applied value steel quarterly report q4 2016 · applied value steel quarterly report – q4 2016 q4...
TRANSCRIPT
Applied Value Steel
Quarterly Report –
Q4 2016
Q4 2016
Applied Value Empire State Building 350 Fifth Avenue, Suite 5400 New York, NY 10118 Phone: +1 646 336 4971 Fax: +1 646 733 9191 www.appliedvaluegroup.com
1 Applied Value Quarterly Steel Report Q4 2016
Applied Value Quarterly Steel Report – Q4 2016
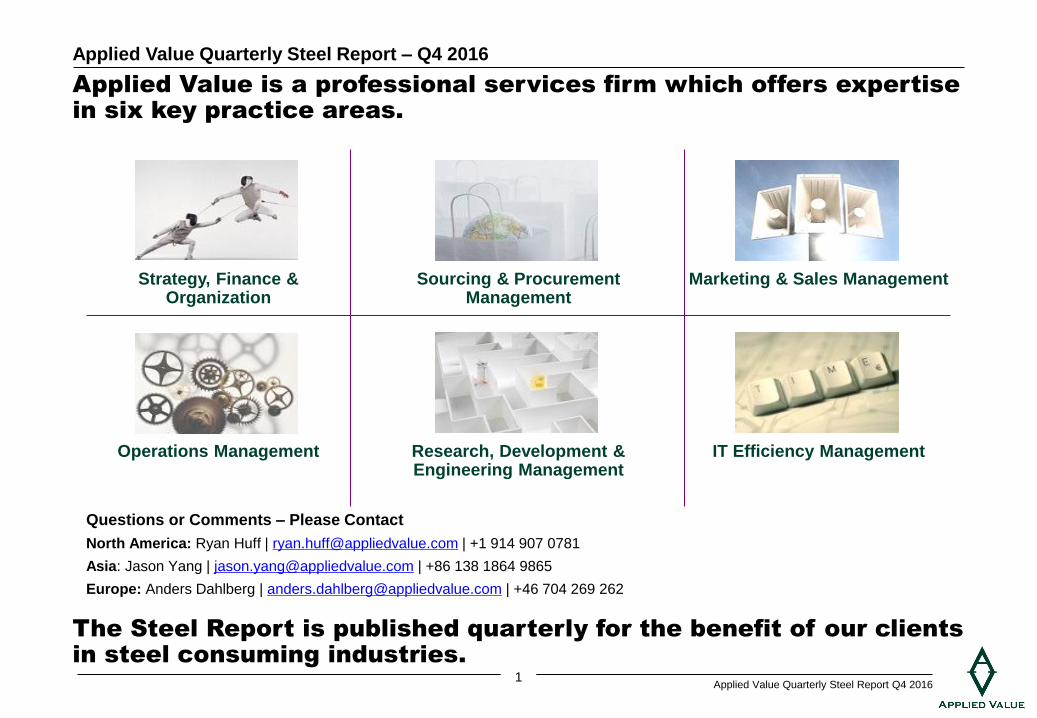
Strategy, Finance & Organization
Operations Management
Sourcing & Procurement Management
Research, Development & Engineering Management
Marketing & Sales Management
IT Efficiency Management
Questions or Comments – Please Contact
North America: Ryan Huff | [email protected] | +1 914 907 0781
Asia: Jason Yang | [email protected] | +86 138 1864 9865
Europe: Anders Dahlberg | [email protected] | +46 704 269 262
The Steel Report is published quarterly for the benefit of our clients
in steel consuming industries.
Applied Value is a professional services firm which offers expertise
in six key practice areas.
2 Applied Value Quarterly Steel Report Q4 2016
Applied Value Quarterly Steel Report – Q4 2016
Automotive OEM
White Goods OEM
Automotive OEM
Global Engineering
Global Construction
Industrial Products
4 Food Producers
Heavy Truck OEM
Defense/Heavy Truck
Security Solutions
Heavy Truck OEM
Heavy Truck OEM
Truck Tier 1
Lifting OEM
Intntl. Engineering
Intntl Consumer Goods OEM
European Engineering
Automotive OEM
Scand. Engineering
Scand. Construction
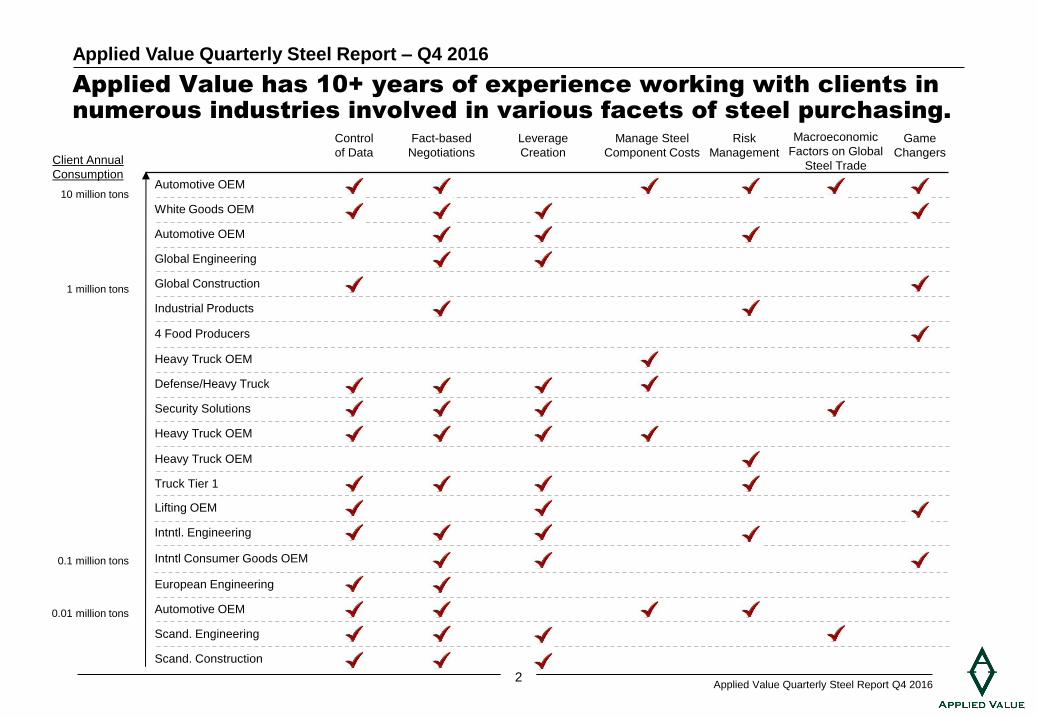
Applied Value has 10+ years of experience working with clients in
numerous industries involved in various facets of steel purchasing.
10 million tons
1 million tons
0.1 million tons
0.01 million tons
Control
of Data
Fact-based
Negotiations
Leverage
Creation
Manage Steel
Component Costs
Risk
Management
Macroeconomic
Factors on Global
Steel Trade
Game
Changers Client Annual
Consumption
3 Applied Value Quarterly Steel Report Q4 2016
Applied Value Quarterly Steel Report – Q4 2016
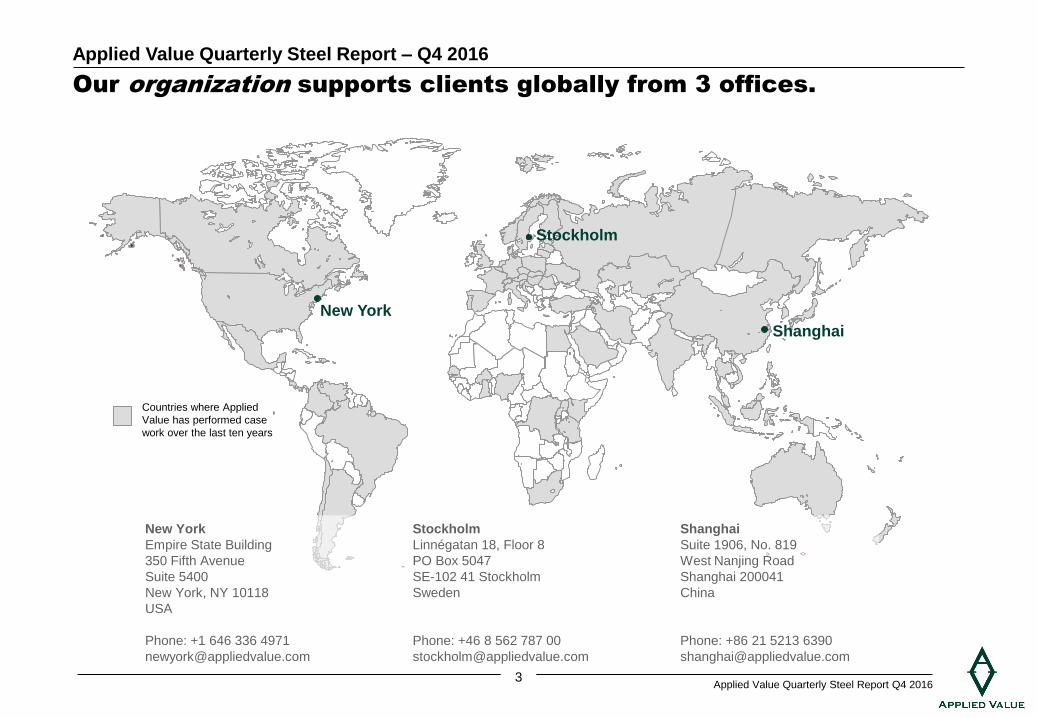
Our organization supports clients globally from 3 offices.
Countries where Applied
Value has performed case
work over the last ten years
Shanghai New York
Stockholm
New York
Empire State Building
350 Fifth Avenue
Suite 5400
New York, NY 10118
USA
Phone: +1 646 336 4971
Shanghai
Suite 1906, No. 819
West Nanjing Road
Shanghai 200041
China
Phone: +86 21 5213 6390
Stockholm
Linnégatan 18, Floor 8
PO Box 5047
SE-102 41 Stockholm
Sweden
Phone: +46 8 562 787 00
4 Applied Value Quarterly Steel Report Q4 2016
Applied Value Quarterly Steel Report – Q4 2016
Market Conditions by Region
Stock Price Development of Major Steel Companies
Steel Production Costs
US Market Fundamentals Deep-Dive
5 Applied Value Quarterly Steel Report Q4 2016
Applied Value Quarterly Steel Report – Q4 2016
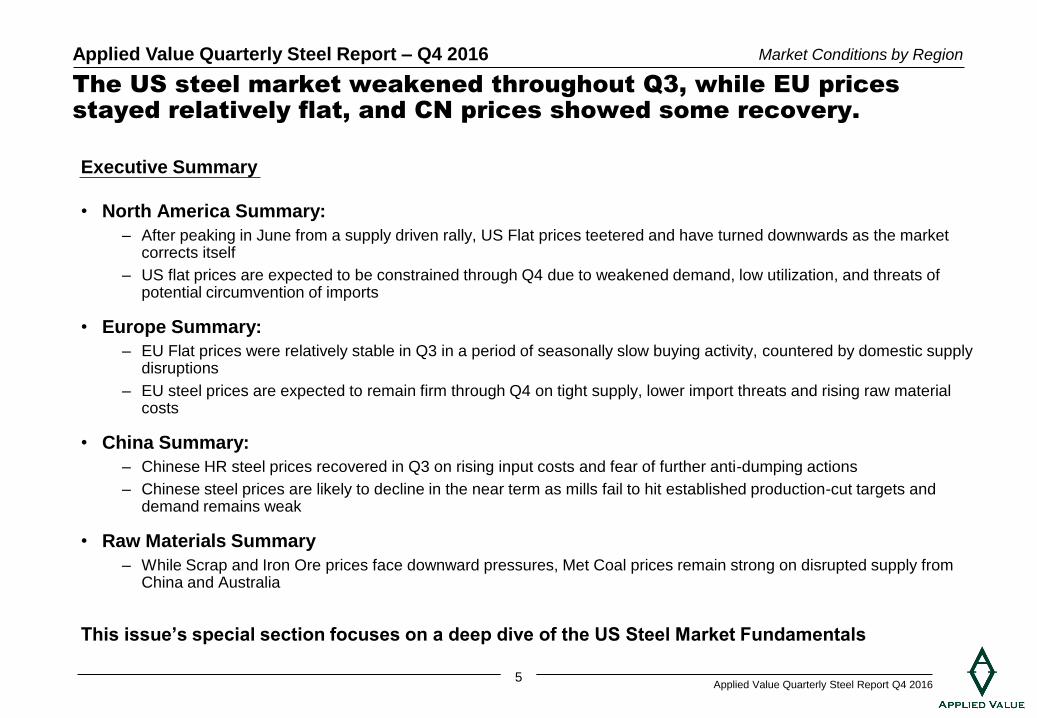
The US steel market weakened throughout Q3, while EU prices
stayed relatively flat, and CN prices showed some recovery.
Executive Summary
• North America Summary:
– After peaking in June from a supply driven rally, US Flat prices teetered and have turned downwards as the market corrects itself
– US flat prices are expected to be constrained through Q4 due to weakened demand, low utilization, and threats of potential circumvention of imports
• Europe Summary:
– EU Flat prices were relatively stable in Q3 in a period of seasonally slow buying activity, countered by domestic supply disruptions
– EU steel prices are expected to remain firm through Q4 on tight supply, lower import threats and rising raw material costs
• China Summary:
– Chinese HR steel prices recovered in Q3 on rising input costs and fear of further anti-dumping actions
– Chinese steel prices are likely to decline in the near term as mills fail to hit established production-cut targets and demand remains weak
• Raw Materials Summary
– While Scrap and Iron Ore prices face downward pressures, Met Coal prices remain strong on disrupted supply from China and Australia
This issue’s special section focuses on a deep dive of the US Steel Market Fundamentals
Market Conditions by Region
6 Applied Value Quarterly Steel Report Q4 2016
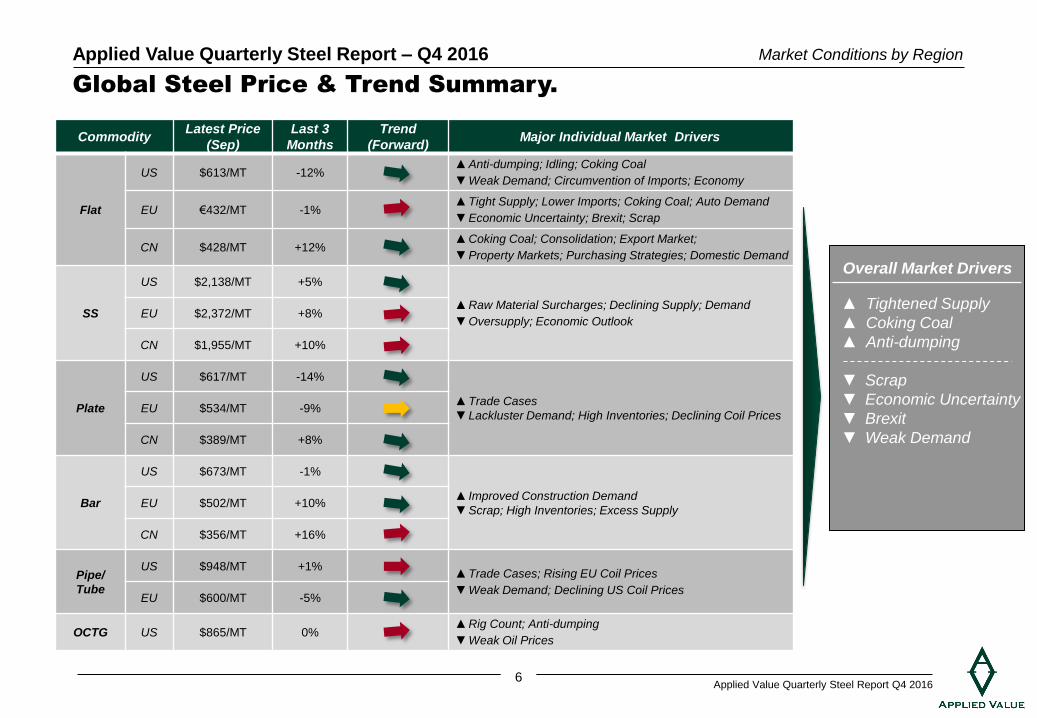
Applied Value Quarterly Steel Report – Q4 2016 Market Conditions by Region
Commodity Latest Price
(Sep)
Last 3
Months
Trend
(Forward) Major Individual Market Drivers
Flat
US $613/MT -12% ▲Anti-dumping; Idling; Coking Coal
▼Weak Demand; Circumvention of Imports; Economy
EU €432/MT -1% ▲Tight Supply; Lower Imports; Coking Coal; Auto Demand
▼Economic Uncertainty; Brexit; Scrap
CN $428/MT +12% ▲Coking Coal; Consolidation; Export Market;
▼Property Markets; Purchasing Strategies; Domestic Demand
SS
US $2,138/MT +5%
▲Raw Material Surcharges; Declining Supply; Demand
▼Oversupply; Economic Outlook EU $2,372/MT +8%
CN $1,955/MT +10%
Plate
US $617/MT -14%
▲Trade Cases
▼Lackluster Demand; High Inventories; Declining Coil Prices EU $534/MT -9%
CN $389/MT +8%
Bar
US $673/MT -1%
▲Improved Construction Demand
▼Scrap; High Inventories; Excess Supply EU $502/MT +10%
CN $356/MT +16%
Pipe/
Tube
US $948/MT +1% ▲Trade Cases; Rising EU Coil Prices
▼Weak Demand; Declining US Coil Prices EU $600/MT -5%
OCTG US $865/MT 0% ▲Rig Count; Anti-dumping
▼Weak Oil Prices
Global Steel Price & Trend Summary.
▲ Tightened Supply
▲ Coking Coal
▲ Anti-dumping
▼ Scrap
▼ Economic Uncertainty
▼ Brexit
▼ Weak Demand
Overall Market Drivers
7 Applied Value Quarterly Steel Report Q4 2016
Applied Value Quarterly Steel Report – Q4 2016
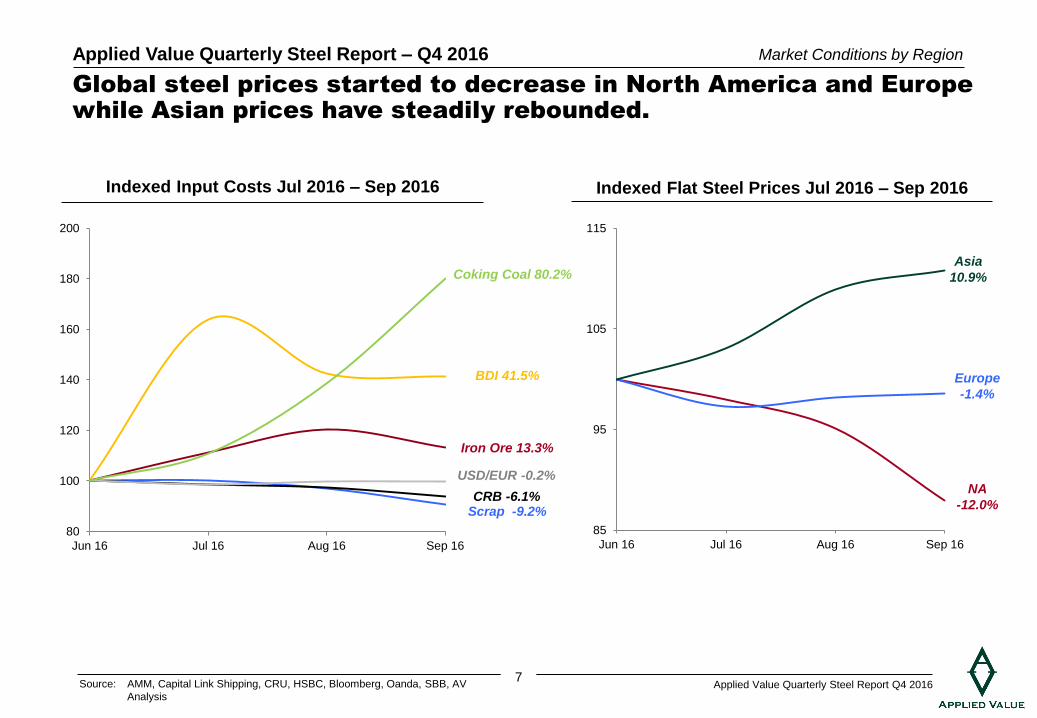
85
95
105
115
Jun 16 Jul 16 Aug 16 Sep 1680
100
120
140
160
180
200
Jun 16 Jul 16 Aug 16 Sep 16
BDI 41.5%
CRB -6.1%
USD/EUR -0.2%
Indexed Input Costs Jul 2016 – Sep 2016
Scrap -9.2%
Iron Ore 13.3%
Indexed Flat Steel Prices Jul 2016 – Sep 2016
Coking Coal 80.2%
Global steel prices started to decrease in North America and Europe
while Asian prices have steadily rebounded.
Europe
-1.4%
Asia
10.9%
NA
-12.0%
Market Conditions by Region
Source: AMM, Capital Link Shipping, CRU, HSBC, Bloomberg, Oanda, SBB, AV
Analysis
8 Applied Value Quarterly Steel Report Q4 2016
Applied Value Quarterly Steel Report – Q4 2016
71.9% 70.2%
60%
70%
80%
90%
Sep 14 Mar 15 Sep 15 Mar 16 Sep 16
0.0
1.0
2.0
3.0
250
500
750
1,000
Sep 14 Mar 15 Sep 15 Mar 16 Sep 16
mM
T I
mp
ort
ed
US
D/M
T
Flat Steel Imports US Price China Price
5,214
4,512
3,500
4,500
5,500
6,500
Sep 14 Mar 15 Sep 15 Mar 16 Sep 16
‘000 M
T
US Flats Steel Prices
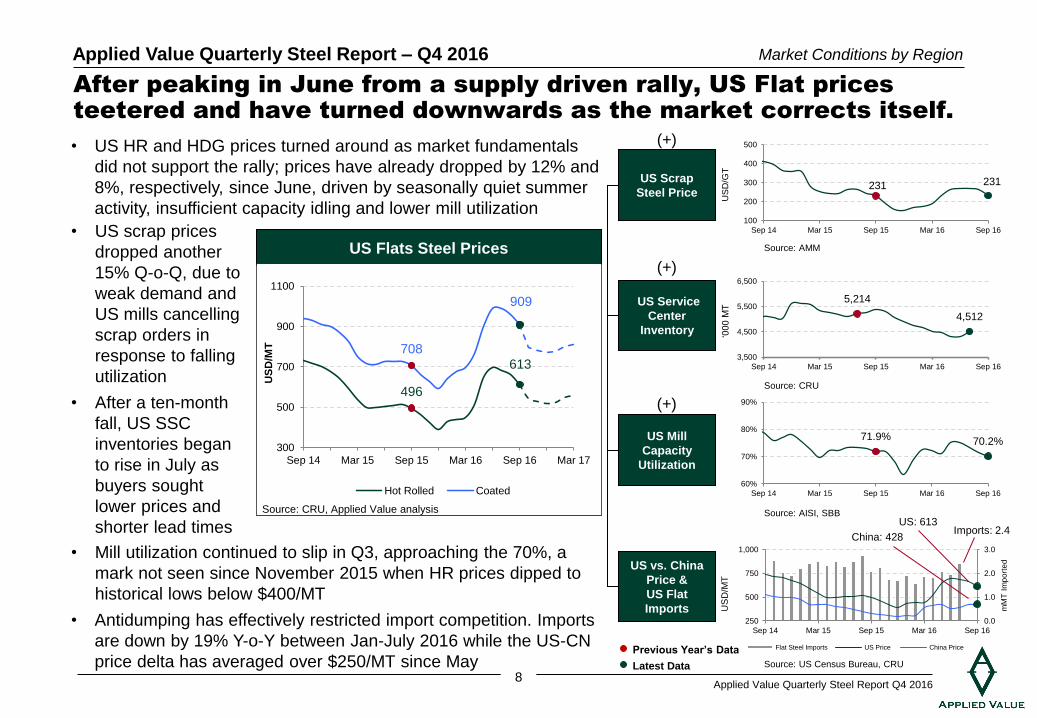
After peaking in June from a supply driven rally, US Flat prices
teetered and have turned downwards as the market corrects itself.
US Service
Center
Inventory
US Mill
Capacity
Utilization
US vs. China
Price &
US Flat
Imports
US Scrap
Steel Price
(+)
(+)
(+)
Source: US Census Bureau, CRU
Source: AMM
Source: AISI, SBB
496
708
909
613
300
500
700
900
1100
Sep 14 Mar 15 Sep 15 Mar 16 Sep 16 Mar 17
Hot Rolled Coated
US: 613
China: 428 Imports: 2.4
Previous Year’s Data
Latest Data
Source: CRU
US
D/M
T
Source: CRU, Applied Value analysis
Market Conditions by Region
• Mill utilization continued to slip in Q3, approaching the 70%, a
mark not seen since November 2015 when HR prices dipped to
historical lows below $400/MT
• Antidumping has effectively restricted import competition. Imports
are down by 19% Y-o-Y between Jan-July 2016 while the US-CN
price delta has averaged over $250/MT since May
• US HR and HDG prices turned around as market fundamentals
did not support the rally; prices have already dropped by 12% and
8%, respectively, since June, driven by seasonally quiet summer
activity, insufficient capacity idling and lower mill utilization
• US scrap prices
dropped another
15% Q-o-Q, due to
weak demand and
US mills cancelling
scrap orders in
response to falling
utilization
• After a ten-month
fall, US SSC
inventories began
to rise in July as
buyers sought
lower prices and
shorter lead times
231 231
100
200
300
400
500
Sep 14 Mar 15 Sep 15 Mar 16 Sep 16
US
D/G
T
9 Applied Value Quarterly Steel Report Q4 2016
Applied Value Quarterly Steel Report – Q4 2016
• Upward drivers
– Antidumping: Trade cases have substantially limited import threats, particularly from China. Imports of Chinese CRC and HDG dwindled to only 140 kMT and 9 kMT in H1 2016, respectively, from over 300 kMT and 525 kMT in H1 2015
– Mill Outages: Current YTD planned outages at ArcelorMittal and AK Steel have helped to mildly improve domestic oversupply. However, AM’s Indiana Harbor is scheduled to come on line in Q4
– Coking Coal: Coking coal prices have shot up by 109% since the beginning of the year, as weather and infrastructure problems at certain mines and railways disrupted supply in China and Australia
• Downward drivers
– Weak Demand: Demand in the US Auto industry started to decline. Light weight vehicle sales decreased by 1% in Aug. and the downward trend is expected to persist through Q4; demand from Construction also started to cool off as US construction spending remained flat in July and housing starts missed expectations in August
– Supply-Driven Price Rally: Market demand indicators did not support the H1 price rally. Thus, the market has begun to correct itself and mill utilization has been continuously decreasing since June in spite of mill outages
– Circumvention Imports: The major US mills have requested that the US DOC investigate China over allegations of circumventing import duties on CRC and HDG products by processing HRC in Vietnam. CRC imports from Vietnam skyrocketed to over 150 kMT in H1 2016, up from 8 kMT in H1 2015; however, the anti-circumvention investigation process will be complex and time consuming, and could extend to other countries, such as Taiwan
– Disappointing Economy: US Q2 GDP growth was 1.1%, well below previous estimates in the range of 2~3%. Meanwhile, Manufacturing PMI slipped to 51.4 in September despite expectations it would hit 52.0; private fixed investment, including residential and business spending, dropped to 3.2% in Q2, the lowest rate in seven years. The disappointing economic performance also delayed the Fed’s decision to raise interest rates in September
– Big River Steel: Arkansas-based Big River Steel opened in September, with an estimated annual production capacity of 1.5 mMT at utilization of around 60%~70%
– Scrap: Scrap prices are expected to remain pressured, as weak demand for steel is keeping steelmakers’ demand for scrap low. Several mills have started to cancel outstanding scrap orders
US flat prices are expected to be constrained through Q4 as the
market continues to correct itself.
Market Conditions by Region
10 Applied Value Quarterly Steel Report Q4 2016
Applied Value Quarterly Steel Report – Q4 2016
200 190
100
150
200
250
300
Sep 14 Mar 15 Sep 15 Mar 16 Sep 16
EU
R/M
T
0.0
0.5
1.0
1.5
2.0
2.5
250
350
450
550
Sep 14 Mar 15 Sep 15 Mar 16 Sep 16
mM
T Im
po
rte
d
EU
R/M
T
Flat Steel Imports EU Price China Price
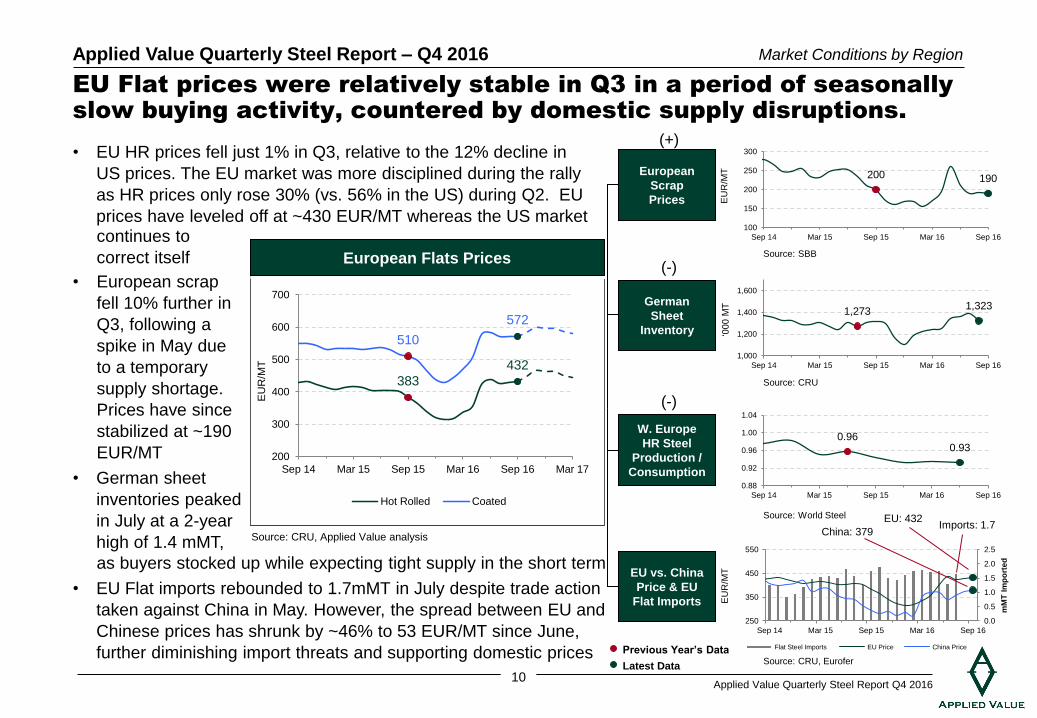
EU Flat prices were relatively stable in Q3 in a period of seasonally
slow buying activity, countered by domestic supply disruptions.
German
Sheet
Inventory
W. Europe
HR Steel
Production /
Consumption
EU vs. China
Price & EU
Flat Imports
European
Scrap
Prices
(-)
(-)
(+)
Source: CRU, Applied Value analysis China: 379
EU: 432 Imports: 1.7
Source: SBB
Source: CRU
Source: CRU, Eurofer
Market Conditions by Region
Previous Year’s Data
Latest Data
Source: World Steel
1,273 1,323
1,000
1,200
1,400
1,600
Sep 14 Mar 15 Sep 15 Mar 16 Sep 16
‘000 M
T
383
510
432
572
200
300
400
500
600
700
Sep 14 Mar 15 Sep 15 Mar 16 Sep 16 Mar 17
Hot Rolled Coated
European Flats Prices E
UR
/MT
as buyers stocked up while expecting tight supply in the short term
• EU Flat imports rebounded to 1.7mMT in July despite trade action
taken against China in May. However, the spread between EU and
Chinese prices has shrunk by ~46% to 53 EUR/MT since June,
further diminishing import threats and supporting domestic prices
continues to
correct itself
• European scrap
fell 10% further in
Q3, following a
spike in May due
to a temporary
supply shortage.
Prices have since
stabilized at ~190
EUR/MT
• German sheet
inventories peaked
in July at a 2-year
high of 1.4 mMT,
• EU HR prices fell just 1% in Q3, relative to the 12% decline in
US prices. The EU market was more disciplined during the rally
as HR prices only rose 30% (vs. 56% in the US) during Q2. EU
prices have leveled off at ~430 EUR/MT whereas the US market
0.96 0.93
0.88
0.92
0.96
1.00
1.04
Sep 14 Mar 15 Sep 15 Mar 16 Sep 16
11 Applied Value Quarterly Steel Report Q4 2016
Applied Value Quarterly Steel Report – Q4 2016
• Upward drivers
– Tight Supply: Material shortages, due to disrupted supply and reported diminishing imports in August/September, have pushed mill lead times far out into late December / early January, especially for CR and Coated steel
– Lower Imports: The impact from trade actions against China is being reported in the market as a shrinking price spread between EU and China. This has allowed domestic producers to gain some of the market share lost to imports
– Coking Coal: Coking coal prices sky-rocketed by 109% since the beginning of the year. 80% of that growth took place in Q3 and is linked to a 60-day reduction in statutory working days at Shanxi mines in China, as well as a series of global supply disruptions owed to weather and infrastructure problems in China and Australia
– Manufacturing Growth: The Eurozone Manufacturing Index (PMI) rose to 52.6 in September, beating market expectations and signaling an increased pace of manufacturing production. According to the European Automobiles Manufacturers Association (ACEA), August demand for new light commercial vehicles is up 35.8% Y-o-Y, driven mainly by Italian, Spanish and German markets
– Consolidation: A potential merger between steel mills ThyssenKrupp and Salzgitter announced in August would create the second largest steel producer in Europe, with combined annual production capacity of ~ 17mMT. The resulting consolidation would enable better control over production and overcapacity. On the other hand, talks for merging Tata Steel’s EU operations with TK have slowed down as Tata and trade unions try to solve a £15B pension funding deficit
• Downward drivers
– Economic Growth: The EU GDP growth rate of 0.3% in Q2 of 2016 is down Y-o-Y from 0.4% in Q2 of 2015
– Brexit: Continues to be viewed as a deterrent for investments, due to the uncertainty that still surrounds both the political and trade environments
– Raw Materials: Despite net positive price movements since the beginning of 2016, EU scrap prices have fallen 27% since May, eroding most of the price gains observed up until then. Iron Ore prices, in spite of climbing by 29% in Q3, remain at historically low levels
Market Conditions by Region
EU steel prices are expected to remain firm through Q4 on tight
supply and lower import threats.
12 Applied Value Quarterly Steel Report Q4 2016
Applied Value Quarterly Steel Report – Q4 2016
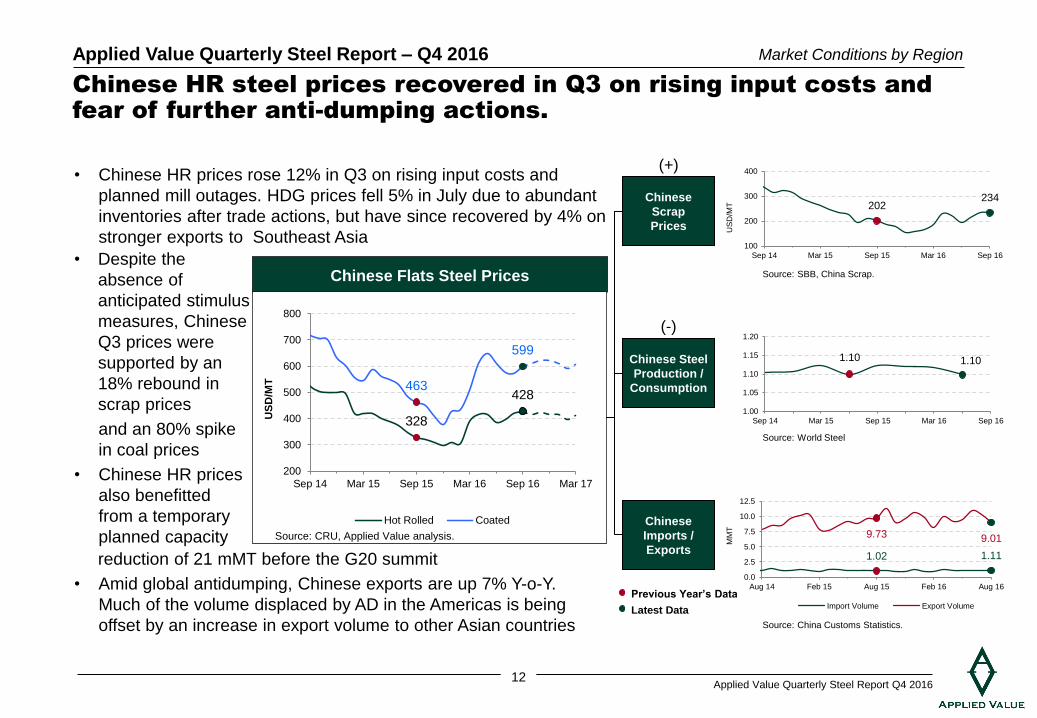
202 234
100
200
300
400
Sep 14 Mar 15 Sep 15 Mar 16 Sep 16
Chinese
Scrap
Prices
Chinese Steel
Production /
Consumption
(-)
(+)
Chinese
Imports /
Exports
Source: China Customs Statistics.
Chinese Flats Steel Prices
Source: CRU, Applied Value analysis.
Chinese HR steel prices recovered in Q3 on rising input costs and
fear of further anti-dumping actions.
Source: SBB, China Scrap.
Source: World Steel
US
D/M
T
Previous Year’s Data
Latest Data
328
463 428
599
200
300
400
500
600
700
800
Sep 14 Mar 15 Sep 15 Mar 16 Sep 16 Mar 17
US
D/M
T
Hot Rolled Coated
• Chinese HR prices rose 12% in Q3 on rising input costs and
planned mill outages. HDG prices fell 5% in July due to abundant
inventories after trade actions, but have since recovered by 4% on
stronger exports to Southeast Asia
Market Conditions by Region
1.02 1.11
9.73 9.01
0.0
2.5
5.0
7.5
10.0
12.5
Aug 14 Feb 15 Aug 15 Feb 16 Aug 16
MM
T
Import Volume Export Volume
• Despite the
absence of
anticipated stimulus
measures, Chinese
Q3 prices were
supported by an
18% rebound in
scrap prices
and an 80% spike
in coal prices
• Chinese HR prices
also benefitted
from a temporary
planned capacity
reduction of 21 mMT before the G20 summit
• Amid global antidumping, Chinese exports are up 7% Y-o-Y.
Much of the volume displaced by AD in the Americas is being
offset by an increase in export volume to other Asian countries
1.10 1.10
1.00
1.05
1.10
1.15
1.20
Sep 14 Mar 15 Sep 15 Mar 16 Sep 16
13 Applied Value Quarterly Steel Report Q4 2016
Applied Value Quarterly Steel Report – Q4 2016
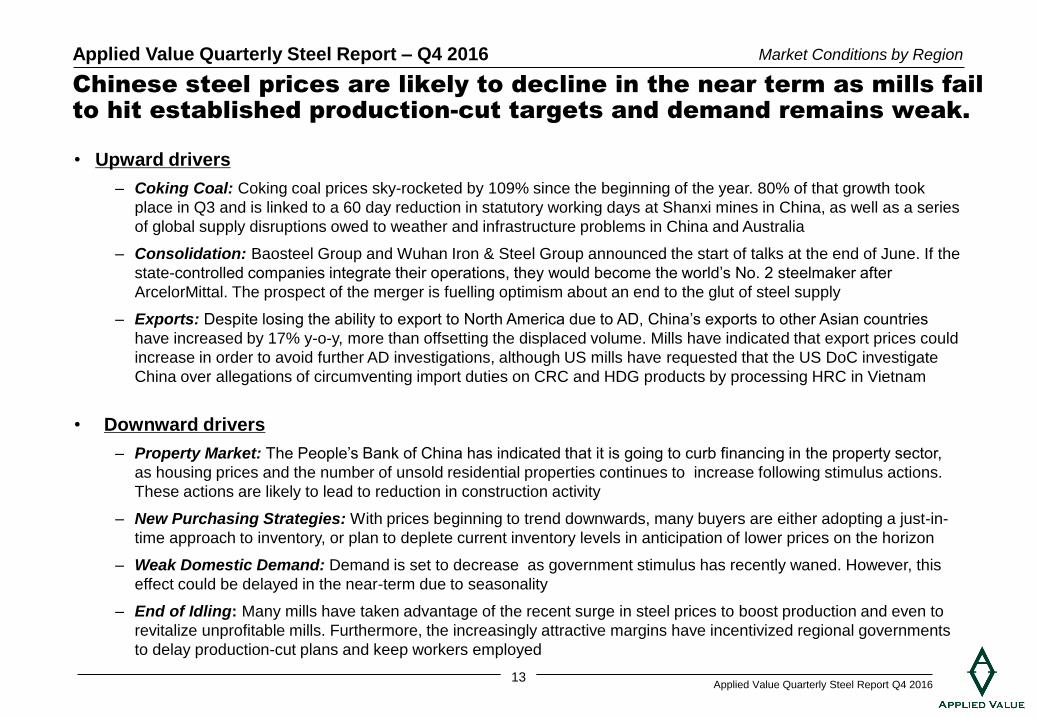
Chinese steel prices are likely to decline in the near term as mills fail
to hit established production-cut targets and demand remains weak.
Market Conditions by Region
• Upward drivers
– Coking Coal: Coking coal prices sky-rocketed by 109% since the beginning of the year. 80% of that growth took
place in Q3 and is linked to a 60 day reduction in statutory working days at Shanxi mines in China, as well as a series
of global supply disruptions owed to weather and infrastructure problems in China and Australia
– Consolidation: Baosteel Group and Wuhan Iron & Steel Group announced the start of talks at the end of June. If the
state-controlled companies integrate their operations, they would become the world’s No. 2 steelmaker after
ArcelorMittal. The prospect of the merger is fuelling optimism about an end to the glut of steel supply
– Exports: Despite losing the ability to export to North America due to AD, China’s exports to other Asian countries
have increased by 17% y-o-y, more than offsetting the displaced volume. Mills have indicated that export prices could
increase in order to avoid further AD investigations, although US mills have requested that the US DoC investigate
China over allegations of circumventing import duties on CRC and HDG products by processing HRC in Vietnam
• Downward drivers
– Property Market: The People’s Bank of China has indicated that it is going to curb financing in the property sector,
as housing prices and the number of unsold residential properties continues to increase following stimulus actions.
These actions are likely to lead to reduction in construction activity
– New Purchasing Strategies: With prices beginning to trend downwards, many buyers are either adopting a just-in-
time approach to inventory, or plan to deplete current inventory levels in anticipation of lower prices on the horizon
– Weak Domestic Demand: Demand is set to decrease as government stimulus has recently waned. However, this
effect could be delayed in the near-term due to seasonality
– End of Idling: Many mills have taken advantage of the recent surge in steel prices to boost production and even to
revitalize unprofitable mills. Furthermore, the increasingly attractive margins have incentivized regional governments
to delay production-cut plans and keep workers employed
14 Applied Value Quarterly Steel Report Q4 2016
Applied Value Quarterly Steel Report – Q4 2016
2.65 2.79
0
2
4
6
Sep 14 Mar 15 Sep 15 Mar 16 Sep 16
US
D/m
mB
tu
Stainless Steel Prices – US / Europe / China
2,161
2,414
1,900
2,138
2,372
1,955
1,500
2,000
2,500
3,000
3,500
Sep 14 Mar 15 Sep 15 Mar 16 Sep 16 Mar 17
US
D/M
T
US CR 304 EU CR 304 China CR 304
9,898 10,026
6,000
10,000
14,000
18,000
Sep 14 Mar 15 Sep 15 Mar 16 Sep 16
US
D/M
T
2,370
1,938
1,800
2,000
2,200
2,400
2,600
Sep 14 Mar 15 Sep 15 Mar 16 Sep 16
US
D/M
T
54 55
0
50
100
150
200
Sep 14 Mar 15 Sep 15 Mar 16 Sep 16
US
D/M
T
Nickel
Chromium
Natural Gas
(+)
(+)
(+)
Source: SBB, Applied Value analysis
Iron Ore
(+)
Stainless prices increased globally during Q3 2016, largely driven
by rising raw material surcharges.
result of higher nickel costs
• In September, the US Department of Commerce announced
preliminary dumping margins of 63.86% and 76.64% in its
antidumping investigation of imports of stainless steel sheet and
narrow strip from China
Source: LME Settlement and 3-Month Futures
Source: AMM
Source: SBB
Source: IMF Previous Year’s Data
Latest Data
• US stainless prices rose by 5% in Q3 as higher raw material
surcharges provided boosts to most grades. Supply has
continued to tighten in the US stainless sheet market since the
start of 2016, thanks to declining imports resulting from AD
against China
• European stainless
prices increased by
8% in Q3, fueled
by rising alloy
surcharges as well
as gradual positive
momentum created
by healthy demand
from some end-use
sectors
• Chinese stainless
prices maintained
an upward trend,
increasing by 10%
during Q3 as a
Market Conditions by Region
15 Applied Value Quarterly Steel Report Q4 2016
Applied Value Quarterly Steel Report – Q4 2016
Plate Prices – US / Europe / China
732 729
700
725
750
775
800
Sep 14 Mar 15 Sep 15 Mar 16 Sep 16
BU
SD
15.19 14.46
38.59 39.55
36
37
38
39
40
10
15
20
Sep 14 Mar 15 Sep 15 Mar 16 Sep 16
Mill
ion B
arr
els
/
Day
USA OPEC
202 204
190
195
200
205
210
Jun 14 Dec 14 Jun 15 Dec 15 Jun 16
IND
EX
(1
985 =
100)
US Defense
Spending
Crude Oil
Production
Baltic Dry
Index
(+)
(+)
(+)
Source: AMM, SBB, Applied Value analysis
US
Shipbuilding
& Repairs
(+)
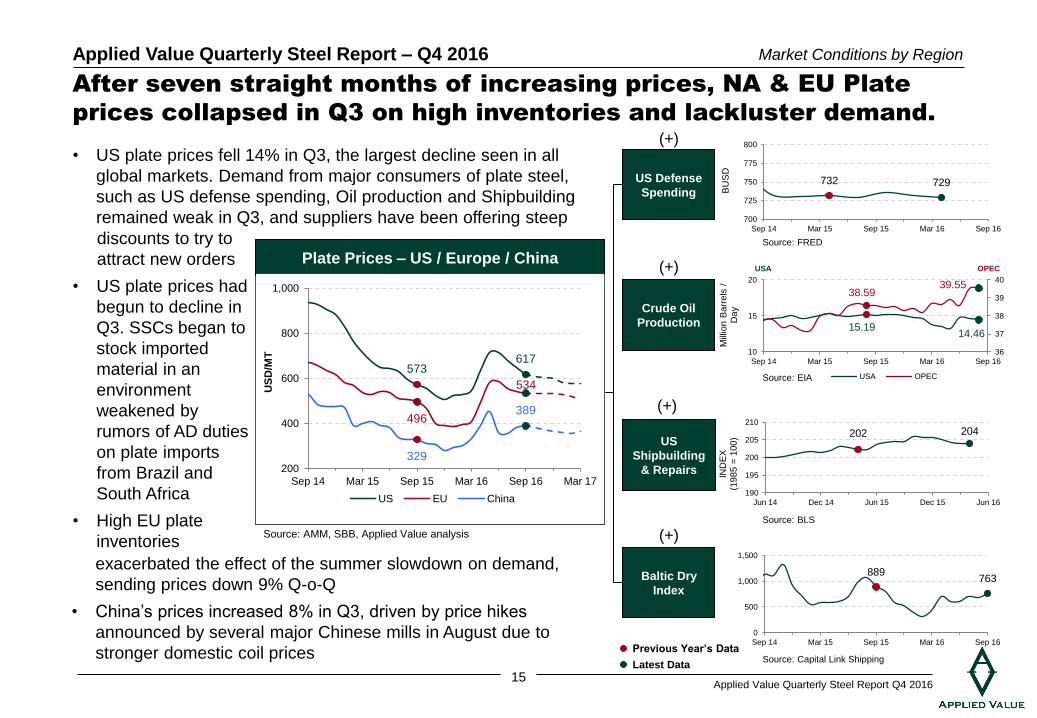
After seven straight months of increasing prices, NA & EU Plate
prices collapsed in Q3 on high inventories and lackluster demand.
Source: FRED
Source: EIA
Source: BLS
Source: Capital Link Shipping
889 763
0
500
1,000
1,500
Sep 14 Mar 15 Sep 15 Mar 16 Sep 16Previous Year’s Data
Latest Data
Market Conditions by Region
• US plate prices fell 14% in Q3, the largest decline seen in all
global markets. Demand from major consumers of plate steel,
such as US defense spending, Oil production and Shipbuilding
remained weak in Q3, and suppliers have been offering steep
USA OPEC
exacerbated the effect of the summer slowdown on demand,
sending prices down 9% Q-o-Q
• China’s prices increased 8% in Q3, driven by price hikes
announced by several major Chinese mills in August due to
stronger domestic coil prices
573
496
329
617
534
389
200
400
600
800
1,000
Sep 14 Mar 15 Sep 15 Mar 16 Sep 16 Mar 17
US
D/M
T
US EU China
discounts to try to
attract new orders
• US plate prices had
begun to decline in
Q3. SSCs began to
stock imported
material in an
environment
weakened by
rumors of AD duties
on plate imports
from Brazil and
South Africa
• High EU plate
inventories
16 Applied Value Quarterly Steel Report Q4 2016
Applied Value Quarterly Steel Report – Q4 2016
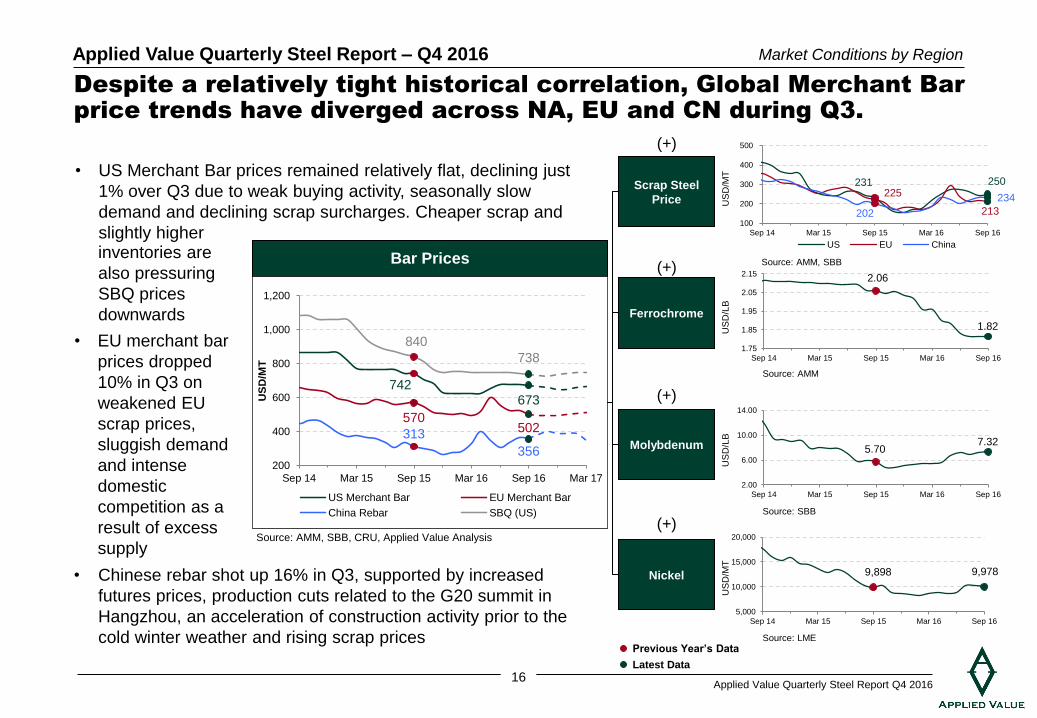
• Chinese rebar shot up 16% in Q3, supported by increased
futures prices, production cuts related to the G20 summit in
Hangzhou, an acceleration of construction activity prior to the
cold winter weather and rising scrap prices
2.06
1.82
1.75
1.85
1.95
2.05
2.15
Sep 14 Mar 15 Sep 15 Mar 16 Sep 16
US
D/L
B
231 250 225
213 202
234
100
200
300
400
500
Sep 14 Mar 15 Sep 15 Mar 16 Sep 16
US
D/M
T
US EU China
5.70 7.32
2.00
6.00
10.00
14.00
Sep 14 Mar 15 Sep 15 Mar 16 Sep 16
US
D/L
B
Bar Prices
Despite a relatively tight historical correlation, Global Merchant Bar
price trends have diverged across NA, EU and CN during Q3.
Ferrochrome
Nickel
Scrap Steel
Price
Source: AMM, SBB, CRU, Applied Value Analysis
Source: AMM, SBB
Molybdenum
Source: LME
Source: AMM
742 673
570
313
840
738
502
356 200
400
600
800
1,000
1,200
Sep 14 Mar 15 Sep 15 Mar 16 Sep 16 Mar 17
US
D/M
T
US Merchant Bar EU Merchant Bar
China Rebar SBQ (US) Source: SBB
(+)
(+)
(+)
(+)
Market Conditions by Region
Previous Year’s Data
Latest Data
• US Merchant Bar prices remained relatively flat, declining just
1% over Q3 due to weak buying activity, seasonally slow
demand and declining scrap surcharges. Cheaper scrap and
slightly higher
9,898 9,978
5,000
10,000
15,000
20,000
Sep 14 Mar 15 Sep 15 Mar 16 Sep 16
US
D/M
T
inventories are
also pressuring
SBQ prices
downwards
• EU merchant bar
prices dropped
10% in Q3 on
weakened EU
scrap prices,
sluggish demand
and intense
domestic
competition as a
result of excess
supply
17 Applied Value Quarterly Steel Report Q4 2016
Applied Value Quarterly Steel Report – Q4 2016
88 84
454 368
0
500
1,000
Sep 14 Mar 15 Sep 15 Mar 16 Sep 16
KM
T
OCTG imports Pipe/Tube Imports
WTI Crude Oil
& Natural Gas
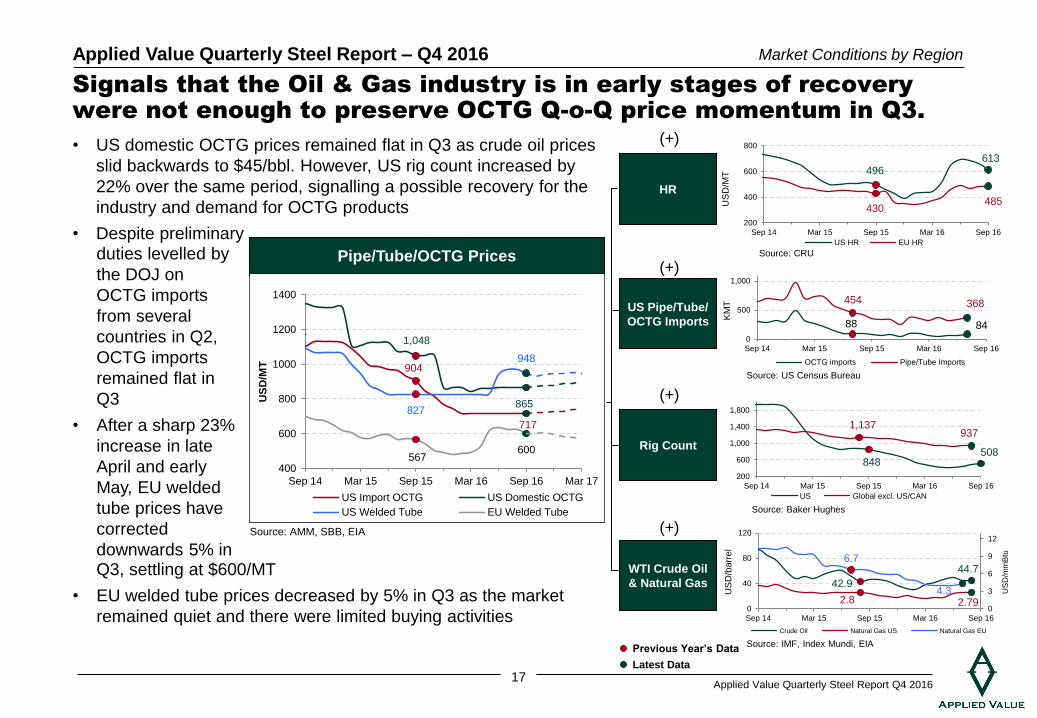
Signals that the Oil & Gas industry is in early stages of recovery
were not enough to preserve OCTG Q-o-Q price momentum in Q3.
42.9
44.7
2.8 2.79
6.7
4.3
0
3
6
9
12
0
40
80
120
Sep 14 Mar 15 Sep 15 Mar 16 Sep 16
US
D/m
mB
tu
US
D/b
arr
el
Crude Oil Natural Gas US Natural Gas EU
Rig Count
848 508
1,137 937
200
600
1,000
1,400
1,800
Sep 14 Mar 15 Sep 15 Mar 16 Sep 16
US Global excl. US/CAN
HR
Source: AMM, SBB, EIA
Source: Baker Hughes
• US domestic OCTG prices remained flat in Q3 as crude oil prices
slid backwards to $45/bbl. However, US rig count increased by
22% over the same period, signalling a possible recovery for the
industry and demand for OCTG products
• Despite preliminary
Source: IMF, Index Mundi, EIA
Pipe/Tube/OCTG Prices
US Pipe/Tube/
OCTG Imports
(+)
(+)
(+)
(+)
Source: US Census Bureau
Previous Year’s Data
Latest Data
Market Conditions by Region
duties levelled by
the DOJ on
OCTG imports
from several
countries in Q2,
OCTG imports
remained flat in
Q3
• After a sharp 23%
increase in late
April and early
May, EU welded
tube prices have
corrected
downwards 5% in Q3, settling at $600/MT
• EU welded tube prices decreased by 5% in Q3 as the market
remained quiet and there were limited buying activities
496 613
430 485
200
400
600
800
Sep 14 Mar 15 Sep 15 Mar 16 Sep 16
US
D/M
T
US HR EU HR
Source: CRU
904
1,048
827
948
567 600
717
865
400
600
800
1000
1200
1400
Sep 14 Mar 15 Sep 15 Mar 16 Sep 16 Mar 17
US
D/M
T
US Import OCTG US Domestic OCTG
US Welded Tube EU Welded Tube
18 Applied Value Quarterly Steel Report Q4 2016
Applied Value Quarterly Steel Report – Q4 2016
173
313
0
125
250
375
500
Sep 14 Mar 15 Sep 15 Mar 16 Sep 16
US
D/M
T
76 93
40
80
120
160
Sep 14 Mar 15 Sep 15 Mar 16 Sep 16
MT
Wire Rod Prices
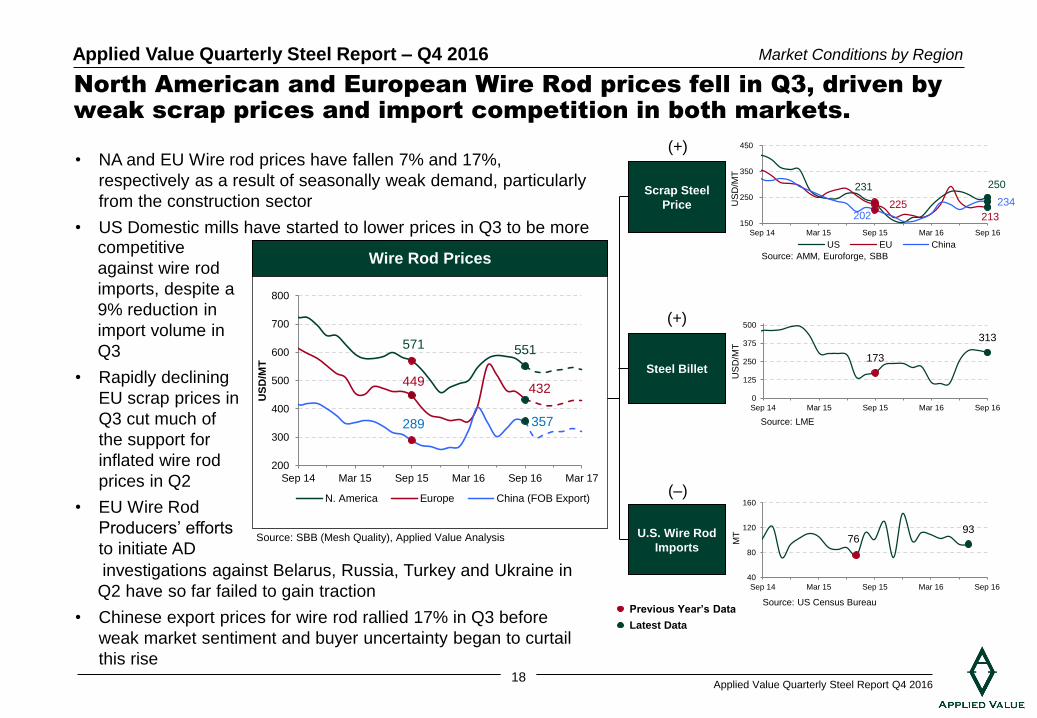
North American and European Wire Rod prices fell in Q3, driven by
weak scrap prices and import competition in both markets.
Steel Billet
Scrap Steel
Price
Source: SBB (Mesh Quality), Applied Value Analysis
Source: AMM, Euroforge, SBB
U.S. Wire Rod
Imports
Source: LME
571
449
289
551
432
357
200
300
400
500
600
700
800
Sep 14 Mar 15 Sep 15 Mar 16 Sep 16 Mar 17
US
D/M
T
N. America Europe China (FOB Export)
Source: US Census Bureau
(+)
(–)
(+)
Market Conditions by Region
Previous Year’s Data
Latest Data
• NA and EU Wire rod prices have fallen 7% and 17%,
respectively as a result of seasonally weak demand, particularly
from the construction sector
• US Domestic mills have started to lower prices in Q3 to be more competitive
against wire rod
imports, despite a
9% reduction in
import volume in
Q3
• Rapidly declining
EU scrap prices in
Q3 cut much of
the support for
inflated wire rod
prices in Q2
• EU Wire Rod
Producers’ efforts
to initiate AD
investigations against Belarus, Russia, Turkey and Ukraine in
Q2 have so far failed to gain traction
• Chinese export prices for wire rod rallied 17% in Q3 before
weak market sentiment and buyer uncertainty began to curtail
this rise
231 250
225 213 202
234
150
250
350
450
Sep 14 Mar 15 Sep 15 Mar 16 Sep 16
US
D/M
T
US EU China
19 Applied Value Quarterly Steel Report Q4 2016
Applied Value Quarterly Steel Report – Q4 2016
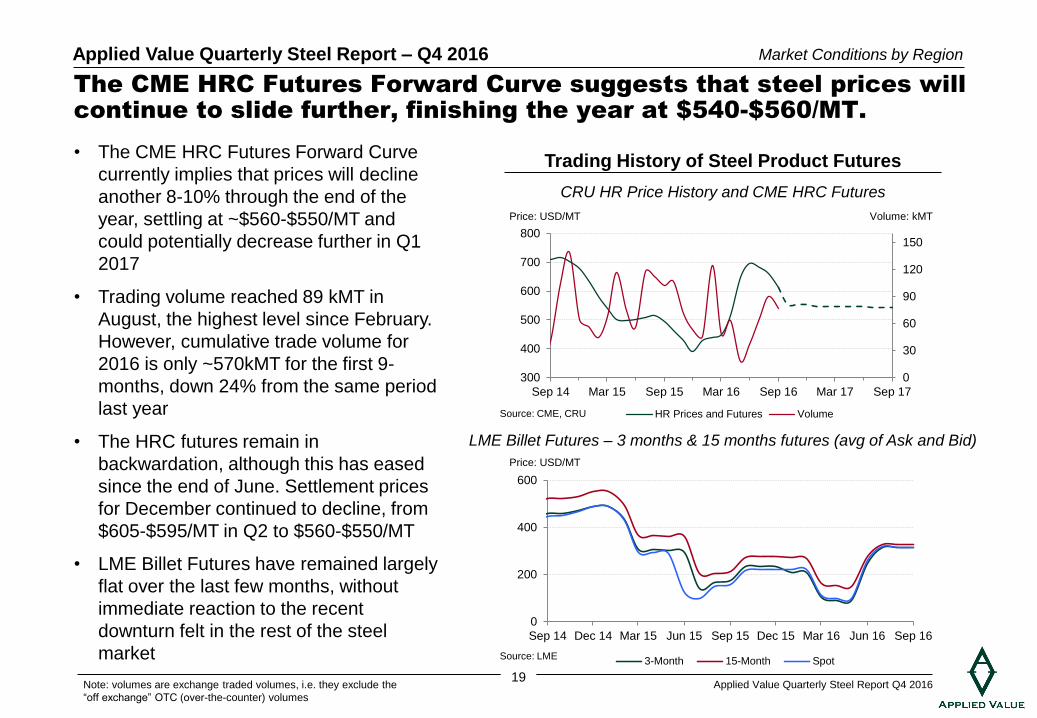
The CME HRC Futures Forward Curve suggests that steel prices will
continue to slide further, finishing the year at $540-$560/MT.
Trading History of Steel Product Futures
Price: USD/MT Volume: kMT
• The CME HRC Futures Forward Curve
currently implies that prices will decline
another 8-10% through the end of the
year, settling at ~$560-$550/MT and
could potentially decrease further in Q1
2017
• Trading volume reached 89 kMT in
August, the highest level since February.
However, cumulative trade volume for
2016 is only ~570kMT for the first 9-
months, down 24% from the same period
last year
• The HRC futures remain in
backwardation, although this has eased
since the end of June. Settlement prices
for December continued to decline, from
$605-$595/MT in Q2 to $560-$550/MT
• LME Billet Futures have remained largely
flat over the last few months, without
immediate reaction to the recent
downturn felt in the rest of the steel
market
Note: volumes are exchange traded volumes, i.e. they exclude the
“off exchange” OTC (over-the-counter) volumes
Source: CME, CRU
CRU HR Price History and CME HRC Futures
0
200
400
600
Sep 14 Dec 14 Mar 15 Jun 15 Sep 15 Dec 15 Mar 16 Jun 16 Sep 16
3-Month 15-Month Spot
LME Billet Futures – 3 months & 15 months futures (avg of Ask and Bid)
Price: USD/MT
Source: LME
Market Conditions by Region
0
30
60
90
120
150
300
400
500
600
700
800
Sep 14 Mar 15 Sep 15 Mar 16 Sep 16 Mar 17 Sep 17
HR Prices and Futures Volume
20 Applied Value Quarterly Steel Report Q4 2016
Applied Value Quarterly Steel Report – Q4 2016
Market Conditions by Region
Stock Price Development of Major Steel Companies
Steel Production Costs
US Market Fundamentals Deep-Dive
21 Applied Value Quarterly Steel Report Q4 2016
Applied Value Quarterly Steel Report – Q4 2016
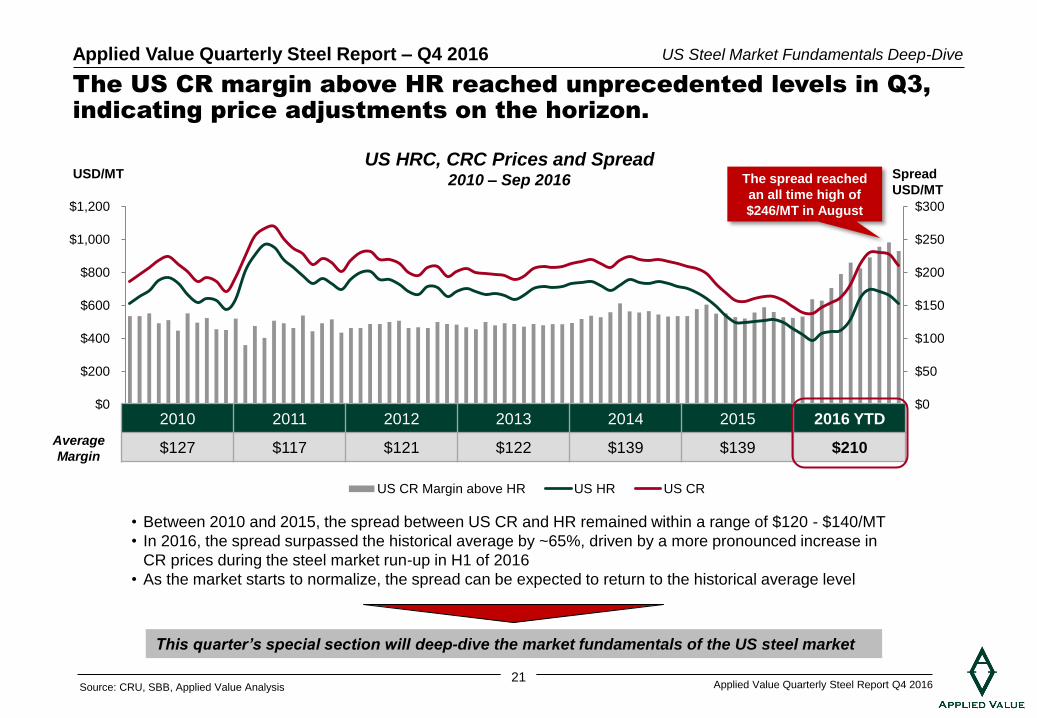
The US CR margin above HR reached unprecedented levels in Q3,
indicating price adjustments on the horizon.
US Steel Market Fundamentals Deep-Dive
Source: CRU, SBB, Applied Value Analysis
$0
$50
$100
$150
$200
$250
$300
$0
$200
$400
$600
$800
$1,000
$1,200
US CR Margin above HR US HR US CR
US HRC, CRC Prices and Spread 2010 – Sep 2016 USD/MT
• Between 2010 and 2015, the spread between US CR and HR remained within a range of $120 - $140/MT
• In 2016, the spread surpassed the historical average by ~65%, driven by a more pronounced increase in
CR prices during the steel market run-up in H1 of 2016
• As the market starts to normalize, the spread can be expected to return to the historical average level
2010 2011 2012 2013 2014 2015 2016 YTD
$127 $117 $121 $122 $139 $139 $210
The spread reached
an all time high of
$246/MT in August
Average
Margin
This quarter’s special section will deep-dive the market fundamentals of the US steel market
Spread
USD/MT
22 Applied Value Quarterly Steel Report Q4 2016
Applied Value Quarterly Steel Report – Q4 2016
$0
$200
$400
$600
$800
$0
$200
$400
$600
$800
$1,000
$1,200
$1,400
Jan-08 Jan-09 Jan-10 Jan-11 Jan-12 Jan-13 Jan-14 Jan-15 Jan-16
Spread US HR Base Scrap
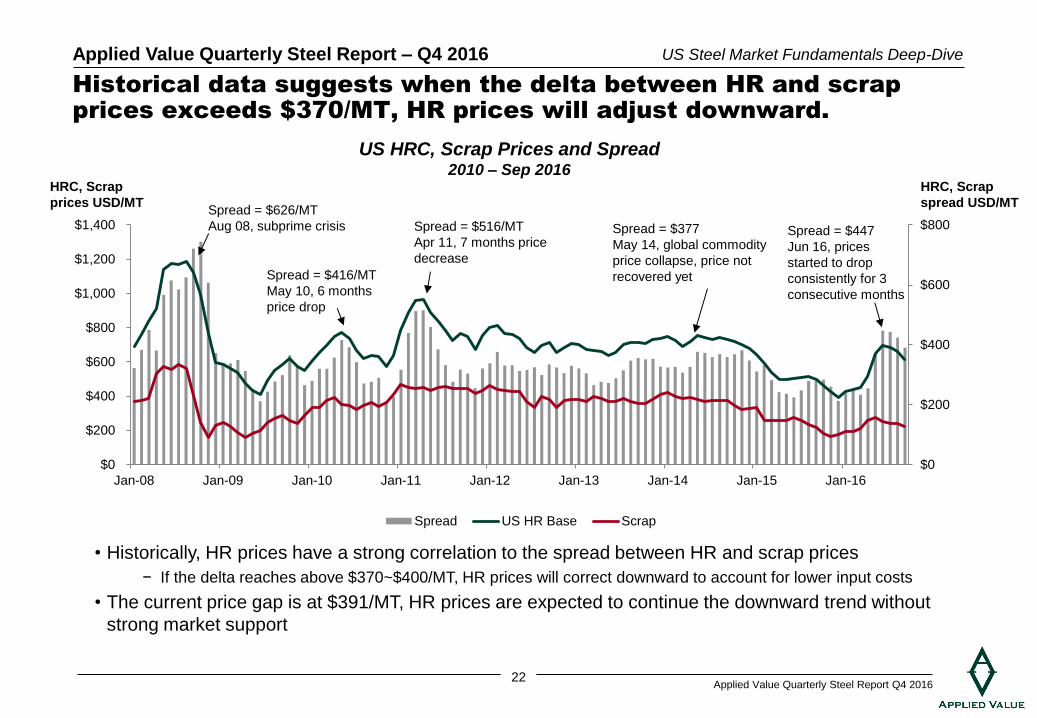
Historical data suggests when the delta between HR and scrap
prices exceeds $370/MT, HR prices will adjust downward.
• Historically, HR prices have a strong correlation to the spread between HR and scrap prices
− If the delta reaches above $370~$400/MT, HR prices will correct downward to account for lower input costs
• The current price gap is at $391/MT, HR prices are expected to continue the downward trend without
strong market support
US Steel Market Fundamentals Deep-Dive
HRC, Scrap
prices USD/MT
US HRC, Scrap Prices and Spread 2010 – Sep 2016
Spread = $626/MT
Aug 08, subprime crisis
Spread = $416/MT
May 10, 6 months
price drop
Spread = $516/MT
Apr 11, 7 months price
decrease
Spread = $377
May 14, global commodity
price collapse, price not
recovered yet
Spread = $447
Jun 16, prices
started to drop
consistently for 3
consecutive months
HRC, Scrap
spread USD/MT
23 Applied Value Quarterly Steel Report Q4 2016
Applied Value Quarterly Steel Report – Q4 2016
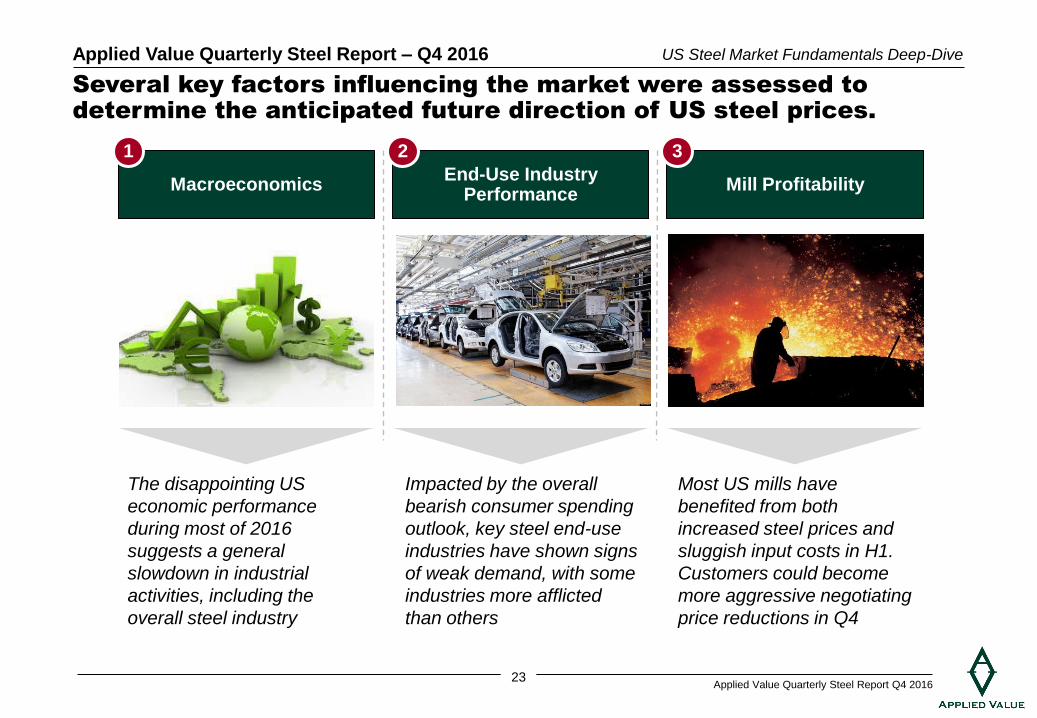
Several key factors influencing the market were assessed to
determine the anticipated future direction of US steel prices.
Macroeconomics End-Use Industry
Performance Mill Profitability
Competition is centered around
domestic steel producers
Domestic buyers of steel must pay
higher price for raw materials
Lowers production and thus supply,
providing upward pressure on price
Overhead costs are not covered
and employees are laid off
Producers can create upward
momentum on prices and margins
Not based on market fundamentals
and sometimes prices do not stick
1 2 3
The disappointing US
economic performance
during most of 2016
suggests a general
slowdown in industrial
activities, including the
overall steel industry
Impacted by the overall
bearish consumer spending
outlook, key steel end-use
industries have shown signs
of weak demand, with some
industries more afflicted
than others
US Steel Market Fundamentals Deep-Dive
Most US mills have
benefited from both
increased steel prices and
sluggish input costs in H1.
Customers could become
more aggressive negotiating
price reductions in Q4
24 Applied Value Quarterly Steel Report Q4 2016
Applied Value Quarterly Steel Report – Q4 2016
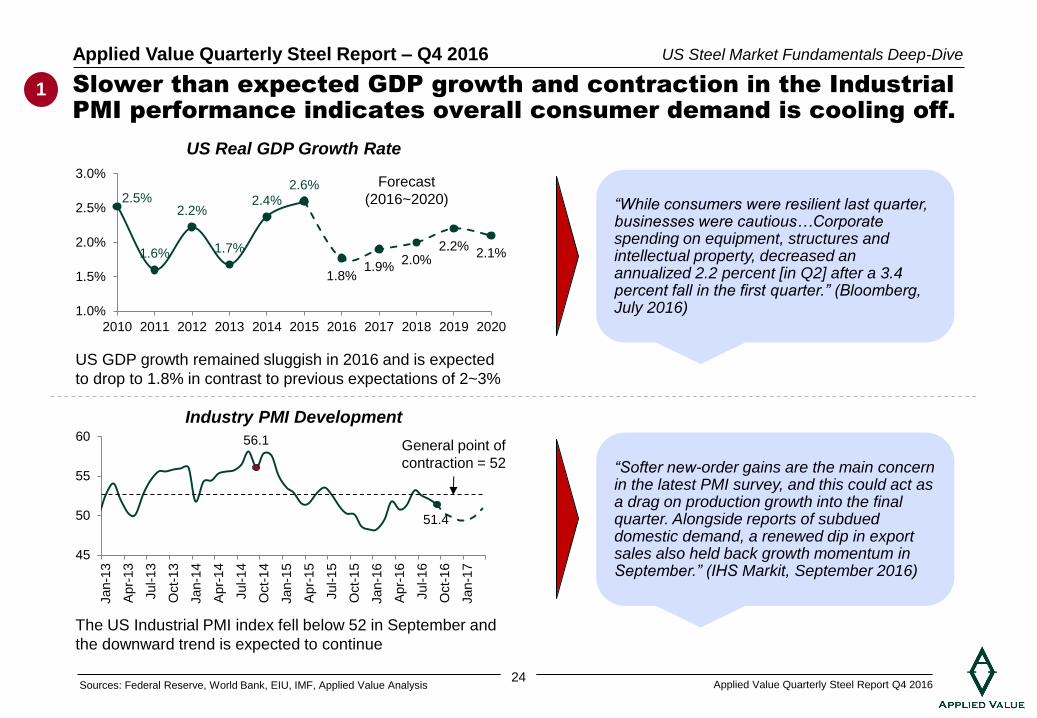
“While consumers were resilient last quarter, businesses were cautious…Corporate spending on equipment, structures and intellectual property, decreased an annualized 2.2 percent [in Q2] after a 3.4 percent fall in the first quarter.” (Bloomberg, July 2016)
Slower than expected GDP growth and contraction in the Industrial
PMI performance indicates overall consumer demand is cooling off.
US Real GDP Growth Rate
Industry PMI Development
1
2.5%
1.6%
2.2%
1.7%
2.4% 2.6%
1.8% 1.9%
2.0% 2.2%
2.1%
1.0%
1.5%
2.0%
2.5%
3.0%
2010 2011 2012 2013 2014 2015 2016 2017 2018 2019 2020
56.1
51.4
45
50
55
60
Jan-1
3
Apr-
13
Jul-1
3
Oct-
13
Jan-1
4
Apr-
14
Jul-1
4
Oct-
14
Jan-1
5
Apr-
15
Jul-1
5
Oct-
15
Jan-1
6
Apr-
16
Jul-1
6
Oct-
16
Jan-1
7
Forecast
(2016~2020)
US GDP growth remained sluggish in 2016 and is expected
to drop to 1.8% in contrast to previous expectations of 2~3%
The US Industrial PMI index fell below 52 in September and
the downward trend is expected to continue
US Steel Market Fundamentals Deep-Dive
“Softer new-order gains are the main concern in the latest PMI survey, and this could act as a drag on production growth into the final quarter. Alongside reports of subdued domestic demand, a renewed dip in export sales also held back growth momentum in September.” (IHS Markit, September 2016)
Sources: Federal Reserve, World Bank, EIU, IMF, Applied Value Analysis
General point of
contraction = 52
25 Applied Value Quarterly Steel Report Q4 2016
Applied Value Quarterly Steel Report – Q4 2016
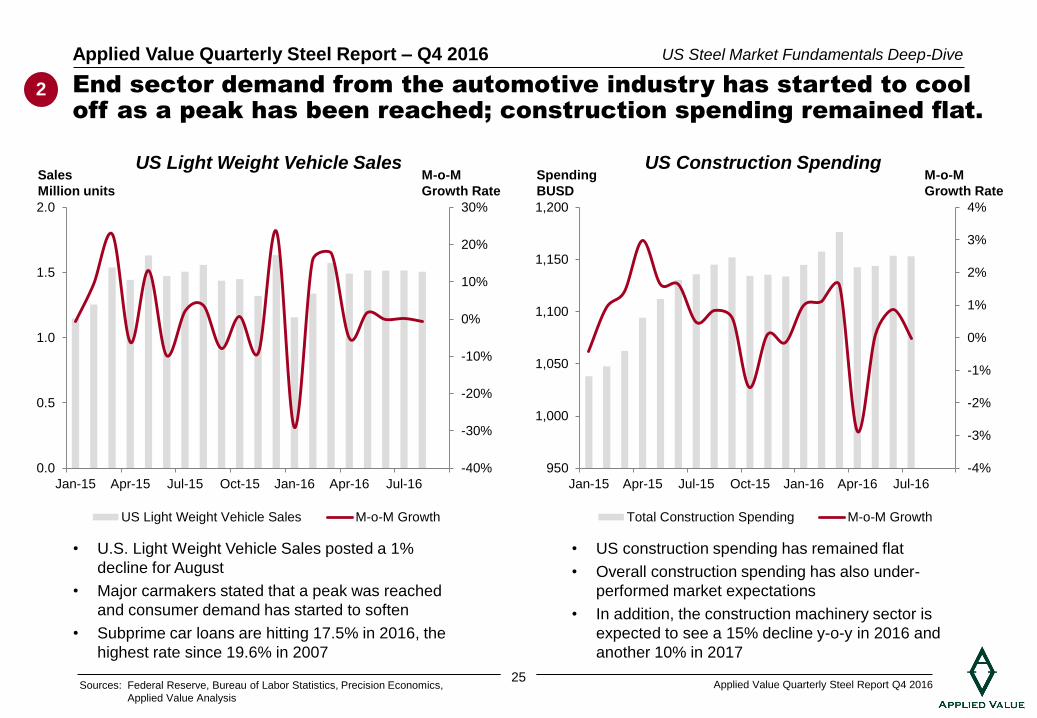
End sector demand from the automotive industry has started to cool
off as a peak has been reached; construction spending remained flat.
-40%
-30%
-20%
-10%
0%
10%
20%
30%
0.0
0.5
1.0
1.5
2.0
Jan-15 Apr-15 Jul-15 Oct-15 Jan-16 Apr-16 Jul-16
Th
ou
san
ds
US Light Weight Vehicle Sales M-o-M Growth
Sales
Million units
US Light Weight Vehicle Sales US Construction Spending
• U.S. Light Weight Vehicle Sales posted a 1%
decline for August
• Major carmakers stated that a peak was reached
and consumer demand has started to soften
• Subprime car loans are hitting 17.5% in 2016, the
highest rate since 19.6% in 2007
2
M-o-M
Growth Rate
-4%
-3%
-2%
-1%
0%
1%
2%
3%
4%
950
1,000
1,050
1,100
1,150
1,200
Jan-15 Apr-15 Jul-15 Oct-15 Jan-16 Apr-16 Jul-16
Total Construction Spending M-o-M Growth
Spending
BUSD
M-o-M
Growth Rate
US Steel Market Fundamentals Deep-Dive
• US construction spending has remained flat
• Overall construction spending has also under-
performed market expectations
• In addition, the construction machinery sector is
expected to see a 15% decline y-o-y in 2016 and
another 10% in 2017
Sources: Federal Reserve, Bureau of Labor Statistics, Precision Economics,
Applied Value Analysis
26 Applied Value Quarterly Steel Report Q4 2016
Applied Value Quarterly Steel Report – Q4 2016
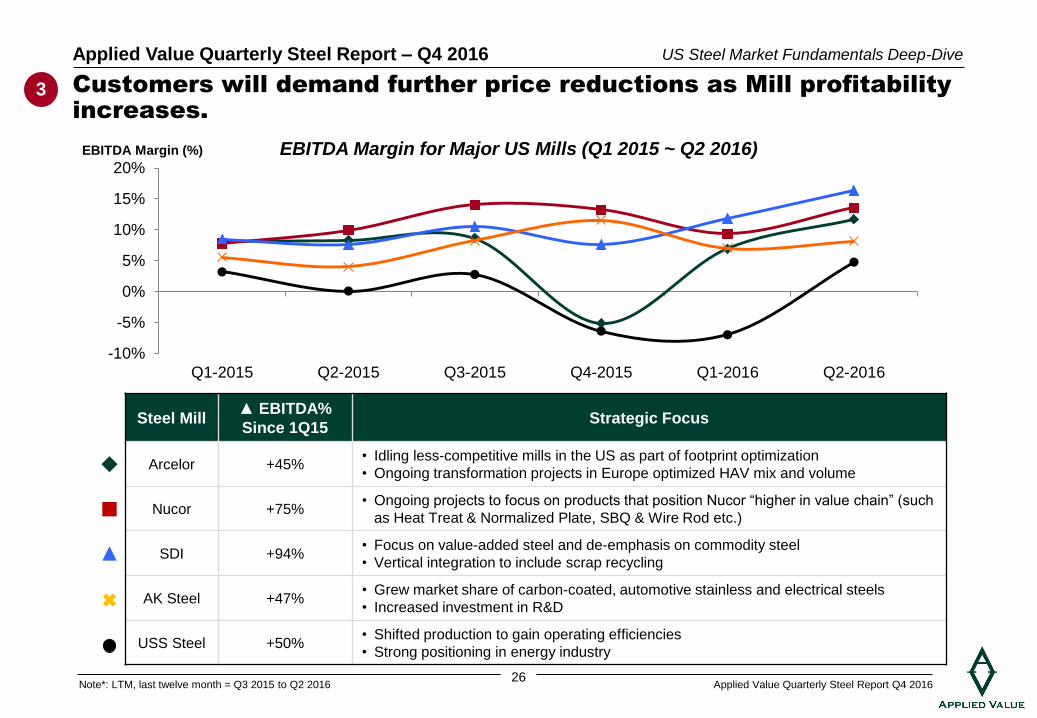
Steel Mill ▲ EBITDA%
Since 1Q15 Strategic Focus
Arcelor +45% • Idling less-competitive mills in the US as part of footprint optimization
• Ongoing transformation projects in Europe optimized HAV mix and volume
Nucor +75% • Ongoing projects to focus on products that position Nucor “higher in value chain” (such
as Heat Treat & Normalized Plate, SBQ & Wire Rod etc.)
SDI +94% • Focus on value-added steel and de-emphasis on commodity steel
• Vertical integration to include scrap recycling
AK Steel +47% • Grew market share of carbon-coated, automotive stainless and electrical steels
• Increased investment in R&D
USS Steel +50% • Shifted production to gain operating efficiencies
• Strong positioning in energy industry
Customers will demand further price reductions as Mill profitability
increases.
-10%
-5%
0%
5%
10%
15%
20%
Q1-2015 Q2-2015 Q3-2015 Q4-2015 Q1-2016 Q2-2016
3
EBITDA Margin for Major US Mills (Q1 2015 ~ Q2 2016)
Note*: LTM, last twelve month = Q3 2015 to Q2 2016
US Steel Market Fundamentals Deep-Dive
EBITDA Margin (%)
27 Applied Value Quarterly Steel Report Q4 2016
Applied Value Quarterly Steel Report – Q4 2016
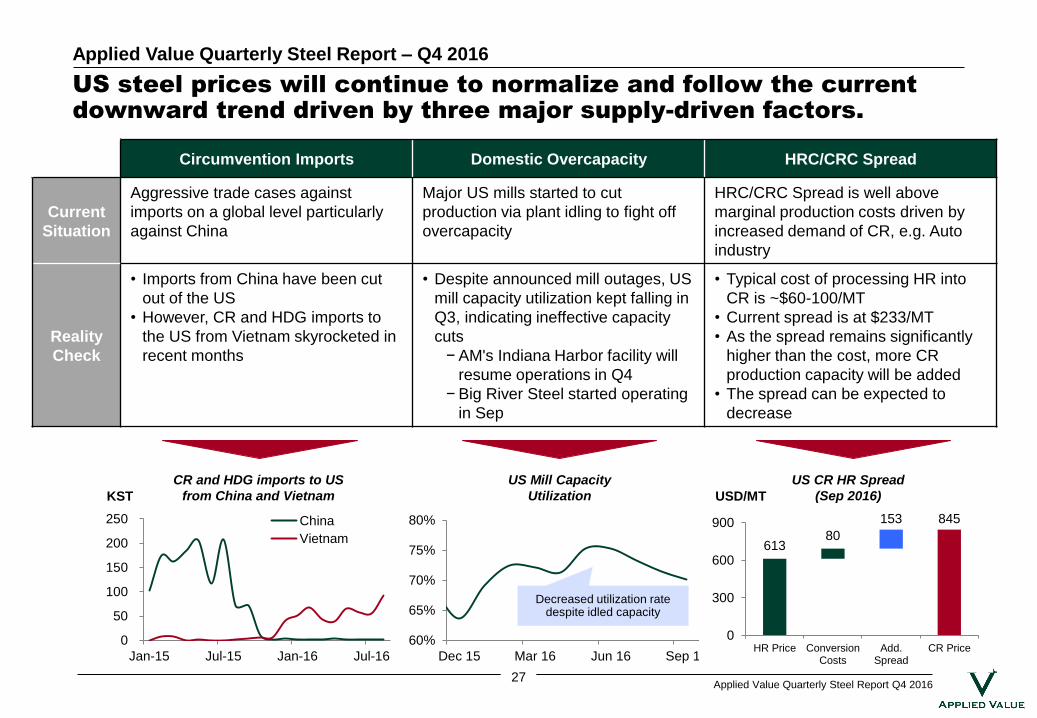
60%
65%
70%
75%
80%
Dec 15 Mar 16 Jun 16 Sep 16
Circumvention Imports Domestic Overcapacity HRC/CRC Spread
Current
Situation
Aggressive trade cases against
imports on a global level particularly
against China
Major US mills started to cut
production via plant idling to fight off
overcapacity
HRC/CRC Spread is well above
marginal production costs driven by
increased demand of CR, e.g. Auto
industry
Reality
Check
• Imports from China have been cut
out of the US
• However, CR and HDG imports to
the US from Vietnam skyrocketed in
recent months
• Despite announced mill outages, US
mill capacity utilization kept falling in
Q3, indicating ineffective capacity
cuts
− AM's Indiana Harbor facility will
resume operations in Q4
− Big River Steel started operating
in Sep
• Typical cost of processing HR into
CR is ~$60-100/MT
• Current spread is at $233/MT
• As the spread remains significantly
higher than the cost, more CR
production capacity will be added
• The spread can be expected to
decrease
US steel prices will continue to normalize and follow the current
downward trend driven by three major supply-driven factors.
0
50
100
150
200
250
Jan-15 Jul-15 Jan-16 Jul-16
China
Vietnam
CR and HDG imports to US
from China and Vietnam KST
US Mill Capacity
Utilization
US CR HR Spread
(Sep 2016) USD/MT
Decreased utilization rate despite idled capacity
613 80
153 845
0
300
600
900
HR Price ConversionCosts
Add.Spread
CR Price
28 Applied Value Quarterly Steel Report Q4 2016
Applied Value Quarterly Steel Report – Q4 2016
Market Conditions by Region
Stock Price Development of Major Steel Companies
Steel Production Costs
US Market Fundamentals Deep-Dive
29 Applied Value Quarterly Steel Report Q4 2016
Applied Value Quarterly Steel Report – Q4 2016
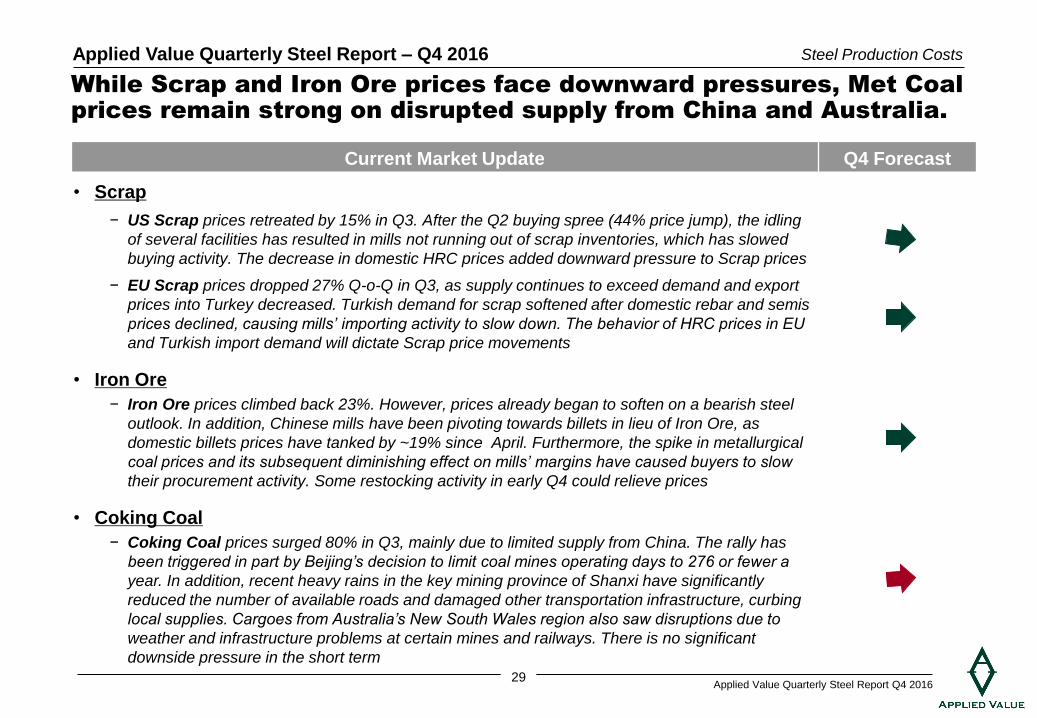
While Scrap and Iron Ore prices face downward pressures, Met Coal
prices remain strong on disrupted supply from China and Australia.
• Scrap
− US Scrap prices retreated by 15% in Q3. After the Q2 buying spree (44% price jump), the idling
of several facilities has resulted in mills not running out of scrap inventories, which has slowed
buying activity. The decrease in domestic HRC prices added downward pressure to Scrap prices
− EU Scrap prices dropped 27% Q-o-Q in Q3, as supply continues to exceed demand and export
prices into Turkey decreased. Turkish demand for scrap softened after domestic rebar and semis
prices declined, causing mills’ importing activity to slow down. The behavior of HRC prices in EU
and Turkish import demand will dictate Scrap price movements
• Iron Ore
− Iron Ore prices climbed back 23%. However, prices already began to soften on a bearish steel
outlook. In addition, Chinese mills have been pivoting towards billets in lieu of Iron Ore, as
domestic billets prices have tanked by ~19% since April. Furthermore, the spike in metallurgical
coal prices and its subsequent diminishing effect on mills’ margins have caused buyers to slow
their procurement activity. Some restocking activity in early Q4 could relieve prices
• Coking Coal
− Coking Coal prices surged 80% in Q3, mainly due to limited supply from China. The rally has
been triggered in part by Beijing’s decision to limit coal mines operating days to 276 or fewer a
year. In addition, recent heavy rains in the key mining province of Shanxi have significantly
reduced the number of available roads and damaged other transportation infrastructure, curbing
local supplies. Cargoes from Australia’s New South Wales region also saw disruptions due to
weather and infrastructure problems at certain mines and railways. There is no significant
downside pressure in the short term
Steel Production Costs
Current Market Update Q4 Forecast
30 Applied Value Quarterly Steel Report Q4 2016
Applied Value Quarterly Steel Report – Q4 2016
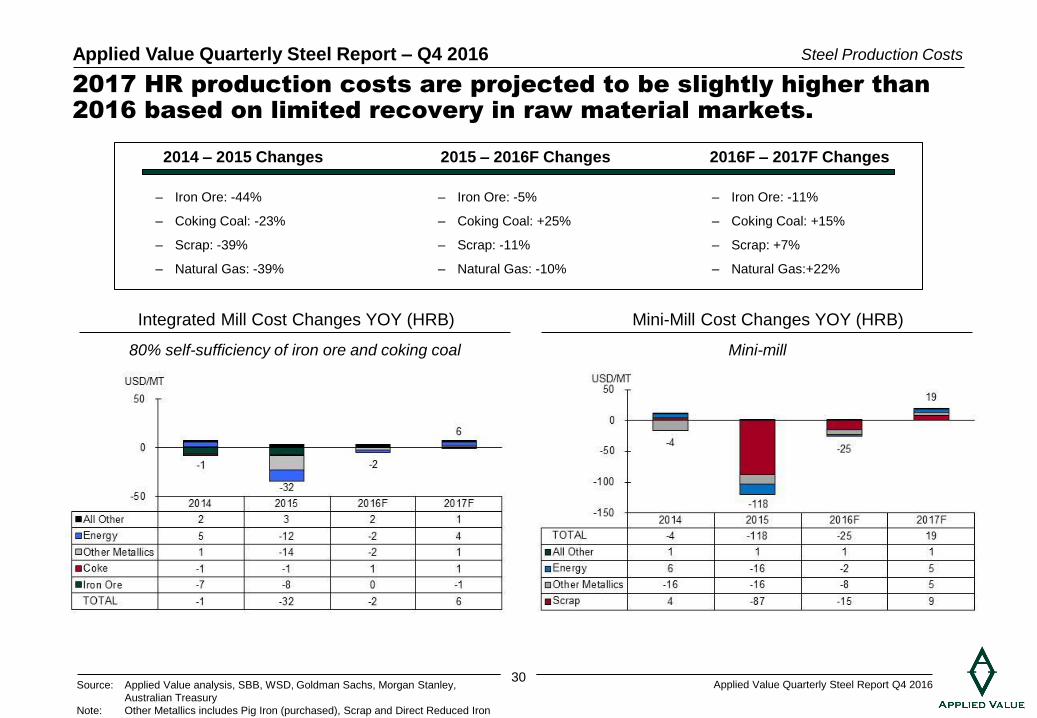
2017 HR production costs are projected to be slightly higher than
2016 based on limited recovery in raw material markets.
80% self-sufficiency of iron ore and coking coal
Integrated Mill Cost Changes YOY (HRB)
Source: Applied Value analysis, SBB, WSD, Goldman Sachs, Morgan Stanley,
Australian Treasury
Note: Other Metallics includes Pig Iron (purchased), Scrap and Direct Reduced Iron
Mini-mill
Mini-Mill Cost Changes YOY (HRB)
2014 – 2015 Changes 2015 – 2016F Changes
– Iron Ore: -44%
– Coking Coal: -23%
– Scrap: -39%
– Natural Gas: -39%
– Iron Ore: -5%
– Coking Coal: +25%
– Scrap: -11%
– Natural Gas: -10%
Steel Production Costs
2016F – 2017F Changes
– Iron Ore: -11%
– Coking Coal: +15%
– Scrap: +7%
– Natural Gas:+22%
31 Applied Value Quarterly Steel Report Q4 2016
Applied Value Quarterly Steel Report – Q4 2016
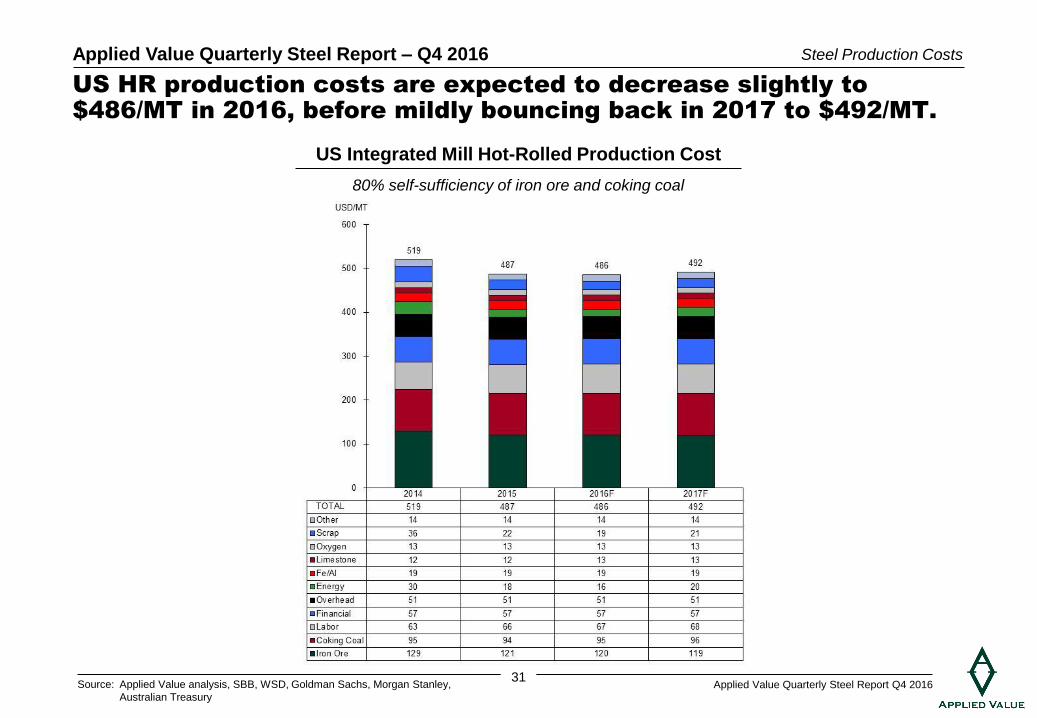
US HR production costs are expected to decrease slightly to
$486/MT in 2016, before mildly bouncing back in 2017 to $492/MT.
US Integrated Mill Hot-Rolled Production Cost
80% self-sufficiency of iron ore and coking coal
Steel Production Costs
Source: Applied Value analysis, SBB, WSD, Goldman Sachs, Morgan Stanley,
Australian Treasury
32 Applied Value Quarterly Steel Report Q4 2016
Applied Value Quarterly Steel Report – Q4 2016
US HDG production costs are expected to remain stable in 2016 before
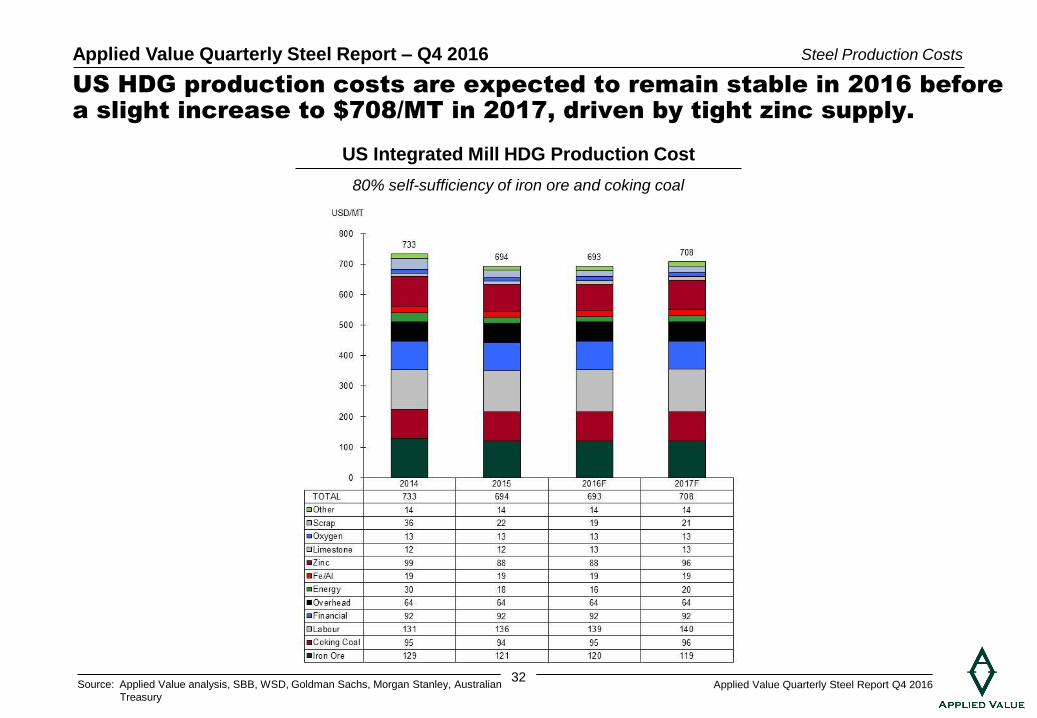
a slight increase to $708/MT in 2017, driven by tight zinc supply.
US Integrated Mill HDG Production Cost
80% self-sufficiency of iron ore and coking coal
Steel Production Costs
Source: Applied Value analysis, SBB, WSD, Goldman Sachs, Morgan Stanley, Australian
Treasury
33 Applied Value Quarterly Steel Report Q4 2016
Applied Value Quarterly Steel Report – Q4 2016
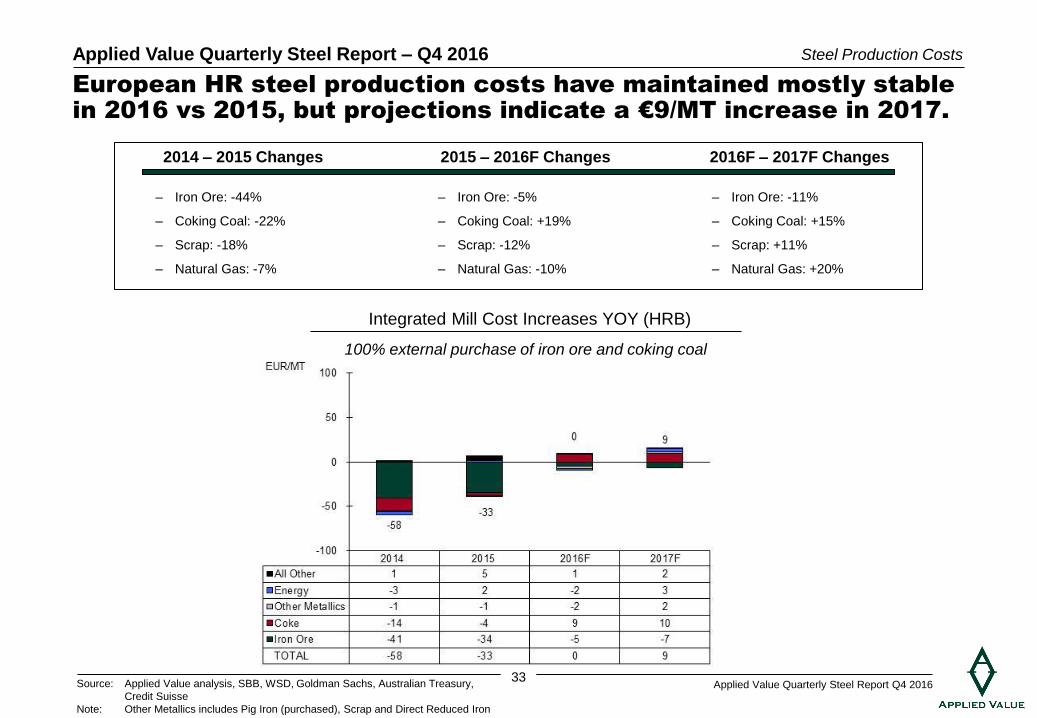
European HR steel production costs have maintained mostly stable
in 2016 vs 2015, but projections indicate a €9/MT increase in 2017.
2014 – 2015 Changes 2015 – 2016F Changes
– Iron Ore: -44%
– Coking Coal: -22%
– Scrap: -18%
– Natural Gas: -7%
– Iron Ore: -5%
– Coking Coal: +19%
– Scrap: -12%
– Natural Gas: -10%
Steel Production Costs
2016F – 2017F Changes
– Iron Ore: -11%
– Coking Coal: +15%
– Scrap: +11%
– Natural Gas: +20%
100% external purchase of iron ore and coking coal
Integrated Mill Cost Increases YOY (HRB)
Source: Applied Value analysis, SBB, WSD, Goldman Sachs, Australian Treasury,
Credit Suisse
Note: Other Metallics includes Pig Iron (purchased), Scrap and Direct Reduced Iron
34 Applied Value Quarterly Steel Report Q4 2016
Applied Value Quarterly Steel Report – Q4 2016
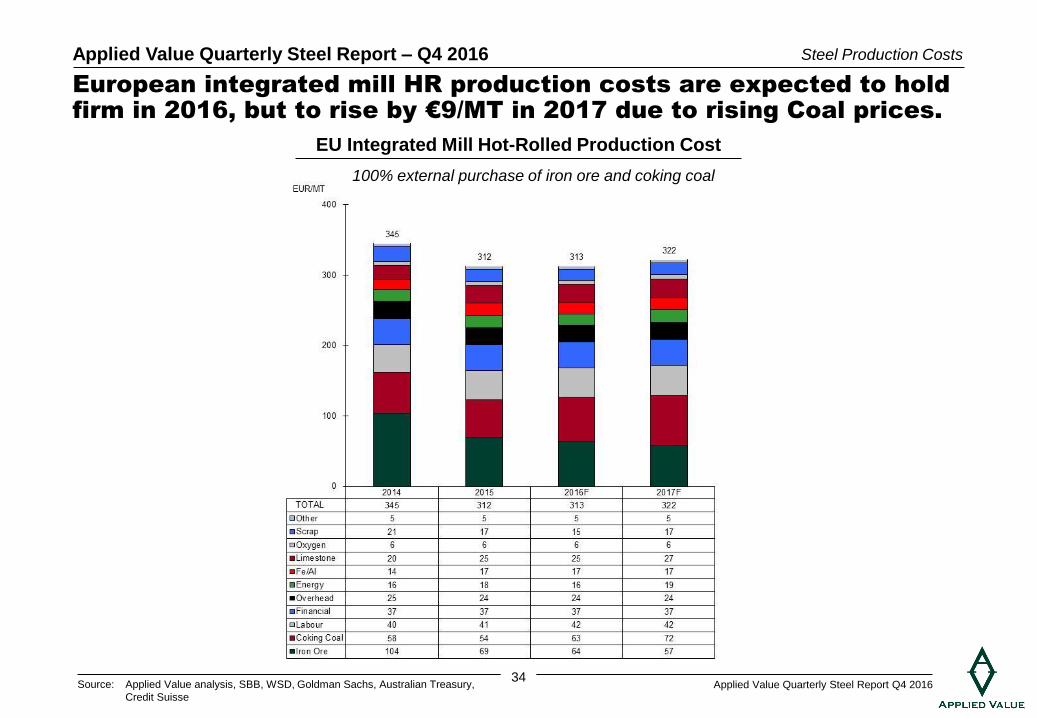
European integrated mill HR production costs are expected to hold
firm in 2016, but to rise by €9/MT in 2017 due to rising Coal prices.
EU Integrated Mill Hot-Rolled Production Cost
100% external purchase of iron ore and coking coal
Steel Production Costs
Source: Applied Value analysis, SBB, WSD, Goldman Sachs, Australian Treasury,
Credit Suisse
35 Applied Value Quarterly Steel Report Q4 2016
Applied Value Quarterly Steel Report – Q4 2016
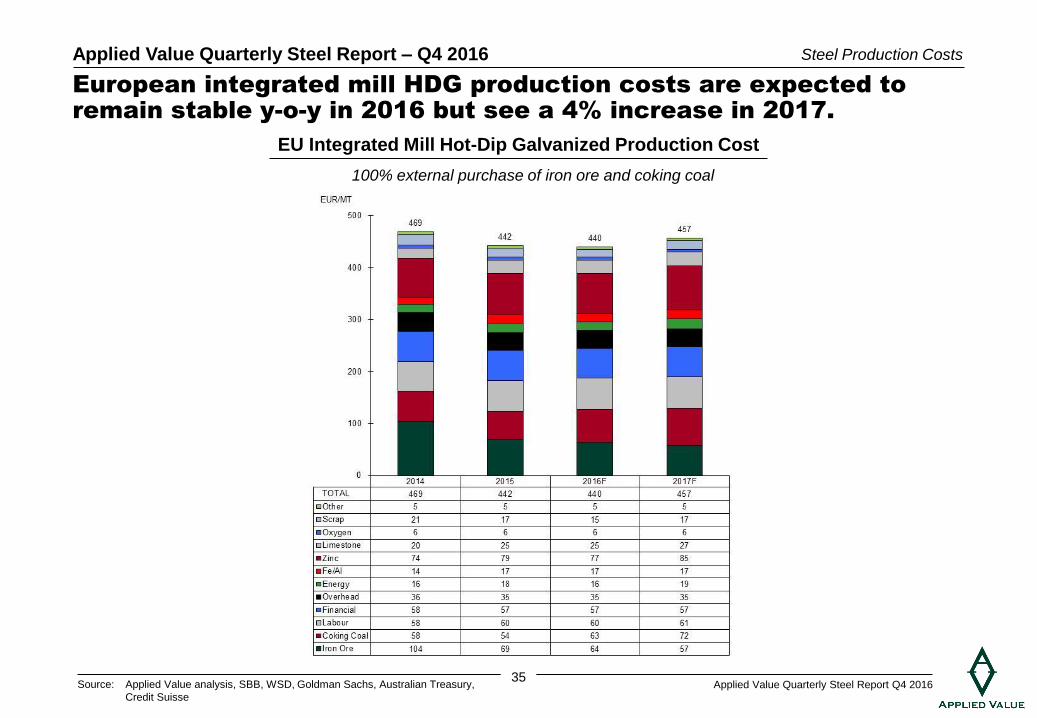
European integrated mill HDG production costs are expected to
remain stable y-o-y in 2016 but see a 4% increase in 2017.
EU Integrated Mill Hot-Dip Galvanized Production Cost
100% external purchase of iron ore and coking coal
Steel Production Costs
Source: Applied Value analysis, SBB, WSD, Goldman Sachs, Australian Treasury,
Credit Suisse
36 Applied Value Quarterly Steel Report Q4 2016
Applied Value Quarterly Steel Report – Q4 2016
€200
€190
150
200
250
300
Sep 14 Mar 15 Sep 15 Mar 16 Sep 16
EU
R/ M
T
$240 $245
150
250
350
450
Sep 14 Mar 15 Sep 15 Mar 16 Sep 16
US
D / M
T
$298 $305
$200
$300
$400
$500
$600
Sep 14 Mar 15 Sep 15 Mar 16 Sep 16
US
D / M
T
$231 $220
150
250
350
450
Sep 14 Mar 15 Sep 15 Mar 16 Sep 16
US
D / G
T
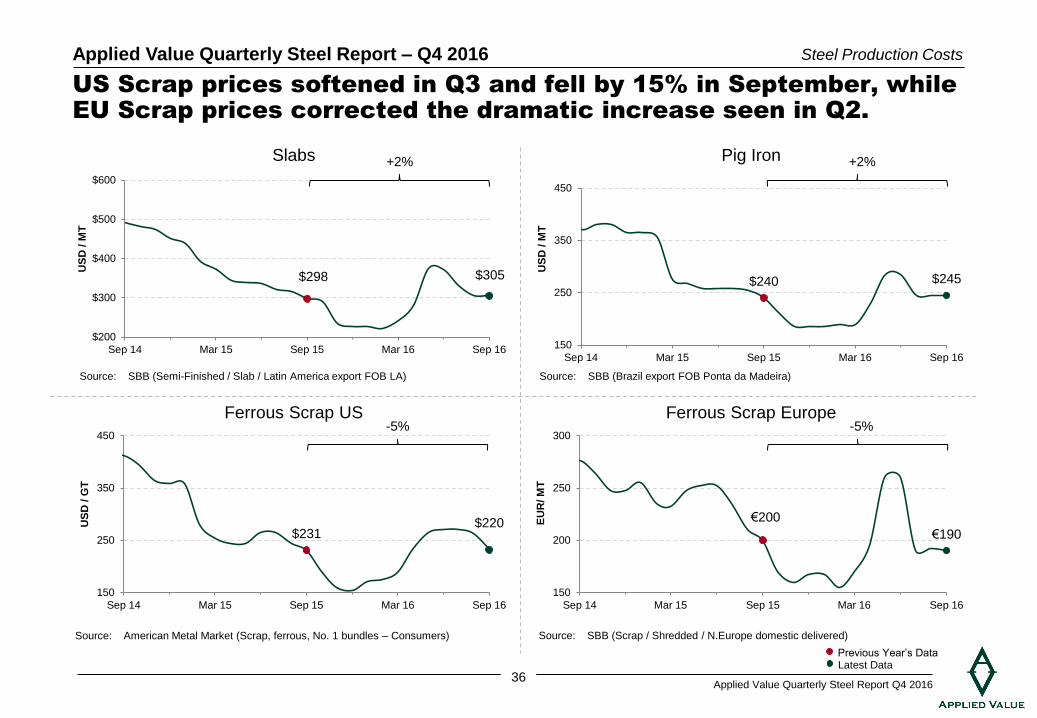
US Scrap prices softened in Q3 and fell by 15% in September, while
EU Scrap prices corrected the dramatic increase seen in Q2.
Source: SBB (Semi-Finished / Slab / Latin America export FOB LA)
Source: American Metal Market (Scrap, ferrous, No. 1 bundles – Consumers) Source: SBB (Scrap / Shredded / N.Europe domestic delivered)
Source: SBB (Brazil export FOB Ponta da Madeira)
Previous Year’s Data Latest Data
Slabs Pig Iron
Ferrous Scrap US Ferrous Scrap Europe
Steel Production Costs
-5% -5%
+2% +2%
37 Applied Value Quarterly Steel Report Q4 2016
Applied Value Quarterly Steel Report – Q4 2016
$54 $56
20
40
60
80
100
Sep 14 Mar 15 Sep 15 Mar 16 Sep 16
US
D / M
T
$1,766
$2,344
1,000
1,500
2,000
2,500
3,000
Sep 14 Mar 15 Sep 15 Mar 16 Sep 16
US
D / M
T
$80
$159
50
100
150
200
Sep 14 Mar 15 Sep 15 Mar 16 Sep 16
US
D / M
T
278
291
260
270
280
290
300
Jul 14 Jan 15 Jul 15 Jan 16 Jul 16
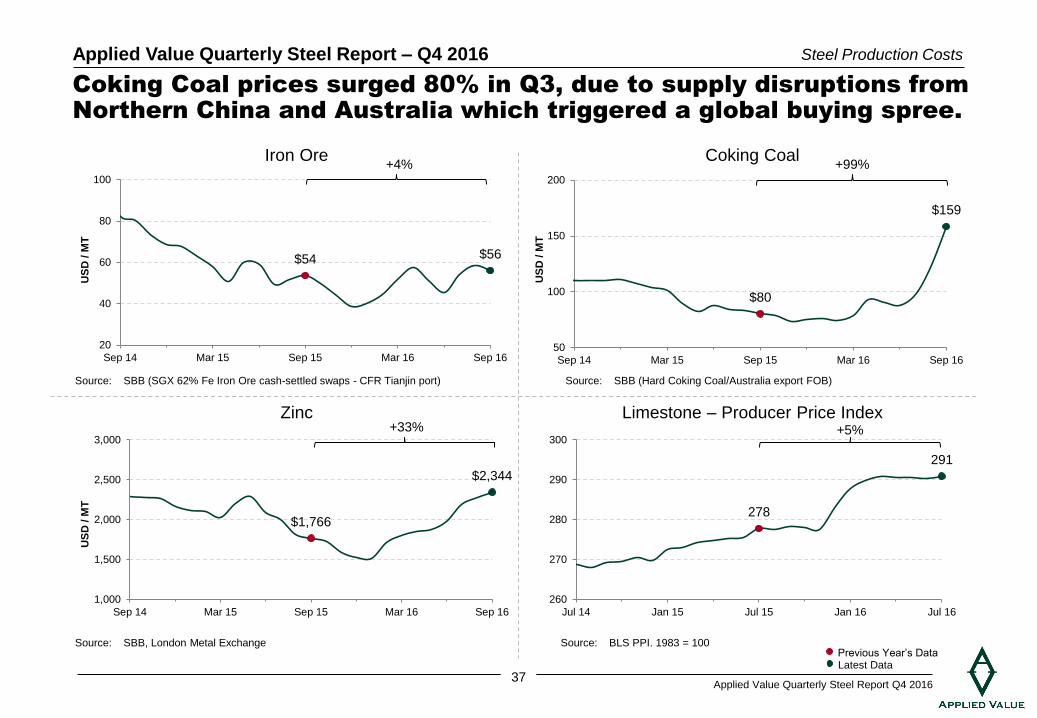
Coking Coal prices surged 80% in Q3, due to supply disruptions from
Northern China and Australia which triggered a global buying spree.
Source: SBB (SGX 62% Fe Iron Ore cash-settled swaps - CFR Tianjin port)
Source: SBB, London Metal Exchange Source: BLS PPI. 1983 = 100
Source: SBB (Hard Coking Coal/Australia export FOB)
Iron Ore Coking Coal
Zinc Limestone – Producer Price Index
Previous Year’s Data Latest Data
Steel Production Costs
+33% +5%
+99% +4%
38 Applied Value Quarterly Steel Report Q4 2016
Applied Value Quarterly Steel Report – Q4 2016
€19.75
€12.65
10
15
20
25
30
Sep 14 Mar 15 Sep 15 Mar 16 Sep 16
Eu
ro / M
WH
$2.76 $2.94
1
2
3
4
5
6
Sep 14 Mar 15 Sep 15 Mar 16 Sep 16
US
D/m
mB
tu
$7.30 $7.23
6.0
6.5
7.0
7.5
8.0
Sep 14 Mar 15 Sep 15 Mar 16 Sep 16
US
cen
ts /
KW
H
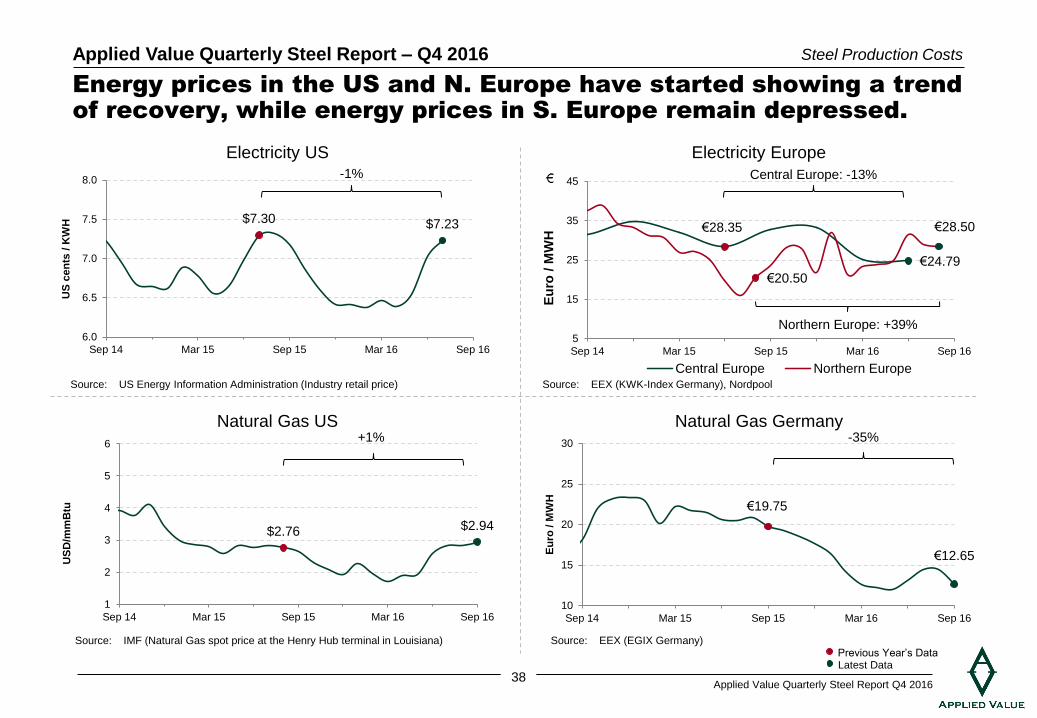
Energy prices in the US and N. Europe have started showing a trend
of recovery, while energy prices in S. Europe remain depressed.
Source: US Energy Information Administration (Industry retail price)
Source: IMF (Natural Gas spot price at the Henry Hub terminal in Louisiana) Source: EEX (EGIX Germany)
Source: EEX (KWK-Index Germany), Nordpool
-1%
+1% -35%
Electricity US
Natural Gas US Natural Gas Germany
Previous Year’s Data Latest Data
Steel Production Costs
€28.35
€24.79
€20.50
€28.50
5
15
25
35
45
Sep 14 Mar 15 Sep 15 Mar 16 Sep 16
Eu
ro /
MW
H
Central Europe Northern Europe
Electricity Europe
Central Europe: -13%
Northern Europe: +39%
39 Applied Value Quarterly Steel Report Q4 2016
Applied Value Quarterly Steel Report – Q4 2016
Market Conditions by Region
Stock Price Development of Major Steel Companies
Steel Production Costs
US Market Fundamentals Deep-Dive
40 Applied Value Quarterly Steel Report Q4 2016
Applied Value Quarterly Steel Report – Q4 2016
2016 Q3 major developments in the steel industry.
• Current improved steel price and spreads in China are expected to spill over to Japan and improve the NSSMC’s profitability with a lag
• POSCO posted a profit margin of 11.9% for Q2, the highest in four years thanks to the increased sales ratio of high quality steel
• JFE sees marginal improvement in export spread and also expects domestic demand to pick up in 2H, led by autos and construction
• Baosteel and Wugang revealed mega-merger plans; the new giant would unseat Hebei Steel as China’s biggest steel producer
• Angang continued cost-cutting efforts and expects a stable margin outlook in Q3 and Q4
• US Steel posted a narrower net loss and improved its full-year guidance for a key earnings metric
• AK Steel swung to a profit as the steelmaker reduced its exposure to spot prices and focused on more profitable coated products
• Severstal’s Q2 results were strong and in line with expectations, reflecting the recent hike in steel prices
• Thyssenkrupp reported a 34% slide in net profit for Q3, weighed down by drops in global steel and material prices from a year ago
• Tata Steel posted a 10% increase in net loss for the fiscal Q1 as a slowdown in demand and losses at its U.K. business hurt margins
• Voestalpine expects earnings to increase, helped by higher prices in its longer-term contracts and increasing orders from the oil & gas sector
• Evraz has suffered a plunge in revenue and profit as it suffers a hangover from the global steel crisis
Stock Price Development of Major Steel Companies
41 Applied Value Quarterly Steel Report Q4 2016
Applied Value Quarterly Steel Report – Q4 2016
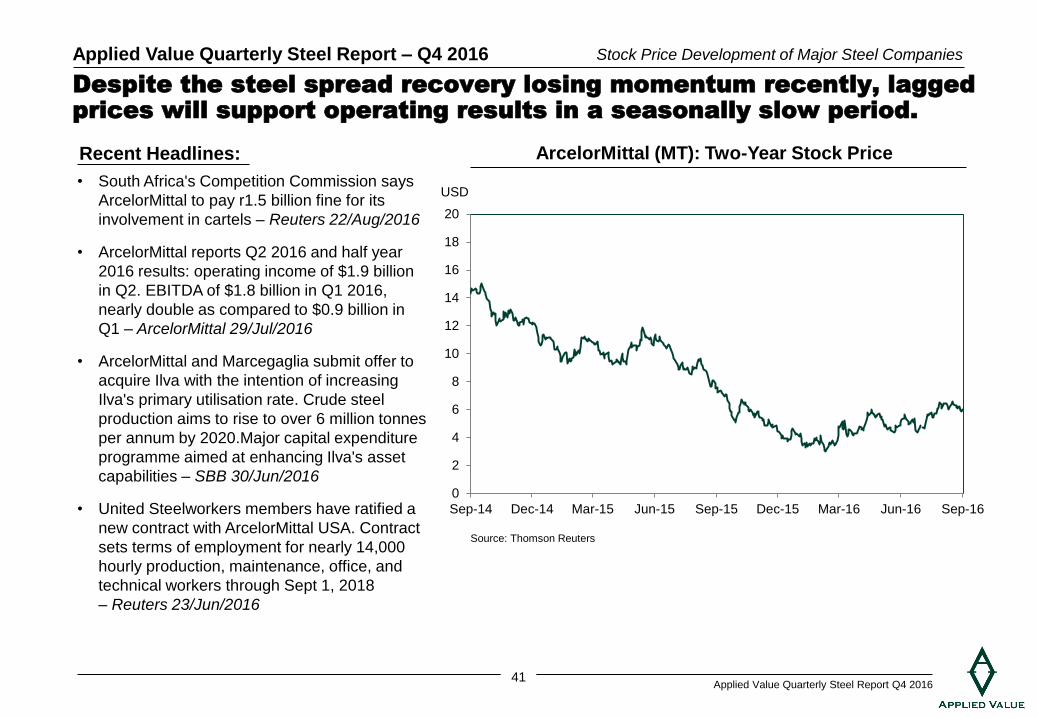
Despite the steel spread recovery losing momentum recently, lagged
prices will support operating results in a seasonally slow period.
• South Africa's Competition Commission says
ArcelorMittal to pay r1.5 billion fine for its
involvement in cartels – Reuters 22/Aug/2016
• ArcelorMittal reports Q2 2016 and half year
2016 results: operating income of $1.9 billion
in Q2. EBITDA of $1.8 billion in Q1 2016,
nearly double as compared to $0.9 billion in
Q1 – ArcelorMittal 29/Jul/2016
• ArcelorMittal and Marcegaglia submit offer to
acquire Ilva with the intention of increasing
Ilva's primary utilisation rate. Crude steel
production aims to rise to over 6 million tonnes
per annum by 2020.Major capital expenditure
programme aimed at enhancing Ilva's asset
capabilities – SBB 30/Jun/2016
• United Steelworkers members have ratified a
new contract with ArcelorMittal USA. Contract
sets terms of employment for nearly 14,000
hourly production, maintenance, office, and
technical workers through Sept 1, 2018
– Reuters 23/Jun/2016
Stock Price Development of Major Steel Companies
Recent Headlines:
Source: Thomson Reuters
ArcelorMittal (MT): Two-Year Stock Price
USD
0
2
4
6
8
10
12
14
16
18
20
Sep-14 Dec-14 Mar-15 Jun-15 Sep-15 Dec-15 Mar-16 Jun-16 Sep-16
42 Applied Value Quarterly Steel Report Q4 2016
Applied Value Quarterly Steel Report – Q4 2016
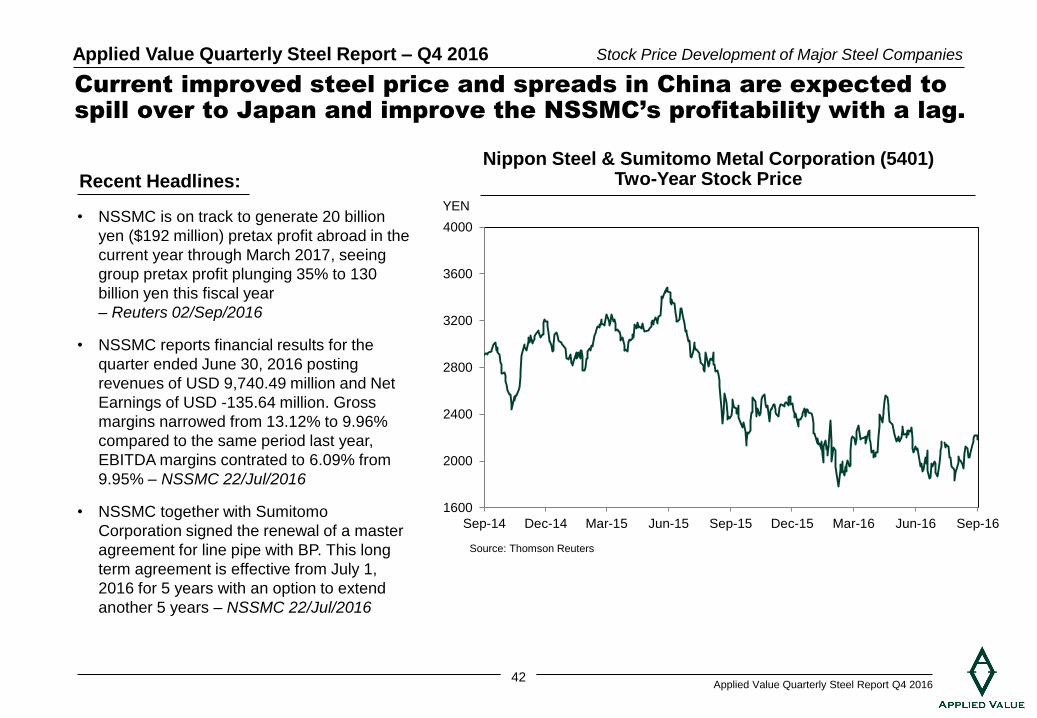
Current improved steel price and spreads in China are expected to
spill over to Japan and improve the NSSMC’s profitability with a lag.
• NSSMC is on track to generate 20 billion
yen ($192 million) pretax profit abroad in the
current year through March 2017, seeing
group pretax profit plunging 35% to 130
billion yen this fiscal year
– Reuters 02/Sep/2016
• NSSMC reports financial results for the
quarter ended June 30, 2016 posting
revenues of USD 9,740.49 million and Net
Earnings of USD -135.64 million. Gross
margins narrowed from 13.12% to 9.96%
compared to the same period last year,
EBITDA margins contrated to 6.09% from
9.95% – NSSMC 22/Jul/2016
• NSSMC together with Sumitomo
Corporation signed the renewal of a master
agreement for line pipe with BP. This long
term agreement is effective from July 1,
2016 for 5 years with an option to extend
another 5 years – NSSMC 22/Jul/2016
Stock Price Development of Major Steel Companies
Recent Headlines:
Nippon Steel & Sumitomo Metal Corporation (5401) Two-Year Stock Price
1600
2000
2400
2800
3200
3600
4000
Sep-14 Dec-14 Mar-15 Jun-15 Sep-15 Dec-15 Mar-16 Jun-16 Sep-16
Source: Thomson Reuters
YEN
43 Applied Value Quarterly Steel Report Q4 2016
Applied Value Quarterly Steel Report – Q4 2016
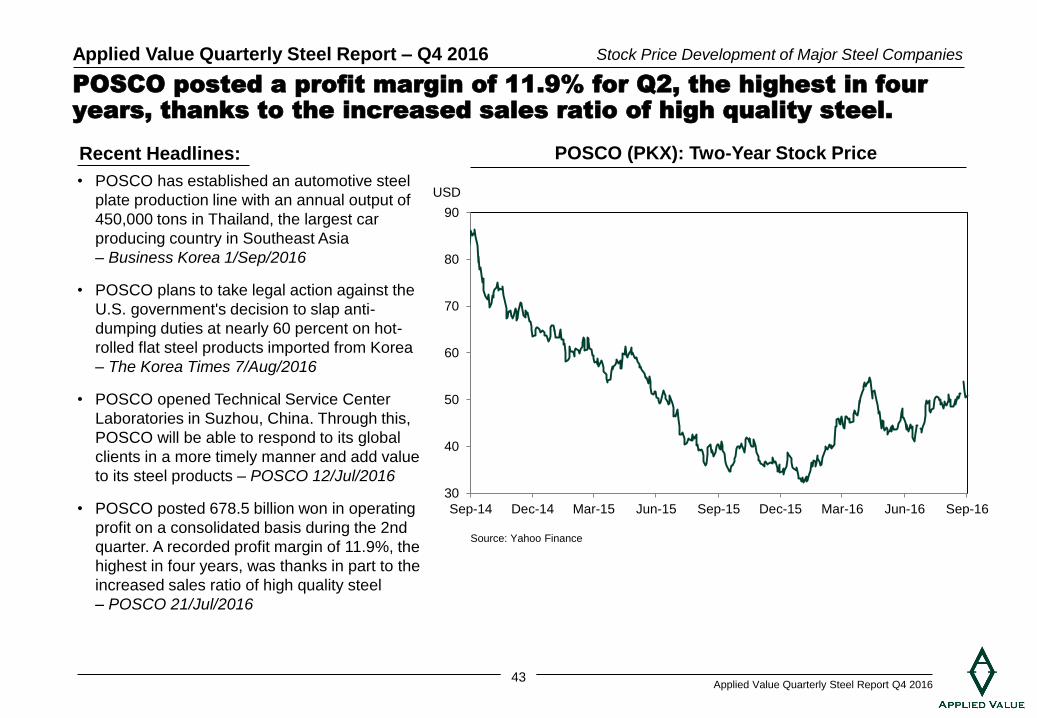
POSCO posted a profit margin of 11.9% for Q2, the highest in four
years, thanks to the increased sales ratio of high quality steel.
Stock Price Development of Major Steel Companies
Recent Headlines: POSCO (PKX): Two-Year Stock Price
USD • POSCO has established an automotive steel
plate production line with an annual output of
450,000 tons in Thailand, the largest car
producing country in Southeast Asia
– Business Korea 1/Sep/2016
• POSCO plans to take legal action against the
U.S. government's decision to slap anti-
dumping duties at nearly 60 percent on hot-
rolled flat steel products imported from Korea
– The Korea Times 7/Aug/2016
• POSCO opened Technical Service Center
Laboratories in Suzhou, China. Through this,
POSCO will be able to respond to its global
clients in a more timely manner and add value
to its steel products – POSCO 12/Jul/2016
• POSCO posted 678.5 billion won in operating
profit on a consolidated basis during the 2nd
quarter. A recorded profit margin of 11.9%, the
highest in four years, was thanks in part to the
increased sales ratio of high quality steel
– POSCO 21/Jul/2016
30
40
50
60
70
80
90
Sep-14 Dec-14 Mar-15 Jun-15 Sep-15 Dec-15 Mar-16 Jun-16 Sep-16
Source: Yahoo Finance
44 Applied Value Quarterly Steel Report Q4 2016
Applied Value Quarterly Steel Report – Q4 2016
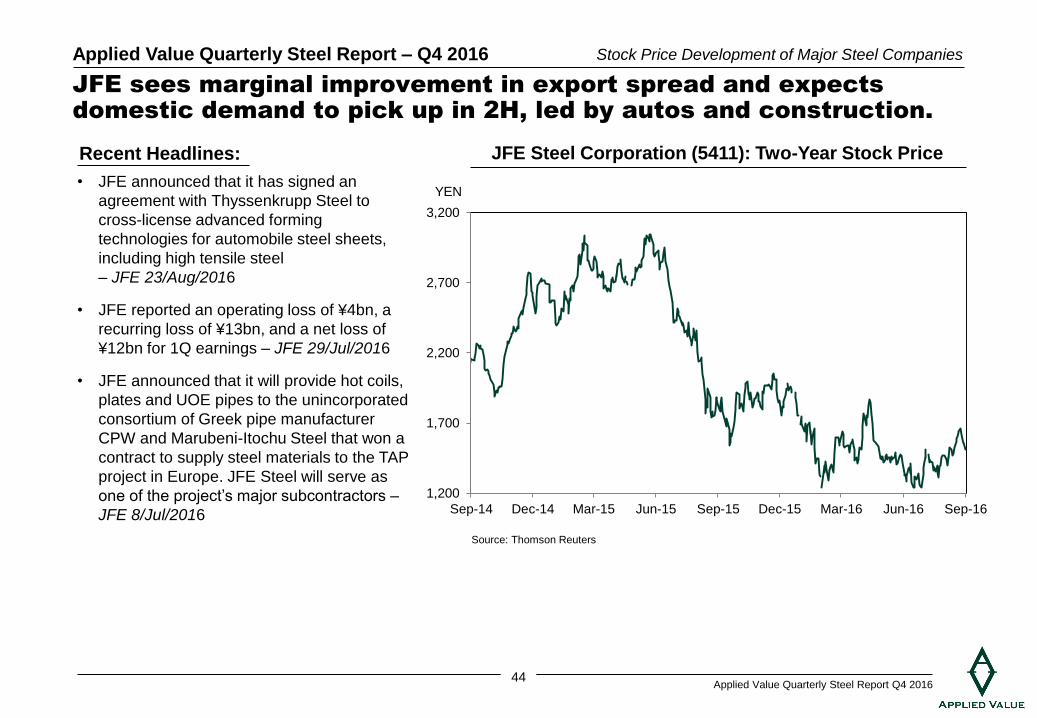
JFE sees marginal improvement in export spread and expects
domestic demand to pick up in 2H, led by autos and construction.
Stock Price Development of Major Steel Companies
Recent Headlines: JFE Steel Corporation (5411): Two-Year Stock Price
YEN • JFE announced that it has signed an
agreement with Thyssenkrupp Steel to
cross-license advanced forming
technologies for automobile steel sheets,
including high tensile steel
– JFE 23/Aug/2016
• JFE reported an operating loss of ¥4bn, a
recurring loss of ¥13bn, and a net loss of
¥12bn for 1Q earnings – JFE 29/Jul/2016
• JFE announced that it will provide hot coils,
plates and UOE pipes to the unincorporated
consortium of Greek pipe manufacturer
CPW and Marubeni-Itochu Steel that won a
contract to supply steel materials to the TAP
project in Europe. JFE Steel will serve as
one of the project’s major subcontractors –
JFE 8/Jul/2016
1,200
1,700
2,200
2,700
3,200
Sep-14 Dec-14 Mar-15 Jun-15 Sep-15 Dec-15 Mar-16 Jun-16 Sep-16
Source: Thomson Reuters
45 Applied Value Quarterly Steel Report Q4 2016
Applied Value Quarterly Steel Report – Q4 2016
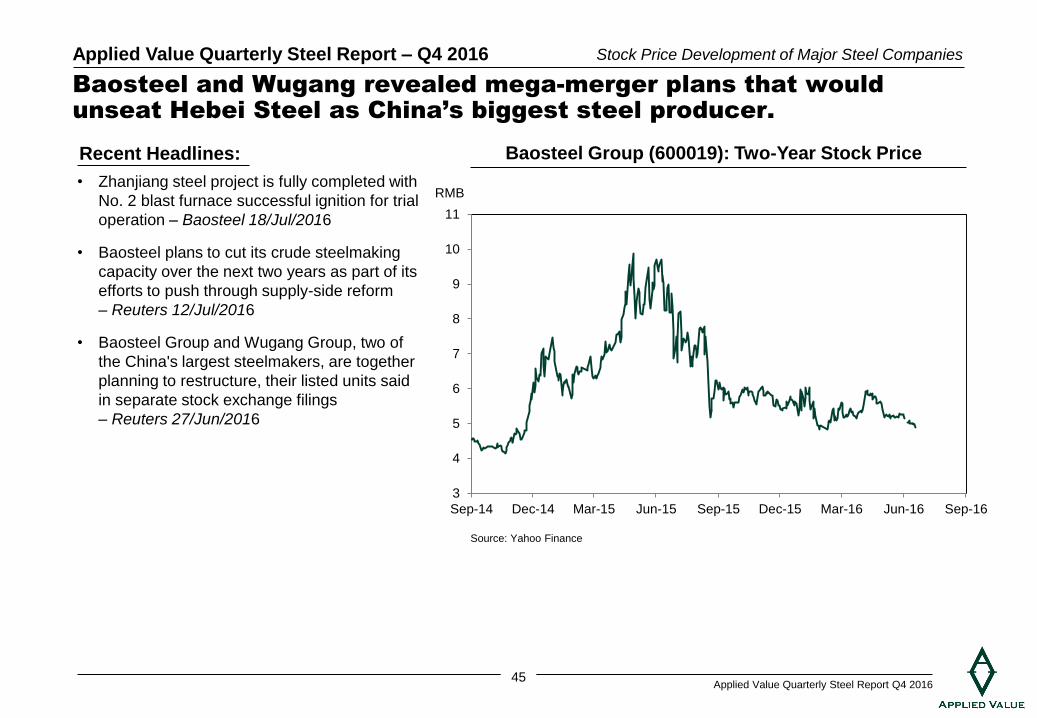
Baosteel and Wugang revealed mega-merger plans that would
unseat Hebei Steel as China’s biggest steel producer.
Stock Price Development of Major Steel Companies
Recent Headlines: Baosteel Group (600019): Two-Year Stock Price
RMB • Zhanjiang steel project is fully completed with
No. 2 blast furnace successful ignition for trial
operation – Baosteel 18/Jul/2016
• Baosteel plans to cut its crude steelmaking
capacity over the next two years as part of its
efforts to push through supply-side reform
– Reuters 12/Jul/2016
• Baosteel Group and Wugang Group, two of
the China's largest steelmakers, are together
planning to restructure, their listed units said
in separate stock exchange filings
– Reuters 27/Jun/2016
3
4
5
6
7
8
9
10
11
Sep-14 Dec-14 Mar-15 Jun-15 Sep-15 Dec-15 Mar-16 Jun-16 Sep-16
Source: Yahoo Finance
46 Applied Value Quarterly Steel Report Q4 2016
Applied Value Quarterly Steel Report – Q4 2016
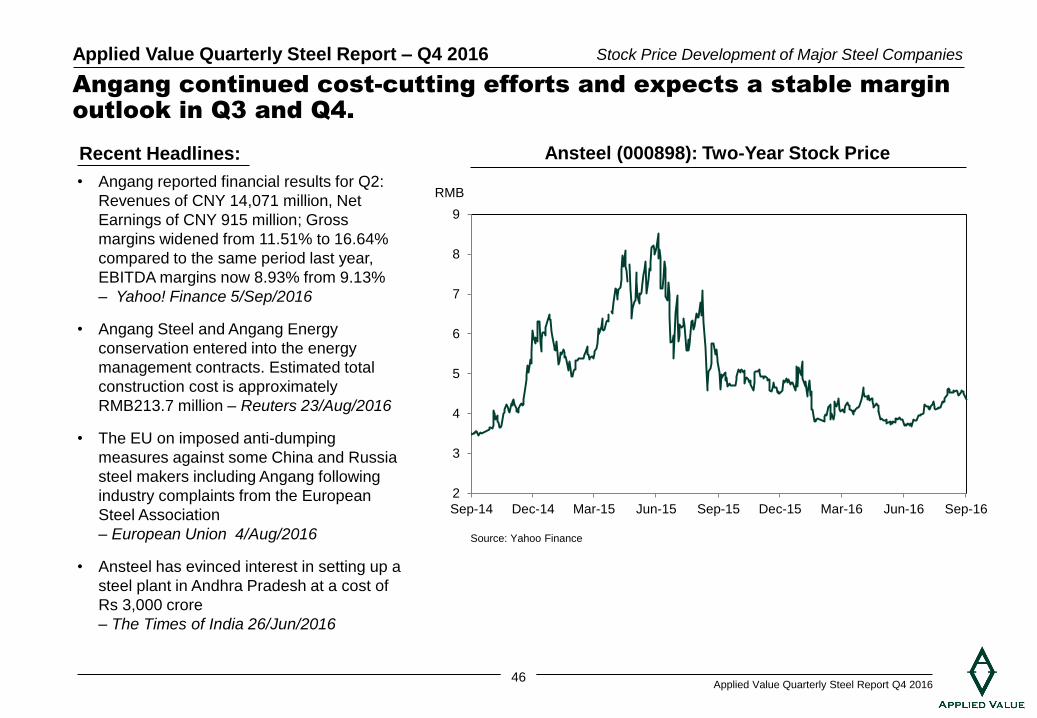
Angang continued cost-cutting efforts and expects a stable margin
outlook in Q3 and Q4.
Stock Price Development of Major Steel Companies
Recent Headlines: Ansteel (000898): Two-Year Stock Price
RMB • Angang reported financial results for Q2:
Revenues of CNY 14,071 million, Net
Earnings of CNY 915 million; Gross
margins widened from 11.51% to 16.64%
compared to the same period last year,
EBITDA margins now 8.93% from 9.13%
– Yahoo! Finance 5/Sep/2016
• Angang Steel and Angang Energy
conservation entered into the energy
management contracts. Estimated total
construction cost is approximately
RMB213.7 million – Reuters 23/Aug/2016
• The EU on imposed anti-dumping
measures against some China and Russia
steel makers including Angang following
industry complaints from the European
Steel Association
– European Union 4/Aug/2016
• Ansteel has evinced interest in setting up a
steel plant in Andhra Pradesh at a cost of
Rs 3,000 crore
– The Times of India 26/Jun/2016
2
3
4
5
6
7
8
9
Sep-14 Dec-14 Mar-15 Jun-15 Sep-15 Dec-15 Mar-16 Jun-16 Sep-16
Source: Yahoo Finance
47 Applied Value Quarterly Steel Report Q4 2016
Applied Value Quarterly Steel Report – Q4 2016
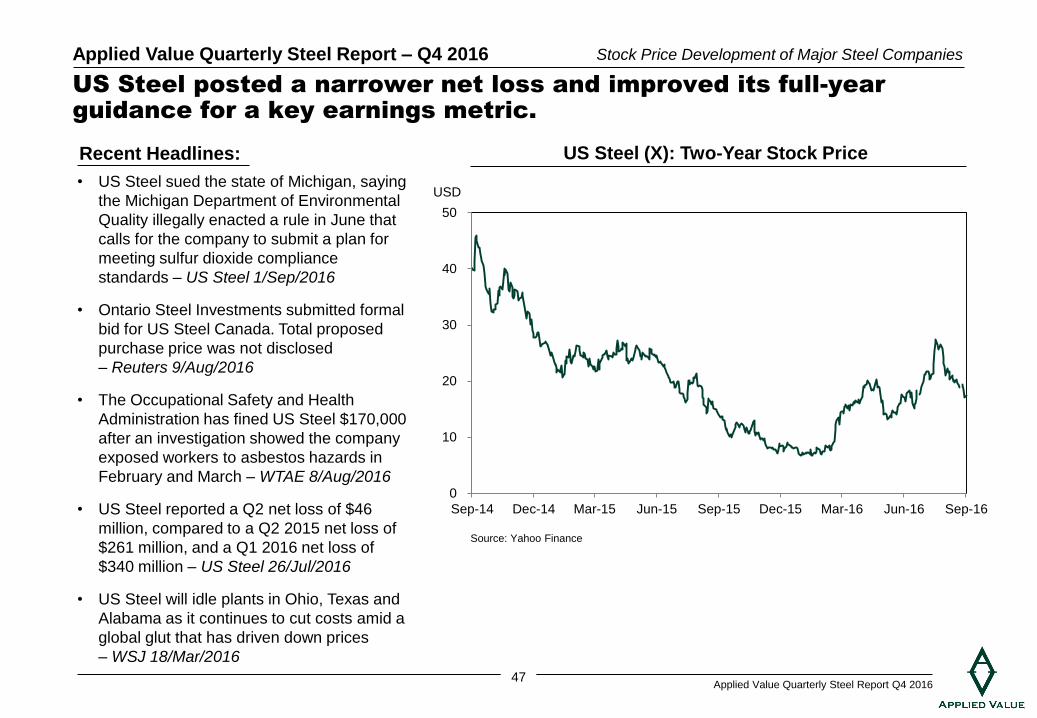
US Steel posted a narrower net loss and improved its full-year
guidance for a key earnings metric.
• US Steel sued the state of Michigan, saying
the Michigan Department of Environmental
Quality illegally enacted a rule in June that
calls for the company to submit a plan for
meeting sulfur dioxide compliance
standards – US Steel 1/Sep/2016
• Ontario Steel Investments submitted formal
bid for US Steel Canada. Total proposed
purchase price was not disclosed
– Reuters 9/Aug/2016
• The Occupational Safety and Health
Administration has fined US Steel $170,000
after an investigation showed the company
exposed workers to asbestos hazards in
February and March – WTAE 8/Aug/2016
• US Steel reported a Q2 net loss of $46
million, compared to a Q2 2015 net loss of
$261 million, and a Q1 2016 net loss of
$340 million – US Steel 26/Jul/2016
• US Steel will idle plants in Ohio, Texas and
Alabama as it continues to cut costs amid a
global glut that has driven down prices
– WSJ 18/Mar/2016
Stock Price Development of Major Steel Companies
Recent Headlines: US Steel (X): Two-Year Stock Price
USD
0
10
20
30
40
50
Sep-14 Dec-14 Mar-15 Jun-15 Sep-15 Dec-15 Mar-16 Jun-16 Sep-16
Source: Yahoo Finance
48 Applied Value Quarterly Steel Report Q4 2016
Applied Value Quarterly Steel Report – Q4 2016
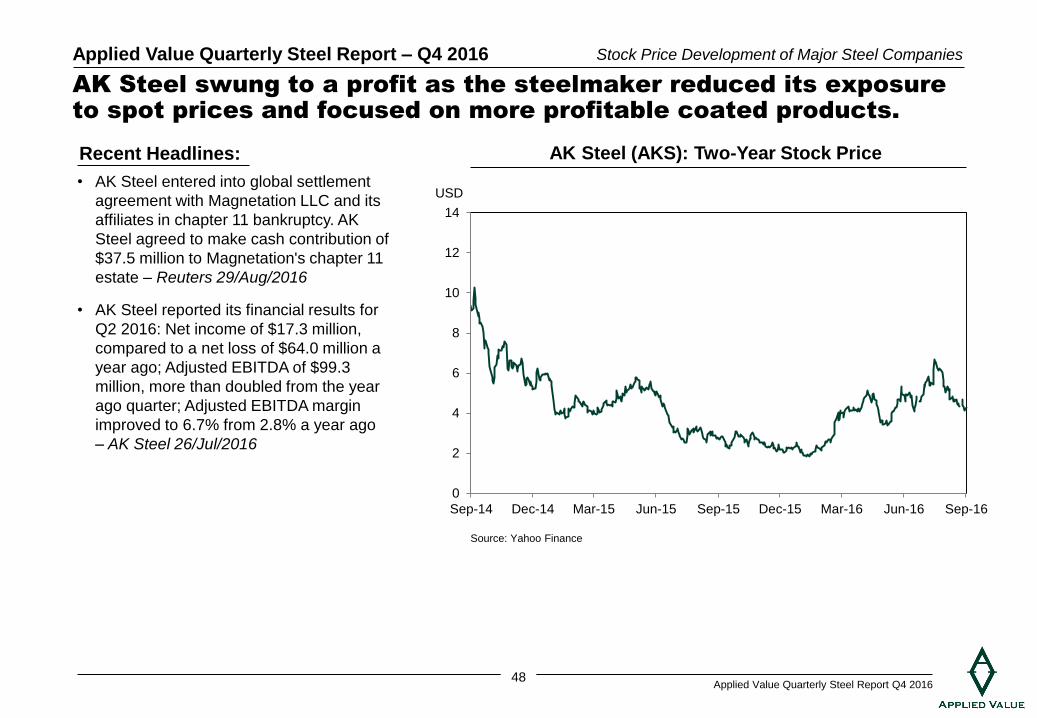
AK Steel swung to a profit as the steelmaker reduced its exposure
to spot prices and focused on more profitable coated products.
• AK Steel entered into global settlement
agreement with Magnetation LLC and its
affiliates in chapter 11 bankruptcy. AK
Steel agreed to make cash contribution of
$37.5 million to Magnetation's chapter 11
estate – Reuters 29/Aug/2016
• AK Steel reported its financial results for
Q2 2016: Net income of $17.3 million,
compared to a net loss of $64.0 million a
year ago; Adjusted EBITDA of $99.3
million, more than doubled from the year
ago quarter; Adjusted EBITDA margin
improved to 6.7% from 2.8% a year ago
– AK Steel 26/Jul/2016
Stock Price Development of Major Steel Companies
Recent Headlines: AK Steel (AKS): Two-Year Stock Price
USD
0
2
4
6
8
10
12
14
Sep-14 Dec-14 Mar-15 Jun-15 Sep-15 Dec-15 Mar-16 Jun-16 Sep-16
Source: Yahoo Finance
49 Applied Value Quarterly Steel Report Q4 2016
Applied Value Quarterly Steel Report – Q4 2016
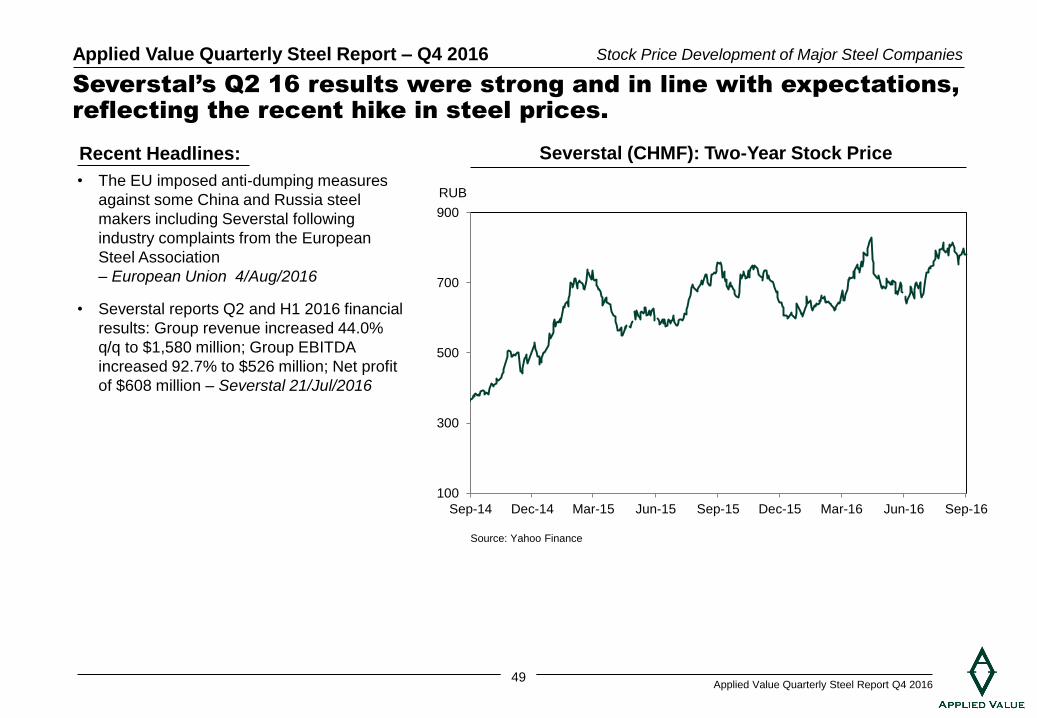
• The EU imposed anti-dumping measures
against some China and Russia steel
makers including Severstal following
industry complaints from the European
Steel Association
– European Union 4/Aug/2016
• Severstal reports Q2 and H1 2016 financial
results: Group revenue increased 44.0%
q/q to $1,580 million; Group EBITDA
increased 92.7% to $526 million; Net profit
of $608 million – Severstal 21/Jul/2016
Stock Price Development of Major Steel Companies
Recent Headlines: Severstal (CHMF): Two-Year Stock Price
RUB
Severstal’s Q2 16 results were strong and in line with expectations,
reflecting the recent hike in steel prices.
100
300
500
700
900
Sep-14 Dec-14 Mar-15 Jun-15 Sep-15 Dec-15 Mar-16 Jun-16 Sep-16
Source: Yahoo Finance
50 Applied Value Quarterly Steel Report Q4 2016
Applied Value Quarterly Steel Report – Q4 2016
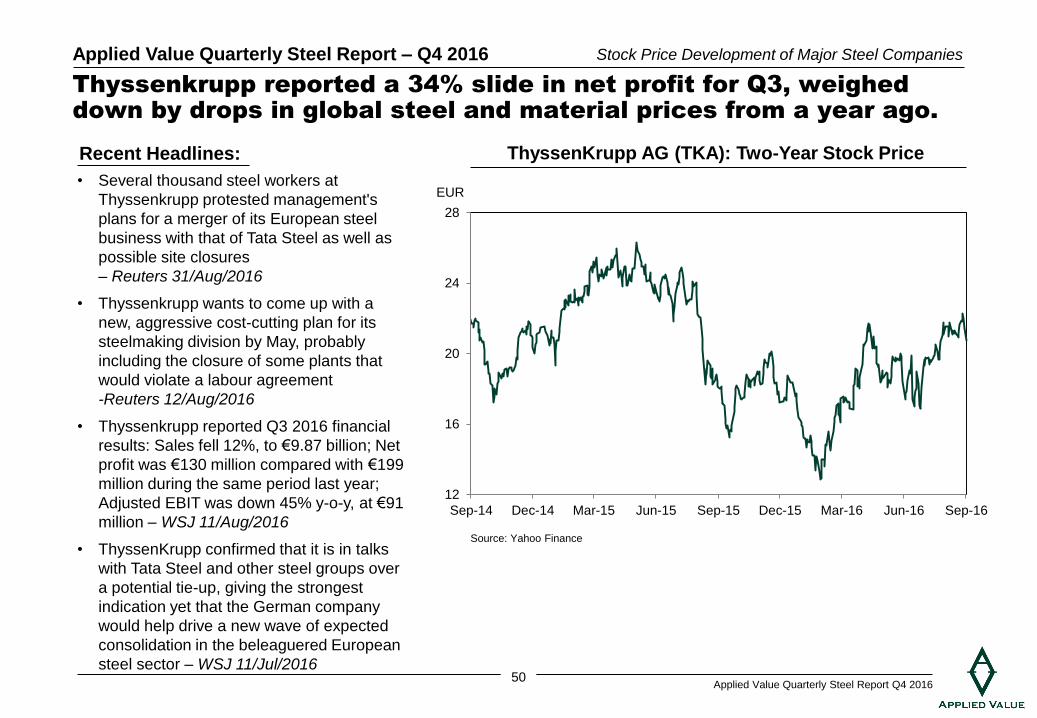
Thyssenkrupp reported a 34% slide in net profit for Q3, weighed
down by drops in global steel and material prices from a year ago.
• Several thousand steel workers at
Thyssenkrupp protested management's
plans for a merger of its European steel
business with that of Tata Steel as well as
possible site closures
– Reuters 31/Aug/2016
• Thyssenkrupp wants to come up with a
new, aggressive cost-cutting plan for its
steelmaking division by May, probably
including the closure of some plants that
would violate a labour agreement
-Reuters 12/Aug/2016
• Thyssenkrupp reported Q3 2016 financial
results: Sales fell 12%, to €9.87 billion; Net
profit was €130 million compared with €199
million during the same period last year;
Adjusted EBIT was down 45% y-o-y, at €91
million – WSJ 11/Aug/2016
• ThyssenKrupp confirmed that it is in talks
with Tata Steel and other steel groups over
a potential tie-up, giving the strongest
indication yet that the German company
would help drive a new wave of expected
consolidation in the beleaguered European
steel sector – WSJ 11/Jul/2016
Stock Price Development of Major Steel Companies
Recent Headlines: ThyssenKrupp AG (TKA): Two-Year Stock Price
EUR
12
16
20
24
28
Sep-14 Dec-14 Mar-15 Jun-15 Sep-15 Dec-15 Mar-16 Jun-16 Sep-16
Source: Yahoo Finance
51 Applied Value Quarterly Steel Report Q4 2016
Applied Value Quarterly Steel Report – Q4 2016
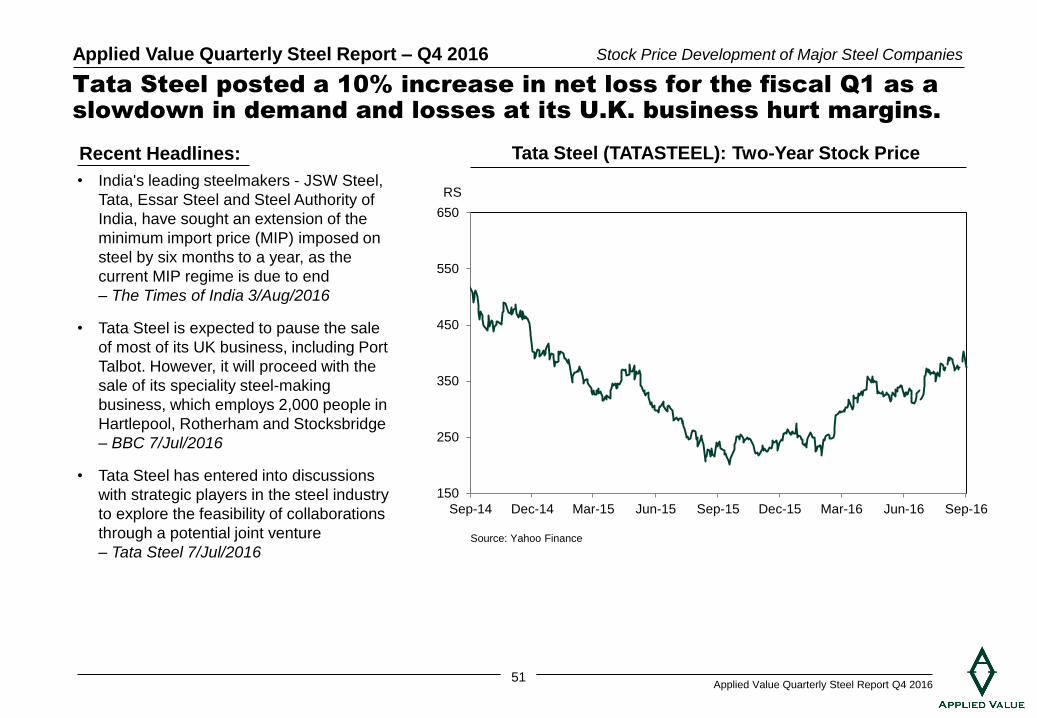
Tata Steel posted a 10% increase in net loss for the fiscal Q1 as a
slowdown in demand and losses at its U.K. business hurt margins.
• India's leading steelmakers - JSW Steel,
Tata, Essar Steel and Steel Authority of
India, have sought an extension of the
minimum import price (MIP) imposed on
steel by six months to a year, as the
current MIP regime is due to end
– The Times of India 3/Aug/2016
• Tata Steel is expected to pause the sale
of most of its UK business, including Port
Talbot. However, it will proceed with the
sale of its speciality steel-making
business, which employs 2,000 people in
Hartlepool, Rotherham and Stocksbridge
– BBC 7/Jul/2016
• Tata Steel has entered into discussions
with strategic players in the steel industry
to explore the feasibility of collaborations
through a potential joint venture
– Tata Steel 7/Jul/2016
Stock Price Development of Major Steel Companies
Recent Headlines: Tata Steel (TATASTEEL): Two-Year Stock Price
RS
150
250
350
450
550
650
Sep-14 Dec-14 Mar-15 Jun-15 Sep-15 Dec-15 Mar-16 Jun-16 Sep-16
Source: Yahoo Finance
52 Applied Value Quarterly Steel Report Q4 2016
Applied Value Quarterly Steel Report – Q4 2016
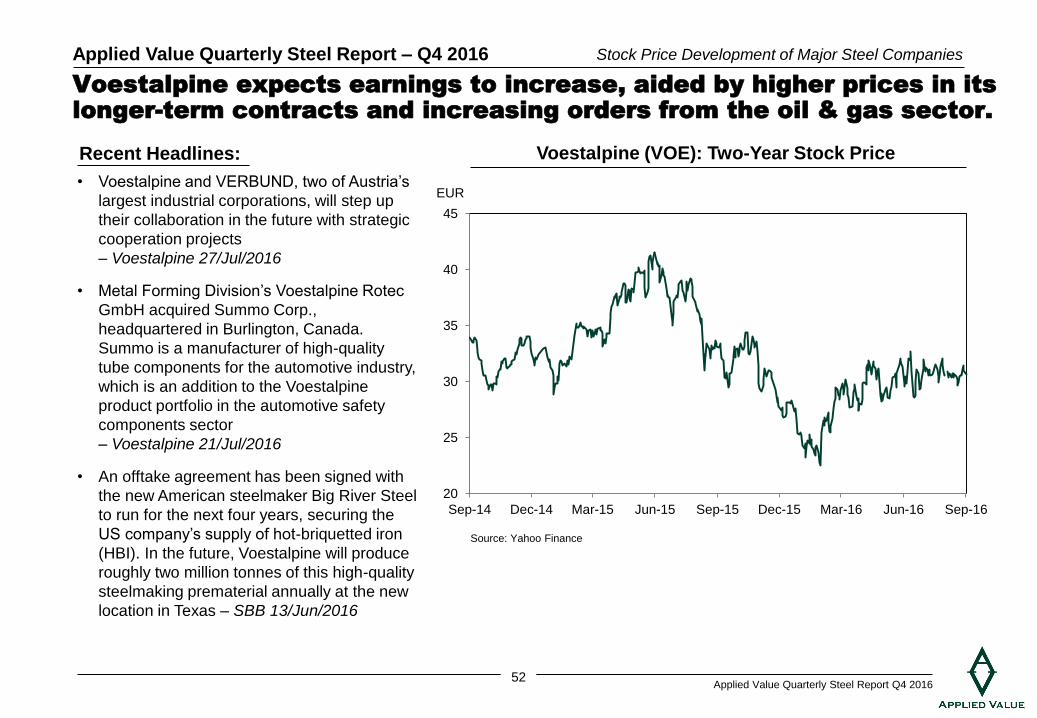
Voestalpine expects earnings to increase, aided by higher prices in its
longer-term contracts and increasing orders from the oil & gas sector.
Stock Price Development of Major Steel Companies
Recent Headlines: Voestalpine (VOE): Two-Year Stock Price
EUR • Voestalpine and VERBUND, two of Austria’s
largest industrial corporations, will step up
their collaboration in the future with strategic
cooperation projects
– Voestalpine 27/Jul/2016
• Metal Forming Division’s Voestalpine Rotec
GmbH acquired Summo Corp.,
headquartered in Burlington, Canada.
Summo is a manufacturer of high-quality
tube components for the automotive industry,
which is an addition to the Voestalpine
product portfolio in the automotive safety
components sector
– Voestalpine 21/Jul/2016
• An offtake agreement has been signed with
the new American steelmaker Big River Steel
to run for the next four years, securing the
US company’s supply of hot-briquetted iron
(HBI). In the future, Voestalpine will produce
roughly two million tonnes of this high-quality
steelmaking prematerial annually at the new
location in Texas – SBB 13/Jun/2016
20
25
30
35
40
45
Sep-14 Dec-14 Mar-15 Jun-15 Sep-15 Dec-15 Mar-16 Jun-16 Sep-16
Source: Yahoo Finance
53 Applied Value Quarterly Steel Report Q4 2016
Applied Value Quarterly Steel Report – Q4 2016
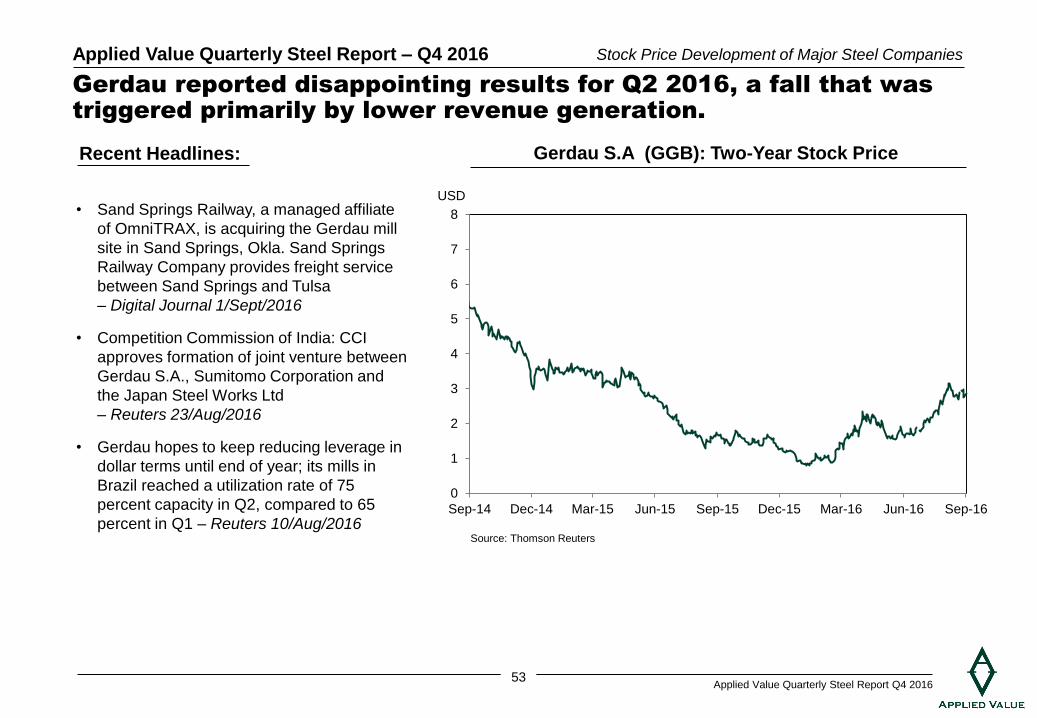
Gerdau reported disappointing results for Q2 2016, a fall that was
triggered primarily by lower revenue generation.
Stock Price Development of Major Steel Companies
Recent Headlines: Gerdau S.A (GGB): Two-Year Stock Price
USD • Sand Springs Railway, a managed affiliate
of OmniTRAX, is acquiring the Gerdau mill
site in Sand Springs, Okla. Sand Springs
Railway Company provides freight service
between Sand Springs and Tulsa
– Digital Journal 1/Sept/2016
• Competition Commission of India: CCI
approves formation of joint venture between
Gerdau S.A., Sumitomo Corporation and
the Japan Steel Works Ltd
– Reuters 23/Aug/2016
• Gerdau hopes to keep reducing leverage in
dollar terms until end of year; its mills in
Brazil reached a utilization rate of 75
percent capacity in Q2, compared to 65
percent in Q1 – Reuters 10/Aug/2016 Source: Thomson Reuters
0
1
2
3
4
5
6
7
8
Sep-14 Dec-14 Mar-15 Jun-15 Sep-15 Dec-15 Mar-16 Jun-16 Sep-16
54 Applied Value Quarterly Steel Report Q4 2016
Applied Value Quarterly Steel Report – Q4 2016
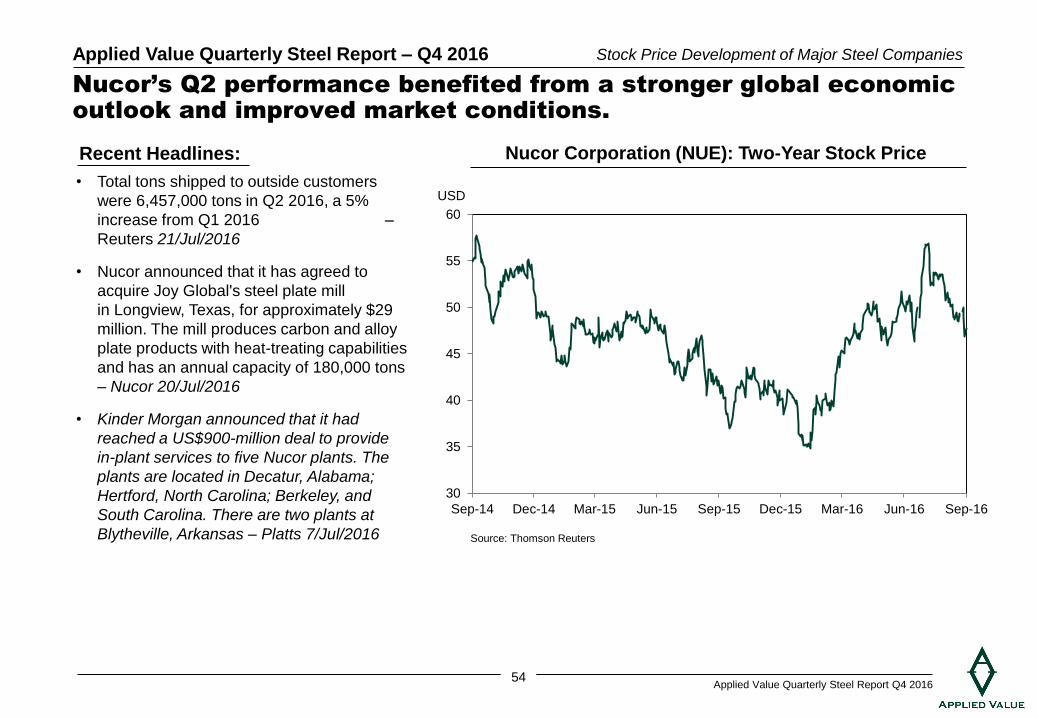
Nucor’s Q2 performance benefited from a stronger global economic
outlook and improved market conditions.
Stock Price Development of Major Steel Companies
Recent Headlines: Nucor Corporation (NUE): Two-Year Stock Price
USD • Total tons shipped to outside customers
were 6,457,000 tons in Q2 2016, a 5%
increase from Q1 2016 –
Reuters 21/Jul/2016
• Nucor announced that it has agreed to
acquire Joy Global's steel plate mill
in Longview, Texas, for approximately $29
million. The mill produces carbon and alloy
plate products with heat-treating capabilities
and has an annual capacity of 180,000 tons
– Nucor 20/Jul/2016
• Kinder Morgan announced that it had
reached a US$900-million deal to provide
in-plant services to five Nucor plants. The
plants are located in Decatur, Alabama;
Hertford, North Carolina; Berkeley, and
South Carolina. There are two plants at
Blytheville, Arkansas – Platts 7/Jul/2016 Source: Thomson Reuters
30
35
40
45
50
55
60
Sep-14 Dec-14 Mar-15 Jun-15 Sep-15 Dec-15 Mar-16 Jun-16 Sep-16
55 Applied Value Quarterly Steel Report Q4 2016
Applied Value Quarterly Steel Report – Q4 2016
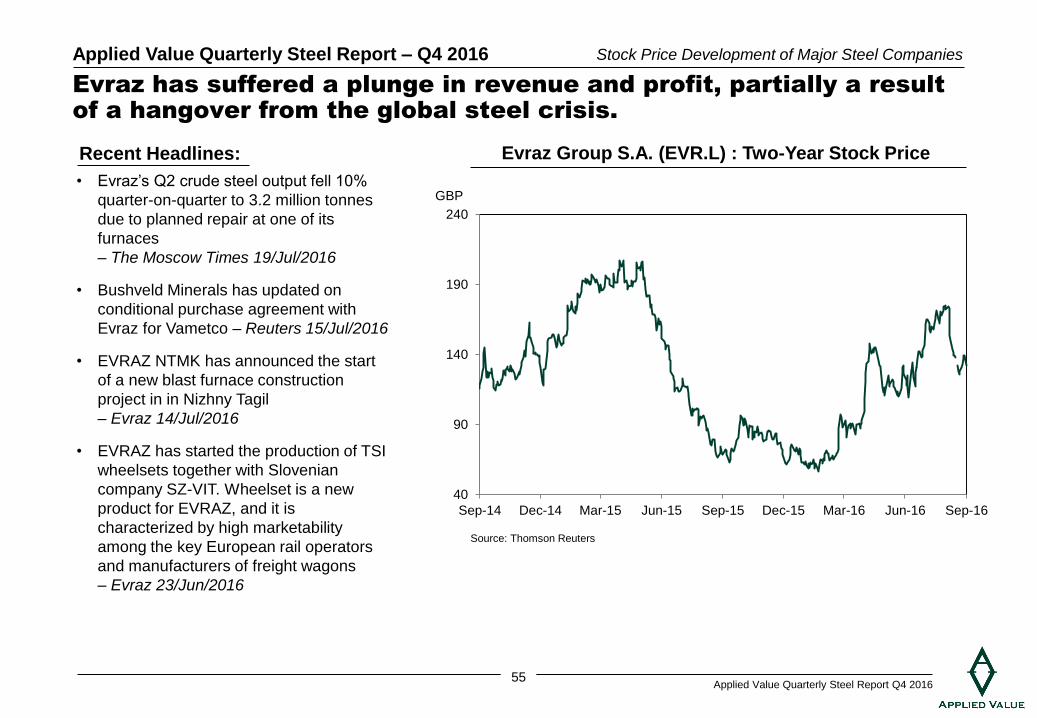
Evraz has suffered a plunge in revenue and profit, partially a result
of a hangover from the global steel crisis.
Stock Price Development of Major Steel Companies
Recent Headlines: Evraz Group S.A. (EVR.L) : Two-Year Stock Price
GBP • Evraz’s Q2 crude steel output fell 10%
quarter-on-quarter to 3.2 million tonnes
due to planned repair at one of its
furnaces
– The Moscow Times 19/Jul/2016
• Bushveld Minerals has updated on
conditional purchase agreement with
Evraz for Vametco – Reuters 15/Jul/2016
• EVRAZ NTMK has announced the start
of a new blast furnace construction
project in in Nizhny Tagil
– Evraz 14/Jul/2016
• EVRAZ has started the production of TSI
wheelsets together with Slovenian
company SZ-VIT. Wheelset is a new
product for EVRAZ, and it is
characterized by high marketability
among the key European rail operators
and manufacturers of freight wagons
– Evraz 23/Jun/2016
Source: Thomson Reuters
40
90
140
190
240
Sep-14 Dec-14 Mar-15 Jun-15 Sep-15 Dec-15 Mar-16 Jun-16 Sep-16
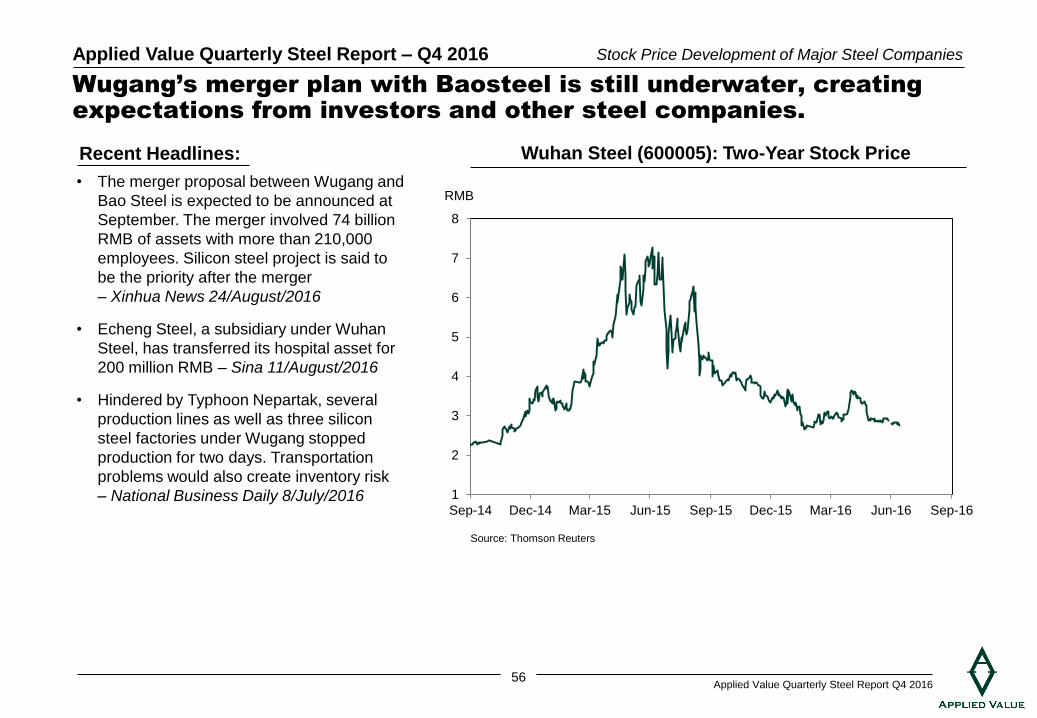
56 Applied Value Quarterly Steel Report Q4 2016
Applied Value Quarterly Steel Report – Q4 2016
Wugang’s merger plan with Baosteel is still underwater, creating
expectations from investors and other steel companies.
Stock Price Development of Major Steel Companies
Recent Headlines: Wuhan Steel (600005): Two-Year Stock Price
RMB • The merger proposal between Wugang and
Bao Steel is expected to be announced at
September. The merger involved 74 billion
RMB of assets with more than 210,000
employees. Silicon steel project is said to
be the priority after the merger
– Xinhua News 24/August/2016
• Echeng Steel, a subsidiary under Wuhan
Steel, has transferred its hospital asset for
200 million RMB – Sina 11/August/2016
• Hindered by Typhoon Nepartak, several
production lines as well as three silicon
steel factories under Wugang stopped
production for two days. Transportation
problems would also create inventory risk
– National Business Daily 8/July/2016
Source: Thomson Reuters
1
2
3
4
5
6
7
8
Sep-14 Dec-14 Mar-15 Jun-15 Sep-15 Dec-15 Mar-16 Jun-16 Sep-16