applied marketing analytics - paramore university 4.16.13
TRANSCRIPT
Applied Marketing Analytics Paramore University 2013
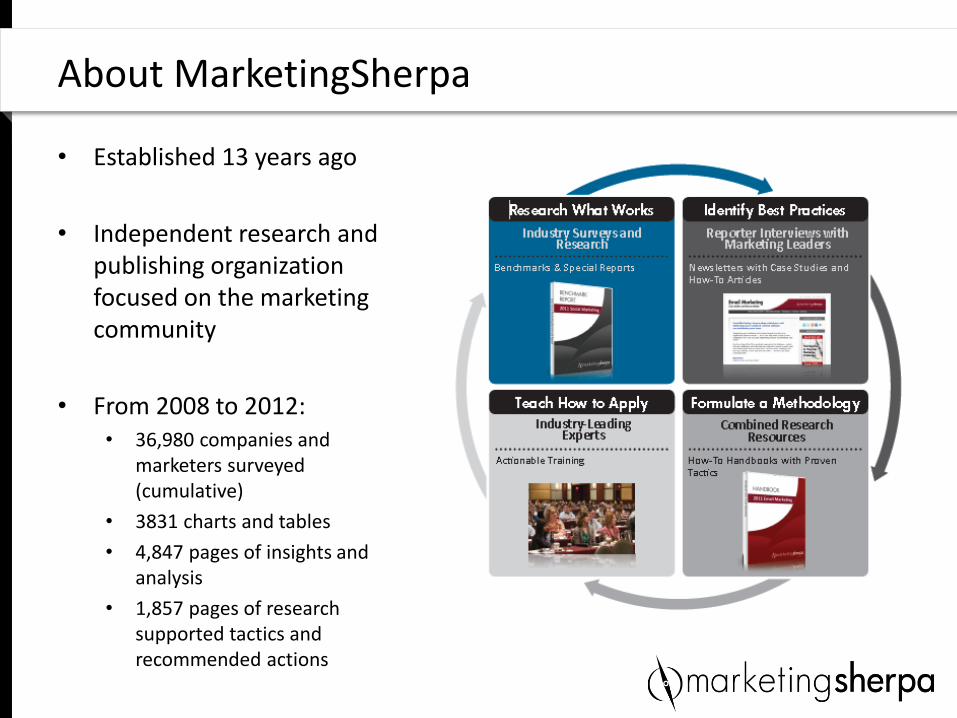
• Established 13 years ago
• Independent research and publishing organization focused on the marketing community
• From 2008 to 2012: • 36,980 companies and
marketers surveyed (cumulative)
• 3831 charts and tables
• 4,847 pages of insights and analysis
• 1,857 pages of research supported tactics and recommended actions
About MarketingSherpa
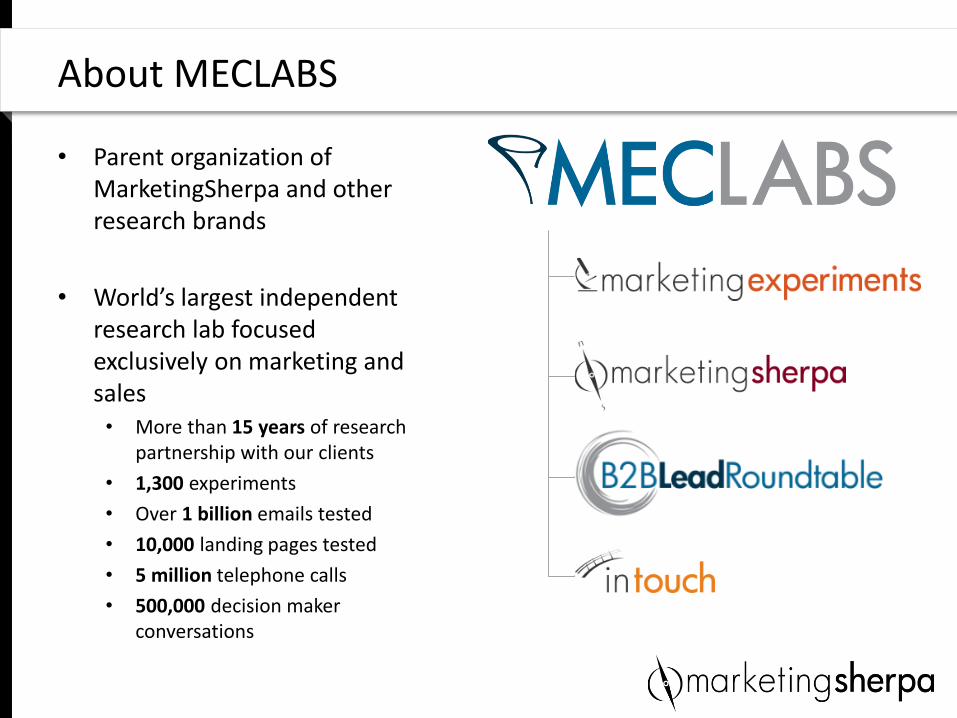
• Parent organization of MarketingSherpa and other research brands
• World’s largest independent research lab focused exclusively on marketing and sales • More than 15 years of research
partnership with our clients
• 1,300 experiments
• Over 1 billion emails tested
• 10,000 landing pages tested
• 5 million telephone calls
• 500,000 decision maker conversations
About MECLABS
#ParamoreU
Questions?

Messaging
Let’s talk about…
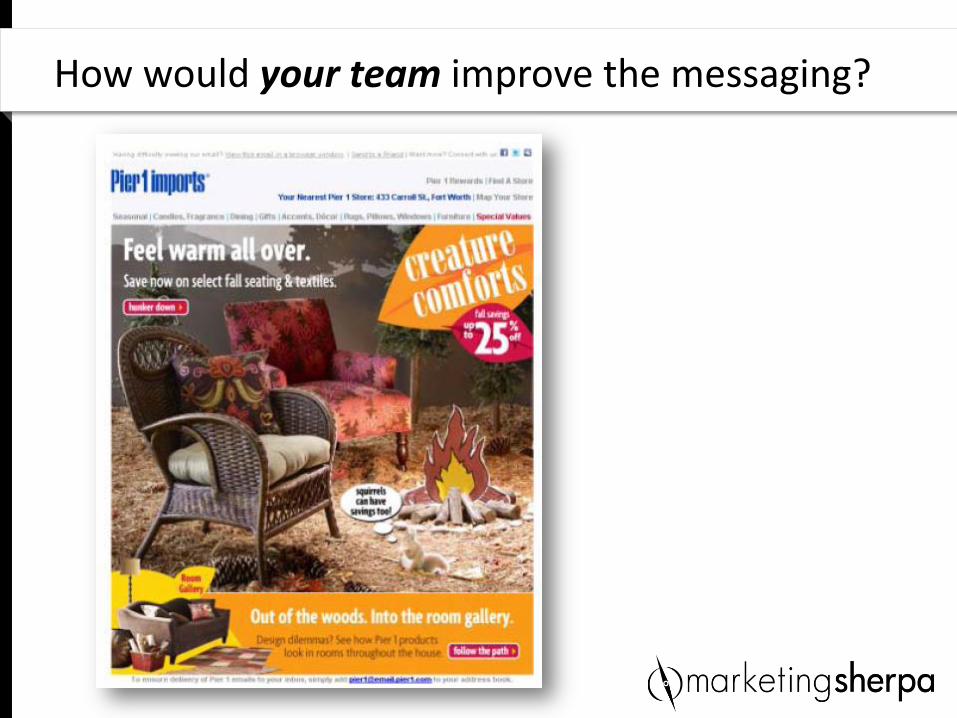
How would your team improve the messaging?
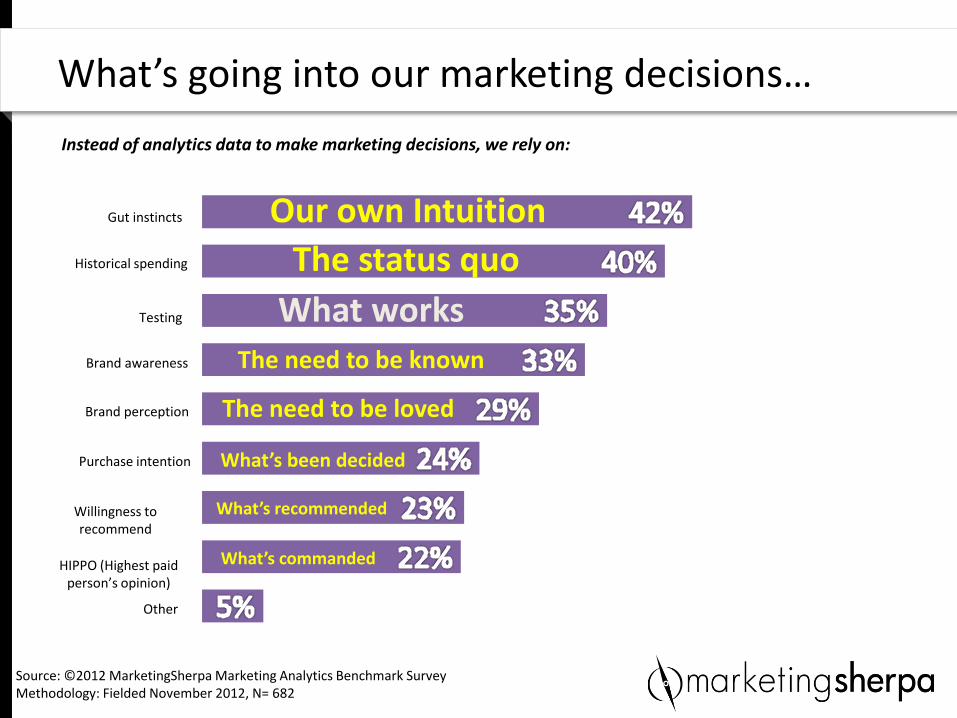
What’s going into our marketing decisions…
Gut instincts
Historical spending
Testing
Brand awareness
Brand perception
Purchase intention
Willingness to recommend
HIPPO (Highest paid person’s opinion)
Other
Instead of analytics data to make marketing decisions, we rely on:
Source: ©2012 MarketingSherpa Marketing Analytics Benchmark Survey Methodology: Fielded November 2012, N= 682
Our own Intuition
The status quo
The need to be known
The need to be loved
What works
What’s been decided
What’s recommended
What’s commanded
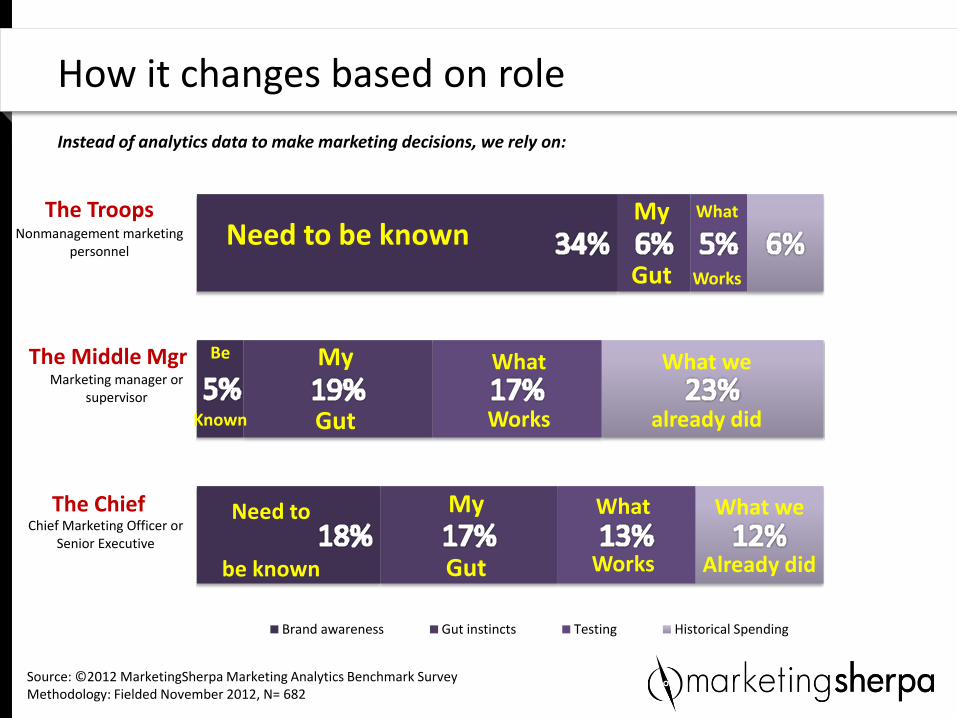
How it changes based on role
Chief Marketing Officer orSenior Executive
Marketing manager orsupervisor
Nonmanagement marketingpersonnel
Brand awareness Gut instincts Testing Historical Spending
Source: ©2012 MarketingSherpa Marketing Analytics Benchmark Survey Methodology: Fielded November 2012, N= 682
Instead of analytics data to make marketing decisions, we rely on:
Need to be known My
Gut
What
Works
My
Gut
What
Works
What we
already did
Be
Known
Need to
be known
My
Gut
What
Works
What we
Already did
The Troops
The Middle Mgr
The Chief
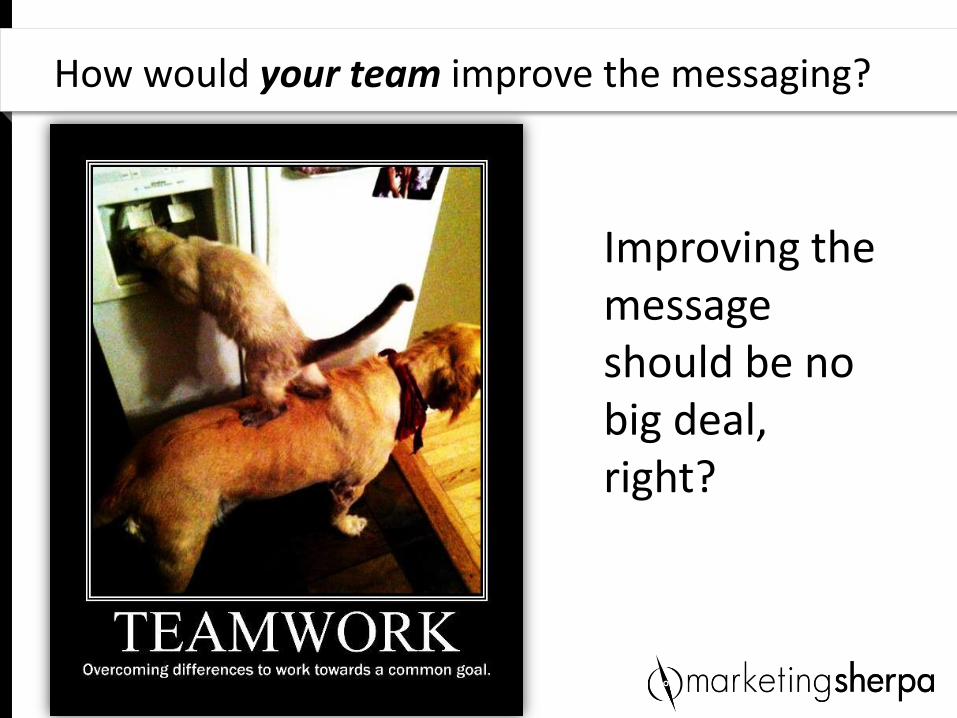
How would your team improve the messaging?
Improving the message should be no big deal, right?
Research Notes:
• Background: B2C home products company with a significant online and retail presence
• Goal: To increase the click-through rate from the email to the landing page
• Primary research question: Which email design will generate the most click-throughs?
• Approach: A/B/C/D split test (variable cluster)
Case Study: Background
Case Study ID: Pier 1 Imports Protocol Number: A-TP1002
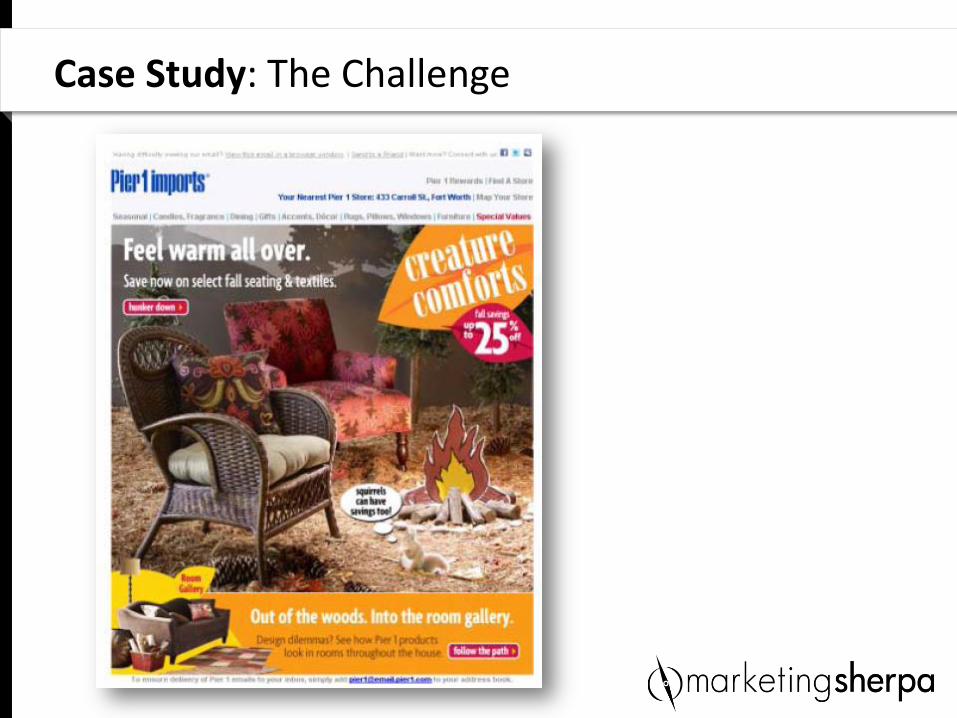
Case Study: The Challenge
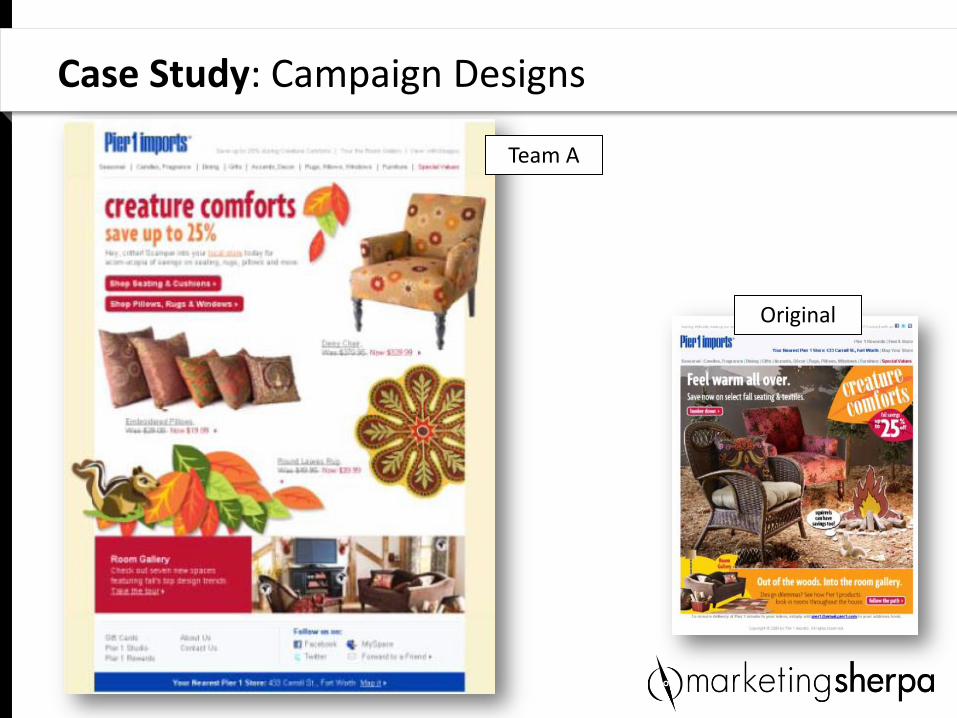
Case Study: Campaign Designs
Team A
Original
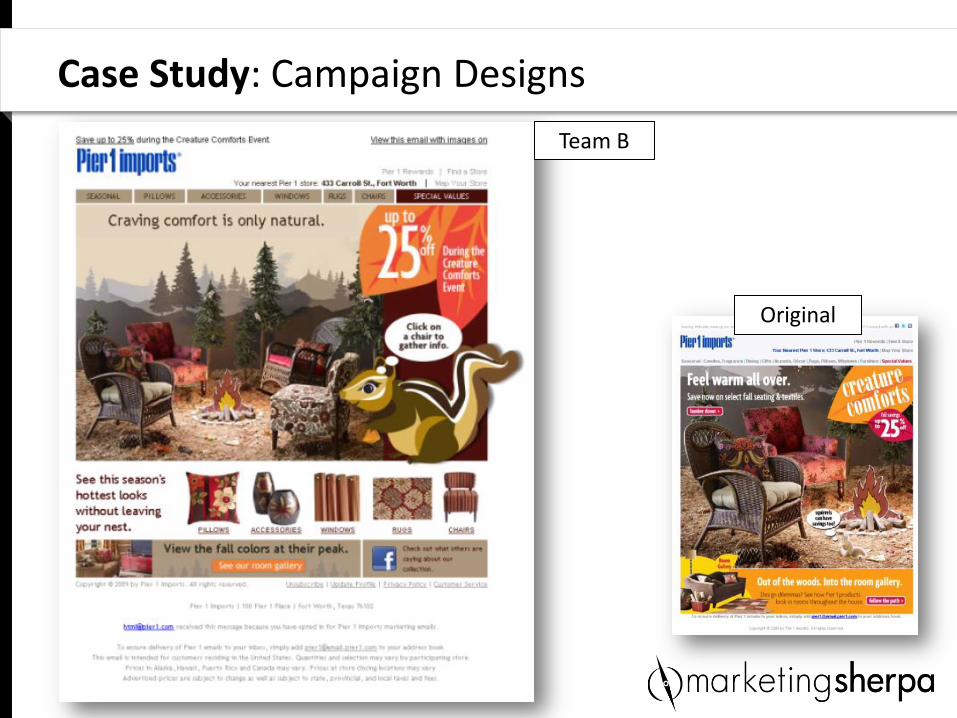
Case Study: Campaign Designs
Team B
Original
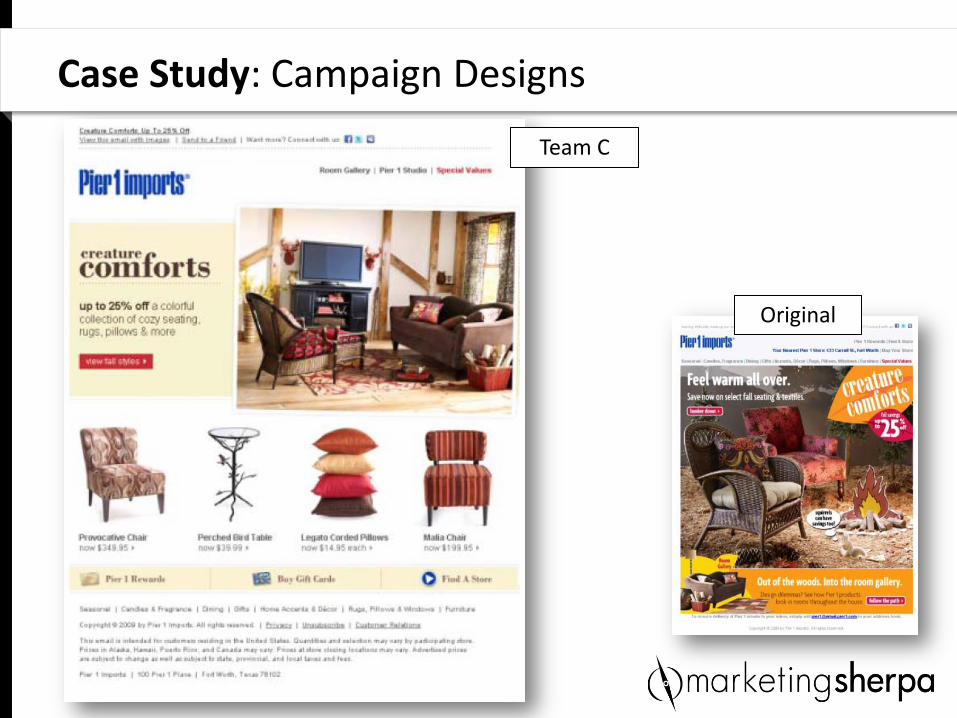
Case Study: Campaign Designs
Team C
Original
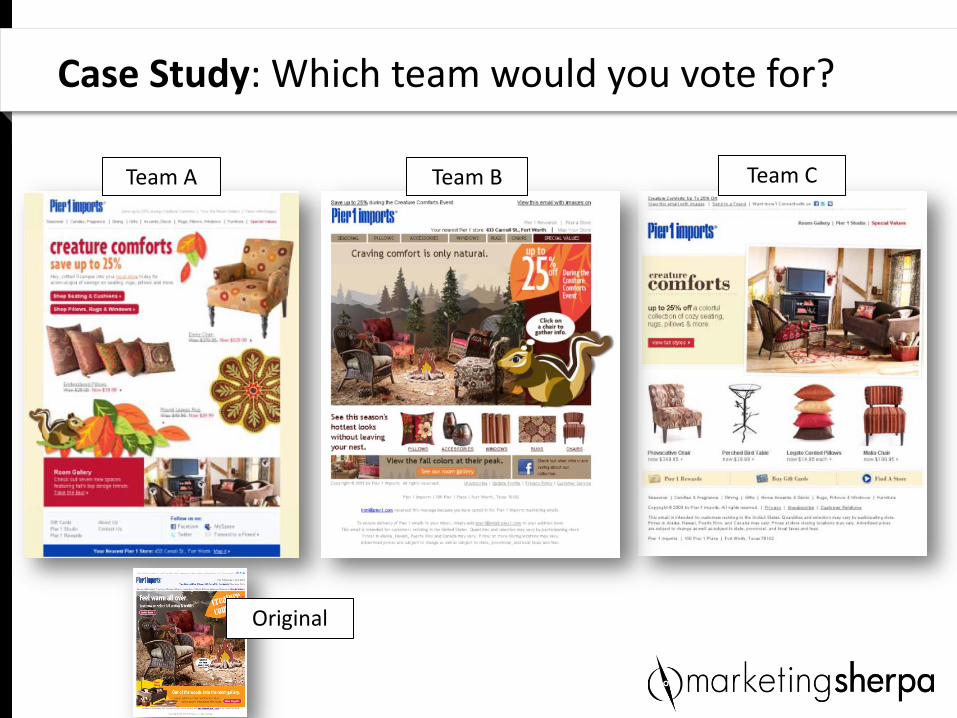
Case Study: Which team would you vote for?
Team A Team B Team C
Original
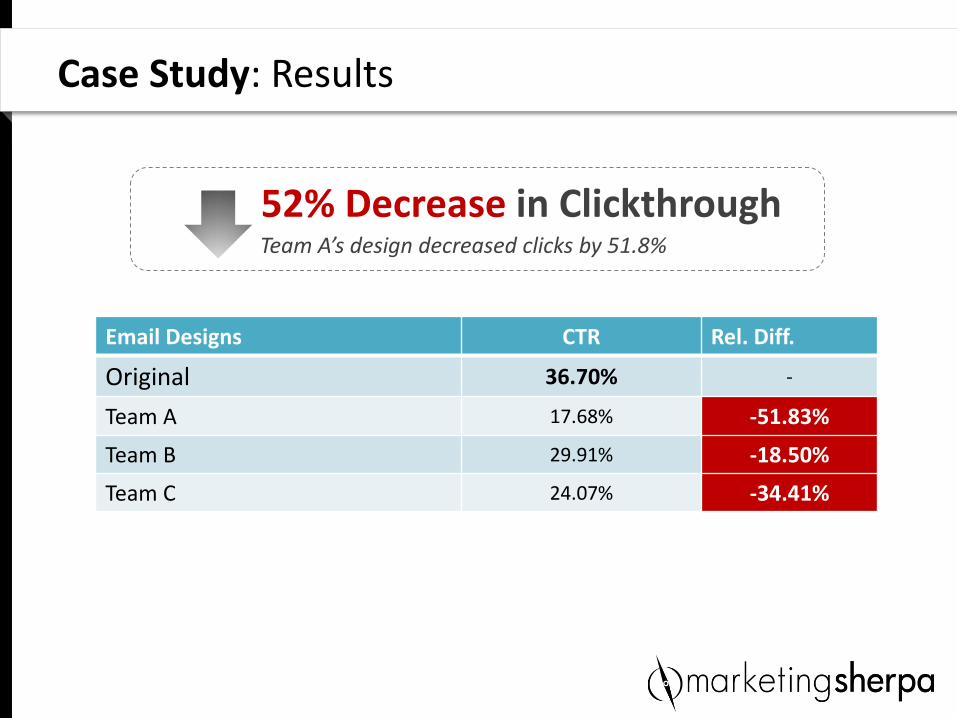
Case Study: Results
52% Decrease in Clickthrough Team A’s design decreased clicks by 51.8%
Email Designs CTR Rel. Diff.
Original 36.70% -
Team A 17.68% -51.83%
Team B 29.91% -18.50%
Team C 24.07% -34.41%
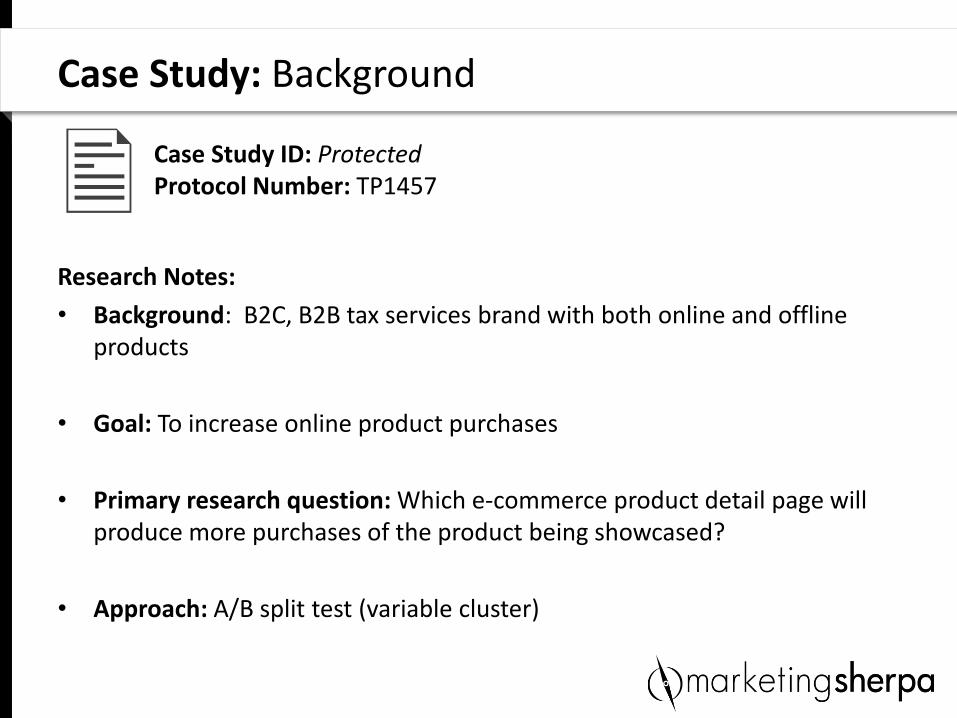
Research Notes:
• Background: B2C, B2B tax services brand with both online and offline products
• Goal: To increase online product purchases
• Primary research question: Which e-commerce product detail page will produce more purchases of the product being showcased?
• Approach: A/B split test (variable cluster)
Case Study: Background
Case Study ID: Protected Protocol Number: TP1457
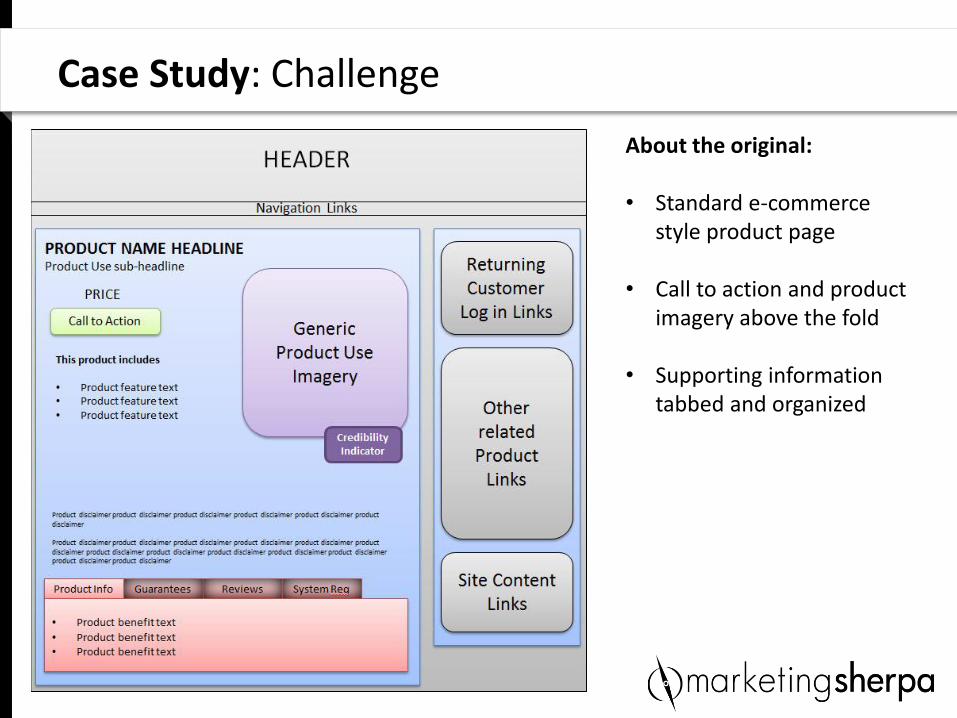
Case Study: Challenge
About the original: • Standard e-commerce
style product page
• Call to action and product imagery above the fold
• Supporting information tabbed and organized
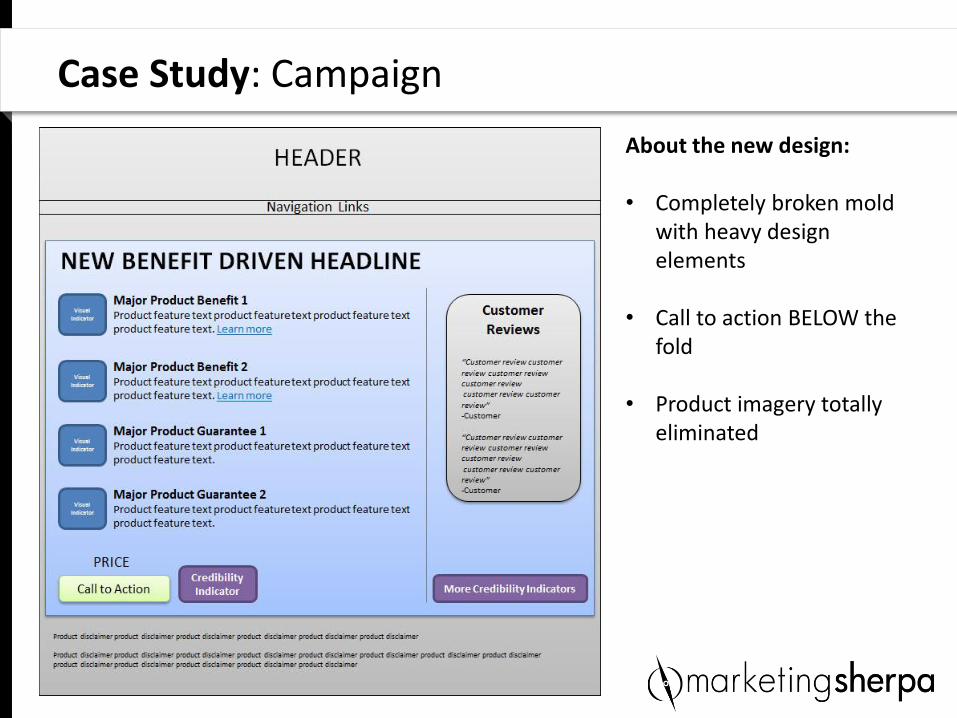
Case Study: Campaign
About the new design: • Completely broken mold
with heavy design elements
• Call to action BELOW the fold
• Product imagery totally eliminated
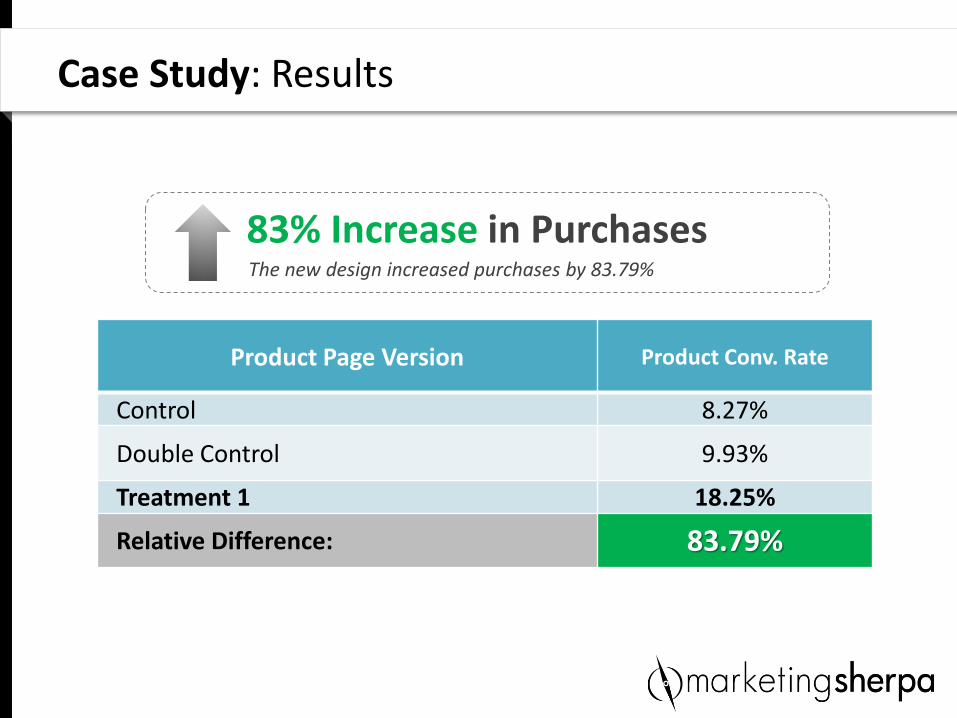
Case Study: Results
83% Increase in Purchases The new design increased purchases by 83.79%
Product Page Version Product Conv. Rate
Control 8.27%
Double Control 9.93%
Treatment 1 18.25%
Relative Difference: 83.79%
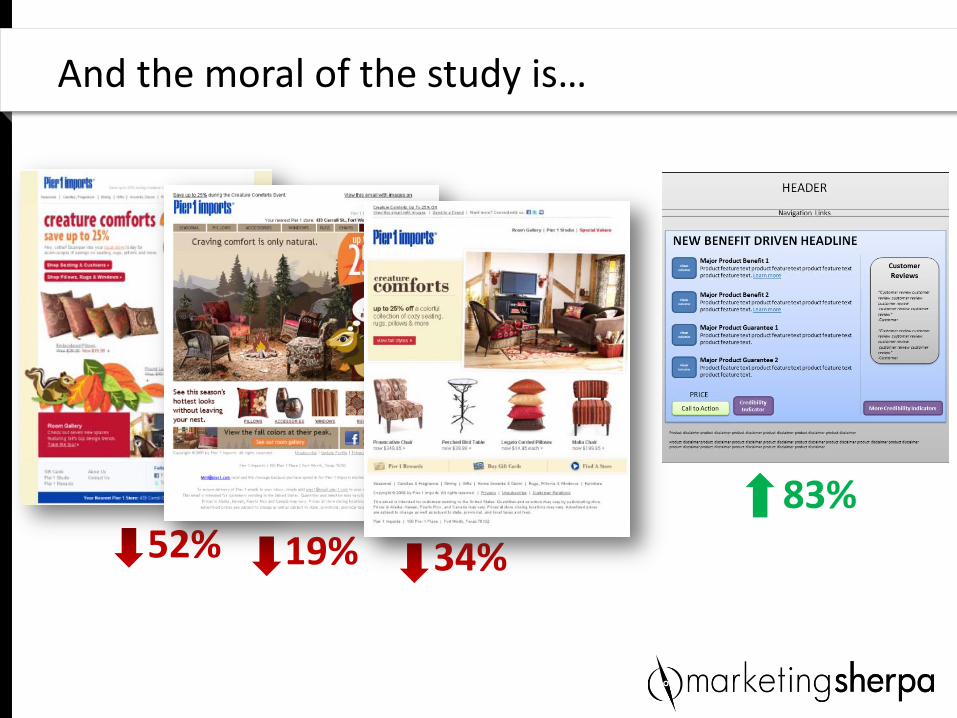
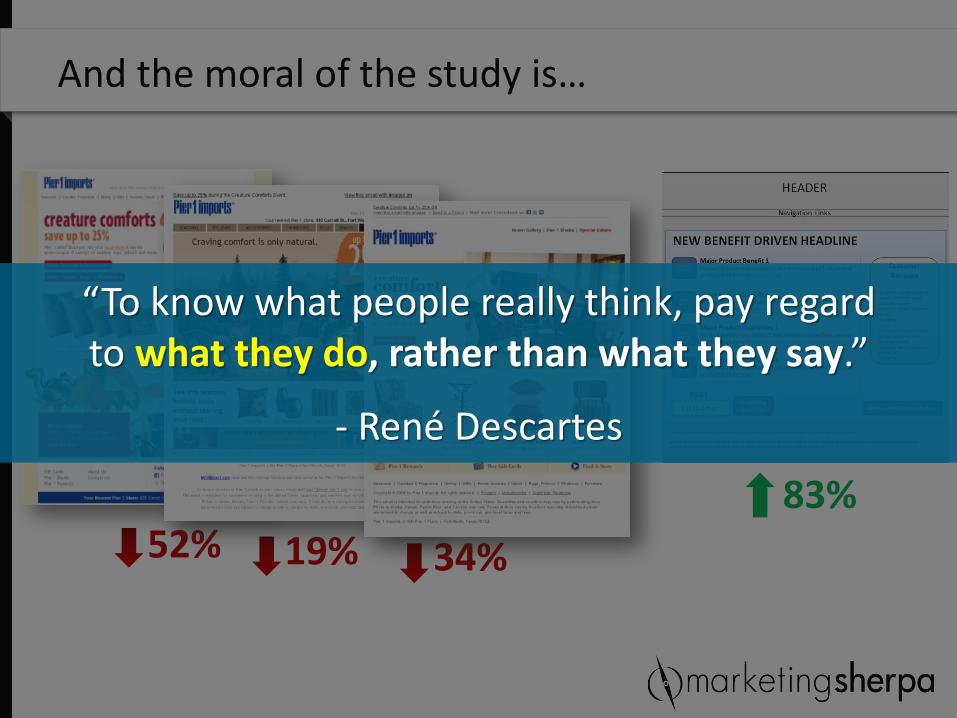
And the moral of the study is…
52% 19% 34%
83%
And the moral of the study is…
52% 19% 34%
83%
“To know what people really think, pay regard to what they do, rather than what they say.”
- René Descartes
• There are no expert marketers, there are just experienced marketers and expert testers
Key Point
• There are no expert marketers, there are just experienced marketers and expert testers
• There is a critical element in the testing and optimization process that you can access now and use without 10 hours of teaching and 10 weeks of systems changes
Key Point
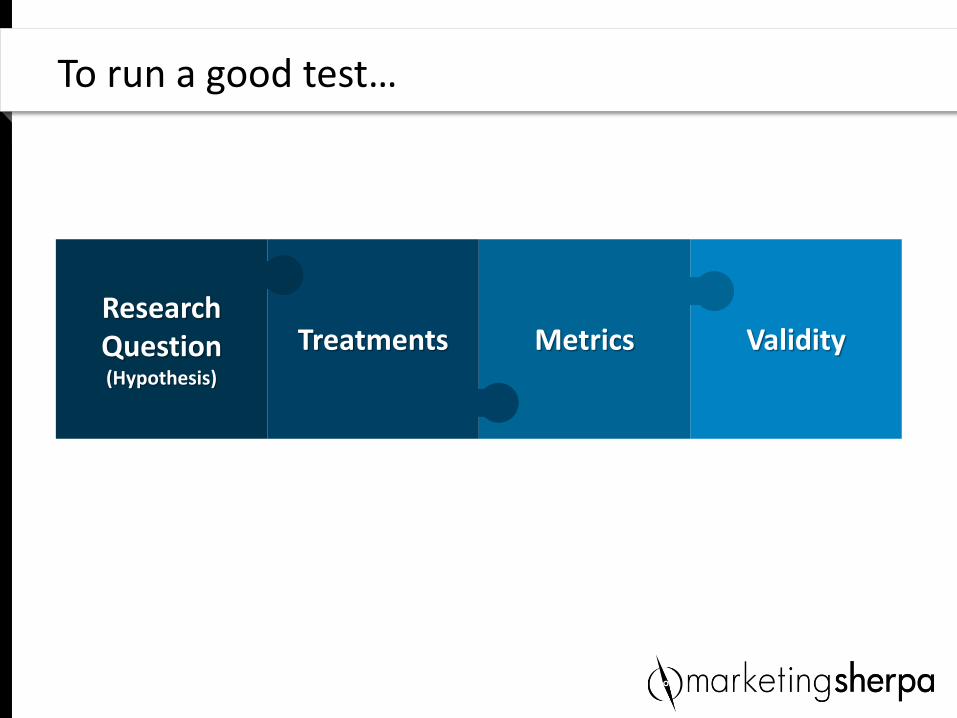
To run a good test…
Validity Metrics Treatments Research Question (Hypothesis)
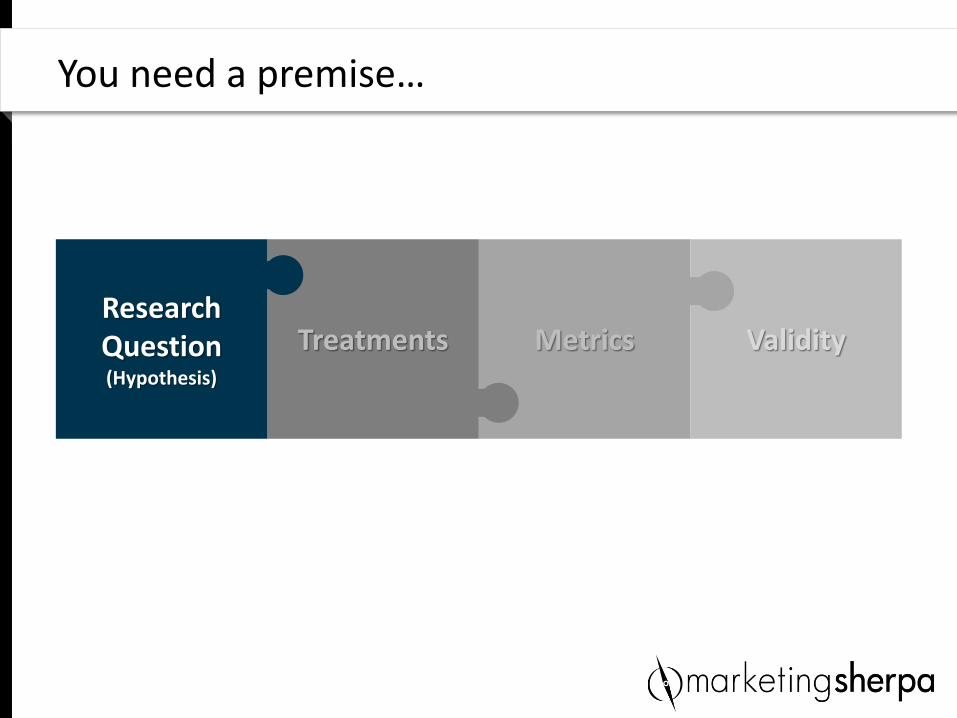
You need a premise…
Validity Metrics Treatments Research Question (Hypothesis)
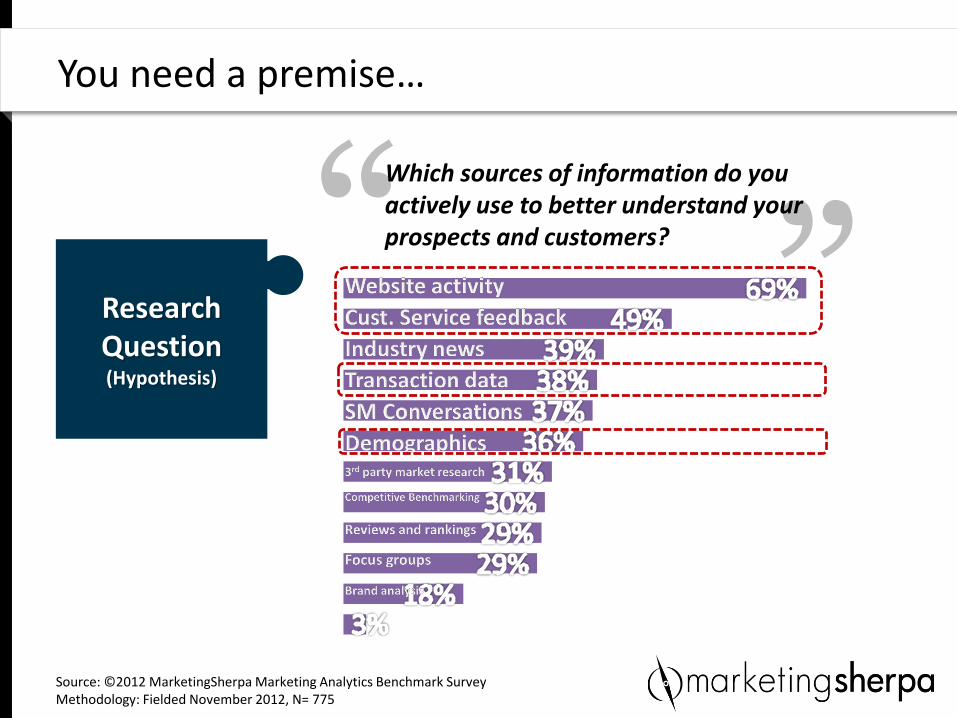
” “ You need a premise…
Research Question (Hypothesis)
Source: ©2012 MarketingSherpa Marketing Analytics Benchmark Survey Methodology: Fielded November 2012, N= 775
Which sources of information do you actively use to better understand your prospects and customers?
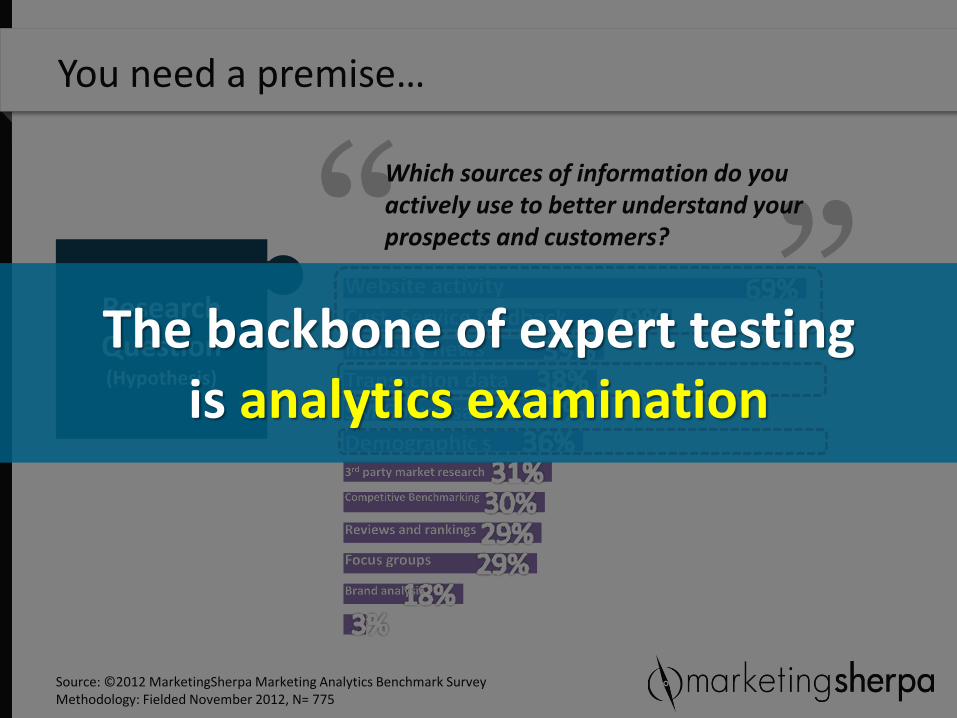
” “ You need a premise…
Research Question (Hypothesis)
Source: ©2012 MarketingSherpa Marketing Analytics Benchmark Survey Methodology: Fielded November 2012, N= 775
Which sources of information do you actively use to better understand your prospects and customers?
The backbone of expert testing is analytics examination
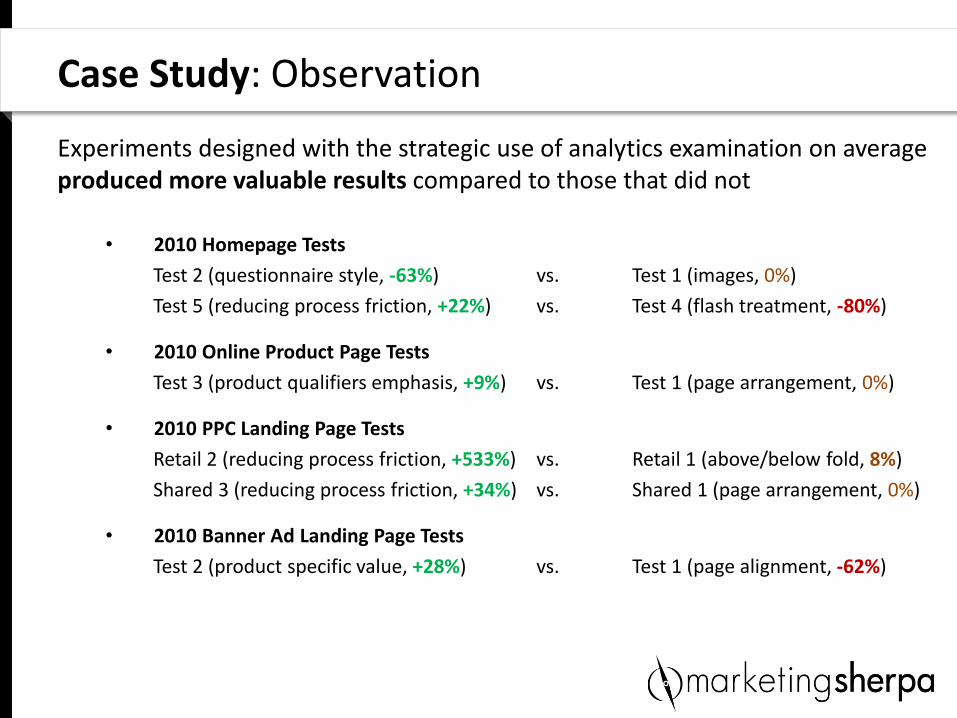
Experiments designed with the strategic use of analytics examination on average produced more valuable results compared to those that did not
• 2010 Homepage Tests
Test 2 (questionnaire style, -63%) vs. Test 1 (images, 0%)
Test 5 (reducing process friction, +22%) vs. Test 4 (flash treatment, -80%)
• 2010 Online Product Page Tests
Test 3 (product qualifiers emphasis, +9%) vs. Test 1 (page arrangement, 0%)
• 2010 PPC Landing Page Tests
Retail 2 (reducing process friction, +533%) vs. Retail 1 (above/below fold, 8%)
Shared 3 (reducing process friction, +34%) vs. Shared 1 (page arrangement, 0%)
• 2010 Banner Ad Landing Page Tests
Test 2 (product specific value, +28%) vs. Test 1 (page alignment, -62%)
Case Study: Observation

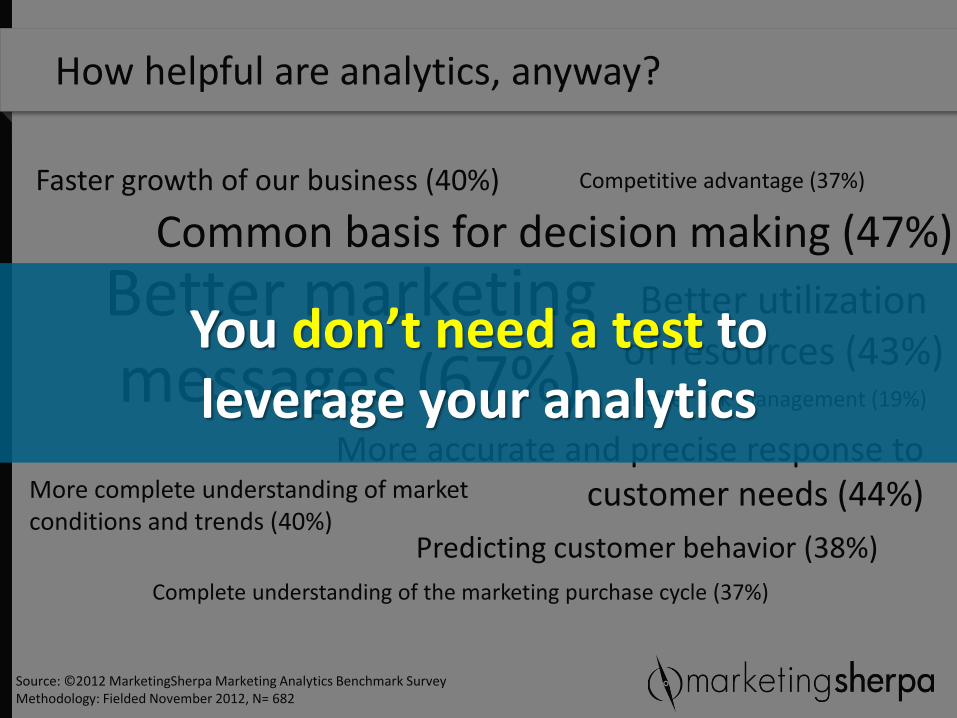
How helpful are analytics, anyway?
Source: ©2012 MarketingSherpa Marketing Analytics Benchmark Survey Methodology: Fielded November 2012, N= 682
Better marketing messages (67%)
Common basis for decision making (47%)
More accurate and precise response to customer needs (44%)
Better utilization of resources (43%)
Faster growth of our business (40%)
More complete understanding of market conditions and trends (40%)
Predicting customer behavior (38%)
Complete understanding of the marketing purchase cycle (37%)
Competitive advantage (37%)
Better risk management (19%)
You don’t need a test to leverage your analytics
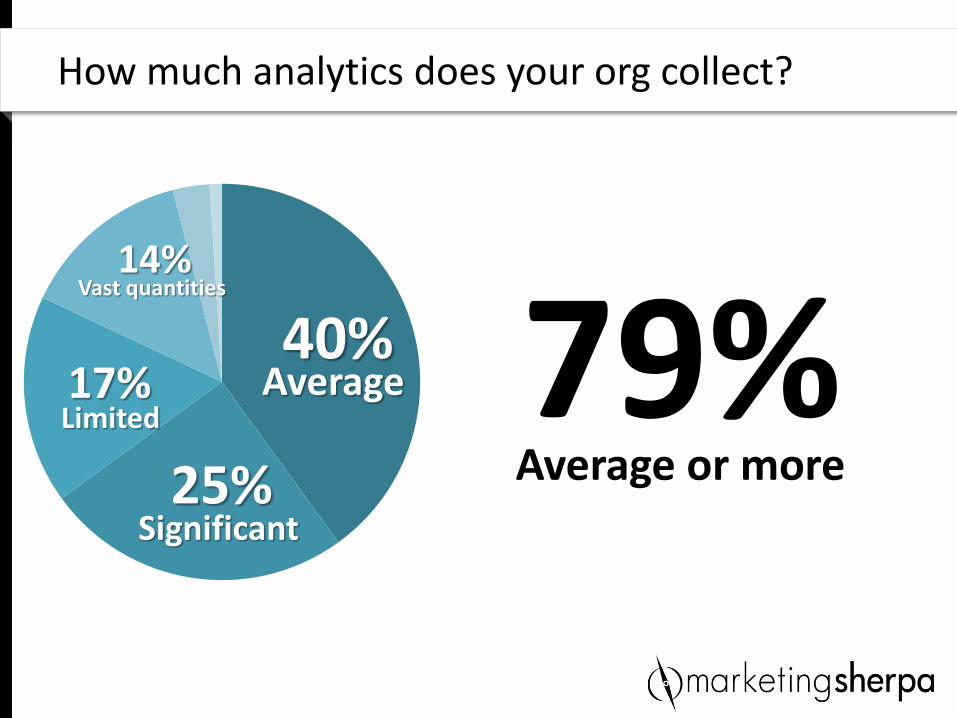
How much analytics does your org collect?
40% Average
25% Significant
14% Vast quantities
17% Limited
Average or more
79%
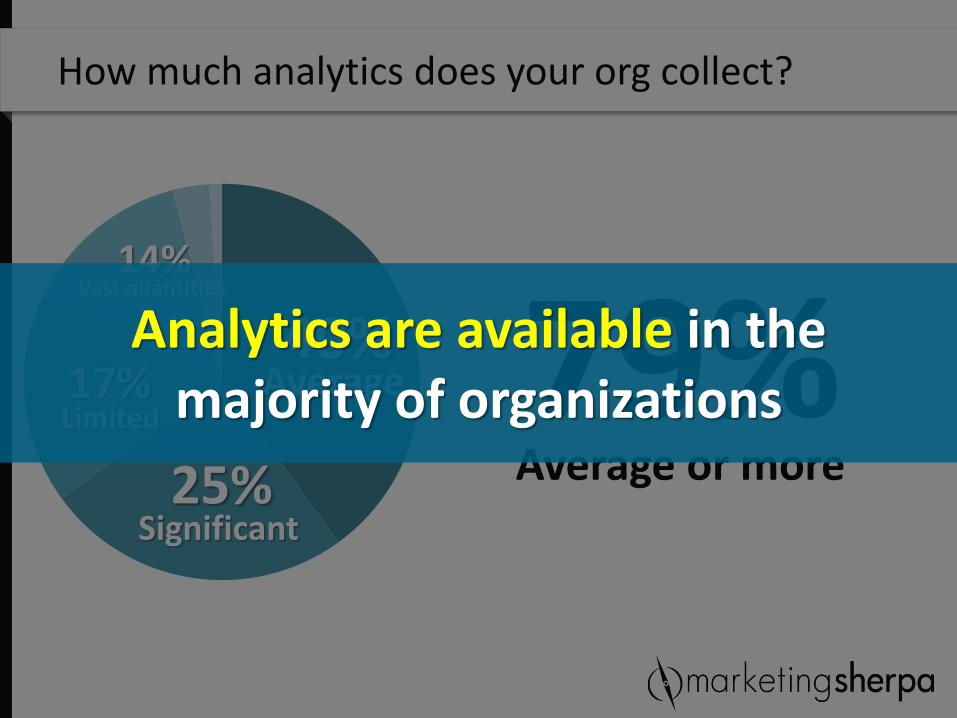
How much analytics does your org collect?
40% Average
25% Significant
14% Vast quantities
17% Limited
Average or more
79% Analytics are available in the majority of organizations
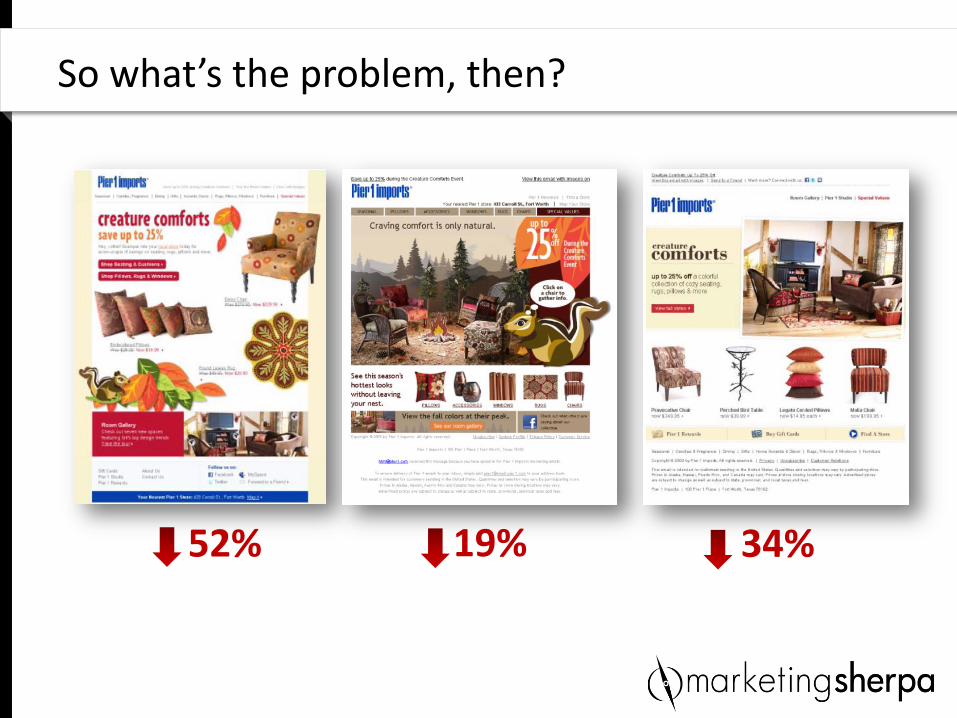
So what’s the problem, then?
52% 19% 34%
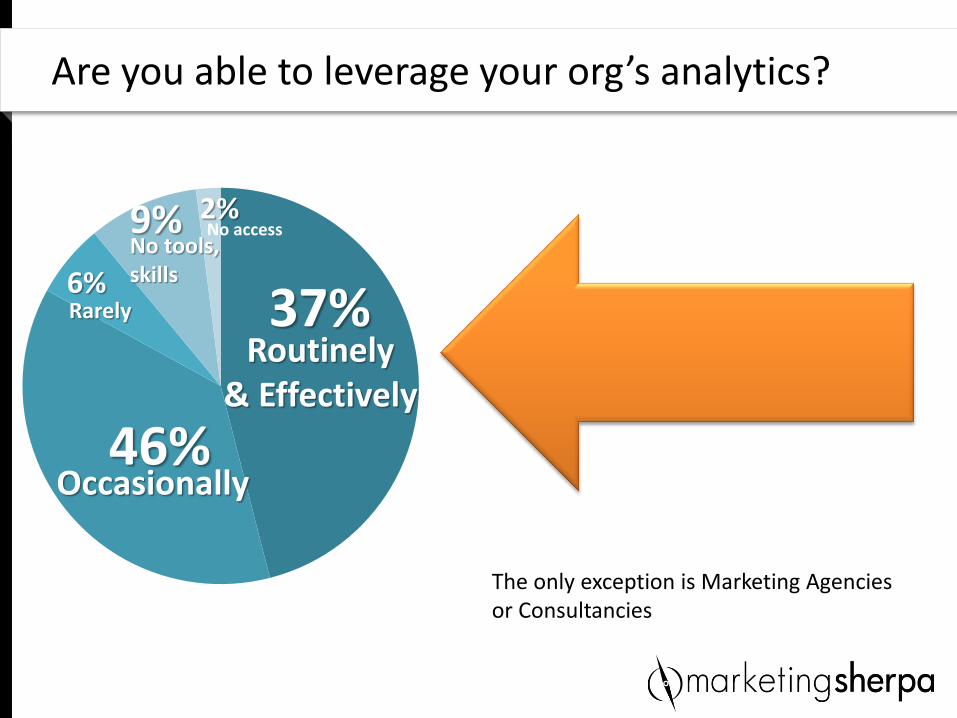
Are you able to leverage your org’s analytics?
2%
37% Routinely
& Effectively
46% Occasionally
9%
Rarely
No tools, skills 6%
No access
The only exception is Marketing Agencies or Consultancies
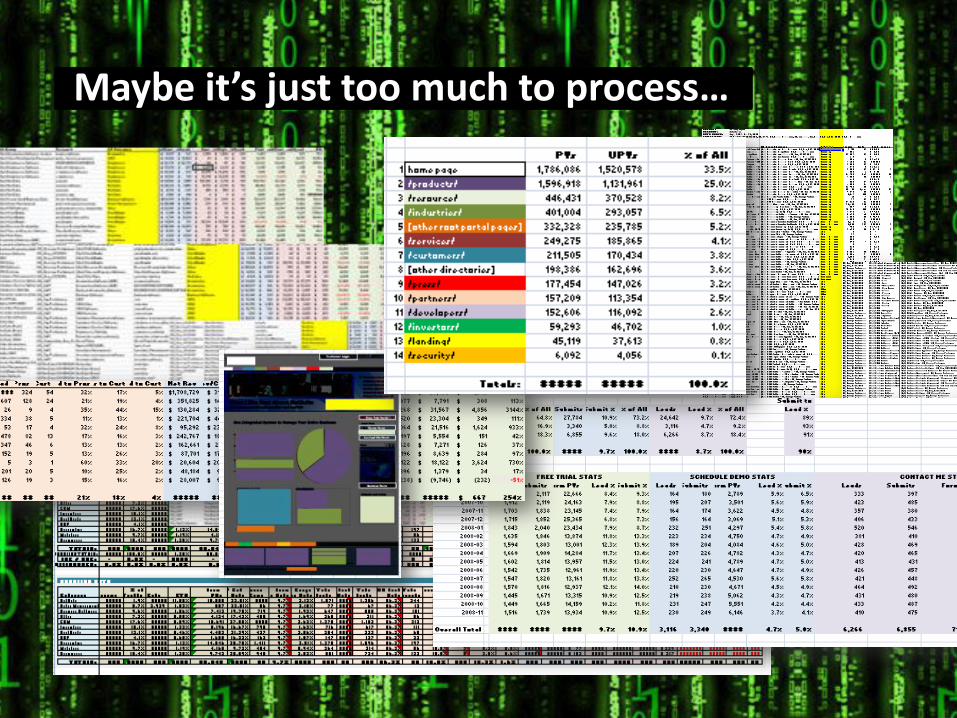
Maybe it’s just too much to process…
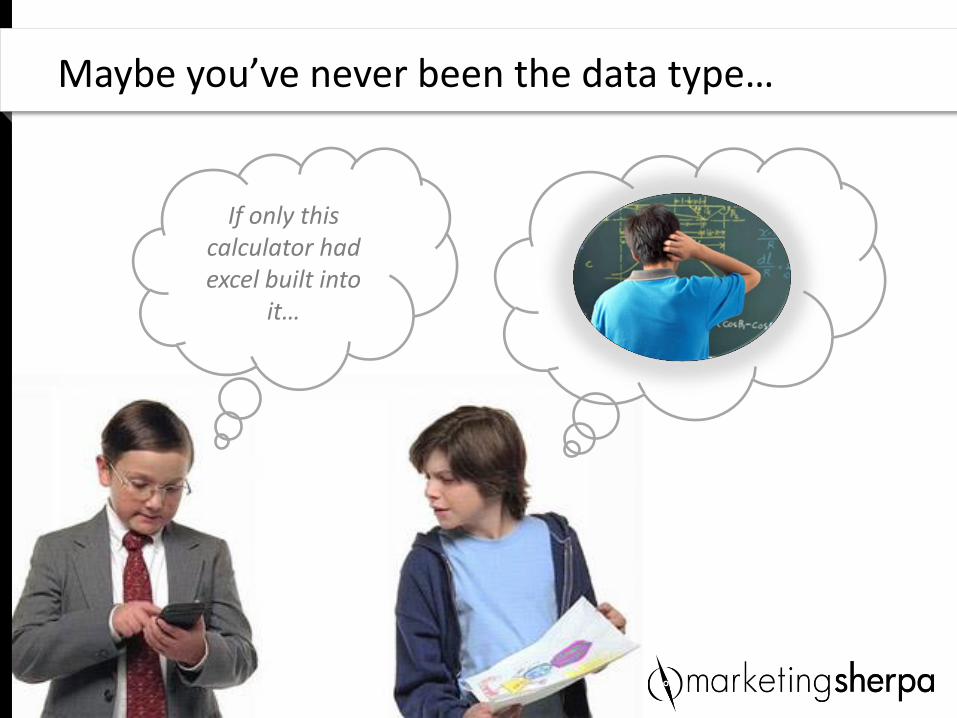
Maybe you’ve never been the data type…
If only this calculator had excel built into
it…
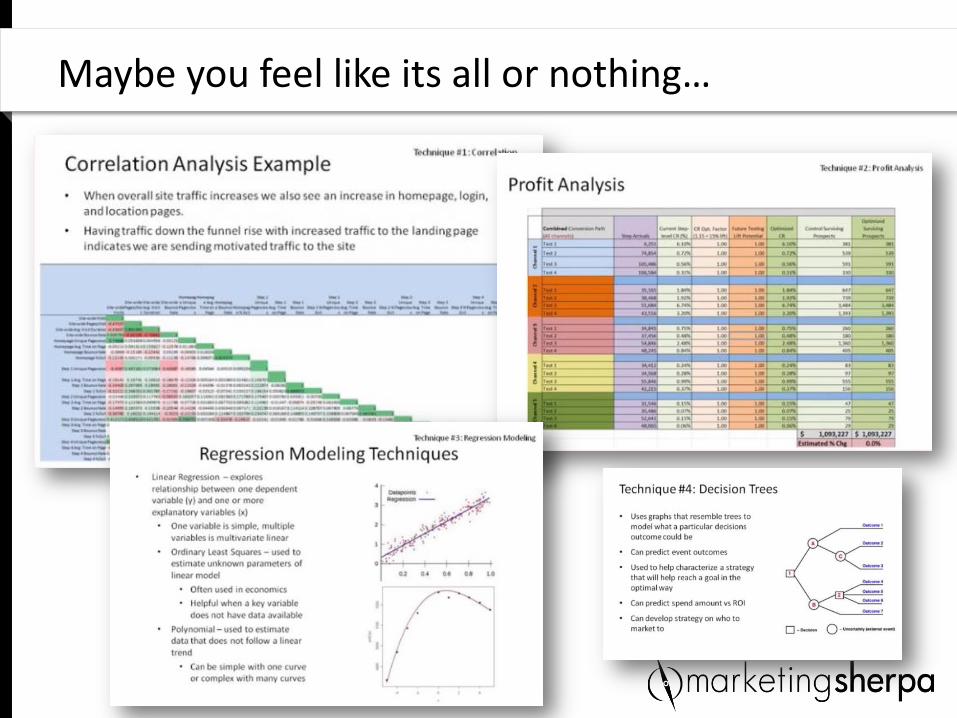
Maybe you feel like its all or nothing…
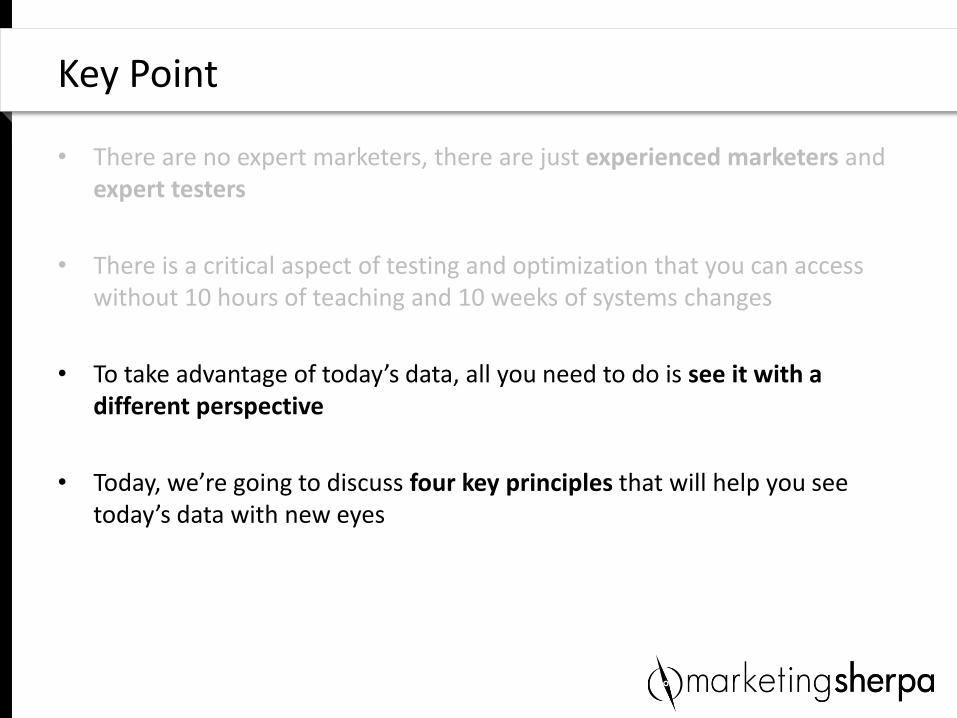
• There are no expert marketers, there are just experienced marketers and expert testers
• There is a critical aspect of testing and optimization that you can access without 10 hours of teaching and 10 weeks of systems changes
• To take advantage of today’s data, all you need to do is see it with a different perspective
• Today, we’re going to discuss four key principles that will help you see today’s data with new eyes
Key Point
POINT 1: Stop focusing on the “how many”
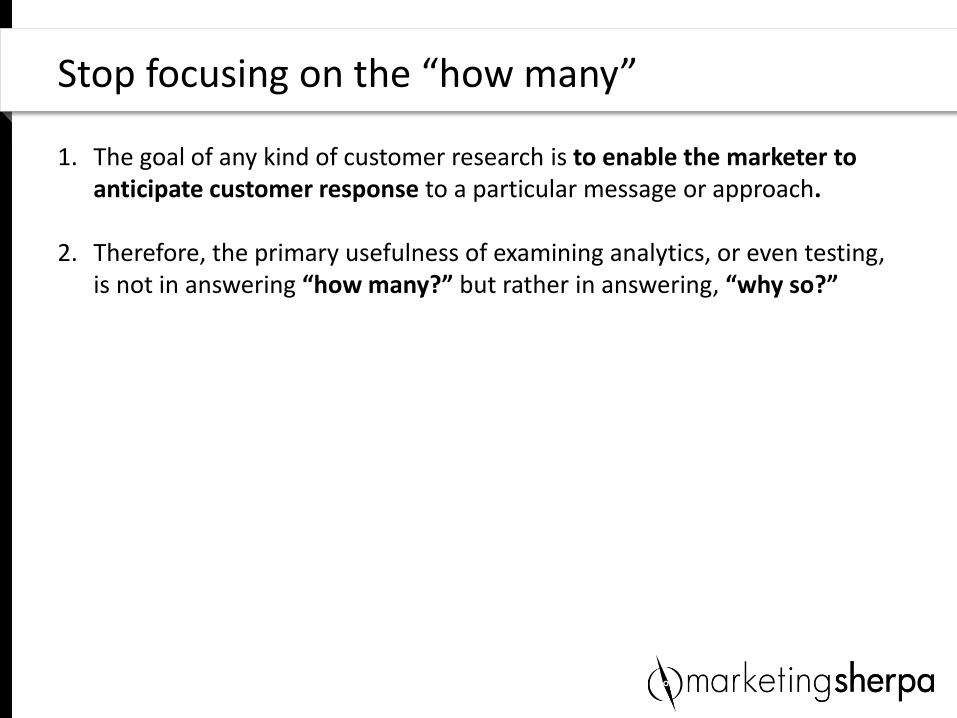
1. The goal of any kind of customer research is to enable the marketer to anticipate customer response to a particular message or approach.
2. Therefore, the primary usefulness of examining analytics, or even testing, is not in answering “how many?” but rather in answering, “why so?”
Stop focusing on the “how many”
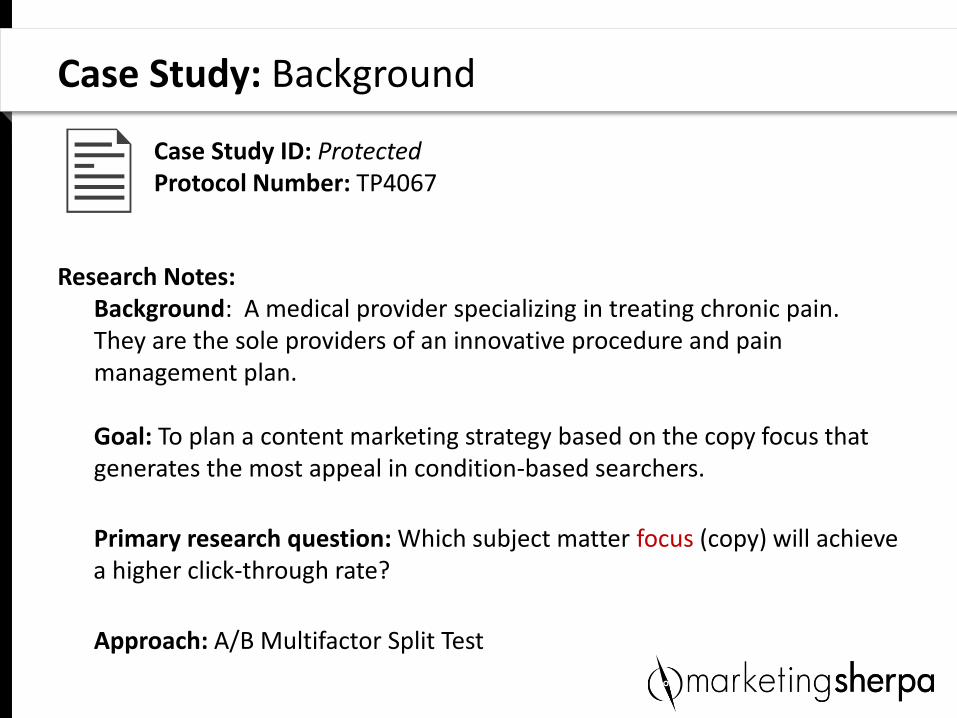
Research Notes: Background: A medical provider specializing in treating chronic pain. They are the sole providers of an innovative procedure and pain management plan.
Goal: To plan a content marketing strategy based on the copy focus that generates the most appeal in condition-based searchers.
Primary research question: Which subject matter focus (copy) will achieve a higher click-through rate?
Approach: A/B Multifactor Split Test
Case Study: Background
Case Study ID: Protected Protocol Number: TP4067
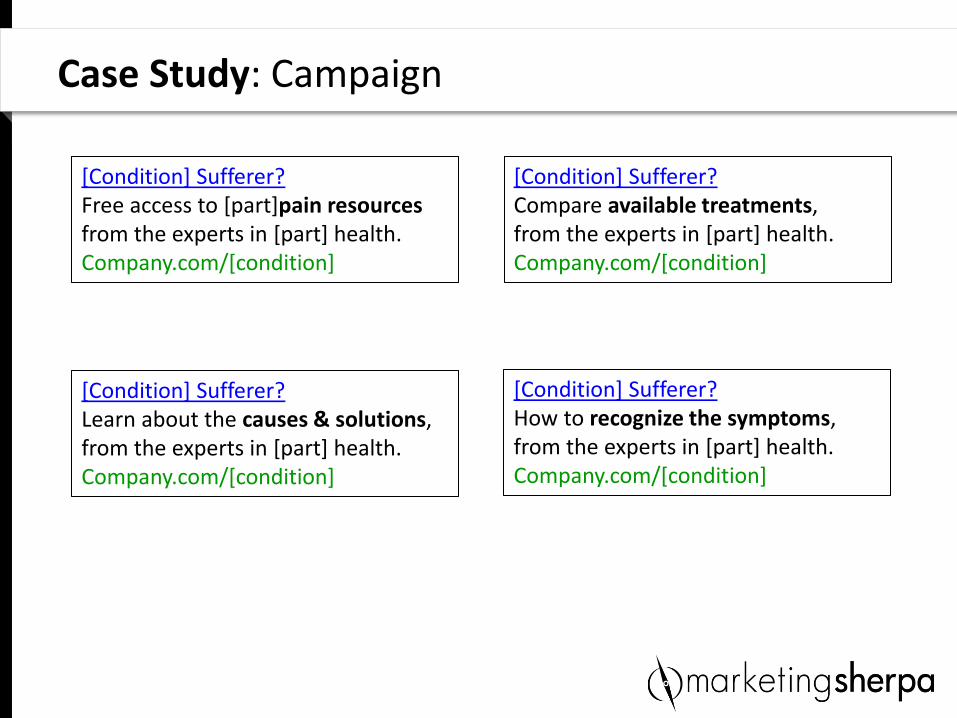
Case Study: Campaign
[Condition] Sufferer? Learn about the causes & solutions, from the experts in [part] health. Company.com/[condition]
[Condition] Sufferer? Free access to [part]pain resources from the experts in [part] health. Company.com/[condition]
[Condition] Sufferer? Compare available treatments, from the experts in [part] health. Company.com/[condition]
[Condition] Sufferer? How to recognize the symptoms, from the experts in [part] health. Company.com/[condition]
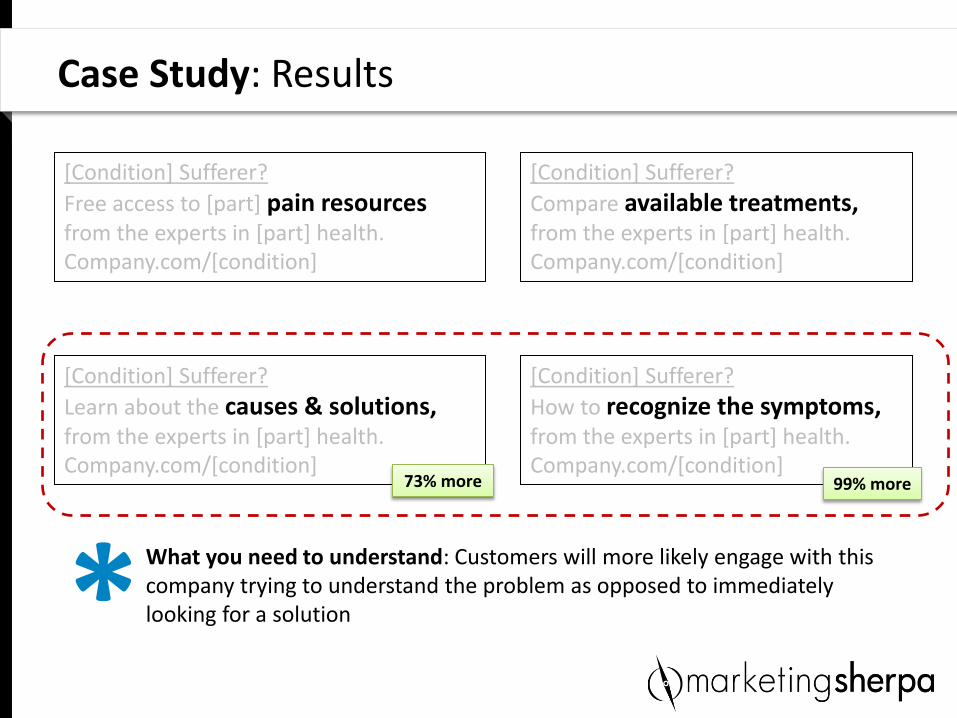
Case Study: Results
[Condition] Sufferer?
Free access to [part] pain resources from the experts in [part] health. Company.com/[condition]
[Condition] Sufferer?
Compare available treatments, from the experts in [part] health. Company.com/[condition]
[Condition] Sufferer?
Learn about the causes & solutions, from the experts in [part] health. Company.com/[condition]
[Condition] Sufferer?
How to recognize the symptoms, from the experts in [part] health. Company.com/[condition]
What you need to understand: Customers will more likely engage with this company trying to understand the problem as opposed to immediately looking for a solution *
73% more 99% more
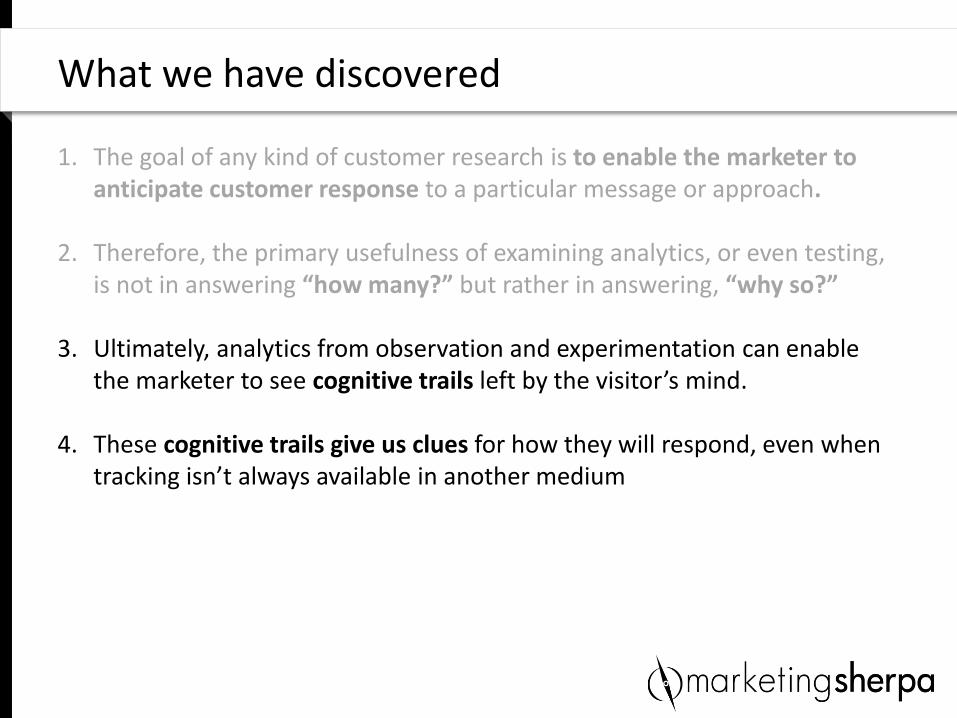
1. The goal of any kind of customer research is to enable the marketer to anticipate customer response to a particular message or approach.
2. Therefore, the primary usefulness of examining analytics, or even testing, is not in answering “how many?” but rather in answering, “why so?”
3. Ultimately, analytics from observation and experimentation can enable the marketer to see cognitive trails left by the visitor’s mind.
4. These cognitive trails give us clues for how they will respond, even when tracking isn’t always available in another medium
What we have discovered
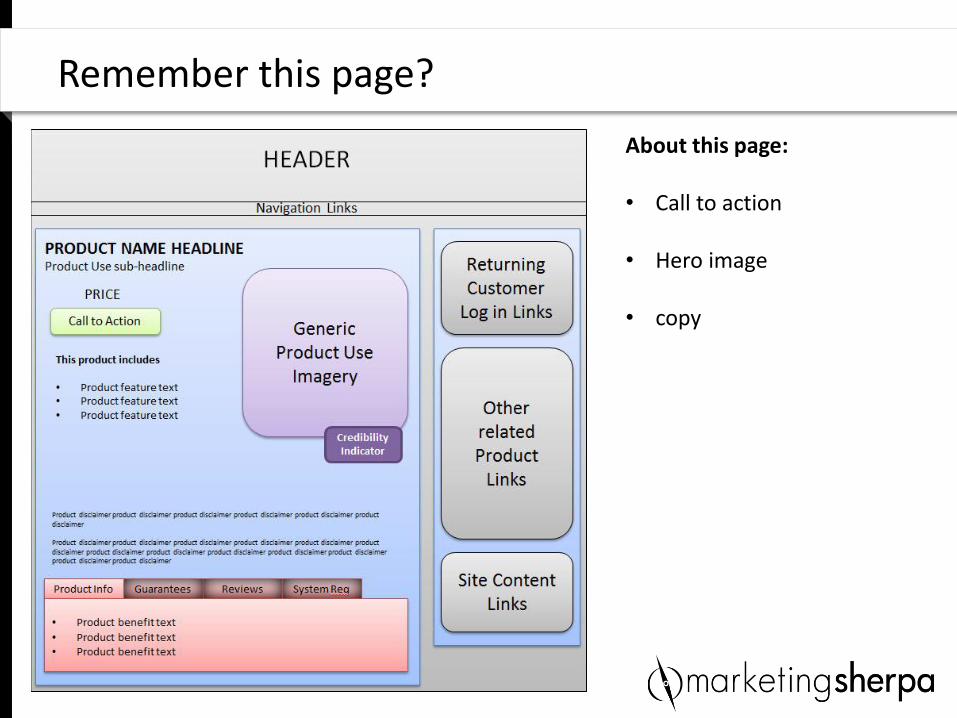
Remember this page?
About this page: • Call to action
• Hero image
• copy
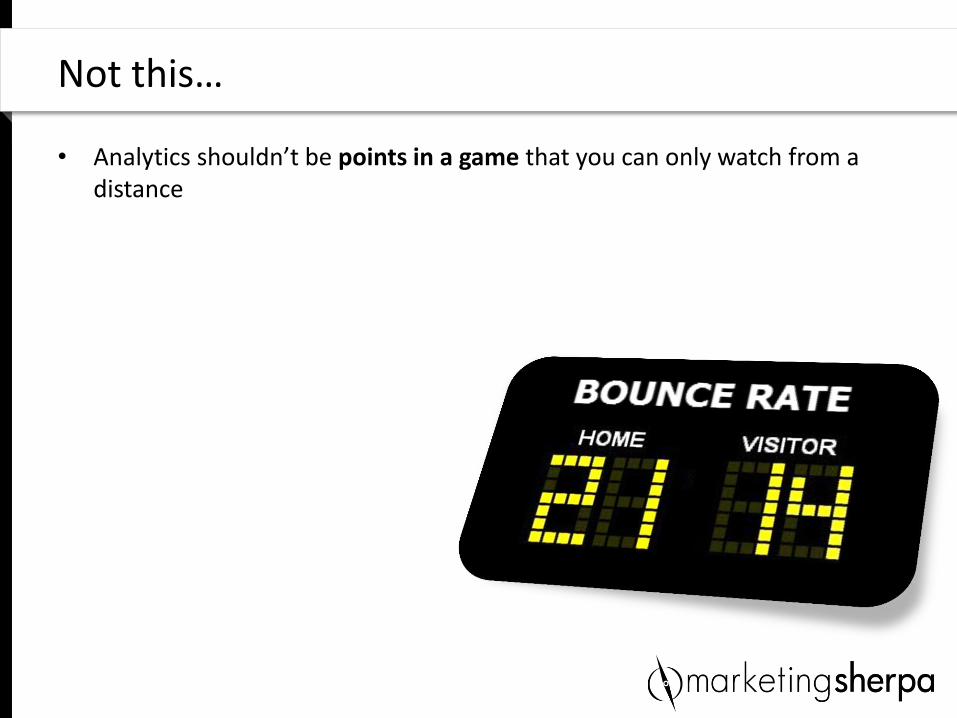
• Analytics shouldn’t be points in a game that you can only watch from a distance
Not this…
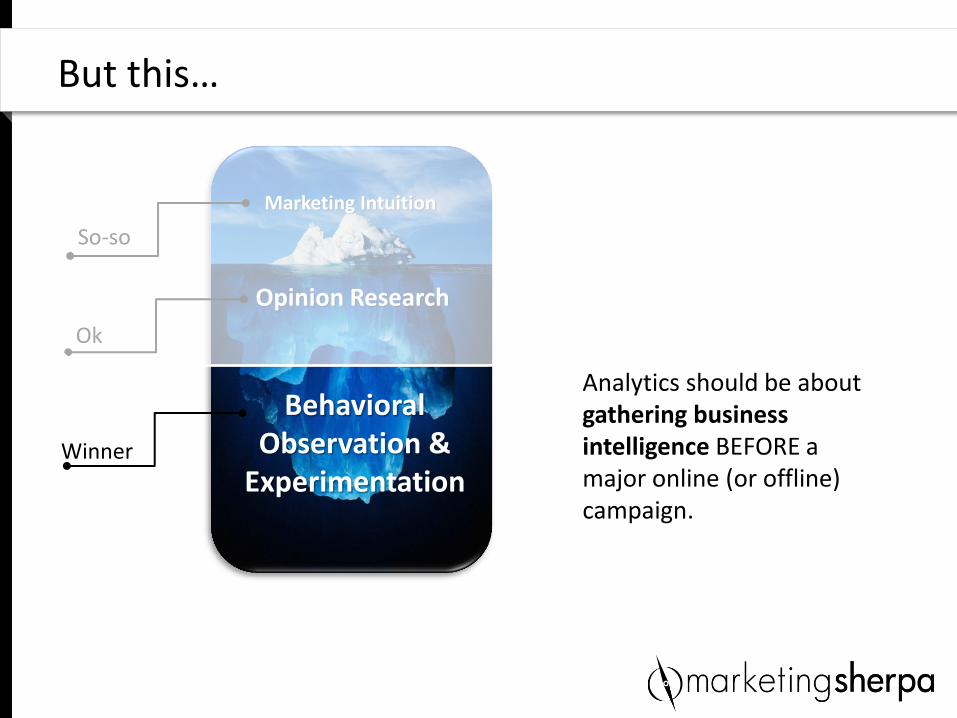
Analytics should be about gathering business intelligence BEFORE a major online (or offline) campaign.
But this…
So-so
Ok
Behavioral Observation &
Experimentation
Opinion Research
Marketing Intuition
Winner
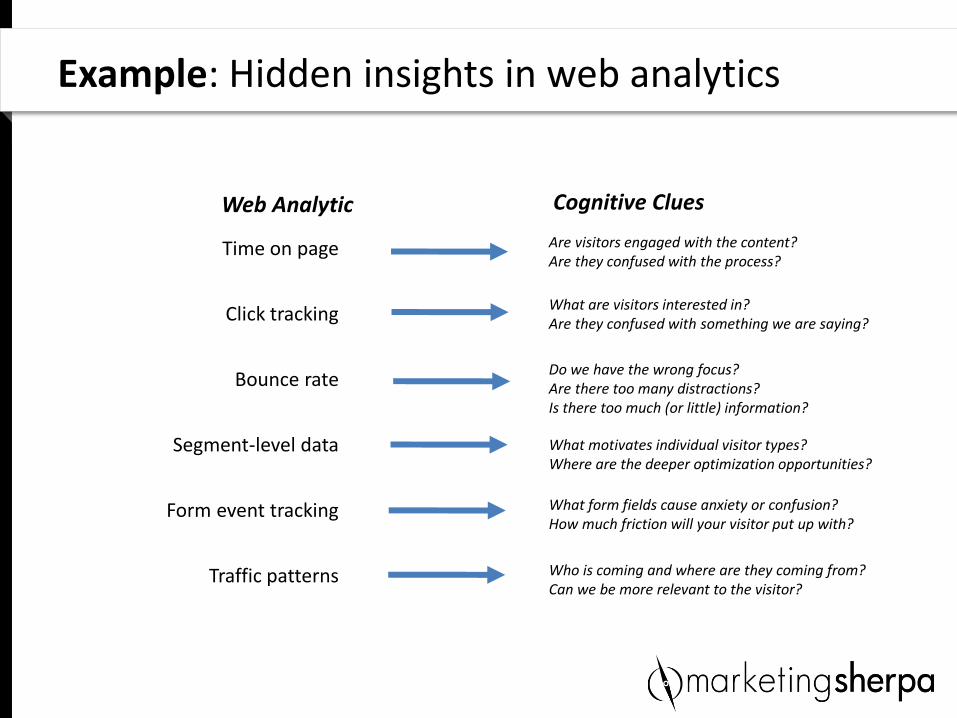
Example: Hidden insights in web analytics
Time on page
Click tracking
Bounce rate
Segment-level data
Form event tracking
Traffic patterns
Are visitors engaged with the content? Are they confused with the process?
What are visitors interested in? Are they confused with something we are saying?
Do we have the wrong focus? Are there too many distractions? Is there too much (or little) information?
What motivates individual visitor types? Where are the deeper optimization opportunities?
What form fields cause anxiety or confusion? How much friction will your visitor put up with?
Who is coming and where are they coming from? Can we be more relevant to the visitor?
Web Analytic Cognitive Clues
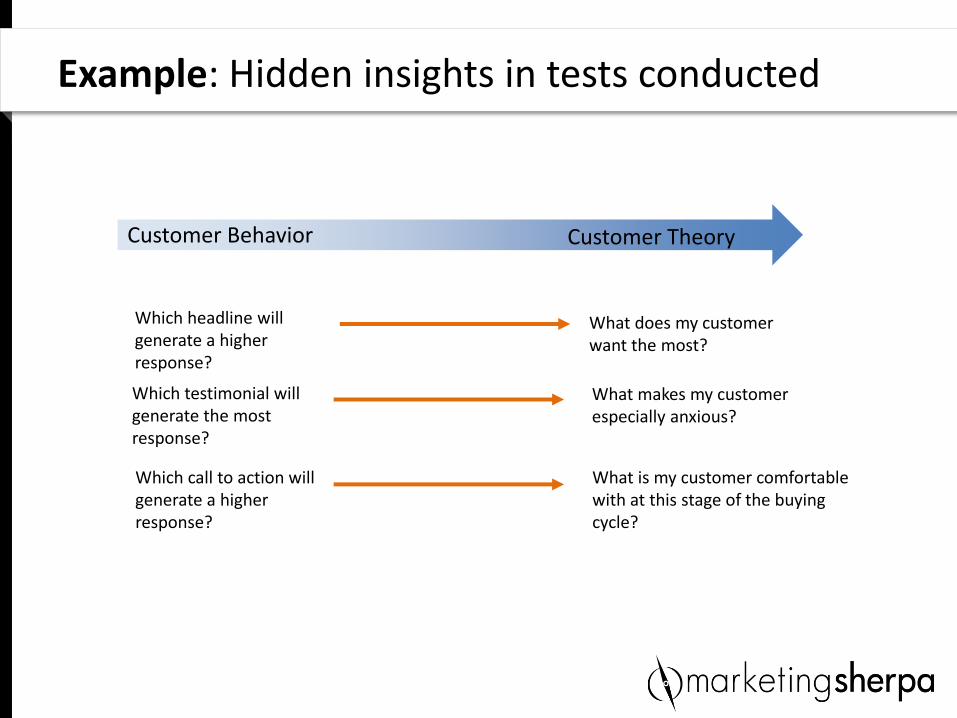
Example: Hidden insights in tests conducted
Customer Behavior Customer Theory
Which headline will generate a higher response?
What does my customer want the most?
Which testimonial will generate the most response?
What makes my customer especially anxious?
Which call to action will generate a higher response?
What is my customer comfortable with at this stage of the buying cycle?
POINT 2: Simplify your perspective of analytics so it gets used
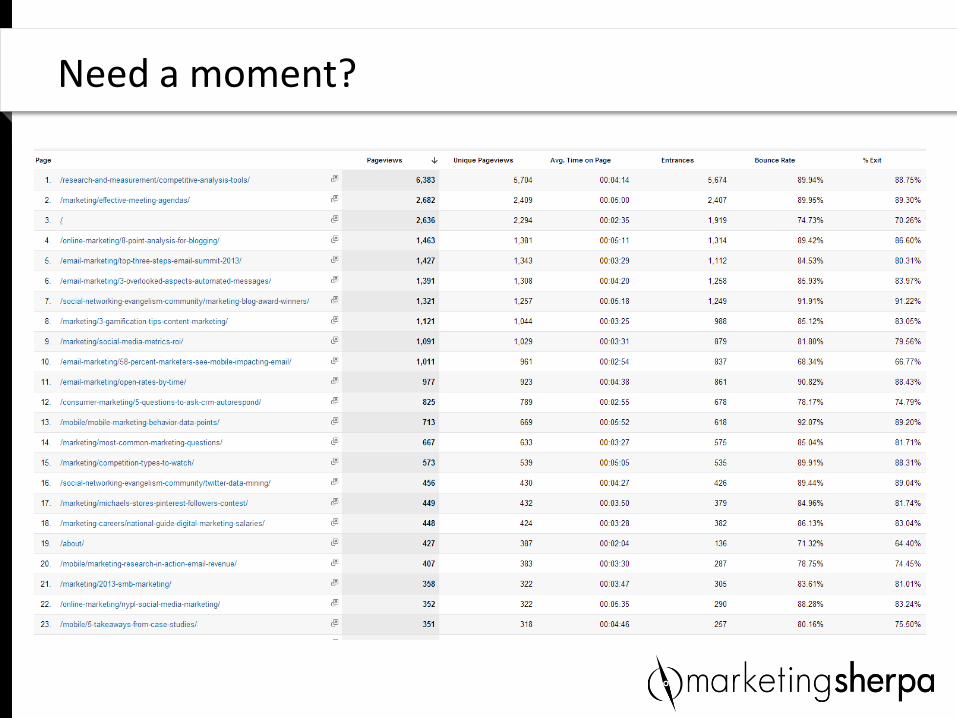
Need a moment?
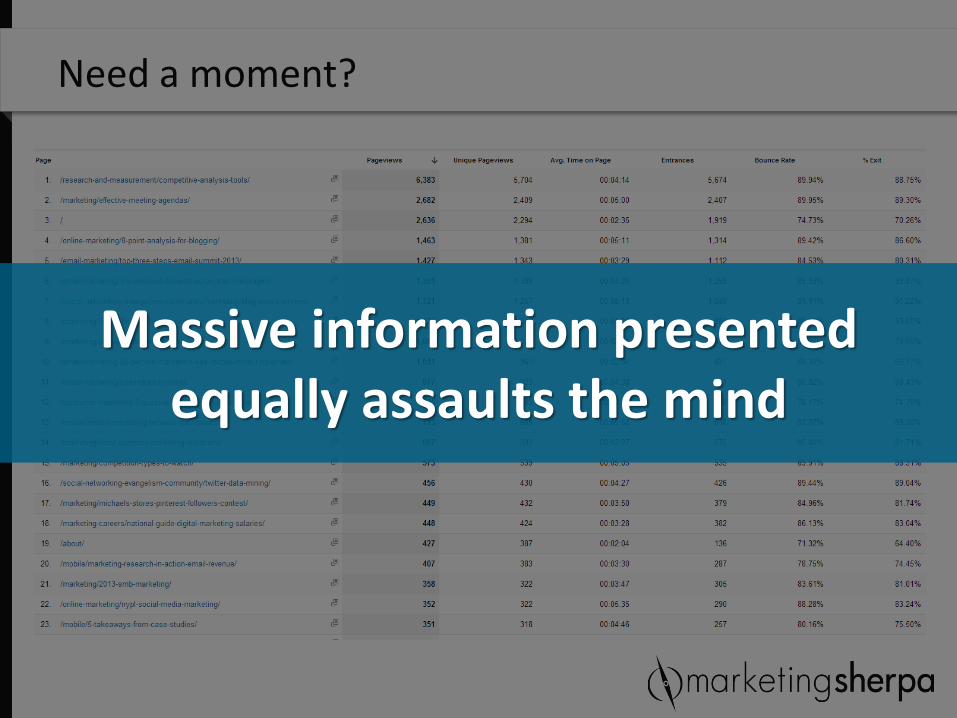
Need a moment?
Massive information presented equally assaults the mind
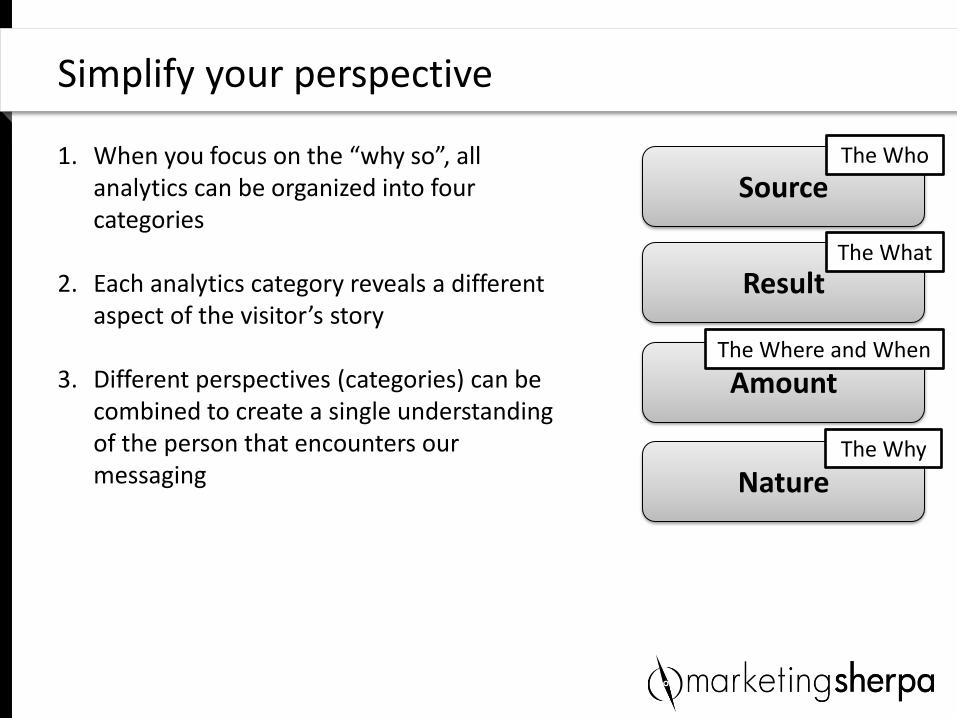
1. When you focus on the “why so”, all analytics can be organized into four categories
2. Each analytics category reveals a different aspect of the visitor’s story
3. Different perspectives (categories) can be combined to create a single understanding of the person that encounters our messaging
Simplify your perspective
Source
Result
Amount
Nature
The Who
The What
The Where and When
The Why
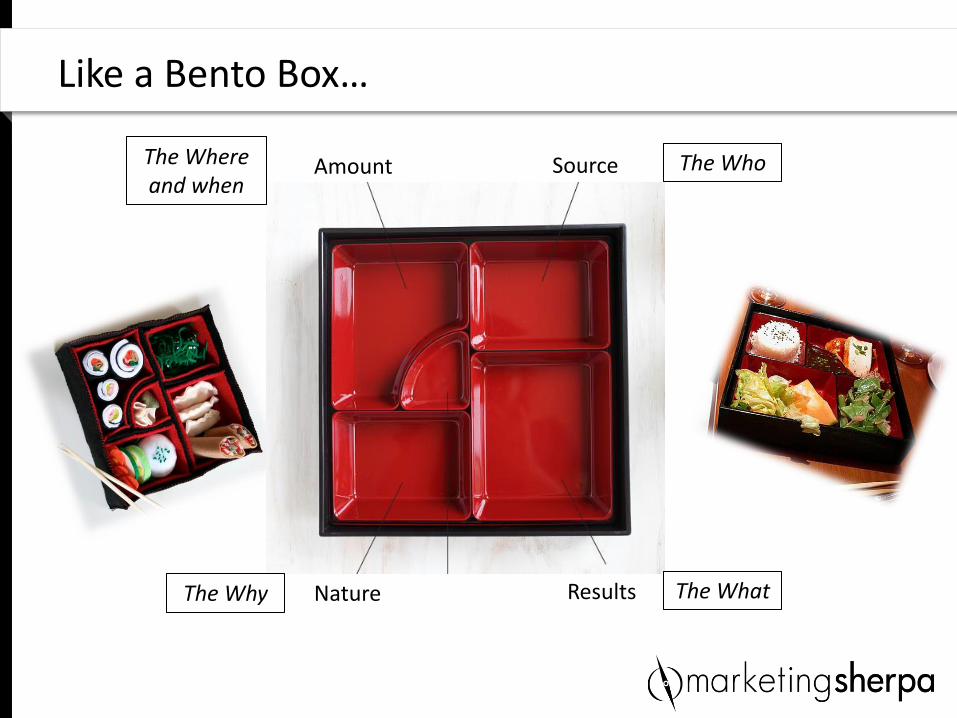
Like a Bento Box…
Amount Source
Nature Results
The Where and when
The Why The What
The Who
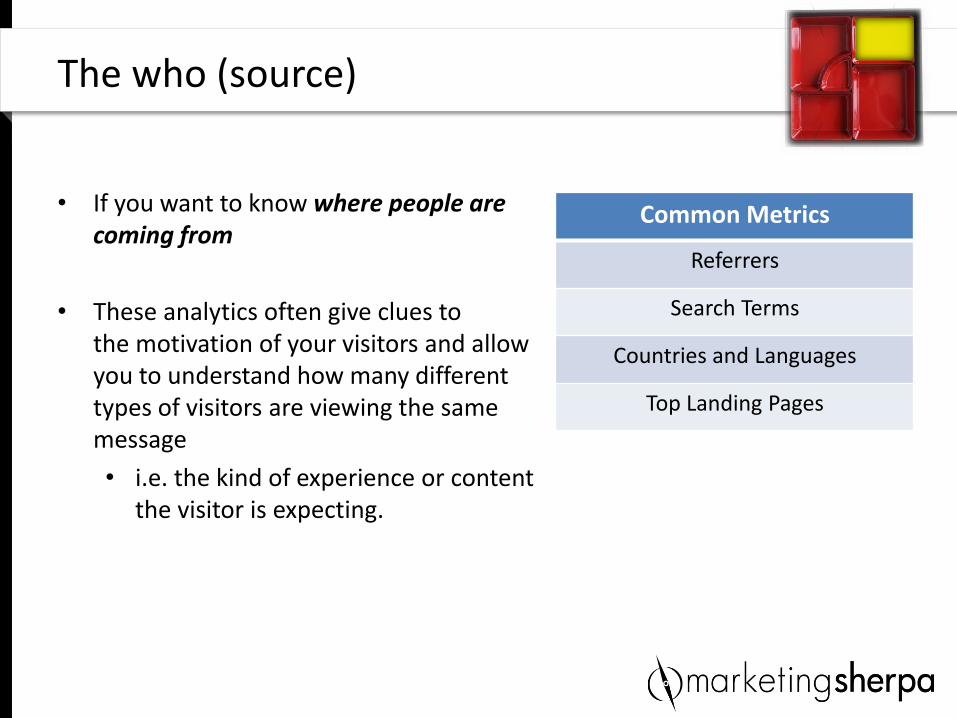
• If you want to know where people are coming from
• These analytics often give clues to the motivation of your visitors and allow you to understand how many different types of visitors are viewing the same message
• i.e. the kind of experience or content the visitor is expecting.
The who (source)
Common Metrics
Referrers
Search Terms
Countries and Languages
Top Landing Pages
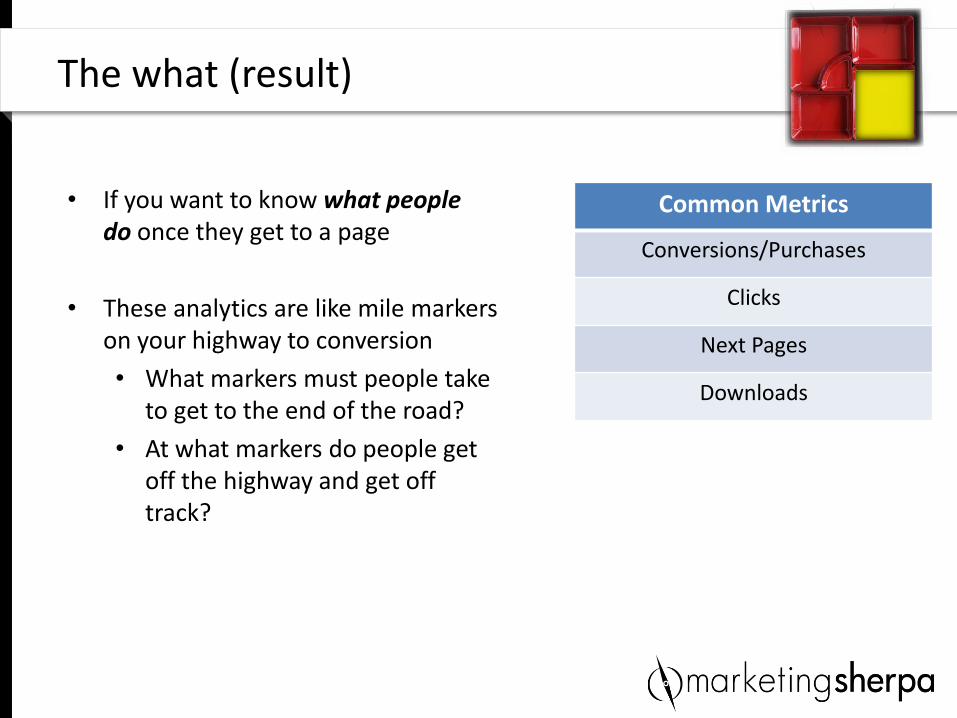
• If you want to know what people do once they get to a page
• These analytics are like mile markers on your highway to conversion
• What markers must people take to get to the end of the road?
• At what markers do people get off the highway and get off track?
The what (result)
Common Metrics
Conversions/Purchases
Clicks
Next Pages
Downloads
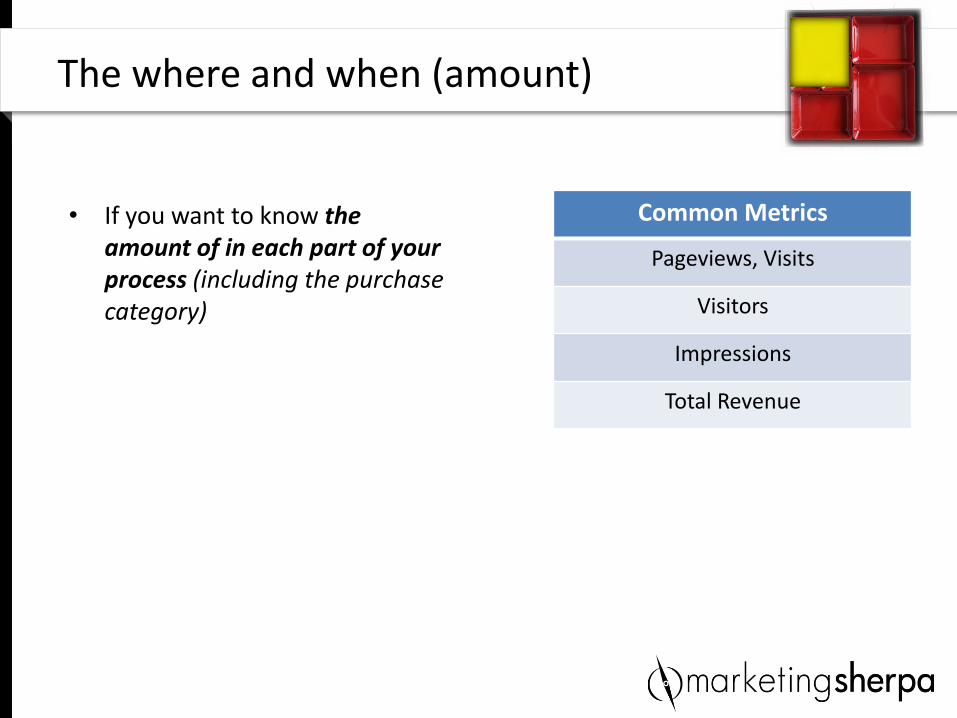
• If you want to know the amount of in each part of your process (including the purchase category)
The where and when (amount)
Common Metrics
Pageviews, Visits
Visitors
Impressions
Total Revenue
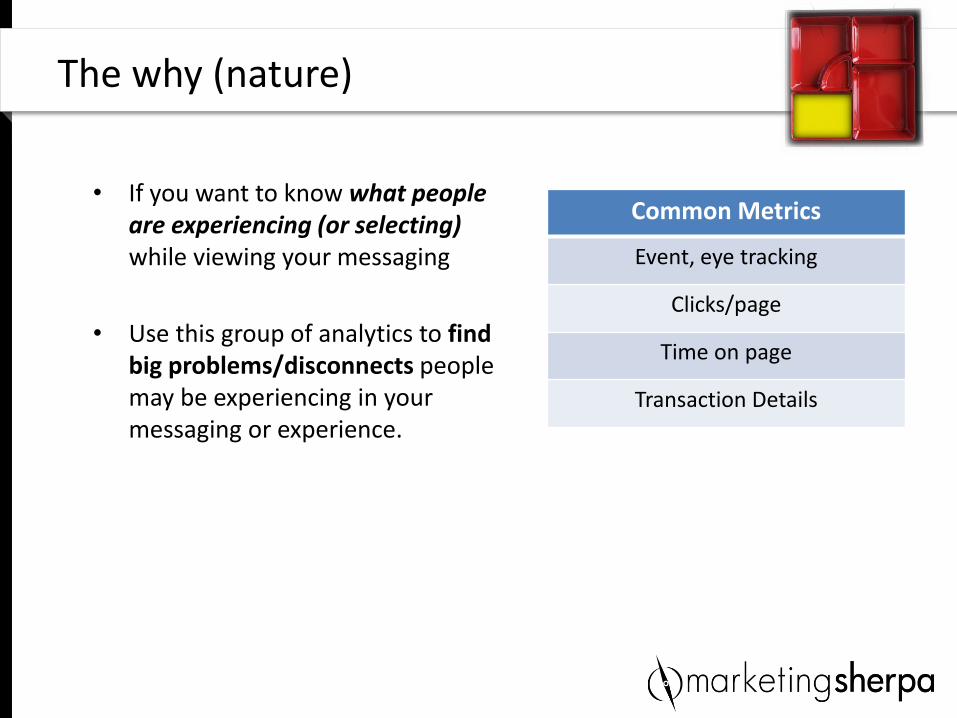
• If you want to know what people are experiencing (or selecting) while viewing your messaging
• Use this group of analytics to find big problems/disconnects people may be experiencing in your messaging or experience.
The why (nature)
Common Metrics
Event, eye tracking
Clicks/page
Time on page
Transaction Details
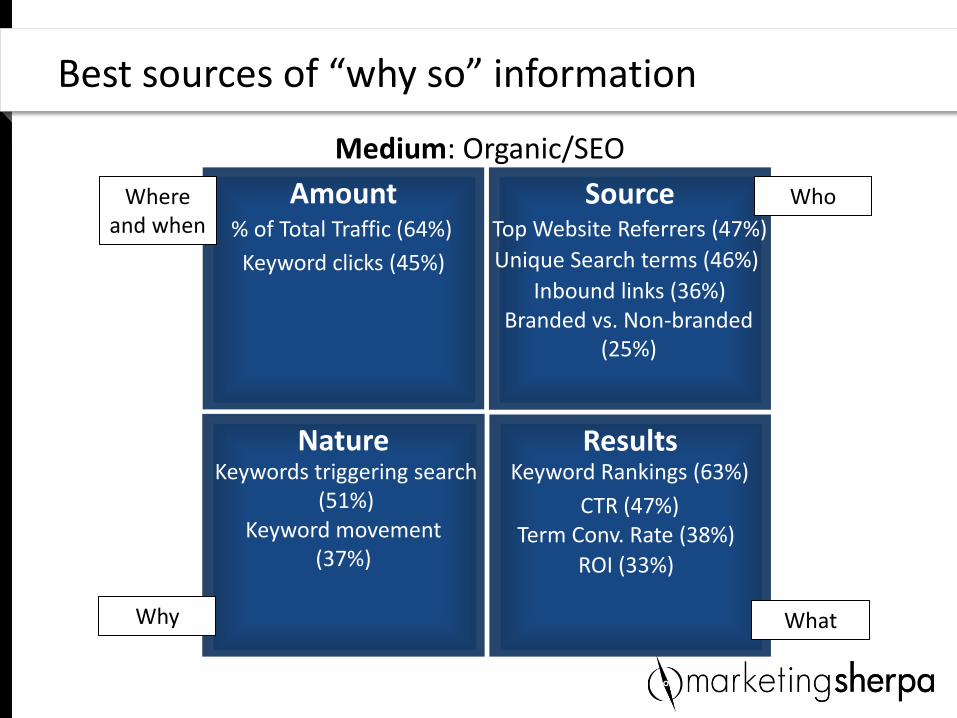
Best sources of “why so” information
Amount
Nature
Source
Results
Where and when
Why What
Who
% of Total Traffic (64%)
Keyword Rankings (63%)
Top Website Referrers (47%)
Unique Search terms (46%) Keyword clicks (45%)
CTR (47%)
Inbound links (36%)
Keywords triggering search (51%)
Keyword movement (37%)
Term Conv. Rate (38%)
ROI (33%)
Branded vs. Non-branded (25%)
Medium: Organic/SEO
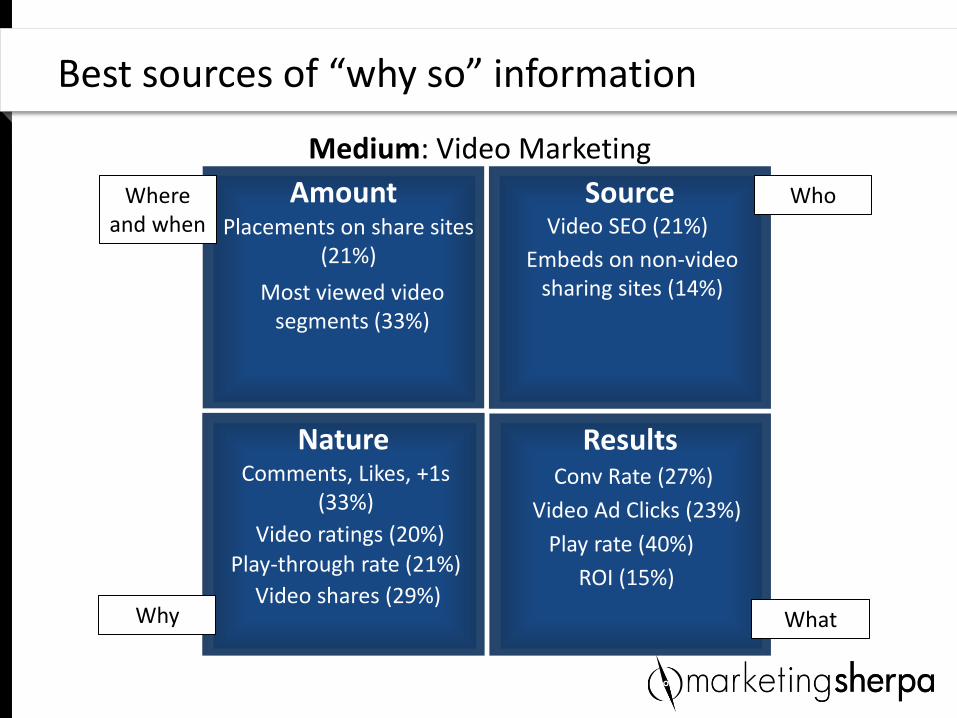
Best sources of “why so” information
Amount
Nature
Source
Results
Where and when
Why What
Who
Play rate (40%)
Most viewed video segments (33%)
Comments, Likes, +1s (33%)
Conv Rate (27%)
Video shares (29%)
Play-through rate (21%)
Video Ad Clicks (23%)
Placements on share sites (21%)
Video SEO (21%)
Video ratings (20%)
ROI (15%)
Embeds on non-video sharing sites (14%)
Medium: Video Marketing
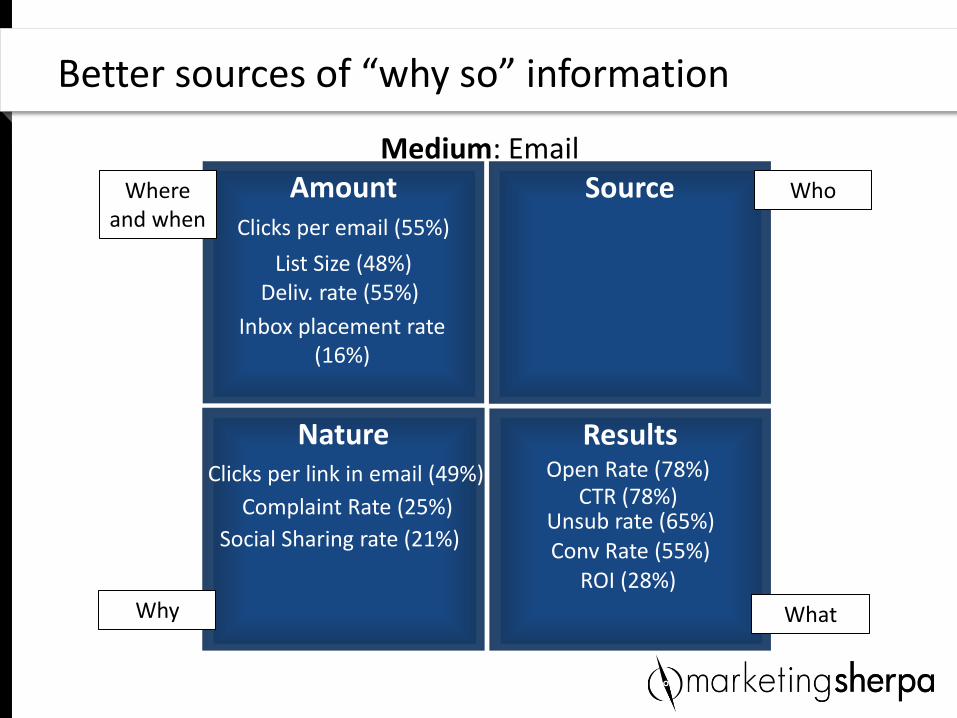
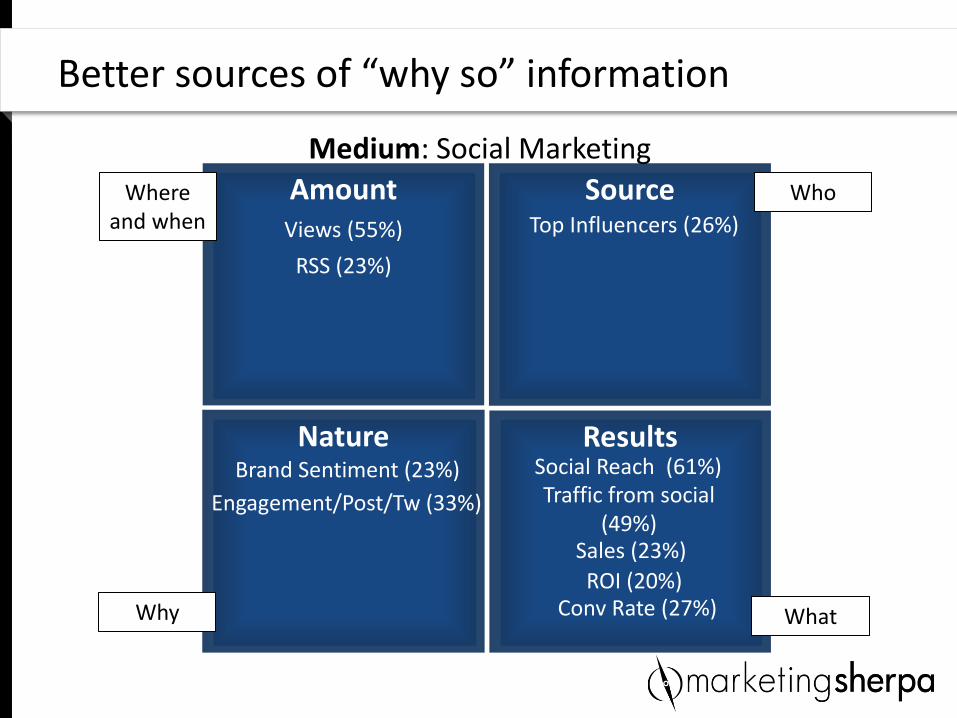
Better sources of “why so” information
Amount
Nature
Source
Results
Where and when
Why What
Who
Open Rate (78%) CTR (78%)
Unsub rate (65%)
Deliv. rate (55%)
Clicks per email (55%)
Conv Rate (55%)
Clicks per link in email (49%)
List Size (48%)
ROI (28%)
Complaint Rate (25%)
Social Sharing rate (21%)
Inbox placement rate (16%)
Medium: Email
Better sources of “why so” information
Amount
Nature
Source
Results
Where and when
Why What
Who
Social Reach (61%) Traffic from social
(49%)
Views (55%)
Engagement/Post/Tw (33%)
RSS (23%)
Sales (23%)
Brand Sentiment (23%)
ROI (20%)
Top Influencers (26%)
Conv Rate (27%)
Medium: Social Marketing
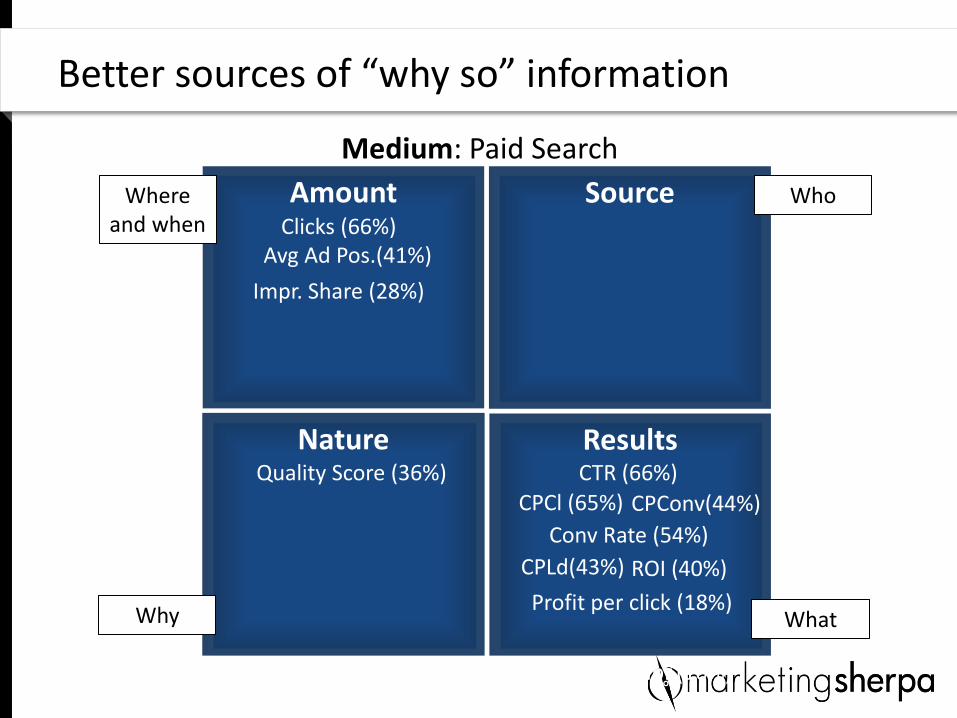
Better sources of “why so” information
Amount
Nature
Source
Results
Where and when
Why What
Who
CTR (66%)
ROI (40%)
Clicks (66%) Avg Ad Pos.(41%)
CPCl (65%)
Conv Rate (54%)
CPConv(44%)
CPLd(43%)
Quality Score (36%)
Impr. Share (28%)
Profit per click (18%)
Profit per Impr.(10%)
Medium: Paid Search
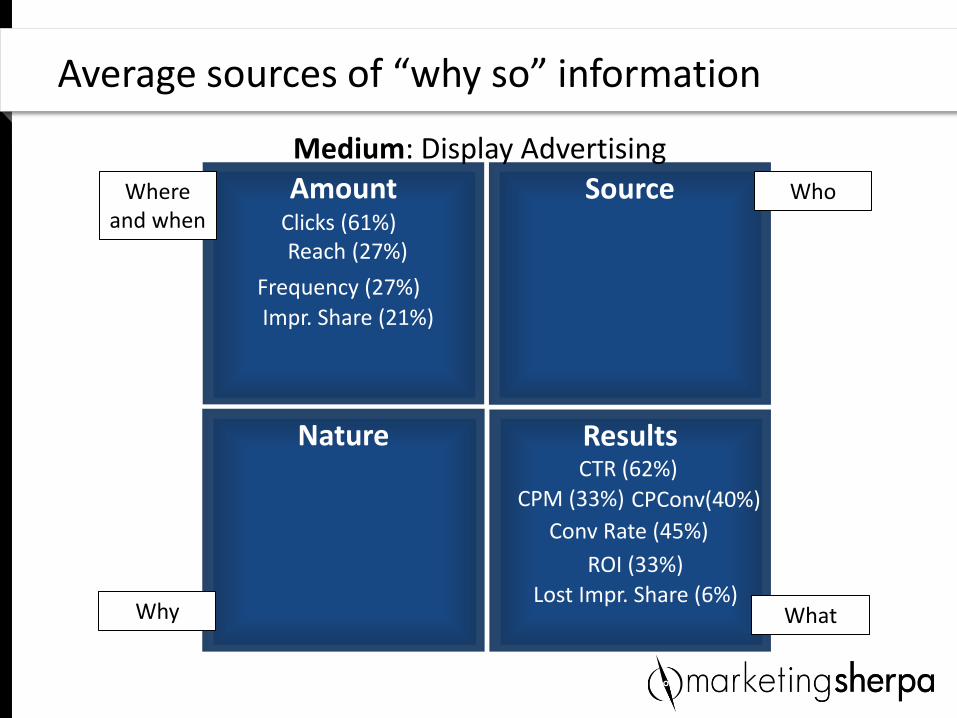
Average sources of “why so” information
Amount
Nature
Source
Results
Where and when
Why What
Who
CTR (62%)
ROI (33%)
Clicks (61%) Reach (27%)
CPM (33%)
Conv Rate (45%)
CPConv(40%)
Frequency (27%)
Impr. Share (21%)
Lost Impr. Share (6%)
Medium: Display Advertising
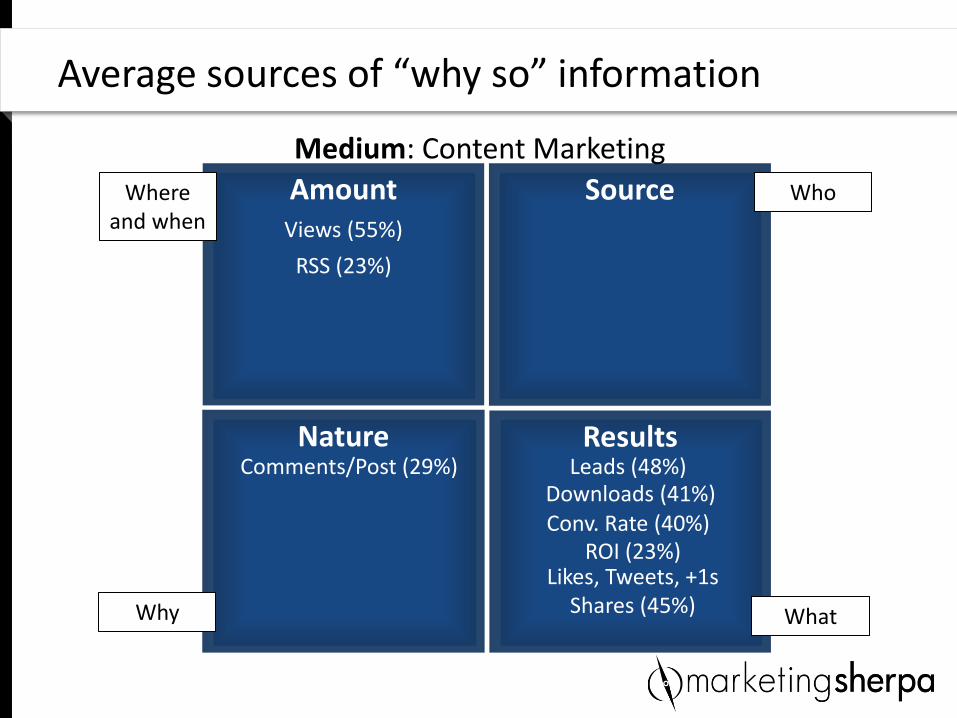
Average sources of “why so” information
Amount
Nature
Source
Results
Where and when
Why What
Who
Leads (48%)
Likes, Tweets, +1s Shares (45%)
Views (55%)
Downloads (41%) Conv. Rate (40%)
Comments/Post (29%)
ROI (23%)
RSS (23%)
Medium: Content Marketing
POINT 3: Start with the minimum (not max) effective dose
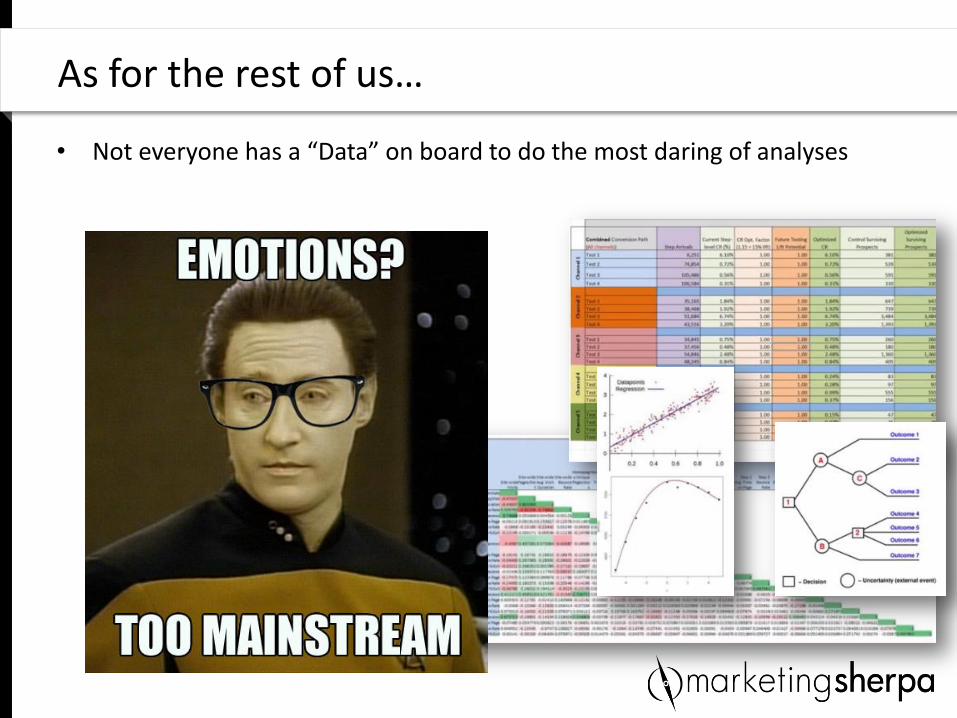
• Not everyone has a “Data” on board to do the most daring of analyses
As for the rest of us…
• You don’t need to throw everything (including the kitchen sink) at something to get messaging the performs positively
Forget the analysis paralysis
Research Notes:
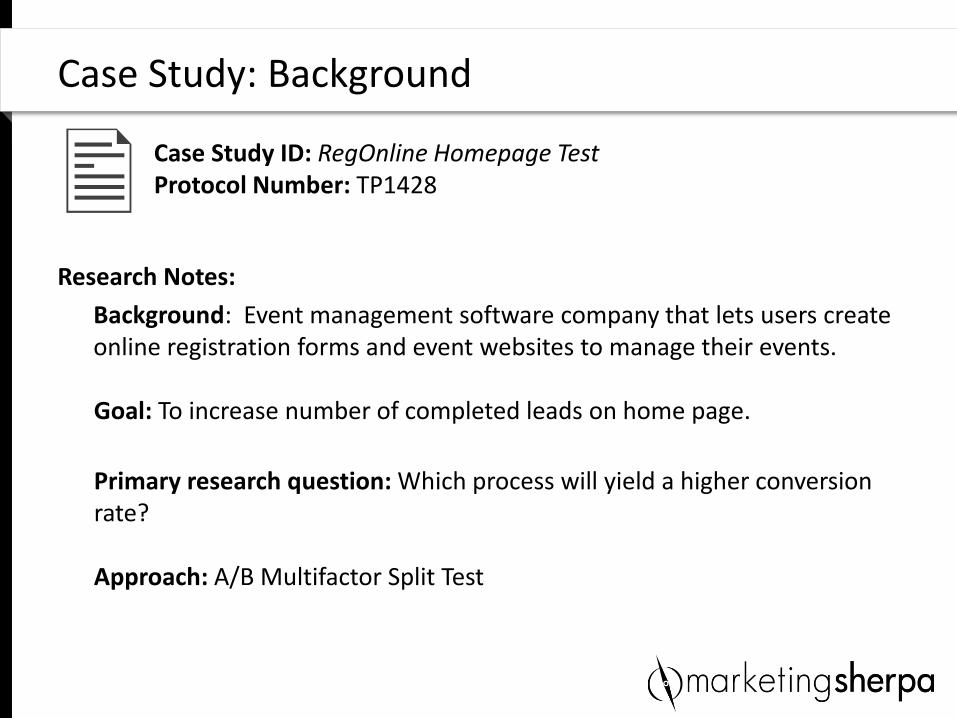
Background: Event management software company that lets users create online registration forms and event websites to manage their events. Goal: To increase number of completed leads on home page.
Primary research question: Which process will yield a higher conversion rate? Approach: A/B Multifactor Split Test
Case Study: Background
Case Study ID: RegOnline Homepage Test Protocol Number: TP1428
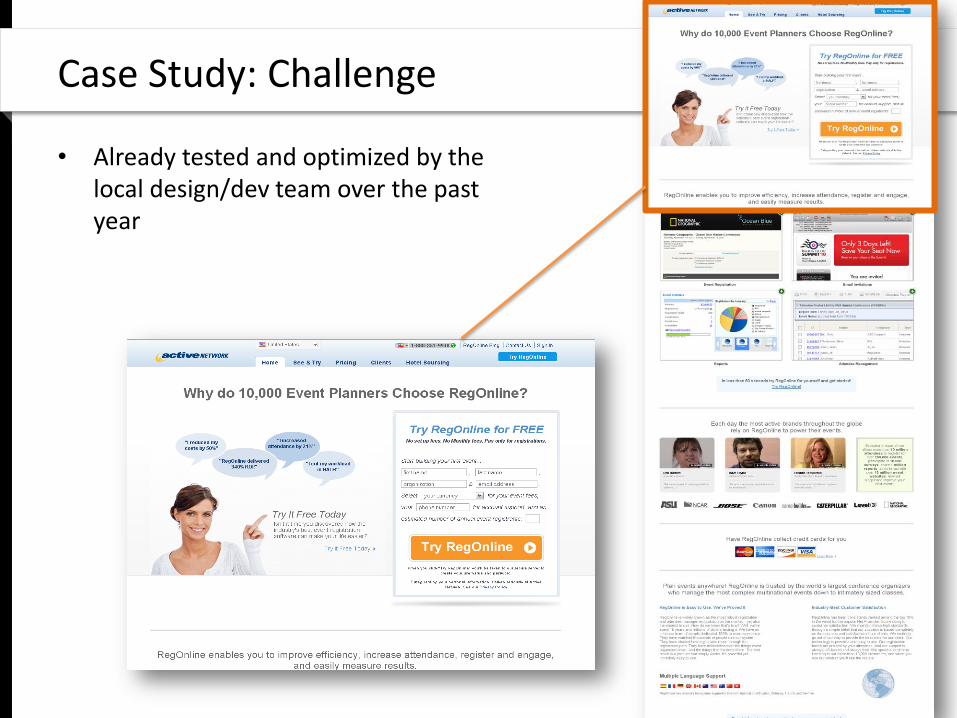
• Already tested and optimized by the local design/dev team over the past year
Case Study: Challenge
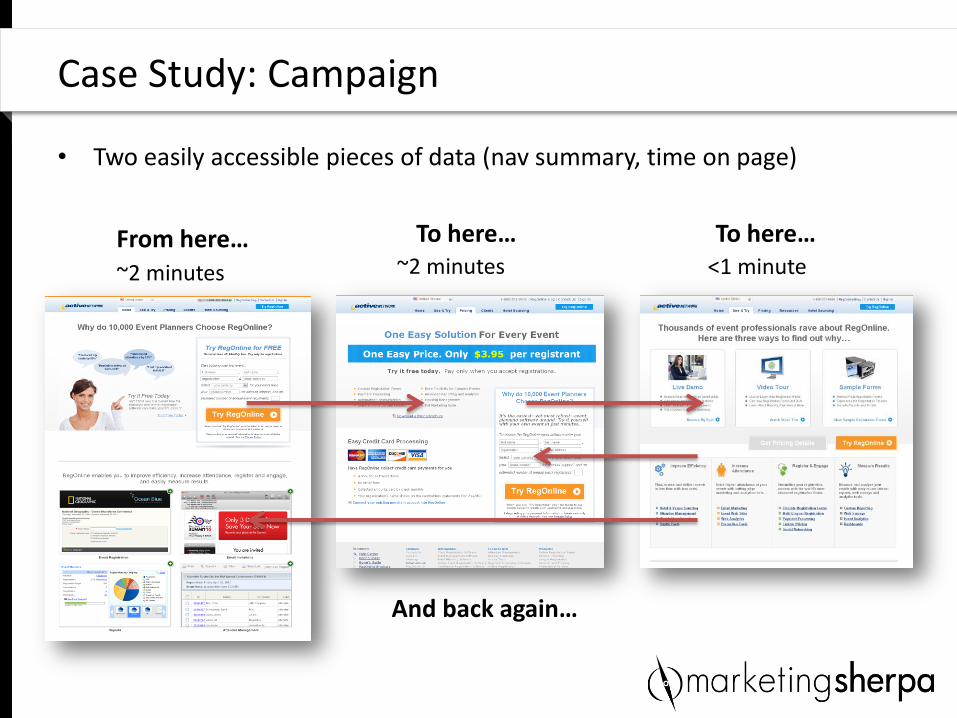
• Two easily accessible pieces of data (nav summary, time on page)
Case Study: Campaign
~2 minutes ~2 minutes <1 minute From here… To here… To here…
And back again…
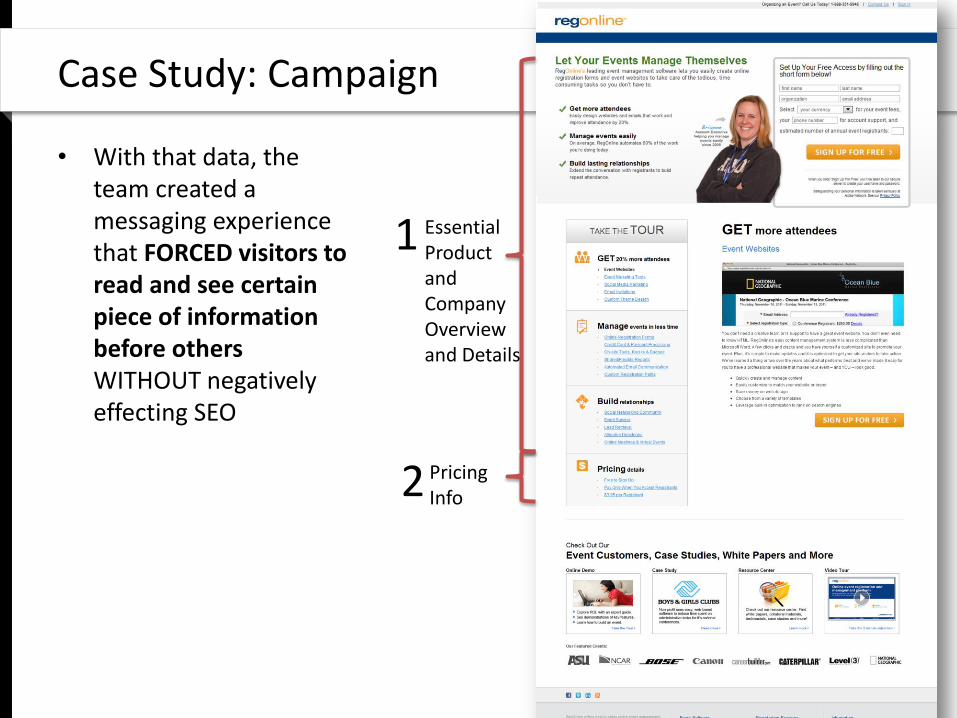
• With that data, the team created a messaging experience that FORCED visitors to read and see certain piece of information before others WITHOUT negatively effecting SEO
Case Study: Campaign
Essential Product and Company Overview and Details
Pricing Info
1
2
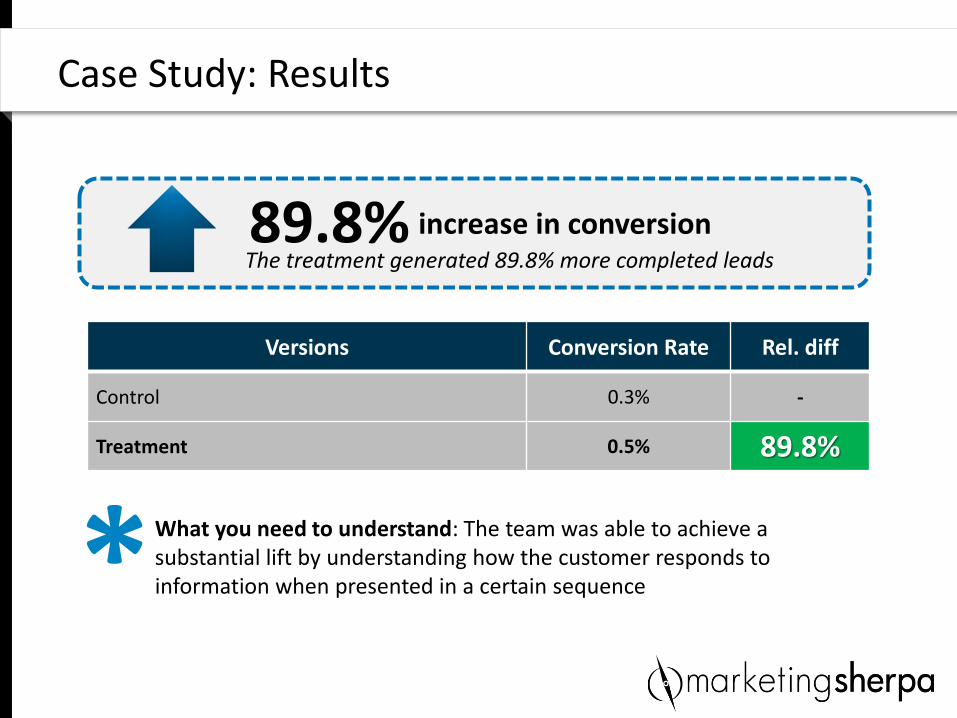
Case Study: Results
Versions Conversion Rate Rel. diff
Control 0.3% -
Treatment 0.5% 89.8%
What you need to understand: The team was able to achieve a substantial lift by understanding how the customer responds to information when presented in a certain sequence
increase in conversion
The treatment generated 89.8% more completed leads 89.8%
*
• You don’t need to throw everything (including the kitchen sink) at something to get messaging the performs positively
• To get the effect of an analysis for a minimal amount of effort, transform your analytics bento box and into a pyramid
Forget the analysis paralysis
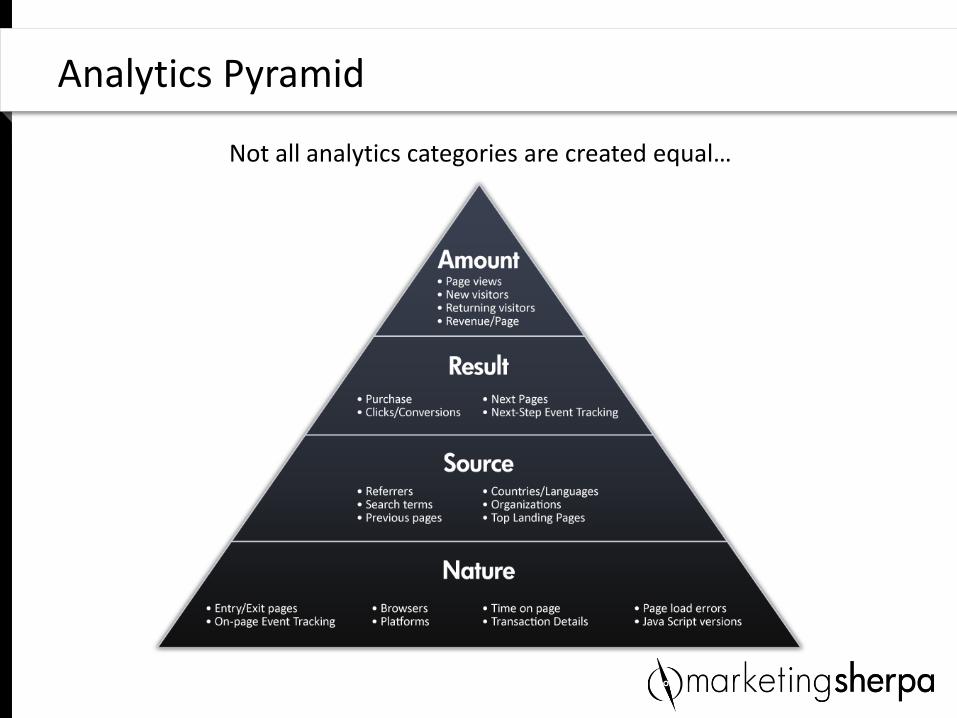
Analytics Pyramid
Not all analytics categories are created equal…
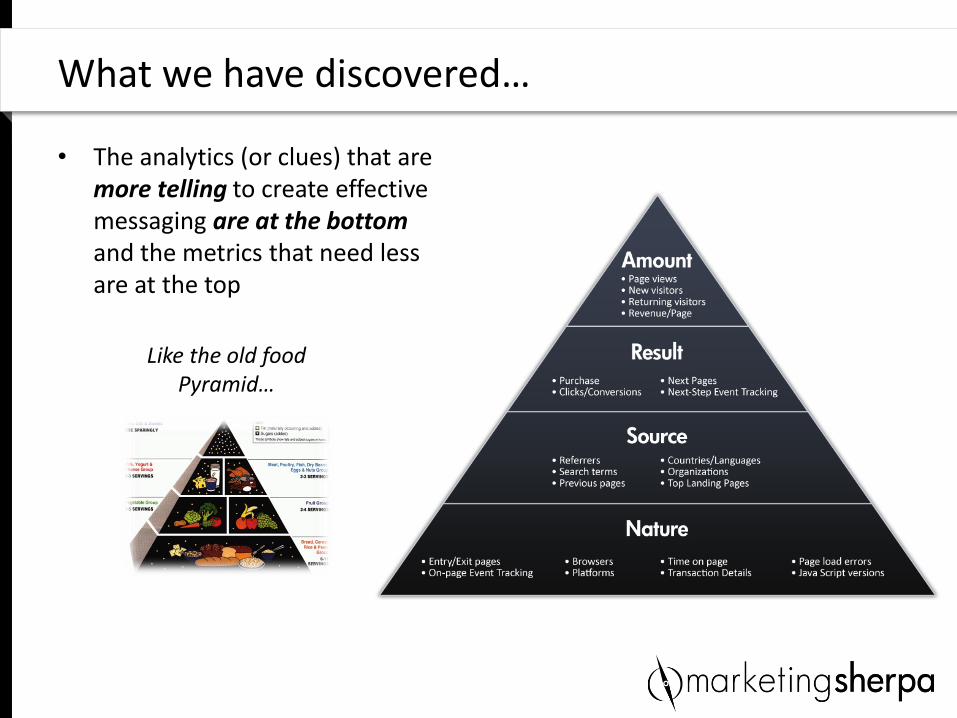
• The analytics (or clues) that are more telling to create effective messaging are at the bottom and the metrics that need less are at the top
What we have discovered…
Like the old food Pyramid…
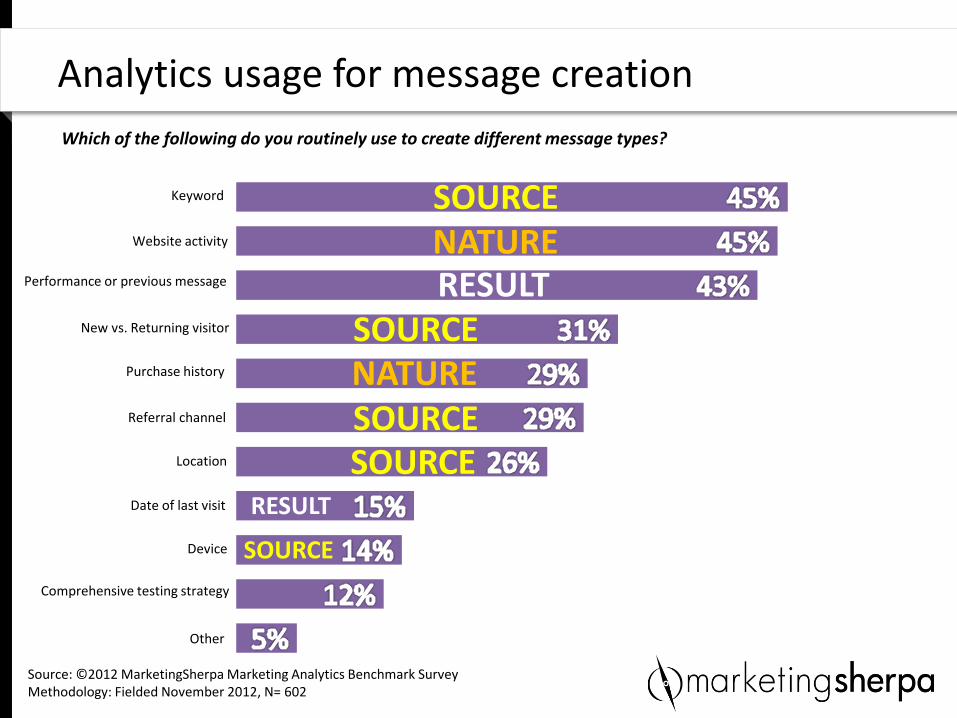
Analytics usage for message creation
Which of the following do you routinely use to create different message types?
Source: ©2012 MarketingSherpa Marketing Analytics Benchmark Survey Methodology: Fielded November 2012, N= 602
Keyword
Website activity
Performance or previous message
Purchase history
Referral channel
Location
Device
Comprehensive testing strategy
Other
New vs. Returning visitor
Date of last visit
SOURCE NATURE
SOURCE NATURE SOURCE SOURCE
SOURCE
RESULT
RESULT
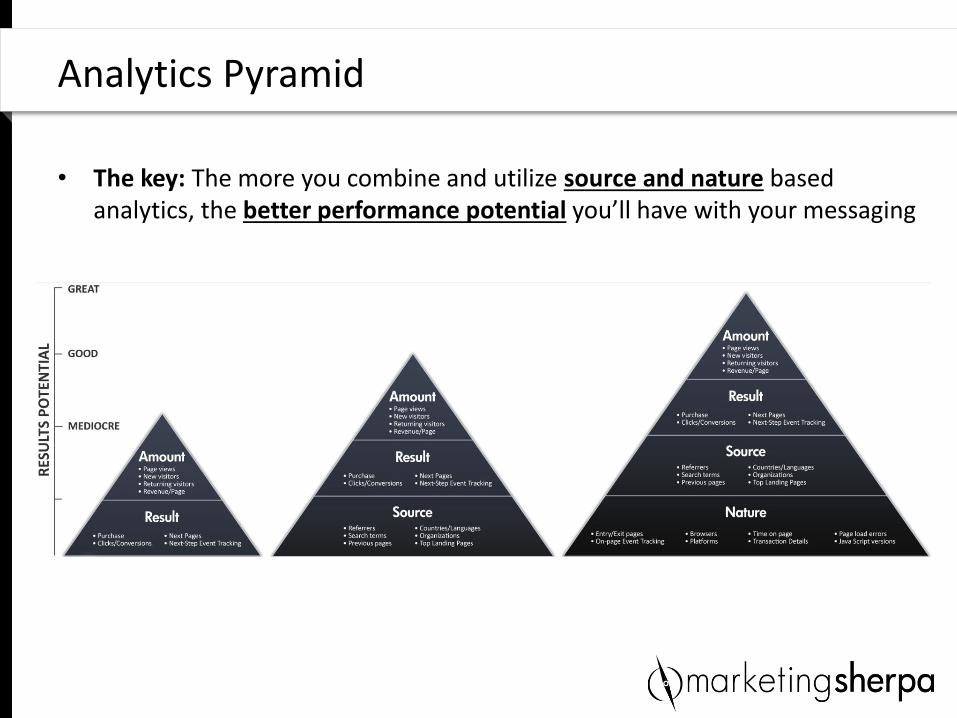
• The key: The more you combine and utilize source and nature based analytics, the better performance potential you’ll have with your messaging
Analytics Pyramid
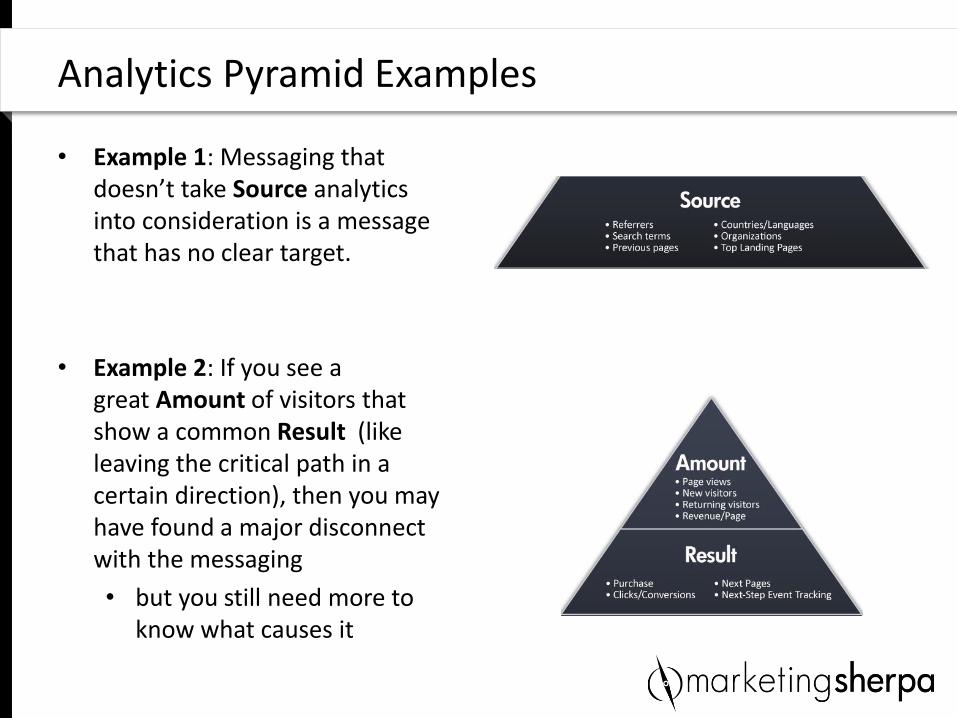
• Example 1: Messaging that doesn’t take Source analytics into consideration is a message that has no clear target.
• Example 2: If you see a great Amount of visitors that show a common Result (like leaving the critical path in a certain direction), then you may have found a major disconnect with the messaging
• but you still need more to know what causes it
Analytics Pyramid Examples
POINT 4: Stop focusing on tools and start focusing on visibility
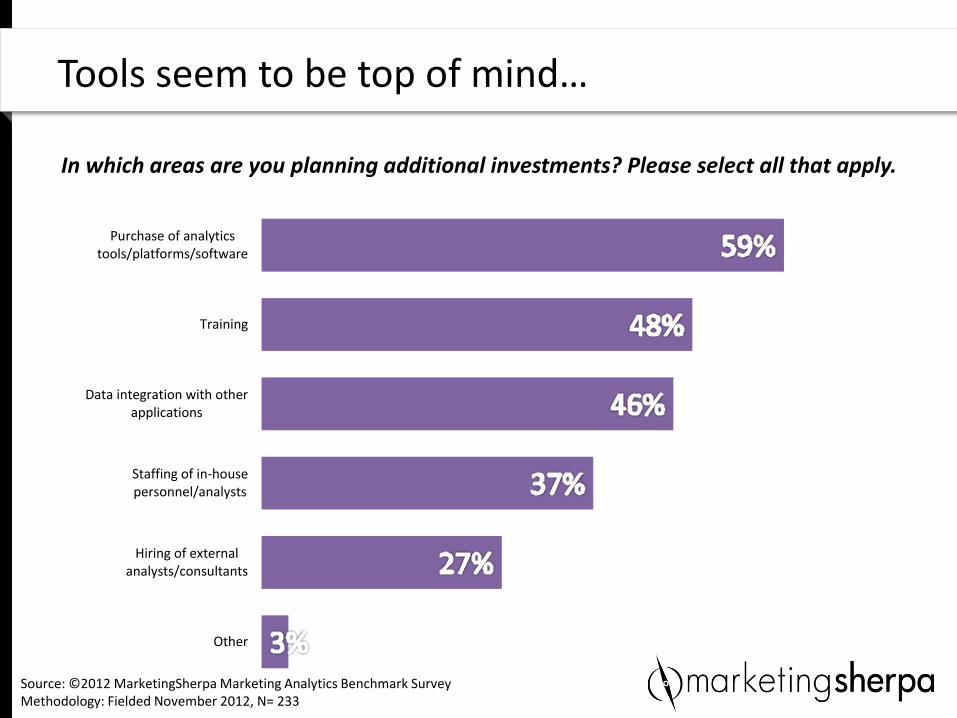
Tools seem to be top of mind…
Purchase of analyticstools/platforms/software
Training
Data integration with otherapplications
Staffing of in-housepersonnel/analysts
Hiring of externalanalysts/consultants
Other
In which areas are you planning additional investments? Please select all that apply.
Source: ©2012 MarketingSherpa Marketing Analytics Benchmark Survey Methodology: Fielded November 2012, N= 233
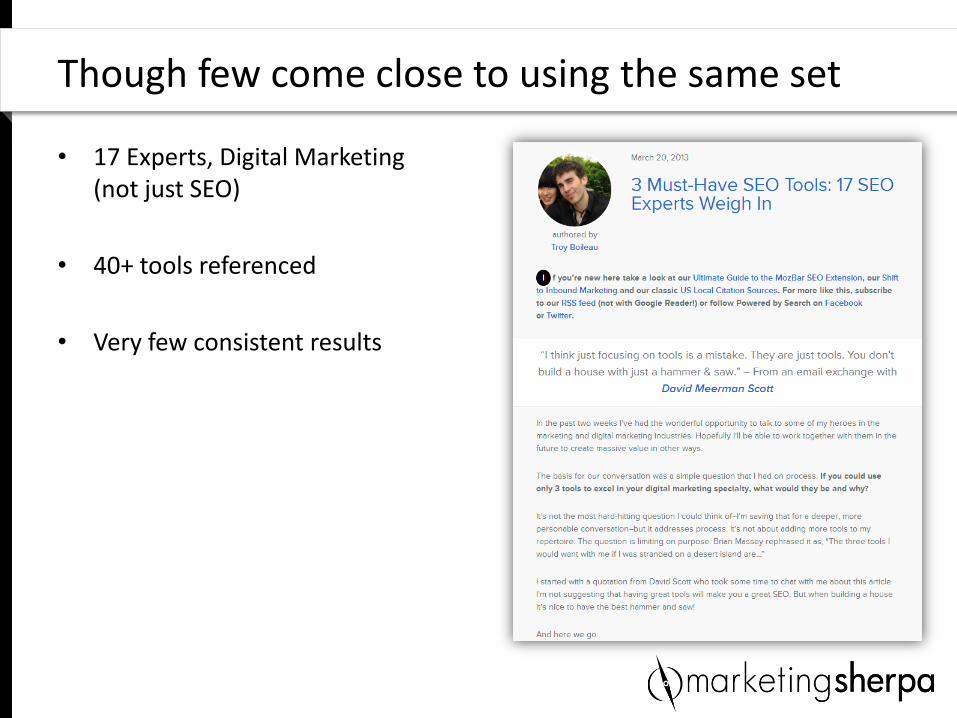
• 17 Experts, Digital Marketing (not just SEO)
• 40+ tools referenced
• Very few consistent results
Though few come close to using the same set
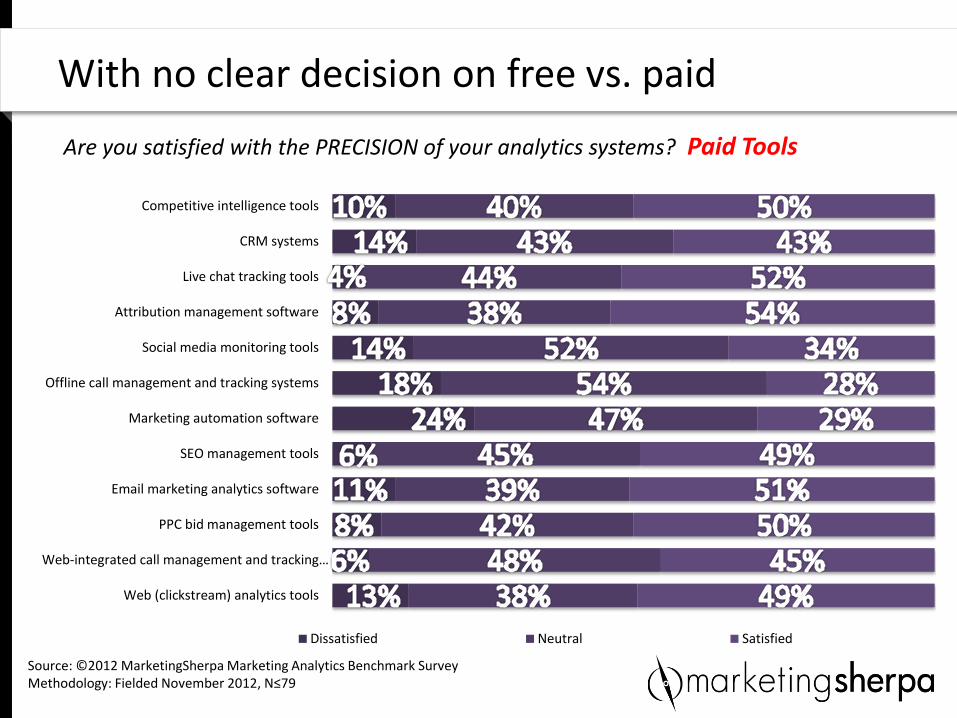
With no clear decision on free vs. paid
Are you satisfied with the PRECISION of your analytics systems? Paid Tools
Source: ©2012 MarketingSherpa Marketing Analytics Benchmark Survey Methodology: Fielded November 2012, N≤79
Web (clickstream) analytics tools
Web-integrated call management and tracking…
PPC bid management tools
Email marketing analytics software
SEO management tools
Marketing automation software
Offline call management and tracking systems
Social media monitoring tools
Attribution management software
Live chat tracking tools
CRM systems
Competitive intelligence tools
Dissatisfied Neutral Satisfied
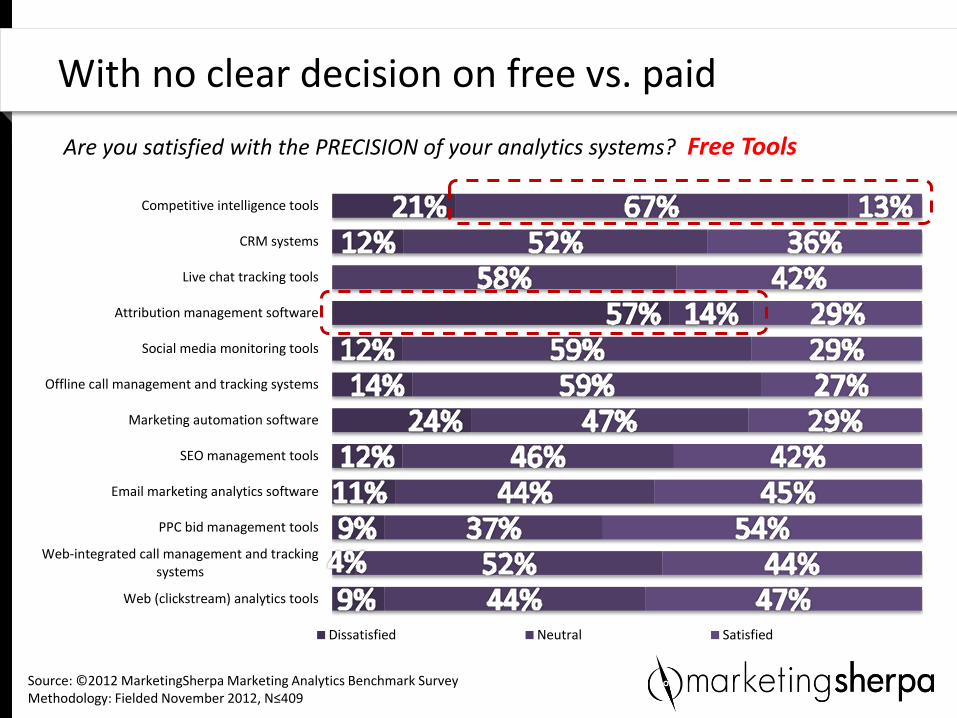
With no clear decision on free vs. paid
Are you satisfied with the PRECISION of your analytics systems? Free Tools
Web (clickstream) analytics tools
Web-integrated call management and trackingsystems
PPC bid management tools
Email marketing analytics software
SEO management tools
Marketing automation software
Offline call management and tracking systems
Social media monitoring tools
Attribution management software
Live chat tracking tools
CRM systems
Competitive intelligence tools
Dissatisfied Neutral Satisfied
Source: ©2012 MarketingSherpa Marketing Analytics Benchmark Survey Methodology: Fielded November 2012, N≤409
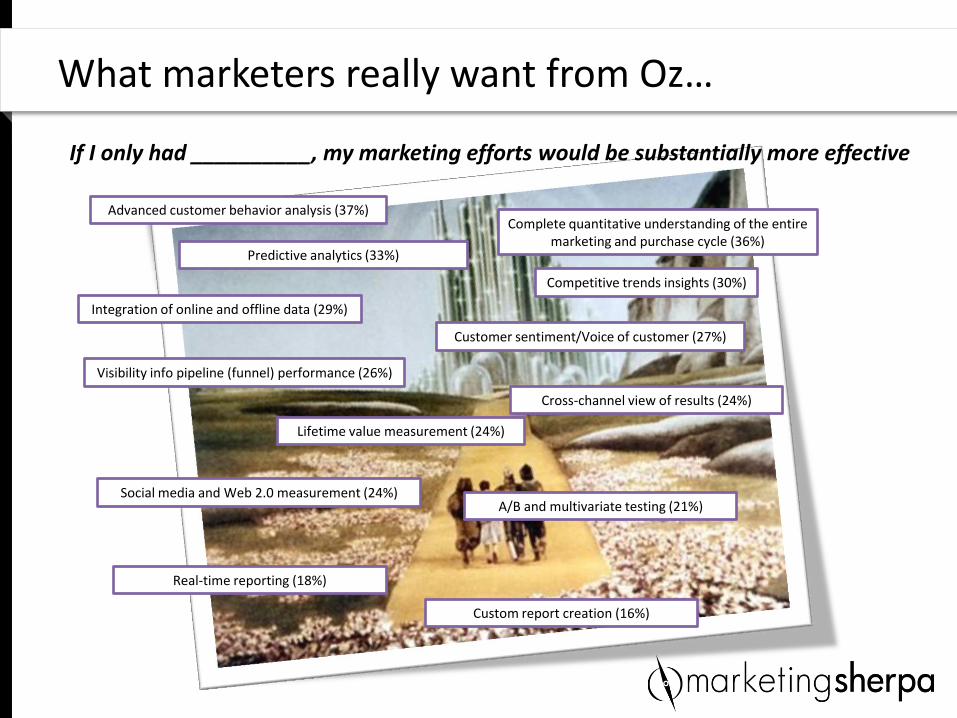
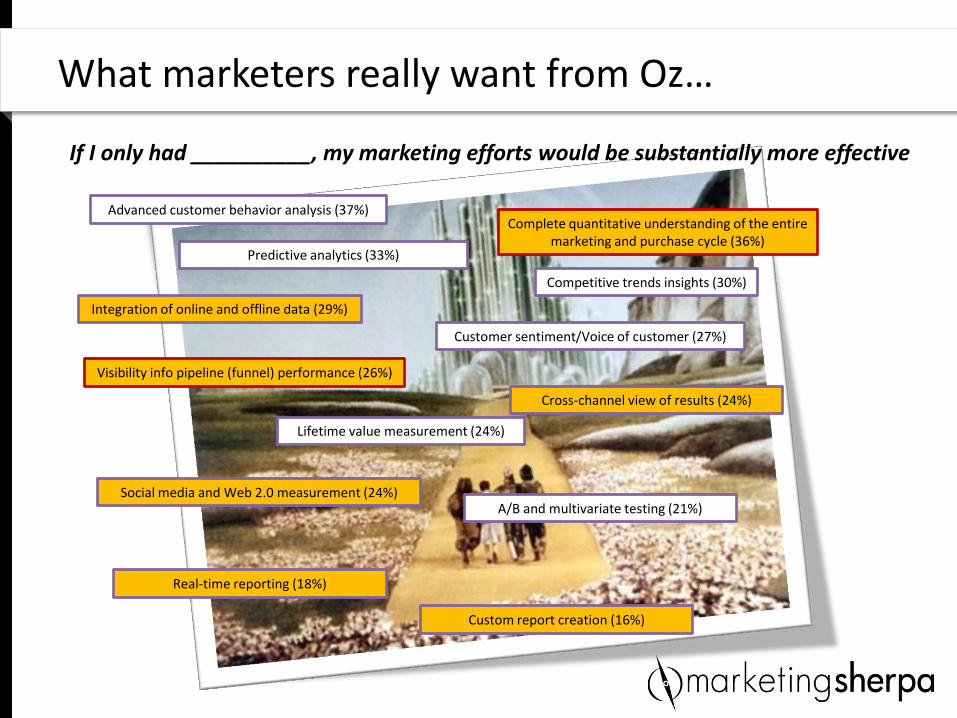
What marketers really want from Oz…
If I only had __________, my marketing efforts would be substantially more effective
Advanced customer behavior analysis (37%) Complete quantitative understanding of the entire
marketing and purchase cycle (36%) Predictive analytics (33%)
Competitive trends insights (30%)
Customer sentiment/Voice of customer (27%)
Visibility info pipeline (funnel) performance (26%)
Cross-channel view of results (24%)
Social media and Web 2.0 measurement (24%) A/B and multivariate testing (21%)
Integration of online and offline data (29%)
Lifetime value measurement (24%)
Real-time reporting (18%)
Custom report creation (16%)
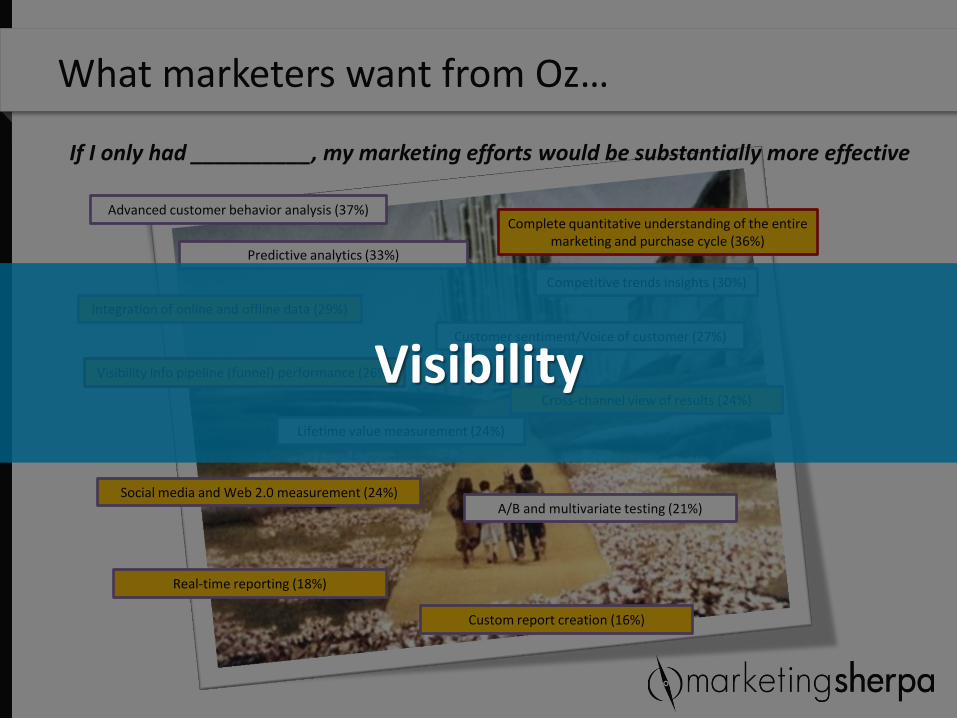
What marketers want from Oz…
If I only had __________, my marketing efforts would be substantially more effective
Advanced customer behavior analysis (37%) Complete quantitative understanding of the entire
marketing and purchase cycle (36%) Predictive analytics (33%)
Competitive trends insights (30%)
Customer sentiment/Voice of customer (27%)
Visibility info pipeline (funnel) performance (26%)
Cross-channel view of results (24%)
Social media and Web 2.0 measurement (24%) A/B and multivariate testing (21%)
Integration of online and offline data (29%)
Lifetime value measurement (24%)
Real-time reporting (18%)
Custom report creation (16%)
Visibility
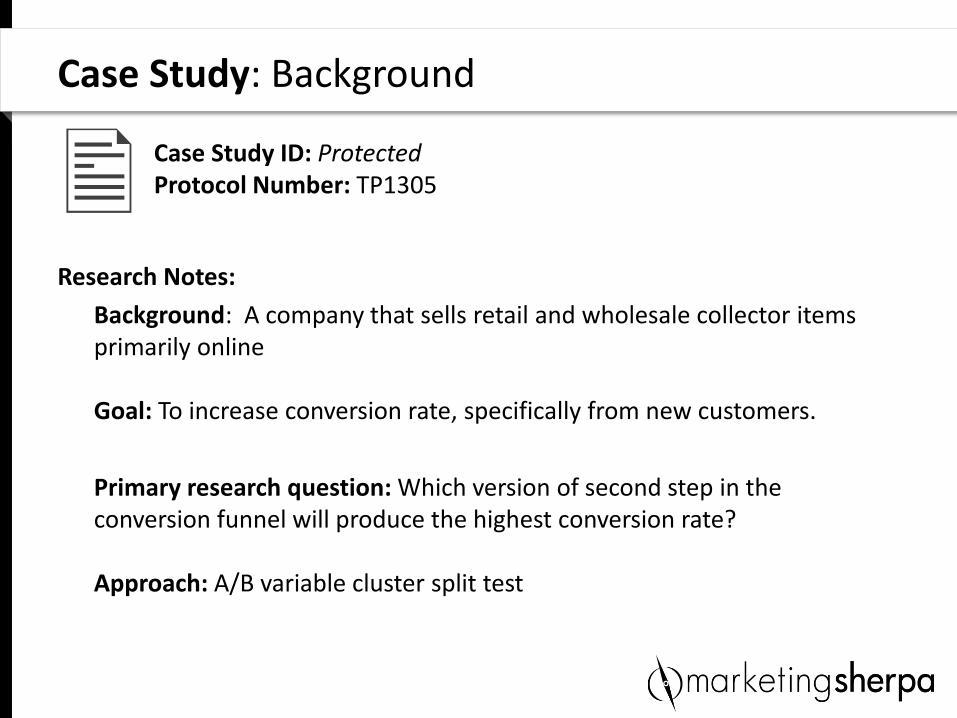
Research Notes:
Background: A company that sells retail and wholesale collector items primarily online Goal: To increase conversion rate, specifically from new customers.
Primary research question: Which version of second step in the conversion funnel will produce the highest conversion rate? Approach: A/B variable cluster split test
Case Study: Background
Case Study ID: Protected Protocol Number: TP1305
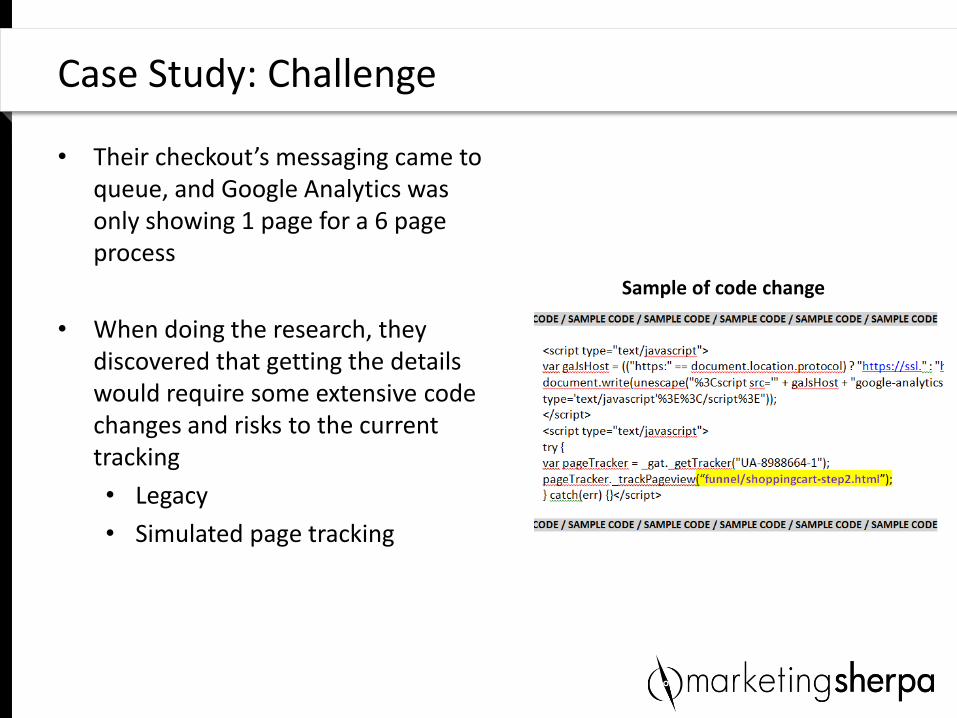
• Their checkout’s messaging came to queue, and Google Analytics was only showing 1 page for a 6 page process
• When doing the research, they discovered that getting the details would require some extensive code changes and risks to the current tracking
• Legacy
• Simulated page tracking
Case Study: Challenge
Sample of code change
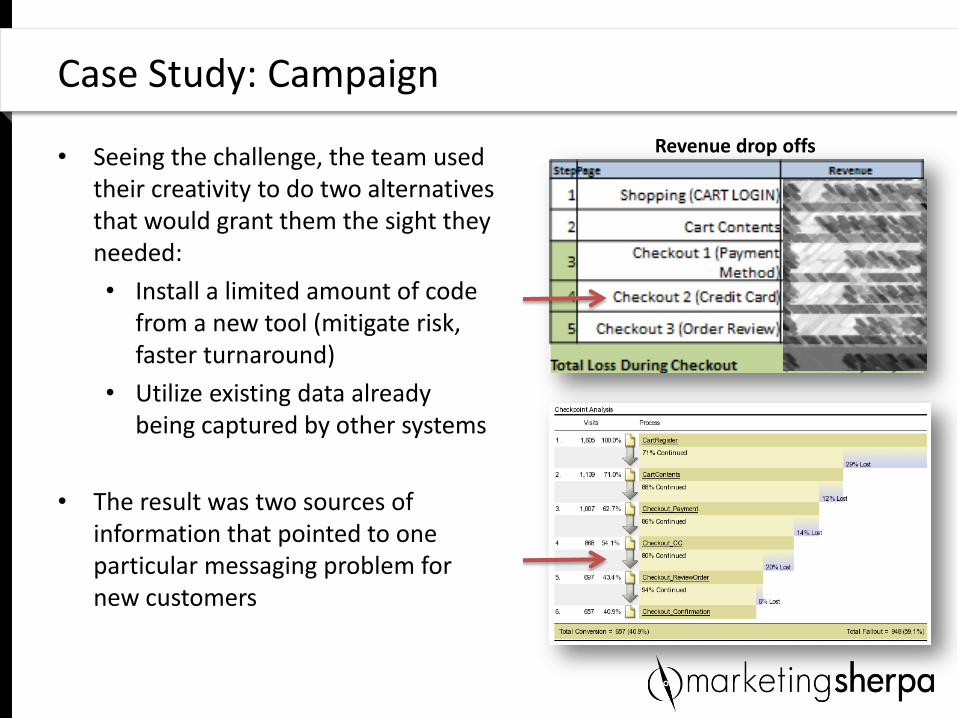
• Seeing the challenge, the team used their creativity to do two alternatives that would grant them the sight they needed:
• Install a limited amount of code from a new tool (mitigate risk, faster turnaround)
• Utilize existing data already being captured by other systems
• The result was two sources of information that pointed to one particular messaging problem for new customers
Case Study: Campaign
Revenue drop offs
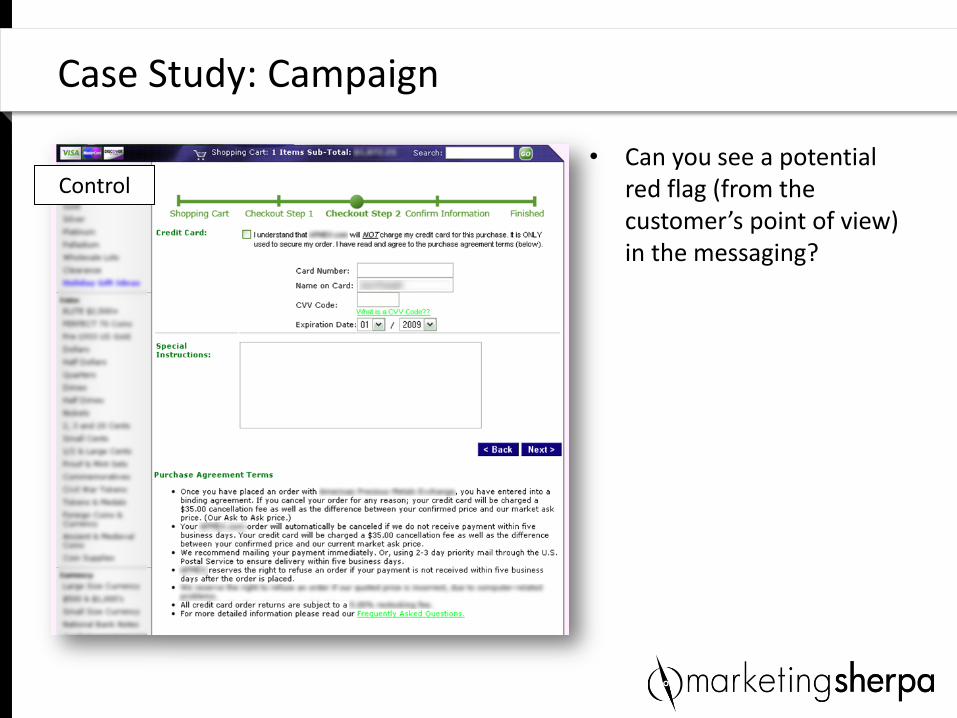
• Can you see a potential red flag (from the customer’s point of view) in the messaging?
Case Study: Campaign
Control
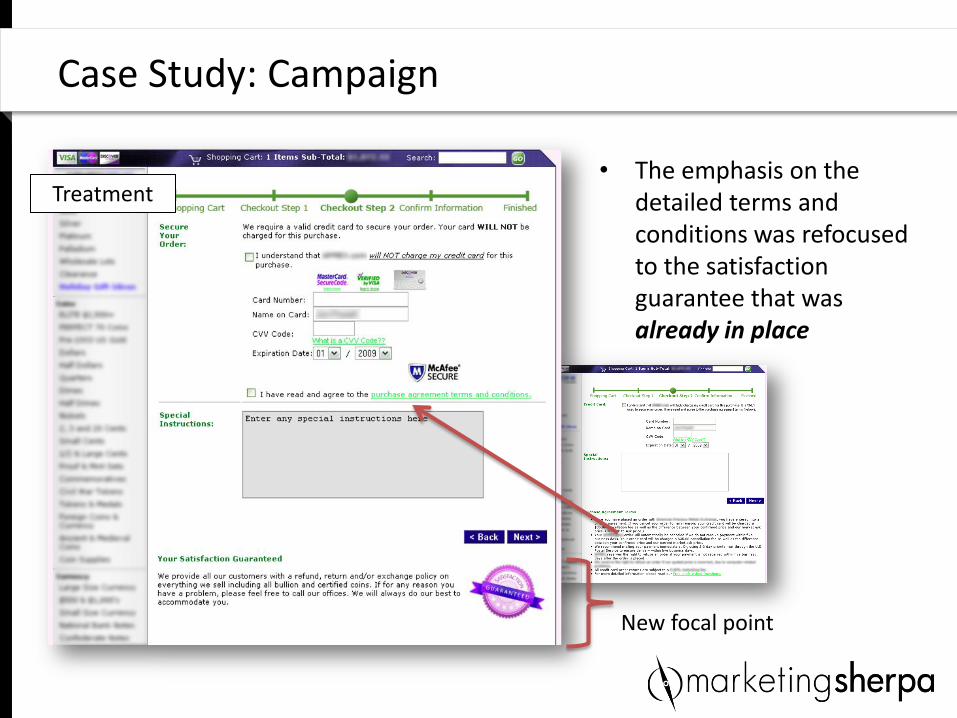
• The emphasis on the detailed terms and conditions was refocused to the satisfaction guarantee that was already in place
Case Study: Campaign
Treatment
New focal point
Case Study: Results
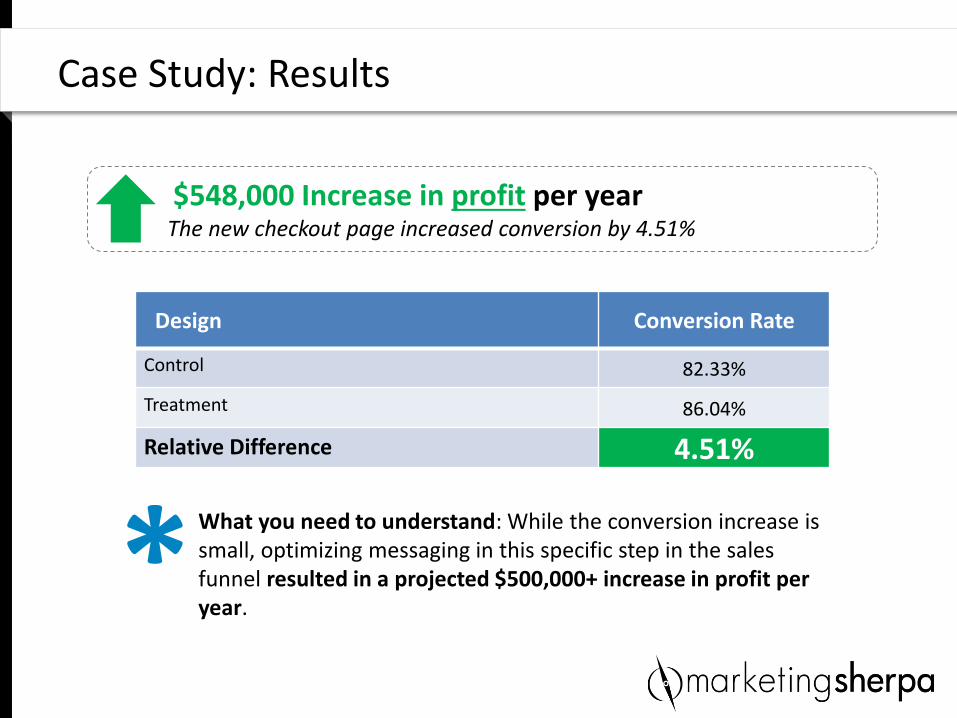
Design Conversion Rate
Control 82.33%
Treatment 86.04%
Relative Difference 4.51%
$548,000 Increase in profit per year The new checkout page increased conversion by 4.51%
What you need to understand: While the conversion increase is small, optimizing messaging in this specific step in the sales funnel resulted in a projected $500,000+ increase in profit per year. *
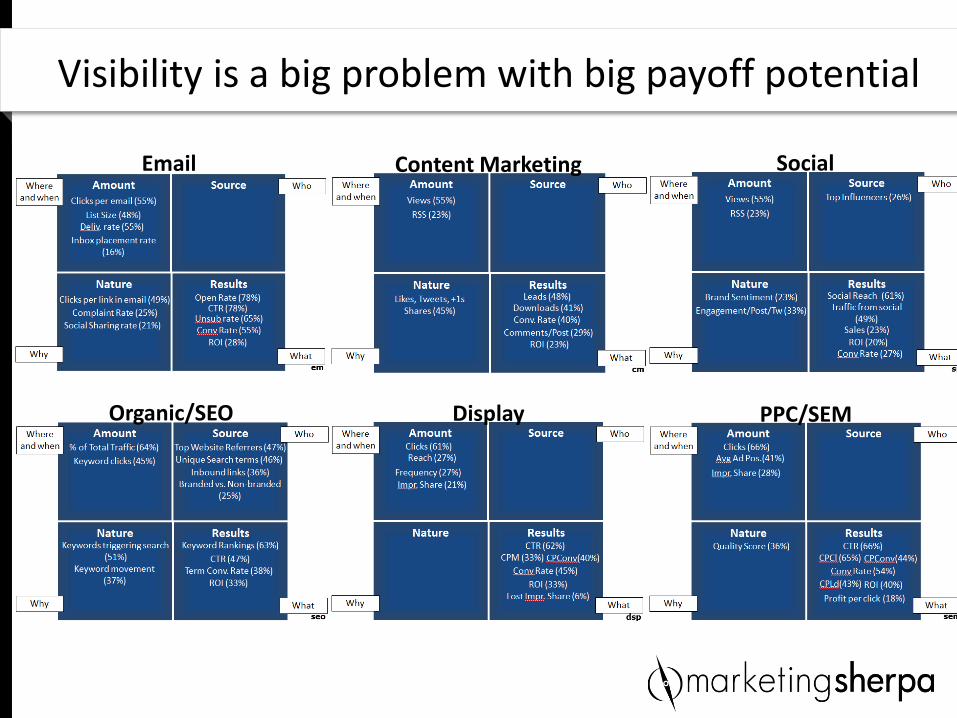
Visibility is a big problem with big payoff potential
Email Content Marketing Social
Organic/SEO Display PPC/SEM
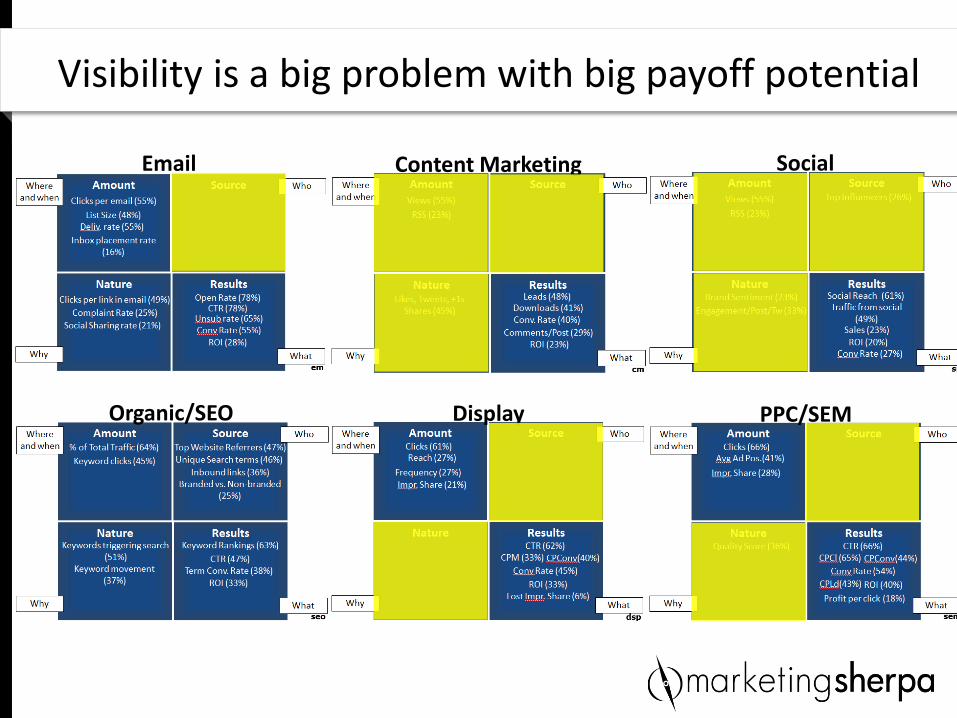
Email Content Marketing Social
Organic/SEO Display PPC/SEM
Visibility is a big problem with big payoff potential
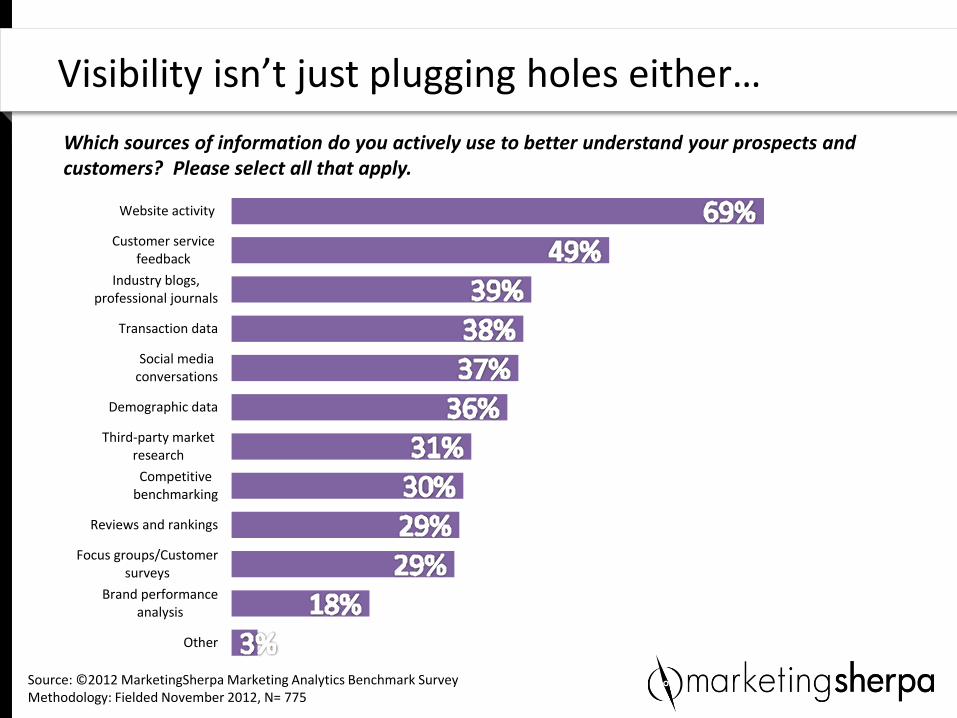
Visibility isn’t just plugging holes either…
Website activity
Customer servicefeedback
Industry blogs,professional journals
Transaction data
Social mediaconversations
Demographic data
Third-party marketresearch
Competitivebenchmarking
Reviews and rankings
Focus groups/Customersurveys
Brand performanceanalysis
Other
Source: ©2012 MarketingSherpa Marketing Analytics Benchmark Survey Methodology: Fielded November 2012, N= 775
Which sources of information do you actively use to better understand your prospects and customers? Please select all that apply.

KEY PRINCIPLES
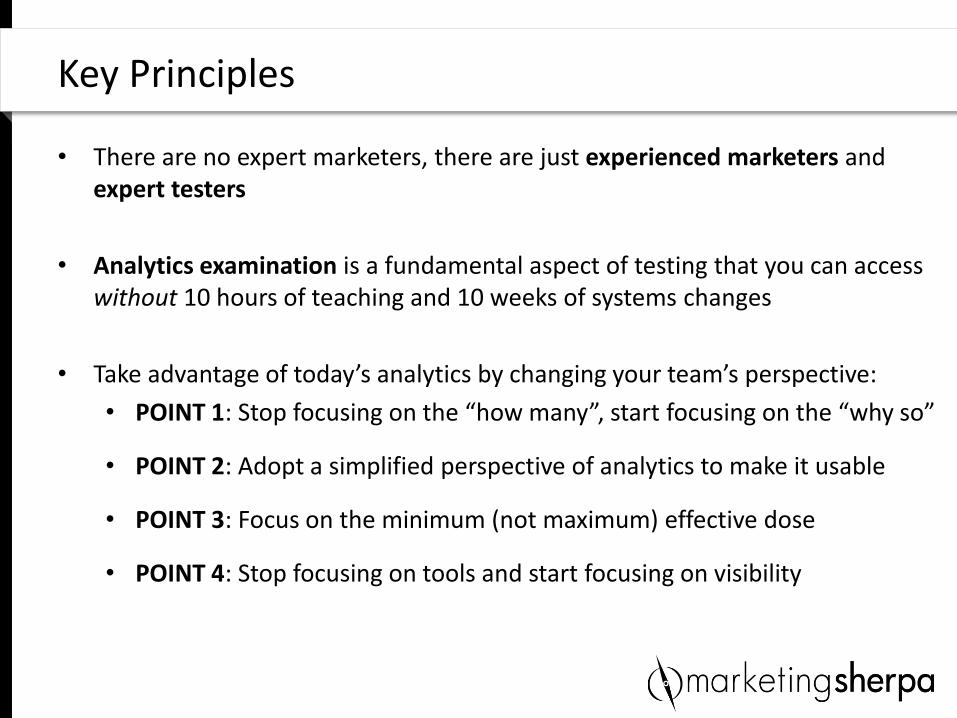
• There are no expert marketers, there are just experienced marketers and expert testers
• Analytics examination is a fundamental aspect of testing that you can access without 10 hours of teaching and 10 weeks of systems changes
• Take advantage of today’s analytics by changing your team’s perspective:
• POINT 1: Stop focusing on the “how many”, start focusing on the “why so”
• POINT 2: Adopt a simplified perspective of analytics to make it usable
• POINT 3: Focus on the minimum (not maximum) effective dose
• POINT 4: Stop focusing on tools and start focusing on visibility
Key Principles