applied climatology vs. applied meteorology from the ams glossary: applied meteorology—a field of...
TRANSCRIPT
Applied climatology vs. applied meteorology
From the AMS glossary: applied meteorology—A field of study where weather data,
analyses, and forecasts are put to practical use. Examples of applications include environmental health, weather modification, air pollution meteorology, agricultural and forest meteorology, transportation, value-added product development and display, and all aspects of industrial meteorology.
applied climatology—The scientific analysis of climatic data in the light of a useful application for an operational purpose. “Operational” is interpreted as any specialized endeavor within such as industrial, manufacturing, agricultural, or technological pursuits… This is the general term for all such work and includes agricultural climatology, aviation climatology, bioclimatology, industrial climatology, and others.
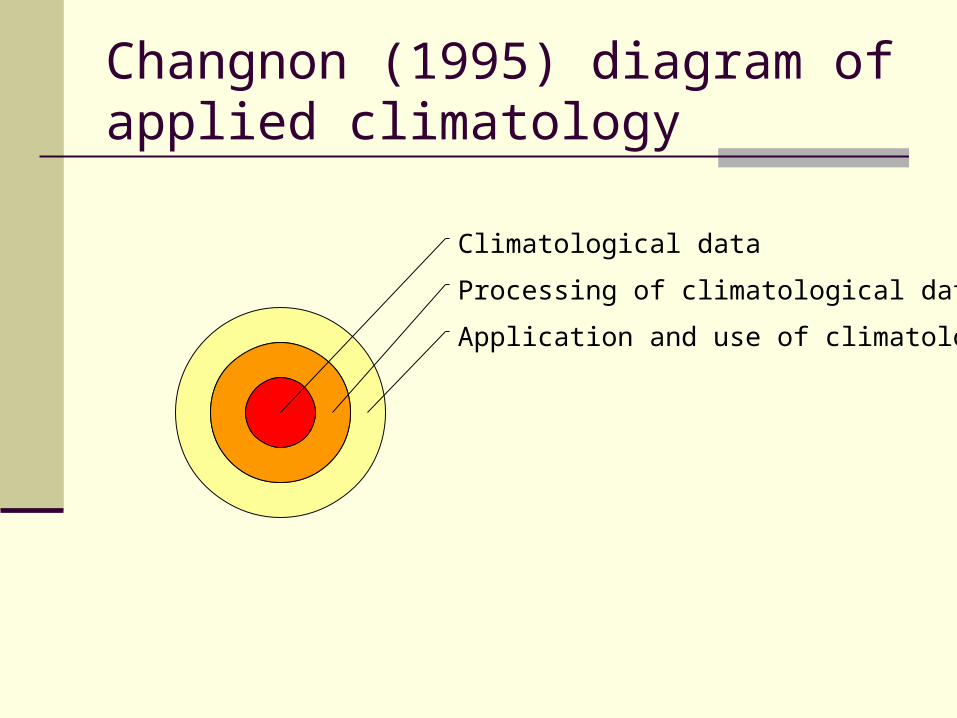
Changnon (1995) diagram of applied climatology
Application and use of climatological data
Processing of climatological data
Climatological data
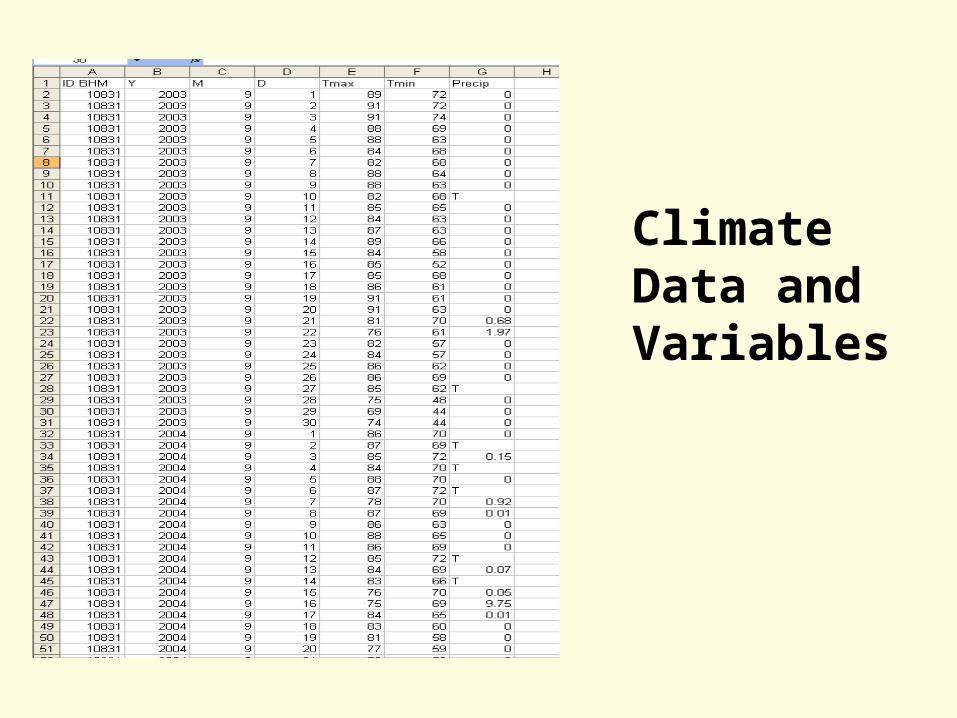
Climate Data and Variables
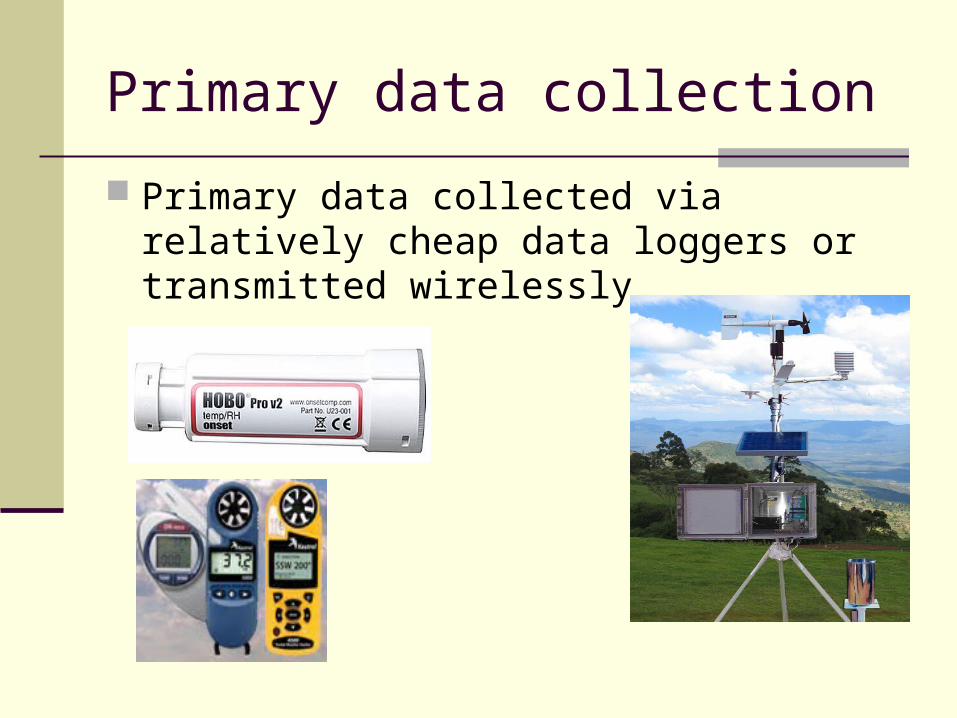
Primary data collection
Primary data collected via relatively cheap data loggers or transmitted wirelessly
Secondary data collection
Most common method
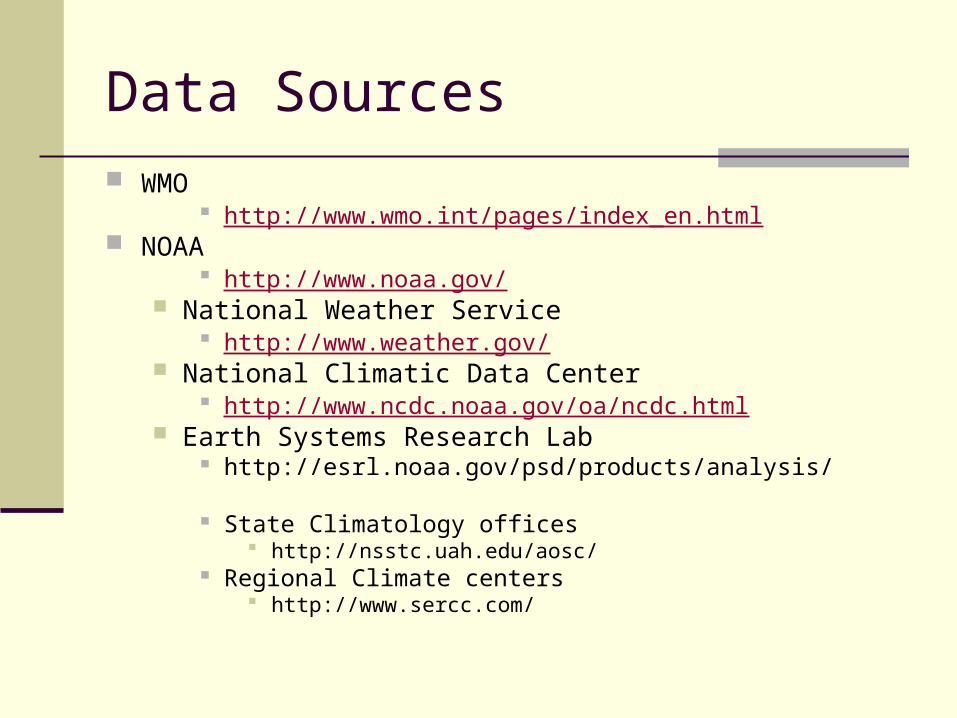
Data Sources WMO
http://www.wmo.int/pages/index_en.html NOAA
http://www.noaa.gov/ National Weather Service
http://www.weather.gov/ National Climatic Data Center
http://www.ncdc.noaa.gov/oa/ncdc.html Earth Systems Research Lab
http://esrl.noaa.gov/psd/products/analysis/
State Climatology offices http://nsstc.uah.edu/aosc/
Regional Climate centers http://www.sercc.com/
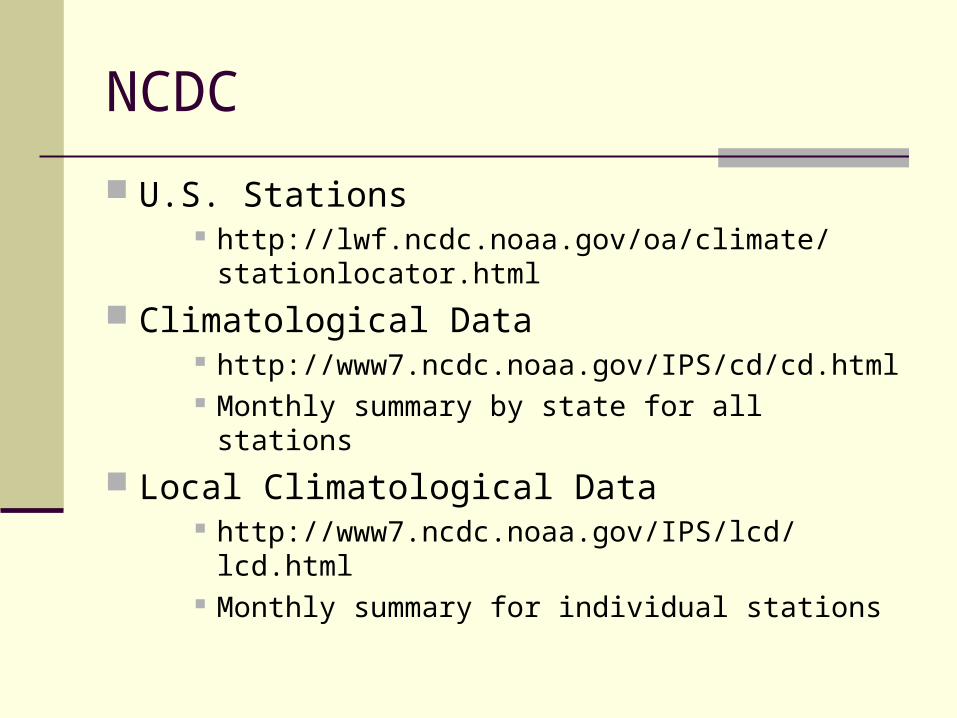
NCDC
U.S. Stations http://lwf.ncdc.noaa.gov/oa/climate/
stationlocator.html
Climatological Data http://www7.ncdc.noaa.gov/IPS/cd/cd.html Monthly summary by state for all stations
Local Climatological Data http://www7.ncdc.noaa.gov/IPS/lcd/lcd.html Monthly summary for individual stations
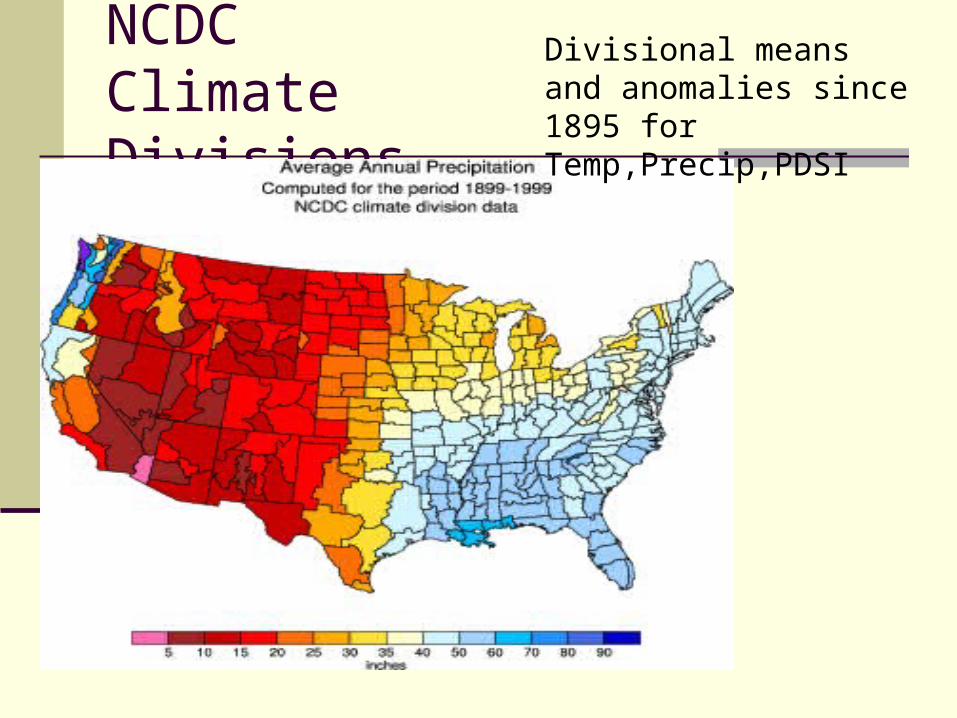
NCDC Climate Divisions
Divisional means and anomalies since 1895 forTemp,Precip,PDSI
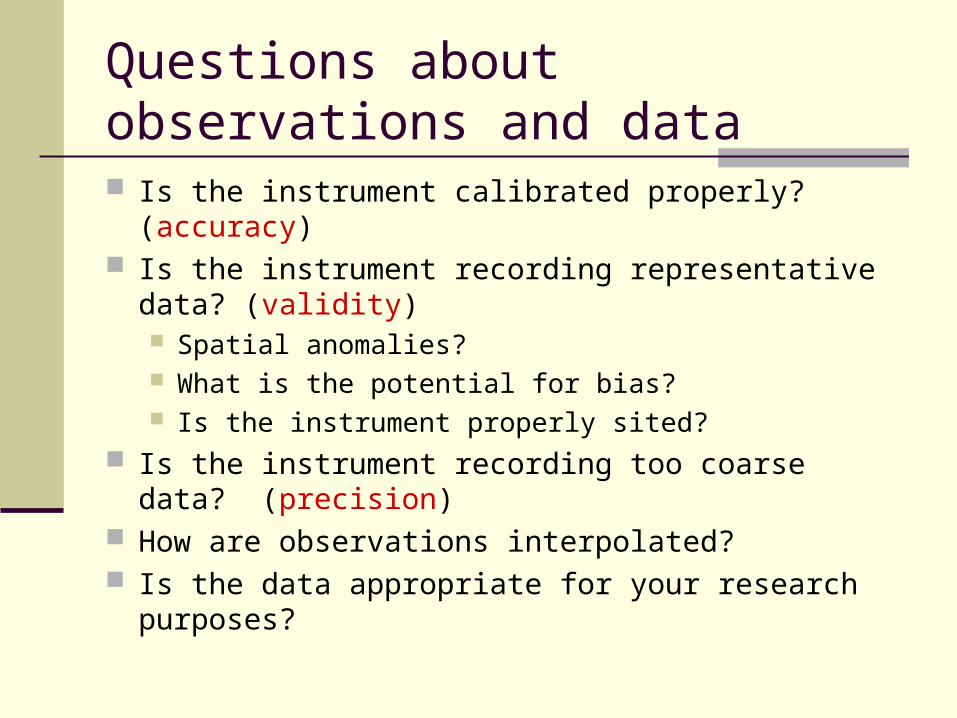
Questions about observations and data
Is the instrument calibrated properly? (accuracy) Is the instrument recording representative data?
(validity) Spatial anomalies? What is the potential for bias? Is the instrument properly sited?
Is the instrument recording too coarse data? (precision)
How are observations interpolated? Is the data appropriate for your research purposes?
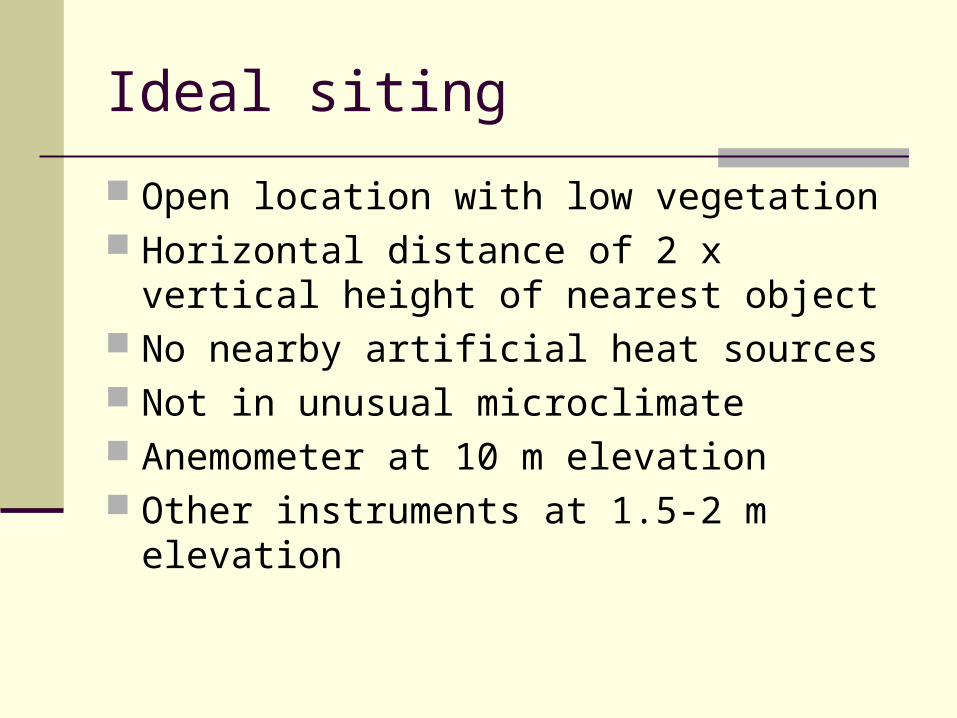
Ideal siting
Open location with low vegetation Horizontal distance of 2 x vertical height of
nearest object No nearby artificial heat sources Not in unusual microclimate Anemometer at 10 m elevation Other instruments at 1.5-2 m elevation
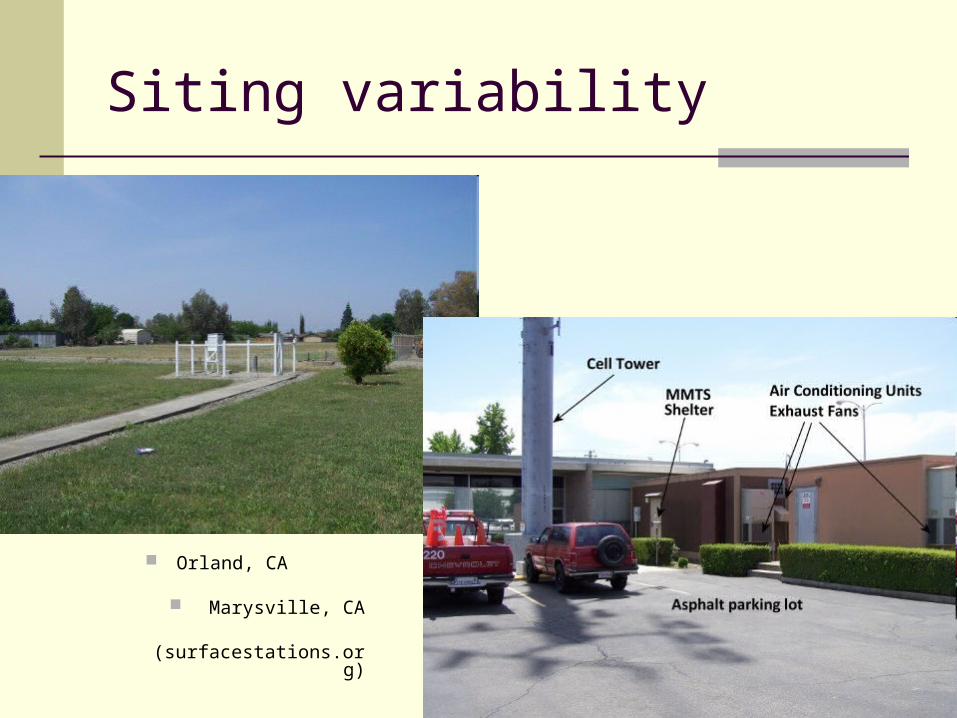
Siting variability
Orland, CA
Marysville, CA
(surfacestations.org)
Issues over time
Stations move Surroundings change Instrumentation change Observation changes
Time Frequency
Time of observation bias
24-hour observations taken at: Midnight (all first-order stations) Early morning (6am-8am) – especially farm
stations Evening (6pm-10pm)
Types of stations
First-order station: measures primary weather variables more or less continuously, reporting hourly (at least)
Second-order station: same as first-order, though usually less than 24 hour coverage
Cooperative station: usually takes observations one time per day
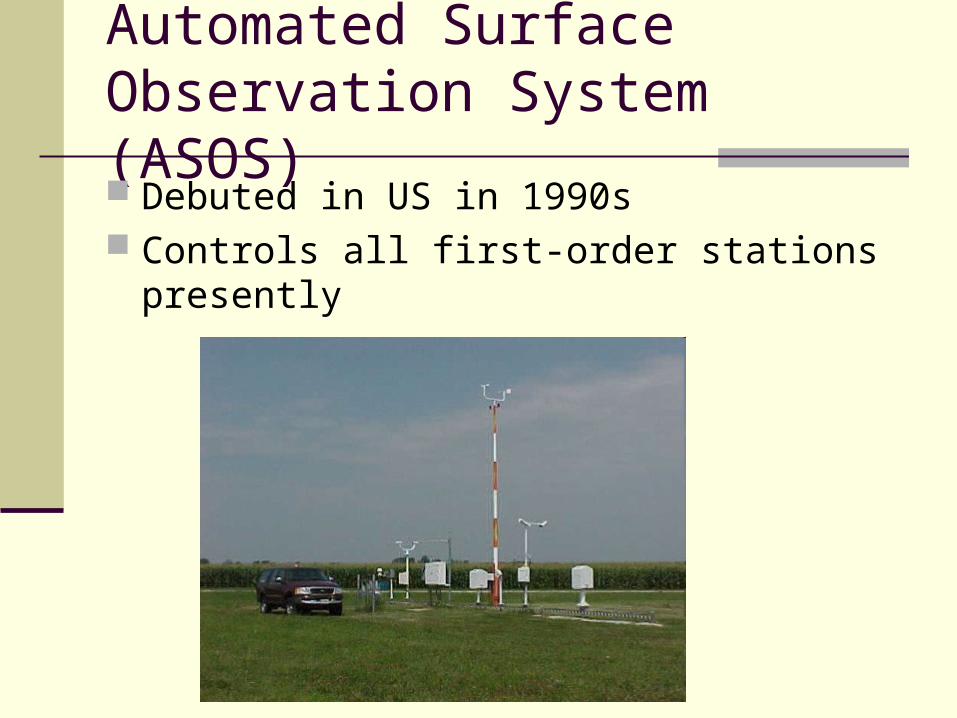
Automated Surface Observation System (ASOS) Debuted in US in 1990s Controls all first-order stations presently
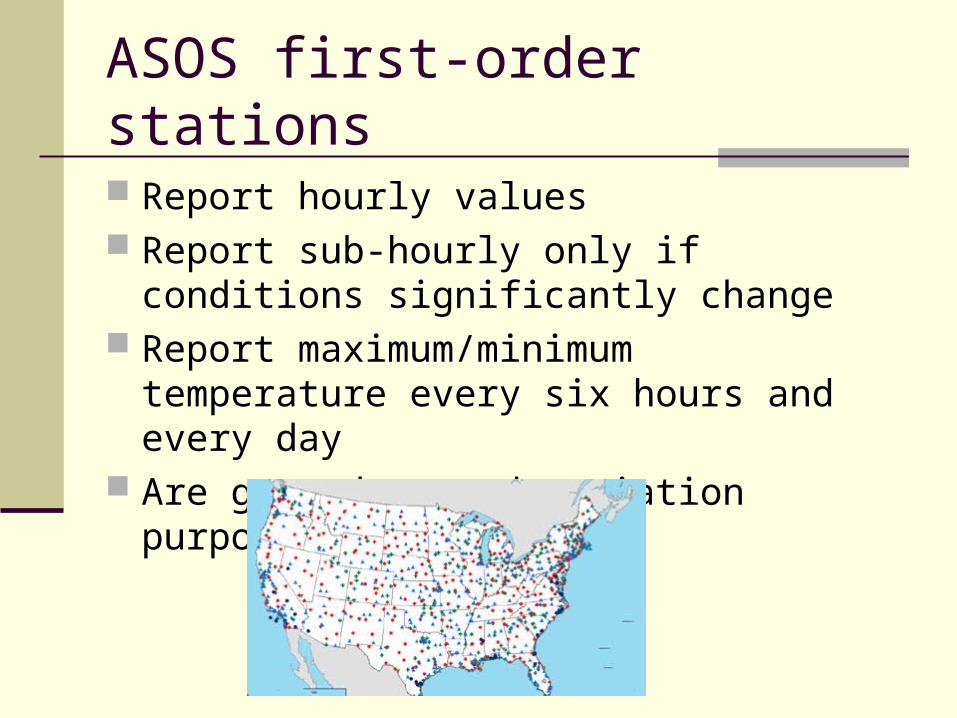
ASOS first-order stations
Report hourly values Report sub-hourly only if conditions
significantly change Report maximum/minimum temperature every
six hours and every day Are geared towards aviation purposes
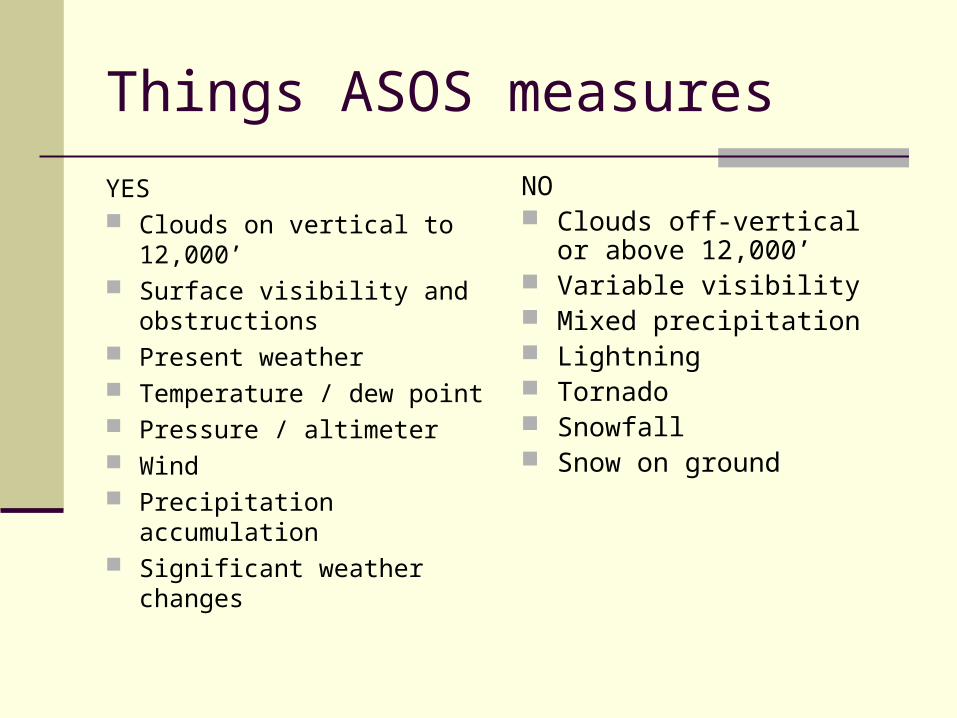
Things ASOS measures
YES Clouds on vertical to 12,000’ Surface visibility and
obstructions Present weather Temperature / dew point Pressure / altimeter Wind Precipitation accumulation Significant weather changes
NO Clouds off-vertical or above
12,000’ Variable visibility Mixed precipitation Lightning Tornado Snowfall Snow on ground
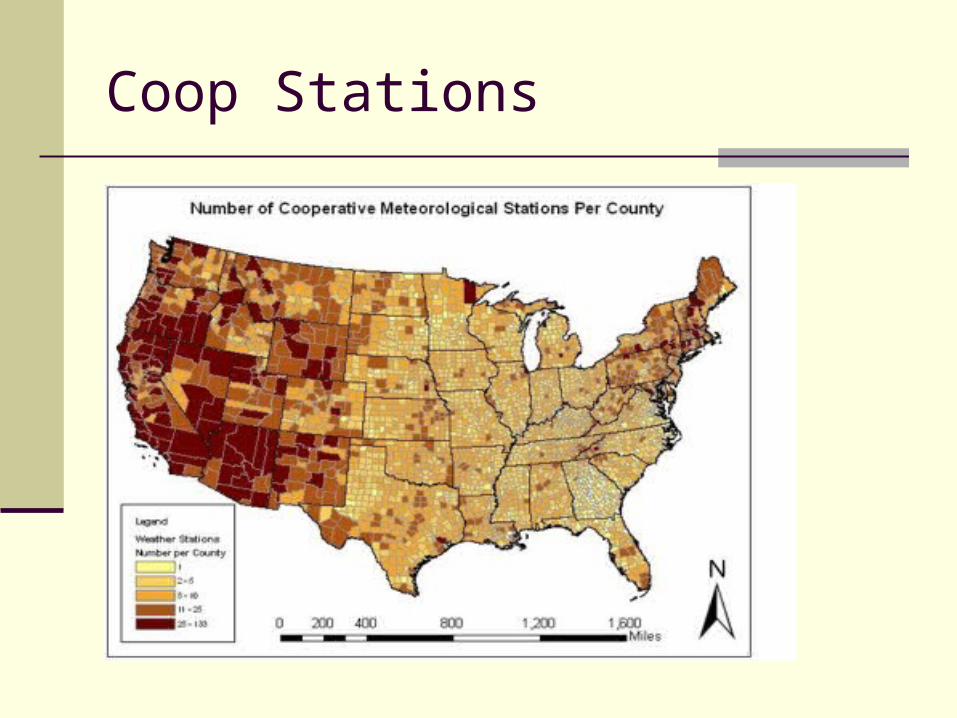
Coop Stations
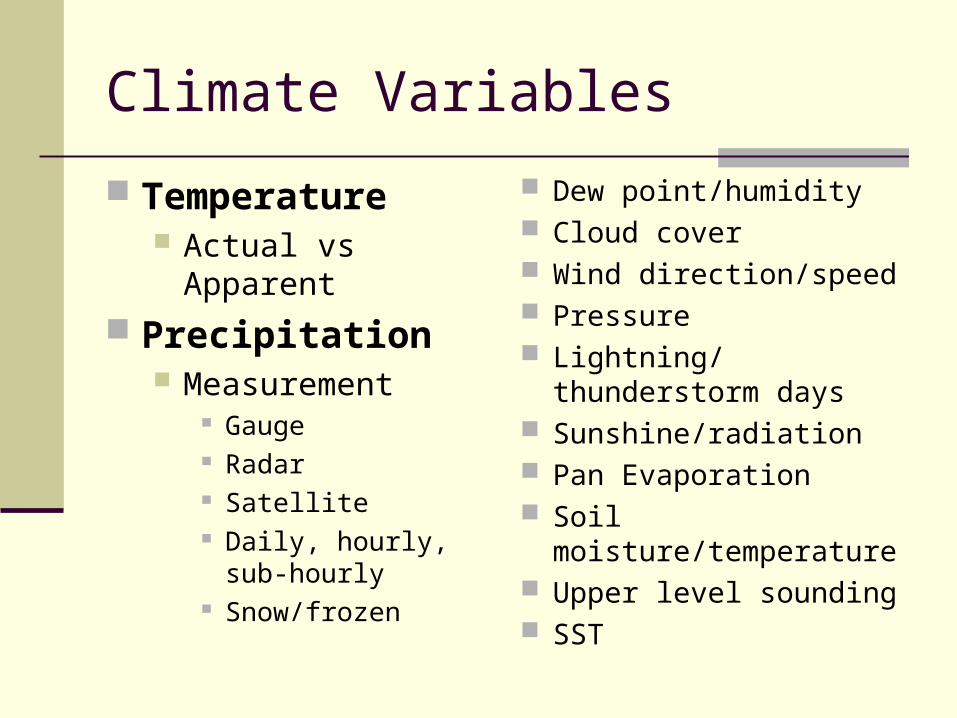
Climate Variables
Temperature Actual vs Apparent
Precipitation Measurement
Gauge Radar Satellite Daily, hourly, sub-
hourly Snow/frozen
Dew point/humidity Cloud cover Wind direction/speed Pressure Lightning/thunderstorm
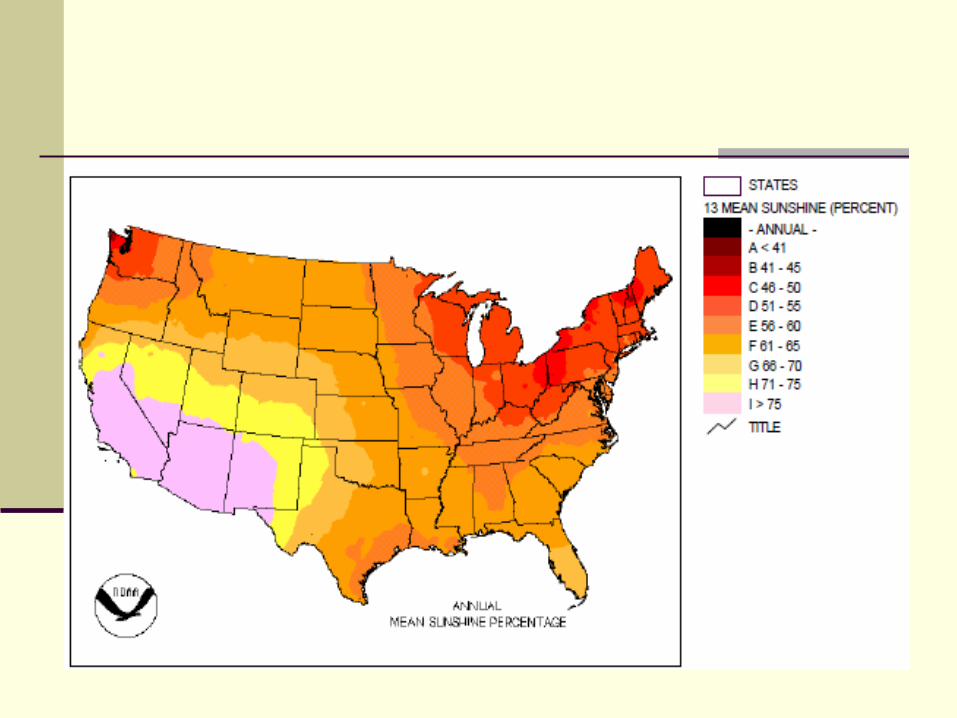
days Sunshine/radiation Pan Evaporation Soil moisture/temperature Upper level sounding SST

Temperature measurement
Other methods?
Stevenson screen/cotton shelter
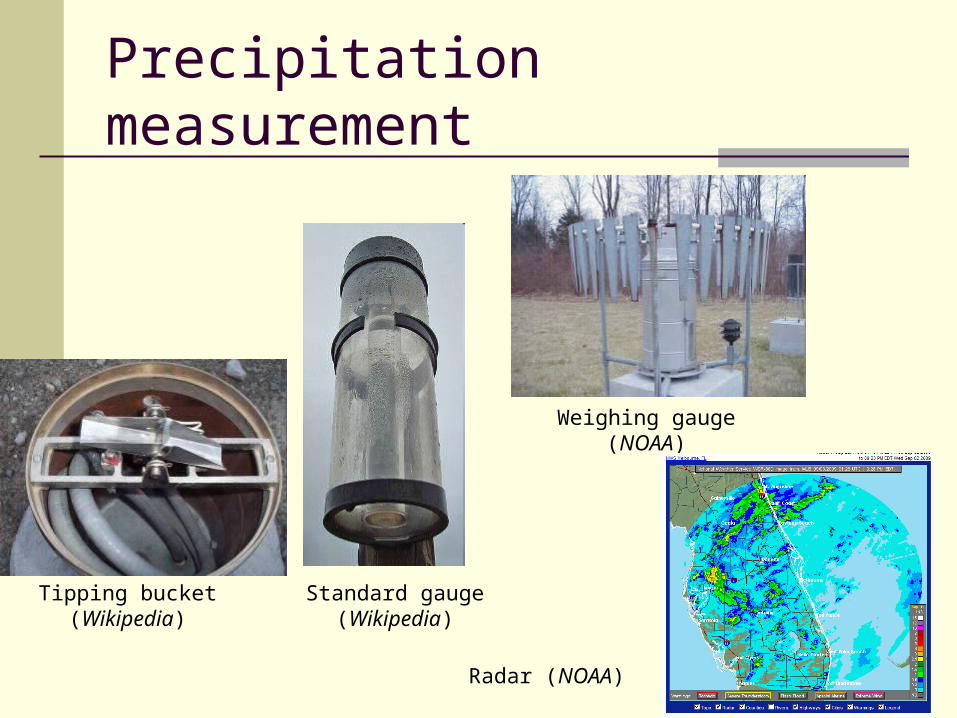
Precipitation measurement
Tipping bucket (Wikipedia) Standard gauge (Wikipedia)
Weighing gauge (NOAA)
Radar (NOAA)
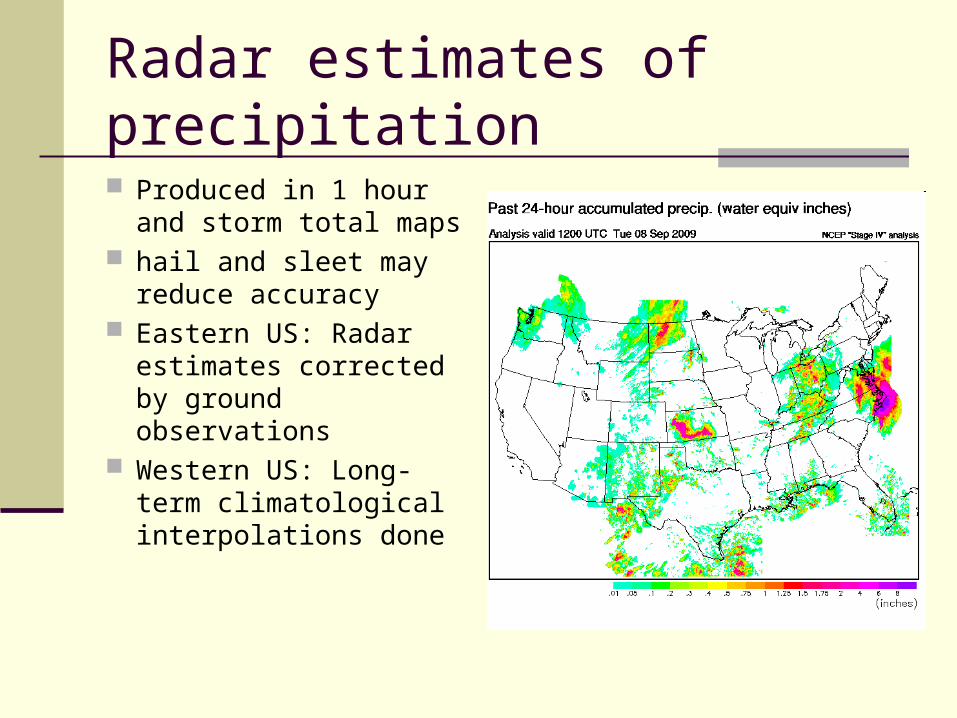
Radar estimates of precipitation
Produced in 1 hour and storm total maps
hail and sleet may reduce accuracy
Eastern US: Radar estimates corrected by ground observations
Western US: Long-term climatological interpolations done
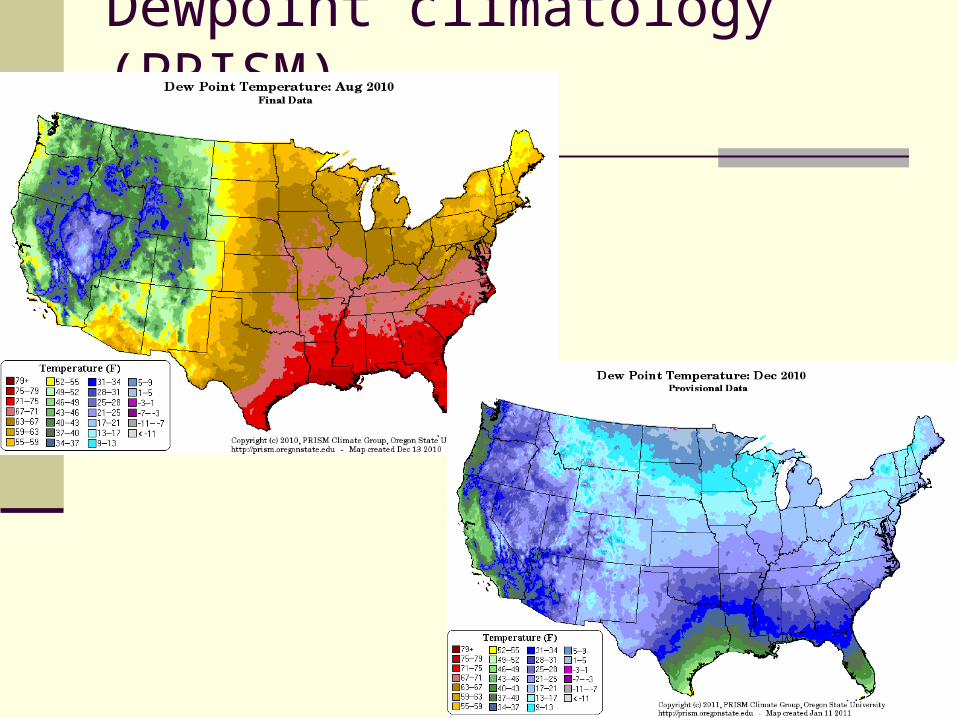
Dewpoint climatology (PRISM)
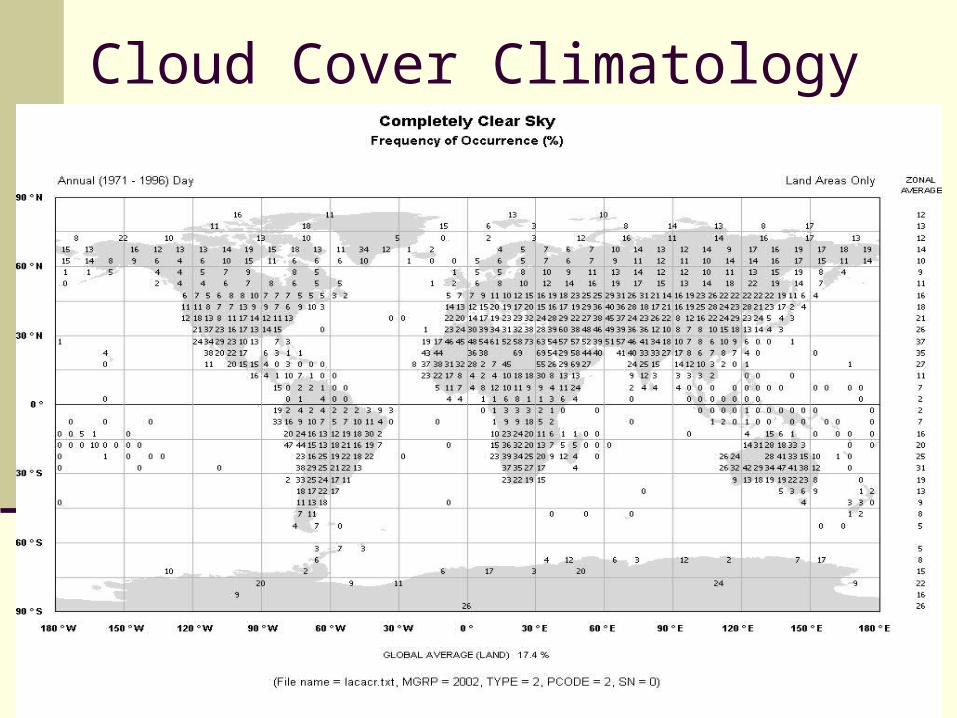
Cloud Cover Climatology

January ws/wd climatology
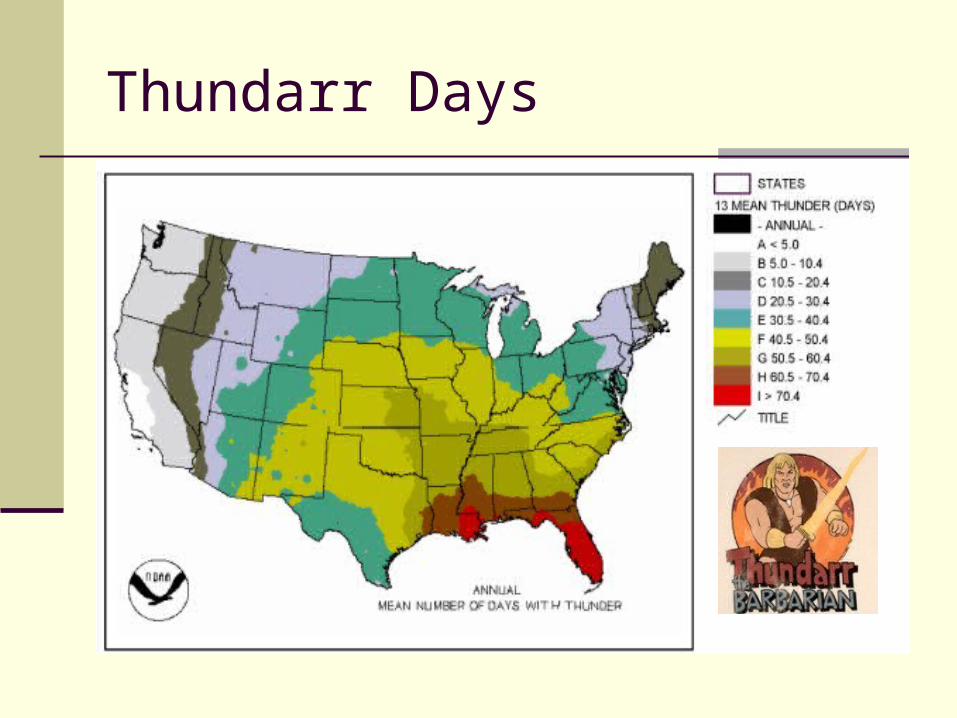
Thundarr Days
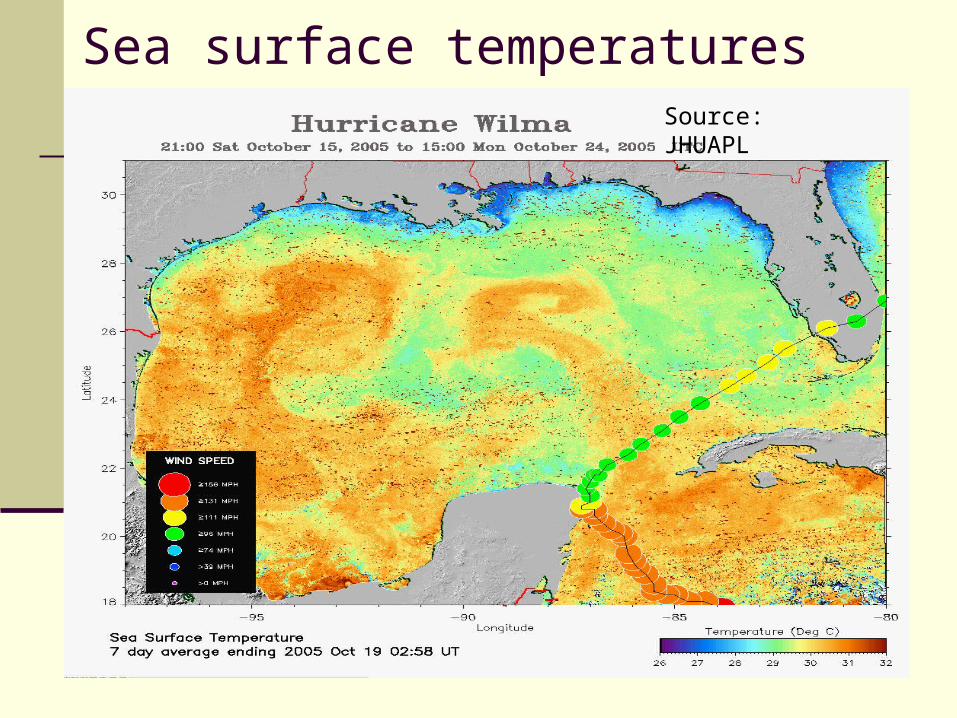
Sea surface temperaturesSource: JHUAPL
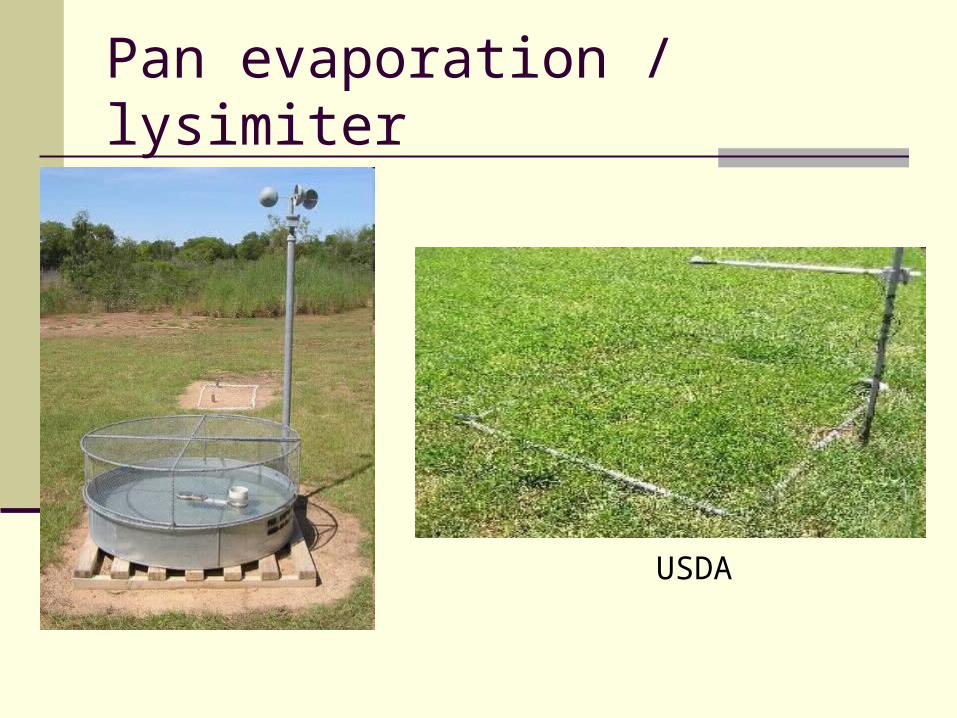
Pan evaporation / lysimiter
USDA
Upper air observations
Radiosonde Developed in 1928; flourished since WW2 Temperature, humidity, pressure
Rawinsonde Similar, though provides wind speed as well
Wind profilers Measure from ground
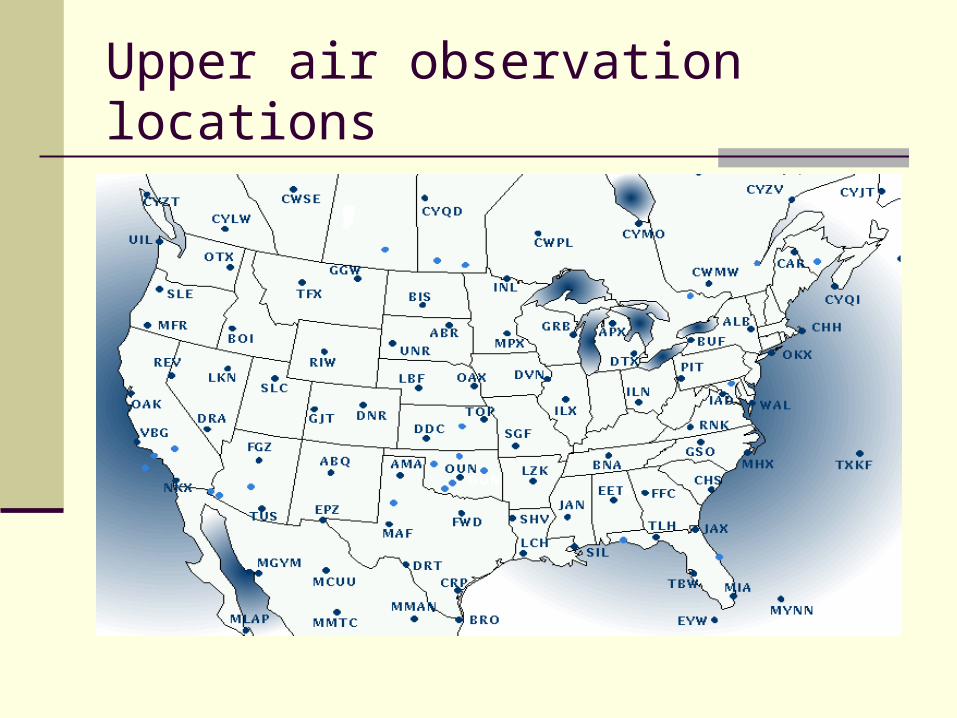
Upper air observation locations
Storm Data / Storm Reports
Drought Dust storm Flood Fog Hail Hurricane Lightning Ocean surf
Precipitation Snow / Ice Temperature extremes Tornado Wildfire Wind
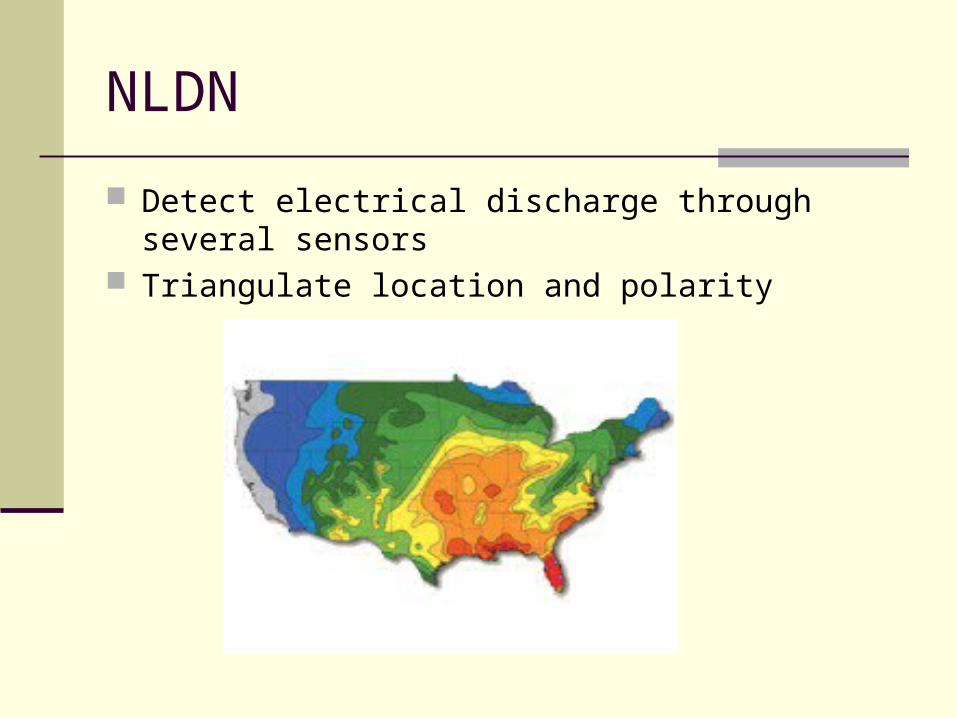
NLDN
Detect electrical discharge through several sensors Triangulate location and polarity
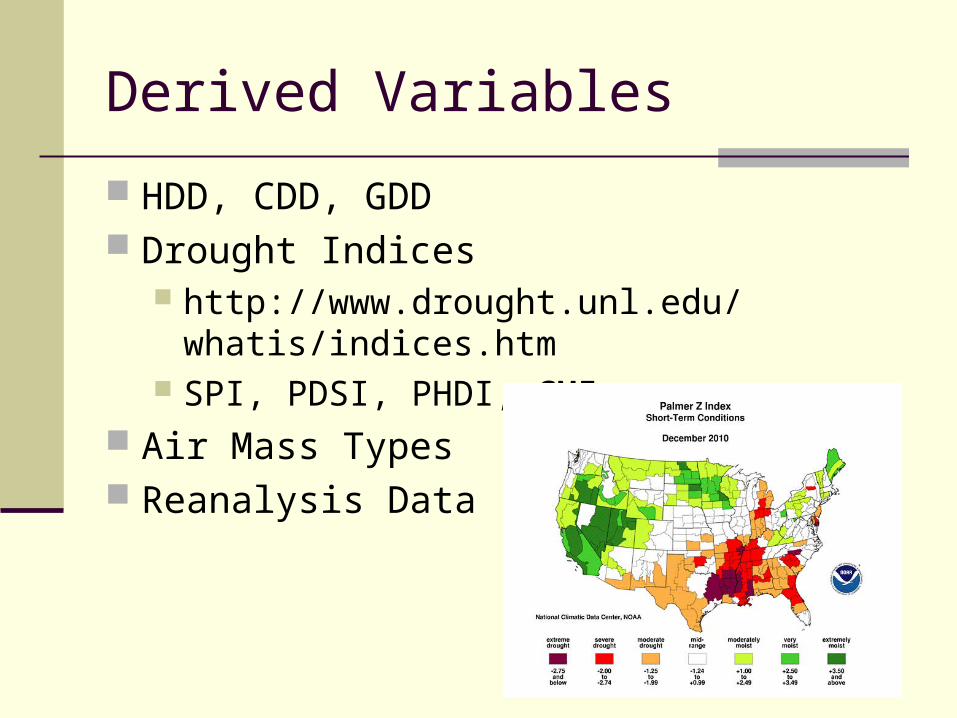
Derived Variables
HDD, CDD, GDD Drought Indices
http://www.drought.unl.edu/whatis/indices.htm SPI, PDSI, PHDI, CMI,
Air Mass Types Reanalysis Data
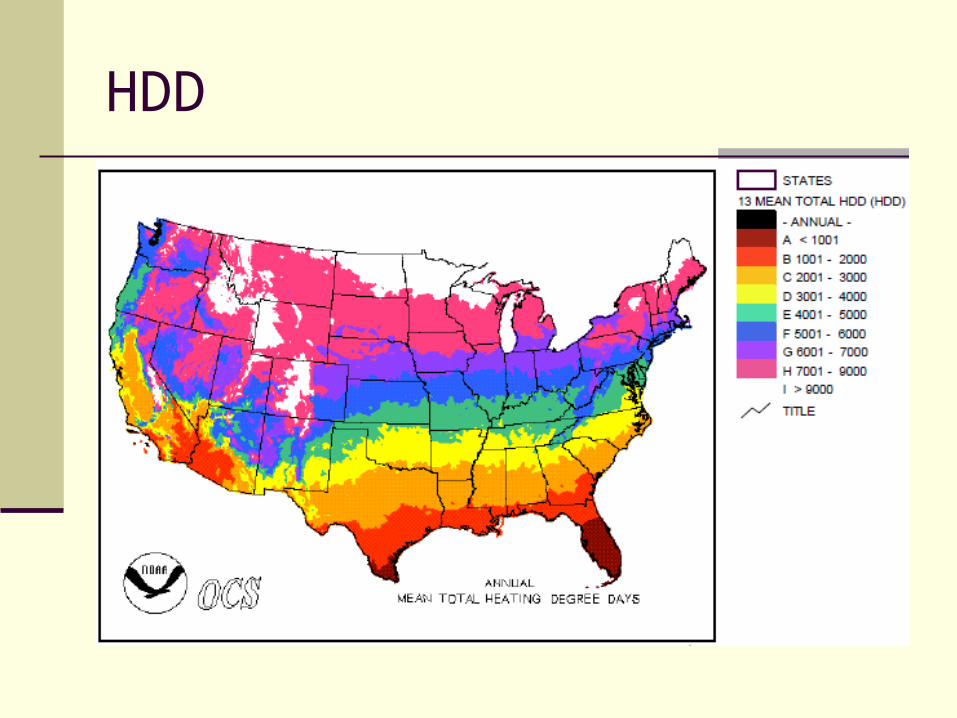
HDD
Reanalysis data
Combination of weather forecast model initialization and analysis, and short-term forecast
Project started in 1990s to reproduce synoptic maps back to 1948; extrapolation to 1908 coming soon
Two significant programs NCEP / NCAR “NNR” (USA) ECMWF “ERA” (European Union)
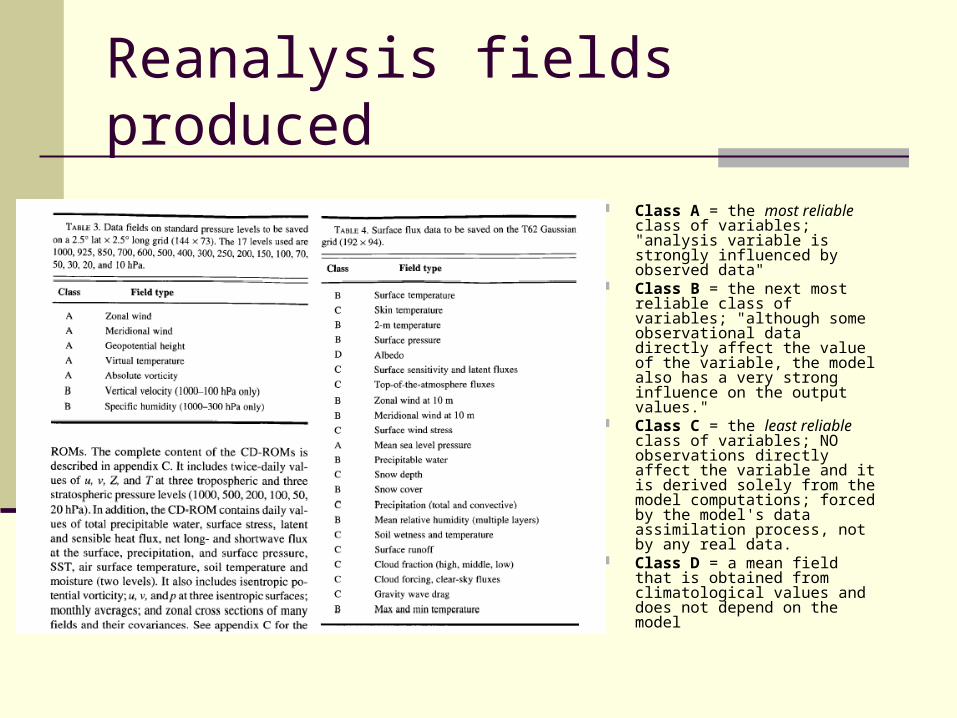
Reanalysis fields produced
Class A = the most reliable class of variables; "analysis variable is strongly influenced by observed data"
Class B = the next most reliable class of variables; "although some observational data directly affect the value of the variable, the model also has a very strong influence on the output values."
Class C = the least reliable class of variables; NO observations directly affect the variable and it is derived solely from the model computations; forced by the model's data assimilation process, not by any real data.
Class D = a mean field that is obtained from climatological values and does not depend on the model
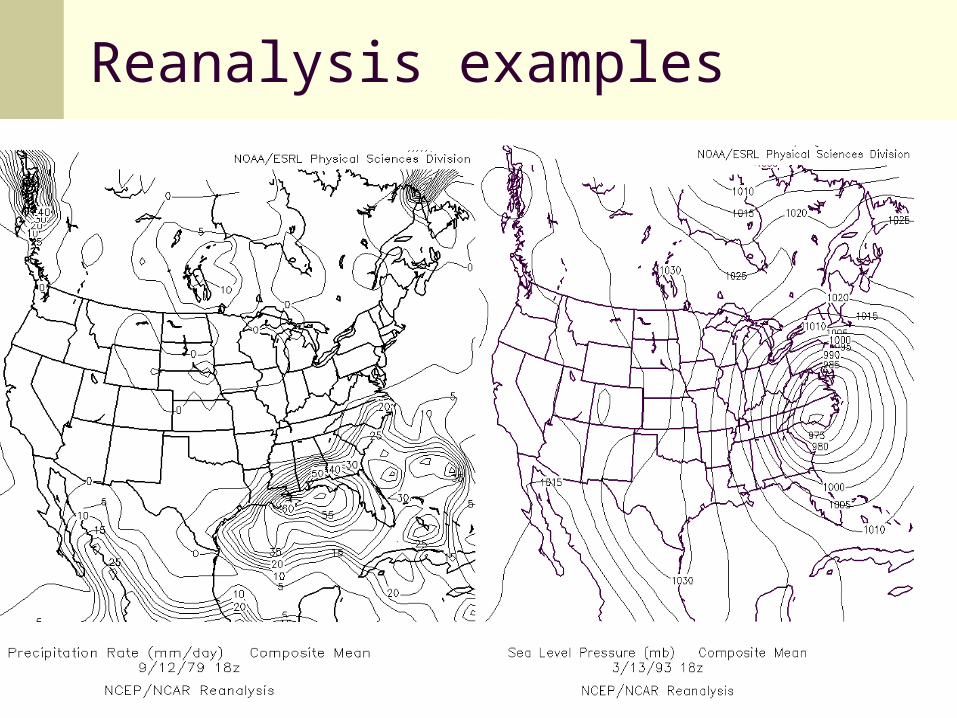
Reanalysis examples
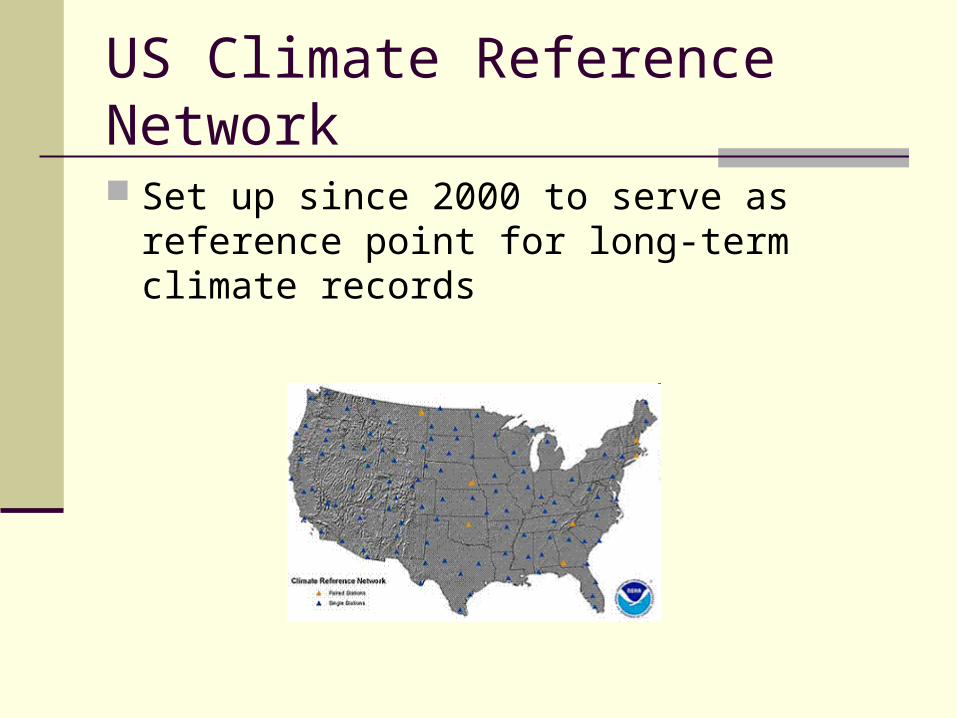
US Climate Reference Network
Set up since 2000 to serve as reference point for long-term climate records
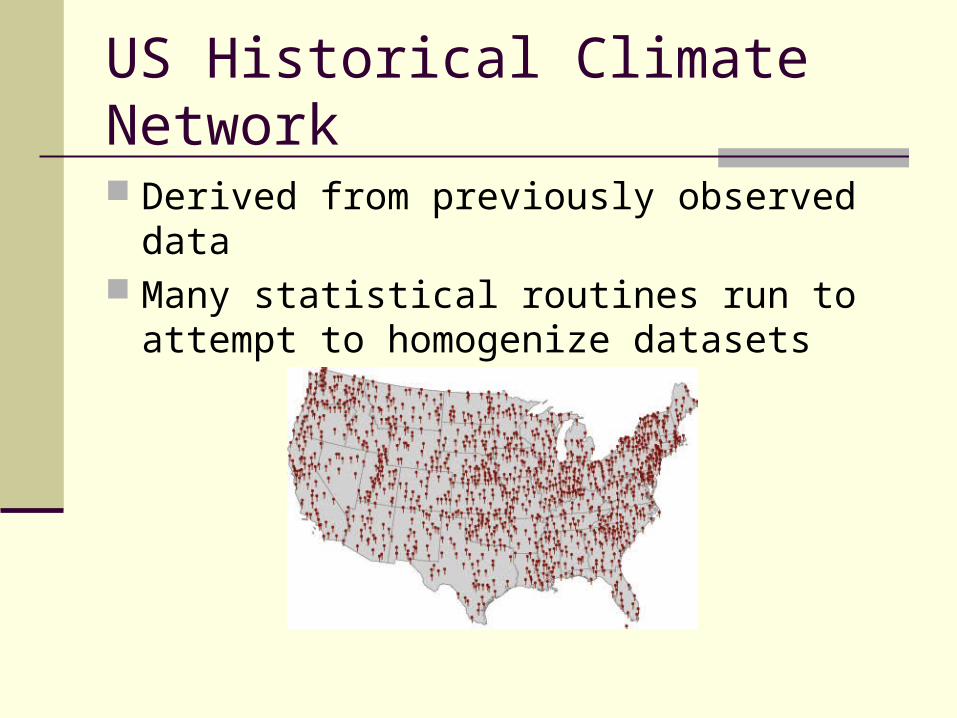
US Historical Climate Network
Derived from previously observed data Many statistical routines run to attempt to
homogenize datasets
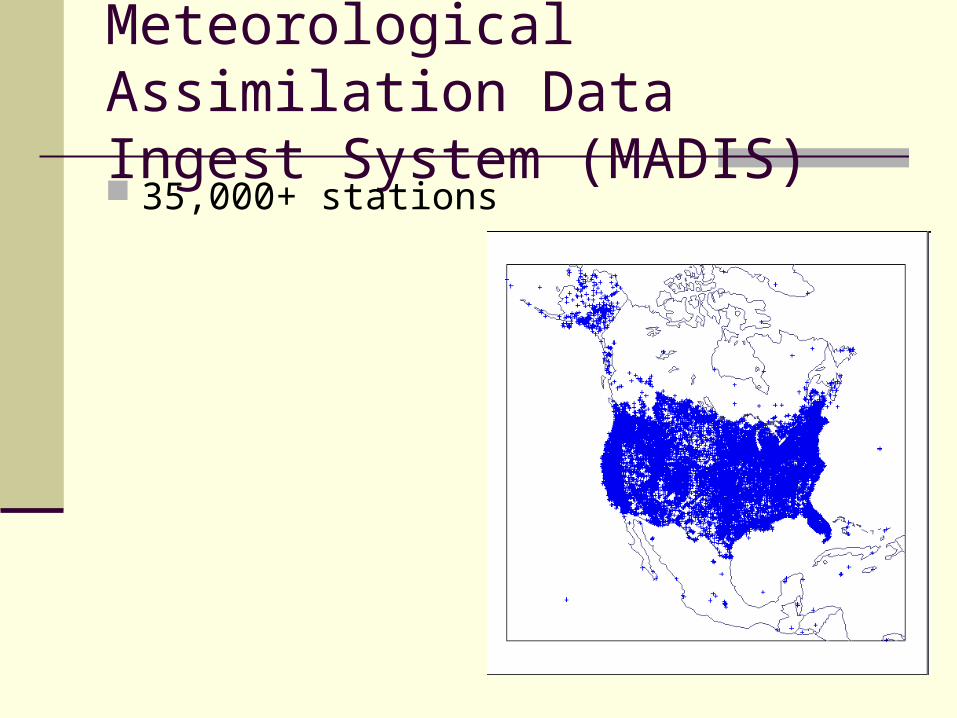
Meteorological Assimilation Data Ingest System (MADIS) 35,000+ stations
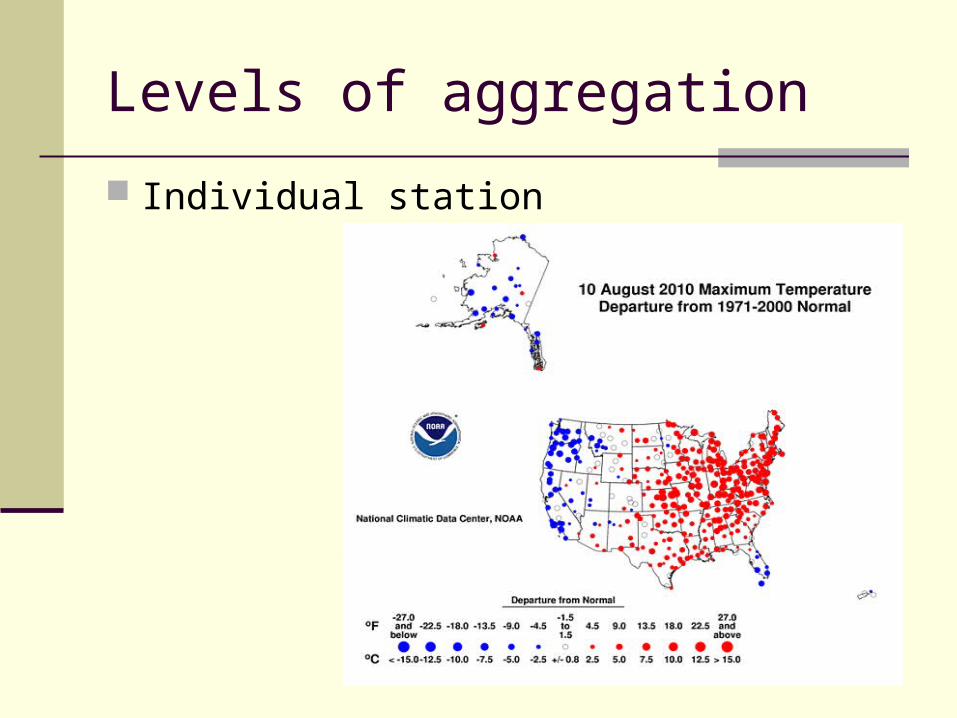
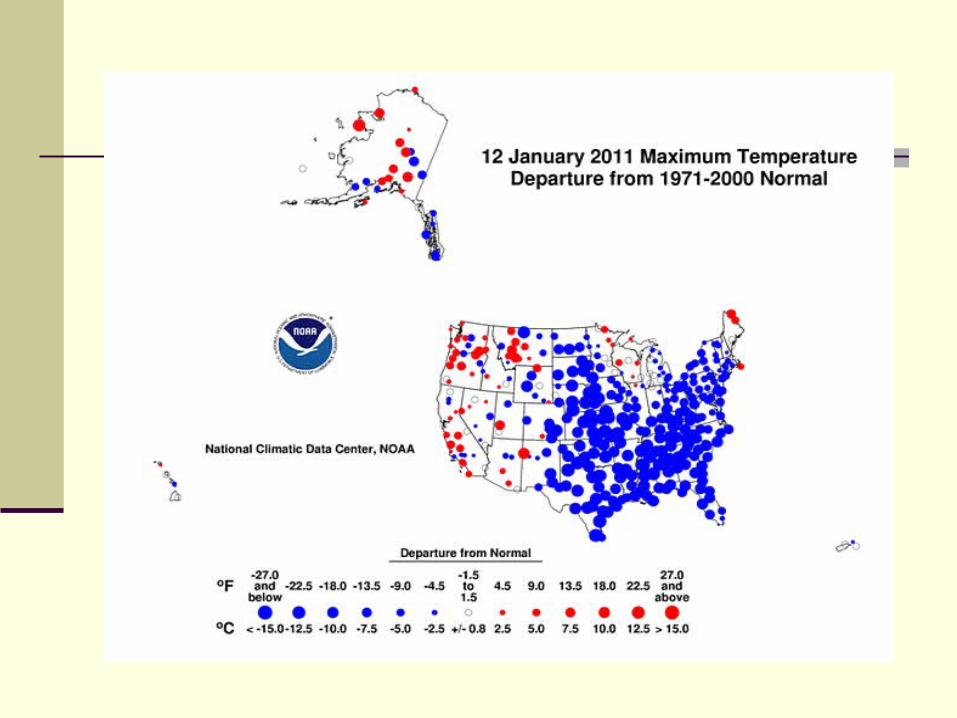
Levels of aggregation
Individual station
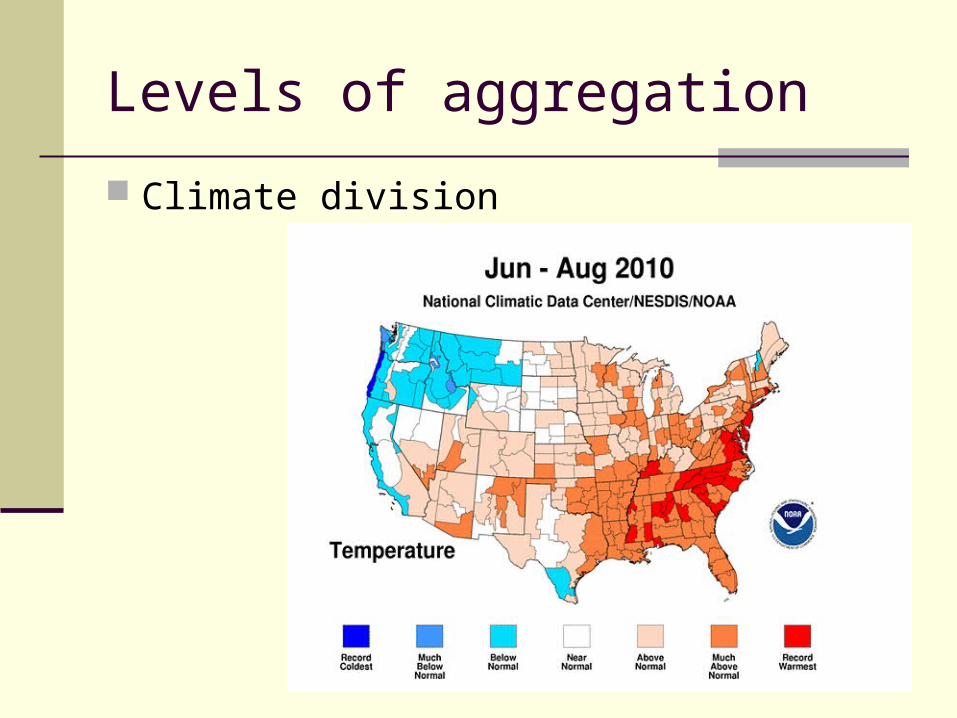
Levels of aggregation
Climate division
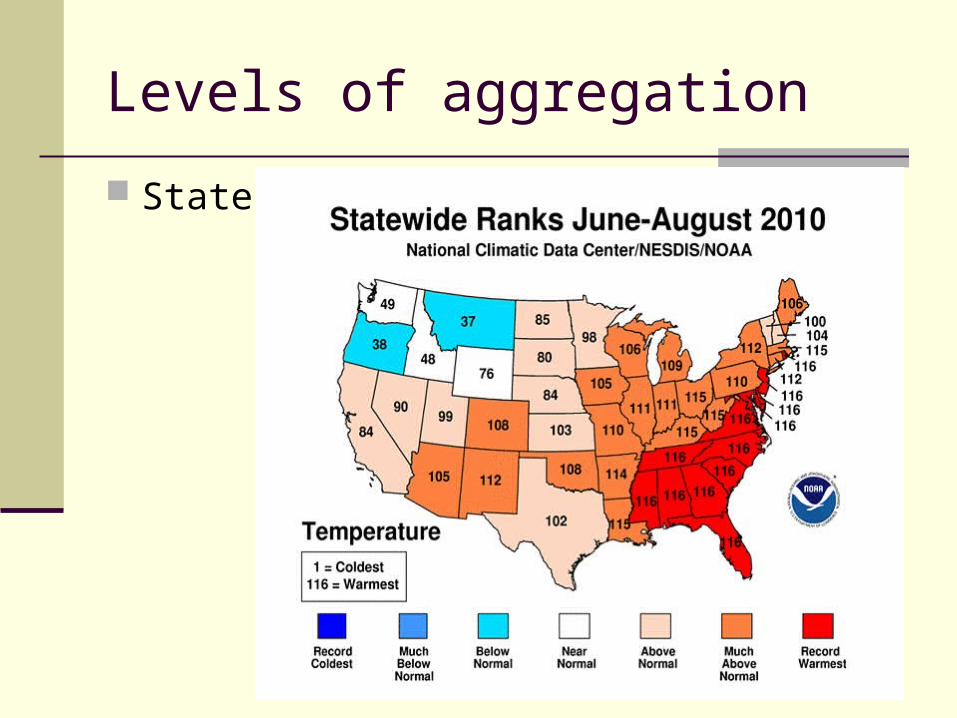
Levels of aggregation
State


Levels of aggregation
Region