application of multiway principal component analysis for identification …€¦ · ·...
TRANSCRIPT
Application of Multiway Principal Component Analysis for Identification of
Process Improvements in Pharmaceutical Manufacture
M. Molloy, E. B. Martin
Biopharmaceutical and Bioprocess Technology Centre, Chemical Engineering and Advanced Materials, Newcastle University,
England (e-mail: [email protected]).
Abstract: This paper describes the application of batch trajectory alignment, outlier detection, and
multiblock multiway principal component analysis (MPCA) to data from an industrial active
pharmaceutical ingredient manufacturing process. The process data routinely collected from historical
batches, including temperatures, pressures, and controller outputs, has been used to improve process
operation and understanding. MPCA highlighted questionable batches from which plant issues were
identified. Variable contributions to the MPCA scores were used to identify the process variables
potentially causing the variation in batch drying time.
Keywords: Data Models, Fault Detection, Fault Diagnosis, Multivariate Systems, Process Models,
Process Variability.
1. INTRODUCTION
Research and industrial applications in the area of Principal
Component Analysis (PCA) have been widely reported in the
literature. Most of this work has been in the area of
multivariate statistical process control, and the monitoring of
continuous processes; however extensions to PCA, Multiway
Principal Component Analysis (Nomikos and MacGregor,
1994), has enabled the monitoring of batch processes. A
number of case studies, utilising both simulated and
industrial data, have been presented in the literature. This
paper focuses on data obtained from an industrial batch
process, and highlights the challenges that arise when
developing a monitoring scheme.. These challenges include
data alignment, non-conforming batches and multiple unit
operations. A number of general solutions to these issues are
presented as well as the specific solutions applied to the
process being studied.
The process under study relates to the commercial
manufacture of an Active Pharmaceutical Ingredient (API).
The process exhibits significant variation in the drying time
of a batch, resulting in the dryer being the bottleneck in the
manufacturing process. If the cause of the variation in drying
time could be understood, process control may be
implemented to minimise the drying time, thereby reducing
the batch cycle time and hence increasing plant capacity and
profitability. Understanding of the possible causes of the
differences between batches was investigated through the
application of Multiway Principal Component Analysis
(MPCA).
This paper is organised as follows: section 2 introduces the
problem in more detail, and discusses the issues of batch
trajectory alignment and outlier identification. A description
of data unfolding, scaling, MPCA, and contribution analysis
is given in section 3. Conclusions and future work are
presented in section 4.
2. DATA COLLECTION
The API manufacturing process is carried out in three unit
operations: reactor, filter, and dryer. As the issues to be
addressed relate to batch drying, the dryer was studied
initially. Five online measurements are recorded, contents
temperature (°C), jacket outlet temperature (°C), jacket
temperature controller output (%), full range pressure (bara)
and vacuum pressure (mbar). The dryer is controlled by an
Emerson PROVOX® DCS (Distributed Control System).
The batch dryer sequence in the DCS comprises six control
components (Fig. 1). The first component (1) starts when half
the batch is in the dryer and is dried at a low jacket
temperature under vacuum. The second half of the batch is
then added to the dryer (2), followed by another low jacket
temperature dry under vacuum (3). The jacket temperature is
then ramped up and the vacuum maintained (4). Atmospheric
pressure is restored to the dryer and the higher jacket
temperature maintained (5). Subsequent to this is a period of
vacuum, (6) before the pressure is restored, and the batch is
cooled, and discharged. Drying is complete when the
contents temperature reaches a set point. Each of these
phases, with the exception of the loading phase (2), is
progressed based on elapsed time. The loading phase is only
implemented when the batch has been transferred to the dryer
and the operator progresses the operation. Batches that are
not at the target temperature by the end of stage (6) require
the operator to manually extend the drying until the target
temperature is achieved. This can vary between 0 and 24
hours, resulting in significant delays in progressing
subsequent batches through the manufacturing process.
2.1 Batch Trajectory Alignment
The first step in processing the data was to identify
questionable batches and remove these prior to developing an
Preprints of the 10th IFAC International Symposium on Dynamics and Control of Process SystemsThe International Federation of Automatic ControlDecember 18-20, 2013. Mumbai, India
Copyright © 2013 IFAC 283
MPCA representation. When dealing with batch processes,
the data-set is three dimensional (Fig. 2); process variables
(J) by time (K) by ‘batch’ (I). The data therefore needs to be
unfolded prior to analysis. There are six methods for
unfolding batch data; I×JK, J×KI and K×IJ are three methods
cited in the literature (Nomikos and MacGregor, 1994); the
other three are equivalent (I×KJ, J×IK and K×JI).
Fig. 1. Typical batch trajectory and segmentation.
Fig. 2. 3-Dimensional data matrix of batch process data.
A further challenge is that MPCA requires that the batches
are aligned. For data alignment to be implemented, it is
essential to have a detailed understanding of the process and
data collection systems (DCS). The DCS scans the process
data every thirty seconds and stores it in the data historian.
Data collection is subjected to a modified boxcar–back-slope
compression algorithm. The compression algorithm uses
deviation tolerances that are smaller than the calibration
tolerances on the plant instrumentation, and therefore can be
considered to serve as a low pass filter thereby having
minimal impact on the accuracy of the data. The data was
exported from the historian using the Aspen Process Data
Add-In for Microsoft Excel® and interpolated to a sampling
rate of 30 seconds. The interpolation interval of 30 seconds
was selected, as this is the fastest the process data can change
due to the DCS scan rate. The remainder of the analysis was
carried out using MATLAB 7.10 software and the PLS
Toolbox 6.71 from Eigenvector.
There are several techniques available for the alignment of
data, including cutting data, linear interpolation, use of an
indicator variable, dynamic time warping (DTW) and
correlation optimised warping (COW). Data cutting involves
deleting sections and may be undesirable if the data contains
information that may be of importance in terms of process
behaviour. Linear interpolation is another method of re-
sampling to attain a consistent number of samples for all
variables and for all batches. This method is preferred over
data cutting as no information is lost, however the time
information needs to be captured in a new variable by
performing the same re-sampling on the time variable
(García-Muñoz et al., 2003). When a batch has a variable that
starts and ends on the same value for each batch, and changes
monotonically over time, this variable can be used as an
indicator variable in place of time (e.g. reaction conversion)
(Nomikos and MacGregor, 1995). More complex alignment
algorithms, such as DTW and COW can give better trajectory
alignment based on features (shapes) within the data. This is
achieved by compressing and stretching the time axis of the
process data to align it to a reference trajectory. Care must be
taken that the alignment is of the features, and not just
matching the variable’s level across the batches. For
example, if an addition of a solvent is slightly more for one
batch, DTW will not correct for this and therefore the batches
will still not be truly aligned (Kassidas et al., 1998, Fransson
and Folestad, 2006).
The selection of the alignment techniques must be done on a
case-by-case basis. In this case study, two techniques were
implemented. Data cutting was applied to each batch. Firstly,
the data prior to the start of the first dry (1) was cut as the
dryer was empty and therefore the data does not contain
information. The second region that was cut was all the data
following the higher temperature higher pressure drying
phase (5) since the focus of the investigation is on the cause
of extended drying which starts immediately post this time
point. Finally, the data between the two low-pressure low-
temperature drying phases (2) was also cut. This was because
during this time the PID (proportional + integral + derivative)
controller for the jacket temperature is on automatic, however
the circulation pump for the jacket is stopped, therefore the
measurements obtained during this period do not reflect the
conditions the batch is operating under. The time elapsed for
this cut region was retained as it may be important in the
analysis.
An indicator variable could only be used on the region within
phase (4) where the jacket temperature is ramped, however
this is only a small section of the data. Linear interpolation
was thus used for batch trajectory alignment and carried out
on each of three sections: section (1); section (3) and (4); and
section (5), thereby ensuring each batch had the same number
of samples.
2.2 Detection and Removal of Questionable Batches
Two hundred and twenty one batches were extracted from the
process historian and aligned by the method detailed in
section 2.1. The next step was to identify the location of
missing data. There are many potential causes of missing data
and many methods to deal with it. (Walczak and Massart,
2001) provide an overview of some of these techniques. The
data analysed from the industrial process contained large
sections of missing data as a result of problems when
extracting the data from the continuous data historian and
forming it into batch segments. There were eighteen batches
found to have significant periods of missing data.
Bat
ches
(i
= 1
:I)
Process Variables
(j = 1:J)
Time (k = 1:K)
Batch Drying Profile
Elapsed Time
Pro
cess
Mea
sure
men
t
(1) (2)
(3) (4) (5) (6)
IFAC DYCOPS 2013December 18-20, 2013. Mumbai, India
284
The date and time stamps on the electronic batch record
(EBR) were used to identify the start and end points of each
operational phase of a batch. Eighteen of the batches had
issues due to one of the date stamps not being present in the
EBR. This may be due to several factors, including if the
process operator was required to ‘exit a unit operation’ to
resolve an issue on the plant to progress the batch. Where this
was the case, the data was imported as a zero vector, because
the location is not able to be identified reliably. These
eighteen batches were removed resulting in two hundred and
three batches to be included in the analysis
Identifying questionable data is important as not only can
spurious data impact on model development, but the causes
of non-conforming data may also be of interest. The process
data was plotted to identify questionable batch trajectories.
Twenty-three batches were identified as having atypical
controller responses (Fig. 3). More specifically, the controller
output was fixed at the maximum value for a period of time
during either: the first low-pressure, low-temperature phase
(1); the second low-pressure, low-temperature phase (3); or
both low-pressure, low-temperature phases (1) and (3).
Immediately prior to the occurrence of this, the controller
output moved to 0% and the vacuum started to decay. These
are characteristics of the DCS entering the fail phase. The
batch was then recovered; the pressure then dropped to an
acceptable vacuum, and the controller output increased. The
jacket temperature did respond to the controller moving,
however it did not reach the set point, causing the controller
output to remain at 100%.
Fig. 3. Questionable behaviour of controller output.
The PROVOX® sequences in the detailed design
specification were then interrogated and it was found that
there was an error in the fail sequence logic for this part of
the operation. During the low-pressure, low-temperature
drying phases, water is re-circulated through the dryer jacket
and heated using low pressure steam (Fig. 4). The jacket
outlet temperature is used to control the steam valve position.
When PROVOX® goes into the fail phase, the steam control
valve is set to zero, valve XV1169 is closed and valve
XV1170 is opened. This allows cold water to be circulated in
a single pass through the jacket, cooling the dryer contents
(Fig. 5). When the batch is recovered, the controller returns to
automatic, however the valves remain in the cooling position.
This causes the jacket outlet temperature to rise with the heat
from the steam; however, as the water is not re-circulated, the
jacket temperature does not rise sufficiently to allow the
steam valve to start to close (Fig. 6).
Fig. 4. Dryer heat transfer system during routine drying
operation.
Fig. 5. Dryer heat transfer system during failed operation
Fig. 6. Dryer heat transfer system after failed operation
recovery.
All of the batches exhibiting this behaviour were excluded
from the analysis. A further ten batches were removed
because the vacuum was lost during one of the vacuum
drying phases, and seven batches were excluded because the
dryer failed during one of the operations causing the batch to
be cooled for a period of time before the operator recovered
the batch and continued the drying process.
MPCA was then applied to identify any questionable batches
that remained within the data-set that had not been observed
from the analysis of the raw data. The data for each of the six
process variables (including batch elapsed time) were
unfolded to give an I×JK matrix (Fig.7). This allows for the
comparison of the batches about the mean trajectory, and
0 50 100 1500
10
20
30
40
50
60
70
Elapsed Time
Pro
ce
ss M
ea
su
rem
en
t
Questionable Controller Behaviour
Controller Output
Pressure
Jacket Temperature
0 50 100 1500
10
20
30
40
50
60
70
Elapsed Time
Pro
ce
ss M
ea
su
rem
en
t
Questionable Controller Behaviour
Controller Output
Pressure
Jacket Temperature
Header TankLC
PMP XV1169
XV1170
TCV
TE1100
Dryer
Steam
Condensate
Cold water
Header TankLC
PMP XV1169
XV1170
TCV
TE1100
Dryer
Steam
Condensate
Cold water
Header TankLC
PMP XV1169
XV1170
TCV
TE1100
Dryer
Steam
Condensate
Cold water
100 %
0 %
0 50 100 150-10
0
10
20
30
40
50
60
70
Elapsed Time
Pro
ce
ss M
ea
su
rem
en
t
Questionable Controller Behaviour
Controller Output
Pressure
Jacket Temperature
Questionable Data
Questionable Controller Behaviour
Elapsed Time
Pro
cess
Mea
sure
men
t
IFAC DYCOPS 2013December 18-20, 2013. Mumbai, India
285

Fig. 11. Unfolding data (J×KI).
therefore batches that significantly differ from the mean
trajectory are identified as questionable (Nomikos and
MacGregor, 1994).
Fig. 7. Unfolding data (I×JK).
Fig. 8. Process data for I×JK MPCA model.
Fig. 9. Questionable batch identification using Hotelling T2.
Fig. 10. Hotelling T2 of data with questionable batches
removed.
Hotelling T2 (Hotelling, 1947) was used to identify
questionable batches (Fig. 9). It is a measure of how far a
sample (batch) is from the origin of the principal component
model for all retained principal components. One batch was
observed to exhibit non-conforming behaviour and was
removed (Fig. 10). The resulting cleaned data set contained
one hundred and fifty three batches (sixty nine percent of the
original data set). To understand the underlying causes for
extended drying time, it is important that the data-set only
includes batches that exhibit variation under ‘normal’
operating conditions.
Finally those batches where the dryer started the cooling
operation after the final vacuum drying period (6) were also
removed. This was to ensure that the calculation of extended
drying time is consistent for each batch and does not include
periods where the batch was actively being cooled. This
resulted in a further twenty batches being excluded giving a
final data-set size of one hundred and thirty-three batches.
The last stage in terms of pre-processing was to remove the
spikes in the process data (Fig. 8) seen around time points
1500 and 3000 as these are artefacts of the alignment method
and do not contain any relevant process information.
3. MULTIWAY PRINCIPAL COMPONENT ANALYSIS
3.1 Process Variable Selection and Data Unfolding
Three additional variables were created from the process
data: the first derivatives of the contents temperature, jacket
temperature and vacuum pressure. This allows information as
to how the temperature and pressure change with time to be
included in the model.
The differential variables and the
jacket temperature and controller
output variables were filtered with a
low pass filter to remove noise
resulting from the instrumentation
and the controller. The data was then
split into two groups based on the
extended drying time. The first group,
‘Good’, comprised twenty batches
with extended drying times of less
than three hours. The second group,
‘Bad’, comprised forty-two batches
where the extended drying times were
greater than ten hours. These values
were chosen to allow for a separation
in the data, so any differences
between ‘Good’ and ‘Bad’ batches
could be observed (Fig. 12). The data
was then unfolded in the JxIK
direction (equivalent to J×KI) prior to
the application of PCA.
3.2 Data Scaling
Scaling the data in an appropriate manner is important as the
method selected can have a significant impact on the quality
of the model. (Gurden et al., 2001) gives examples on scaling
multi-way data. In this paper, the mean trajectories were
removed from each of the process variables, consequently the
deviations from the process means were modelled using
MPCA. The range of the process data varied significantly.
Contents Temperature Jacket Temperature Vacuum Pressure
Batch
Ho
telli
ng
T2H
ote
llin
g T2
Hotelling T2 Plot
Hotelling T2 Plot
Bat
ches
Time = 1 Time = 2 Time = 3 Time = 4 Time = 5 Time = K
v = 1 to V v = 1 to V v = 1 to V v = 1 to V v = 1 to V v = 1 to V
Pro
cess
Me
asu
rem
en
t
Pro
cess
Me
asu
rem
en
t
Pro
cess
Me
asu
rem
en
t
Pro
cess
Me
asu
rem
en
t
Pro
cess
Me
asu
rem
en
t
Pro
cess
Me
asu
rem
en
t
Batch Progression
Full Pressure
Batch Progression
Controller O/P
Batch Progression
Elapsed Time
Batch Progression Batch Progression Batch Progression
IFAC DYCOPS 2013December 18-20, 2013. Mumbai, India
286

For example, pressure ranged from 40 mbar to 1050 mbar,
whilst the range of the controller output was -10 % to 110 %.
Furthermore, the behaviour of the variables differ
considerably resulting in large deviations from the mean
being possible for the vacuum pressure at the transition
points between vacuum and atmospheric pressure drying,
compared to the behaviour of the other variables. The data
was therefore scaled, to lie between -1 and + 1 ensuring that
each variable was equally weighted in the analysis.
Fig. 12. Selection of ‘Good’ and ‘Bad’ batches using
extended drying time
A PCA representation was then built on the scaled ‘Good’
batches data-set with the scaled ‘Bad’ batches data-set then
being introduced. The scores plots for each batch were
compared (Fig. 13) and the main difference observed was in
principal component two, with a clear separation between
‘Good’ and ‘Bad’ from progression index 1200 onwards.
Fig. 13. Scores plots for J×KI MPCA
3.3 Contribution Analysis and Interpretation of the Scores
Plots
Contribution analysis has been shown to be useful in
multivariate process control, for identifying the variables
indicative of an out of control signal in the scores from a
PCA representation (Chen et al., 2009). In this paper, they are
used to identify those variables indicative of the different
structures in the principal component scores, for different
groups of batches.
Consider the unfolded data matrix X (J×KI) with I batches, J
process variables and K samples. After performing MPCA,
the scores, T, are contained in a KI×N matrix, where N is the
number of principal components retained. This is then
unfolded to obtain a three dimensional matrix of scores, T,
(I×K×N). For the kth
sample, nth principal component, and ith
batch, the score is:
(1)
where pj,n is the loading for the jth
variable and the nth
principal component. The scores can therefore be
decomposed into J contributions, one for each variable. For
example, the kth
observation contribution to the score of the
ith
batch and the nth
principal component from the jth
variable
is:
(2)
and therefore the contribution for the kth
observation for the
nth
principal component and jth
variable can be summed
across all batches:
(3)
and thus grouped batches can be compared.
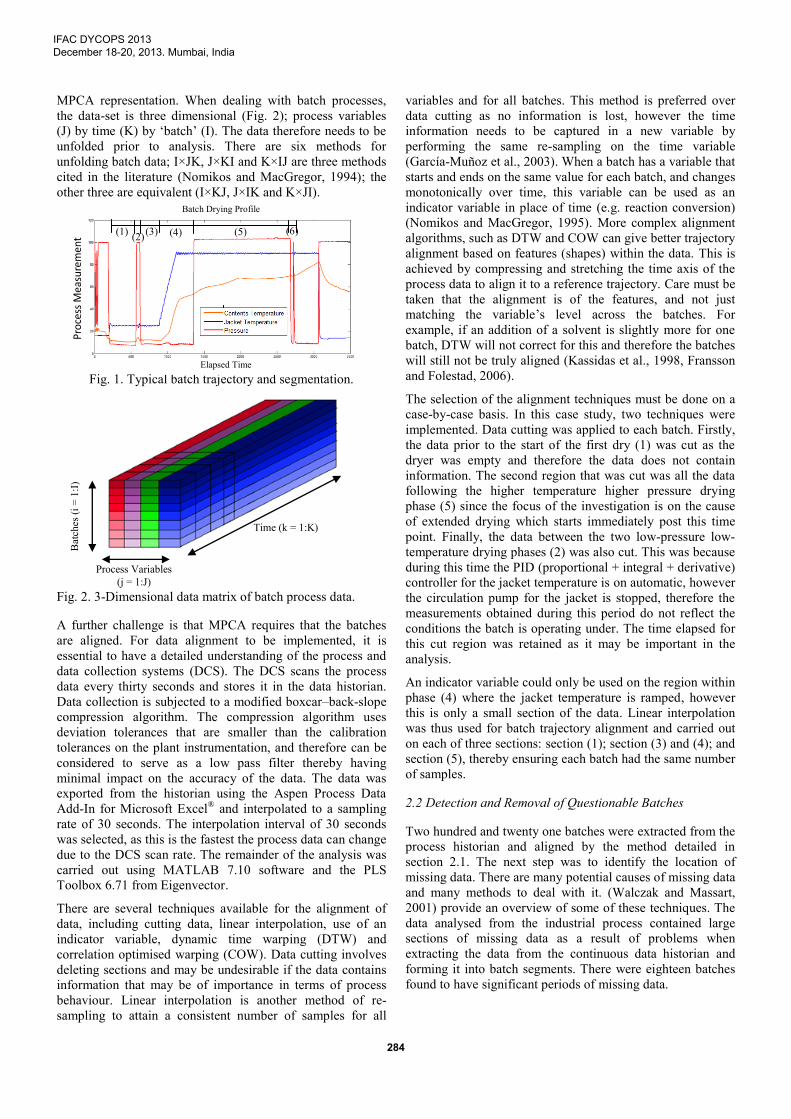
The contributions to the scores were then calculated for
samples 1200 to 2400 for principal component two, as it was
an area of interest identified from the scores plots (Fig. 13).
The contributions for the ‘Good’ batches and ‘Bad’ batches
are shown in Fig. 4, and the difference between the
contributions are shown in Fig. 15.
Fig. 14. Contribution of scores for ‘Good’ (left) and ‘Bad’
batches (right).
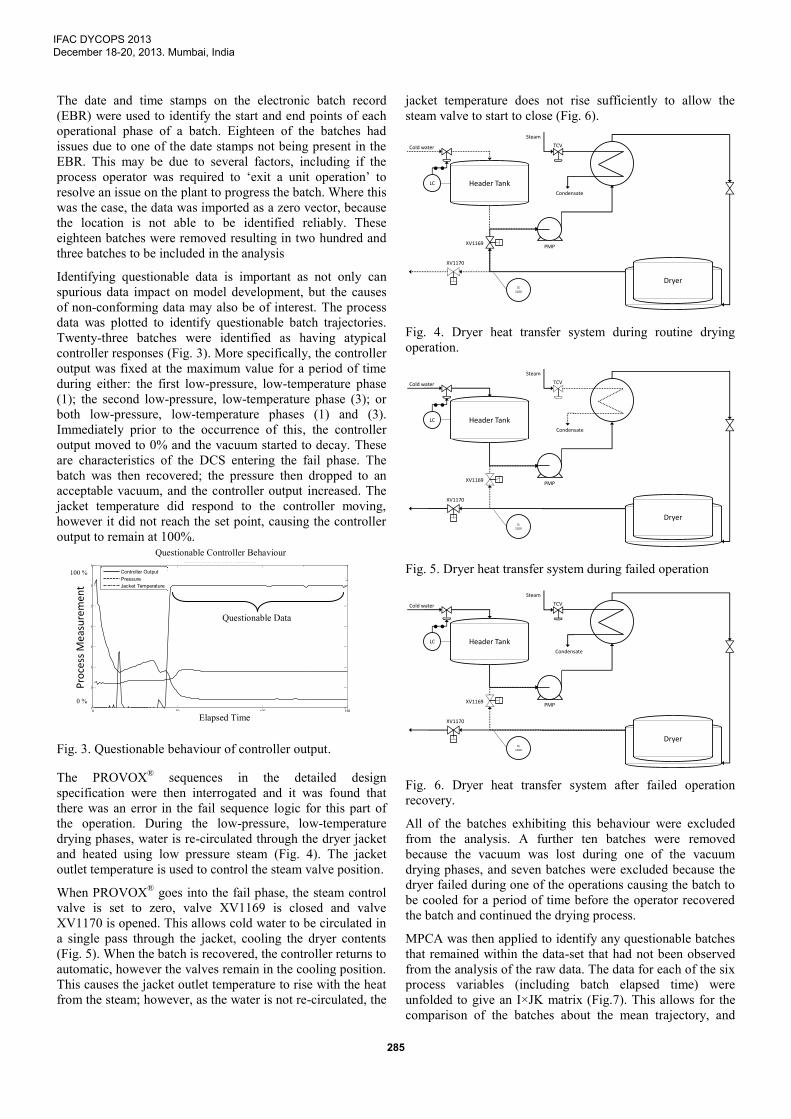
It is clear from Figs. 14 and 15 that the contents temperature
is contributing most significantly to the difference in the
scores between the ‘Good’ and ‘Bad’ batches. The
temperature profile for the region of interest (time points
1200 through 2400) was compared in terms of extended
drying time. In Fig. 16 the dark profiles are the ‘Good’
batches and the light profiles are the ‘Bad’ batches. It can be
noted that the temperature of the ‘Bad’ batches is lower. This
differentiation in batch temperature occurs at the end of the
temperature ramp (4) and is carried throughout the remainder
of the drying process. The lack of clear differentiation in the
scores on the other principal components indicates that this is
the primary indicator of extended drying present with respect
to the variables currently monitored on the dryer.
Bad
Scores on PC1 Scores on PC2 Scores on PC3 Contribution Plots for PC2 Samples 1200 to 2400
Tem
per
atu
re a
t en
d o
f fi
xed
dry
ing
per
iod
Sco
res
Sco
res
Sco
res
Co
ntr
ibu
tio
n
Co
ntr
ibu
tio
n
Extended Drying Time
‘Good’ and ‘Bad’ Batch Selection
Scores on PC4 Scores on PC5 Scores on PC6
Scores on PC7 Scores on PC8 Scores on PC9
Batch Progression Batch Progression Batch Progression
Bad
Good
IFAC DYCOPS 2013December 18-20, 2013. Mumbai, India
287
Fig. 15. Difference between contribution on scores for
‘Good’ and ‘Bad’ batches.
Fig. 16. Temperature for ‘Good’ and ‘Bad’ batches.
As no other process variables were highlighted as
contributing significantly and no other regions of interest in
the scores were identified from the retained principal
components, the cause of extended drying is therefore
hypothesised to be a characteristic of the batch as it enters the
dryer that becomes visible when the batch temperature is
elevated. The root cause is likely to lie further up stream in
the reaction, crystallization, and/or filtration processes and
this is currently under investigation.
4. CONCLUSIONS AND FUTURE WORK
Several operational issues have been identified on the
chemical plant with respect to the dryer, during the
identification of non-conforming batches. These issues have
been highlighted and will be addressed in due course. The
removal of the affected batches from the data-set meant that
more subtle operational changes could be highlighted as
indicative of extended drying times.
The application of MPCA enabled extended drying to be
associated with a characteristic of the batch that is seen
relatively early in the drying process. The root cause of
extended drying therefore lies up stream of the dryer. Future
work will include investigating the reactor and filter to
identify the likely causes of extended drying through
multiblock multiway principal component analysis.
Process data alignment is also an important issue for the
analysis of this industrial data-set prior to the application of
MPCA. For this study a straightforward alignment technique
was applied due to the nature of the batch process control,
however it should be noted that more complex alignment
techniques such as DTW and COW may have a significant
impact on the results of the application of MPCA where more
complex process dynamics are present.
5. ACKNOWLEDGEMENTS
The authors acknowledge Piramal Healthcare, Morpeth for
access to the process plant and data, especially to James
Howells and Mike Devenport for their support and guidance.
They also acknowledge the EPSRC for providing funding
(EP/G018502/1) for the EngD student and related activities.
6. REFERENCES
Chen, T., Martin, E., and Montague, G. (2009). Robust
probabilistic PCA with missing data and
contribution analysis for outlier detection.
Computational Statistics & Data Analysis, (53),
3706-3716.
Fransson, M. and Folestad, S. (2006). Real-time alignment of
batch process data using COW for on-line process
monitoring. Chemometrics and Intelligent
Laboratory Systems, (84), 56-61.
García-Muñoz, S., Kourti, T., MacGregor, J. F., Mateos, A.
G., and Murphy, G. (2003). Troubleshooting of an
Industrial Batch Process Using Multivariate
Methods. Industrial & Engineering Chemistry
Research, (42), 3592-3601.
Gurden, S. P., Westerhuis, J. A., Bro, R., and Smilde, A. K.
(2001). A comparison of multiway regression and
scaling methods. Chemometrics and Intelligent
Laboratory Systems, (59), 121-136.
Hotelling, H. (1947) Selected Techniques of Statistical
Analysis for Scientific and Industrial Research and
Production and Management Engineering, London,
McGraw-Hill.
Kassidas, A., Taylor, P. A., and MacGregor, J. F. (1998).
Off-line diagnosis of deterministic faults in
continuous dynamic multivariable processes using
speech recognition methods. Journal of Process
Control, (8), 381-393.
Nomikos, P. and MacGregor, J. F. (1994). Monitoring batch
processes using multiway principal component
analysis. AIChE Journal, (40), 1361-1375.
Nomikos, P. and MacGregor, J. F. (1995). Multivariate SPC
charts for monitoring batch processes.
Technometrics, (37), 41-59.
Walczak, B. and Massart, D. L. (2001). Dealing with missing
data: Part II. Chemometrics and Intelligent
Laboratory Systems, (58), 29-42.
Batch Progression
Temperature Trajectory for ‘Good’ and ‘Bad’ Batches (Samples 1200 to 2400)
Batch Progression (Sample Number)
Co
ntr
ibu
tio
nTe
mp
erat
ure
Comparison Contribution Plot for PC 2 and Samples [1200:2400]
IFAC DYCOPS 2013December 18-20, 2013. Mumbai, India
288