application of crop information system to the management
TRANSCRIPT

294
APPLICATION OF CROP INFORMATION SYSTEM TO THE MANAGEMENT OF RICE PLANTATIONS IN PATIGI LOCAL GOVERNMENT AREA OF KWARA STATE, NIGERIA
Olabode A.D. Department of Geography, University of Ilorin, Ilorin, Nigeria.
Ajibade, L.T.
Department of Geography, University of Ilorin, Ilorin, Nigeria.
Ogunbodede, E.F. Department of Geography and Planning Sciences, Adekunle Ajasin University, Ondo, Nigeria.
ABSTRACT
This study focused on the application of Crop Information System (CIS) for sustainable rice production in Patigi Local
Government Area of Kwara State, Nigeria. The rice fields were identified through the use of Global Positioning System
(GPS) while some attribute data concerning each identified rice fields from the farmers were obtained with the use of
questionnaires and direct observation. However, secondary data were collected from the existing books, journals, maps and
internet. Random Sampling technique was used to draw a population of 224 from a population of 45,712 which was used for
200 people as sampling frame of the entire population. Above all, a number of 224 questionnaires were administered and
used in the course of the study. The base map of Kwara State was scanned, geo-referenced and digitized by layers (i.e
boundary, district, settlement, road, ward, and rivers) in AutoCAD Map 2000i and Arcview 3.2a GIS Software. Maps and
tables were used for presentations and discussions of results. Finally, it was observed that all the geographic queries carried
out in this research were as a result of the available database, such that when there is a click on any feature, the spatial and
attribute data are easily displayed. The regular up-date of this comprehensive geographic database should be carried out so
that, the decision making bodies can have access to information on rice growth and management in the study area.
Keywords: Database, Plantation, Management,
INTRODUCTION
Background to the Study
Accurate and timely information is necessary to evolve strategies for sustainable management of natural resources.
Today’s “Space Age” supported by computer and communication technologies offer great scope for efficient planning and
management of agricultural resources on scientific principles. Global Positioning System (GPS) and Geographic Information
System (GIS) technologies are of great use to planners in planning for efficient use of national resources at national, state,
and district levels. Application of these technologies in the management of natural resources is increasing rapidly due to great
strides being made through space borne remote sensing satellites in terms of spatial, temporal, spectral and radiometric
Journal of Sustainable Development in Africa (Volume 12, No.6, 2010) ISSN: 1520-5509 Clarion University of Pennsylvania, Clarion, Pennsylvania

295
resolution. Many of the conventional approaches for handling multi thematic information to arrive at optimal solutions are
being computerized using GIS utilities.
Agricultural produce has been the major source of food production in many of the developing nations among which
is Nigeria. On a global and national scale, rapid increase of population has necessitated high demand of food production. It is
therefore imperative to address the changing state of agricultural system as a result of the present day technological
advancement.
Rice is important in Nigeria for several reasons. The trend for the production and consumption of rice is growing
faster than any other food staples. It is a major contributor to internal and sub-regional trade. Rice is also the staple for most
of the peoples in the Niger-Benue trough which divides Nigeria into four parts, Sokoto-Rima Basin in the north-west, Chad
Depression in the north-east, Hadejia-Jamaare trough in the extreme north, and Cross River trough in the south. Farmers find
rice more adaptable than a high input staple like maize when there is declining soil fertility because of the huge array of
varieties they can switch over to every few years (Selbut, 2003). Since it is becoming a staple crop, farmers seem to be
willing to grow it all the time no matter the constraints they are facing. It is therefore mandatory to have adequate knowledge
on meaningful production areas that can allow the decision-makers to identify population that are most liable to food
insecurity and poverty.
Statement of the Research Problem
Referring to the use of agricultural resources, geospatial information is an effective tool for gathering related spatial
data that are capable of identifying a specific crop area in order to reduce problems facing food production in a developing
nation. Various development measures have been put together so as to curb problem of food insecurity in Kwara State -
where the study area falls, resulting from inadequate crop information for proper planning and decision-making. Related to
this is the good intension of the Kwara State Agricultural Development Project with the following overall objectives:
- to provide adequate and reliable data that facilitate information for sound decision-making by the
management;
- to improve planning support to the project in form of annual work plan, mid-year and monthly reviews;
- to conduct planning studies on specific project constraints during implementation.
However, most of the objectives have not been actualized based on the limitations of the scientific tools involved in
crop data gathering and estimation. It is therefore imperative to identify the rice growing areas using Geographic Information
System for sustainable agricultural development. This paper attempts the application of crop information system to the
management of rice plantations in Patigi Local Government Area of Kwara State, Nigeria.
Justification of the Study
To have geospatial information on crop area and yield in most States in Nigeria is difficult. This has led to
misappropriation of land resources evaluation for proper land use strategies. Not only this, patterns of agricultural resource
used and the scope of resource demanded are always changing from time to time. Also, detailed maps on location of major
staple crops like rice are not readily available for the study area.

296
Both state and national planners intending to use multi-disciplinary decision support systems require among others,
adequate information on where crops are grown in order to monitor agricultural production in a given areas (McGuire,
1997). When adequate information on these component parts of the agricultural system are available or can be collected;
political and economic concerns can be addressed through improved management programs.
STUDY AREA
The study was carried out in Patigi Local Government Area (consisting of three districts including Pategi, Lade and
Kpada), which was created from Edu Local Government Area of Kwara State, Nigeria. This area is geographically located
within 80501 N and 50251E of the equator. The location shares common boundaries with Niger state, Kogi State as well as
Edu and Irepodun Local Government Areas (Figure 1 & 2). It has a total land area of about 2924.62sq.km, which is about
5% of the total land area of the state – Kwara State (www.kwarastate.com). Approximately 25% of the land area of the Local
Government is used for farming (Kwara State Agricultural Development Project, 2007).
A humid climate prevails within the study area with two distinct seasons (the wet and dry seasons). The wet season
lasts between April and October while the dry season falls between November and March. The rainfall ranges between
50.8mm during the driest months to 2413.3mm in the wettest months. The minimum average temperature throughout the
state ranges between 21.10c and 25.00c while, maximum average temperature ranges from 300c to 350c (The Met. Office,
2007).
The soil is red laterite of tropical area formed under seasonal rainfall climatic region. Soil aggregation is poor, with
tendency to compact under wet condition. Surface texture is sandy loam. Clay is predominantly kaolite. Soil is about 30-
40% clay especially with depth. The climax vegetation was tropical deciduous forest but the influence of man, especially
farming activities has turned it into dry woodland savanna, which is characterized with scattered trees and tall grasses. As a
result of topographic changes, rainfall differences and edaphic factors, some pockets of other distinct vegetation types are
supported within the study area. Various vegetation species contained here are; Raphia Palm (Raphia Sardomical), eiba
Pentandra, and Lannea Acida among others. Of grasses, Andopogen Tenctorum is evident where the soil is deep and
Morrocymbium Ceresiiforme is frequent in poorer soils (KWADP, 2007).
The study area was chosen because agriculture is the bedrock of its economy and also characterized with various forms of
ecological zones that give rise to different types of crop. The typical cropping systems in the study area are, Rice – based
system, Sugar Cane-based system, Ground Nut -based systems, Millet-based system and Melon cultivation in areas located
along river Niger, the major river in the study area. The major crops cultivated in the location include Rice, Sugar Cane,
Ground Nut, Millet, and Melon and some leafy vegetables. Majority of the food produced are for personal consumption,
while some households sell small amount of the food in the market to earn additional income for household upkeep
(KWADP, 1996).
The total estimated population of Patigi Local Government Area according to National Population Commission
(1991) is about 45,494 (22,712 males, 22,782 females) of which farmers account for about 70% (www. Kwarastate.com).
Agricultural production is largely peasant and small-scale relying heavily on the use of manual labour equipped with crude
implements, while fertilizers, mechanical implement, improved seeds and agrochemicals are also used to some extent
(KWADP, 2007).

297
Figure 1: Map of Kwara State showing Patigi LGAs Source: Kwara State Ministry of Lands and Housing, 1999.
MAP OF NIGERIA

298
Irepo
dun
LGA
Edu
LG
A
Kogi LGA
Kogi LG
A
Niger State Rver Niger
100 0 100 200 Miles
N
EW
S
4°1'01" 4°1'01"
5°2'02" 5°2'02"
6°3'03" 6°3'03"
3°1'01"
3°1'01"
4°2'02"
4°2'02"
5°3'03"
5°3'03"
6°4'04"
6°4'04"3
3
4
4
5
5
6
6
7
7
4 4
5 5
6 6
LEGEND
RIVER NIGER
PATIGI DISTRICT
KPADA DISTRICT
LADE DISTRICT
MATERIALS AND METHODS
Thirty-two locations of the major existing rice fields in Patigi Local Government Area of Kwara State were
identified using Global Positioning System (GPS). The coordinates were taken on districts basis ( Patigi has 13 points, Lade
has 7 points and Kpada has 12), which are in degrees, minutes, and seconds and thereafter converted into Universal Traverse
Mercator (UTM) for easy manipulations). In order to elicit attributes of each of the locations, two hundred and twenty-four
questionnaires were distributed using stratified random sampling technique (i.e. seven questionnaires per each of the 32 Rural
Village Areas).
To create database for Crop Information System, the map of Patigi Local Government Areas was extracted, Geo-
referenced and digitized from the 1:50,000 topographical map of Kwara State (Kwara State Ministry of Land and Housing,
1996). The map was scanned electronically to convert map lines and points into digital form. Thereafter, this was digitized on
screen. Identities of the objects on the map as well as their spatial relationships were then specified. The attributes of rice
fields available were linked to the spatial data with Arcview 3.2a GIS software.
Figure 2: Locational Map of Patigi LGA Source: Kwara State Ministry of Lands and Housing and Authors’ Laboratory work, 2008.

299
The GPS data generated were stored in a relational database, which consist of core dataset (rice points and unique
ID) to which the associated spatial data (X,Y coordinates) stored in tables prepared with Arcview 3.2a GIS software were
linked. Basically, all data collected through different methods and sources were subjected to Geographic Information System
treatment. Spatial searches were carried out to verify and demonstrate the utility of the database created as decision making
tool.
RESULTS AND DISCUSSIONS
Rice Growing Points in Patigi Local Government Area
Various locations where rice grows within the study area were identified and shown in figure 3. This shows the
predominance of rice farming activity in all the districts under study. That is why Selbut (2003) said that Kaduna State, Kogi
State, Kwara State, Niger State and Enugu State, (all in Nigeria) fall under the River Niger drainage system, which is very
favorable for rice production.
Figure 3 : Point Map of Rice Location
Source: Author’s field survey, 2008

300
Database for Crop Information System (CIS)
Table 1: General Database for Crop Information System (CIS)
Source: Author’s Field Survey, 2009.

301
Table 1 (Cont’d)
Source: Author’s Field Survey, 2009.

302
The map of Patigi Local Government Areas was extracted, Geo-referenced and digitized from the 1:50,000
topographical map of map of Kwara State (Kwara State Ministry of Land and Housing, 1996). This was done through hand-
traced with a computer mouse to collect the coordinates of features. An electronic scanning device was also used to convert
map lines and points into digital data. Identities of the objects on the map as well as their spatial relationships were then
specified. The attributes of rice fields available were linked to the spatial data with Arcview 3.2a GIS software. Some other
related information such as location (LGA, District, and Rural Village Areas), Roads, Drainage, Crop (rice yield level,
methods of crop management) were linked together (see Table 1).
The GPS data generated were stored in a relational database, which consist of core dataset (rice points and unique
ID) to which the associated spatial data (X,Y coordinates) stored in tables that were prepared with Arcview 3.2a GIS
software were linked. Basically, all data collected through different methods and sources were subjected to Geographic
Information System treatment through specific GIS software known as Arcview 3.2a version. Attribute tables was created
and linked to the map in ArcView 3.2a software environment with the Universal Trasverse Mercator Projection Coordinate
System of the dataset. In the Arcview GIS environment, the point coordinates of the major rice field locations were imported
into Arcview GIS through the Add Event Theme in the Theme Menu after saving the coordinate generated in Notepad (as
delimited text file) and finally converted to dBASE (dbf) for editing.
Spatial Searches/Queries
Field search
This aspect of the geographic queries allows for specific searches to be made directly on the map. Here, the verifier
would access both the spatial and attribute data by clicking on a point. For instance, a field search was made for Lade district
in Patigi Local Government Areas where rice irrigation scheme is concentrated (see figure 4).

303
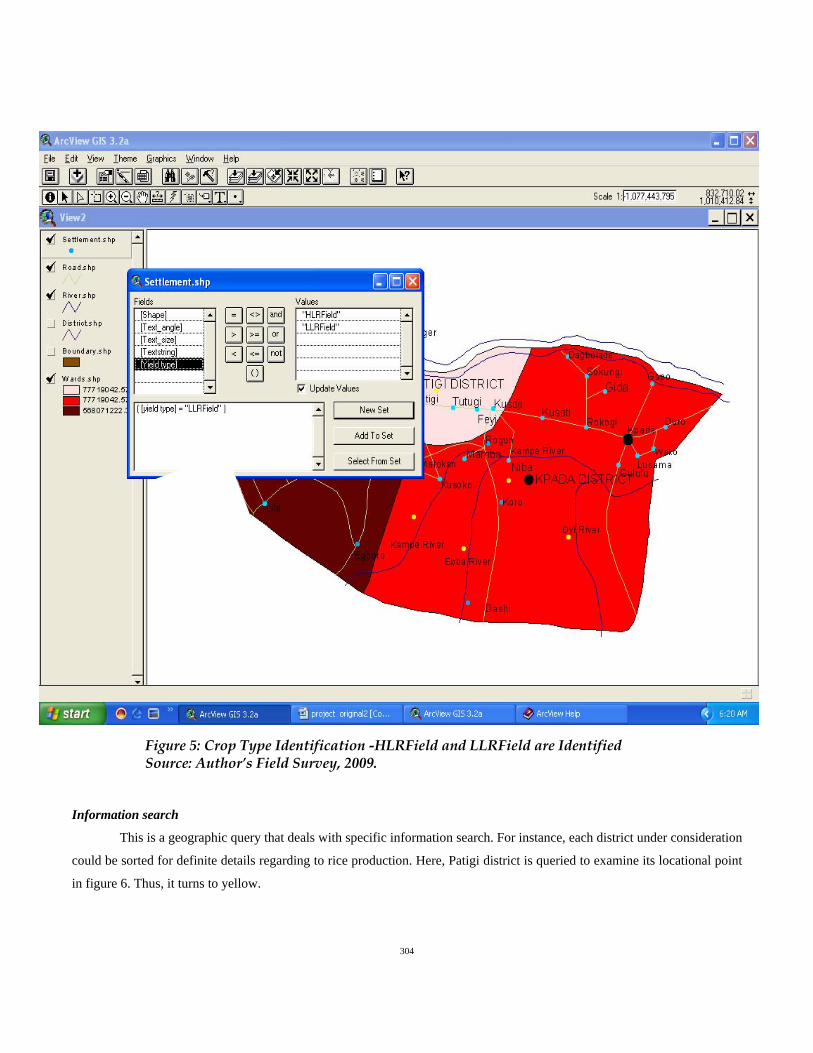
Distance search
This is to find an object located within a definite distance to a given point. The closest Rice fields to Rivers were
queried and turned to yellow, while those ones that are not close turned blue. Hence, the yellow ones are referred to as Low
Land Rice Field (LLRF) and the blues as High Land Rice Field (HLRF) (figure 5).
Figure 4: Lade Identities are Displayed for District Identification Source: Author’s Field Survey, 2009.
304
Figure 5: Crop Type Identification -HLRField and LLRField are Identified Source: Author’s Field Survey, 2009.
Information search
This is a geographic query that deals with specific information search. For instance, each district under consideration
could be sorted for definite details regarding to rice production. Here, Patigi district is queried to examine its locational point
in figure 6. Thus, it turns to yellow.

305
CONCLUSIONS AND RECOMMENDATIONS
In this study, a comprehensive database on Crop Information System (CIS) for sustainable rice production has been
created. This is expected to allow the farm managers and decision makers to carry out more research on what, where, and
how best could this be of benefit in various systems/methods of farming for sustainable rice production.
Both the spatial and the attribute data were created for the purpose of comprehensive decision making in geographic
scope. This has made it to be simply recognized that database is the heart of GIS without which no queries can be done. All
Figure 6: Patigi Area Points are Displayed Source: Author’s Field Survey, 2009.

306
the geographic queries carried out in this research were as a result of the available database, such that when there is a click on
any feature, the spatial and attribute data are easily displayed.
Based on the findings and conclusions of this study, the following recommendations are offered for consideration on
sustainable agricultural development within the policy frame: Regular up-date of this comprehensive geographic database
through which specific site could be sought to know what is obtainable in that particular field or district through a link
between geometric and attribute data. This will enable the decision making bodies to have access to information on each
feature under query and at the same time improve upon them. Government should encourage the development of Crop
Information System (CIS) for all crops in the entire state and Nigeria as a whole.
REFERENCES: Burrough, P.A. (1986), Principles of Geographical Information Systems for Land Resource Assessment, Oxford (England), Clarendon press, 13(4):194. FAO (1999), Crop information System, Remote Sensing for Decision-Makers Series, No. 18, Satellite imagery for a Crop Information System, www.ftp.fao.org/doccis/pdf. KWADP (Kwara State Agricultural Development Project) (1996), Agricultural Issues, Ilorin, Nigeria. KWADP (Kwara State Agricultural Development Project) (2007), Agricultural Issues, Ilorin, Nigeria. Kwara State Ministry of Lands and Housing (1999), Topographical Map of Kwara State, Ilorin, Nigeria. Kwara State Ministry of Lands and Housing and Authors’ Laboratory Work (2008), Topographical Map of Kwara State, Ilorin, Nigeria. McGuire, M. L. (1997), Status Report on Crop Use Intensity (CUI) Applications in the FEWS Project,FEWS, http://www.fews.org/imagery/ag-cui.pdf. National Population Commission (1991), Population Data, Ilorin. Selbut, R. L. (2003), Eco-systems Development Organisation, WIS Partners Building, 5 Lugard, Jos, Plateau State – NIGERIA. The Met. Office (2007), Climatological Data for Agricultural Land Classification, Ilorin, Nigeria. www.kwarastate.com (2009), Kwara State and Local Government Areas Information World Wide Website.
ABOUT THE AUTHORS:
Olabode, A.D., Department of Geography, University of Ilorin, Ilorin, Nigeria.
Dr. Ajibade, L.T., Department of Geography, University of Ilorin, Ilorin, Nigeria.
Dr. Ogunbodede, E.F., Department of Geography and Planning Sciences, Adekunle Ajasin University, Ondo, Nigeria.