application of cpt data for evaluation of ground liquefaction in chi-chi earthquake, taiwan d.h. lee...
TRANSCRIPT
Application of CPT data for evaluation of ground liquefaction in
Chi-Chi Earthquake, Taiwan
D.H. Lee1 , C.S. Ku2, C.S. Chen1, C.H. Juang3 &J.H. Wu3
1National Cheng Kung University, Taiwan2I-Shou University, Taiwan3Clemson University, USA
Acknowledgment
This study was sponsored by the National Science Council of Taiwan
(Grant No. : NSC 91-2211-E-214-006)
Evaluation of ground liquefaction in the Chi-Chi, Taiwan earthquake using CPT data
CPT equipment and test procedure CPT data of the liquefied areas Soil resistance change of the liquefied area Post earthquake assessment of liquefaction CPT-based liquefaction curve Summary and Conclusion
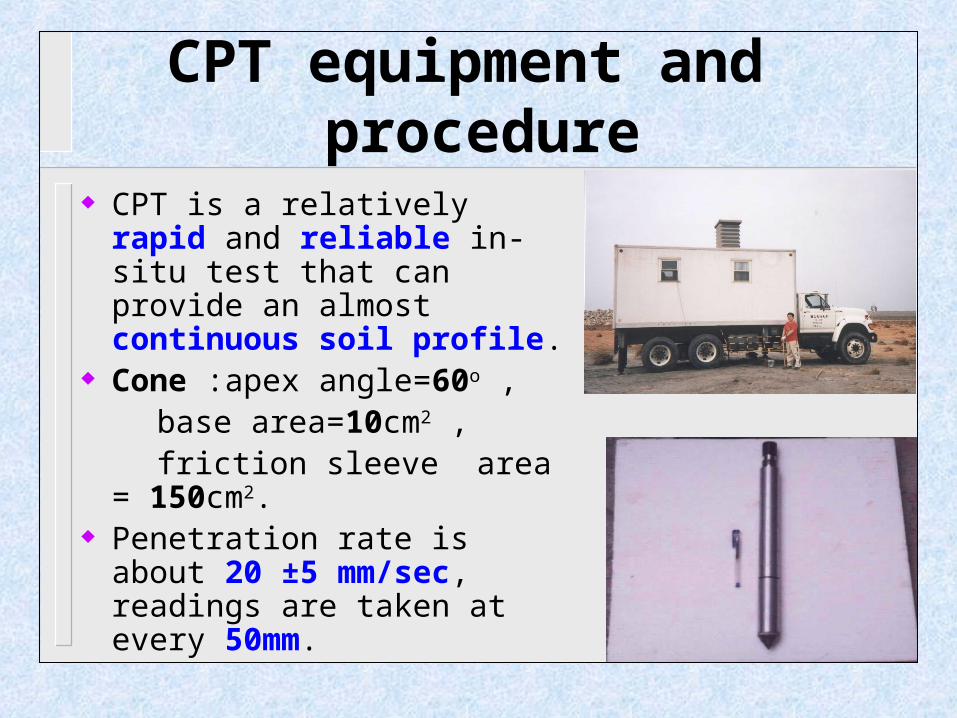
CPT equipment and procedure
CPT is a relatively rapid and reliable in-situ test that can provide an almost continuous soil profile.
Cone :apex angle=60o , base area=10cm2 , friction sleeve area = 150cm2. Penetration rate is about 20
±5 mm/sec, readings are taken at every 50mm.
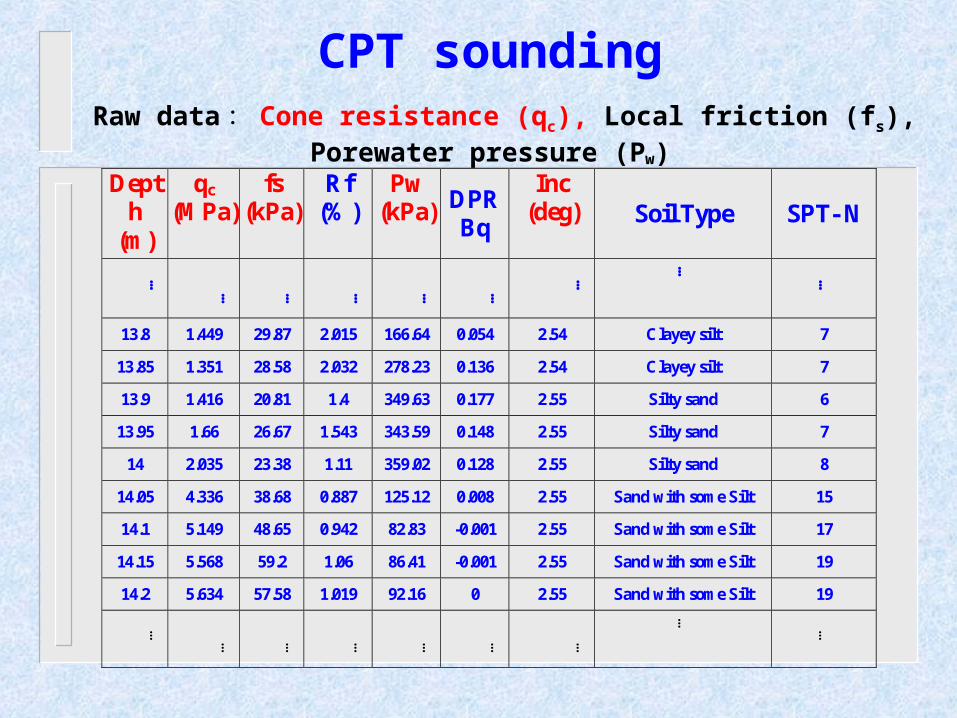
CPT sounding Raw data : Cone resistance (qc), Local friction (fs), Porewater pressure
(Pw)
Depth
(m)
qc (MPa)
fs (kPa)
Rf (%)
Pw (kPa) DPR
Bq
Inc (deg) Soil Type SPT- N
… …
…
…
…
…
…
… …
13.8 1.449 29.87 2.015 166.64 0.054 2.54 Clayey silt 7
13.85 1.351 28.58 2.032 278.23 0.136 2.54 Clayey silt 7
13.9 1.416 20.81 1.4 349.63 0.177 2.55 Silty sand 6
13.95 1.66 26.67 1.543 343.59 0.148 2.55 Silty sand 7
14 2.035 23.38 1.11 359.02 0.128 2.55 Silty sand 8
14.05 4.336 38.68 0.887 125.12 0.008 2.55 Sand with some Silt 15
14.1 5.149 48.65 0.942 82.83 -0.001 2.55 Sand with some Silt 17
14.15 5.568 59.2 1.06 86.41 -0.001 2.55 Sand with some Silt 19
14.2 5.634 57.58 1.019 92.16 0 2.55 Sand with some Silt 19
… …
…
…
…
…
…
… …
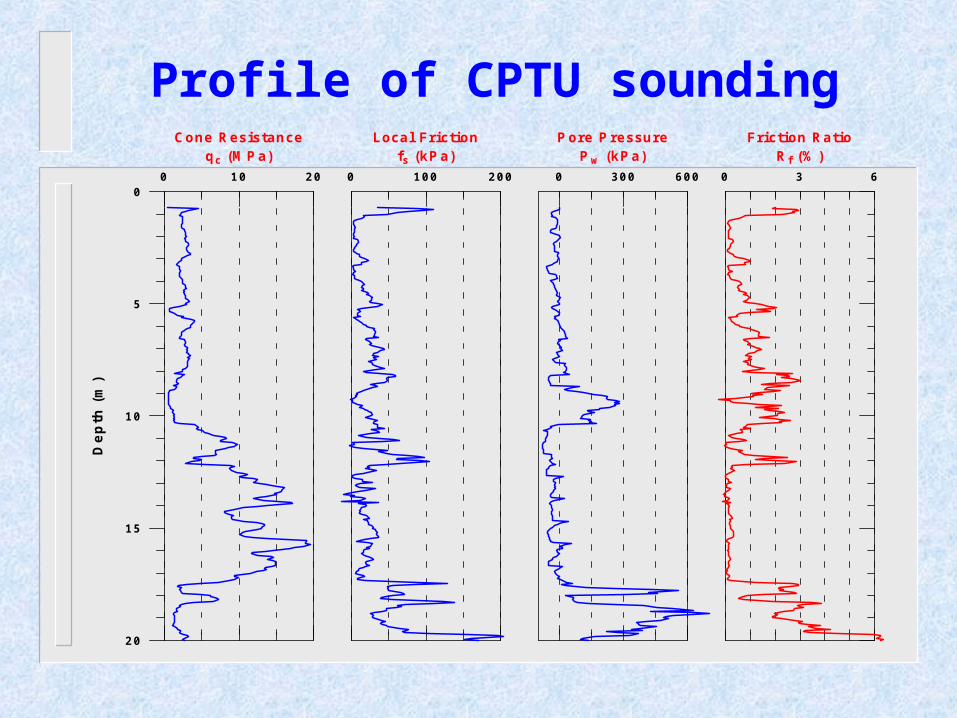
Profile of CPTU sounding
0
5
10
15
20
Dep
th (
m)
0 10 20
C one R esistanceqc (M P a)
0 100 200
Local Frictionfs (kP a)
0 300 600
P ore P ressureP w (kP a)
0 3 6
Friction R atioR f (% )
CPT data of the liquefied area
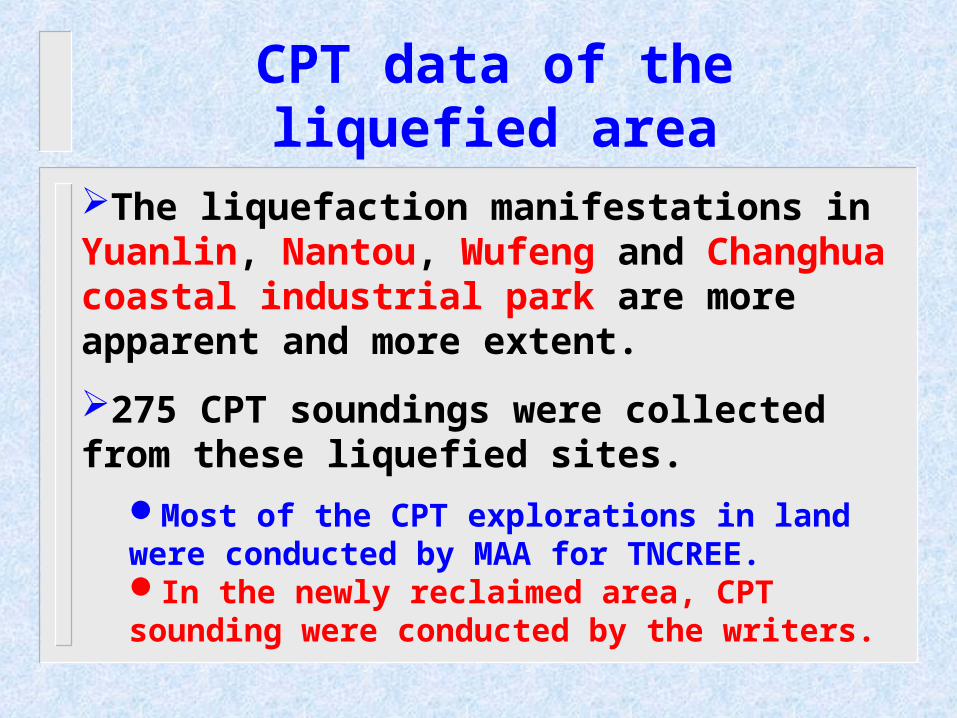
The liquefaction manifestations in Yuanlin, Nantou, Wufeng and Changhua coastal industrial park are more apparent and more extent.
275 CPT soundings were collected from these liquefied sites.
Most of the CPT explorations in land were conducted by MAA for TNCREE.In the newly reclaimed area, CPT sounding were conducted by the writers.
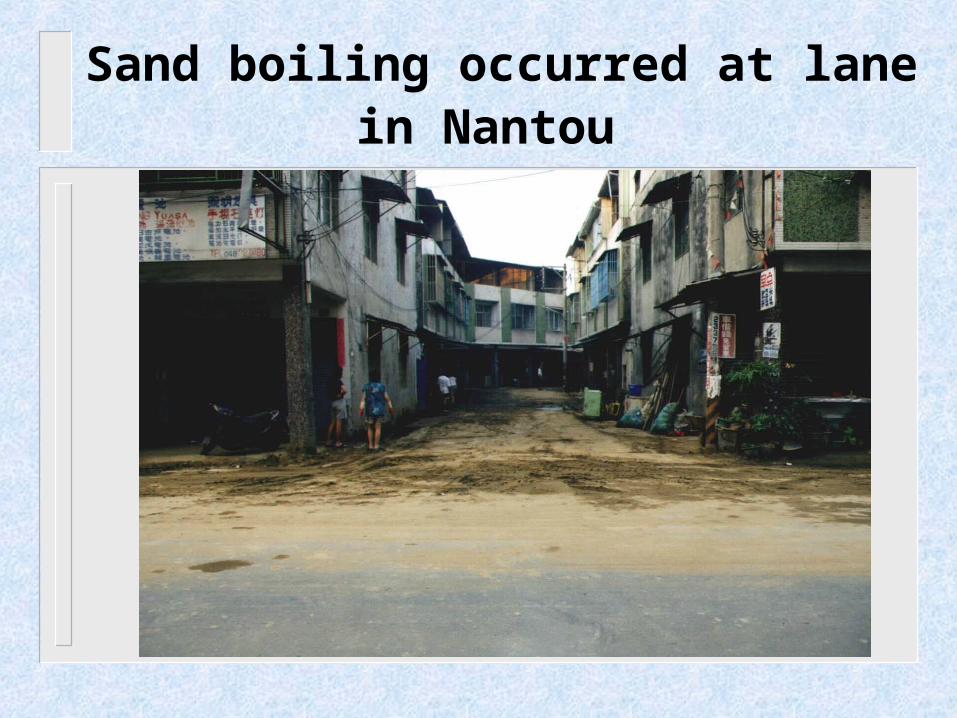
Sand boiling occurred at lane in Nantou
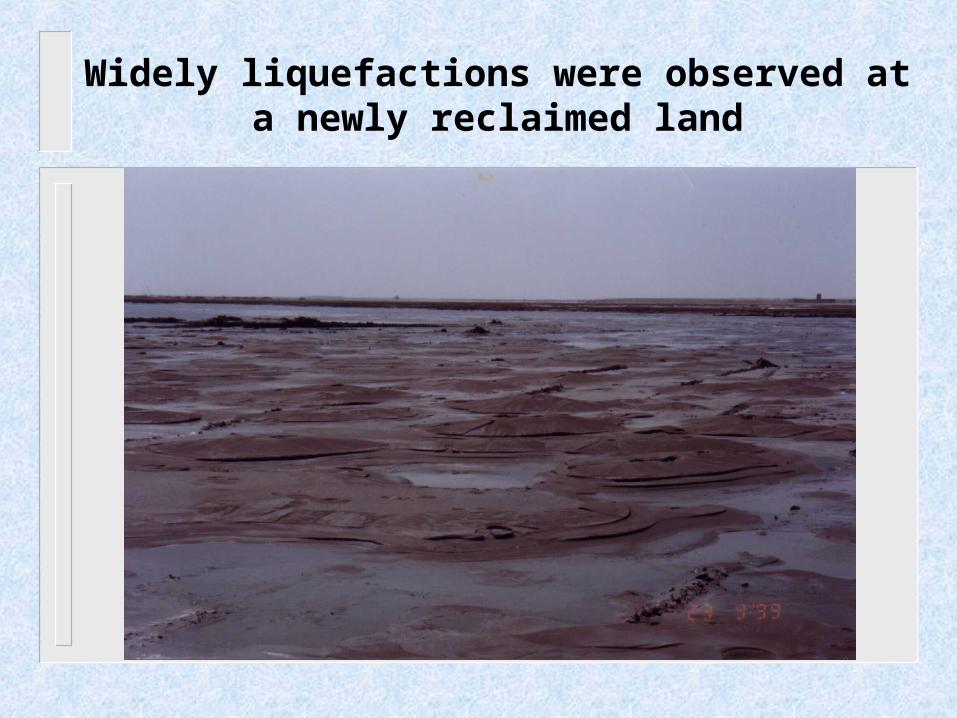
Widely liquefactions were observed at a newly reclaimed land
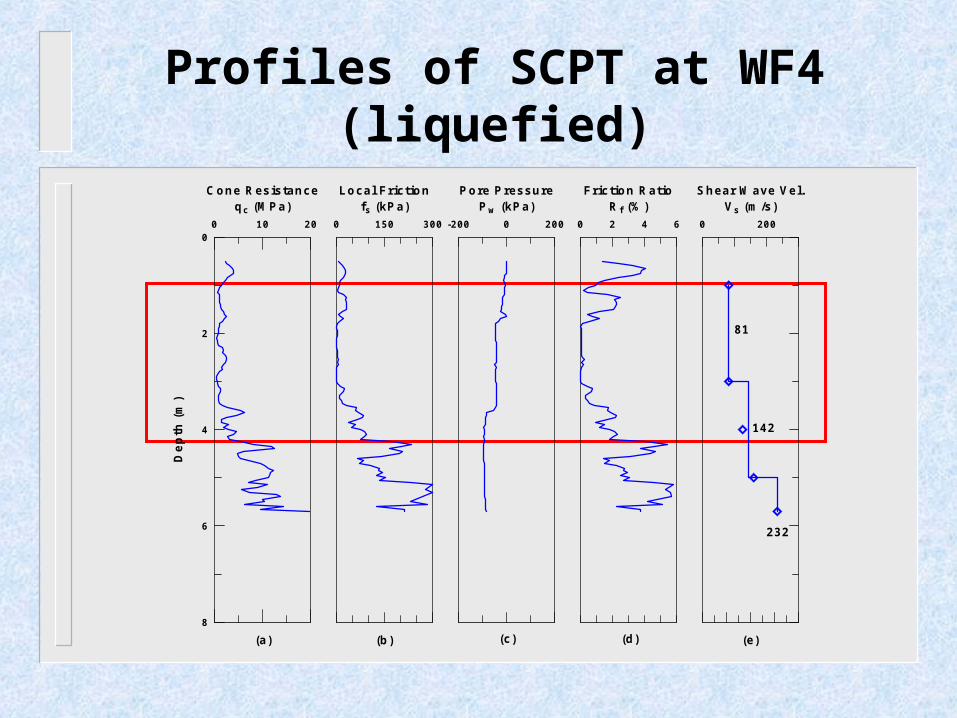
Profiles of SCPT at WF4 (liquefied)
0
2
4
6
8
Dep
th (
m)
0 10 20
Cone Resistanceqc (MPa)
0 150 300
Local Frictionfs (kPa)
-200 0 200
Pore PressurePw (kPa)
0 2 4 6
Friction RatioR f (% )
0 200
Shear W ave Vel.Vs (m /s)
81
142
232
(a) (b) (c) (d) (e)
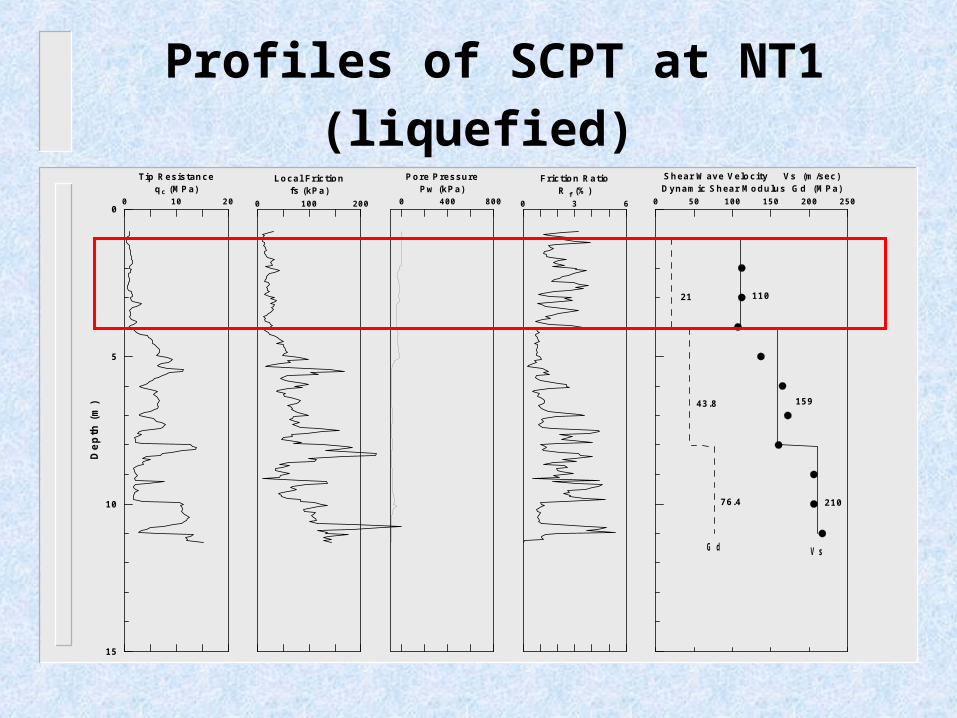
Profiles of SCPT at NT1 (liquefied)
0
5
10
15
Dep
th (
m)
0 10 20
Tip Resistanceqc (MPa)
0 400 800
Pore PressurePw (kPa)
0 50 100 150 200 250
Shear W ave Velocity Vs (m/sec)Dynamic Shear Modulus Gd (MPa)
43.8
76.4
159
210
V sG d
0 100 200
Local Frictionfs (kPa)
0 3 6
Friction RatioR f (% )
11021
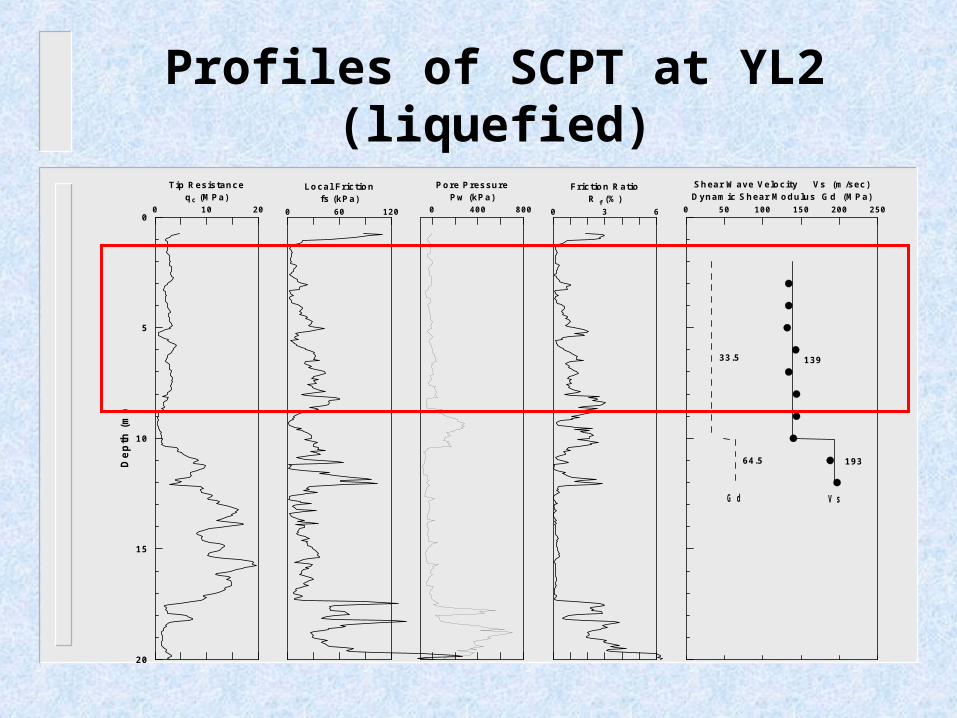
Profiles of SCPT at YL2 (liquefied)
0
5
10
15
20
Dep
th (
m)
0 10 20
Tip Resistanceqc (MPa)
0 400 800
Pore PressurePw (kPa)
0 50 100 150 200 250
Shear W ave Velocity Vs (m/sec)Dynamic Shear Modulus Gd (MPa)
33.5
64.5
139
193
V sG d
0 60 120
Local Frictionfs (kPa)
0 3 6
Friction RatioR f (% )
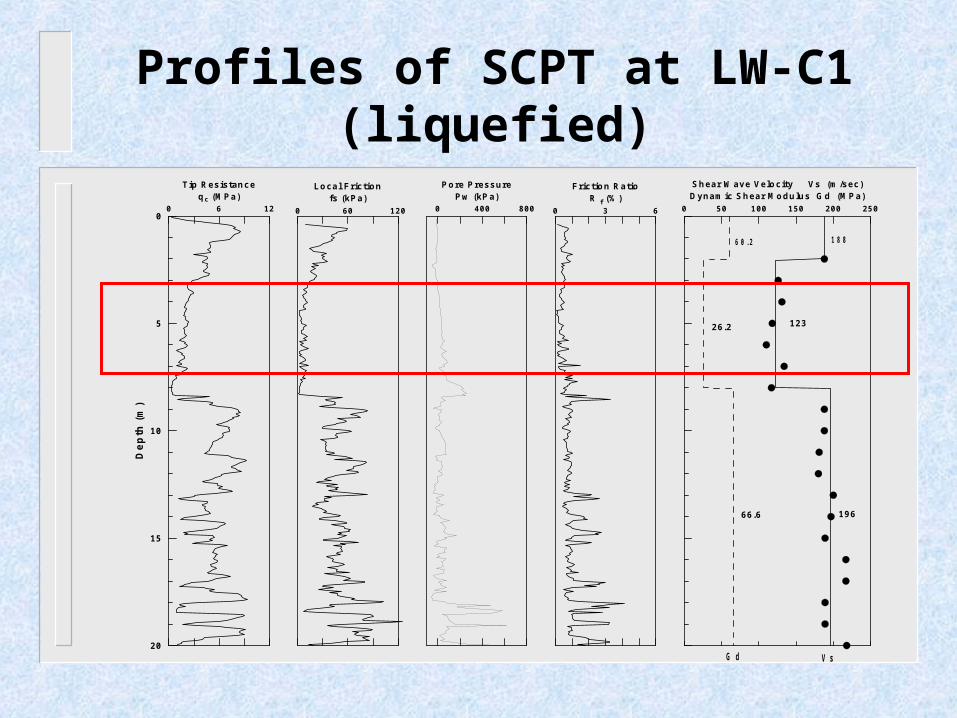
Profiles of SCPT at LW-C1 (liquefied)
0
5
10
15
20
Dep
th (
m)
0 6 12
Tip Resistanceqc (MPa)
0 400 800
Pore PressurePw (kPa)
0 50 100 150 200 250
Shear W ave Velocity Vs (m/sec)Dynamic Shear Modulus Gd (MPa)
26.2
66.6
123
196
V sG d
60.2 188
0 60 120
Local Frictionfs (kPa)
0 3 6
Friction RatioR f (% )
Geotechnical Characteristic of the liquefied area
According to these SCPT soundings at the liquefied area, the continuous sandy soil (SP, SP-SM, SM) with low cone resistance and slow Vs were observed, it could be the most susceptible liquefaction layer.
Soil resistance change of the liquefied area
It is a interesting that the alteration of the soil characteristics with time at the liquefied site after an earthquake.
The CPT are employed at the same location but in different time (November, 1999, July, 2000, and May, 2002), and the results were used to check the soil resistance change of the liquefied area.
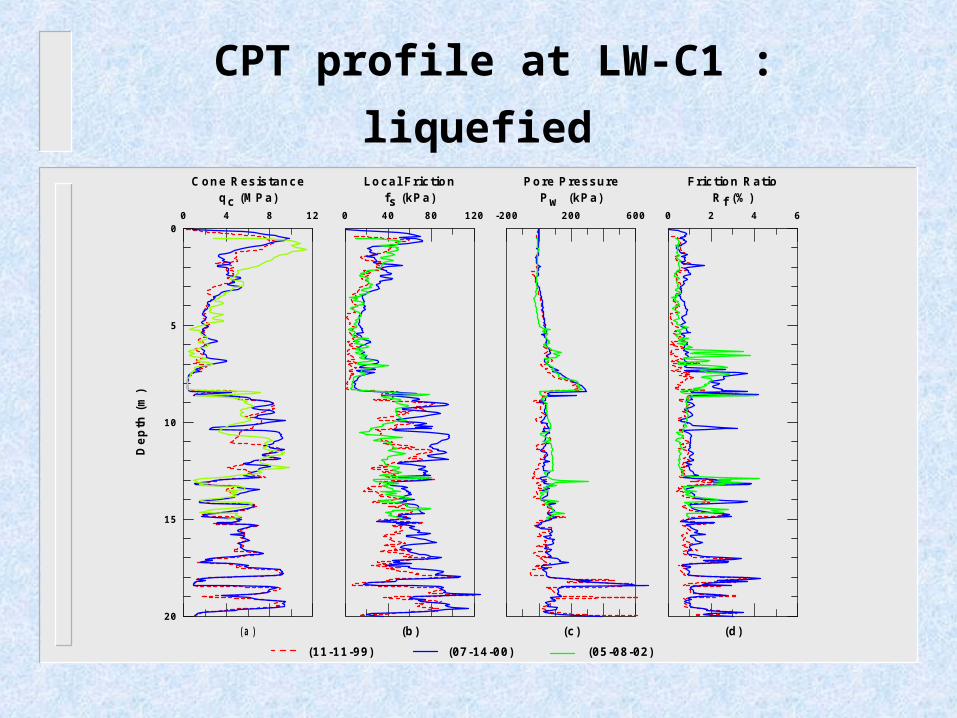
CPT profile at LW-C1 : liquefied
(a)
0
5
10
15
20
Dep
th (
m)
0 4 8 12
Cone Resistanceqc (M Pa)
(b)
0 40 80 120
Local Frictionfs (kPa)
-200 200 600
Pore PressurePw (kPa)
(c)
0 2 4 6
Friction RatioRf (% )
(d)
(11-11-99) (07-14-00) (05-08-02)
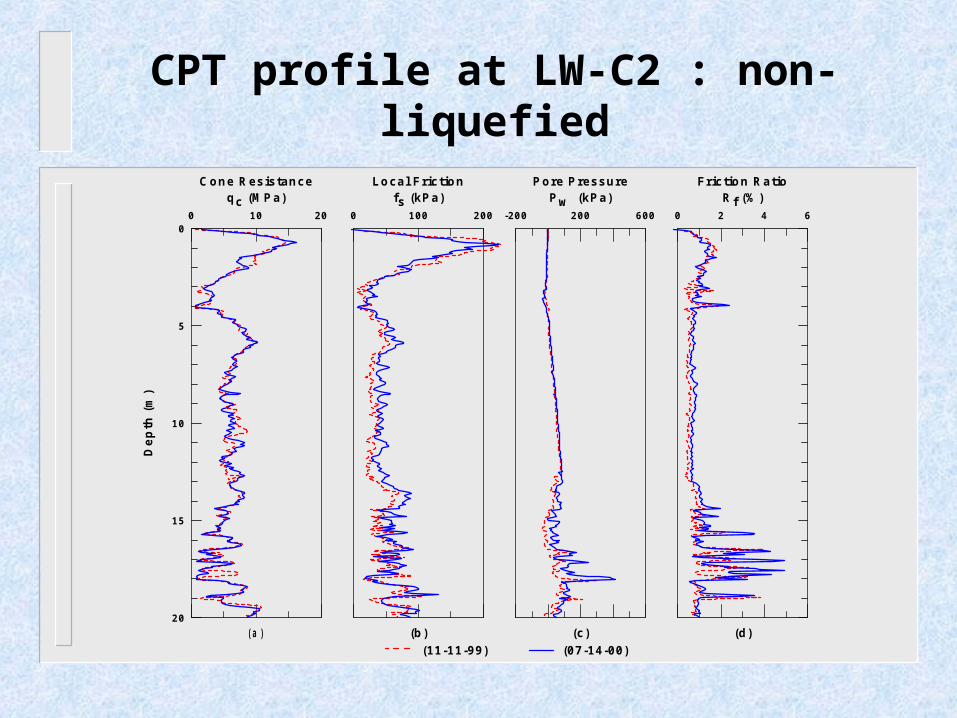
CPT profile at LW-C2 : non-liquefied
(a)
0
5
10
15
20
Dep
th (
m)
0 10 20
Cone Resistanceqc (M Pa)
(b)
0 100 200
Local Frictionfs (kPa)
-200 200 600
Pore PressurePw (kPa)
(c)
0 2 4 6
Friction RatioRf (% )
(d)(11-11-99) (07-14-00)
Soil resistance change of the liquefied area
The CPT profiles of LW- C1, wherein the sand boil occurred, the changes of qc data were relatively small.
The CPT profiles of LW- C2, non-liquefied evidence observed therein, the qc, fs and porewater pressure are no obvious difference between the two stages soundings.
Post earthquake assessment of liquefaction
Simplified methods Vs-based method SPT-based method CPT- based method
Olsen (1981~1997)
Robertson (1983~1998)
Juang (1999~2003): probabilistic methods
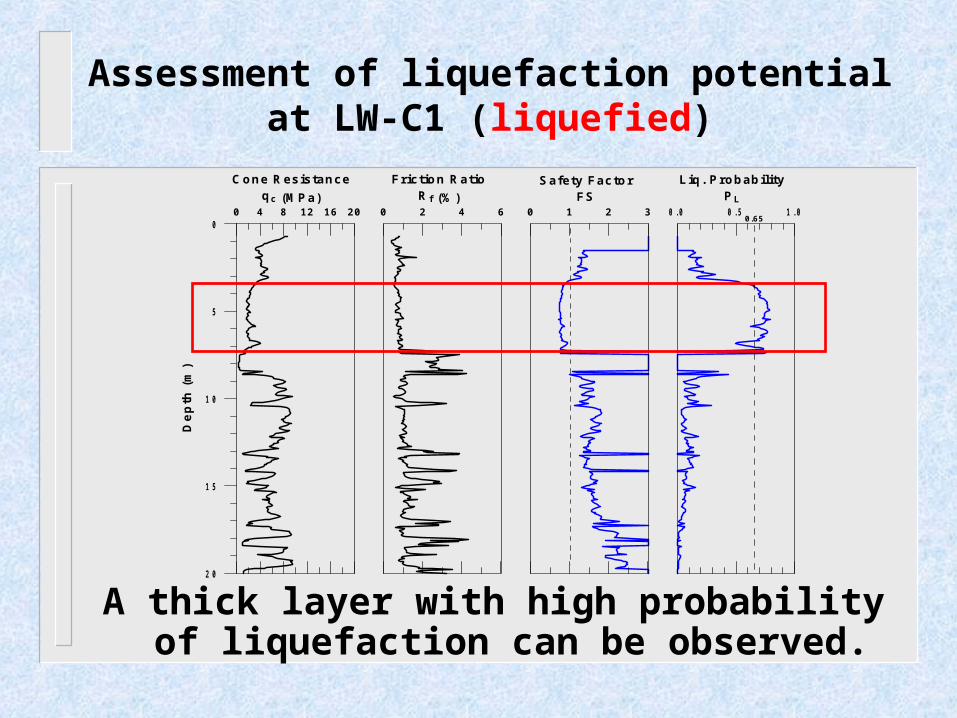
Assessment of liquefaction potential at LW-C1 (liquefied)
A thick layer with high probability of liquefaction can be observed.
0 1 2 3
Safety FactorFS
2 0
1 5
1 0
5
0
Dep
th (
m)
0 2 4 6
Friction RatioR f (%)
0 . 0 0 . 5 1 . 0
Liq. ProbabilityPL
0 4 8 12 16 20
Cone Resistanceqc (MPa)
0.65
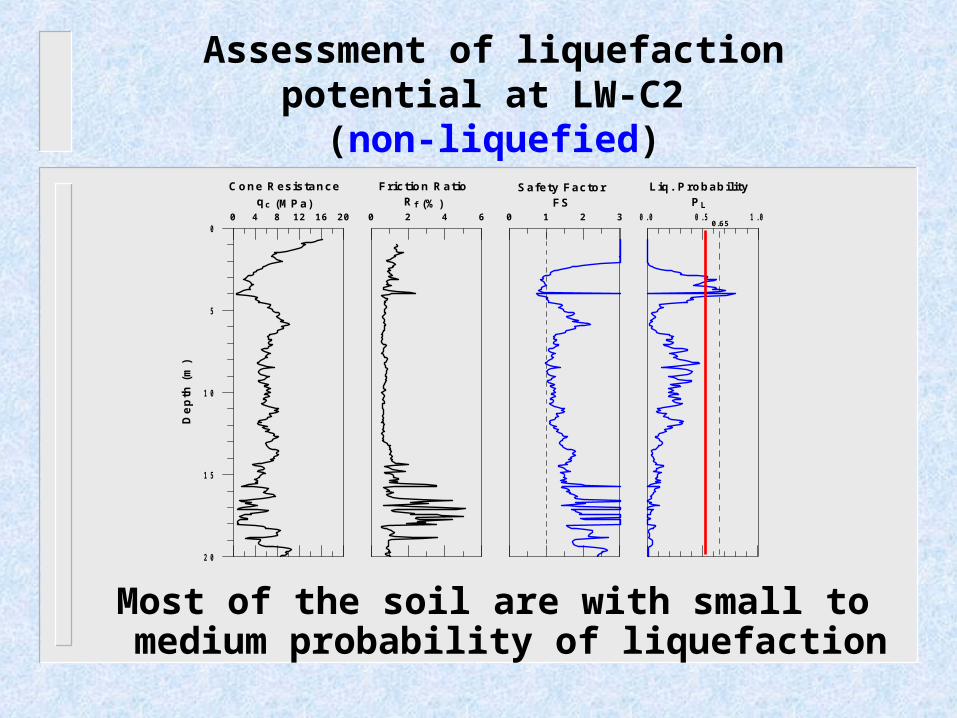
Assessment of liquefaction potential at LW-C2 (non-liquefied)
Most of the soil are with small to medium probability of liquefaction
0 1 2 3
Safety FactorFS
2 0
1 5
1 0
5
0
Dep
th (
m)
0 2 4 6
Friction RatioR f (%)
0 . 0 0 . 5 1 . 0
Liq. ProbabilityPL
0 4 8 12 16 20
Cone Resistanceqc (MPa)
0.65
CPT-based liquefaction curve
※Liquefaction or non-liquefaction
The sounding could be judged as the occurrence of liquefaction when the liquefaction phenomena such as sand boils, ground subsidence, lateral spread and building settlement are observed on the ground.
※The liquefaction related phenomena only indicate that the liquefactions occur in the place but not the precise location or depth.
Evaluation Criteria
The liquefied soil could be disturbed to a loose state and has lower cone resistance value.
The resistance of the non-liquefaction soil have insignificant changes and are almost the same as their original values. The sandy soil with normal high cone resistance values could be considered as non-liquefaction.
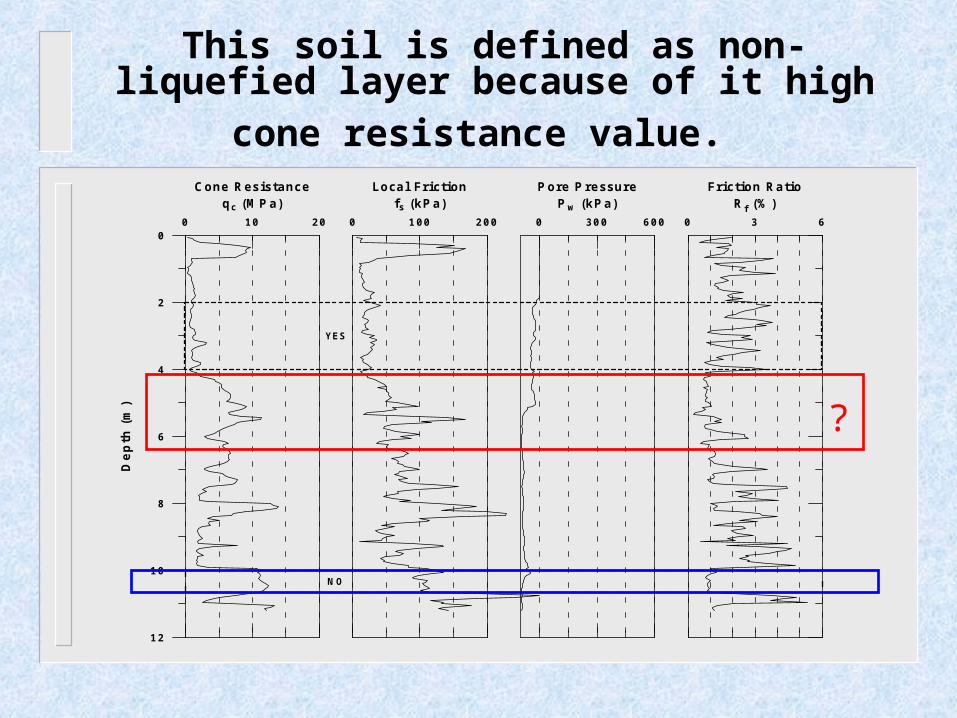
This soil is defined as non-liquefied layer because
of it high cone resistance value.
0
2
4
6
8
10
12
Dep
th (
m)
0 10 20
C one R esistanceqc (M P a)
0 100 200
Local Frictionfs (kP a)
0 300 600
P ore P ressureP w (kP a)
0 3 6
Friction R atioR f (% )
YES
N O
?
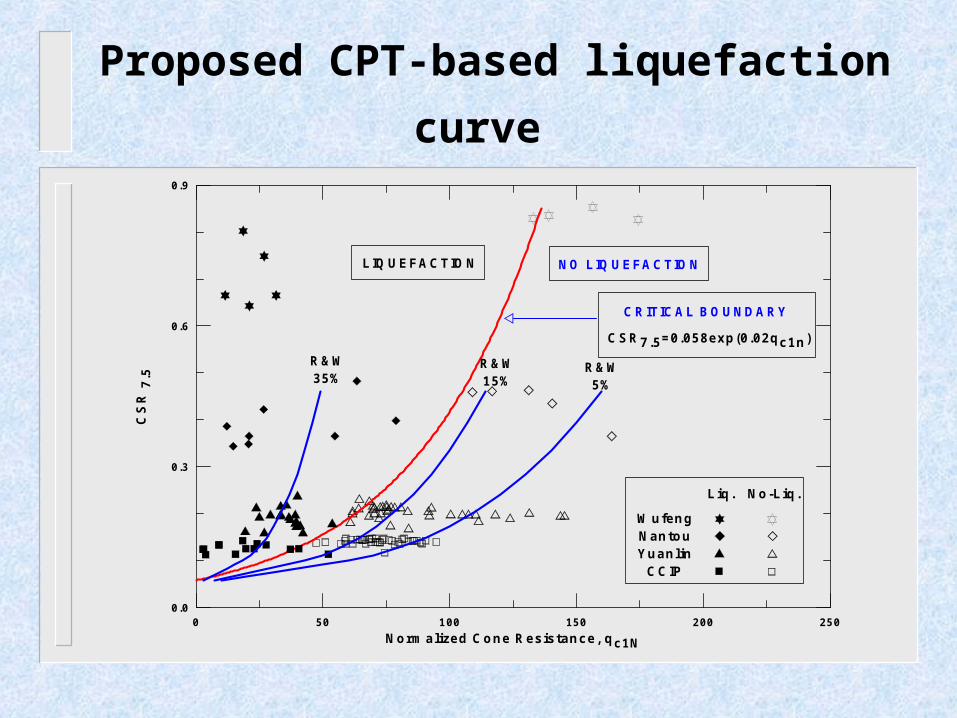
Proposed CPT-based liquefaction curve
0 50 100 150 200 250Norm alized Cone Resistance, qc1N
0.0
0.3
0.6
0.9
CS
R 7
.5
LIQUEFACTION NO LIQUEFACTION
W ufengNantouYuanlin
CCIP
Liq. No-Liq.
CRITICAL BOUNDARY
CSR7.5=0.058exp(0.02qc1n)
R&W35%
R&W15%
R&W5%
Summary and Conclusion
A thick continuous loose sandy soil with low resistance and slow shear wave velocity were measured, and this layer could be the most susceptible to liquefaction.
From the liquefied and not liquefied CPT soundings of the different periods after the Chi-Chi earthquake, the soil resistances in the liquefied zone almost don’t change.
Summary and Conclusion (cont.)
A site with liquefaction experiences in an earthquake will not necessarily reduce its liquefaction potential in the future seismic events.
According to the proposed judgment criteria of liquefaction or non-liquefaction in this study, 46 liquefaction cases and 88 non-liquefaction cases could be derived from the 43 CPT soundings in the liquefied areas during Chi-Chi earthquake.
The endThanks for your attention