application of bet ef to mount etna: a retrospective ... et al... · giovanni distefano1, carmelo...
TRANSCRIPT
Application of BET_EF to Mount Etna: a retrospective analysis (years 2001-2005)
Alfonso Brancato1,*, Stefano Gresta1, Salvatore Alparone2, Daniele Andronico2, Alessandro Bonforte2,Tommaso Caltabiano2, Ornella Cocina2, Rosa Anna Corsaro2, Renato Cristofolini1, Giuseppe Di Grazia2,Giovanni Distefano1, Carmelo Ferlito1, Salvatore Gambino2, Salvatore Giammanco2, Filippo Greco2,Rosalba Napoli2, Laura Sandri3, Jacopo Selva3, Giuseppina Tusa1,2, Marco Viccaro1
1 Università di Catania, Dipartimento di Scienze Geologiche, Catania, Italy2 Istituto Nazionale di Geofisica e Vulcanologia, Sezione di Catania, Osservatorio Etneo, Catania, Italy3 Istituto Nazionale di Geofisica e Vulcanologia, Sezione di Bologna, Bologna, Italy
ANNALS OF GEOPHYSICS, 54, 5, 2011; doi: 10.4401/ag-5346
ABSTRACT
Advances in volcano monitoring and forecasting need amultidisciplinary collaborative framework. In light of this, a BayesianEvent Tree (BET) approach was performed by the application of the BETfor Eruption Forecasting (BET_EF) code to analyze the space-timedistribution of the volcanic activity of Mount Etna from 2001-2005.First, a reliable monitoring dataset was set up after some sessions toelicit geophysical, volcanological and geochemical ‘precursor’parameters. A constant unrest probability of 100%, with a magmainvolvement usually greater than 95%, was computed throughout thetime period analyzed. Eruption probabilities higher than 90% wereestimated a few days before the onsets of the 2001 and 2002-2003 flankeruptions. Values slightly higher than 75% were observed during the lavafountaining period in June-July 2001. However, the probabilitiesflattened to around 30% for the 2004-2005 flank eruption. With suitabledata, a good depiction of the actual location of the eruptive scenario forthe 2001 and 2002-2003 events was provided. Conversely, the size of theeruptions was not indicated.
1. IntroductionOne of the major goals of modern volcanology is to set
up sound risk-based decision making for land-use planningand emergency management. This topic has maximumpriority especially for volcanoes located close to denselyurbanized areas, such as Mount Etna.
This necessarily requires improvements to the presentsurveillance of volcanic systems, to allow near real-timeaccurate responses through the use of innovative andboundary techniques. Volcanic hazard must be managedwith reliable estimates of quantitative long-term and short-term eruption forecasting; however, the large number of
observables that are involved in any volcanic process suggeststhat a probabilistic approach is probably the most suitabletool in forecasting.
Two styles of eruptive activity typically occur for MountEtna [i.e. Cristofolini et al. 1988]. Persistent gas emissions andfrequent strombolian eruptions, which are sometimesaccompanied by minor lava flows, take place from one ormore of the four prominent summit craters: the CentralCrater, Bocca Nuova, the North-East Crater, and the South-East Crater. Instead, flank eruptions occur less frequently (atintervals of years), and they originate from fissures thatusually open progressively downwards from near thesummit; their durations can span from days to years.
The aim of the present study was for a retrospectiveanalysis to quantify the probabilistic estimations of eruptionsand relative vent locations for suitable lava-flow hazardassessment for Mount Etna volcano, through the applicationof the Bayesian Event Tree for Eruption Forecasting(BET_EF) code [Marzocchi et al. 2004, 2008]. Following thepioneering test run that was performed with the BET_EFcode for the 2001 flank eruption of Mount Etna volcano[Brancato et al., in press], we wanted to estimate theprobabilities along a selected path (Figure 1a) for the timeperiod of January 2001 to April 2005.
The present application represents the first efforts at anopen-conduit active volcano to merge all of the relevantmonitoring information in a truly objective manner, and overa long time span of more than four years. The initial resultssuggested that the monitoring dataset adopted was suitable toaddress how a future eruption might progress for Mount Etnavolcano. In addition, the 2001 flank eruption is considered asa changing point in some of the internal dynamics of the
Article historyReceived November 22, 2010; accepted June 15, 2011.Subject classification:Experimental volcanism, Volcano monitoring, Volcanic risk, Statistical analysis, Collections.
Special Issue: V3-LAVA PROJECT
642

volcano, and the parameters values gave some new insightsinto the post-2001 condition. Therefore, the pre-existing 2001dataset ( January 1-July 23 2001) [Brancato et al., in press], isreviewed, and is merged with the post-2001 values. First, thisleads to a review of the probabilities estimated for the 2001eruption. Then the BET_EF code is applied for 2002-2005,during which period there were two further Mount Etna flankeruptions, from October 2002 to January 2003, and fromSeptember 2004 to March 2005. Finally, the inter-eruptive timeperiod is also analyzed.
2. The Bayesian Event Tree for Eruption Forecasting code(version 2.1)
The BET_EF model is based on the event tree philosophyas assessed by Newhall and Hoblitt [2002]. The concepts ofvent location, epistemic and aleatory uncertainties, and afuzzy approach for monitoring measurements, that is neededto simulate the expert opinion with a given degree of anomalyof the parameters observed, are considered in the present
version of the code. All of the technical details are describedin Marzocchi et al. [2008], and we refer the reader to that studyfor all of the settings of the code.
Nevertheless, some brief explanation is due. A BET is agraphic representation of a specialized branching of eventsin which the individual branches are alternative steps from ageneral prior event, and where they evolve into increasinglyspecific subsequent states. Then, this BET attempts tographically display all of the relevant possible outcomes ofvolcanic unrest in progressively higher levels of detail. Theprocedure is set to estimate an a-priori probabilitydistribution based upon theoretical knowledge, toaccommodate this using past data, and to modify this furtherusing current monitoring data.
The code is divided into five nodes. The first three nodes,1, 2 and 3, have two possible outcomes, and are mutuallyexclusive and exhaustive in the time interval [t0, t0 + x]. Thelast two nodes, 4 and 5, are set by the user (Figure 1a). Here,t0 is the time at which the volcano is in an unrest condition,
643
BRANCATO ET AL.
Figure 1. a) General scheme of the BET_EF code (selection of the path, within the event tree), as adapted for the present application. b) Simplified flow-chart of the run process.

644
and x represents the forecast time window set on the basis ofthe observed typical time scale of the variations of the stateof the volcano under study. In our case, we fixed x= 1 week,coherent with the number of weeks in which unrest has beenexperienced [Brancato et al., in press].
Generally speaking, node 1 refers to the probability ofhaving unrest in the above time interval, node 2 refers to theprobability of having magmatic unrest (other causes can beconsidered as well; e.g. hydrothermal or tectonic activity)under the condition where unrest is detected, and node 3refers to the probability that magma will reach the surfaceafter the magmatic unrest (i.e. the occurrence of aneruption). The following node 4 refers to the probability thatthe eruptive vent will be located at a specific site, andprovided that an eruption is ongoing; the final node 5 refersto the probability of the size/style of an eruption that occursat a specific vent location.
The code consists of nonmonitoring and monitoringcomponents, which are computed by Bayesian inference. Forthe nonmonitoring component, the a-priori distribution ateach node describes general knowledge about that specificnode (e.g. expert opinion and/or similar volcanic activityworldwide). This is represented by a ‘best-guess’ probability,as well as a relative weight that is expressed as a number K ofequivalent data [Marzocchi et al. 2004, 2008].
The a-priori distribution of the monitoring componentis derived using parameters that are usually managed andmeasured during volcano surveillance procedures. Then, thisa-priori distribution is adapted according to a likelihoodfunction if past data are available from actual monitoredunrest or eruptive events.
When no unrest is observed, long-term forecasting isestablished, whereas, by using monitoring data, the code canbe used calculate short-term estimates inside the forecasttime window.
For long-term forecasting, an a-priori model that dealswith the present tectonic and volcanic structure of MountEtna is considered. The model is mainly based on the past ventlocations of the flank eruptions for Mount Etna over the last400 years [Project V3-Lava 2010]. Considering the variations inthe information through time, and its relationship to thestructural setting of the volcano, we can also define an a-posteriori probability map for the next vent opening.
For short-term forecasting of vent opening hazardassessment, the monitoring has a leading role. This is primarilybased on seismological data, which are integrated withground deformation, geochemical, petrological, gravimetricand magnetic parameters. Specific monitoring parameters areset only for the first three nodes, and all of the parameters setfor the preceding nodes can be suitable for assessment of thefuture vent-opening probability. Parameter values describe the‘state’ of Mount Etna volcano, and they are more detailedthrough the subsequent nodes of the code.
3. Mount Etna volcano monitoring and eliciting themonitoring parameters
Mount Etna is one of the best monitored volcanoesworldwide. The aim of this monitoring is to define the state ofits activity through detection and measurement of some of theparameters that are directly linked to deep magma movements.Although the origins of these precursor phenomena wereknown in the past, it was only starting from the early 1960s thatthe data were collected routinely, when different instrumentalnetworks were deployed on the volcanic edifice.
Seismic precursors include both volcano-tectonicearthquakes and volcanic tremors, which are typical of open-conduit volcanoes, and which arise mainly due to the gasesinside the conduit. Increasing trends for both of theseparameters are usually observed when a flank eruption takesplace [Alparone et al. 2003, Patanè et al. 2003, Bonaccorso etal. 2004, Falsaperla et al. 2005].
Strain deformation arises when an uplifting of thevolcanic edifice occurs. These uplifts usually increase untilthe magma reaches the surface [Bonaccorso et al. 2002,Bonforte et al. 2004, Aloisi et al. 2006].
Gravimetric and magnetic data can be linked to magmaintrusive processes. As with the above parameters,gravimetric and magnetic data show increasing trends duringan unrest phase, prior to an upcoming eruption [Carbone etal. 2003, Del Negro et al. 2004, Carbone and Greco 2007].
The geochemical fluids here considered are the emissionsof SO2 and CO2 from the summit crater and the soil,respectively. Both of these parameters are usually observed tohave a decreasing trend some months before the occurrenceof a flank eruption [Bruno et al. 2001, Aiuppa et al. 2004].
Finally, petrological analysis allows the reconstructionof the eruptive dynamics through a study of the magmacomposition [Andronico et al. 2005, Corsaro et al. 2009].
These relative measurements, and the analysis andinterpretation of these parameters, can provide anunderstanding of whether Mount Etna is evolving towardsvolcanic activity.
For the present BET_EF application to Mount Etna, weneed to look at the monitoring component as the mostinformative part of the short-term forecasting. Therefore,the monitoring parameters have to be reliably set, as well asthe relative thresholds, the inertia time window of theexpected anomaly, and the weights.
An elicitation process based on discussions was used toprovide the whole dataset used in the present study. Theexperiment here involved the researchers who usuallymanage the monitoring data for Mount Etna, through directcall-up. Several meetings took place among the authors of thepresent study, as experts in at least one of the above-citeddisciplines, and a reliable dataset of monitoring parametersfor nodes 1, 2 and 3 was set up. A feedback process producedimproved work-flow between the qualitative and quantitative
APPLICATION OF BET_EF TO MOUNT ETNA
BRANCATO ET AL.
645
Input Parameter Data/Thresholds/Inertia Wa/Kb
NODE 1: Unrest/No Unrest
Prior distribution No info (uniform distribution)
Past data n1=1047 weeks; y1=36
Number of earthquakes (D≥200 km; M=5+; Tyrrhenian slab) >1 day–1; 90 days
Number of VT earthquakes (M=3+; Pernicana Fault) >1,3 day–1; 60 days
Number of VT earthquakes (D≥20 km; M=3+; NW sector) >1, 3 month–1; 150 days
Number of VT earthquakes (M=1+) >5-50 day–1; 180 days
Tremor amplitude duplication in 24 h =1; 30 days
W flank dilatation >0.011; 0.016 nstrain day–1; 365 days
Serra Pizzuta – M. Stempato line >0.027; 0.055 nstrain day–1; 180 days
M. Silvestri – Bocche 1792 line >0.027; 0.082 nstrain day–1; 180 days
EDM >0.068; 0.096 nstrain day–1; 365 days
Deformation Pernicana Fault >0.008; 0.019 cm day–1; 90 days
Clinometric variation (>0.033 nrad day–1 ; CDV station) =1; 365 days
SO2 emission* <1000-1500 ton day–1; 90 days
CO2 emission (P39 station) >2000-3000 g m–2 day–1; 180 days
Gravity (E-W profile) >0.33; 0.50 ngal day–1; 60 days
Gravity (N-S profile; seasonal) >0.50; 0.67 ngal day–1; 60 days
Ash emission =1; 90 days
NODE 2: Magma/No Magma
Prior distribution 0.95 1b
Past data No data
Number of VT earthquakes (M=2+; W sector) >10, 15 day–1; 90 days 2a
Number of VT earthquakes (D<5 km) >3-10 day–1; 90 days 2a
Number of seismic swarms (>30 earthquakes day–1) =1; 60 days 2a
W flank dilatation >0.010, 0.015 nstrain day–1; 365 days 1a
Serra Pizzuta – M. Stempato line >0.055, 0.548 nstrain day–1; 180 days 1a
M. Silvestri – Bocche 1792 line >0.080, 0.548 nstrain day–1; 180 days 1a
Clin. Variation of the mean (CDV, MNR, MSC stations) >0.6-1.2; 1 day 2a
SO2 emission >2000-5000 ton day–1; 30 days 1a
CO2 emission (P78 station) >120-250 g m–2 day–1; 60 days 1a
Gravity (E-W profile) >0.50, 1.00 ngal day–1; 30 days 1a
Gravity (N-S profile; seasonal) >0.67, 1.33 ngal day–1; 30 days 1a
Presence of juvenile material =1; 90 days 1a
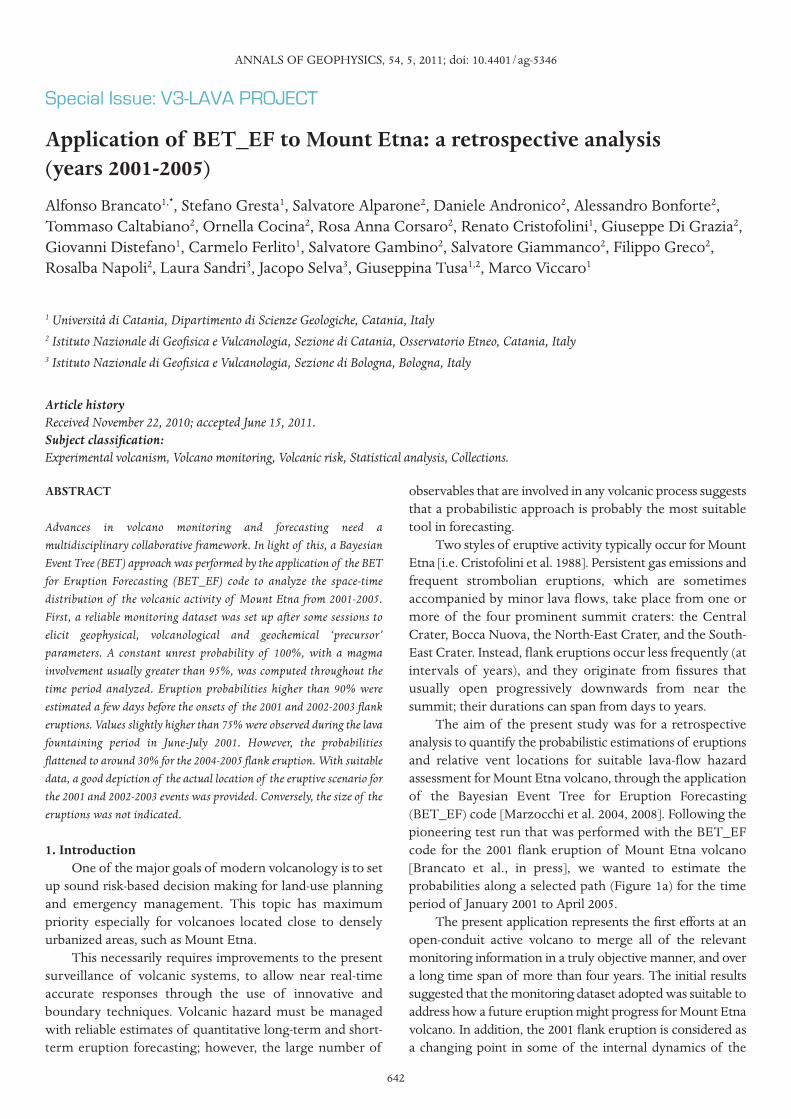
Figure 2. Numerical evolution of the monitoring dataset, as retrieved from the elicitation sessions.

646
information (Figure 1b). After the test case [Brancato et al., inpress], a fifth and final session took place for the finalconsiderations and comments. An initial dataset of 51parameters (56, after the second session; Figure 2) wasconsidered. By thorough examination, some parameters wereseen to be clones or strongly correlated with others, hencethey were included in those parameters that showed broaderfeatures. A final collection of 48 parameters was retained(Figure 2). At the moment, because of some difficulties inretrieving reliable data, only 42 out of these 48 parametersare routinely considered. Tremor data in node 1 is availableonly up to July 31, 2001, and in node 3, only up to July 23,2001. Therefore, given the lack of more information, afterthese dates the relative values were set as nonanomalous.
The magnetic parameter deserves further discussion. Itwas set well for nodes 1 and 2, whereas it showed someincoherence for node 3, because the expected variations werenot fully supported by the data acquired. For this reason, themagnetic parameter is discarded for the present analysis, thusreducing the final dataset to 39 parameters (Table 1).
An important question was to consider the parametersaccording to Boolean or fuzzy approaches. Since theapplication is monitoring, an expression of the state of thevolcano is required that is based on threshold levels of theparameters. A Boolean approach could be a crude decisionbecause a single threshold would only distinguish betweentwo possible states (anomalous or not anomalous).
Indeed, a system can evolve to an anomalous state
APPLICATION OF BET_EF TO MOUNT ETNA
Input Parameter Data/Thresholds/Inertia Wa/Kb
NODE 3: Eruption/No Eruption
Prior distribution No info (uniform distribution)
Past data n3=36; y3=26
Number of VT earthquakes (D<5km) >40-100 day–1; 1 day 2a
Number of VT events >70-100 day–1; 1 day 2a
Tremor (STA/LTA maximum peak) >2, 4 day–1; 1 day 1a
W flank dilatation >0.014, 0.027 nstrain day–1; 30 days 1a
Serra Pizzuta – M. Stempato line >0.548, 1.918 nstrain day–1; 30 days 1a
M. Silvestri – Bocche 1792 line >0.548, 1.918 nstrain day–1; 30 days 1a
Clin. Variation of the mean (CDV, MNR, MSC stations) >1.2-2.5; 1 day 2a
SO2 emission >8000-11000 ton day–1; 7 days 1a
CO2 emission (P78 station) <0-120 g m–2 day–1; 7 days 1a
Gravity (E-W profile) >1.00, 1.67 ngal day–1; 15 days 1a
Gravity (N-S profile; seasonal) >1.67, 2.00 ngal day–1; 15 days 1a
NODE 4: Vent location
Prior distribution See text for details
Past data See text for details
NODE 5: Eruption size (five sizes, according past data)
Prior distribution �size 1=0.40
�size 2=0.16
�size 3=0.02
�size 4=0.26
�size 5=0.16
Past data y5size1=17
y5size2=7
y5size3=1
y5size4=11
y5size5=7a weight of the monitoring parameter; b number of the equivalent data for non-monitoring components; *<500-1000 ton day−1; 90 days (since August15 2001, after July-August 2001 flank eruption)
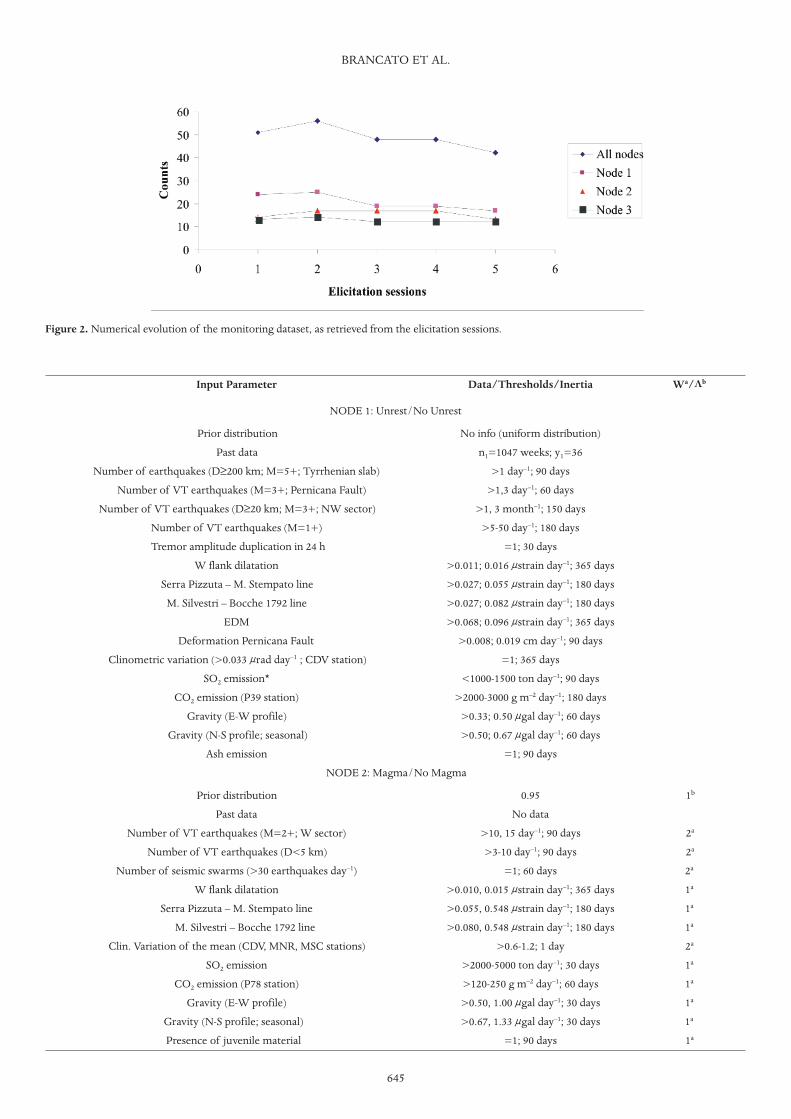
Table 1. Summary of the BET_EF input information (prior models, past data and monitoring parameters) for the 2001-2005 period analyzed. Thethresholds and inertia of the collected parameters are also shown.
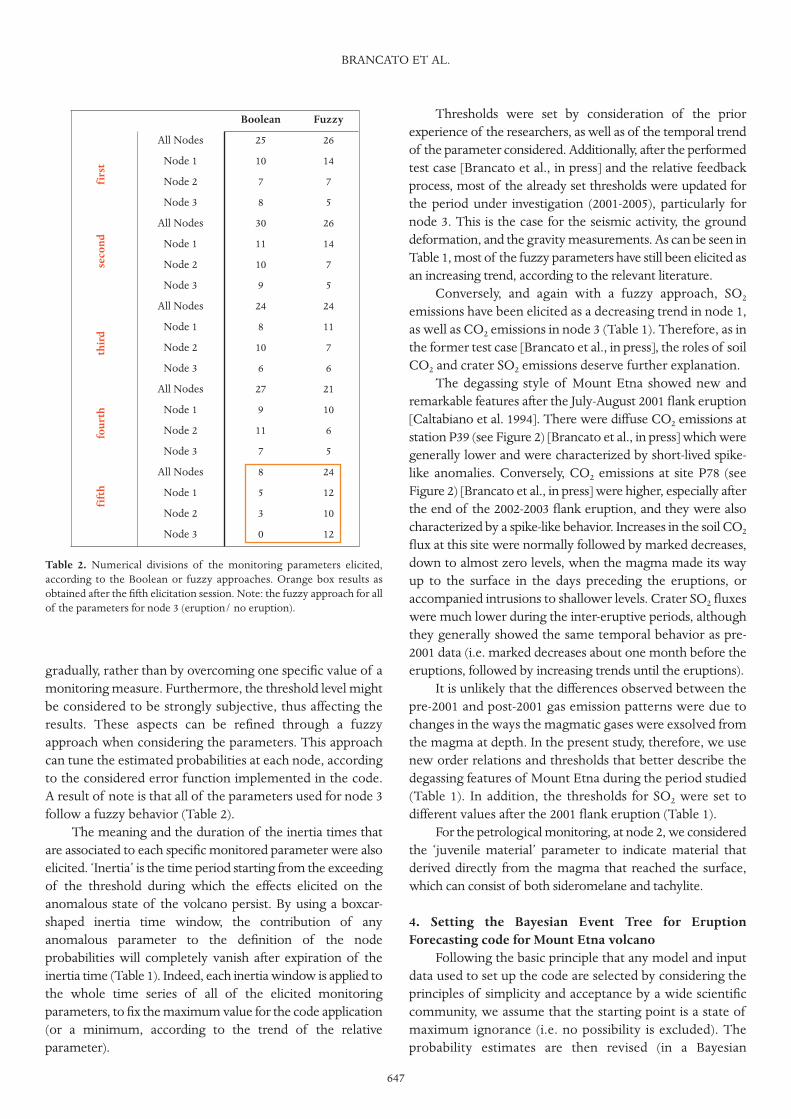
gradually, rather than by overcoming one specific value of amonitoring measure. Furthermore, the threshold level mightbe considered to be strongly subjective, thus affecting theresults. These aspects can be refined through a fuzzyapproach when considering the parameters. This approachcan tune the estimated probabilities at each node, accordingto the considered error function implemented in the code.A result of note is that all of the parameters used for node 3follow a fuzzy behavior (Table 2).
The meaning and the duration of the inertia times thatare associated to each specific monitored parameter were alsoelicited. ‘Inertia’ is the time period starting from the exceedingof the threshold during which the effects elicited on theanomalous state of the volcano persist. By using a boxcar-shaped inertia time window, the contribution of anyanomalous parameter to the definition of the nodeprobabilities will completely vanish after expiration of theinertia time (Table 1). Indeed, each inertia window is applied tothe whole time series of all of the elicited monitoringparameters, to fix the maximum value for the code application(or a minimum, according to the trend of the relativeparameter).
Thresholds were set by consideration of the priorexperience of the researchers, as well as of the temporal trendof the parameter considered. Additionally, after the performedtest case [Brancato et al., in press] and the relative feedbackprocess, most of the already set thresholds were updated forthe period under investigation (2001-2005), particularly fornode 3. This is the case for the seismic activity, the grounddeformation, and the gravity measurements. As can be seen inTable 1, most of the fuzzy parameters have still been elicited asan increasing trend, according to the relevant literature.
Conversely, and again with a fuzzy approach, SO2
emissions have been elicited as a decreasing trend in node 1,as well as CO2 emissions in node 3 (Table 1). Therefore, as inthe former test case [Brancato et al., in press], the roles of soilCO2 and crater SO2 emissions deserve further explanation.
The degassing style of Mount Etna showed new andremarkable features after the July-August 2001 flank eruption[Caltabiano et al. 1994]. There were diffuse CO2 emissions atstation P39 (see Figure 2) [Brancato et al., in press] which weregenerally lower and were characterized by short-lived spike-like anomalies. Conversely, CO2 emissions at site P78 (seeFigure 2) [Brancato et al., in press] were higher, especially afterthe end of the 2002-2003 flank eruption, and they were alsocharacterized by a spike-like behavior. Increases in the soil CO2flux at this site were normally followed by marked decreases,down to almost zero levels, when the magma made its wayup to the surface in the days preceding the eruptions, oraccompanied intrusions to shallower levels. Crater SO2 fluxeswere much lower during the inter-eruptive periods, althoughthey generally showed the same temporal behavior as pre-2001 data (i.e. marked decreases about one month before theeruptions, followed by increasing trends until the eruptions).
It is unlikely that the differences observed between thepre-2001 and post-2001 gas emission patterns were due tochanges in the ways the magmatic gases were exsolved fromthe magma at depth. In the present study, therefore, we usenew order relations and thresholds that better describe thedegassing features of Mount Etna during the period studied(Table 1). In addition, the thresholds for SO2 were set todifferent values after the 2001 flank eruption (Table 1).
For the petrological monitoring, at node 2, we consideredthe ‘juvenile material’ parameter to indicate material thatderived directly from the magma that reached the surface,which can consist of both sideromelane and tachylite.
4. Setting the Bayesian Event Tree for EruptionForecasting code for Mount Etna volcano
Following the basic principle that any model and inputdata used to set up the code are selected by considering theprinciples of simplicity and acceptance by a wide scientificcommunity, we assume that the starting point is a state ofmaximum ignorance (i.e. no possibility is excluded). Theprobability estimates are then revised (in a Bayesian
BRANCATO ET AL.
647
Table 2. Numerical divisions of the monitoring parameters elicited,according to the Boolean or fuzzy approaches. Orange box results asobtained after the fifth elicitation session. Note: the fuzzy approach for allof the parameters for node 3 (eruption/ no eruption).
Boolean Fuzzy
All Nodes 25 26
Node 1 10 14
Node 2 7 7
Node 3 8 5
All Nodes 30 26
Node 1 11 14
Node 2 10 7
Node 3 9 5
All Nodes 24 24
Node 1 8 11
Node 2 10 7
Node 3 6 6
All Nodes 27 21
Node 1 9 10
Node 2 11 6
Node 3 7 5
All Nodes 8 24
Node 1 5 12
Node 2 3 10
Node 3 0 12
fifth fo
urth third secon
d first

648
framework) based on the availability of robust and widelyaccepted models and data.
In the following, we give a brief explanation of thechoices made at each node. As aforementioned, each nodeconsists of a nonmonitoring (distinct in a-priori distributionand past likelihood data) and a monitoring component.
For node 1 (unrest/no unrest), no information isavailable for the a-priorimodel; then, a uniform distribution(representing maximum ignorance) is assumed. For the pastdata, we used the instrumental seismic catalog for MountEtna for the period January 1978 to December 2000. In thistime interval (23 years; 1200 weeks), we counted the numberof unrest episodes (eruptive or not). Considering that
noneruptive unrest episodes were roughly defined bylooking at the average daily rate of earthquakes occurringon Mount Etna (on average, 3 events per day), we defined anunrest episode as when 35 earthquakes per week wasreached. Based on this broad definition, we counted 26unrest episodes with no eruptions for a total of 56 weeks. Inthe same period, the volcano experienced 10 flank eruptions,for a total of 133 weeks. This totals 36 unrest episodes(eruptive or not) that were spread over a period of 1047weeks (Table 1). This last is calculated as the differencebetween the whole period (1200 weeks) and the total time(189 weeks) during which Mount Etna was in unrest(eruptive or not), summed to the total of 36 episodes.
APPLICATION OF BET_EF TO MOUNT ETNA
Figure 3. a) Graphic output of the BET_EF software package for the absolute probability estimate for node 3 (eruption node), when no unrest is observed.Blue rectangular box, median probability calculated for the non-monitoring component; the errors are also shown (10th and 90th percentile). Redrectangular box, average probability. b) Map showing the space-time probability of an eruptive vent opening when no unrest is observed.

For the monitoring component, we collected 16parameters. The relative order relations, thresholds, andinertia time windows (in days) are shown in Table 1.
For the nonmonitoring component of node 2 (magma/no magma), a probability of magmatic unrest (an a-prioridistribution), given the occurrence of an unrest, is set to 95%(as usually assumed worldwide for volcanoes such as MountEtna; Newhall, personal communication). This valueindicates that 95% of the unrest episodes are of magmaticorigin. The number of equivalent data K [Marzocchi et al.2008] is equal to 1, thus indicating the large uncertainty. Nopast data are available for this node.
For the monitoring component, a total of 12 parameterswas set (Table 1). The weights are not the same for all ofthese parameters. Although the whole monitoring datasetcan be considered as very significant for the presence ofmagma, a weight of 2 is assigned only to the seismic and tiltparameters (Table 1). Indeed, as they are monitored daily,these parameters are more indicative than the others that areretrieved from seasonal or occasional campaigns. No pastmonitored events are present.
For node 3 (eruption/ no eruption), no information isavailable for the a-priori distribution; hence, a uniform modelis assumed. For past data, considering this period of January1978 to December 2000, 10 unrest episodes of the 36 weremarked by eruptions (see node 1; Table 1).
For the monitoring component, we consider 11parameters (Table 1). As for node 2, a weight of 1 is assigned bydefault, whereas a weight of 2 highlights the strong eruptionforecasting capacity of the seismic and tilt parameters (Table 1).
For the vent location (node 4), we provide the samegraphical framework as proposed for the previous test case(Figure 3b) [Brancato et al., in press].
Taking into account past vent locations and fracturelocation datasets, in particular based on the flank eruptivehistory of the volcano during the last 400 years [Project V3-Lava 2010], we considered a grid area that was divided into484 squared cells (22 × 22; each cell has a surface of 1 km2;Figure 3b). Cells #231, #232, #253 and #254 enclose thesummit crater area.
Mount Etna has experienced 43 flank eruptive episodesover the last 400 years [Project V3-Lava 2010]. Table 3summarizes these data, as distinct per duration (<45 or >45days) and volume (1-30, 30-100, >100 106 m3) of erupted lava.
A vent opening probability must be assigned to each cell.Considering the geographical distribution of the known 43flank eruptions (Figure 4), we discriminate the case when oneor more vents are located inside a cell. Thus, probabilities of3%, 8% and 12% are arbitrarily assigned if a cell has one, twoor three (one case) historical vents within it, respectively. Inaddition, it is evident that the eastern slope of the volcano ismore active than the western slope (Figure 4). To take thisinto account, we introduce the so-called flank factor; namely,
a value that ‘weights’ the different flank activities accordingly.Values of 66% (for the eastern flank) and 33% (for the westernflank) multiply the above probabilities, respectively. Finally, tonormalize the probability density function, we assign a valueof 0.1% for those cells surrounding the summit area, and0.01% moving towards the external margins of the grid, toreach the minimum of 0.005% along the borders.
The counts of past eruptive vents inside each cell are usedto shape the likelihood function. No specific monitoringparameters are set for this node, but all of the parameters setfor the preceding nodes might be suitable to assess the futurevent opening probability [Marzocchi et al. 2008]. In particular,we considered seismic activity and tilt recording sets in nodes1, 2 and 3 as the most significant for the next vent opening, asthese are especially localized.
For the final node 5, the theoretical approach has shownto date that no monitoring parameter can provide insightsinto the size and style of an impending eruption [e.g. Sandri
BRANCATO ET AL.
649
Figure 4. Location of the vents (black stars) of the flank eruptions thatoccurred for Mount Etna over the last 400 years [data from Project V3-Lava 2010]. Thin black line, eastern coast of Sicily.
Table 3.Double entrance (duration of eruption; volume of erupted lava)table of data representing the 43 flank eruptions over the last 400 yearsthat occurred on Mount Etna volcano [data from Project V3-Lava 2010].
Volume (106 m3)
Duration (days)
1 - 30 30 - 100 > 100
< 45 17 (40%)Size 1
7 (16%)Size 2
0 (0%)==
> 45 1 (2%)Size 3
10 (23%)Size 4
8 (19%)Size 5

650
et al. 2004]. Due to the lack of detailed information, for thea-priorimodel, we simply identified five classes with no zeroprobability value (from size 1 to size 5), by considering onlythe 43 flank eruptions that have occurred for Mount Etnavolcano over the last 400 years (Tables 1 and 3). Again, therelative counts are used to shape the likelihood function atnode 5 (Tables 1 and 3).
5. ResultsThe probability estimates are based on both
nonmonitoring components (a-priori models and past data)and monitoring parameters.
Considering only the nonmonitoring componentsprovides forecasting that is associated with no observedunrest. On the contrary, using the monitoring parameters,
APPLICATION OF BET_EF TO MOUNT ETNA
Date Node 1 Node 2 Node 3
20/04/2001 100% 94.8% 52.6%
21/04/2001 100% 93.7% 45.5%
22/04/2001 100% 95.6% 63.0%
23/04/2001 100% 95.0% 43.0%
07/05/2001 100% 96.3% 63.0%
08/05/2001 100% 95.2% 43.5%
09/05/2001 100% 96.2% 73.4%
10/05/2001 100% 95.5% 44.9%
04/06/2001 100% 94.0% 43.7%
05/06/2001 100% 95.5% 43.9%
06/06/2001 100% 95.9% 64.5%
07/06/2001 100% 94.7% 73.2%
08/06/2001 100% 95.5% 61.8%
09/06/2001 100% 95.0% 73.0%
10/06/2001 100% 94.9% 61.8%
11/06/2001 100% 94.9% 73.9%
12/06/2001 100% 96.4% 62.5%
13/06/2001 100% 96.9% 73.6%
14/06/2001 100% 96.6% 44.7%
15/06/2001 100% 96.0% 75.1%
16/06/2001 100% 96.0% 44.4%
17/06/2001 100% 95.5% 73.5%
18/06/2001 100% 94.2% 45.8%
19/06/2001 100% 95.2% 73.9%
20/06/2001 100% 95.3% 44.4%
21/06/2001 100% 95.4% 63.2%
22/06/2001 100% 95.1% 74.6%
23/06/2001 100% 96.4% 44.7%
24/06/2001 100% 95.1% 72.9%
25/06/2001 100% 94.1% 43.8%
26/06/2001 100% 95.3% 45.6%
27/06/2001 100% 94.7% 72.9%
28/06/2001 100% 96.4% 62.9%
29/06/2001 100% 95.4% 63.8%
30/06/2001 100% 95.5% 75.3%
01/07/2001 100% 95.2% 45.3%
02/07/2001 100% 95.3% 46.2%
03/07/2001 100% 95.6% 46.3%
04/07/2001 100% 96.0% 74.5%
05/07/2001 100% 96.2% 44.9%
06/07/2001 100% 96.1% 46.0%
07/07/2001 100% 96.0% 74.9%
Date Node 1 Node 2 Node 3
08/07/2001 100% 96.8% 46.9%
09/07/2001 100% 94.9% 63.4%
10/07/2001 100% 95.3% 45.4%
11/07/2001 100% 95.5% 47.1%
12/07/2001 100% 97.3% 90.7%
13/07/2001 100% 96.9% 94.9%
14/07/2001 100% 98.7% 93.5%
15/07/2001 100% 97.5% 94.3%
16/07/2001 100% 97.3% 93.1%
17/07/2001 100% 96.7% 92.6%
18/07/2001 100% 97.5% 88.4%
19/07/2001 100% 96.8% 90.4%
20/07/2001 100% 97.4% 89.8%
21/07/2001 100% 96.8% 87.9%
22/07/2001 100% 97.0% 89.2%
23/07/2001 100% 97.2% 89.0%
24/07/2001 100% 97.0% 89.1%
25/07/2001 100% 96.2% 88.0%
26/07/2001 100% 97.2% 89.0%
27/07/2001 100% 97.4% 88.7%
28/07/2001 100% 96.7% 89.5%
29/07/2001 100% 97.2% 88.7%
30/07/2001 100% 96.6% 89.1%
31/07/2001 100% 97.4% 88.3%
01/08/2001 100% 95.8% 88.7%
02/08/2001 100% 97.8% 91.3%
03/08/2001 100% 96.9% 91.2%
04/08/2001 100% 96.9% 90.0%
05/08/2001 100% 96.7% 91.8%
06/08/2001 100% 97.7% 91.9%
07/08/2001 100% 97.4% 92.0%
08/08/2001 100% 97.5% 93.6%
09/08/2001 100% 97.5% 92.5%
10/08/2001 100% 97.0% 89.3%
11/08/2001 100% 97.0% 89.6%
12/08/2001 100% 96.6% 91.2%
13/08/2001 100% 96.2% 89.1%
07/10/2002 100% 94.0% 72.2%
08/10/2002 100% 94.6% 72.7%
09/10/2002 100% 93.4% 73.6%
10/10/2002 100% 94.3% 74.8%
11/10/2002 100% 93.4% 74.3%
Date Node 1 Node 2 Node 3
12/10/2002 100% 92.6% 74.2%
13/10/2002 100% 94.7% 74.0%
14/10/2002 100% 94.0% 75.0%
15/10/2002 100% 94.8% 74.1%
16/10/2002 100% 95.0% 74.7%
17/10/2002 100% 94.1% 77.0%
18/10/2002 100% 94.5% 77.1%
19/10/2002 100% 94.9% 78.1%
20/10/2002 100% 93.9% 75.8%
21/10/2002 100% 95.3% 76.1%
22/10/2002 100% 93.8% 76.0%
23/10/2002 100% 95.2% 77.6%
24/10/2002 100% 93.5% 76.6%
25/10/2002 100% 94.9% 75.1%
26/10/2002 100% 96.4% 80.9%
27/10/2002 100% 96.2% 95.2%
28/10/2002 100% 96.0% 91.3%
29/10/2002 100% 95.7% 85.4%
30/10/2002 100% 96.0% 85.6%
31/10/2002 100% 96.2% 83.7%
01/11/2002 100% 95.6% 84.9%
02/11/2002 100% 95.6% 86.8%
03/11/2002 100% 95.2% 85.4%
04/11/2002 100% 95.4% 86.3%
05/11/2002 100% 95.3% 87.1%
06/11/2002 100% 96.1% 89.7%
07/11/2002 100% 95.1% 90.3%
08/11/2002 100% 94.9% 89.7%
09/11/2002 100% 95.3% 87.9%
10/11/2002 100% 95.6% 88.6%
11/11/2002 100% 93.6% 89.8%
06/09/2004 100% 94.8% 29.7%
07/09/2004 100% 94.6% 28.1%
08/09/2004 100% 94.1% 28.6%
09/09/2004 100% 94.5% 28.3%
10/09/2004 100% 94.3% 29.3%
11/09/2004 100% 95.6% 27.6%
12/09/2004 100% 94.8% 28.6%
13/09/2004 100% 93.9% 29.0%
Table 4. Average probability values as estimated for nodes 1 (absolute estimates), 2 (conditional estimates) and 3 (conditional estimates). Values onlyrefer to daily rate runs (see text for details).

we can estimate probabilities that are usefully associatedwith significant variations in the volcanic phenomena on atime scale that is comparable to the fixed time windowforecast (one week, in our case). Accordingly, we ran aweekly rate along the whole time interval investigated. Themodel is run at a daily rate when the thresholds in themonitoring database are seen to be exceeded (April 20-23,2001; June 5 - August 18, 2001; October 7 - November 11,2002), and for the retrospective analysis assessed before theonset of an eruption (September 7-13, 2004). Table 4summarizes all of the probabilities estimated for these dailyrate runs.
When no unrest was observed, we estimated the long-term absolute probability of eruption and vent opening. Forthe period investigated, the average of the absoluteprobability of eruption was around 1.0% per week (Figure3a), whereas for vent opening, the highest absolute averageprobability was estimated as 0.02% (Figure 3b).
The use of the monitoring component needs to beconsidered for the short-term eruption forecasting.
We focused our attention on the probabilities forunrest (node 1), relative magma involvement (node 2), anderuption (node 3). Our results, as estimated year by year,are presented independent of the occurrence of aneruption.
The probabilities for vent location (node 4) and size oferuption (node 5) are only analyzed for the flank eruptionsthat occurred in July-August 2001 and from October 2002 toJanuary 2003, because the volcano-tectonic data wassuitable.
5.1 The 2001 forecastFrom November 2000, volcanic activity occurred at Bocca
Nuova that varied from explosions to effusive lava flows[Smithsonian Institution 2000]. This activity was accompaniedby seismic activity and strong degassing, which was reducedafter early December 2000 [Smithsonian Institution 2000].
Figure 5a reports all of the probability estimates for the2001 forecast (absolute values for node 1, and conditionalestimates for nodes 2 and 3). From January 2001, andthroughout all of that year, an absolute value of 100% forthe unrest phase is computed. This is associated with thepresence of at least an anomalous parameter in the datasetelicited. Indeed, tilt, SO2 and ash emission anomalies wereobserved over this entire year.
Node 2 shows an average conditional estimate >95.0%for the whole of 2001 (Figure 5a). This confirms, in part, thevery frequently observed involvement of magma duringthese unrest phases, whereas purely phreatic eruptions wererare [Branca and Del Carlo 2005].
On the contrary, at node 3, given the more restrictedinertia time window, the conditional probabilities oferuption vary according to the presence of anomalous
monitoring parameters, in the range of 27.0% to 95.0%(Figure 5a). A constant value >40.0% is computed startingfrom January 2001, up to the middle of February 2001(Figure 5a), due to anomalies in CO2 emission as well asongoing volcanic activity. Indeed, resumed summit volcanicactivity was observed from the first ten days in January 2001up to the first ten days of June 2001, which included bothstrombolian and effusive lava flows [Smithsonian Institution2001, Branca and Del Carlo 2005].
Starting from mid-February 2001, and over more thanone month, the probability of eruption showed a sharpincrease towards values >65.0% (Figure 5a). During thisperiod, anomalies were observed in the strong SO2 and CO2degassing. A few days afterwards, on April 20, 2001, therewas an intense seismic swarm (>90 volcano-tectonicearthquakes in a day), which resulted in a new and suddenincrease in the probability of an eruption (52.6%; Figure 5a).On April 22, 2001, tremor activity was added to the stilloccurring seismic volcano-tectonic earthquake, and theprobability rose to 63.0% (Figure 5a). While thesestrombolian and effusive lava flows were still ongoing fromsummit craters, no new eruptive activity was observed untilearly May, 2001, when there was a short-lived (for a fewhours) lava fountain at the South-East Crater. This last wasenhanced by anomalies in the tremor data, which thusyielded the probability of 73.4% on May 9, 2001 (Figure 5a).After that, the probability dropped to around 40.0% untilearly June, 2001, with a maximum probability of 75.3%(Figure 5). Starting from June 6, 2001, new lava fountainingactivity resumed at the South-East Crater, with a moreregular frequency (charge and discharge episodes). Theseevents lasted up to early July 2001 (13 lava fountains)[Behncke et al. 2006].
Starting from July 12, 2001, in the monitoring datasetthere was a sudden increase in the seismic activity (more than100 earthquakes recorded daily), as well as anomalies in thegeochemical fluids, dilatation and gravity. The code responseis a large jump towards probabilities >90.0% (Figure 5); themaximum of 94.9% is estimated for July 13, 2001, when thepeak of seismicity of 998 events was recorded (Figure 5).Flank activity was reported for the South-East Crater fromJuly 17, 2001 [Smithsonian Institution 2001]; the probabilityestimate reached 92.6% (Figure 5) and also maintainedrelatively high values (52.0%-76.5%) for the following months,although the eruption stopped on August 9, 2001 (Figure 5).Apart from strong degassing from summit craters, no neweruptive activity occurred until September 2001 [SmithsonianInstitution 2001]. Up to the end of October 2001, the volcanicactivity was very low, as it was mostly degassing, which wasoccasionally accompanied by ash emissions from summitvents [Smithsonian Institution 2001].
All of these observed variations in the anomalousparameters lasted up to the end of December 2001, when
BRANCATO ET AL.
651

652
the probability of an eruption dropped to around thebackground level (Figure 5a).
Shallow earthquakes (depth <5 km) is the parameterwith the most significant anomaly that led to precursoractivity for the July-August 2001 effusive flank episode. Thus,by considering the epicenters of the events that occurred justbefore the onset of this eruption, we generated mapsshowing the relative probabilities of vent opening inside theweekly forecast time windows (Figure 6). As the clusteringalong the swarm period ( July12-17, 2001), the seismicity
depicts the same vent location area at the south of the baseof the South-East Crater, and the eventual vent site fellconsistently within the highest probability zone on all ofthese maps (Figure 6). The maximum of 6.2% was reachedon July 17, 2001, the day of the start of the eruption (Figure6). Although within the same vent location area, the flankeruption had a complex development, with different ventsopening at different heights (Figure 6).
The probabilities estimated for node 5 do not changewith time, probably owing to the independence of the
APPLICATION OF BET_EF TO MOUNT ETNA
Figure 5. a) Probability estimates for the 2001 forecast at Mount Etna. Circles, absolute probability for node 1 (unrest); diamonds, conditional probabilityfor node 2 (magmatic unrest, given an unrest); and triangles, conditional probability for node 3 (eruption, given a magmatic unrest). b) Enlargement ofthe probability values estimated for the period June 5 to September 17, 2001 (rectangular box in (a)). Yellow triangle, onset of the volcano-tectonicseismicity of July 12, 2001; pink box, volcanic activity of the flank eruption of July 17 to August 9, 2001.

monitoring data (Table 5). The most informative result is asubstantial representation of the eruptive history of thevolcano (for comparison, see Table 3).
5.2 The 2002 forecastThroughout the whole of 2002, the probability
estimates for nodes 1 and 2 maintained similar values tothose of the 2001 forecast (100% and 86.1%-96.6%,respectively; Figure 7a). The node 1 values are due to the tilt
parameter elicited. The probability of eruption (node 3)showed an increasing trend, starting from mid-February 2002up to the last week of March 2002 (Figure 7a). Theprobability leveled at around 65.0% up to the last week ofJune 2002, after which it rose to >75.0% (Figure 7a). Then,there was an inverted decreasing trend (minimum of 59.6%)that was estimated up to the end of August 2002 (Figure 7a).During all of these periods, a strong anomaly was observedonly for CO2 emission, as a consequence of the threshold
BRANCATO ET AL.
653
Figure 6.Maps of the probabilities of vent opening in the period July 12-23, 2001. Color scale bar (at right of each panel), average absolute probability asspread over the grid area considered in the present study. White crosses, locations of the eruptive vents that opened during the particular one weekprobability windows shown (see Figure 3b for comparison).

654
elicited. The eruptive activity was very low (mostly ash andgases emission, from summit craters) or almost absent[Smithsonian Institution 2002].
After this, a new sharper increasing trend was estimatedup to the end of October (maximum of 78.1%; Figure 7a),during which anomalies in the gravity measurementsaccompanied the previous anomalous CO2 emissions. Aseismic swarm started in the last hours of October 26, 2002,and initially it struck the central upper part of the volcanicedifice. During the night between October 26 and 27, 2002,the seismic activity also spread to the upper north-easternflank of Mount Etna, with the hypocenters located at a depthof 6 km below sea level [Barberi et al. 2004]. The probability
APPLICATION OF BET_EF TO MOUNT ETNA
Figure 7. a) As for Figure 5a, for the 2002 forecast. b) Enlargement as for Figure 5b, for the period October 7 to December 30, 2002 (rectangular box in(a)). Yellow triangle, onset of the volcano-tectonic seismicity of October 26, 2002; pink box, volcanic activity of the flank eruption of October 27, 2002,to January 28, 2003.
Table 5. Average conditional probabilities estimated for node 5. Reportedvalues refer to the flank eruptive activity that occurred for Mount Etna inJuly-August 2001 and from October 2002 to January 2003.
Date Node 5
Size 1 Size 2 Size 3 Size 4 Size 5
2001/07/12 20.4% 18.9% 17.9% 22.9% 19.9%
2001/07/13 20.4% 19.1% 17.8% 22.9% 19.8%
2001/07/14 20.4% 19.1% 17.8% 22.9% 19.8%
2001/07/16 20.4% 19.1% 17.8% 22.9% 19.8%
2001/07/17 20.4% 19.1% 17.8% 22.9% 19.8%
2001/07/18 20.6% 19.2% 17.8% 22.7% 19.7%
2002/10/26 21.4% 18.5% 17.6% 24.0% 18.5%
2002/10/27 21.6% 19.0% 17.8% 22.8% 18.8%
BRANCATO ET AL.
655
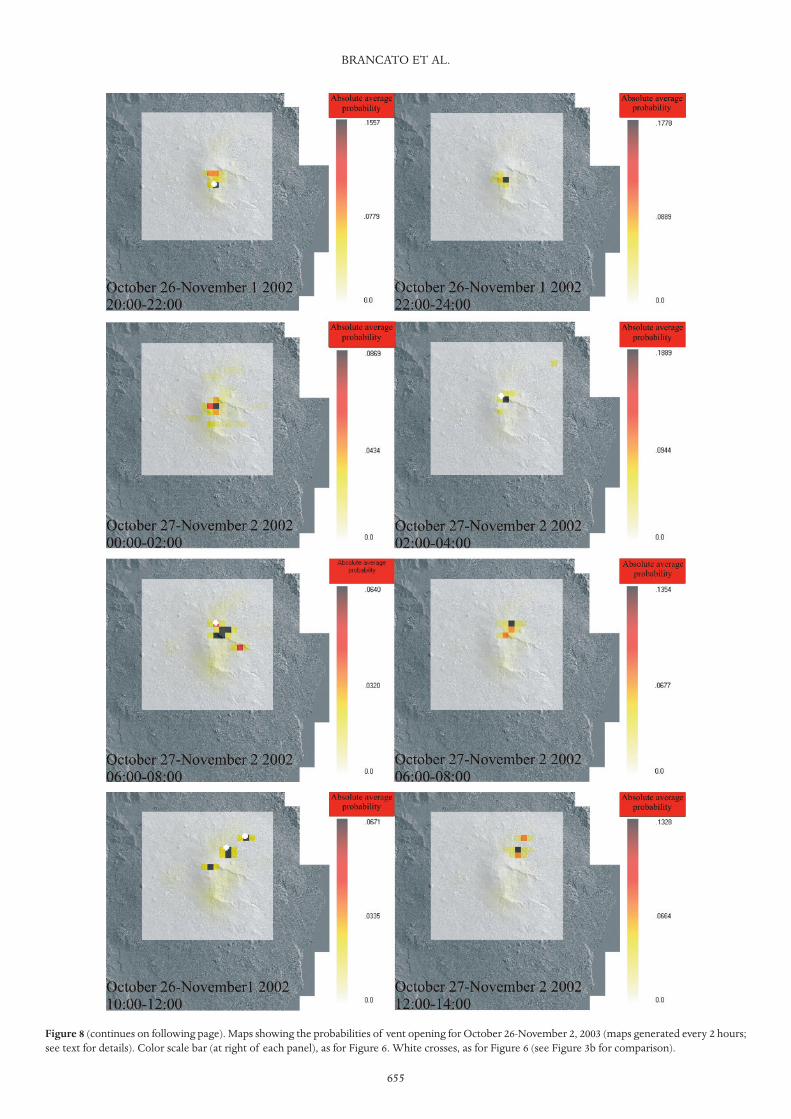
Figure 8 (continues on following page). Maps showing the probabilities of vent opening for October 26-November 2, 2003 (maps generated every 2 hours;see text for details). Color scale bar (at right of each panel), as for Figure 6. White crosses, as for Figure 6 (see Figure 3b for comparison).

656
of eruption jumped to >90.0% (Figure 7), and new stronganomalies were observed in the tilt measurements and SO2emissions. Indeed, starting from early September, 2002, therewas strong strombolian activity at the North-East Crater[Smithsonian Institution 2002], and a relatively large lateraleruptive event was impending on Mount Etna from late onthe night of October 26, 2002 [Neri et al. 2004, Monaco et al.2005]. The flank activity stopped on January 28, 2003[Andronico et al. 2005]. After the onset of the eruption, theprobability of eruption stayed >85.0% up to the end ofDecember (Figure 7).
As for the July-August 2001 flank eruption, the shallowvolcano-tectonic seismicity concurred in generating mapsthat show the relative probabilities of vent opening (node 4).Now the seismicity is considered according to the relativeoccurrence. Therefore, the maps were created by taking into
account the shallow volcano-tectonic seismicity thatoccurred every two hours (at least four events). Figure 8tracks the pattern of the vent location area within the weeklyforecasting time window. No seismic activity occurred from08:00 to 10:00. The maximum probability (28.7%) wasestimated on October 27, 2002, from 16:00 to 18:00. Afterthis, the seismic activity decreased drastically.
As for the July-August 2001 flank eruption, the ventlocation area was spread on two different sides of the volcano,located at the south of the base of the South-East Crater, andalong the north-eastern rift (Figure 8). Indeed, Neri et al.(2004) reported that two eruptive fissure systems opened onthe southern and north-eastern flanks (see Figure 2 forcomparison).
Again, the probabilities estimated for node 5 do notshow any variations over time (Table 5).
APPLICATION OF BET_EF TO MOUNT ETNA
Figure 8 (continued).
Figure 9. As for Figure 5a, for the 2003 forecast. Pink box, end of the flank eruption of October 27 2002 to January 28, 2003.

5.3 The 2003 forecastAlso for the 2003 forecast, the probability estimates for
node 1 (a constant 100%) and 2 (from 89.1%-95.4%) aresimilar to the previous years of 2001 and 2002 (Figure 9).Again, as in 2002, a constant anomaly was observed for thetilt parameter elicited for node 1.
For node 3, a high probability, as close to 90.0%, isobserved up to early February (Figure 9). The code reflectsthe end of the anomalies that were observed from earlySeptember 2002, due to the different inertia time window forthe different monitoring parameters. In detail, the roles ofboth the CO2 and SO2 thresholds elicited were predominant(Table 1).
Starting from the first ten days of February, 2003, a slightdecrease led to the probability of eruption leveling at around75.0%, up to the middle of August 2003 (Figure 9). Exceptfor very low CO2 values inside the inertia period (down to 0g m–2 day–1 from mid-June to mid-August 2003), nomonitoring anomalies were observed. The inertia timewindow of the parameter completely vanished after the lastten days of August (Figure 9). As a consequence, abackground level of around 28.0% was estimated up to theend of December 2003 (Figure 9).
No relevant volcanic activity occurred at Mount Etnafor the whole of 2003 after the end of the flank eruption( January 28, 2003). Very minor emissions were observed at
BRANCATO ET AL.
657
Figure 10. a) As for Figure 5a, for the January 2004 to April 2005 forecast. b) Enlargement as for Figure 5b, for the period August 23, 2004, to April 25,2005 (rectangular box in (a)). Pink box, volcanic activity of the flank eruption of September 7, 2004, to March 8, 2005.

658
summit craters, which were often accompanied by vigorousor less intense gas emissions from the same vents[Smithsonian Institution 2003]. As already indicated, evenwith the absence of relevant volcanic activity, the highprobabilities that were estimated up to the middle of August2003 are exclusively linked to the inertia time, as well as tothe threshold of CO2, both of which remained fixed after thelast eliciting session.
5.4 The 2004-2005 forecastAgain, as in the previous period of 2001-2003, the
probability estimates for nodes 1 and 2 show similar trendsalso for the 2004-2005 forecast (constant 100%, and 87.9%-96.6%, respectively; Figure 10). Also in this case, a constanttilt anomaly is observed for node 1.
Apart from a brief period (early March - early May 2004,at >45.0%), the probability of eruption (node 3) showed aconstant level at around 30.0%, thus indicating a long no-anomaly trend in the monitoring dataset. In this period,anomalies were observed in the gravity measurements, whichwere often accompanied by CO2 emissions. No relevantvolcanic activity was reported up to September 7, 2004[Smithsonian Institution 2004], which was when a new effusiveflank eruption occurred from a fracture field that opened onthe slope of the South-East Crater and propagating roughlyEast-South-East [Burton et al. 2005]. Unlike the two previouseruptions, the onset of this flank eruptive event wascharacterized by the absence of precursor activity, as revealedby the probability estimates that were around the backgroundlevel, as lower than 30.0%. After about six months of low-intensity lava outflow, the emission stopped on March 8, 2005.Only in early January 2005 and up to early March 2005 werethe probabilities >50.0% (a maximum probability estimate of78.8%), which reflects the strong anomalies in both the CO2and SO2 monitoring parameters. After a decreasing trendestimated up to mid-March 2005, a new increasing trend isobserved up to the end of April 2005. Again, there was arelevant anomaly in the CO2 parameter, with values close to50 g m–2 day–1. No relevant eruptive activity was observed afterthe end of the September 2004 to the March 2005 flank event.
Due to the absence of precursor activity, no probabilitiesare estimated for the following node 4 and 5.
6. Discussion and conclusionsA previous application at Mt. Etna of the recently
developed technique for eruption forecasting (the BET_EFcode) [Marzocchi et al. 2004, 2008] showed that the goodperformance of this method provides good and quantitativeaverages relative to the opinions of the experts in terms ofwhat can happen before an eruptive event [Brancato et al.,in press].
The present study illustrates the set-up and applicationof the BET_EF code, with particular focus on the
retrospective analysis spanning the period from 2001 to2005.
Following the first test case [Brancato et al., in press], themonitoring settings were upgraded to fix some coarserthresholds in the parameters that were initially considered witha Boolean approach. Thus, after further elicitation sessions, athorough revision was allowed, considering all of themonitoring parameters for node 3 under a fuzzy perspective(Figure 2, Table 1).
In addition, the a-priori models were primarily set bytaking into account the eruptive flank history of Mount Etnathat could be back traced with good guesses over the last 400years (Figure 3b and 4, Table 3) [Project V3-Lava 2010].
Concerning the probability estimations, the firststrong evidence is based on the values of the unrest (node1). For the whole period analyzed ( January 2001 - April2005), the 100% estimate highlights that Mount Etna isalways under unrest (Figures 5, 7, 9 and 10), which ismostly due to a constant tilt anomaly, and which is oftenaccompanied by persistent volcanic tremor, soil SO2 andCO2 gas emissions, and magma movement activities. Fornode 2 (magma/no magma) the relative probabilities aremostly >90.0%, which suggests that magma is deeplyinvolved over this January 2001 to April 2005 unrest phase(Figures 5, 7, 9 and 10).
After the upgrading of the monitoring settings, therelative trends of the probability estimates for node 3(eruption/no eruption) were able to be tuned moreappropriately to the real eruptive occurrences. When nomonitoring anomalies are observed, an average of around30.0% is estimated (Figures 5, 7, 9 and 10). This confirms, inpart, that the monitoring data control the role of theapplication, when compared with the probability when nounrest is detected (see Figure 3a).
An anomaly in the dataset resulted in the estimation ofprobability values >50.0% (Figures 5 and 7). This reflects thecapacity of the code to react to some significant variations,which can maybe be interpreted as mid-term precursoryactivity. Finally, a few days before the onset of a flank eruptiveevent, different anomalies concurred to give probabilityestimates >90.0% (Figures 5 and 7). This short-term forecastingmatches well with the 1-week time window used. When ananomaly persisted because of the relative inertia time window,a lower value was computed that leveled off around 80.0%(Figure 9).
The grid area adopted (484 square cells; 1 km2 each) ingenerating the maps for relative probabilities of vent opening(node 4) allowed better insight into the definition of theactual eruptive scenario (Figures 6 and 8).
On the contrary, the relative probability estimates fornode 5 (size/style of an eruptive event), do not show anysignificant variations with time (Table 5).
Despite the good performance of the code, some final
APPLICATION OF BET_EF TO MOUNT ETNA

remarks are appropriate. Of the flank eruptions analyzedhere, only the September 2004-March 2005 was no predicted,because no monitoring anomalies occurred (Figure 10). Thecode is not a ‘magic box’ that can predict significant volcanicactivity, although it can react (in near real-time) to anyexternal variations (i.e. an anomalous monitoringparameter). In any case, an anomalous parameter is notsuitable as the definition of the heralding of eruptive activity,as shown with the ‘false alarm’ on April 20, 2001, when asudden anomalous increase in the number of shallowearthquakes occurred (Figure 5).
However, an almost constant value of probability ofunrest of 100% is reasonable for an active volcano such asMount Etna.
Although the whole monitoring setting was revised by thefixing of the relative thresholds and inertia time windowaccording to the recent evolution of the relative time series(Table 1), the role of gas emissions in the estimation of theprobability of an eruption (node 3) appears to be extreme. Inparticular, although barely applied in our investigation, the CO2parameter elicited did yield some results, the interpretation ofwhich, in terms of precursors, needs great care (Figures 5, 7, 9and 10). The involvement of the CO2 parameter elicited in theprobability estimates starts a few months before impendingflank activity, as shown for July to August 2001, October 2002to January 2003, and September 2004 to March 2005. Theanomalies recorded, which lasted for long periods (from weeksto months), appear to reflect the internal dynamics of thevolcano, which are not often accompanied by other anomalies,even if this occurs during ongoing volcanic activity (e.g.strombolian eruptions at the summit craters; Figure 5).
On the contrary, during the period of January to mid-March 2005 (Figure 10b), the high estimated probabilities(slightly lower than 80.0%) are due exclusively to thegeochemical (gas) anomalies. These results are almost linkedto anomalies in the CO2 monitoring parameter, and theymight suggest a sequence of ‘false alarms’, with anomalouslong-lived times revealed, rather than short-lived spikes. Thismight be due to the incorrect elicitation of the CO2parameter in terms of trends, and/or relative thresholds,and/or the related inertia time window.
In any case, the above observations highlight the role ofthe code in varying probabilities when new data areincoming, also during an ongoing eruption.
During the inter-eruptive period of early February 2003to September 2004, the high probability of eruption that wasestimated from early February to mid-August 2003 (from68.6% to 79.2%) is due to the slowness of some of theparameters in their resetting towards the no-anomaly values,in agreement with the elicited inertia time window.
The most relevant observation concerns the final node 5.As set here, it represents only a coarse depiction of theeruptive history of the volcano, as it is improbable at the same
time that it can discriminate between the most significanteruptive sizes. Therefore, great care is needed for the clearclassification of the features of an eruption, in terms of boththe size and type. The suggestion for a reliable model (e.g. apower-law distribution) of the eruptive activity at Mount Etnacan be taken into account to better combine the size and thetype of eruption. Furthermore, although to date nomonitoring parameter provides insights into the size and styleof an impending eruption [e.g., Sandri et al. 2004], these mightbe suggested for a well monitored and very active volcanosuch as Mount Etna. Therefore, the monitoring elicitationshould indicate those parameters that can provide the physicalmodeling of the volcanic edifice (e.g. three componentbroadband seismometers, continuous global positioningsystem and gravimetric measurements, infrasound sensors,thermal cameras, etc.).
The monitoring dataset elicited might prove useful for theCivil Protection, to provide more timely and accurate warningsfor the public. The communication of such warnings hasbecome more efficient as well, with the introduction of an alertnotification system, similar to that adopted by the United StatesGeological Survey (USGS; http://volcanoes.usgs.gov/activity/alertsystem). Therefore, on the basis of our results, apreliminary alert system for eruption occurrence (node 3) atMount Etna volcano can be tentatively proposed. Green(normal), yellow (advisory), orange (watch) and red (warning)levels can be defined easily by the Authority on the basis ofdifferent probability values. Such a proposed system shouldallow both critical decisions and dissemination of informationto be made easier.
Acknowledgements.The authors wish to thank Don Dingwell, JörgKeller, Warner Marzocchi and Chris Newhall for their fruitful discussionsand suggestions. Alexander McBirney and Nick Varley are sincerelyacknowledged for the constructive criticism and a careful review of anearly version of the manuscript, and Stephen D. Conway is thanked forhis careful review of the English text. This study benefited from fundingprovided by the Italian Presidenza del Consiglio dei Ministri, Dipartimentodella Protezione Civile (DPC, 2007-2009 V3 Lava project). Scientific papersfunded by DPC do not represent its official opinion and policies.
ReferencesAiuppa, A., P. Allard, W. D’Alessandro, S. Giammanco, F.Parello and M. Valenza (2004). Magmatic gas leakage atMount Etna (Sicily, Italy): relationships with the vol-cano-tectonic structures, the hydrological pattern andthe eruptive activity, in Mt. Etna: Volcano Laboratory(A. Bonaccorso, S. Calvari, M. Coltelli, C. Del Negro,S. Falsaperla Editors). American Geophysical Union,Washington, DC, Geophysical Monograph Series 143,129-145; doi: 10.1029/143GM09.
Aloisi, M., A. Bonaccorso and S. Gambino (2006). Imagingcomposite dike propagation (Etna, 2002 case), J. Geo-phys. Res, 111, B06404; doi: 10.1029/2005JB003908.
BRANCATO ET AL.
659
660
Alparone, S., D. Andronico, L. Lodato and T. Sgroi (2003).Relationship between tremor and volcanic activity dur-ing the Southeast Crater eruption on Mount Etna inearly 2000, J. Geophys. Res., 108 (B5), 2241; doi:10.1029/ 2002JB001866.
Andronico, D., S. Branca, S. Calvari, M. Burton, T. Caltabi-ano, R.A. Corsaro, P. Del Carlo, G. Garfì, L. Lodato, L.Miraglia, F. Murè, M. Neri, E. Pecora, M. Pompilio, G.Salerno and L. Spampinato (2005). A multi-disciplinarystudy of the 2002-03 Etna eruption: insights into a com-plex plumbing system, B. Volcanol., 67, 314-330.
Barberi, G., O. Cocina, V. Maiolino, C. Musumeci and E.Privitera (2004). Insight into Mt. Etna (Italy) kinematicsduring the 2002-2003 eruption as inferred from seismicstress and strain tensors, Geophys. Res. Lett., 31,L21614; doi: 10.1029/2004GL020918.
Behncke, B., M. Neri, E. Pecora and V. Zanon (2006). Theexceptional activity and growth of the SoutheastCrater, Mount Etna (Italy), between 1996 and 2001, B.Volcanol., 69, 149-173.
Bonaccorso, A., M. Aloisi and M. Mattia (2002). Dike em-placement forerunning the Etna July 2001 eruptionmodelled through continuous tilt and GPS data, Geo-phys. Res. Lett., 29, 13; doi: 10.1029/2001GL014397.
Bonaccorso, A., S. D'Amico, M. Mattia and D. Patanè(2004). Intrusive mechanism at Mt. Etna forerunningthe July-August 2001 eruption, Pure Appl. Geophys.,161 (7), 1469-1487; doi: 10.1007/s00024-004-2515-4.
Bonforte, A., F. Guglielmino, M. Palano and G. Puglisi(2004). A syn-eruptive ground deformation episodemeasured by GPS, during the 2001 eruption on the uppersouthern flank of Mt. Etna, B. Volcanol., 66, 336-341.
Branca, S. and P. Del Carlo (2005). Types of eruptions atEtna volcano AD 1670-2003: implications for short-termeruptive behaviour, B. Volcanol., 67, 737-742.
Brancato, A., S. Gresta, L. Sandri, J. Selva, W. Marzocchi, S.Alparone, D. Andronico, A. Bonforte, T. Caltabiano, O.Cocina, R.A. Corsaro, R. Cristofolini, G. Di Grazia, G.Distefano, C. Ferlito, S. Gambino, S. Giammanco, F.Greco, R. Napoli, G. Tusa and M. Viccaro. Quantifyingprobabilities of eruption at a well-monitored active vol-cano: an application at Mount Etna (Sicily, Italy), B. Ge-ofis. Teor. Appl., (in press).
Bruno, N., T. Caltabiano, S. Giammanco and R. Romano(2001). Degassing of SO2 and CO2 at Mount Etna(Sicily) as an indicator of pre-eruptive ascent and shal-low emplacement of magma, J. Volcanol. Geoth. Res.,110, 137-153.
Burton, M.R., M. Neri, D. Andronico, S. Branca, T. Caltabi-ano, S. Calvari, R. A. Corsaro, P. Del Carlo, G. Lan-zafame, L. Lodato, L. Miraglia, G. Salerno and L.Spampinato (2005). Etna 2004-2005: An archetype forgeodynamically-controlled effusive eruptions, Geophys.
Res. Lett., 32, L09303; doi: 10.1029/2005GL022527.Caltabiano, T., R. Romano and G. Budetta (1994). SO2 fluxmeasurements at Mount Etna (Sicily), J. Geophys. Res.,99, 12809-12819.
Carbone, D., G. Budetta and F. Greco (2003). Bulkprocesses prior to the 2001 Mount Etna eruption, high-lighted through microgravity studies, J. Geophys. Res.,108 (B12), 2556; doi: 10.1029/2003JB002542.
Carbone, D. and F. Greco (2007). Review of microgravityobservations at Mt. Etna: a powerful tool to monitorand study active volcanoes, Pure Appl. Geophys., 164,769-790.
Corsaro, R.A., L. Civetta, V. Di Rienzo and L. Miraglia(2009). Petrology of lavas from the 2004-2005 flankeruption of Mt. Etna, Italy: inferences on the dynamicsof magma in the shallow plumbing system, B. Vol-canol., 71, 781-793.
Cristofolini, R., S. Gresta, S. Imposa and G. Patanè (1988).Feeding mechanism of eruptive activity at Mt. Etnabased on seismological and petrological data, In: Y.King and R. Scarpa (eds.), Modelling of VolcanicProcesses, Vieweg-Verlag, Wiesbaden, 73-93.
Del Negro, C., G. Currenti, R. Napoli and A. Vicari (2004).Volcanomagnetic changes accompanying the onset ofthe 2002-2003 eruption of Mt. Etna (Italy), EarthPlanet. Sci. Lett., 229, 1-14.
Falsaperla, S., S. Alparone, S. D’Amico, G. Di Grazia, F. Fer-rari, H. Langer, T. Sgroi and S. Spampinato (2005). Vol-canic tremor at Mt. Etna, Italy, preceding andaccompanying the eruption of July-August 2001, PureAppl. Geophys., 162, 2111-2132.
Marzocchi, W., L. Sandri, P. Gasparini, C. Newhall and E.Boschi (2004). Quantifying probabilities of volcanicevents: The example of volcanic hazard at Mount Vesu-vius, J. Geophys. Res., 109, B11201; doi: 10.1029/2004JB00315U.
Marzocchi, W., L. Sandri and J. Selva (2008). BET_EF: aprobabilistic tool for long- and short-term eruptionforecasting, B. Volcanol., 70, 623-632.
Monaco, C., S. Catalano, O. Cocina, G. De Guidi, C. Ferl-ito, S. Gresta, C. Musumeci and L. Tortorici (2005). Tec-tonic control on the eruptive dynamics at Mt. Etnavolcano (Sicily) during the 2001 and 2002-2003 erup-tions, J. Volcanol. Geoth. Res., 144, 211-233.
Neri, M., V. Acocella and B. Behncke (2004). The role ofthe Pernicana Fault System in the spreading of Mt. Etna(Italy) during the 2002-2003 eruption, B. Volcanol., 66,417-430.
Newhall, C. G. and R. P. Hoblitt (2002). Constructing eventtrees for volcanic crises, B. Volcanol., 64, 3-20.
Patanè, D., E. Privitera, S. Gresta, A. Akinci, S. Alparone,G. Barberi, L. Chiaraluce, O. Cocina, S. D’Amico, P. DeGori, G. Di Grazia, S. Falsaperla, F. Ferrari, S. Gambino,
APPLICATION OF BET_EF TO MOUNT ETNA

E. Giampiccolo, H. Langer, V. Maiolino, M. Moretti, A.Mostaccio, C. Musumeci, D. Piccinini, D. Reitano, L.Scarfì, S. Spampinato, A. Ursino and L. Zuccarello(2003). Seismological constraints for the dike emplace-ment of July-August 2001 lateral eruption at Mt. Etnavolcano, Italy, Annals of Geophysics, 46 (4), 599-608.
Project V3-LAVA (2010). Realization of the lava flow inva-sion hazard map at Mt. Etna and method for its dy-namic update, DPC-INGV 2007-2009 agreement, FinalScientific Report, 196 pp.
Sandri, L., W. Marzocchi and L. Zaccarelli (2004). A newperspective in identifying the precursory patterns ofvolcanic eruptions, B. Volcanol., 66, 263-275.
Smithsonian Institution (2000-2004). Etna activity reports,Bull. Global Volcanism Network.
*Corresponding author: Alfonso Brancato,Università degli Studi di Catania, Dipartimento di Scienze Geologiche,Catania, Italy; e-mail: [email protected].
© 2011 by the Istituto Nazionale di Geofisica e Vulcanologia. All rightsreserved.
BRANCATO ET AL.
661