application of backpropagation neural networks in ... · rate, backpropagation neural network...
TRANSCRIPT

Abstract— This study utilizes Backpropagation Neural
Network (BPNN) to predict the story drift of multi-story
reinforced concrete building under earthquake load. Seismic-
resistant building design process requires structural analysis to
be performed to obtain the necessary building responses. Modal
response spectrum analysis is performed to simulate
earthquake loading and produce story drift data for further use
in the Backpropagation Neural Networks. The BPNN
architecture comprises of 3 layers: an input layer, a hidden
layer, and an output layer. The input data consist of earthquake
load parameters, soil condition, and building geometry,
whereas story drift is selected as output parameter. The trained
BPNN is capable of predicting story drift of building due to
earthquake loading at 96% rate of prediction and the
calculated Mean-Squared Errors (MSE) as low as 1.2.10-4. The
high accuracy of story drift prediction can greatly assist the
engineer to identify the building condition rapidly due to
earthquake loads and plan the building maintenance routinely
Index Terms—Backpropogation Neural Networks,
Earthquake load, Modal response spectrum, Story drift
I. INTRODUCTION
NE of the so many factors that affect the aftermath of
earthquake disaster is the resilience of the infrastructure
building against the strong ground motion. Critical
infrastructure building such as hospital, school, power plant
office, and governmental buildings are most likely multi-
storey buildings which are very prone to seismic loading.
During strong ground motion, multi-storey building might
collapse in a brittle-way that endanger its occupants due to
the massive dead weight, especially for reinforced cement
concrete (RCC) building. Other than that, tall building if not
designed properly will experience excessive displacement
(storey-drift) that cause discomfort and might damage non-
structural components such partition wall, window, and door
which blocks evacuation passage. Due to these facts, multi-
storey building shall be designed properly to exhibit ductile
behavior and controlled deformations during strong ground
motion.
Story drift is one of the most important limit states in
multi-story building structure design. A Building shall not
drift excessively to provide better performance and prevent
Manuscript received October 13, 2016; revised February 2, 2017. This
work was supported in part by Ministry of Research, Technology and
Higher Education of the Republic of Indonesia under Fundamental-Scheme
Grant.
Reni Suryanita is with the Civil Engineering Department - University of
Riau, Jl. HR Subrantas Km.12,5 Pekanbaru 28293, Riau - Indonesia
phone: +628127513783 e-mail: [email protected]
Hendra Jingga was with the Civil Engineering Department - University
of Riau, Jl. HR Subrantas Km.12,5 Pekanbaru 28293, Riau - Indonesia
damage to non-structural elements such as walls and doors.
Provisions that limit story drift vary depending on which
code is used. Frequently, story drift governs the design of
structural elements rather than strength. According to [1],
story drift can be solved with estimation of displacement
modal responses, whereas [2] used the spectral displacement
and beam-to-column ratio to determine the story drift of the
building. The various methods can be useful for preliminary
design of new structures or rapid assessment of existing
buildings.
Finite Element Method (FEM) is currently the best
available method to analytically calculate the story drift of
multi-story buildings. Performing FEM for such complex
buildings could be very tedious to be hand-calculated if not
practically impossible. To help in faster and more accurate
calculations, FEM software is developed and widely
available in the market. However, precisely the modeling
and running analysis of building structures in FEM software
is indeed very time-consuming especially for nonlinear and
dynamic analysis.
Though Finite Element Method for structural analysis is
accurate, it is relatively slow. To provide an adequate early
prediction of story drift building or displacement at a faster
rate, Backpropagation Neural Network (BPNN) method may
be used. BPNN method is a general prediction tool which is
widely used in various fields of application. The BPNN is
one of the Artificial Neural Network methods which
simplified models of the biological nervous system and have
drawn their motivation from the kind of computing
performed by a human brain [3]. An Artificial Neural
Network is organized into a sequence of layer with full or
random connections between the layers. A typical Neural
Network is fully connected, which means there is a
connection between each neuron in any given layer to each
neuron in the next layer. Backpropagation Neural Network is
capable of modeling the nonlinear relationship between
input and output parameters. BPNN works by processing
weighted input data using certain algorithms to produce a
desired output [4]. The relationship between neurons in
BPNN is represented by weight factors that will be modified
through a training process. If sufficient data sets are
available and learning algorithm is correctly chosen, the
training process will modify the weight factors, by each
iteration performed and eventually the desired output will be
achieved.
Many researchers have studied the application of
Artificial Neural Networks in Civil Engineering such as [5]
discussed the prediction of axial bearing capacity of driven
piles and [6] for predicting shaft and tip resistances of
concrete piles. Meanwhile, the studies about the multi-storey
shear structure to predict the health of the building have
been studied by [7] and [8]. The previous studies about the
Application of Backpropagation Neural
Networks in Predicting Story Drift of Building
Reni Suryanita, and Hendra Jingga, Member, IAENG
O
Proceedings of the International MultiConference of Engineers and Computer Scientists 2017 Vol I, IMECS 2017, March 15 - 17, 2017, Hong Kong
ISBN: 978-988-14047-3-2 ISSN: 2078-0958 (Print); ISSN: 2078-0966 (Online)
IMECS 2017

application of BPNN have been done to predict the damage
level on bridges structure [9] and to alert in the bridge
monitoring system [10]. In this study the BPNN is used to
predict the story drift of reinforced concrete multi-story
building under earthquake loading in 34 provinces of
Indonesia. Indonesia is one of the highest-risk seismic zone
in the world, where is crossed by the Pacific Ring of Fire,
which refers to the geographical region with the most active
tectonic plate and volcanic activities on earth, such as
Krakatau Volcano. This condition causes a high tendency of
strong ground motion to occur due to earthquake in the
Pacific Ring of Fire region. In 2004, a whopping 9.3 richer-
scale mega quake struck Aceh on the Western Coast of
Sumatera Island, which then followed by a tsunami that
travelled several kilometers inland. In all the aforementioned
cases, the property damage was severe and the casualty was
huge. The high accuracy of story drift prediction can greatly
assist the engineer to identify the building condition rapidly
due to earthquake loading and plan the building maintenance
routinely.
II. BACKPROPAGATION NEURAL NETWORKS
Artificial neural network (ANN) is a mathematical model
inspired by its biological neural network counterpart. The
ANN system comprises of several processing layers and
neurons. Just like the biological neural network, the
connection and signal transfer between neurons and layers
enable the ANN system to process the given input signal into
appropriate outputs, which is later called prediction. ANN
possesses the capability to predict output based on any given
input in which the mathematical relationship between the
input and output parameter is nonlinear, complex, and often
vague. Common multi-layer ANN system comprises of an
input layer, hidden layer, and the output layer as shown in
Fig. 1. Input layer consists of input neurons that receive
external signals (input data). Hidden layer also consists of
neurons that receive signals from input neurons and transfer
it to the output layer. The number of neurons in hidden layer
affects the prediction rate and the ability of the ANN system
to cope with nonlinear relationship between variables.
Finally, output layer consists of output neurons that
represent the output parameters to be predicted. The
difference between the predicted output value and the target
value (the true value according to learning data set) is the
error of the ANN system.
Fig.1. Simple Artificial Neural Network Scheme
ANN neuron‟s functionality is analogue to the biological
neuron. The synapse strength in biological neural network is
represented by the weight factor in the ANN system (for
example: notated as w11 in Fig.1). The initial values of the
weight factors are usually random, which later modified
through a process called ANN training, iteration, or learning
process. The ANN learning process requires a set of data to
„train‟ the ANN before it is ready for testing. The trained
ANN system is expected to possess the capability to predict
outputs based on any given inputs at decent accuracy. The
commonly adopted criteria to evaluate the performance of
the ANN system are Mean-Squared-Error (MSE) and
Coefficient of Correlation (R).
Backpropagation Artificial Neural Network is one of the
most widely used types of ANN. The Backpropagation ANN
algorithm consists of two calculation phases: Feed-forward
calculation and Backpropagation calculation. In Feed-
forward processing, input data is fed into the input layer,
then the calculation is continued until it reaches the output
layer during the feed-forward calculation. The difference
between the predicted output value and the target value is
used to calculate the error value. Meanwhile, during the
Backpropagation calculation, the error value obtained in the
previous phase is used to modify the weight factors of each
neuron in the output layer, then the hidden layer. The
completion of one Feed-forward and Backpropagation
calculation for each data set is called one epoch.
The feed-forward calculation uses (1) and (2) to compute
the value of the neuron.
where:
= net input of neuron j at layer l;
= weight factors between neuron j at layer l and
neuron i at layer (l – 1);
= value of neuron i at layer (l – 1);
= number of neurons in layer (l – 1); and
= Sigmoid transfer function to compute the final
value of neuron j at layer l.
To evaluate the performance of the ANN system before
proceeding to the Backpropagation calculation, Mean-
Squared-Error (MSE) and Coefficient of Correlation (R) are
computed using (3) and (4), respectively.
where:
= target value based on learning data set;
= predicted output value; and
= the number of data sets.
Proceedings of the International MultiConference of Engineers and Computer Scientists 2017 Vol I, IMECS 2017, March 15 - 17, 2017, Hong Kong
ISBN: 978-988-14047-3-2 ISSN: 2078-0958 (Print); ISSN: 2078-0966 (Online)
IMECS 2017
III. METHODOLOGY
Backpropagation analysis requires an amount of learning
data sets to perform the training, validation, and testing
process. In this study, the BPNN data sets were generated by
performing structural analysis on several varieties of
building the structure model, soil condition, and seismic
location. In the following sub-sections, the methodology
used in this research will be described in detail.
A. Building Structure Model
The multi-storey building structure models are reinforced
cement concrete (RCC) moment frames combined with shear
walls. In this study, 3 variations of building height are
adopted: 10 storey (Model 1), 15 storey (Model 2), and 20
storey (Model 3), as tabulated in Table I. The inter-storey
height is 4.5 meters at base and 4 meters at other stores.
TABLE I
MULTI-STOREY BUILDING STRUCTURE MODELS
Geometry Parameters Model 1 Model 2 Model 3
Number of bays in X
direction 7 7 7
Number of bays in Y
direction 6 6 6
Total floor length in X
direction 42 m 42 m 42 m
Total floor length in Y
direction 36 m 36 m 36 m
Number of storeys 10 15 20
Total building height 40.5 m 60.5 m 80.5 M
B. Seismic Analysis: Modal Response Spectrum Analysis
In this study, 34 capital cities and 13 other cities in
Indonesia were selected as seismic location with 3 soil
conditions (soft, medium, and hard soil). By adopting 47
cities in Indonesia with 3 possible soil conditions, 141
seismic response spectrum plots were obtained. One of the
seismic response spectrum plots for Banda Aceh City is
shown in Fig.2.
0.0
0.1
0.2
0.3
0.4
0.5
0.6
0.7
0.8
0.9
1.0
0.0 0.5 1.0 1.5 2.0 2.5 3.0 3.5 4.0
Hard Soil
Medium Soil
Soft Soil
Acc
eler
atio
n,
S a(g
)
Period, T (second)
Fig 2. Seismic Response Spectrum Plot for Banda Aceh City
Modal response spectrum analysis was performed to
obtain the responses of the building structure models such as
storey displacement. The seismic load was included as
seismic response spectrum plot which shows the relationship
between the design structure acceleration (Sa) and the
structure‟s period of free vibration (T). The Sa vs. T plot
varies with soil condition and seismic location.
For each seismic load, 10 building response data were
generated from modal response spectrum analysis from
Model 1, 15 data from Model 2, and 20 data from Model 3,
which sums up to 45 data. Therefore, as many as 6345 data
sets (141 x 45) were generated from the whole structural
analysis process.
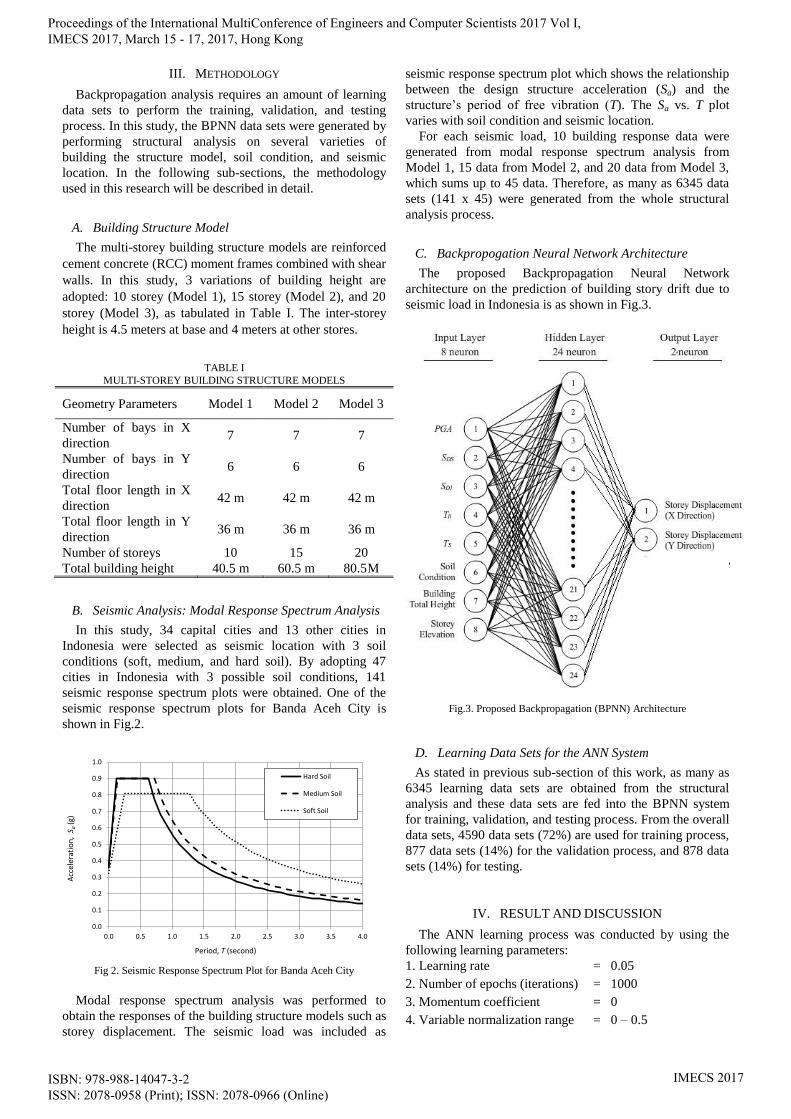
C. Backpropogation Neural Network Architecture
The proposed Backpropagation Neural Network
architecture on the prediction of building story drift due to
seismic load in Indonesia is as shown in Fig.3.
Fig.3. Proposed Backpropagation (BPNN) Architecture
D. Learning Data Sets for the ANN System
As stated in previous sub-section of this work, as many as
6345 learning data sets are obtained from the structural
analysis and these data sets are fed into the BPNN system
for training, validation, and testing process. From the overall
data sets, 4590 data sets (72%) are used for training process,
877 data sets (14%) for the validation process, and 878 data
sets (14%) for testing.
IV. RESULT AND DISCUSSION
The ANN learning process was conducted by using the
following learning parameters:
1. Learning rate = 0.05
2. Number of epochs (iterations) = 1000
3. Momentum coefficient = 0
4. Variable normalization range = 0 – 0.5
Proceedings of the International MultiConference of Engineers and Computer Scientists 2017 Vol I, IMECS 2017, March 15 - 17, 2017, Hong Kong
ISBN: 978-988-14047-3-2 ISSN: 2078-0958 (Print); ISSN: 2078-0966 (Online)
IMECS 2017

A. Prediction Criteria: MSE and R
The details on the Mean Squared Error (MSE) and
Coefficient of Correlation (R) values obtained through the
BPNN learning process is tabulated in Table II and Table
III. After 1000 epochs during the BPNN learning process,
the average MSE of displacement was calculated as
1.07E104 for training phase, 0.985E10
-4 for validation phase,
and 0.98E10-4
for testing phase (Table II). Meanwhile the
average R of displacement was calculated as 0.982 for
training phase, 0.981 for validation phase and 0.988 for
testing phase as shown in Table III.
TABLE II
MEAN SQUARED ERROR (MSE)
Parameters Mean-Squared-Error (MSE)
Training Validation Testing
Displacement X 1.09E-4 1.01E-4 1.0E-4
Displacement Y 1.05E-4 0.96E-4 0.96E-4
Average 1.07E-4 0.985E-4 0.98E-4
TABLE III
COEFFICIENT OF CORRELATION (R)
Parameters Coefficient of Correlation (R)
Training Validation Testing
Displacement X 0.982 0.981 0.988
Displacement Y 0.982 0.981 0.988
Average 0.982 0.981 0.988
B. ANN Learning Process
The results show that the prediction performance of the
trained BPNN is sufficiently accurate, which can also be
observed on the Target vs. Prediction Plots for all
parameters and learning phase. The Coeffisien of
Correlation (R) of Displacement X and Displacement Y
were calculated as 0.988 for testing phase as shown in Fig. 4
and Fig.5
0
0.1
0.2
0.3
0.4
0.5
0.6
0.7
0 0.1 0.2 0.3 0.4 0.5 0.6 0.7
Prediction
Target
Fig. 4 Displacement X for Testing Phase
0
0.1
0.2
0.3
0.4
0.5
0.6
0.7
0 0.1 0.2 0.3 0.4 0.5 0.6 0.7
Prediction
Target
Fig. 5 Displacement Y for Testing Phase
V. CONCLUSIONS
The MSE was calculated as 1.09x10⁻⁴
for training phase,
0.985x10⁻⁴
for validation phase, and 0.98x10⁻⁴
for testing
phase. Meanwhile, the coefficient of correlation (R) for
testing phase results 0.988 for the testing phase. Both
calculated MSE and R value indicate that the prediction
performance of the trained BPNN is sufficiently accurate.
The BPNN is a very promising tool to provide an early
prediction of story drift (displacement) at multi-story
building in the region of Indonesia to assist further Finite
Element Method analysis.
REFERENCES
[1] S. Mau and V. Aruna, “Story Drift, Shear, and OTM Estimation from
Building Seismic Records,” J. Struct. Eng., vol. 120, no. 11, pp.
3366–3385, Nov. 1994.
[2] S. Akkar, U. Yazgan, and P. Gülkan, “Drift Estimates in Frame
Buildings Subjected to Near-Fault Ground Motions,” J. Struct. Eng.,
vol. 131, no. 7, pp. 1014–1024, Jul. 2005.
[3] S. Rajasekaran and G. A. V. Pai, Neural Network, Fuzzy logic, and
Genetic Algorithms Syntesis and Applications. New Delhi: Prentice
Hall of India, 2007.
[4] V. S. Kanwar, R. P. Singh, N. Kwatra, and P. Aggarwal, “Monitoring
of RCC structures affected by earthquakes,” Geomatics, Nat.
Hazards Risk, vol. 7, no. 1, pp. 37–64, 2016.
[5] H. Maizir and K. A. Kassim, “Neural Network Application in
Prediction of Axial Bearing Capacity of Driven Piles,” Lect. Notes
Eng. Comput. Sci., 2013.
[6] E. Momeni, R. Nazir, D. J. Armaghani, and H. Maizir, “Application
of artificial neural network for predicting shaft and tip resistances of
concrete piles,” Earth Sci. Res. J., vol. 19, no. 1, pp. 85–93, 2015.
[7] D. M. Sahoo, A. Das, and S. Chakraverty, “Interval data-based
system identification of multistorey shear buildings by artificial
neural network modelling,” Archit. Sci. Rev., vol. 58, no. 3, pp. 244–
254, 2015.
[8] A. Gupta and H. Krawinkler, “Estimation of seismic drift demands
for frame structures,” Earthq. Eng. Struct. Dyn., vol. 29, no. 9, pp.
1287–1305, 2000.
[9] R. Suryanita and A. Adnan, “Application of Neural Networks in
Bridge Health Prediction based on Acceleration and Displacement
Data Domain,” IAENG International Conference on Artificial
Intelligence and Applications (ICAIA’13). Hongkong, 13th – 15th
March 2013, 2013.
[10] R. Suryanita and A. Adnan, “Early-Warning System in Bridge
Monitoring Based on Acceleration and Displacement Data Domain,”
in Transactions on Engineering Technologies, vol. 275, G.-C. Yang,
S.-I. Ao, X. Huang, and O. Castillo, Eds. Springer Netherlands, 2014,
pp. 157–169.
Proceedings of the International MultiConference of Engineers and Computer Scientists 2017 Vol I, IMECS 2017, March 15 - 17, 2017, Hong Kong
ISBN: 978-988-14047-3-2 ISSN: 2078-0958 (Print); ISSN: 2078-0966 (Online)
IMECS 2017