application of a moving bed biofilm reactor for tertiary...
TRANSCRIPT

Bioresource Technology 112 (2012) 51–60
Contents lists available at SciVerse ScienceDirect
Bioresource Technology
journal homepage: www.elsevier .com/locate /bior tech
Application of a moving bed biofilm reactor for tertiary ammonia treatmentin high temperature industrial wastewater
Jennifer L. Shore a,b, William S. M’Coy b, Claudia K. Gunsch a, Marc A. Deshusses a,⇑a Department of Civil & Environmental Engineering, Duke University, Durham, NC 27708, United Statesb HDR Engineering, Inc., 5700 Lake Wright Drive, Suite 300, Norfolk, VA 23502, United States
a r t i c l e i n f o a b s t r a c t
Article history:Received 7 November 2011Received in revised form 6 February 2012Accepted 8 February 2012Available online 17 February 2012
Keywords:Moving bed biofilm reactorIndustrial wastewaterBiological nutrient removalNitrificationqPCR
0960-8524/$ - see front matter � 2012 Elsevier Ltd. Adoi:10.1016/j.biortech.2012.02.045
⇑ Corresponding author at: Box 90287, Duke UniversUnited States. Tel.: +1 919 660 5480; fax: +1 919 660
E-mail address: [email protected] (M.A. D
This study examines the use of a moving bed biofilm reactor (MBBR) as a tertiary treatment step forammonia removal in high temperature (35–45 �C) effluents, and quantifies different phenotypes ofammonia and nitrite oxidizing bacteria responsible for nitrification at elevated temperatures. Bench scalereactors operating at 35 and 40 �C were able to successfully remove greater than 90% of the influentammonia (up to 19 mg L�1 NH3–N) in both the synthetic and industrial wastewater. No biotreatmentwas observed at 45 �C, although effective nitrification was rapidly recovered when the temperaturewas lowered to 30 �C. Using qPCR, Nitrosomonas oligotropha was found to be the dominant ammonia oxi-dizing bacterium in the biofilm for the first phases of reactor operation. In the later phases, Nitrosomonasnitrosa was observed and its increased presence may have been responsible for improved ammonia treat-ment efficiency. Accumulation of nitrite in some instances appeared to correlate with temporary lowpresence of Nitrospira spp.
� 2012 Elsevier Ltd. All rights reserved.
1. Introduction
The Chesapeake Bay is the largest estuary in the United States.In recent years the rehabilitation and reduction of point source pol-lution to the Bay has been the focal point of many environmentalconservation efforts. Wastewater treatment facilities (WWTF) areresponsible for 19% of the nitrogen loading in the ChesapeakeBay watershed. In order to meet point source pollution reductiongoals and stringent maximum loading regulations, many municipalWWTFs will be required to add enhanced nutrient removal to theirexisting operations (Chesapeake, 2009). Hopewell Regional Waste-water Treatment Facility (HRWTF; Hopewell, VA) is one of themany facilities facing new regulations. Wasteload allocations forHRWTF have been set at 830 tons of total nitrogen per year by2011. Projected domestic growth in 2011 through 2015 will in-crease the total nitrogen loading above allocated amounts unlessnutrient removal improvements are implemented. This poses somechallenges in that the Hopewell facility receives a blend of 15%domestic wastewater and 85% industrial wastewater from variouschemical and paper industries in the area. Waste streams fromthese industries have a high temperature and vary in chemicalcomposition, both of which can inhibit biological nutrient removal(BNR) (Kelly et al., 2004; Grunditz and Dalhammar, 2001).
ll rights reserved.
ity, Durham, NC 27708-0287,5219.eshusses).
BNR is the preferred treatment method for reduction of organicmaterials and nutrients; however the limit of technology is quicklybeing reached. In recent years, the development and use of a mov-ing bed biofilm reactor (MBBR) as an enhancement of BNR hasevolved to treat a broad range of wastewaters. Advantages ofMBBRs include the reduction in space as compared to traditionalactivated sludge system, ease in upgrade of existing facilities,reduction of headloss when compared to submerged filter configu-rations, fewer requirements for cleaning or backwash, increasedsolid retention time for slow growing organisms, and more rapidrecovery from extreme loading conditions (Rusten et al., 1995;Odegaard et al., 1994; Jahren et al., 2002; Khan et al., 2011). Bio-film-based processes may also lessen the presence of non-floccu-lating filamentous bacteria which, in turn, mitigates problemswith poor flocculation and settling in downstream treatment(LaPara et al., 2001; LaPara and Alleman, 1999). Bench scale MBBRshave been shown to be more stable for nutrient removal thanmembrane bioreactors under fluctuating loading conditions (Yanget al., 2009), and fixed microorganisms are more resilient to fluctu-ations in pH, nutrient concentration, toxic substances (Hosseiniand Borghei, 2005; Lazarova and Manem, 1995; Jaroszynski et al.,2011).
Elevated temperature poses significant challenges for nitrifica-tion. In bench scale experiments, optimal temperatures for ammo-nia oxidizing bacteria (AOB) range from 30–35 to 35–40 �C fornitrite oxidizing bacteria (NOB) (Grunditz and Dalhammar, 2001;Bae et al., 2001; Jones and Hood, 1980). Recently, Zhang et al.

52 J.L. Shore et al. / Bioresource Technology 112 (2012) 51–60
(2009) operated a 15 L sequencing batch biofilm reactor seededwith municipal wastewater to evaluate nitrification rates at fivetemperatures ranging from 15 to 35 �C. The sequencing batch reac-tor achieved an optimal ammonia oxidation rate of 4.7 mg NHþ4 –N L�1 h�1 at 31 �C, while at the maximum operating temperaturetested (35 �C), a rate of 3.2 mg NHþ4 –N L�1 h�1 was achieved. Thetemperature sensitivity of nitrifying bacteria has stimulated de-tailed research on the microbial ecology of AOB and NOB. Quanti-tative polymerase chain reaction (qPCR) has emerged as themethod of choice to evaluate and relate nitrifying bacteria commu-nity structure to nutrient treatment rates, because it can showfunctional diversity between specific phenotypes and may be ap-plied to environmental samples. Methods have been developedto target the ammonia monooxygenase gene (amoA) sequencesspecific to AOB (Dionisi et al., 2002; Geets et al., 2007; Harmset al., 2003; Kuo et al., 2006; Layton et al., 2005; Lim et al.,2008a) and the specific 16S rDNA sequences conserved in the var-ious clusters of AOB (Dionisi et al., 2002; Lim et al., 2008a,b). Be-cause NOB are less phylogenetically diverse, primers for theirquantification are more consistent in the literature (Juretschkoet al., 1998; Gieseke et al., 2001). The primer set targetingNitrospira spp., which are believed to be the dominant NOB inwastewater, is the most commonly used one (Kim and Kim, 2006).
The aim of this research was to evaluate nitrification in a benchscale MBBR at three elevated temperatures (35, 40, and 45 �C) withsynthetic wastewater and with secondary treated effluent from theHopewell facility. It was hypothesized that biofilm growth on thecarrier media would provide some protection for AOB and NOBactivity at those temperatures and allow continued treatment ofammonia despite the adverse operating conditions. Nitrifying bac-teria were quantified by qPCR in an attempt to link nutrient treat-ment rates with specific bacterial population densities.
2. Methods
2.1. Reactor setup and operation
Three bench scale reactors were operated for 116 days. Eachreactor had a 3.5 L operating volume, and a 200 min. hydraulic res-idence time. They were filled with 300 ± 5 pieces each of BioPortzTM
media, a high surface area (580 m2 m�3) cylindrical support made ofHDPE (ca 2 cm dia. � 2 cm tall, Entex Technologies, Chapel Hill, NC)which corresponds to a 50% fill. Fig. 1 shows a schematic of theexperimental setup. Carrier media with a nitrifying biofilm was col-lected from a pilot study at South Durham Wastewater TreatmentFacility (Durham, NC) described in Kim et al. (2010) and immedi-ately transferred to the bench scale reactors. Synthetic wastewater(see composition below) was pumped into each reactor at a rate of17.5 mL min�1. This flow was selected because it provided ahydraulic residence time (200 min) comparable to that of a possible
Fig. 1. Schematic of the bench
full scale basin at HRWTF. The synthetic wastewater nutrient con-centrations were based on historical average secondary effluentconcentrations at HRWTF and consisted of 23 mg L�1 acetic acid,53 mg L�1 glutamic acid, 41 mg L�1 NH4Cl, 21 mg L�1 Na2S2O3,5.7 mg L�1 KH2PO4 and a trace mineral mixture of 2.6 mg L�1 MgSO4
and 0.75 mg L�1 of each Fe2(SO4)3, MnSO4, and ZnSO4 in deionizedwater. The COD of the synthetic waste water was 120 ± 10 mg L�1
(all soluble) which is slightly lower, but still comparable to theCOD of the HRWTF water (see below) The pH was adjusted to 6.7with sodium bicarbonate on a daily basis. Compressed air was bub-bled in the reactors at a rate of 800 mL min�1 which facilitatedliquid mixing and media up/down motion in the reactors and main-tained dissolved oxygen concentrations above 4 mg L�1 as recom-mended by the media manufacturer.
The reactors were initially operated at room temperature (�20–22 �C) with synthetic wastewater for 18 days. The temperature ineach reactor was then increased using heating tape wrappedaround each reactor connected to a constant voltage source untilthe desired operating temperature (i.e., 35, 40 and 45 �C) wasreached (Table 1). After 84 days of operation the influent waterin two reactors was changed from synthetic wastewater to second-ary treated effluent collected on two occasions from HRWTF. Theconcentration of key species in the first batch of HRWTF waterwas 18.6 mg L�1 NH3–N, <1 mg L�1 NO2–N + NO3–N, 6.9 pH,153 mg L�1 CODtotal, 122 mg L�1 CODsoluble, and the temperatureat the time of collection was 41.6 �C. Key species concentrationin the second batch of water was 15.6 mg L�1 NH3 N, <1 mg L�1
NO2–N +NO3–N, pH 6.7, 158 mgL�1 CODtotal, 130 mgL�1 CODsoluble
and the temperature was 37.9 �C. After transport the water wasstored at 5.6 �C to prevent biological growth until it was pumpedinto the reactors.
2.2. Analytical methods
Influent and effluent water testing was conducted on a daily ba-sis for the duration of the experiment. The following nutrient con-centrations were measured colorimetrically with Hach kits and aspectrophotometer DR/2500 (Hach, Loveland, CO): NO3
- -N (cad-mium reduction method), NO�2 –N (diazotization method), NH3–N(salicylate method), and unfiltered COD (reactor digestion meth-od). pH was measured with an Accumet liquid-filled, glass bodysingle-junction combination pH Ag/AgCl Electrode (Fisher Scien-tific, Pittsburg, PA). Temperature was monitored and recorded con-tinuously with a stainless steel temperature probe and Labquestinterface (Vernier Software & Technology, Beaverton, OR). Micro-soft Office Excel 2007 was used for all statistical analysis. For meancomparison of more than two data sets ANOVA analysis was em-ployed, whereas a two-tailed Student’s t-test was used to evaluatestatistical differences for paired two sample means. A 95%confidence interval was used for all statistical analyses.
scale experimental set-up.

Table 1Reactor operating conditions.
Phase Start-up Phase 1 Phase 2 Phase 3 Phase 4 Phase 5
Operation days 1–17 18–32 32–59 60–83 84–100 101–116Reactor 1 30 �C 30 �C 35 �C 35 �C 35 �C** 35 �C**
Reactor 2 30 �C 30 �C 40 �C 40 �C 40 �C** 40 �C**
Reactor 3 30 �C 30 �C 45–30 �C* 45 �C 45 �C 45 �C
* Failure of temperature control on day 38 resulting in overheating to 55 �C for 3 h, after which the temperature was lowered to 30 �C for two weeks to allow for recovery.** Operation with HRWTF secondary effluent.
J.L. Shore et al. / Bioresource Technology 112 (2012) 51–60 53
For dry-weight biomass quantification, three pieces of mediawere extracted from each reactor on selected dates. After eachsampling event, three pieces of clean, new media were used toreplenish the reactor. Upon extraction, each piece of media wasplaced in an aluminum pan and dried for 4 h at 105 �C. Afterweighing, each piece of media was placed in 100 mL of 5 N sulfuricacid and stirred for 24 h in an enclosed container. Following theacid digestion wash, each media piece was thoroughly rinsed withdistilled water and dried at 105 �C for 4 h. The final mass was mea-sured and subtracted from the initial mass to determine the dryweight of biomass per piece of media.
2.3. DNA extraction and quantitative polymerase chain reaction
DNA was extracted for analysis during each phase of reactoroperation. A total of five samples for Reactors 1 and 2 and four sam-ples from Reactor 3 were randomly taken for molecular analysis.Biomass was manually scraped off from inner walls of theBioportzTM media and was stored at�80 �C until further processing.Prior to DNA extraction, biomass was thawed and 1 mL of steriledistilled water was added per 20 mg wet-weight biomass; biofilmflocs were manually homogenized by repeated passing through a25 gauge syringe needle. Samples were centrifuged at 10,000g forone minute and DNA was extracted using the MOBIO UltraCleanTM
Microbial DNA isolation kit (Carlsbad, CA) following the manufac-turer’s protocols. DNA concentration and quality was determinedby measuring absorbance at 260 and 280 nm using a NanoDropSpectrophotometer ND-1000 (Fisher Thermo Scientific, Waltham,MA) and calculating the ratio of A260/A280. Samples with A260/A280
ranging from 1.8 to 2.0 were used in subsequent analyses. Sampleswere diluted with PCR grade sterile water to a final concentration of5 nglL�1 and stored at �20 �C until further dilution for PCRamplification.
Total bacteria as well as AOB and NOB were quantified usingpublished primer sequences and temperature cycling programs.The specific gene targets were N. oligotropha amoA and 16S rDNAfrom total bacteria, N. europaea, N. nitrosa, Nitrospira spp. andNitrosospira spp. Table 2 lists the primers used in this study. All oli-gonucleotide primers were obtained from Integrated DNA Technol-ogies (Coralville, IA). PCR amplicon lengths were verified byagarose gel electrophoresis. All qPCR experiments were performedusing a M�3000P QPCR System (Stratagene, La Jolla CA) and iTaq
Table 2Oligonucleotide primers used in qPCR analysis.
Target Primer
N. oligotropha amoA gene amoNo550D2famoNo754r
Nitrosomonas nitrosa Cluster 16S rDNA NSMnit-438fNSMnit-633r
Nitrospira spp. 16S rDNA NSR1113fNSR1264r
16s rDNA Total bacteria 799F 16S rDNA1063R 16S rDNA
Nitrosomonas europaea cluster 16S rDNA NSMeur-828fNSMeur-1028r
SYBR Green Supermix with ROX (Bio-Rad Laboratories, Hercules,CA). At the end of each qPCR run, a dissociation curve analysiswas performed with five serial dilutions of the target PCR ampliconto ensure the quality of the PCR products. The control was obtainedthrough amplifications of phase 1 samples.
The qPCR samples and conditions were as described in therespective studies referenced in Table 2 with the following modifi-cations. The final concentrations for each primer set were 300 nMfor N. oligotropha amoA, 500 nM for N. nitrosa 16S rDNA, 600 nM forNitrospira spp. 16S rDNA, and 200 nM for 16S rDNA for total bacte-ria. A final concentration of 1 nglL�1 of total DNA was used for allreactions. All reactions were completed in duplicate. Standardcurves for each target gene were generated by performing qPCRwith DNA concentrations ranging from 0.1 to 1000 nglL�1. Theefficiency (E) of each reaction was calculated as described in Livakand Schmittgen (2001); values were greater than 91% for all prim-ers and except for the 16S rDNA reference primer (E = 66%). R2 val-ues for efficiency curves were greater than 0.985 for all primer sets.
Relative quantification was carried out by determining the rel-ative gene abundance for a target population in comparison to areference population (i.e., 16S rDNA for total bacteria) using thecomparative threshold method (Pfaffl, 2001; Gunsch et al., 2006).Briefly, the threshold cycle numbers (Ct) which is a measure of atarget gene concentration is determined as the number of PCR cy-cles for which a threshold fluorescence level is reached. Ct valuescan then be compared between treatments to determine the rela-tive abundance of specific genes or specific microbial populations.In this study, the relative abundance was normalized at each timepoint relative to a calibrator sample. The calibrator sample waschosen as that collected on day 32 (last day of phase 1 operation).This time point was selected because all reactors had been oper-ated under the same conditions up to this point and had similarammonia treatment performance (87–88% of influent ammonia re-moved) and biomass concentrations. The relative gene target num-ber (R) was calculated as shown in Eq. 1.
R ¼ ð1þ EtargetÞCt;target;calibrator�Ct;target;sample
ð1þ Etotal 16SÞCt;total16S;sample�Ct;total16S;sampleð1Þ
Where Etotal16S and Etarget represent the amplification efficiencyfor total 16S rDNA (reference population) and for each target,respectively; Ct,Total16S,calibrator and Ct,target,calibrator are the thresholdcycle numbers for total 16S rDNA and each target population at
Sequence 50–30 Reference
TCAGTAGCYGACTACACMGG Harms et al. (2003)CTTTAACATAGTAGAAAGCGGTTCGG TCGGG AAGAW ATAG Lim et al. 2008bCTAGT YATAT AGTTT CAAAC GCCCTGCTTTCAGTTGCTACCG Harms et al. (2003)GTTTGCAGCGCTTTGTACCGGGTAGTCYAYGCMSTAAACG Bach et al. (2002)GACARCCATGCASCACCTGGTTGT CGGAT CTAAT TAAG Lim et al. (2008a)TGTCT TGGCT CCCTT TC

54 J.L. Shore et al. / Bioresource Technology 112 (2012) 51–60
day 32; Ct,target,sample and Ct,total16Ssample are the threshold cyclenumbers for total 16S rDNA and each target population at the se-lected sampling event.
3. Results and discussion
3.1. Effect of temperature on ammonia treatment
Average ammonia treatment efficiencies in Reactors 1, 2 and 3are shown in Table 3. Ammonia treatment in the different bioreac-tors were not statistically different (p > 0.05) during Phase 1 whenall reactors were operated at 30 �C. However, changes occurredafter the temperature was increased and when the influent wasswitched from synthetic wastewater to HRWTF secondary effluent.
3.1.1. Reactor 1 (35 �C)After the temperature was raised to 35 �C in Phase 2, Reactor 1
maintained nitrification rates which were not statistically differentthan those obtained in Phase 1 (Fig. 2A). Ammonia removal effi-ciency gradually increased in Phase 3, while a slight increase inthe effluent nitrate concentration and a transient effluent nitriteconcentration around 2–3 mgL�1 NO2–N were observed. Ammoniaeffluent concentrations further decreased when influent water wasswitched from the synthetic wastewater to HRWTF water. SinceHRWTF secondary effluent had a greater concentration of ammoniathan the synthetic wastewater, Phases 4 and 5 also corresponded toan increase in ammonia loading. Ammonia influent concentrationswere 18.6 and 15.6 mgL�1 NH3–N in Phases 4 and 5, respectively,compared to 12.5 mgL�1 NH3–N in Phases 1–3. Ammonia removalwas significantly different when comparing to values when the syn-thetic wastewater was used in Phase 3 and the Hopewell water inPhases 4 and 5 (ANOVA, p < 0.05). The 5% increase in ammonia re-moval efficiency may be attributed to additional matrix chemicalsin the Hopewell water, shifts in AOB population (discussed below),increased specific activity of the AOB or reduced competition withheterotrophic bacteria in the biofilm due to a possible decrease inbioavailable COD in the HRWTF water. During Phase 3, on days67–83, an unexpected buildup of nitrite was observed (Fig. 2a),which peaked at roughly 3 mg L�1 NO�2 –N. A priori, there was noparticular reason for such a drastic change in treatment perfor-mance, but monitoring of the nitrifying community revealed thatthis partial upset coincided with a decrease in normalized NOBpopulation during Phase 3. This is discussed later in Section 3.3. In
Table 3Average ammonia treatment efficacy during reactor operation, values are calculated from toperation in each phase.
Temperature �C Average % NH3–N removal
Reactor 1Phase 1 30 87.7 (±7.6)%Phase 2 35 –*
Phase 3 35 92.6 (±6.8)%Phase 4** 35 97.4 (±0.8)%Phase 5** 35 98.1 (±0.3)%Reactor 2Phase 1 30 �C 86.9 (±7.3)%Phase 2 40 �C –*
Phase 3 40 �C 90.1 (±5.6)%Phase 4** 40 �C 97.8 (±1.5)%Phase 5** 40 �C 98.3 (±0.2)%Reactor 3Phase 1 30 88.0 (±6.0)%Phase 2 45–30 90.5 (±3.1)%Phase 3 45 18.3 (±3.4)%Phase 4 45 18.3 (±3.4)%
* Unsteady state, average removal not calculated** Operation with HRWTF secondary effluent.
Phases 4 and 5, nitrite concentrations remained less than 0.1 mgL�1
NO�2 –N. Effective nitrification occurring at this temperature rangewas expected as optimal temperature for freshwater nitrifiers isapproximately 35 �C (Grunditz and Dalhammar, 2001; Jones andHood, 1980).
3.1.2. Reactor 2 (40 �C)At the beginning of Phase 2, after the temperature was in-
creased to 40 �C, nitrification was temporarily inhibited (Fig. 2b).The effluent nitrate concentration reached approximately 3 mgL�1
NO�3 –N and ammonia treatment efficacy was less than 30%. How-ever, within four weeks, the reactor recovered and, during the lasteleven days of Phase 3, ammonia treatment efficacy was close to90%, i.e., not significantly different than for operation at 30 �C. InPhase 3, the effluent nitrate concentrations increased to an averageof 11.5 mgL�1 NO�3 –N indicating that nitrite oxidation was wellestablished. This corresponded with a relative increase in Nitrospir-a spp. population observed in Phase 3 (discussed in the next sec-tion). In Phases 4 and 5, ammonia treatment continued toimprove, and was significantly increased as compared to treatmentperformance in Phases 1, 2, and 3 (ANOVA, p < 0.05). However,even though the ammonia loading was significantly different, therewas no significant difference in ammonia treatment efficiency be-tween Phases 4 and 5 (t-test, p > 0.05). Effluent nitrite concentra-tions remained stable during Phase 4 and 5 with an averageconcentration of 0.10 ± 0.04 mgL�1 NO2-N. Effluent nitrate concen-trations decreased slightly in Phase 5. This decrease was attributedto the lower ammonia concentration in the second batch of HRWTFsecondary effluent. Surprisingly, within 6 h after the beginning ofPhase 4 (switch to HRWTF secondary effluent), the movement ofmedia in Reactor 2 changed drastically; roughly one third of themedia floated to the top of the reactor, while the remainder contin-ued to circulate in a pattern similar to previous operations. Thiswas unchanged for the remainder of the experiments and wasnot observed in either Reactor 1 or 3. Based on effluent ammoniaconcentrations, this did not adversely affect the treatment perfor-mance of Reactor 2. It is unclear why this phenomenon was ob-served in this reactor only, and what or even if any parameter inthe Hopewell water caused it. Slight variations in air bubblesdistribution, possibly in bubble coalescence or differences in bio-film density could be the cause. Even so, treatment of ammonia re-mained unchanged because the mixing time in the bioreactor waswell below the hydraulic retention time.
he arithmetic mean of effluent concentrations measured from the final eleven days of
Comments
Not significantly different from R-2, R-3 at 30 �CAcclimation periodNot significantly different from R-2 40 �CRemoval % for different Hopewell samples are not significantly different.
Not significantly different from R-1, R-3 at 30 �CAcclimation periodNot significantly different from R-1 35 �CRemoval % for different Hopewell samples are not significantly different.
Not significantly different from R-1, R-2 at 30 �C–––

Fig. 2. Influent/effluent ammonia and nitrate concentrations (left axis), effluent nitrite concentrations (right axis) for the three bioreactors during the experiment. The dashedlines indicate the different phases and arrows indicate time of sampling for DNA analysis.
J.L. Shore et al. / Bioresource Technology 112 (2012) 51–60 55
The data for Reactor 2 indicate that nitrification is possible attemperatures that exceed the documented optimal growth tem-perature for pure cultures of nitrifying bacteria operating in smallscale batch reactors (Grunditz and Dalhammar, 2001; Bae et al.,2001; Jones and Hood, 1980). Batch reactor studies are useful inpreliminary testing; however due to their short operation timeand decreasing substrate concentrations, they are not optimal forbacterial adaptation. Results for Reactors 1 and 2 show that adap-tation can range from several days to over a week. The similarnitrification rates observed at both 35 and 40 �C (Reactors 1 and2) contradict previous findings by Zhang et al. (2009) whose recentstudy found that optimal ammonia treatment in a sequencingbatch biofilm reactor occurred at 31 �C and decreased at 35 �C.The biofilm reactor was first operated at 35 �C for 14 days and at31 �C for 28 days. In contrast, the reactors in this study were oper-ated at elevated and constant temperatures for over 80 days to al-low ample time for stabilization, as illustrated by the 97% ammoniaremoval efficiencies recorded in Phases 4 and 5. The difference be-tween Zhang et al. and our findings suggests that extended accli-mation time and time to build up dense biofilms are needed,when working with slow growing organisms such as nitrifiers, un-der significant environmental stress.
3.1.3. Reactor 3 (45 �C)Reactor 3 was operated at 45 �C for five days (day 32–38) before
failure of the temperature control resulted in overheating to 55 �C.After 3 h at 55 �C, the temperature was reduced to 30 �C to allowthe microbial community to recover from the heat shock. Withintwo weeks, Reactor 3 was able to once again remove 90% of theinfluent ammonia without re-inoculation of nitrifying bacteria.During the two week recovery, the total inorganic nitrogen in theeffluent was found to be double the amount of ammonia enteringthe reactor. This indicates that significant release of inorganicnitrogen occurred from the system, probably as a result of biomasshydrolysis at elevated temperature (Iranpour et al., 2002). The in-crease in the effluent nitrate and nitrite concentrations also corre-lated with an increase of ammonia removal (Fig. 2c). The recoveryobserved in Reactor 3 after the temperature shock indicates that aviable nitrifying biofilm was retained on the floating media. It alsoillustrates that the MBBR can successfully overcome inevitableprocess upsets without the added cost of biomass recycle, as insuspended biomass systems. Temperature was again increased to45 �C on day 60 and the bioreactor was operated at this tempera-ture for 34 days during which an average of 18.3 ± 4.5% ammoniawas removed. Average influent and effluent nitrate concentrations

56 J.L. Shore et al. / Bioresource Technology 112 (2012) 51–60
were 1.3 ± 0.6 mgL�1 NO�3 –N and 3.0 ± 0.6 mgL�1 NO3–N respec-tively, and average influent/effluent nitrite concentrations were0.027 ± 0.016 mgL�1 NO�2 –N and 0.164 ± 0.04 mgL�1 NO2–Nrespectively indication minimal ammonia oxidation. The reactor’sinability to effectively nitrify at 45 �C is consistent with previousstudies (Grunditz and Dalhammar, 2001; Bae et al., 2001; Jonesand Hood, 1980). Even so, Reactor 3 was able to remove approxi-mately 44% of the influent COD at 45 �C (Figure S1, in Supplemen-tary Information). This level of COD removal was not unexpectedas thermotolerant and thermophilic heterotrophs are commonlyreported for COD removal (LaPara and Alleman, 1999).
3.1.4. Nitrogen balance and distributionAn inorganic nitrogen balance was conducted by summing
influent and effluent concentrations of NH3–N, NO�2 –N, and NO�3 –N. If nitrification is the dominant ammonia removal process occur-ring in the reactor, then the total influent and effluent inorganicnitrogen concentrations should be nearly equal. Fig. 3 provides dai-ly total influent and effluent inorganic nitrogen concentrations,while speciation of inorganic nitrogen can be found in Fig. 2, dis-cussed earlier. In the early phases of operation, some discrepancyis observed between total influent and effluent inorganic nitrogenflux, most probably because of assimilation of nitrogen by bacteria,for cell growth, and partial stripping of ammonia before nitrifica-tion was well established. It is not clear why there were differencesin the nitrogen balances through the beginning of Phase 3 between
Fig. 3. Influent/effluent total inorganic nitrogen (NH3–N + NO�2 –N
Reactor 1 and Reactor 2. Possibly greater growth occurred in Reac-tor 1 (which was operated at a lower temperature), a speculationsupported by biomass measurements presented in Fig. 4 (dis-cussed below). During the latter days of Phase 3, the average influ-ent total inorganic nitrogen concentration was 13.9 ± 0.7 mgL�1–Nand effluent values were 13.6 ± 0.9 and 13.5 ± 0.1 mgL�1–N forReactors 1 and 2, respectively, indicating excellent closure (>99%)of the nitrogen balance. A different balance was observed whenReactors 1 and 2 were fed Hopewell water, as only between 60and 70% of the total influent inorganic nitrogen was recovered(mainly as nitrate and nitrite, see Fig. 2) in the effluent. The 4–8 mg L�1 discrepancy in the total inorganic nitrogen entering andexiting the reactors during Phases 4 and 5 is indicative of nitrogenremoval by a mechanism other than nitrification within the reac-tor. This finding is discussed in the next paragraph. The inorganicnitrogen balance in Reactor 3 generally showed excellent corre-spondence between influent and effluent nitrogen concentrations,except between days 43 and 60 during which very high nitrite con-centrations were observed in the effluent. This was most likelycaused by the upset of the culture and hydrolysis of organic nitro-gen as a result of the temperature shock. This result shows thatprocess failures can result in the temporary release of nitrogenconcentrations that exceed the influent concentrations.
A detailed determination of nitrogen removal mechanisms otherthan nitrification was not conducted in this research, however severalpossibilities exist to explain the missing nitrogen fraction observed in
+ NO�3 –N) for the three bioreactors during the experiment.
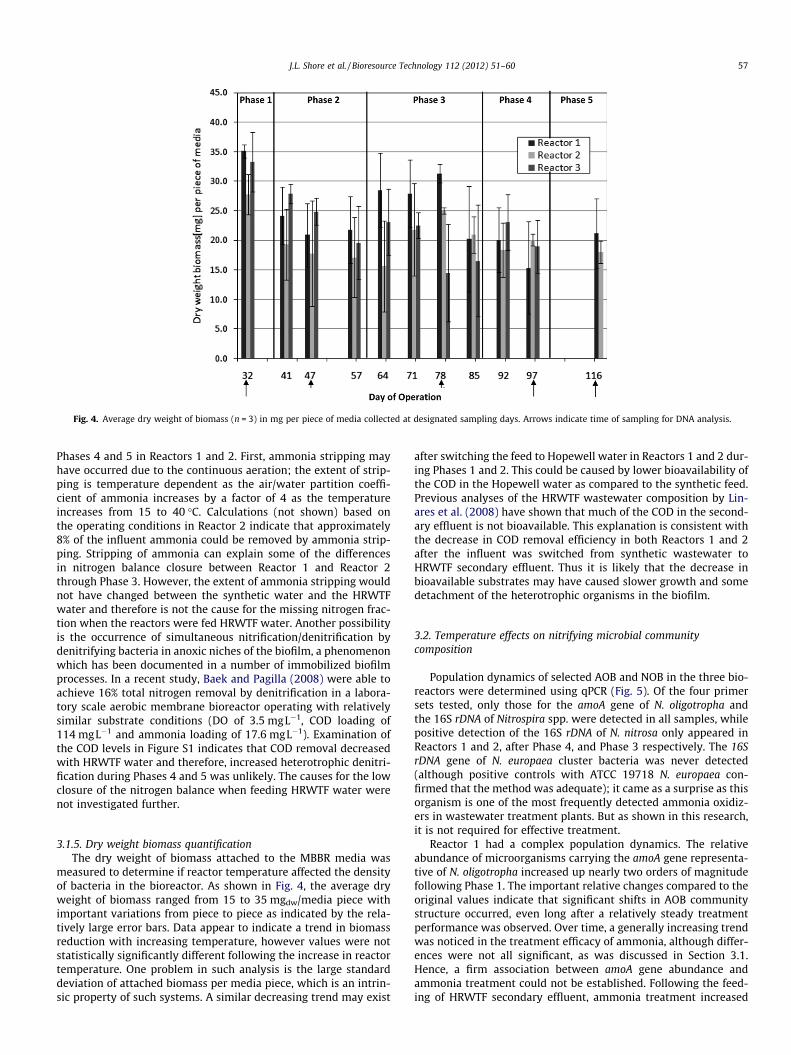
Fig. 4. Average dry weight of biomass (n = 3) in mg per piece of media collected at designated sampling days. Arrows indicate time of sampling for DNA analysis.
J.L. Shore et al. / Bioresource Technology 112 (2012) 51–60 57
Phases 4 and 5 in Reactors 1 and 2. First, ammonia stripping mayhave occurred due to the continuous aeration; the extent of strip-ping is temperature dependent as the air/water partition coeffi-cient of ammonia increases by a factor of 4 as the temperatureincreases from 15 to 40 �C. Calculations (not shown) based onthe operating conditions in Reactor 2 indicate that approximately8% of the influent ammonia could be removed by ammonia strip-ping. Stripping of ammonia can explain some of the differencesin nitrogen balance closure between Reactor 1 and Reactor 2through Phase 3. However, the extent of ammonia stripping wouldnot have changed between the synthetic water and the HRWTFwater and therefore is not the cause for the missing nitrogen frac-tion when the reactors were fed HRWTF water. Another possibilityis the occurrence of simultaneous nitrification/denitrification bydenitrifying bacteria in anoxic niches of the biofilm, a phenomenonwhich has been documented in a number of immobilized biofilmprocesses. In a recent study, Baek and Pagilla (2008) were able toachieve 16% total nitrogen removal by denitrification in a labora-tory scale aerobic membrane bioreactor operating with relativelysimilar substrate conditions (DO of 3.5 mgL�1, COD loading of114 mgL�1 and ammonia loading of 17.6 mgL�1). Examination ofthe COD levels in Figure S1 indicates that COD removal decreasedwith HRWTF water and therefore, increased heterotrophic denitri-fication during Phases 4 and 5 was unlikely. The causes for the lowclosure of the nitrogen balance when feeding HRWTF water werenot investigated further.
3.1.5. Dry weight biomass quantificationThe dry weight of biomass attached to the MBBR media was
measured to determine if reactor temperature affected the densityof bacteria in the bioreactor. As shown in Fig. 4, the average dryweight of biomass ranged from 15 to 35 mgdw/media piece withimportant variations from piece to piece as indicated by the rela-tively large error bars. Data appear to indicate a trend in biomassreduction with increasing temperature, however values were notstatistically significantly different following the increase in reactortemperature. One problem in such analysis is the large standarddeviation of attached biomass per media piece, which is an intrin-sic property of such systems. A similar decreasing trend may exist
after switching the feed to Hopewell water in Reactors 1 and 2 dur-ing Phases 1 and 2. This could be caused by lower bioavailability ofthe COD in the Hopewell water as compared to the synthetic feed.Previous analyses of the HRWTF wastewater composition by Lin-ares et al. (2008) have shown that much of the COD in the second-ary effluent is not bioavailable. This explanation is consistent withthe decrease in COD removal efficiency in both Reactors 1 and 2after the influent was switched from synthetic wastewater toHRWTF secondary effluent. Thus it is likely that the decrease inbioavailable substrates may have caused slower growth and somedetachment of the heterotrophic organisms in the biofilm.
3.2. Temperature effects on nitrifying microbial communitycomposition
Population dynamics of selected AOB and NOB in the three bio-reactors were determined using qPCR (Fig. 5). Of the four primersets tested, only those for the amoA gene of N. oligotropha andthe 16S rDNA of Nitrospira spp. were detected in all samples, whilepositive detection of the 16S rDNA of N. nitrosa only appeared inReactors 1 and 2, after Phase 4, and Phase 3 respectively. The 16SrDNA gene of N. europaea cluster bacteria was never detected(although positive controls with ATCC 19718 N. europaea con-firmed that the method was adequate); it came as a surprise as thisorganism is one of the most frequently detected ammonia oxidiz-ers in wastewater treatment plants. But as shown in this research,it is not required for effective treatment.
Reactor 1 had a complex population dynamics. The relativeabundance of microorganisms carrying the amoA gene representa-tive of N. oligotropha increased up nearly two orders of magnitudefollowing Phase 1. The important relative changes compared to theoriginal values indicate that significant shifts in AOB communitystructure occurred, even long after a relatively steady treatmentperformance was observed. Over time, a generally increasing trendwas noticed in the treatment efficacy of ammonia, although differ-ences were not all significant, as was discussed in Section 3.1.Hence, a firm association between amoA gene abundance andammonia treatment could not be established. Following the feed-ing of HRWTF secondary effluent, ammonia treatment increased

Fig. 5. Relative abundance ratio of target gene with respect to the control sample in Phase 1 and normalized to the reference total bacteria 16S rDNA. Values represent thearithmetic average of ratios calculated for each phase and target primer set. Note the different Y scales.
58 J.L. Shore et al. / Bioresource Technology 112 (2012) 51–60
to 97.4 (±0.9)%, a significant increase compared to earlier phases.At the same time, a new target AOB cluster corresponding toN. nitrosa was observed (Fig. 5a). No amplification had been ob-tained for this target in any sample obtained during Phases 1–3,and thus, N. nitrosa must have been introduced into the systemvia the Hopewell water, although no analysis was conducted toconfirm this hypothesis. The relative N. nitrosa population numbersincreased by about two orders of magnitude in Phase 5 while the N.oligotropha population returned to the original level observed dur-ing Phase 1. Fluctuations of AOB populations and the emergence ofnew nitrifying populations is not unusual. Kuo et al. alternatedhigh (55 mgL�1 NH3–N) and low (20 mgL�1 NH3–N) ammonia con-centrations in pilot-scale bioreactors and found that N. nitrosapopulations decreased at lower nitrogen loading and increasedwith high nitrogen loading, while a high density of N. oligotrophacorrelated with very short solids retention times throughout the120 day experiment. Van den Akker et al. (2010) also observedimportant fluctuations in AOB density over time in integratedfixed-film activated sludge (IFAS) bioreactors, however there wasno correlation with treatment performance, which led to the
conclusion that there was excess nitrifying capacity in their biore-actor. Furthermore, shifts from one dominant AOB species to an-other over extended time similar to that documented in thepresent study have been reported by others. Layton et al. (2005) re-ported on the ecology of an industrial wastewater treatment facil-ity and showed dominance of N. nitrosa in the first 7 months, whilebeginning in month seven, N. communis was detected and domi-nated the AOB population for the remainder of the experiment(6 months).
The relative abundance of NOB decreased in comparison to itsinitial value after the reactor temperature was first increased(Phases 2 and 3, see Fig. 5a). Remarkably, this decrease also corre-sponded to the build-up of nitrite measured in Phase 3 (Fig. 2a). InPhases 4 and 5, the relative abundance of Nitrospira spp. in thebioreactor increased and nitrite concentrations decreased onceagain to levels below 0.1 mgL�1. Thus, there appears to be someassociation between the relative abundance of Nitrospira spp. andnitrite oxidation.
Similar effects to that observed in Reactor 1 were found in Reac-tor 2 with respect to community dynamics (Fig. 5b). The relative

J.L. Shore et al. / Bioresource Technology 112 (2012) 51–60 59
abundance of N. oligotropha and Nitrospira spp. decreased signifi-cantly in Phase 2 which corresponds to the first acclimation to ele-vated temperature, during which a transient deficiency inammonia treatment occurred. This observation suggests that atemperature increase of 10 �C is capable of acutely disrupting thenitrifying microbial community, with visible impacts as far astreatment of ammonia and nitrite is concerned. In Phase 3, Reactor2 was able to effectively remove ammonia and this correspondedto a rebound in population concentration for both N. oligotrophaand Nitrospira spp. when compared to the Phase 1 control point.In Phase 3, the largest population of N. oligotropha was observedtogether with the emergence of N. nitrosa. Interestingly, this coin-cided with the detection of elevated levels of nitrite, indicating thatAOB were able to produce nitrite at faster rates than NOB were ableto oxidize it. In Phases 4 and 5, the balance of AOB and NOB waschanged and effluent nitrite returned to low values (<2 mg L�1
NO�2 –N).The population dynamics results of Reactor 3 added further evi-
dence that nitrifying populations, in particular Nitrospira spp., areespecially sensitive to the high temperatures. During Phase 2, fol-lowing the five day temperature shock (days 32–38), the relativeabundance of Nitrospira spp. dropped by two orders of magnitudewhereas the relative number of N. oligotropha microorganisms didnot significantly change (Fig. 5c). The sampling event for Phase 2occurred on day 47 when measured nitrite values were beginningto peak and the reactor was beginning to remove ammonia again atgreater than 80% efficiency. These data indicate that N. oligotrophamay be either less sensitive to temperature shock or that it recov-ered faster than Nitrospira spp. Later, as the temperature was in-creased to 45 �C the relative abundance of both N. oligotrophaand Nitrospira spp. dropped by more than two orders of magnitude,while N. nitrosa was never detected in that reactor (but unlikeReactors 1 and 2, Reactor 3 was never fed Hopewell water). Theseobservations are consistent with the quasi total loss in nitrificationactivity in Phases 3 and 4 (see Table 3).
Overall, the data in Fig. 5 and the above discussion illustratesthat complex population dynamics were observed over time in allthree bioreactors. These did not always translate into clear differ-ences in ammonia or nitrite treatment. One limitation of the qPCRapproach is that it cannot distinguish between active and inactivemicrobial fractions. Thus, here, the implicit assumption that geneabundance correlated with activity was made, although it is notnecessarily valid. Further, in bioreactors that rely on biofilms, it islikely that some inactive organisms remain embedded deep in thebiofilms, protected from shear by the outer layer of actively grow-ing and continuously sheared organisms. This could possibly dam-pen the population dynamic patterns. Even so, certain distinctcorrespondences between population dynamics and treatment per-formance were identified which helped improve our understandingof the microbial ecology of MBBRs removing ammonia.
4. Conclusions
The MBBRs successfully treated high temperature secondaryeffluent. Nitrification was achieved at 35 and 40 �C with ammoniatreatment exceeding efficacy of 95% and effluent concentrationsbelow 1 mgL�1-N. At 45 �C, nitrification could not be sustainedfor more than 24 h, however the MBBR recovered within twoweeks once the temperature was decreased to 30 �C. Shifts inAOB from N. oligotropha to N. nitrosa were observed. In some cases,an increase in N. nitrosa was linked to improved ammonia treat-ment and decreases in Nitrospira spp. correlated with the buildup of nitrite. These results demonstrate that some insight can bederived from correlating microbial population structure and biore-actor activity.
Acknowledgement
The funding for this study by HDR Engineering, Inc, Norfolk,Virginia is acknowledged.
Appendix A. Supplementary data
Supplementary data associated with this article can be found, inthe online version, at doi:10.1016/j.biortech.2012.02.045.
References
Bach, H.J., Tomanova, J., Schloter, M., Munch, J.C., 2002. Enumeration of totalbacteria and bacteria with genes for proteolytic activity in pure cultures and inenvironmental samples by quantitative PCR mediated amplification. Journal ofMicrobiological Methods 49 (3), 235–245.
Bae, W., Baek, S., Chung, J., Lee, Y., 2001. Optimal operational factors for nitriteaccumulation in batch reactors. Biodegradation 12 (5), 359–366.
Baek, S.H., Pagilla, K.R., 2008. Simultaneous nitrification and denitrification ofmunicipal wastewater in aerobic membrane bioreactors. Water EnvironmentResearch 80 (2), 109–117.
Chesapeake Bay Program, 2009. Chesapeake Bay Program 2011 Milestones toReduce Nitrogen and Phosphorus, Chesapeake Bay Program, Annapolis.
Dionisi, H.M., Layton, A.C., Harms, G., Gregory, I.R., Robinson, K.G., Sayler, G.S., 2002.Quantification of Nitrosomonas oligotropha-like ammonia-oxidizing bacteriaand Nitrospira spp. from full-scale wastewater treatment plants by competitivePCR. Applied and Environmental Microbiology 68 (1), 245–253.
Geets, J., de Cooman, M., Wittebolle, L., Heylen, K., Vanparys, B., De Vos, P.,Verstraete, W., Boon, N., 2007. Real-time PCR assay for the simultaneousquantification of nitrifying and denitrifying bacteria in activated sludge.Applied Microbiology and Biotechnology 75 (1), 211–221.
Gieseke, A., Purkhold, U., Wagner, M., Amann, R., Schramm, A., 2001. Communitystructure and activity dynamics of nitrifying bacteria in a phosphate-removingbiofilm. Applied and Environmental Microbiology 67 (3), 1351–1362.
Grunditz, C., Dalhammar, G., 2001. Development of nitrification inhibition assaysusing pure cultures of Nitrosomonas and Nitrobacter. Water Research 35 (2),433–440.
Gunsch, C.K., Kinney, K.A., Szaniszlo, P.J., Whitman, C.P., 2006. Quantification ofhomogentisate-1,2-dioxygenase expression in a fungus degradingethylbenzene. Journal of Microbiological Methods 67 (2), 257–265.
Harms, G., Layton, A.C., Dionisi, H.M., Gregory, I.R., Garrett, V.M., Hawkins, S.A.,Robinson, K.G., Sayler, G.S., 2003. Real-time PCR quantification of nitrifyingbacteria in a municipal wastewater treatment plant. Environmental Science &Technology 37 (2), 343–351.
Hosseini, S.H., Borghei, S.M., 2005. The treatment of phenolic wastewater using amoving bed bio-reactor. Process Biochemistry 40 (3–4), 1027–1031.
Iranpour, R., Oh, S., Cox, H.H.J., Shao, Y.J., Moghaddam, O., Kearney, R.J., Deshusses,M.A., Stenstrom, M.K., Ahring, B.K., 2002. Changing mesophilic wastewatersludge digestion into thermophilic operation at Terminal Island TreatmentPlant. Water Environment Research 74 (5), 494–507.
Jahren, S.J., Rintala, J.A., Odegaard, H., 2002. Aerobic moving bed biofilm reactortreating thermomechanical pulping whitewater under thermophilic conditions.Water Research 36 (4), 1067–1075.
Jaroszynski, L.W., Cicek, N., Sparling, R., Oleszkiewicz, J.A., 2011. Importance of theoperating pH in maintaining the stability of anoxic ammonium oxidation(anammox) activity in moving bed biofilm reactors. Bioresource Technology102 (14), 7051–7056.
Jones, R.D., Hood, M.A., 1980. Effects of temperature, pH salinity, and inorganicoxidation by nitrifiers isolated from wetland environments. Microbial Ecology 6(4), 339–347.
Juretschko, S., Timmermann, G., Schmid, M., Schleifer, K.H., Pommerening-Roser, A.,Koops, H.P., Wagner, M., 1998. Combined molecular and conventional analysesof nitrifying bacterium diversity in activated sludge: Nitrosococcus mobilis andNitrospira-like bacteria as dominant populations. Applied and EnvironmentalMicrobiology 64 (8), 3042–3051.
Kelly, R.T., Henriques, I.D.S., Love, N.G., 2004. Chemical inhibition of nitrification inactivated sludge. Biotechnology and Bioengineering 85 (6), 683–694.
Khan, S.J., Ilyas, S., Javid, S., Visvanathan, C., Jegatheesan, V., 2011. Performance ofsuspended and attached growth MBR systems in treating high strengthsynthetic wastewater. Bioresource Technology 102 (9), 5331–5336.
Kim, D.J., Kim, S.H., 2006. Effect of nitrite concentration on the distribution andcompetition of nitrite-oxidizing bacteria in nitratation reactor systems andtheir kinetic characteristics. Water Research 40 (5), 887–894.
Kim, H.S., Gellner, J.W., Boltz, J.P., Freudenberg, R.G., Gunsch, C.K., Schuler, A.J., 2010.Effects of integrated fixed film activated sludge media on activated sludgesettling in biological nutrient removal systems. Water Research 44 (5), 1553–1561.
Kuo, D.H.W., Robinson, K.G., Layton, A.C., Meyers, A.J., Sayler, G.S., 2006. Real-timePCR quantification of ammonia-oxidizing bacteria (AOB): Solids retention time(SRT) impacts during activated sludge treatment of industrial wastewater.Environmental Engineering Science 23 (3), 507–520.
60 J.L. Shore et al. / Bioresource Technology 112 (2012) 51–60
LaPara, T.M., Alleman, J.E., 1999. Thermophilic aerobic biological wastewatertreatment. Water Research 33 (4), 895–908.
LaPara, T.M., Konopka, A., Nakatsu, C., Alleman, J.E., 2001. Thermophilic aerobictreatment of a synthetic wastewater in a membrane-coupled bioreactor. Journalof Industrial Microbiology & Biotechnology 26 (4), 203–209.
Layton, A.C., Dionisi, H., Kuo, H.W., Robinson, K.G., Garrett, V.M., Meyers, A., Sayler,G.S., 2005. Emergence of competitive dominant ammonia-oxidizing bacterialpopulations in a full-scale industrial wastewater treatment plant. Applied andEnvironmental Microbiology 71 (2), 1105–1108.
Lazarova, V., Manem, J., 1995. Biofilm characterization and activity analysis in waterand wastewater treatment. Water Research 29 (10), 2227–2245.
Lim, J., Lee, S., Hwang, S., 2008a. Use of quantitative real-time PCR to monitorpopulation dynamics of ammonia-oxidizing bacteria in batch process. Journal ofIndustrial Microbiology and Biotechnology 35, 1339–1344.
Lim, J., Do, H., Shin, S.G., Hwang, S., 2008b. Primer and probe sets for group-specificquantification of the genera Nitrosomonas and Nitrosospira using real-timePCR. Biotechnology and Bioengineering 99 (6), 1374–1383.
Linares, K.H.M., Grandstaff, E., Walker, H., Bailey, E., M’Coy, W., 2008.Troubleshooting plant performance upsets at the Hopewell RegionalWastewater Treatment Facility. Water Practice 2 (4), 1–18.
Livak, K.J., Schmittgen, T.D., 2001. Analysis of relative gene expression data usingreal-time quantitative PCR and the 2-[Delta][Delta]CT Method. Methods 25 (4),402–408.
Odegaard, H., Rusten, B., Westrum, T., 1994. A new moving-bed biofilm reactor-applications and results. Water Science and Technology 29 (10), 157–165.
Pfaffl, M.W., 2001. A new mathematical model for relative quantification in real-time RT-PCR. Nucleic Acids Research 29 (9), 6.
Rusten, B., Hem, L.J., Odegaard, H., 1995. Nitrification of municipal waste-water inmoving-bed biofilm reactors. Water Environment Research 67 (1), 75–86.
van den Akker, B., Beard, H., Kaeding, U., Giglio, S., Short, M.D., 2010. Exploring therelationship between viscous bulking and ammonia-oxidiser abundance inactivated sludge: A comparison of conventional and IFAS systems. WaterResearch 44 (9), 2919–2929.
Yang, S., Yang, F.L., Fu, Z.M., Lei, R.B., 2009. Comparison between a moving bedmembrane bioreactor and a conventional membrane bioreactor on organiccarbon and nitrogen removal. Bioresource Technology 100 (8), 2369–2374.
Zhang, L.Q., Wei, C.H., Zhang, K.F., Zhang, C.S., Fang, Q., Li, S.G., 2009. Effects oftemperature on simultaneous nitrification and denitrification via nitrite in asequencing batch biofilm reactor. Bioprocess and Biosystems Engineering 32(2), 175–182.