appendix: methods and tools - santa clara county, california · appendix: methods and tools ......
TRANSCRIPT
1
Appendix: Methods and Tools
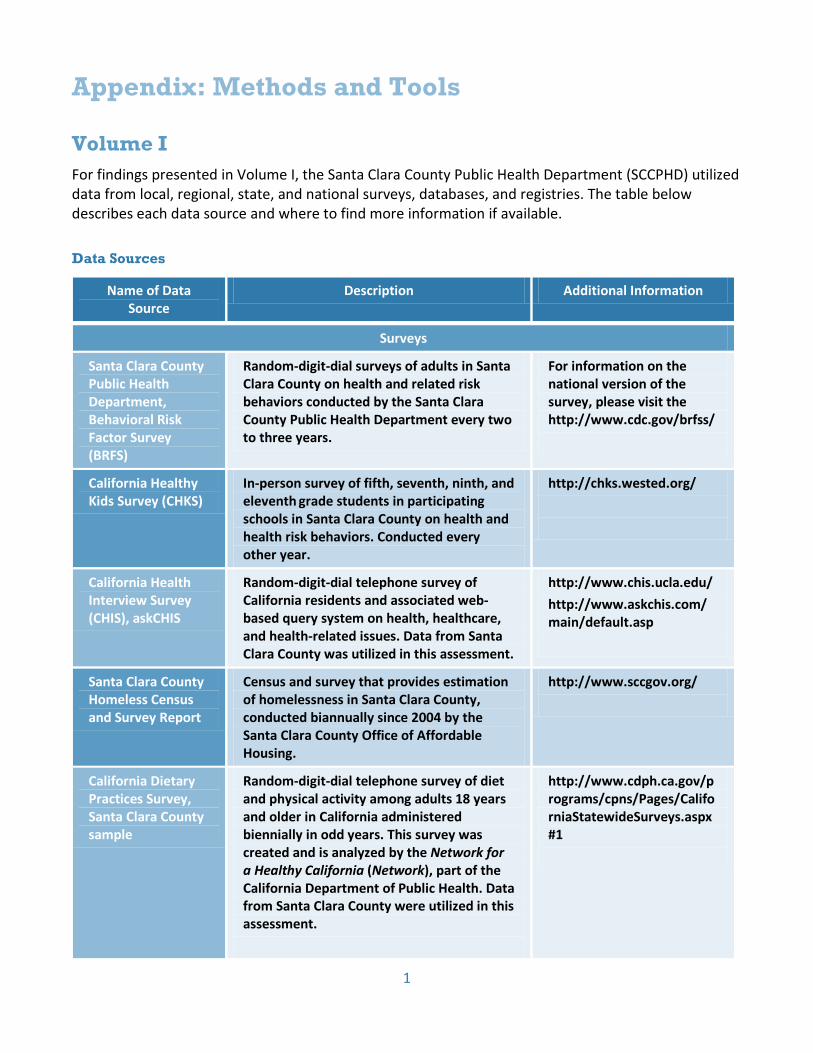
Volume I For findings presented in Volume I, the Santa Clara County Public Health Department (SCCPHD) utilized data from local, regional, state, and national surveys, databases, and registries. The table below describes each data source and where to find more information if available.
Data Sources
Name of Data Source
Description Additional Information
Surveys
Santa Clara County Public Health Department, Behavioral Risk Factor Survey (BRFS)
Random-digit-dial surveys of adults in Santa Clara County on health and related risk behaviors conducted by the Santa Clara County Public Health Department every two to three years.
For information on the national version of the survey, please visit the http://www.cdc.gov/brfss/
California Healthy Kids Survey (CHKS)
In-person survey of fifth, seventh, ninth, and eleventh grade students in participating schools in Santa Clara County on health and health risk behaviors. Conducted every other year.
http://chks.wested.org/
California Health Interview Survey (CHIS), askCHIS
Random-digit-dial telephone survey of California residents and associated web-based query system on health, healthcare, and health-related issues. Data from Santa Clara County was utilized in this assessment.
http://www.chis.ucla.edu/
http://www.askchis.com/main/default.asp
Santa Clara County Homeless Census and Survey Report
Census and survey that provides estimation of homelessness in Santa Clara County, conducted biannually since 2004 by the Santa Clara County Office of Affordable Housing.
http://www.sccgov.org/
California Dietary Practices Survey, Santa Clara County sample
Random-digit-dial telephone survey of diet and physical activity among adults 18 years and older in California administered biennially in odd years. This survey was created and is analyzed by the Network for a Healthy California (Network), part of the California Department of Public Health. Data from Santa Clara County were utilized in this assessment.
http://www.cdph.ca.gov/programs/cpns/Pages/CaliforniaStatewideSurveys.aspx#1

2
Name of Data Source
Description Additional Information
Demographics
U.S. Census Bureau, U.S. Census
Demographic information on every household in the U.S. Conducted every 10 years.
http://www.census.gov/
U.S. Census Bureau, American Community Survey 1-Year and 3-Year Estimates and Public Use Microsample
Social and demographic information collected from approximately three million addresses in the U.S. each year.
http://www.census.gov/acs/
Vital Statistics
California Department of Heath, Vital Statistics
Records of all births and deaths in Santa Clara County.
http://www.apps.cdph.ca.gov/vsq/default.asp
Health Surveillance Systems
Greater Bay Area Cancer Registry (GBACR)
The Greater Bay Area Cancer Registry gathers information on all cancers diagnosed and treated in a nine-county area (Alameda, Contra Costa, Marin, Monterey, San Benito, San Francisco, San Mateo, Santa Clara, and Santa Cruz counties). Data from Santa Clara County were utilized in this assessment.
http://www.cpic.org/site/c.skI0L6MKJpE/b.5730971/k.47A8/Greater_Bay_Area_Cancer_Registry.htm
Automated Vital Statistics System and California Reportable Disease Information Exchange system (CalREDDIE)
Statewide surveillance systems that tracks reportable diseases using data from participating county healthcare providers and laboratories.
For statewide counts and rates on sexually transmitted diseases, tuberculosis, and HIV/AIDS, see http://www.cdph.ca.gov/data/statistics/Pages/default.aspx
California Department of Public Health, Immunization Branch, Kindergarten Retrospective Survey
The Kindergarten Retrospective Survey provides estimates of immunization coverage among kindergarten students at various age checkpoints, based on a sample of California’s kindergartens in concurrence with selective review. Conducted by local health departments.
http://www.cdph.ca.gov/programs/immunize/Pages/ImmunizationLevels.aspx
3
Name of Data Source
Description Additional Information
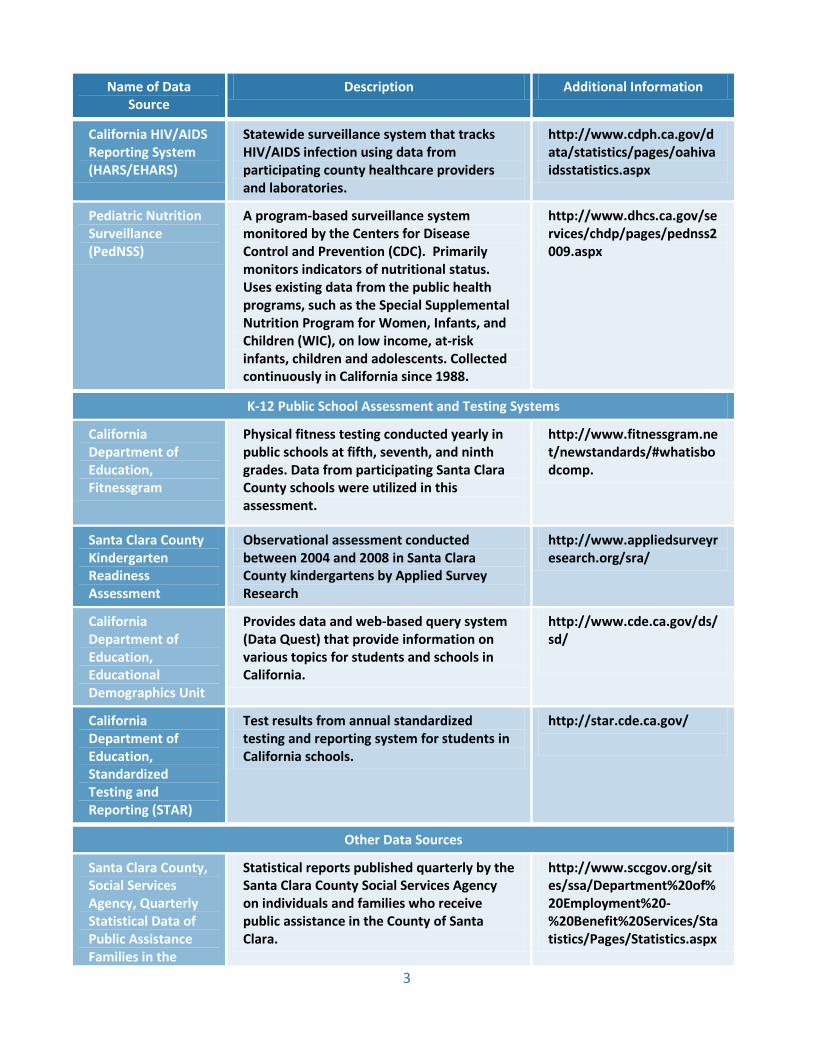
California HIV/AIDS Reporting System (HARS/EHARS)
Statewide surveillance system that tracks HIV/AIDS infection using data from participating county healthcare providers and laboratories.
http://www.cdph.ca.gov/data/statistics/pages/oahivaidsstatistics.aspx
Pediatric Nutrition Surveillance (PedNSS)
A program-based surveillance system monitored by the Centers for Disease Control and Prevention (CDC). Primarily monitors indicators of nutritional status. Uses existing data from the public health programs, such as the Special Supplemental Nutrition Program for Women, Infants, and Children (WIC), on low income, at-risk infants, children and adolescents. Collected continuously in California since 1988.
http://www.dhcs.ca.gov/services/chdp/pages/pednss2009.aspx
K-12 Public School Assessment and Testing Systems
California Department of Education, Fitnessgram
Physical fitness testing conducted yearly in public schools at fifth, seventh, and ninth grades. Data from participating Santa Clara County schools were utilized in this assessment.
http://www.fitnessgram.net/newstandards/#whatisbodcomp.
Santa Clara County Kindergarten Readiness Assessment
Observational assessment conducted between 2004 and 2008 in Santa Clara County kindergartens by Applied Survey Research
http://www.appliedsurveyresearch.org/sra/
California Department of Education, Educational Demographics Unit
Provides data and web-based query system (Data Quest) that provide information on various topics for students and schools in California.
http://www.cde.ca.gov/ds/sd/
California Department of Education, Standardized Testing and Reporting (STAR)
Test results from annual standardized testing and reporting system for students in California schools.
http://star.cde.ca.gov/
Other Data Sources
Santa Clara County, Social Services Agency, Quarterly Statistical Data of Public Assistance Families in the
Statistical reports published quarterly by the Santa Clara County Social Services Agency on individuals and families who receive public assistance in the County of Santa Clara.
http://www.sccgov.org/sites/ssa/Department%20of%20Employment%20-%20Benefit%20Services/Statistics/Pages/Statistics.aspx
4
Name of Data Source
Description Additional Information
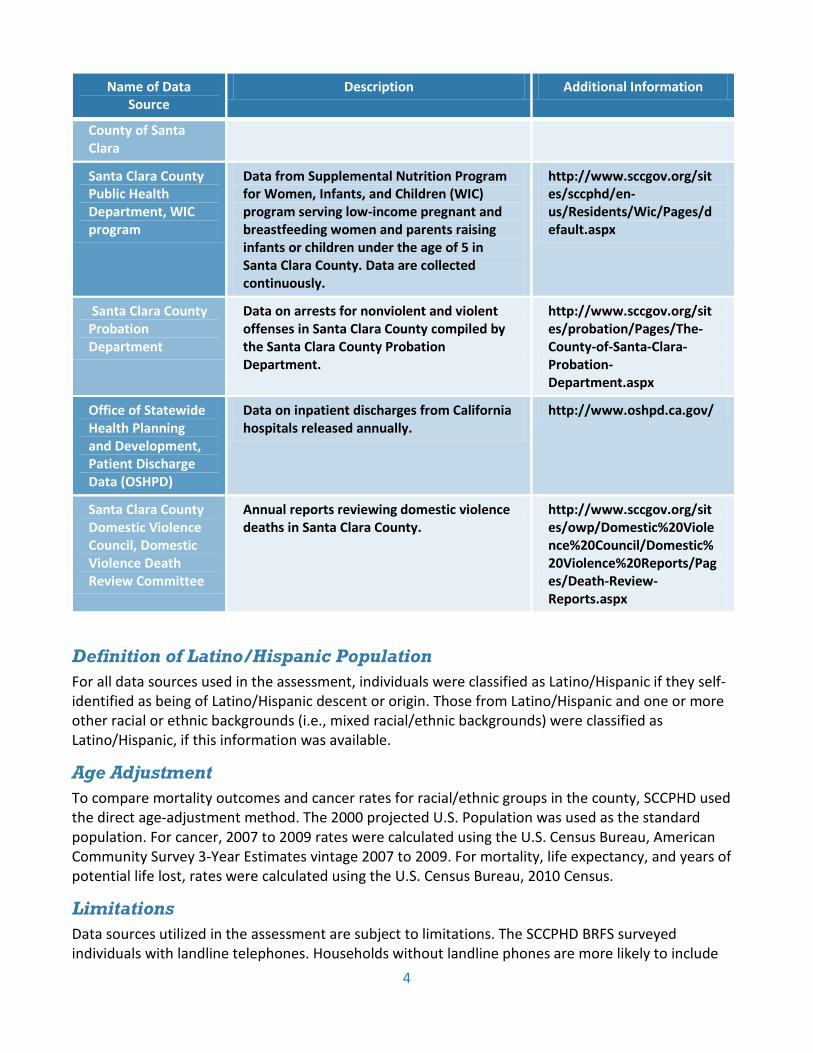
County of Santa Clara
Santa Clara County Public Health Department, WIC program
Data from Supplemental Nutrition Program for Women, Infants, and Children (WIC) program serving low-income pregnant and breastfeeding women and parents raising infants or children under the age of 5 in Santa Clara County. Data are collected continuously.
http://www.sccgov.org/sites/sccphd/en-us/Residents/Wic/Pages/default.aspx
Santa Clara County Probation Department
Data on arrests for nonviolent and violent offenses in Santa Clara County compiled by the Santa Clara County Probation Department.
http://www.sccgov.org/sites/probation/Pages/The-County-of-Santa-Clara-Probation-Department.aspx
Office of Statewide Health Planning and Development, Patient Discharge Data (OSHPD)
Data on inpatient discharges from California hospitals released annually.
http://www.oshpd.ca.gov/
Santa Clara County Domestic Violence Council, Domestic Violence Death Review Committee
Annual reports reviewing domestic violence deaths in Santa Clara County.
http://www.sccgov.org/sites/owp/Domestic%20Violence%20Council/Domestic%20Violence%20Reports/Pages/Death-Review-Reports.aspx
Definition of Latino/Hispanic Population For all data sources used in the assessment, individuals were classified as Latino/Hispanic if they self-identified as being of Latino/Hispanic descent or origin. Those from Latino/Hispanic and one or more other racial or ethnic backgrounds (i.e., mixed racial/ethnic backgrounds) were classified as Latino/Hispanic, if this information was available.
Age Adjustment To compare mortality outcomes and cancer rates for racial/ethnic groups in the county, SCCPHD used the direct age-adjustment method. The 2000 projected U.S. Population was used as the standard population. For cancer, 2007 to 2009 rates were calculated using the U.S. Census Bureau, American Community Survey 3-Year Estimates vintage 2007 to 2009. For mortality, life expectancy, and years of potential life lost, rates were calculated using the U.S. Census Bureau, 2010 Census.
Limitations Data sources utilized in the assessment are subject to limitations. The SCCPHD BRFS surveyed individuals with landline telephones. Households without landline phones are more likely to include

5
low-income and younger individuals as well as males. (1) The number of people who live in cell phone-only households has increased dramatically over the past several years. (1) Homeless individuals without landlines and residents who were too ill to speak on the phone or take the survey could not be interviewed, leading to a potential bias toward healthier individuals. Other telephone survey data used in this report were potentially subject to similar biases. All information on health and social indicators on surveys utilized in the assessment was self-reported and is subject to reporting bias. Public health surveillance data (births, deaths, and infectious disease) utilized in the assessment were subject to both misclassification and reporting bias; however, this bias is expected to be minimal. Data on adolescents from the California Health Kids Survey (CHKS) were subject to selection bias. Only public schools participate in the CHKS and participation is subject to both school and parent consent.
Volumes 1 and 2: Geographic Analysis This section describes the methods used for geographic analysis in Volumes I and II.
Areas in the County Included in the Analysis Santa Clara County is a large, geographically diverse county. Most of the county’s residents live in urban/suburban environments, but a majority of the land area in the county is unpopulated. Because the focus of the geographic assessment is on residents and their neighborhoods, as well as the environment surrounding these neighborhoods, areas with no population were excluded from analysis and, generally, from the maps and graphs presented in the report. The definition of urban/suburban used in the analysis followed guidelines provided by the U.S. Census Bureau for the 2010 Census. Any tract bigger than three square miles, or with a population density less than 500 persons per square mile, was excluded from analysis. Based on this definition, many maps have the legend item, “No Population and/or Rural,” to indicate these excluded areas.
Definition of Neighborhoods In order to present information on the smallest possible areas of the county, we used census blocks as defined by the U.S. Census Bureau, 2010 Census, where possible to represent neighborhoods. A census block is a land area surrounded on all sides by streets. In a residential environment, the homes on one’s own street block would fit the definition of a census block. In order to measure distances from a census block to other features, such as parks, crime occurrences or shopping centers, we calculated the “block centroid.” The centroid of the block is the geographical center of the block which is computed mathematically from the locations of all the vertices defining the boundary of the block. The block centroid is the primary point that we used for measuring distances to places around neighborhoods for the maps and graphs. In the descriptions below, we refer to the block centroid as the “block center.” Some maps present indicators or measures related to percentages or densities. A density is defined as how much of one item there is in relation to another. A common density would be population per square mile, or Latinos/Hispanics as a percentage of total population. Generally, we used census tracts
6
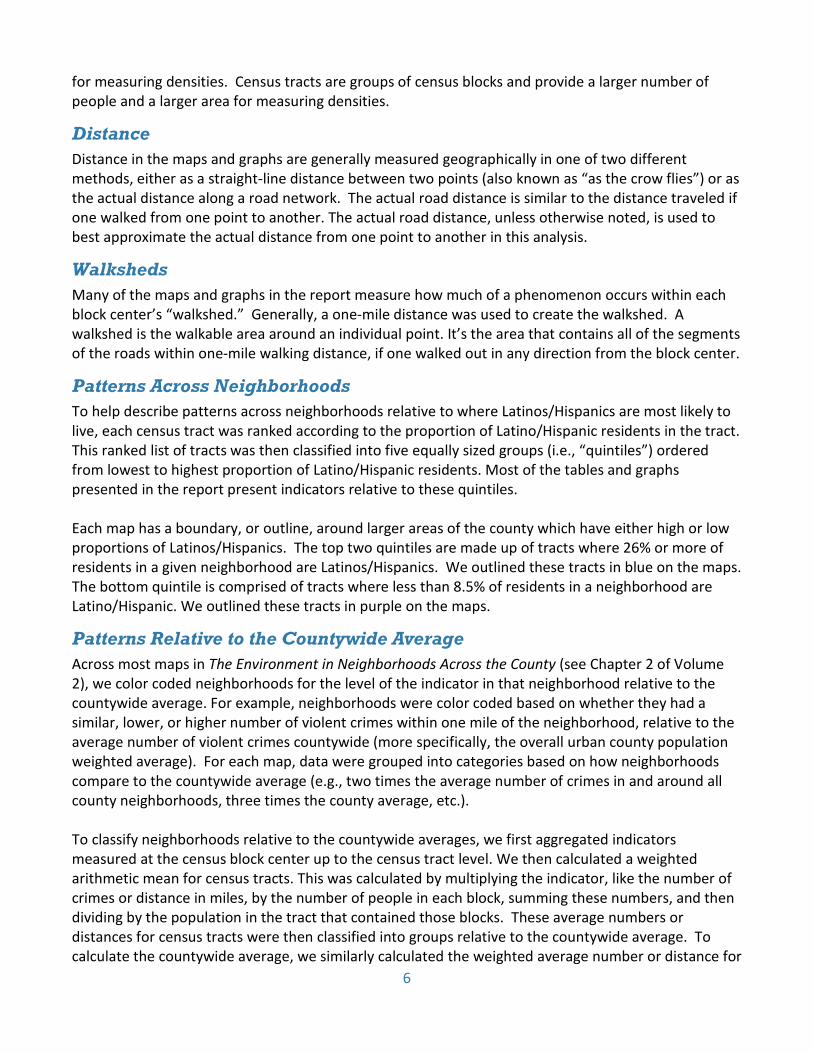
for measuring densities. Census tracts are groups of census blocks and provide a larger number of people and a larger area for measuring densities.
Distance Distance in the maps and graphs are generally measured geographically in one of two different methods, either as a straight-line distance between two points (also known as “as the crow flies”) or as the actual distance along a road network. The actual road distance is similar to the distance traveled if one walked from one point to another. The actual road distance, unless otherwise noted, is used to best approximate the actual distance from one point to another in this analysis.
Walksheds Many of the maps and graphs in the report measure how much of a phenomenon occurs within each block center’s “walkshed.” Generally, a one-mile distance was used to create the walkshed. A walkshed is the walkable area around an individual point. It’s the area that contains all of the segments of the roads within one-mile walking distance, if one walked out in any direction from the block center.
Patterns Across Neighborhoods To help describe patterns across neighborhoods relative to where Latinos/Hispanics are most likely to live, each census tract was ranked according to the proportion of Latino/Hispanic residents in the tract. This ranked list of tracts was then classified into five equally sized groups (i.e., “quintiles”) ordered from lowest to highest proportion of Latino/Hispanic residents. Most of the tables and graphs presented in the report present indicators relative to these quintiles. Each map has a boundary, or outline, around larger areas of the county which have either high or low proportions of Latinos/Hispanics. The top two quintiles are made up of tracts where 26% or more of residents in a given neighborhood are Latinos/Hispanics. We outlined these tracts in blue on the maps. The bottom quintile is comprised of tracts where less than 8.5% of residents in a neighborhood are Latino/Hispanic. We outlined these tracts in purple on the maps.
Patterns Relative to the Countywide Average Across most maps in The Environment in Neighborhoods Across the County (see Chapter 2 of Volume 2), we color coded neighborhoods for the level of the indicator in that neighborhood relative to the countywide average. For example, neighborhoods were color coded based on whether they had a similar, lower, or higher number of violent crimes within one mile of the neighborhood, relative to the average number of violent crimes countywide (more specifically, the overall urban county population weighted average). For each map, data were grouped into categories based on how neighborhoods compare to the countywide average (e.g., two times the average number of crimes in and around all county neighborhoods, three times the county average, etc.). To classify neighborhoods relative to the countywide averages, we first aggregated indicators measured at the census block center up to the census tract level. We then calculated a weighted arithmetic mean for census tracts. This was calculated by multiplying the indicator, like the number of crimes or distance in miles, by the number of people in each block, summing these numbers, and then dividing by the population in the tract that contained those blocks. These average numbers or distances for census tracts were then classified into groups relative to the countywide average. To calculate the countywide average, we similarly calculated the weighted average number or distance for
7
all census tracts in the county using the population in each tract. This procedure was used for the countywide averages for each map and for the graphs. Most of the graphs present data aggregated into quintiles (described above). We used a procedure similar to that for countywide averages: We multiplied the census tract average (such as the average number of crimes in the census tract) by the population in the tract, summed these numbers, and then divided by the total population of the census tracts in a quintile.
Data Sources, Indicators, and Geographic Units of Analysis for Maps and Graphs This section describes the data source used for each indicator in the maps, how we defined the indicators themselves, and what geographic unit (i.e., census blocks and/or tracts) were used to map or graph each indicator. Abbreviated versions of these descriptions can be found in the corresponding section of Volumes 1 and 2.
Percentage of Latinos/Hispanics in Census Tract
Data Source Data for the map on the percentage of Latinos/Hispanics in census tracts came from the U.S. Census Bureau, 2010 Census. Indicator and Geographic Unit The map presents the percentage of persons in each urban census tract classified by the 2010 Census as Hispanic, relative to the total population of the census tract. We then ranked each individual census tract according to the percentage of Hispanic residents in the tract. This ranked list was then classified into 5 equal groups (i.e., quintiles) and mapped. The map legend presents the percentages of Latinos/Hispanics in the census tracts included in each quintile.
Percentage Change in Latino/Hispanic Census Tract Population, 2000-2010
Data Source Data for the map on the percentage change in the Latino/Hispanic census tract population from 2000 to 2010 came from the U.S. Census Bureau, 2010 Census. Indicator and Geographic Unit The map presents the percentage change in the residents in each urban census tract classified by the 2000 Census and the 2010 Census as Hispanic. To calculate the percentage change, we subtracted the number of Latinos/Hispanics in a census tract in 2000 from the number in 2010, and then divided by the number of Latinos in 2000. We excluded those census tracts with a relatively small Latino/Hispanic population in both 2000 (225 or fewer) and 2010 (265) from the map. There were some changes in census tracts over time. We used tables published by the U.S. Census Bureau to compare the populations across the two census periods. Further information can be obtained from http://www.census.gov/geo/www/2010census/tract_rel/tract_rel.html.
Neighborhood Walk Score
Data Source
8
The data source for the extent to which a neighborhood supports walking for leisure and errands (sometimes called “walkability”) was StreetSmart© Walk Score.® StreetSmart Walk Score was developed by Walkscore.com. A location’s StreetSmart Walk Score is a standardized, internationally-recognized process of systematically assessing the walkability of a given location. The Street Smart Walk Score algorithm is based on walking distances from an address to a diverse set of nearby amenities. For more information on the methods and availability of Walk Score, see http://www.walkscore.com/professional/research.php. Indicator and Geographic Unit Walk Score values can range from 0 to 100. Each neighborhood has an overall Walk Score and Walk Scores for specific amenities, like banks, bookstores, coffee shops, entertainment, grocery stores, restaurants and bars, schools, and shopping. We obtained Walk Score values for block centers of each census block with population in the county. We classified neighborhoods into groups based on their overall scores (e.g., neighborhoods were assigned to the classification “Walker’s Paradise” if they had an overall Walk Score of 91-99 points. Classifications were based on thresholds and descriptions published by Walkscore.com (see http://www.walkscore.com/live-more/).
Neighborhood Access to Supermarkets or Large Grocery Stores
Data Source Data on food retailers in Santa Clara County came from InfoUSA, a private market research company which maintains a comprehensive database on all businesses. We acquired the data on March 16, 2012. Indicator and Geographic Unit We use walking distance to the nearest supermarket or large grocery store as an indicator of neighborhood access to fresh fruits and vegetables. Supermarkets were defined as food retailers with 50 employees or more. Large grocery stores were defined as food retailers with 10 to 49 employees. We calculated the distance in miles from the block center to the closest supermarket or large grocery store for each urban census block with population in the county. Neighborhoods were then classified into groups, and mapped relative to the countywide average or graphed by Latino/Hispanic quintile, as described above.
Neighborhood Modified Retail Food Environment Index (mRFEI)
Data Source As a second measure of neighborhood access to healthy foods, we calculated an index for each neighborhood based on a measure created by the Centers for Disease Control and Prevention (CDC) called Modified Retail Food Environment Index (mRFEI). Data for the index came from InfoUSA (described above). Data on certified farmers’ markets, which was included in the index, was provided by the Santa Clara County Division of Agriculture. Indicator and Geographic Unit The modified Retail Food Environment Index (mRFEI) is the percentage of food retailers that are considered healthy within each neighborhood, out of the total number of health and unhealthy food retailers:

9
𝑷𝒆𝒓𝒄𝒆𝒏𝒕 𝒐𝒇 𝑯𝒆𝒂𝒍𝒕𝒉 𝑭𝒐𝒐𝒅 𝑹𝒆𝒕𝒂𝒊𝒍𝒆𝒓𝒔
= 𝟏𝟎𝟎 𝒙 # 𝒐𝒇 𝑯𝒆𝒂𝒍𝒕𝒉𝒚 𝑭𝒐𝒐𝒅 𝑹𝒆𝒕𝒂𝒊𝒍𝒆𝒓𝒔
# 𝒐𝒇 𝑯𝒆𝒂𝒍𝒕𝒉𝒚 𝑭𝒐𝒐𝒅 𝑹𝒆𝒕𝒂𝒊𝒍𝒆𝒓𝒔 + # 𝒐𝒇 𝑳𝒆𝒔𝒔 𝑯𝒆𝒂𝒍𝒕𝒉𝒚 𝑭𝒐𝒐𝒅 𝑹𝒆𝒕𝒂𝒊𝒍𝒆𝒓𝒔
For more detail on this indicator, see CDC’s mRFEI methodology. (2) Healthy food retailers included supermarkets or large grocery stores (see definition above), warehouse clubs, and produce stores. Unhealthy food retailers included fast food restaurants, small grocery stores (three or fewer employees), and convenience stores (as defined by North American Industrial Classification System (NAICS) codes). Full service restaurants with five or more locations in Santa Clara County were also classified as unhealthy. The complete set of food retailers within census tracts or one half mile from the tract boundary were classified as healthy or unhealthy based on CDC’s definition. We then created counts of healthy stores and total stores for each census tract. We revised CDC’s methodology by adding farmer’s markets to the list of food retailers. Farmer’s markets were added to both of these store counts. Using CDC’s formula above, we then calculated the percent of healthy food retailers. Neighborhoods were classified into groups (see map legend for groups) and graphed by Latino/Hispanic quintile, as described above.
Community Gardens and Certified Farmers’ Markets
Data Source Data on certified farmers’ markets in Santa Clara County came from the Santa Clara County Division of Agriculture. Data on whether or not farmers’ markets accept electronic benefit transfer (EBT) came from the Santa Clara Social Services Administration. Brian Fulfrost & Associates provided a list of community gardens in Santa Clara County as of 2009. Indicator We mapped the location of each certified farmers’ markets and community garden in the county. Farmers’ markets that accept EBT were distinguished from those that do not accept EBT.
Pedestrian and Bicycle Collisions
Data Source Data on pedestrian and bicycle collisions came from the Safe Transportation Research and Education Center (SafeTREC) at U.C. Berkeley which provides access to California Statewide Integrated Traffic Records System (SWITRS), a database of data gathered by the police from a collision scene with an automobile. We pooled five years of data (2006-2010) for Santa Clara County for pedestrian and bicycle collisions. Further information can be found at: http://tims.berkeley.edu/index.php Indicator and Geographic Unit We calculated the number of bicycle and pedestrian collisions that occurred within each block center’s one mile walk shed (see description above). These counts were then mapped relative to the countywide average or graphed by Latino/Hispanic quintile, as described above.

10
Distance to Nearest Park or Accessible Open Space
Data Source Data on parks and accessible open space comes from the California Protected Areas Database (CPAD) and Santa Clara County Parks Department. We excluded from the analysis parks that have restricted access or are inaccessible. We also excluded special purpose open space areas such as golf courses and future unimproved park lands. Further information pertaining to CPAD may be found at: http://www.calands.org/. Indicator and Geographic Unit Parks and accessible open spaces by their nature are large areas with multiple access points. These access points were not available for this analysis. Consequently, we measured the distance from each block center to the nearest boundary of the park or accessible open space based on the straight-line distance method (described above). Distances were measured in miles. These distances were then mapped relative to the countywide average for all neighborhoods, or graphed by Latino/Hispanic quintile, as described above.
Violent Crimes in and around Neighborhoods
Data Source The data for violence in and around neighborhoods comes from Public Engines, Inc., also known as CrimeReports.com. CrimeReports.com provides a standardized crime reporting system which reports crime for 15 crime types based on uniform crime reporting (UCR) definitions. All crime locations are provided at the block level by CrimeReports to protect victim and suspect identity. We used data for the 12-month time period from August 1, 2010 to July 31, 2011. Incidents which were coded as robbery, homicide, sexual assault and assault with a deadly weapon were defined as violent crimes, according to the definition of violent crime provided by the FBI’s Uniform Crime Reporting (UCR) Program. Incidents that had a reporting location in the same block as a major hospital or police station, or which had a duplicate incident identifier were excluded from the analysis. However, their inclusion did not substantively change results. Further information can be found at: https://www.crimereports.com/. Indicator and Geographic Unit We calculated the number of violent crimes that occurred within each block center’s one mile walk shed (described above). These counts were then mapped relative to the countywide average for all neighborhoods or graphed by Latino/Hispanic quintile, as described above.
Violent Crime near Parks, Accessible Open Space, and Schools
Data Source Data on parks and accessible open space came from the source described above under Distance to Nearest Park or Accessible Open Space. Data on schools came from the County of Santa Clara. Indicator and Geographic Unit As described above, parks and accessible open spaces have multiple access points. These access points were not available for this analysis. Schools have similar characteristics. Consequently, distance was measured on the straight-line distance method and a 500-feet buffer or zone, was created outward from the perimeter of parks and schools. All violent crimes, as described above, that fell within each
11
buffer were counted and assigned to the school, park or accessible open space. The countywide average used to classify neighborhoods into groups for the map was created through calculating a simple average of all the scores in the county. We also calculated a simple average for each of the quintiles presented in the graph.
Volume II: Environmental Assessment in Eight Neighborhoods This section provides an overview of methods used for data presented in Volume II, based on environmental scans of eight neighborhoods in Santa Clara County. We used a mixed-method (quantitative and qualitative) approach to collect data for a comprehensive assessment of the food, physical activity, and safety environments in eight neighborhoods in Santa Clara County. Selection criteria included having a high percentage of Hispanic residents and at least one elementary school. Selected neighborhoods, with a few exceptions, also had at least 10,000 residents. We also included at least one neighborhood in each of the five supervisorial districts in Santa Clara County. We defined the neighborhood boundaries in consultation with neighborhood associations, city planning departments, and neighborhood service providers, and in some cases used pre-existing boundaries defined by city initiatives, such as San Jose’s Strong Neighborhoods Initiative. We used several tools for environmental assessment, including:
• Retail food store surveys • Surveys of food banks/emergency food outlets • Surveys of K-12 public schools • Outdoor marketing surveys near schools and parks • Surveys of childcare centers • Assessment of mobile vending/food truck surveys near schools and parks • Street surveys
Tools were selected based on validity, ease of use, inter-rater reliability, and relevance of items and categories to the goals of the Latino Health Assessment. Surveyors entered data for food retail outlets, outdoor marketing of foods, and street surveys using the iFormBuilder (Herndon, VA) application on iPads. This method allowed surveyors to instantly upload surveys as well as take photos in real time that could be used to verify the data being collected. We also conducted focus groups with neighborhood residents in the selected neighborhoods. Details on each assessment are provided below. Data were collected by Resource Development Associates, a research firm (Oakland, CA) contracted by the Santa Clara County Public Health Department (SCCPHD). SCCPHD and county staff assisted with store, street, outdoor marketing, and mobile vending scans.
Environmental Scans We used the CX3 (Communities of Excellence in Nutrition, Physical Activity, and Obesity Prevention) tool developed by the California Department of Public Health to collect neighborhood-level data in the eight neighborhoods selected for assessment. We selected this tool because it is designed to measure the quality, availability, and affordability of food in low-income communities. (3) We used surveys
12
designed to assess retail food stores, outdoor marketing environments, emergency food outlets, and mobile vendors around schools. To learn more about the CX3 or any of the specific surveys we used, please visit the CX3 website at http://www.cdph.ca.gov/programs/cpns/Pages/CX3_Main_Navgation.aspx. The original versions of the CX3 tools, as well as other tools, used for this assessment can be found at the end of this chapter. Modifications made to these tools for this assessment are noted on these surveys.
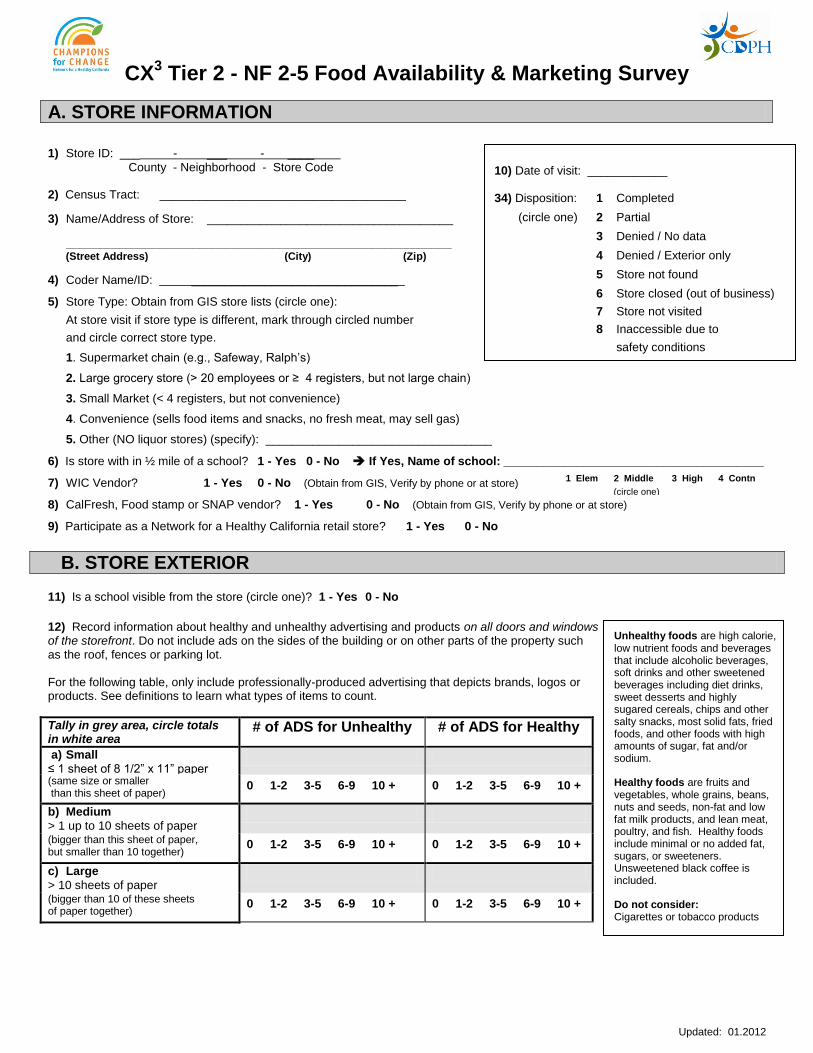
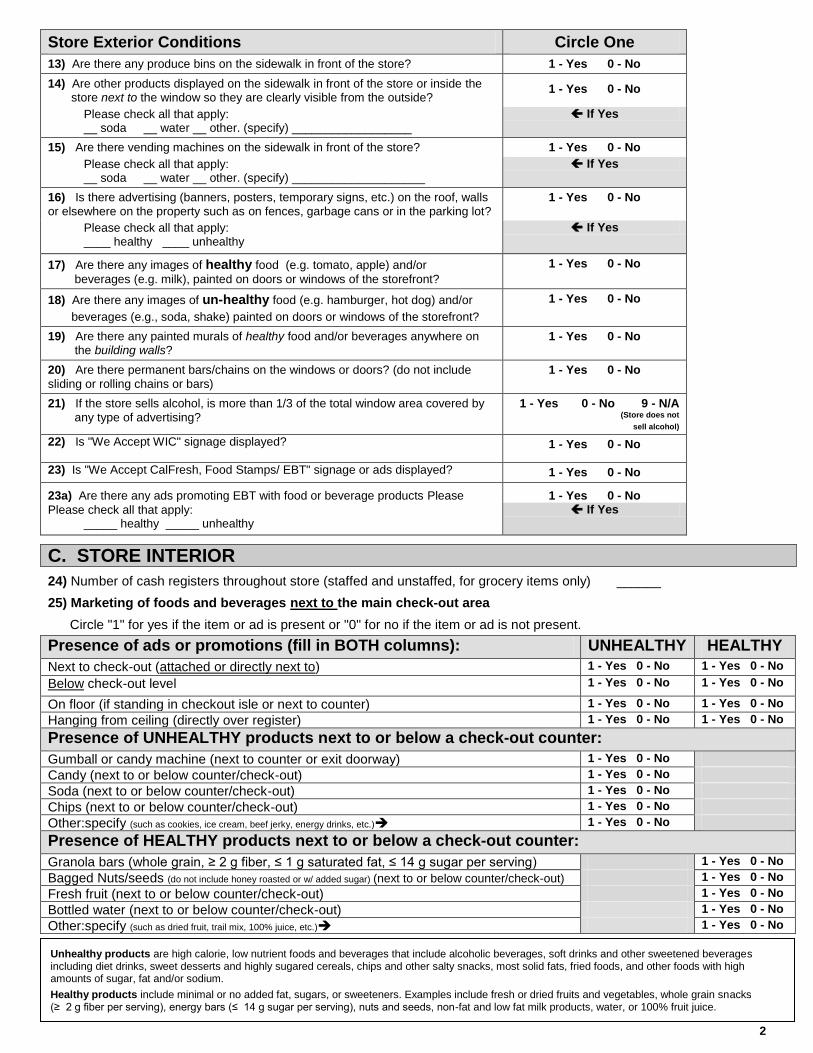
Store Surveys We conducted surveys of retail food stores to measure access to affordable and high-quality healthy foods, the types of foods that are promoted in high-traffic areas of stores, and marketing messages (healthy and unhealthy) for foods and beverages at stores. We used the CX3 Food Availability and Marketing survey for in-store assessments. The CX3 Food Availability and Marketing survey is a 34-question survey administered on site in each store and was specifically designed to evaluate access to healthy foods in low-income neighborhoods. (4) The survey includes the following categories:
• Marketing (advertising inside and outside stores) • Produce (the availability and quality of produce) • Other Healthy Products (availability of healthy products other than produce) • Safety and Food Programs (safety and food program access)
We modified the survey to include six additional produce items (mango, avocado, cactus paddles (nopales), zucchini, cucumber, corn on the cob) and four additional healthy non-produce foods (reduced-fat Monterey Jack cheese, other reduced-fat Mexican cheese, fish, other seafood) because of their cultural significance to the Latino/Hispanic population. The CX3 survey protocol recommends surveying at least 15 stores per neighborhood. (4) We assessed up to 25 stores in each neighborhood, including:
• Supermarket chains • Large (non-chain) grocery stores (≥ 4 registers) • Small markets (< 4 registers, not convenience store) • Convenience stores (sells food items and snacks) • Other stores that sell food, including 99-cent stores and pharmacies
Surveyors, working in pairs, conducted scans of all retail food stores within a half-mile radius of the neighborhood, as well as convenience stores within a half-mile radius of a middle or high school. We identified applicable food retailers through a list purchased from InfoUSA, , a private market research company which maintains a comprehensive database on all businesses, and mapped retailers in the eight neighborhoods using ArcGIS mapping software (Esri, Redlands, CA) as well as on-site observation and investigation. In total, between 11 and 20 stores were surveyed in each neighborhood for an overall total of 122 stores surveyed. Each survey took between ten and forty minutes to conduct, depending on the size of the store. All data were collected from May 28-June 26, 2012.

13
Number and Type of Stores Surveyed by Neighborhood
Supermarket chain/Large
Grocery Store
Small market
Convenience store
Other Total number of
stores surveyed
Burbank/Buena Vista 3 5 8 3 19
Mayfair/Suenos 2 2 9 0 13
Rengstorff 2 2 5 3 12
Seven Trees/Los Arboles/Serenade
4 2 5 1 12
Snail/Lowlanders 2 1 8 0 11
South Central Gilroy 5 4 4 6 19
Tropicana/Dorsa/Miller 2 2 8 4 16
Washington/Guadalupe 2 0 14 2 18
Across Neighborhoods 22 18 61 19 120
Source: Santa Clara County Public Health Department, Status of Latino/Hispanic Health 2012, CX3 Food Availability and Marketing Survey
Emergency Food Outlet/Food Bank Surveys To evaluate access to healthy foods for community members that receive food assistance, we used the CX3 Emergency Food Outlet and Food Bank surveys. (5) Both surveys collect information in the following areas:
• Food Outlet Information (basic demographic information) • Foods Provided (how often are healthy and unhealthy foods provided or distributed) • Healthy Food Promotion (in what ways, if any, does the outlet/bank promote healthy eating
habits) We used ArcGIS software to identify food banks and emergency food outlets that serve the selected neighborhoods. After repeated efforts to contact individual emergency food outlets via phone or in person, we contacted the Second Harvest Food bank and conducted a phone interview to collect data on the food bank and the practices of the emergency outlets the food bank supplies. Second Harvest Food Bank completed the survey for all of the emergency food outlets it supplies. In total, we obtained data for 53 emergency food outlets and one food bank.
Outdoor Marketing Surveys We used the CX3 Food and Physical Activity Outdoor Marketing Survey to collect data on the visual cues school-aged children and their families receive from advertising about healthy and unhealthy foods and activities. (6) Surveyors, working in pairs, collected data on all advertisements relating to food and physical activity within a 1,000 foot radius of 20 schools and 4 parks located within the neighborhood boundaries. These advertisements included billboards, transit ads, sandwich boards, electronic billboards, and mobile billboards. All data were collected from June 1-27, 2012. The survey documented the following information on each advertisement:

14
• Location • Whether a school or park is visible from the advertisement • Type and size of the advertisement • Content (what product/activity is being advertised)
School Surveys We used the School Environment Data Collection Forms developed by the Trans-disciplinary Research on Energetics and Cancer Centers (TREC) to collect data on food environments in public schools for school-aged children residing in the eight neighborhoods. (7) These forms assess the types of foods that are available for student purchase as a la carte items and advertised on school grounds, as well as practices and policies regarding nutrition standards for foods served outside of the school lunch program in schools. (8) We developed a comprehensive online survey and interview guide using the TREC Vending Machine Inventory Form/Middle School A la Carte Observation Form, the High School A la Carte Observation Form/School Store Form, as well as questions compiled from the Cook Manager Survey and Principal Survey. These surveys included items in the following categories:
• Foods and beverages available for a la carte purchase in school cafeterias and school stores • Foods and beverages available for purchase in vending machines on school grounds • Advertisements of foods and beverages on school grounds • School policies on food (including policies on bringing in food from home, eating in classrooms,
foods sold for fundraising, foods served at sporting events, and foods offered as rewards/incentives for students)
We identified K-12 public schools within neighborhood boundaries as well as several middle and high schools outside the study area that draw a significant number of students who live in the neighborhoods. The number of schools ranged from one to four per neighborhood. Surveys were administered via phone and online during two separate time periods, due to summer vacation: May 18-June 4, 2012 and August 13-17, 2012. Respondents included school principals, nutrition department staff, and district staff. In total, 14 of the 22 identified schools completed the survey.
Preschool/Childcare Surveys We assessed the nutrition and physical activity environments in childcare facilities in each neighborhood using the Nutrition and Physical activity Self-Assessment for Child Care (NAPSACC) survey instrument. The NAPSACC is a reliable and validated 54-question survey (9) that includes best practice recommendations for childcare centers based on extensive review of research and nutrition regulation. Respondents reported the extent to which their center met best practice standards on a scale from one to four, with four being the best practice standard. The NAPSACC tool included items in two categories:
• Nutrition (types and frequency of foods and beverages served, feeding practices, nutrition policies and education)

15
• Physical Activity (active time, play environment, physical activity policies and education) We identified 21 preschool/childcare facilities within the eight selected neighborhoods, with a range of one to four facilities per neighborhood. Surveyors contacted each facility and elicited survey answers via phone and site visits and gave facility staff the option to complete an online self-assessment. In total, 11 of the 21 identified preschool/childcare facilities completed the survey.
Mobile Vending/Food Truck Surveys As part of the effort to assess the availability and marketing of healthy and unhealthy foods in each neighborhood, we surveyed mobile vending and impermanent food stands around schools in the selected neighborhoods. We used the CX3 Mobile Vending Survey because it is specifically designed for the purpose of assessing mobile vendors (food trucks) in low-income neighborhoods. (10) We conducted all mobile vending surveys at the end of the school day in order to evaluate the types of foods accessible to school-aged children after school. Surveyors, either alone or in pairs, walked or drove through streets within a 500 foot radius of all schools (elementary, middle, high, and alternative) within each neighborhood, and recorded information on any vendors present within this radius. The survey provided the following information about each vendor:
• Type of vendor (i.e. motorized truck, peddler on foot, etc.) • If the vendor is within visual range of a school • Main product the vendor is selling • Marketing tactics (bell, music, etc.) • Whether a valid permit is visible • Whether most of the food being sold by the vendor is healthy
In total, we collected data around 20 different schools. Fourteen of the schools had mobile vendors present; we collected data on a total of 34 vendors at these schools. Surveys were conducted within two different time periods due to school vacations: May 21-June 9, 2012 and August 15-31, 2012.
Street Surveys To assess the walking and bicycling environments of streets in each neighborhood, we collected data using both the Pedestrian Environmental Data Scan (PEDS) survey and all questions within the category of safety from the Irvine-Minnesota Inventory. Both surveys were selected because they are validated tools with high inter-rater reliability. (11) (12) The combination of these tools created a comprehensive, 67-question survey that included the following categories:
• Aesthetics (elements related to attractiveness for use by pedestrians and bicyclists) • Amenities (permanent fixtures that make pedestrian or bicyclist use of the area easier or more
pleasant) • Violence and Safety (presence or absence of elements that make the area feel safe) • Traffic Conditions and Pedestrian Safety (permanent fixtures that protect pedestrians from
traffic conditions) • Pedestrian Accessibility (conditions of pedestrian areas)

16
The majority of the items across categories involved objective observation of street conditions. A few items on the survey required subjective assessment on the part of the surveyors. The original version of the tools can be found at the end of the Methodology section. Modifications made to these tools for this assessment are noted on these surveys. Using ArcGIS mapping software and Stata Version 12.0 (StataCorp, College Station, TX), we selected a random sample of 25% of all low-traffic streets in each neighborhood for surveying, as well as 100% of high-traffic streets within neighborhood boundaries. High-traffic streets are generally main arterial streets and low-traffic streets are generally found in residential areas and have fewer lanes. We surveyed both sides of both high- and low-traffic streets; however, for low-traffic street segments data for both sides was included in one survey, and for high-traffic streets each side of the street was surveyed separately. We chose to survey a sample of low-traffic streets rather than all streets because of the large number of low-traffic streets and due to limited resources. This is a validated approach and sampling was taken into account during data analysis by using a weighted average for all results combining low- and high-traffic street data. We surveyed between 18 and 90 street segments in each neighborhood for a total of 506 street segments. Each survey took between five and fifteen minutes to complete, depending on the size of the segment. We performed quality assurance by validating responses to environmental scans for a sample of sites in each neighborhood. All data were collected from May 28-June 26, 2012.
Street Segments Surveyed (High Traffic versus Low Traffic), by Neighborhood
Neighborhood High traffic streets Low traffic streets Grand Total
Burbank/Buena Vista 45 39 84
Mayfair/Suenes 62 28 90
Rengstorff 7 11 18
S. Central Gilroy 45 51 96
Seven Trees/Los Arboles/Serenade
22 38 60
Snail/Lowlanders 34 50 84
Tropicana/Dorsa/Miller 18 26 44
Washington/Guadalupe 14 16 30
Grand Total 247 259 506
Source: Santa Clara County Public Health Department, Status of Latino/Hispanic Health 2012, PEDS and IMI
Modification of Survey Instruments We modified existing survey instruments to better fit the needs of the assessment. Modifications included adding questions to several surveys that were considered to be culturally relevant to the Latino/Hispanic population. We also added questions to the following surveys:
• PEDS (we added all questions from the safety domain of the IMI) • PEDS/IMI (modified some wording of questions after feedback from surveyors)

17
• CX3 Food and Physical Activity Marketing Survey, CX3 Mobile Vending Survey (added question about the language of marketing tactics)
It is important to note that we did not eliminate any questions from any survey and analyzed additional questions separately to ensure that the scoring system was unaffected by changes to the survey.
Focus Groups We facilitated focus groups with residents in each of the eight neighborhoods. The majority of participants were of Latino/Hispanic origin. In each neighborhood, we attempted to conduct one focus group in English and one in Spanish. In neighborhoods where there were an insufficient number of English speaking volunteers, we attempted to conduct a second focus group in Spanish. SCCPHD staff identified local community leaders to convene and host the groups. The focus groups were designed to answer the following questions:
• What are residents’ perceptions regarding neighborhood food access, physical activity infrastructure and neighborhood violence?
• What are the community's social norms associated with physical activity and healthy eating? • What else is causing childhood and adult obesity? (i.e., cultural norms, socio-economic factors,
housing, employment, family issues, etc.) • What are their recommendations for improving access and opportunity for healthier living, as
well as improving safety/reducing violence in their neighborhoods? Focus groups were held in June and July of 2012 in locations in the neighborhoods, such as community centers, community organization sites, and libraries. Each group was comprised of 5 to 18 neighborhood residents, who received $20 gift cards to local grocery stores as compensation. We recorded and transcribed all conversation during each focus group. In total, we conducted ten groups in Spanish and three groups in English for a total of 13 focus groups across the eight neighborhoods. In addition, we held conducted one focus group with three service providers in the Snail/Lowlanders neighborhood due to lack of participation from neighborhood residents. The focus group protocol can be found at the end of this chapter.
Data Analysis For all responses from environmental scans and surveys, we calculated percentages and counts. Analysis of the childcare survey included averaging scores for practices and policies for each best practice standard. The store survey and emergency food outlet survey analyses also include a scoring system and benchmark score established by the CX3 as a “standard of excellence.” With the approval of the CX3 staff, we modified the scoring system for both of these surveys because of limitations on the amount of data we could collect for each survey. Rather than reporting each individual survey item alone, we organized a series of related questions into categories, such as “safety” and “advertising.” In order to present findings that will be actionable across the eight neighborhoods, the analysis pooled data across neighborhoods and highlighted patterns rather than providing findings for each neighborhood. Data for specific neighborhoods surveyed, will be available shortly at www.sccphd.org/statistics2.
18
For the following surveys, cross-neighborhood data were broken down into separate categories:
• To analyze store surveys, data was analyzed by type of store (e.g., large chain, convenience store, etc.) as well as across all stores. We analyzed the data in this manner to highlight the differences between food environments in different types of stores. This, combined with the knowledge that certain types of stores are far more prevalent than others, was intended to provide a more in-depth perspective on healthy food access.
• To analyze street segment surveys, we analyzed low-traffic and high-traffic streets separately, with the understanding that different factors are more or less important depending on the amount of traffic on a street. Because we surveyed a higher percentage of high-traffic than low-traffic streets, we also calculated a weighted average for all street segments in order to avoid overrepresentation of high-volume streets.
We analyzed data from focus groups by coding the transcriptions, looking for similarities in the information, and then generating key themes. We coded 6 basic categories:
• Environmental factors associated with access to healthy and affordable food • Environmental factors associated with physical activity • Environmental factors associated with safety • Environmental factors associated with multiple or other environmental factors relating to
health • Non-environmental factors impacting Latino health • Ways the community can promote health
Key themes were reported across all groups.
Limitations This assessment had a number of limitations:
• Due to the large amount of data being collected and the variety of survey tools being used, we conducted surveys at different times and days of the week. Data from the surveys therefore provide a “snapshot” of a particular time and place.
• There were more than 20 individual surveyors who participated in the scans. Although trained, each surveyor brings his or her own unique set of biases. Surveyors worked in teams of two and differences in responses were resolved by consensus.
• Though both the PEDS and the Irvine-Minnesota Inventory are validated tools with high inter-rater reliability, (12) (11) the PEDS survey contains some questions that have a low reliability score. We compared responses for all questions with the duplicate data collected for quality assurance and did not report findings for questions with consistently low inter-rater reliability.
19
References 1. Blumberg, S. J., & Luke, J. V. (2010). Wireless subsitution: early release of estimates from the National Health
Interview Survey, July-December 2009. Atlanta: Division of Health Interview Statistics, Centers for Disease Control and Prevention.
2. Centers for Disease Control and Prevention. (n.d.). Overweight and Obesity. Retrieved from Centers for Disease Control and Prevention: ftp://ftp.cdc.gov/pub/Publications/dnpao/census-tract-level-state-maps-mrfei_TAG508.pdf
3. California Department of Public Health, Champions for Change. (2010). Communities of Excellence (CX3). Retrieved September 21, 2012, from California Department of Public Health: http://www.cdph.ca.gov/programs/cpns/Pages/CX3_Main_Navgation.aspx
4. California Department of Public Health, Champions for Change. (2010). Food Availability and Marketing-Store Survey. Retrieved from California Department of Public Health: http://www.cdph.ca.gov/programs/cpns/Pages/CX3_T2_FAMSurvey.aspx
5. Network for a Healthy California. (n.d.). CX3 Tier 2-Food Bank and Emergency Food Outlets. Retrieved from California Department of Public Health: http://www.cdph.ca.gov/programs/cpns/Pages/CX3_T2_FoodBank_EmergFoodSurvey.aspx
6. California Department of Public Health, Champions for Change. (2010). CX3 Food and Physical Activity Outdoor Marketing. Retrieved from California Department of Public Health: http://www.cdph.ca.gov/programs/cpns/Pages/CX3_T2_OutdoorSurvey.aspx
7. Hearst MO, L. L. (2009). Inventory versus checklist approach to assess middle school à la carte food availability. The Journal of School Health, 593-598.
8. Trans-Disciplinary Research on Energetics and Cancer Centers. (2006). Procedures Manual. Trans-Disciplinary Research on Energetics and Cancer Centers.
9. Benjamin, S. E. (2007). Reliability and validity of a nutrition and physical activity environmental self-assessment for child care. International Journal of Behavioral Nutrition and Physical Activity, 4-6.
10. California Department of Public Health, Champions for Change. (2010). CX3 Mobile Vending Around Schools. Retrieved from California Department of Public Health: http://www.cdph.ca.gov/programs/cpns/Pages/MobileVendingAroundSchools.aspx
11. Day, K. B. (2012). Tools and Measures: Irvine Minnesota Inventory. Retrieved from Active Living Research: http://www.activelivingresearch.org/node/10634
12. Clifton, K. J. (2006). The development and testing of an audit for the pedestrian environment. Science Direct, 8-14.

Tools for Data Collection
Updated: 01.2012
CX3 Tier 2 - NF 2-5 Food Availability & Marketing Survey
A. STORE INFORMATION
1) Store ID: ___ - ___ - ____
County - Neighborhood - Store Code 2) Census Tract: _____________________________________
3) Name/Address of Store: _____________________________________
__________________________________________________________ (Street Address) (City) (Zip)
4) Coder Name/ID: _______________________________
5) Store Type: Obtain from GIS store lists (circle one):
At store visit if store type is different, mark through circled number
and circle correct store type.
1. Supermarket chain (e.g., Safeway, Ralph’s)
2. Large grocery store (> 20 employees or ≥ 4 registers, but not large chain)
3. Small Market (< 4 registers, but not convenience)
4. Convenience (sells food items and snacks, no fresh meat, may sell gas)
5. Other (NO liquor stores) (specify): __________________________________
6) Is store with in ½ mile of a school? 1 - Yes 0 - No If Yes, Name of school: _______________________________________
7) WIC Vendor? 1 - Yes 0 - No (Obtain from GIS, Verify by phone or at store)
8) CalFresh, Food stamp or SNAP vendor? 1 - Yes 0 - No (Obtain from GIS, Verify by phone or at store)
9) Participate as a Network for a Healthy California retail store? 1 - Yes 0 - No
B. STORE EXTERIOR
11) Is a school visible from the store (circle one)? 1 - Yes 0 - No
12) Record information about healthy and unhealthy advertising and products on all doors and windows of the storefront. Do not include ads on the sides of the building or on other parts of the property such as the roof, fences or parking lot. For the following table, only include professionally-produced advertising that depicts brands, logos or products. See definitions to learn what types of items to count.
Tally in grey area, circle totals in white area
# of ADS for Unhealthy # of ADS for Healthy
a) Small
≤ 1 sheet of 8 1/2” x 11” paper
(same size or smaller than this sheet of paper)
0 1-2 3-5 6-9 10 + 0 1-2 3-5 6-9 10 +
b) Medium
> 1 up to 10 sheets of paper
(bigger than this sheet of paper, but smaller than 10 together)
0 1-2 3-5 6-9 10 + 0 1-2 3-5 6-9 10 +
c) Large
> 10 sheets of paper
(bigger than 10 of these sheets of paper together)
0 1-2 3-5 6-9 10 + 0 1-2 3-5 6-9 10 +
1 Elem 2 Middle 3 High 4 Contn
(circle one)
10) Date of visit: ____________
34) Disposition: 1 Completed
(circle one) 2 Partial
3 Denied / No data
4 Denied / Exterior only
5 Store not found
6 Store closed (out of business)
7 Store not visited
8 Inaccessible due to
safety conditions
Unhealthy foods are high calorie, low nutrient foods and beverages that include alcoholic beverages, soft drinks and other sweetened beverages including diet drinks, sweet desserts and highly sugared cereals, chips and other salty snacks, most solid fats, fried foods, and other foods with high amounts of sugar, fat and/or sodium.
Healthy foods are fruits and vegetables, whole grains, beans, nuts and seeds, non-fat and low fat milk products, and lean meat, poultry, and fish. Healthy foods include minimal or no added fat, sugars, or sweeteners. Unsweetened black coffee is included.
Do not consider: Cigarettes or tobacco products
2
Store Exterior Conditions Circle One
13) Are there any produce bins on the sidewalk in front of the store? 1 - Yes 0 - No
14) Are other products displayed on the sidewalk in front of the store or inside the store next to the window so they are clearly visible from the outside?
1 - Yes 0 - No
Please check all that apply: __ soda __ water __ other. (specify) __________________
If Yes
15) Are there vending machines on the sidewalk in front of the store? 1 - Yes 0 - No
Please check all that apply: __ soda __ water __ other. (specify) ____________________
If Yes
16) Is there advertising (banners, posters, temporary signs, etc.) on the roof, walls
or elsewhere on the property such as on fences, garbage cans or in the parking lot?
1 - Yes 0 - No
Please check all that apply: ____ healthy ____ unhealthy
If Yes
17) Are there any images of healthy food (e.g. tomato, apple) and/or
beverages (e.g. milk), painted on doors or windows of the storefront?
1 - Yes 0 - No
18) Are there any images of un-healthy food (e.g. hamburger, hot dog) and/or
beverages (e.g., soda, shake) painted on doors or windows of the storefront?
1 - Yes 0 - No
19) Are there any painted murals of healthy food and/or beverages anywhere on the building walls?
1 - Yes 0 - No
20) Are there permanent bars/chains on the windows or doors? (do not include
sliding or rolling chains or bars)
1 - Yes 0 - No
21) If the store sells alcohol, is more than 1/3 of the total window area covered by
any type of advertising?
1 - Yes 0 - No 9 - N/A (Store does not
sell alcohol)
22) Is "We Accept WIC" signage displayed?
1 - Yes 0 - No
23) Is "We Accept CalFresh, Food Stamps/ EBT" signage or ads displayed? 1 - Yes 0 - No
23a) Are there any ads promoting EBT with food or beverage products Please
1 - Yes 0 - No
Please check all that apply: _____ healthy _____ unhealthy
If Yes
C. STORE INTERIOR
24) Number of cash registers throughout store (staffed and unstaffed, for grocery items only) ______
25) Marketing of foods and beverages next to the main check-out area
Circle "1" for yes if the item or ad is present or "0" for no if the item or ad is not present.
Presence of ads or promotions (fill in BOTH columns): UNHEALTHY HEALTHY
Next to check-out (attached or directly next to) 1 - Yes 0 - No 1 - Yes 0 - No
Below check-out level 1 - Yes 0 - No 1 - Yes 0 - No
On floor (if standing in checkout isle or next to counter) 1 - Yes 0 - No 1 - Yes 0 - No
Hanging from ceiling (directly over register) 1 - Yes 0 - No 1 - Yes 0 - No
Presence of UNHEALTHY products next to or below a check-out counter:
Gumball or candy machine (next to counter or exit doorway) 1 - Yes 0 - No
Candy (next to or below counter/check-out) 1 - Yes 0 - No
Soda (next to or below counter/check-out) 1 - Yes 0 - No
Chips (next to or below counter/check-out) 1 - Yes 0 - No
Other:specify (such as cookies, ice cream, beef jerky, energy drinks, etc.) 1 - Yes 0 - No
Presence of HEALTHY products next to or below a check-out counter:
Granola bars (whole grain, ≥ 2 g fiber, ≤ 1 g saturated fat, ≤ 14 g sugar per serving) 1 - Yes 0 - No
Bagged Nuts/seeds (do not include honey roasted or w/ added sugar) (next to or below counter/check-out) 1 - Yes 0 - No
Fresh fruit (next to or below counter/check-out) 1 - Yes 0 - No
Bottled water (next to or below counter/check-out) 1 - Yes 0 - No
Other:specify (such as dried fruit, trail mix, 100% juice, etc.) 1 - Yes 0 - No
Unhealthy products are high calorie, low nutrient foods and beverages that include alcoholic beverages, soft drinks and other sweetened beverages including diet drinks, sweet desserts and highly sugared cereals, chips and other salty snacks, most solid fats, fried foods, and other foods with high amounts of sugar, fat and/or sodium.
Healthy products include minimal or no added fat, sugars, or sweeteners. Examples include fresh or dried fruits and vegetables, whole grain snacks (≥ 2 g fiber per serving), energy bars (≤ 14 g sugar per serving), nuts and seeds, non-fat and low fat milk products, water, or 100% fruit juice.
3
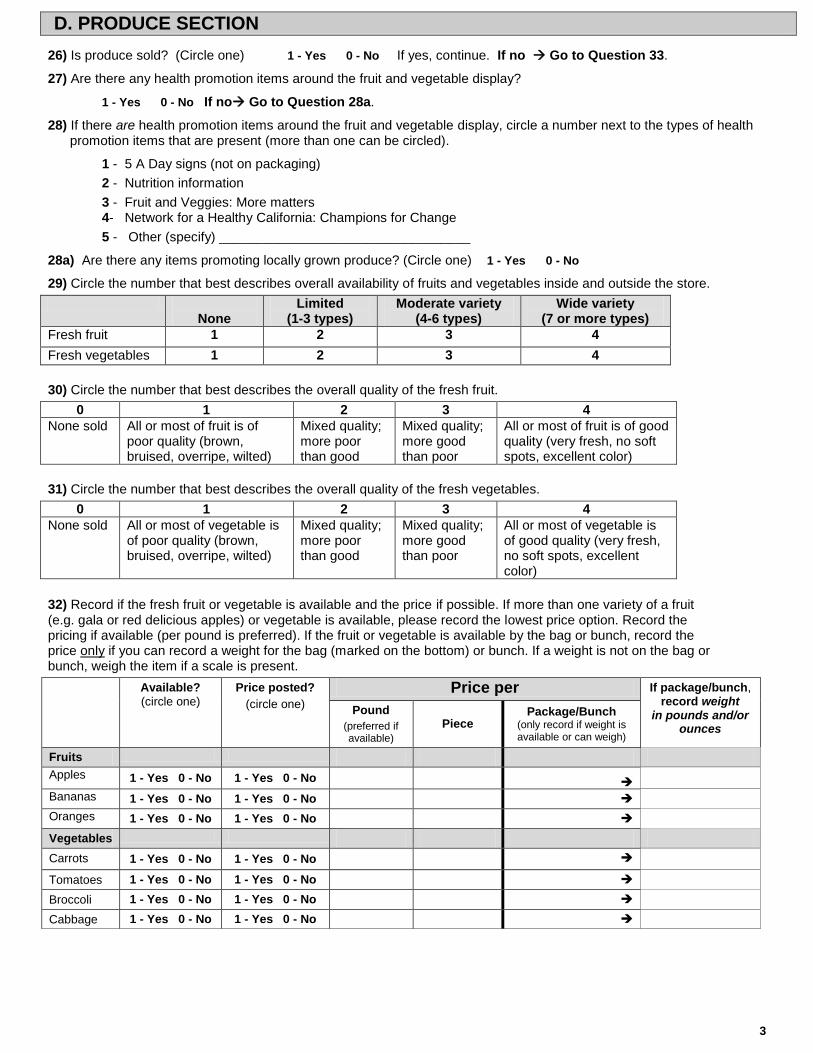
D. PRODUCE SECTION
26) Is produce sold? (Circle one) 1 - Yes 0 - No If yes, continue. If no Go to Question 33.
27) Are there any health promotion items around the fruit and vegetable display?
1 - Yes 0 - No If no Go to Question 28a.
28) If there are health promotion items around the fruit and vegetable display, circle a number next to the types of health promotion items that are present (more than one can be circled).
1 - 5 A Day signs (not on packaging)
2 - Nutrition information
3 - Fruit and Veggies: More matters 4- Network for a Healthy California: Champions for Change
5 - Other (specify) __________________________________
28a) Are there any items promoting locally grown produce? (Circle one) 1 - Yes 0 - No
29) Circle the number that best describes overall availability of fruits and vegetables inside and outside the store.
None
Limited (1-3 types)
Moderate variety (4-6 types)
Wide variety (7 or more types)
Fresh fruit 1 2 3 4
Fresh vegetables 1 2 3 4
30) Circle the number that best describes the overall quality of the fresh fruit.
0 1 2 3 4
None sold All or most of fruit is of poor quality (brown, bruised, overripe, wilted)
Mixed quality; more poor than good
Mixed quality; more good than poor
All or most of fruit is of good quality (very fresh, no soft spots, excellent color)
31) Circle the number that best describes the overall quality of the fresh vegetables.
0 1 2 3 4
None sold All or most of vegetable is of poor quality (brown, bruised, overripe, wilted)
Mixed quality; more poor than good
Mixed quality; more good than poor
All or most of vegetable is of good quality (very fresh, no soft spots, excellent color)
32) Record if the fresh fruit or vegetable is available and the price if possible. If more than one variety of a fruit (e.g. gala or red delicious apples) or vegetable is available, please record the lowest price option. Record the pricing if available (per pound is preferred). If the fruit or vegetable is available by the bag or bunch, record the price only if you can record a weight for the bag (marked on the bottom) or bunch. If a weight is not on the bag or bunch, weigh the item if a scale is present.
Available?
(circle one)
Price posted?
(circle one)
Price per If package/bunch, record weight
in pounds and/or ounces
Pound
(preferred if available)
Piece Package/Bunch
(only record if weight is available or can weigh)
Fruits
Apples 1 - Yes 0 - No 1 - Yes 0 - No
Bananas 1 - Yes 0 - No 1 - Yes 0 - No
Oranges 1 - Yes 0 - No 1 - Yes 0 - No
Vegetables
Carrots 1 - Yes 0 - No 1 - Yes 0 - No
Tomatoes 1 - Yes 0 - No 1 - Yes 0 - No
Broccoli 1 - Yes 0 - No 1 - Yes 0 - No
Cabbage 1 - Yes 0 - No 1 - Yes 0 - No
4
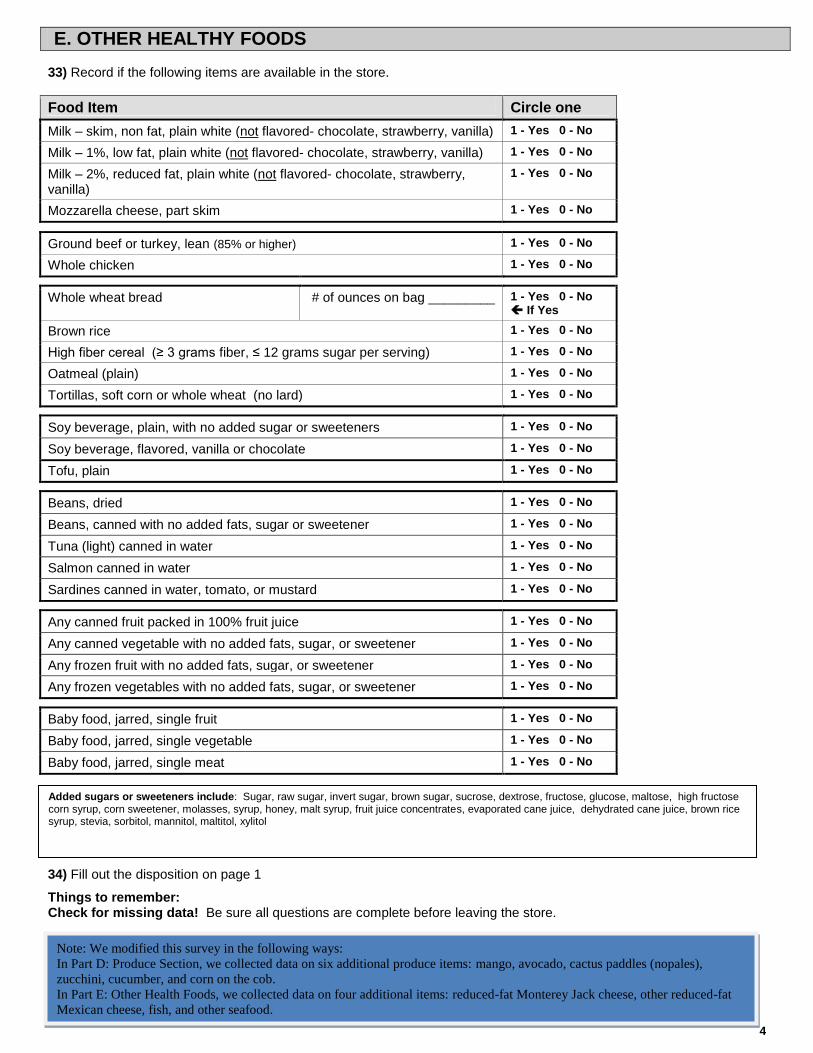
E. OTHER HEALTHY FOODS
33) Record if the following items are available in the store.
34) Fill out the disposition on page 1
Things to remember: Check for missing data! Be sure all questions are complete before leaving the store.
Food Item Circle one
Milk – skim, non fat, plain white (not flavored- chocolate, strawberry, vanilla) 1 - Yes 0 - No
Milk – 1%, low fat, plain white (not flavored- chocolate, strawberry, vanilla) 1 - Yes 0 - No
Milk – 2%, reduced fat, plain white (not flavored- chocolate, strawberry, vanilla)
1 - Yes 0 - No
Mozzarella cheese, part skim 1 - Yes 0 - No
Ground beef or turkey, lean (85% or higher) 1 - Yes 0 - No
Whole chicken 1 - Yes 0 - No
Whole wheat bread # of ounces on bag _________ 1 - Yes 0 - No If Yes
Brown rice 1 - Yes 0 - No
High fiber cereal (≥ 3 grams fiber, ≤ 12 grams sugar per serving) 1 - Yes 0 - No
Oatmeal (plain) 1 - Yes 0 - No
Tortillas, soft corn or whole wheat (no lard) 1 - Yes 0 - No
Soy beverage, plain, with no added sugar or sweeteners 1 - Yes 0 - No
Soy beverage, flavored, vanilla or chocolate 1 - Yes 0 - No
Tofu, plain 1 - Yes 0 - No
Beans, dried 1 - Yes 0 - No
Beans, canned with no added fats, sugar or sweetener 1 - Yes 0 - No
Tuna (light) canned in water 1 - Yes 0 - No
Salmon canned in water 1 - Yes 0 - No
Sardines canned in water, tomato, or mustard 1 - Yes 0 - No
Any canned fruit packed in 100% fruit juice 1 - Yes 0 - No
Any canned vegetable with no added fats, sugar, or sweetener 1 - Yes 0 - No
Any frozen fruit with no added fats, sugar, or sweetener 1 - Yes 0 - No
Any frozen vegetables with no added fats, sugar, or sweetener 1 - Yes 0 - No
Baby food, jarred, single fruit 1 - Yes 0 - No
Baby food, jarred, single vegetable 1 - Yes 0 - No
Baby food, jarred, single meat 1 - Yes 0 - No
Added sugars or sweeteners include: Sugar, raw sugar, invert sugar, brown sugar, sucrose, dextrose, fructose, glucose, maltose, high fructose corn syrup, corn sweetener, molasses, syrup, honey, malt syrup, fruit juice concentrates, evaporated cane juice, dehydrated cane juice, brown rice syrup, stevia, sorbitol, mannitol, maltitol, xylitol
Note: We modified this survey in the following ways:
In Part D: Produce Section, we collected data on six additional produce items: mango, avocado, cactus paddles (nopales),
zucchini, cucumber, and corn on the cob.
In Part E: Other Health Foods, we collected data on four additional items: reduced-fat Monterey Jack cheese, other reduced-fat
Mexican cheese, fish, and other seafood.
Reviewed 03.2011
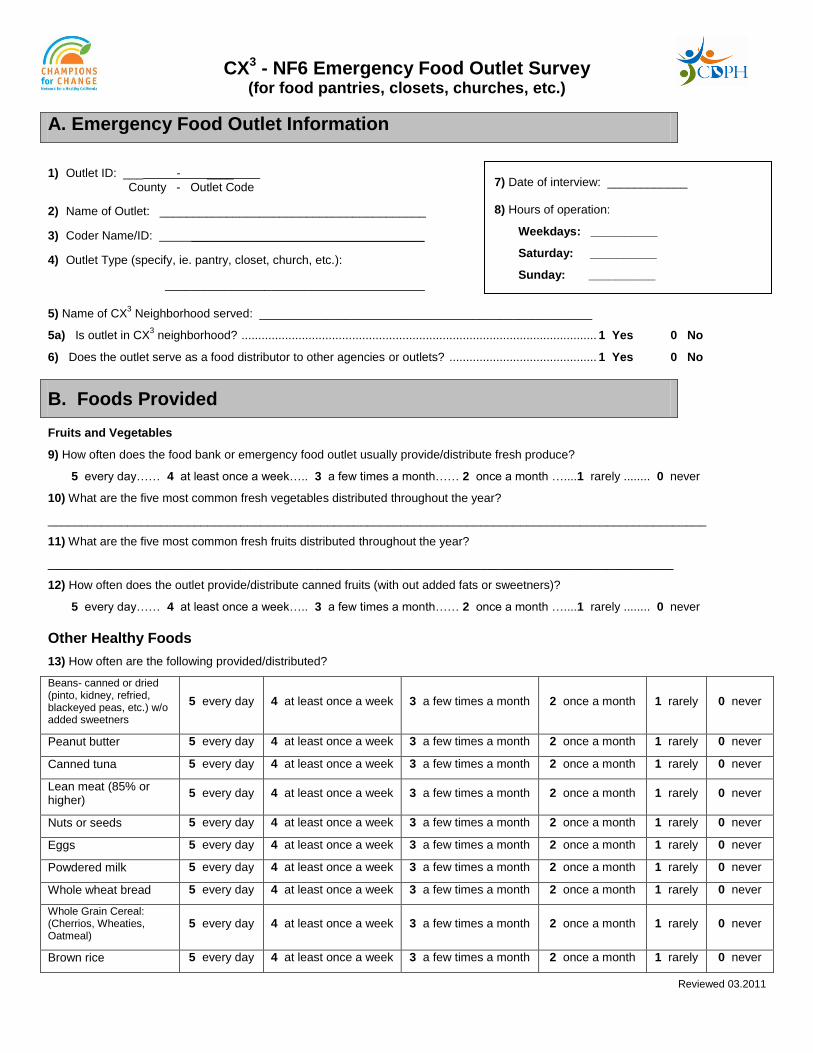
CX3 - NF6 Emergency Food Outlet Survey (for food pantries, closets, churches, etc.)
A. Emergency Food Outlet Information
1) Outlet ID: ___ - ____
County - Outlet Code
2) Name of Outlet: ________________________________________
3) Coder Name/ID: ___________________________________
4) Outlet Type (specify, ie. pantry, closet, church, etc.):
_______________________________________
5) Name of CX
3 Neighborhood served: __________________________________________________
5a) Is outlet in CX3 neighborhood? .......................................................................................................... 1 Yes 0 No
6) Does the outlet serve as a food distributor to other agencies or outlets? ............................................ 1 Yes 0 No
B. Foods Provided
Fruits and Vegetables
9) How often does the food bank or emergency food outlet usually provide/distribute fresh produce?
5 every day…… 4 at least once a week….. 3 a few times a month…… 2 once a month …....1 rarely ........ 0 never
10) What are the five most common fresh vegetables distributed throughout the year?
___________________________________________________________________________________________________
11) What are the five most common fresh fruits distributed throughout the year?
______________________________________________________________________________________________
12) How often does the outlet provide/distribute canned fruits (with out added fats or sweetners)?
5 every day…… 4 at least once a week….. 3 a few times a month…… 2 once a month …....1 rarely ........ 0 never
Other Healthy Foods
13) How often are the following provided/distributed?
Beans- canned or dried (pinto, kidney, refried, blackeyed peas, etc.) w/o added sweetners
5 every day 4 at least once a week 3 a few times a month 2 once a month 1 rarely 0 never
Peanut butter 5 every day 4 at least once a week 3 a few times a month 2 once a month 1 rarely 0 never
Canned tuna 5 every day 4 at least once a week 3 a few times a month 2 once a month 1 rarely 0 never
Lean meat (85% or higher)
5 every day 4 at least once a week 3 a few times a month 2 once a month 1 rarely 0 never
Nuts or seeds 5 every day 4 at least once a week 3 a few times a month 2 once a month 1 rarely 0 never
Eggs 5 every day 4 at least once a week 3 a few times a month 2 once a month 1 rarely 0 never
Powdered milk 5 every day 4 at least once a week 3 a few times a month 2 once a month 1 rarely 0 never
Whole wheat bread 5 every day 4 at least once a week 3 a few times a month 2 once a month 1 rarely 0 never
Whole Grain Cereal: (Cherrios, Wheaties, Oatmeal)
5 every day 4 at least once a week 3 a few times a month 2 once a month 1 rarely 0 never
Brown rice 5 every day 4 at least once a week 3 a few times a month 2 once a month 1 rarely 0 never
7) Date of interview: ____________
8) Hours of operation:
Weekdays: __________
Saturday: __________
Sunday: __________

Pasta (egg or whole wheat)
5 every day 4 at least once a week 3 a few times a month 2 once a month 1 rarely 0 never
Soy milk 5 every day 4 at least once a week 3 a few times a month 2 once a month 1 rarely 0 never
Unhealthy Foods
14) How often are the following provided/distributed?
Soda 5 every day 4 at least once a week 3 a few times a month 2 once a month 1 rarely 0 never
Other sweetened drinks (gatorade, energy drinks, sweetened teas, fruit drinks-not 100% juice)
5 every day 4 at least once a week 3 a few times a month 2 once a month 1 rarely 0 never
Chips 5 every day 4 at least once a week 3 a few times a month 2 once a month 1 rarely 0 never
Cookies 5 every day 4 at least once a week 3 a few times a month 2 once a month 1 rarely 0 never
High sugar cereals (fruit loops, cocoa puffs,frosted flakes, captain crunch, etc.)
5 every day 4 at least once a week 3 a few times a month 2 once a month 1 rarely 0 never
Candy (fruit snacks, crunch & munch, etc.)
5 every day 4 at least once a week 3 a few times a month 2 once a month 1 rarely 0 never
C. Healthy Food Promotion
Does the outlet:
15) receive/obtain mainly foods that are low in salt, fat, and hydrogenated oils? ............................................ 1 Yes 0 No
16) provide guidelines or tips for healthy food preparation? .................................................................... 1 Yes 0 No
17) provide taste testing or samples of foods? ................................................................................................ 1 Yes 0 No
18) provide nutrition education? ....................................................................................................................... 1 Yes 0 No
19) work with area nutrition educators to provide nutrition education to clients? ............................................... 1 Yes 0 No
20) consult with a nutritionist about the food distributed? ................................................................................ 1 Yes 0 No
21) include nutrition education in newsletters or mailings? ............................................................................. 1 Yes 0 No
22) conduct client surveys? ............................................................................................................................. 1 Yes 0 No
D. Site Visit
23) Are there any healthy food promotion items visible? ................................................................... 1 Yes 0 No 24) If available, circle a number next to the types of health promotion items that are present. (More than one can be circled.)
1 - 5 A Day (not on packaging)
2 - Nutritional information
3 - Fruit and Veggies: More Matters
4 - Network for a Healthy California: Champions for Change
5 - Other (specify) ____________________________________
25) Notes/Other Observations: (optional)
________________________________________________________________________________________________
________________________________________________________________________________________________ Things to remember: Double check that all entries are clear and legible. Thank You!
Note: We modified this survey in the following ways:
We did not complete Part D: Site Visit.

Updated 04.2012
CX3 Tier 2 – NF10 Food and Physical Activity Outdoor Marketing Survey
A. Location Information
1) Location ID: ___ - ___ _
County - Neighborhood 2) Census Tract (record complete #): ____________________________________
3) Name of School/Park/Playground: _____________________________________
Location type (circle one): 1 - School 2 - Park 3 - Playground
4) Coder Name/ID: ___________________________________
Messages and Products in Marketing - Category Descriptions
1 Fast Food Restaurants
Advertising for chain restaurants that sell burgers, fries, fried chicken, pizza, tacos or burritos but that do not display images of foods sold there.
2 Other Restaurants
Advertising for restaurants that offer items other than those specified above or serve a broad range of items that may include some of those specified for fast food restaurants.
3 Healthy Foods and Messages Include
Low-fat/non-fat dairy products (not milk)
Fruits and vegetables
Low-fat meats (fish, seafood, skinless poultry)
Soy products (including soy milk)
Whole grain breads and cereals
Energy bars, convenient health food (e.g., Power bar)
Healthy prepared food
PSAs (government, foundation sponsored, etc.) for healthy messages related to obesity prevention, healthy eating, activity
5) Date of visit: ____________
6) Disposition for school area
(circle one):
1 Completed 2 Partial
5 Physical Activity/Sporting Equipment/Facilities Include
Basketball
Baseball
Tennis
Golf
Other (e.g., fitness centers/gyms)
7 Unhealthy Beverages Include (specify beverage in notes section)
Regular soda
Diet soda/drinks (artificially sweetened beverages)
Energy drinks (Red Bull, Rockstar, Go Girl)
Sugary fruit drinks (Tampico, Sunny Delight)
Vitamin Water
Sports drinks (PowerAde, Gatorade)
Specialty Coffee/Tea drinks (Frappuccino, Mocha, Sobe)
Regular whole milk/flavored milks (chocolate, strawberry)
Alcohol
4 Unhealthy Foods Include
Fast food (Burgers, fries, fried chicken, pizza, tacos and burritos)
Low nutrient density snack food (chips, cookies, candy)
High-fat meats (beef, pork, lamb, poultry with skin, fried poultry/fish/seafood)
Refined grain breads and cereals
Desserts (except fresh, frozen, or canned fruit in own juices)
6 Other (specify type in notes section) Use this category for food related ads that do not fit into any of the above categories and provide a brief description of the products under notes/comments.
8 Healthy Beverages and Messages (specify beverage in notes section)
Water
100% Fruit juice
Low-fat/non-fat milk
Healthy beverages message

2
B. Types of Outdoor Advertising
Record all the different types of outdoor advertising within 1,000’ of the school or park. (One survey for each school/park)
Location type (circle one): 1 - School 2 - Park 3 - Playground
Location/Street Photo (mark
exposure # if photo taken)
School/park visible from
ad?
(circle #)
Type/Size (enter
number)
Product/Ad is for: (enter
number)
Notes/Comments (If Type/Size = “8-Other”)
(If Product/Ad = “6-Other”) (If Product/Ad = “Unhealthy Bev”)
1 - Yes 0 - No
1 - Yes 0 - No
1 - Yes 0 - No
1 - Yes 0 - No
1 - Yes 0 - No
1 - Yes 0 - No
1 - Yes 0 - No
1 - Yes 0 - No
1 - Yes 0 - No
1 - Yes 0 - No
1 - Yes 0 - No
1 - Yes 0 - No
1 - Yes 0 - No
1 - Yes 0 - No
1 - Yes 0 - No
7. Total # ads
recorded
8. Total ads visible from school/park
Total ads
each type/size
10. Total ads
healthy
11. Total ads
unhealthy or FF
restaurant
Product/Ad is for:
1 Fast food restaurant 2 Other restaurant 3 Healthy food item(s)/message 4 Unhealthy food item(s) 5 Physical activity (e.g., sports equipment, gyms) 6 Other Food/PA topic (please specify in notes/comments column) 7 Unhealthy Beverages (soda, energy drinks, other sugar sweetened beverages)
(please specify in notes/comments column) 8 Healthy beverage(s)/message
Type/Size:
1 Large billboard (14’ x 48”) 2 Medium-sized billboard (12’ x 25’, “30 sheets”) 3 Small billboard (6’ x 12’, “8 sheets”) 4 Transit ad (bus bench/shelter/rail station) 5 Sandwich board ad 6 Electronic billboard 7 Mobile billboard 8 Other outdoor signage (please specify in
notes/comments column)
Descriptions for each category available on
previous page
9. Total # ads for each type/size:
1 Large billboard _____ 5 Sandwich board ad _____ 2 Medium billboard _____ 6 Electronic billboard _____ 3 Small billboard _____ 7 Mobile billboard _____
4 Transit ad _____ 8 Other Outdoor signage _____

EPI-CH/DCSS/IDEA 016 (1-13) 10/06 Ver.1 B. Produced by DCSS Page 1
Date: |___|___| / |___|___| / |___|___| 30
Principal Survey/Interview I. PRACTICES & POLICIES A. Which of the following practices (what your students and staff are allowed to do on a
regular basis) does your school allow? 1. Students are allowed to … Yes No
a. Have food in the classroom 1 2
37
b. Have beverages in the classroom 1 2
c. Have food in school hallways 1 2
d. Have beverages in school hallways 1 2
e. Bring food (or have parents bring food) into the cafeteria from local fast food restaurants
1 2
f. Leave school grounds during lunch 1 2
g. Leave school grounds during other periods 1 2
h. Use indoor physical facilities for recreation outside school hours
1 2
i. Use outdoor physical facilities for recreation outside school hours
1 2
j. Use school equipment for recreation outside school hours
1 2
k. Substitute a different class (ROTC, band, team sport) for PE class
1 2
l. Walk to school 1 2
m. Bicycle to school 1 2
n. Use a bike rack located at the school to lock their bikes 1 2 50
2. Teachers and other school staff … Yes No
a. Use food as rewards or incentives for students. 1 2
51
b. Use food coupons as rewards or incentives for students. 1 2 52
Go to next page.
36 Office Use Only: Method of Data Collection: 1 In-person interview 2 Phone interview 3 Mailed survey
ID Number: |__|__|__|__|__|__|__|__| 14
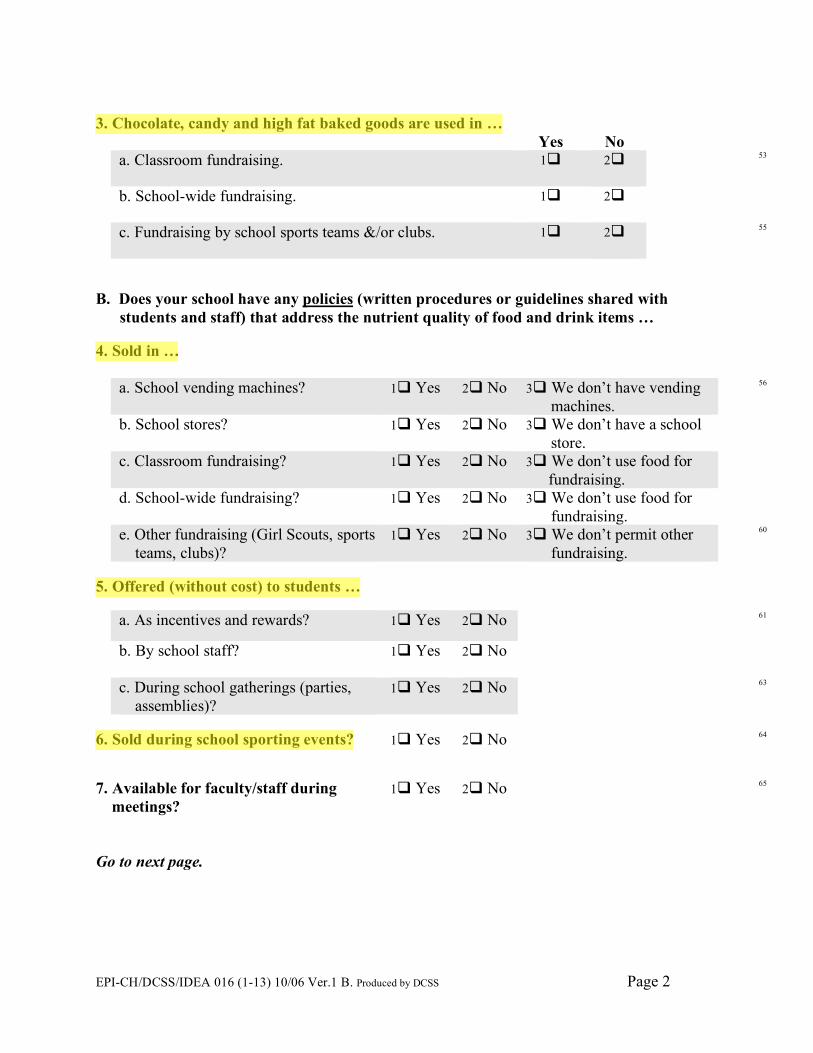
EPI-CH/DCSS/IDEA 016 (1-13) 10/06 Ver.1 B. Produced by DCSS Page 2
3. Chocolate, candy and high fat baked goods are used in … Yes No
a. Classroom fundraising. 1 2
53
b. School-wide fundraising. 1 2
c. Fundraising by school sports teams &/or clubs. 1 2
55
B. Does your school have any policies (written procedures or guidelines shared with
students and staff) that address the nutrient quality of food and drink items … 4. Sold in …
a. School vending machines? 1 Yes 2 No 3 We don’t have vending machines.
56
b. School stores? 1 Yes 2 No 3 We don’t have a school store.
c. Classroom fundraising? 1 Yes 2 No 3 We don’t use food for fundraising.
d. School-wide fundraising? 1 Yes 2 No 3 We don’t use food for fundraising.
e. Other fundraising (Girl Scouts, sports teams, clubs)?
1 Yes 2 No 3 We don’t permit other fundraising.
60
5. Offered (without cost) to students …
a. As incentives and rewards? 1 Yes 2 No
61
b. By school staff? 1 Yes 2 No
c. During school gatherings (parties, assemblies)?
1 Yes 2 No 63
6. Sold during school sporting events? 1 Yes 2 No 64
7. Available for faculty/staff during meetings?
1 Yes 2 No 65
Go to next page.
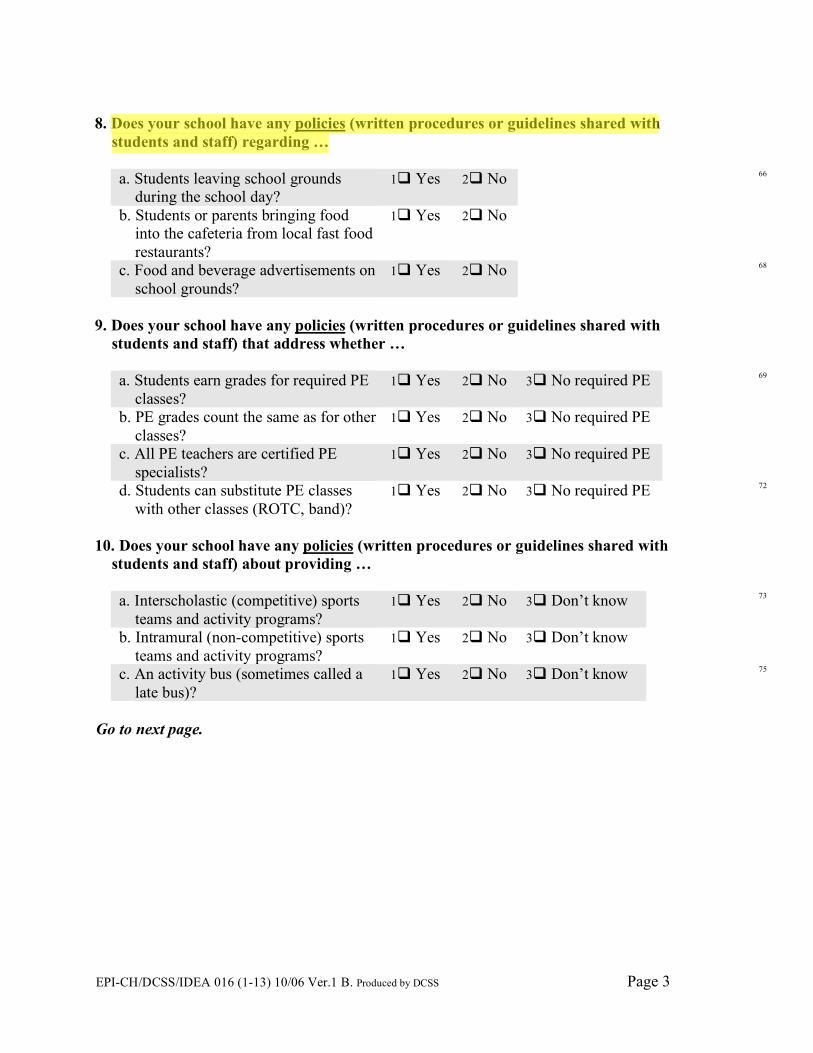
EPI-CH/DCSS/IDEA 016 (1-13) 10/06 Ver.1 B. Produced by DCSS Page 3
8. Does your school have any policies (written procedures or guidelines shared with
students and staff) regarding …
a. Students leaving school grounds during the school day?
1 Yes 2 No 66
b. Students or parents bringing food into the cafeteria from local fast food restaurants?
1 Yes 2 No
c. Food and beverage advertisements on school grounds?
1 Yes 2 No 68
9. Does your school have any policies (written procedures or guidelines shared with
students and staff) that address whether …
a. Students earn grades for required PE classes?
1 Yes 2 No 3 No required PE 69
b. PE grades count the same as for other classes?
1 Yes 2 No 3 No required PE
c. All PE teachers are certified PE specialists?
1 Yes 2 No 3 No required PE
d. Students can substitute PE classes with other classes (ROTC, band)?
1 Yes 2 No 3 No required PE 72
10. Does your school have any policies (written procedures or guidelines shared with
students and staff) about providing …
a. Interscholastic (competitive) sports teams and activity programs?
1 Yes 2 No 3 Don’t know
73
b. Intramural (non-competitive) sports teams and activity programs?
1 Yes 2 No 3 Don’t know
c. An activity bus (sometimes called a late bus)?
1 Yes 2 No 3 Don’t know 75
Go to next page.

EPI-CH/DCSS/IDEA 016 (1-13) 10/06 Ver.1 B. Produced by DCSS Page 4
II. HEALTH/WELLNESS COUNCILS 11. Does your school district have a health or wellness advisory council?
1 Yes
76
2 No Go to Question 17, page 6
12. How long has the council existed?
1 This is the first year 77
2 1-2 years 3 3-4 years 4 More than 4 years 5 Don’t know
13. How often does the council meet?
1 Weekly 78
2 Monthly
3 Every quarter
4 Twice a year
5 Annually
6 Other (please specify): _____________________________|___|___| 79
14. Is your school represented on the council? 81
1 Yes 2 No
82- 89 90
Go to Question 15, next page.
14a. Who is on the council? (Check all that apply). 1 Principal(s) 1 School nurse(s) 1 Teacher(s) 1 Food Service Staff 1 Parent(s) 1 Student(s) 1 Guidance Counselor(s) 1 Other, please specify: _______________________|___|___|
Go to Question 15, next page.

EPI-CH/DCSS/IDEA 016 (1-13) 10/06 Ver.1 B. Produced by DCSS Page 5
15. Has the council addressed food-related policies at your school? 92
1 Yes
2 No 3 Don’t know
93- 102
103
16. Has the council addressed policy related to physical activity at your school? 105
1 Yes
2 No 3 Don’t know
Go to Question 17, next page.
106- 113
114
15a. Please mark the school food-related polices addressed (check all that apply). 1 Food/Beverages sold in school vending machines 1 Food/Beverages sold in school store(s) 1 Food/Beverages sold in fundraising efforts 1 Food/Beverages offered to students as incentives and rewards 1 Food/Beverages sold during school sporting events 1 Food/Beverages available during faculty/staff meetings 1 Food/Beverage advertisements on school grounds. 1 Students leaving school grounds during the school day 1 Students or parents bringing food into the cafeteria from local
fast food restaurants 1 Other, please specify: _________________________|___|___|
Go to Question 16, below.
16a. Please mark the school physical activity-related polices addressed (check all that apply).
1 Students earning grades for required PE classes 1 PE grades counting the same as for other classes 1 All PE teachers being certified PE specialists 1 Students substituting PE classes for other classes (ROTC, band) 1 Interscholastic (competitive) sports teams and activity
programs 1 Intramural (non-competitive) sports teams and activity
programs 1 Activity bussing (late bussing) 1 Other, please specify: __________________________|___|___|
Go to Question 17, next page.

EPI-CH/DCSS/IDEA 016 (1-13) 10/06 Ver.1 B. Produced by DCSS Page 6
17. Does your school have a health or wellness advisory council?
1 Yes 116
2 No Go to Question 23, page 8
18. Who is on the council? (Check all that apply).
1 Principal(s) 117- 124
1 School nurse(s) 1 Teacher(s) 1 Food Service Staff 1 Parent(s) 1 Student(s) 1 Guidance Counselor(s) 1 Other, please specify: __________________________|___|___| 125
19. How long has the council existed?
1 This is the first year 127
2 1-2 years 3 3-4 years 4 More than 4 years 5 Don’t know
20. How often does the council meet?
1 Weekly 128
2 Monthly 3 Every quarter 4 Twice a year 5 Annually 6 Other, please specify: ____________________________|___|___| 130
129 skip
Go to next page.
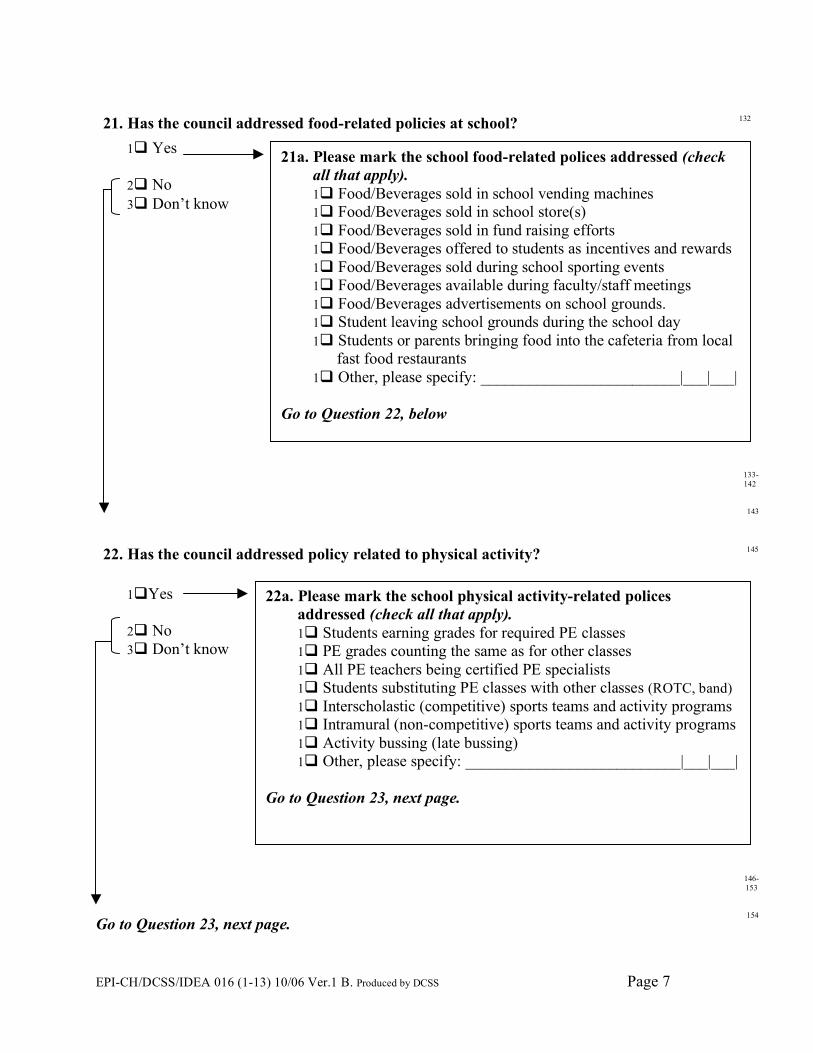
EPI-CH/DCSS/IDEA 016 (1-13) 10/06 Ver.1 B. Produced by DCSS Page 7
21. Has the council addressed food-related policies at school? 132
1 Yes
2 No 3 Don’t know
133- 142
143
22. Has the council addressed policy related to physical activity? 145
1Yes 2 No 3 Don’t know
Go to Question 23, next page.
146- 153
154
22a. Please mark the school physical activity-related polices addressed (check all that apply). 1 Students earning grades for required PE classes 1 PE grades counting the same as for other classes 1 All PE teachers being certified PE specialists 1 Students substituting PE classes with other classes (ROTC, band) 1 Interscholastic (competitive) sports teams and activity programs 1 Intramural (non-competitive) sports teams and activity programs 1 Activity bussing (late bussing) 1 Other, please specify: ___________________________|___|___|
Go to Question 23, next page.
21a. Please mark the school food-related polices addressed (check all that apply). 1 Food/Beverages sold in school vending machines 1 Food/Beverages sold in school store(s) 1 Food/Beverages sold in fund raising efforts 1 Food/Beverages offered to students as incentives and rewards 1 Food/Beverages sold during school sporting events 1 Food/Beverages available during faculty/staff meetings 1 Food/Beverages advertisements on school grounds. 1 Student leaving school grounds during the school day 1 Students or parents bringing food into the cafeteria from local
fast food restaurants 1 Other, please specify: _________________________|___|___|
Go to Question 22, below

EPI-CH/DCSS/IDEA 016 (1-13) 10/06 Ver.1 B. Produced by DCSS Page 8
III. VENDING MACHINES 23. How many vending machines (including soda) are accessible to students at the school?
|___|___| Go to Question 24, below. 156
1 No vending machines accessible to students 158
24. At what times are vending machines turned on for student use? (Check all that apply).
1 Before school starts 159- 163
1 From the beginning of the first period class until the beginning of the first lunch period 1 During lunch 1 From the end of the last lunch period until the end of the school day 1 After school
25. Are vending machines located in or right next to the cafeteria?
1 Yes 164
2 No 3 Don’t Know
26. Which of the following groups receive funds from vending machine sales at the school?
Please consider only those vending machines that are accessible to students. (Check all that apply).
1 School food service program 165- 170
1 School administration 1 Athletic department 1 School clubs 1 Soft drink bottler (Coke, Pepsi, etc) 1 Other, please specify: ___________________________________|___|___| 171
Yes No Don’t
know
27. Does your district have a contract with a soft drink bottler, such as Coca-Cola, Pepsi-Cola, or Dr. Pepper, giving the company exclusive rights to sell soft drinks at schools in your district?
1 2 3 173
28. Are there soft drink machines at the school owned by soft drink companies, for which your district/school receives a percentage of sales?
1 2 3
29. Does your district/school receive incentives (for example, cash rewards, donations of equipment, supplies, or other donations), from a soft drink bottler based on sales?
1 2 3 175
Go to next page.
Go to Question 30, next page.

EPI-CH/DCSS/IDEA 016 (1-13) 10/06 Ver.1 B. Produced by DCSS Page 9
IV. ADVERTISMENTS 30. Do soft drink advertisements exist in the
following locations? Yes No Don’t
know N/A
a. In the cafeteria
1 2 3 176
b. On vending machines (if applicable)
1 2 3 4
c. In school buildings
1 2 3
d. On school grounds, including on the outside of school buildings, on playing fields, or other areas of campus
1 2 3
e. On school buses
1 2 3
f. In school newspapers, public address system, etc. 1 2 3
181
31. Do any other food or beverage advertisements exist in the cafeteria?
1 Yes 182
2 No
3 Don’t Know
32. If yes, please check the foods and/or beverages advertised.
Food 1 Fruits 183-
189
1 Vegetables 1 Baked Goods (e.g., Cookies/Doughnuts/Granola Bars) 1 Fast Food (e.g., Taco Bell, Pizza Hut) 1 Salty Snacks 1 Candy/Candy Bars 1 Other, please specify: _________________________|___|___| 190
Beverages 1 100% fruit juice 192-
196
1 Water 1 Milk 1 Other sweetened drinks 1 Other, please specify: _________________________|___|___| 197
Go to next page.
Go to Question 33, next page.

EPI-CH/DCSS/IDEA 016 (1-13) 10/06 Ver.1 B. Produced by DCSS Page 10
33. Do any other food or beverage advertisements
exist in the following locations? Yes No Don’t
Know N/A
a. On vending machines (if applicable)
1 2 3 4 199
b. In school buildings
1 2 3
c. On school grounds, including on the outside of school buildings, on playing fields, or other areas of campus
1 2 3
d. On school buses
1 2 3
e. In school newspapers, public address system, etc. 1 2 3
203
34. If you answered “Yes” for any of the items in question 33 please check the foods and/or beverages advertised.
Food 1 Fruits 204-
210
1 Vegetables 1 Baked Goods (e.g., Cookies/Doughnuts/Granola Bars) 1 Fast Food (e.g., Taco Bell, Pizza Hut) 1 Salty Snacks 1 Candy/Candy Bars 1 Other, please specify: _________________________|___|___| 211 Beverages 1 100% fruit juice 213-
217
1 Water 1 Milk 1 Other sweetened drinks 1 Other, please specify: _________________________|___|___| 218
35. Does your school subscribe to Channel One?
1 Yes 220
2 No 3 Don’t Know
Go to next page.
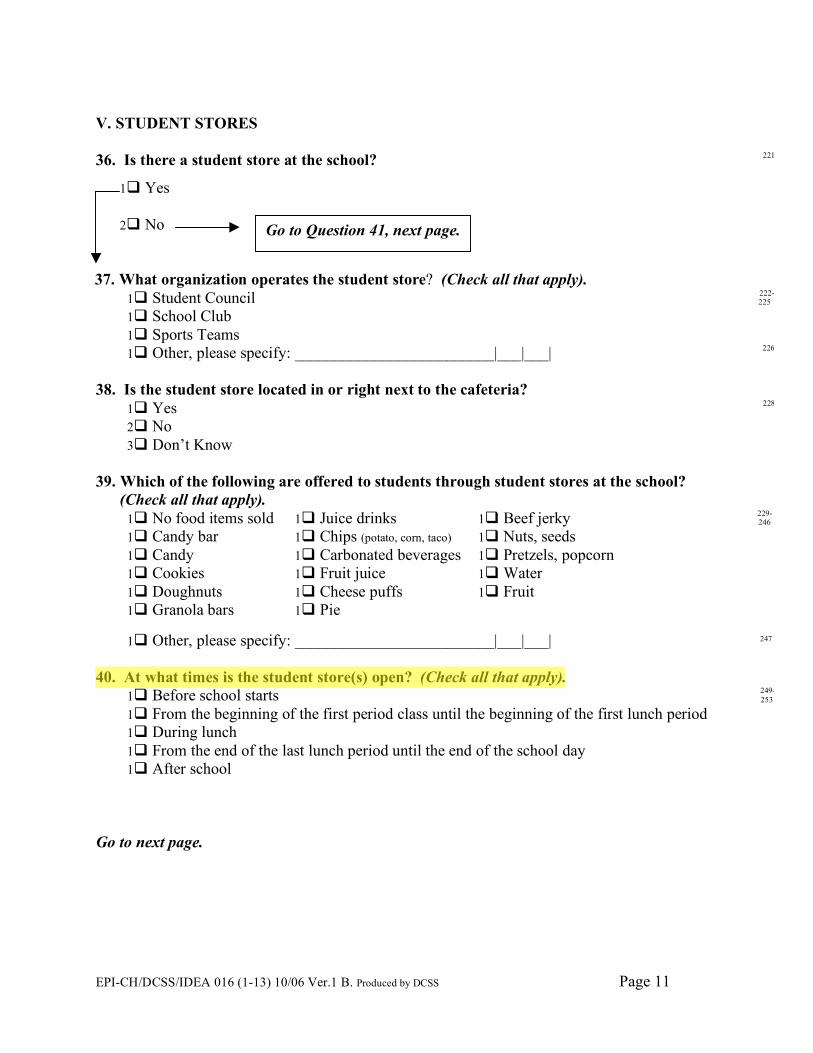
EPI-CH/DCSS/IDEA 016 (1-13) 10/06 Ver.1 B. Produced by DCSS Page 11
V. STUDENT STORES 36. Is there a student store at the school? 221
1 Yes 2 No
37. What organization operates the student store? (Check all that apply).
1 Student Council 222- 225
1 School Club 1 Sports Teams 1 Other, please specify: _________________________|___|___| 226
38. Is the student store located in or right next to the cafeteria?
1 Yes 228
2 No 3 Don’t Know
39. Which of the following are offered to students through student stores at the school?
(Check all that apply). 1 No food items sold 1 Juice drinks 1 Beef jerky 229-
246
1 Candy bar 1 Chips (potato, corn, taco) 1 Nuts, seeds 1 Candy 1 Carbonated beverages 1 Pretzels, popcorn 1 Cookies 1 Fruit juice 1 Water 1 Doughnuts 1 Cheese puffs 1 Fruit 1 Granola bars 1 Pie 1 Other, please specify: _________________________|___|___|
247
40. At what times is the student store(s) open? (Check all that apply).
1 Before school starts 249- 253
1 From the beginning of the first period class until the beginning of the first lunch period 1 During lunch 1 From the end of the last lunch period until the end of the school day 1 After school
Go to next page.
Go to Question 41, next page.

EPI-CH/DCSS/IDEA 016 (1-13) 10/06 Ver.1 B. Produced by DCSS Page 12
VI. STUDENT CLUBS 41. On average how often do clubs offer food items for sale to students at the school
during the school day? 1 Daily 254
2 More than once a week 3 Once a week 4 Once every two weeks 5 Once a month 6 Less than once a month
42. Which of the following foods are sold to students through club sales at the school
during the school day? (Check all that apply). 1 Chocolate candy 1 Chips (potato, corn, taco) 255-
265
1 Non-chocolate candy 1 Soft drinks, sports drinks, or fruit drinks 1 Baked goods, not low in fat 1 Pizza 1 Low-fat baked goods 1 Subs/hoagies 1 100% fruit or vegetable juice 1 Fruits or vegetables 1 Other, please specify: _________________________|___|___| 266
43. Do club food sales ever occur in the cafeteria during lunchtime?
1 Yes 268
2 No 3 Don’t Know
VII. DEMOGRAPHICS 44. What is your gender?
1 Male 269
2 Female 45. What is your current job title?
1 Principal 270
2 Associate/Assistant Principal
3 Other, please specify: ___________________________|___|___| 271
46. How many years have you served in this position?
1 Less than 1 year 273
2 1-5 years
3 6-10 years
4 More than 10 years
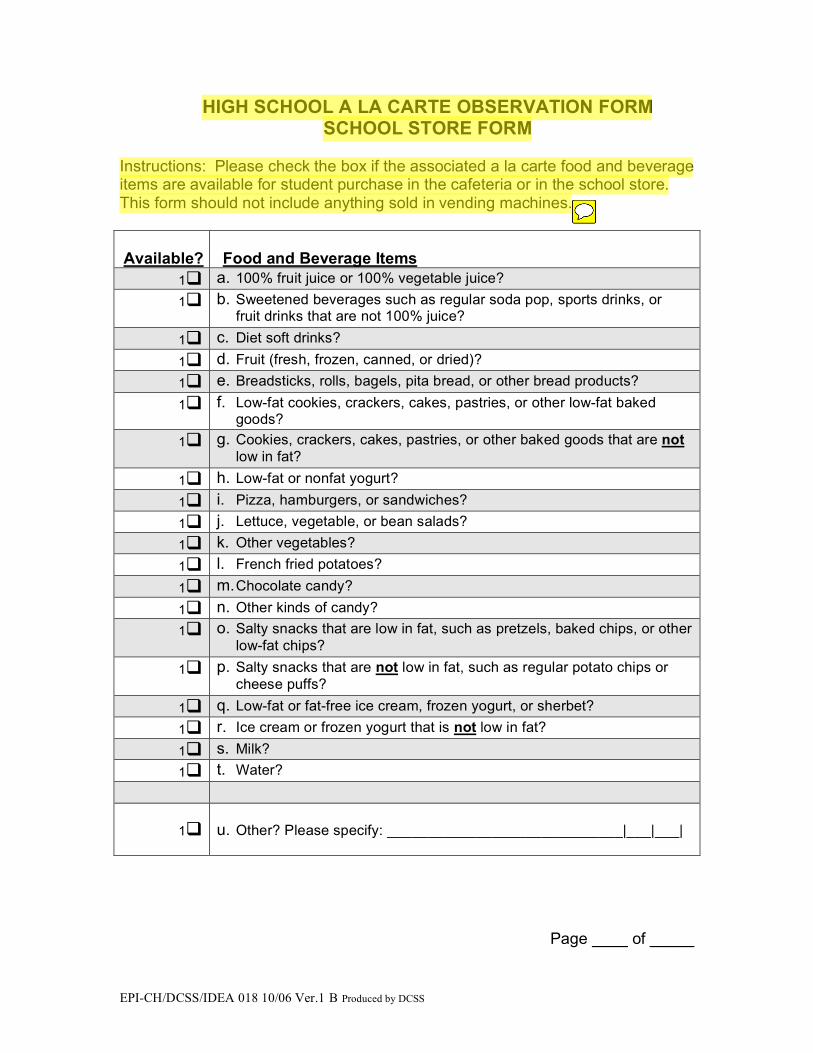
EPI-CH/DCSS/IDEA 018 10/06 Ver.1 B Produced by DCSS
HIGH SCHOOL A LA CARTE OBSERVATION FORM SCHOOL STORE FORM
Instructions: Please check the box if the associated a la carte food and beverage items are available for student purchase in the cafeteria or in the school store. This form should not include anything sold in vending machines.
Available?
Food and Beverage Items
1 a. 100% fruit juice or 100% vegetable juice? 1 b. Sweetened beverages such as regular soda pop, sports drinks, or
fruit drinks that are not 100% juice? 1 c. Diet soft drinks? 1 d. Fruit (fresh, frozen, canned, or dried)? 1 e. Breadsticks, rolls, bagels, pita bread, or other bread products? 1 f. Low-fat cookies, crackers, cakes, pastries, or other low-fat baked
goods? 1 g. Cookies, crackers, cakes, pastries, or other baked goods that are not
low in fat? 1 h. Low-fat or nonfat yogurt? 1 i. Pizza, hamburgers, or sandwiches? 1 j. Lettuce, vegetable, or bean salads? 1 k. Other vegetables? 1 l. French fried potatoes? 1 m. Chocolate candy? 1 n. Other kinds of candy? 1 o. Salty snacks that are low in fat, such as pretzels, baked chips, or other
low-fat chips? 1 p. Salty snacks that are not low in fat, such as regular potato chips or
cheese puffs? 1 q. Low-fat or fat-free ice cream, frozen yogurt, or sherbet? 1 r. Ice cream or frozen yogurt that is not low in fat? 1 s. Milk? 1 t. Water?
1 u. Other? Please specify: _____________________________|___|___|
Page ____ of _____
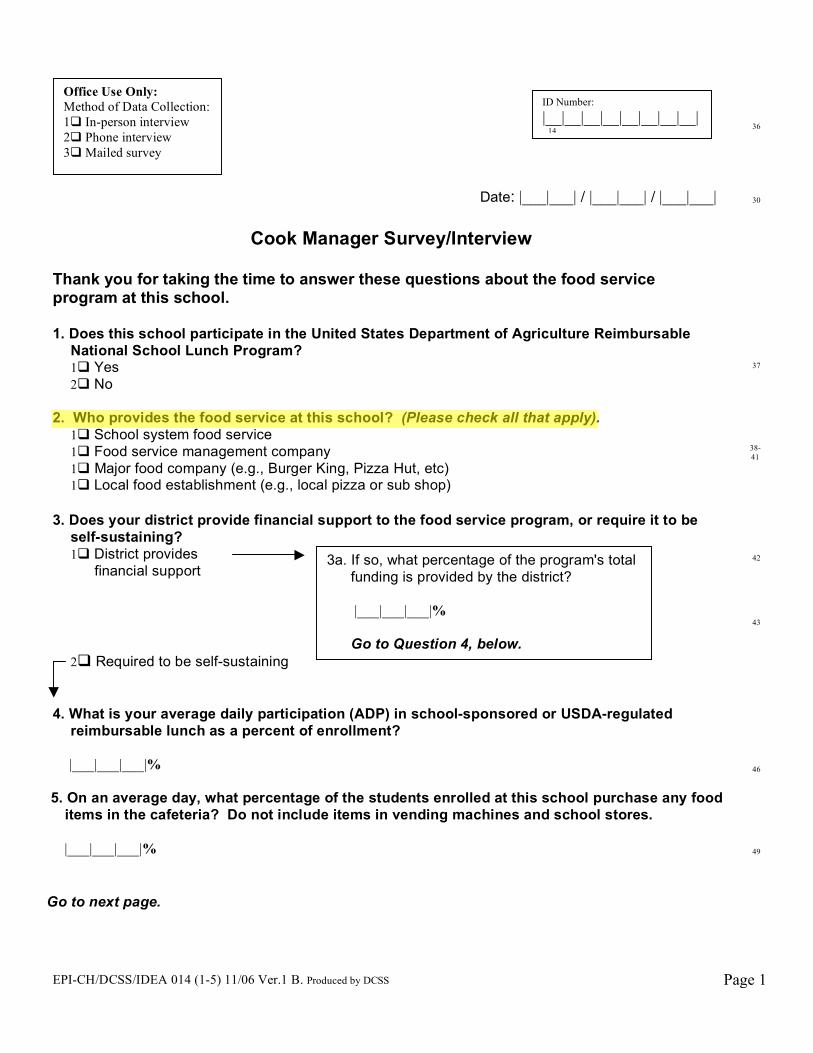
EPI-CH/DCSS/IDEA 014 (1-5) 11/06 Ver.1 B. Produced by DCSS
Page 1
Date: |___|___| / |___|___| / |___|___|
Cook Manager Survey/Interview
Thank you for taking the time to answer these questions about the food service program at this school. 1. Does this school participate in the United States Department of Agriculture Reimbursable
National School Lunch Program? 1 Yes 2 No
2. Who provides the food service at this school? (Please check all that apply). 1 School system food service 1 Food service management company 1 Major food company (e.g., Burger King, Pizza Hut, etc) 1 Local food establishment (e.g., local pizza or sub shop) 3. Does your district provide financial support to the food service program, or require it to be
self-sustaining? 1 District provides
financial support
2 Required to be self-sustaining 4. What is your average daily participation (ADP) in school-sponsored or USDA-regulated
reimbursable lunch as a percent of enrollment? |___|___|___|%
5. On an average day, what percentage of the students enrolled at this school purchase any food items in the cafeteria? Do not include items in vending machines and school stores.
|___|___|___|% Go to next page.
36
30
37
38- 41
42
43
46
49
Office Use Only: Method of Data Collection: 1 In-person interview 2 Phone interview 3 Mailed survey
ID Number: |__|__|__|__|__|__|__|__| 14
3a. If so, what percentage of the program's total funding is provided by the district? |___|___|___|% Go to Question 4, below.
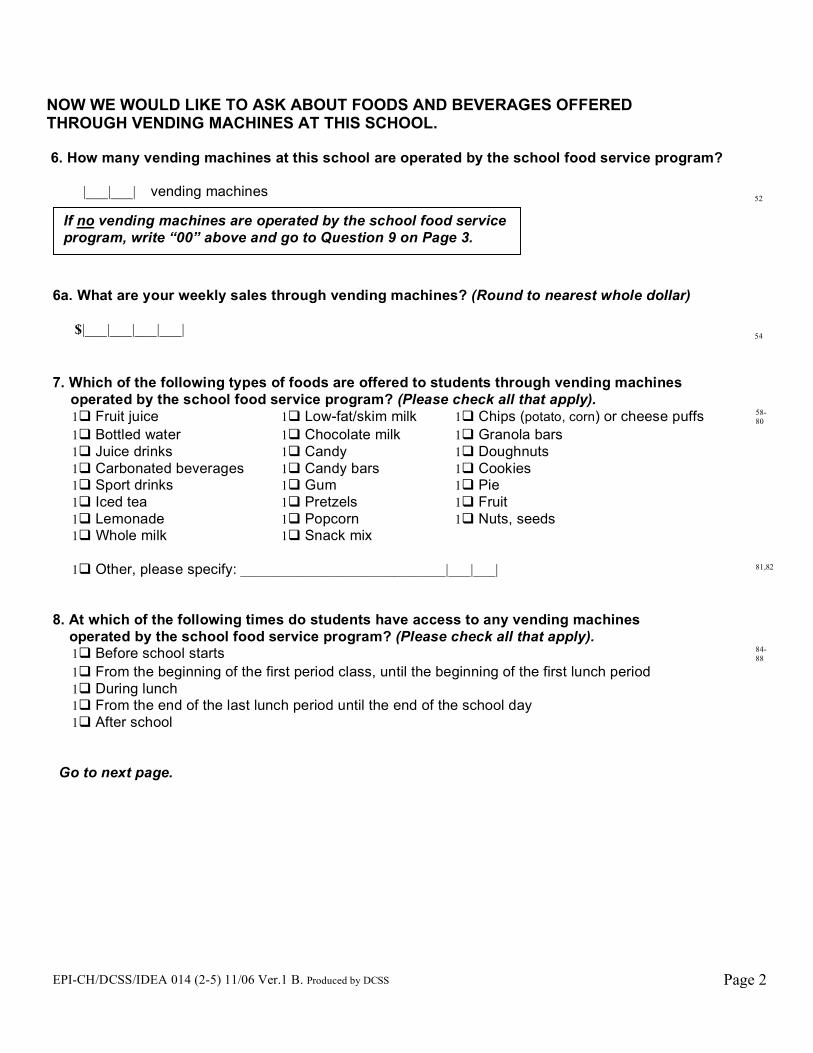
EPI-CH/DCSS/IDEA 014 (2-5) 11/06 Ver.1 B. Produced by DCSS
Page 2
NOW WE WOULD LIKE TO ASK ABOUT FOODS AND BEVERAGES OFFERED THROUGH VENDING MACHINES AT THIS SCHOOL. 6. How many vending machines at this school are operated by the school food service program? |___|___| vending machines 6a. What are your weekly sales through vending machines? (Round to nearest whole dollar)
$|___|___|___|___|
7. Which of the following types of foods are offered to students through vending machines operated by the school food service program? (Please check all that apply). 1 Fruit juice 1 Low-fat/skim milk 1 Chips (potato, corn) or cheese puffs 58-
80
1 Bottled water 1 Chocolate milk 1 Granola bars
1 Juice drinks 1 Candy 1 Doughnuts
1 Carbonated beverages 1 Candy bars 1 Cookies
1 Sport drinks 1 Gum 1 Pie
1 Iced tea 1 Pretzels 1 Fruit
1 Lemonade 1 Popcorn 1 Nuts, seeds
1 Whole milk 1 Snack mix
1 Other, please specify: ____________________________|___|___|
81,82
8. At which of the following times do students have access to any vending machines operated by the school food service program? (Please check all that apply).
1 Before school starts 84- 88
1 From the beginning of the first period class, until the beginning of the first lunch period
1 During lunch
1 From the end of the last lunch period until the end of the school day
1 After school
Go to next page.
52 54
If no vending machines are operated by the school food service program, write “00” above and go to Question 9 on Page 3.
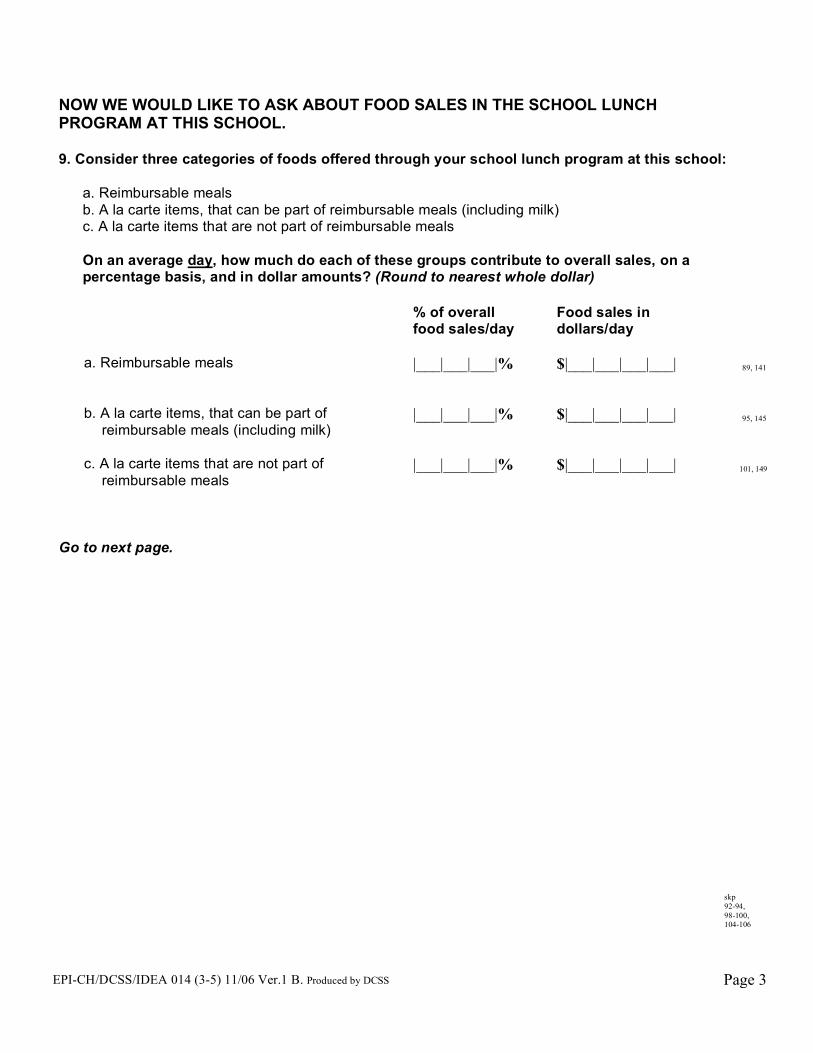
EPI-CH/DCSS/IDEA 014 (3-5) 11/06 Ver.1 B. Produced by DCSS
Page 3
NOW WE WOULD LIKE TO ASK ABOUT FOOD SALES IN THE SCHOOL LUNCH PROGRAM AT THIS SCHOOL. 9. Consider three categories of foods offered through your school lunch program at this school: a. Reimbursable meals b. A la carte items, that can be part of reimbursable meals (including milk) c. A la carte items that are not part of reimbursable meals
On an average day, how much do each of these groups contribute to overall sales, on a percentage basis, and in dollar amounts? (Round to nearest whole dollar)
% of overall
food sales/day Food sales in dollars/day
a. Reimbursable meals
|___|___|___|% $|___|___|___|___| 89, 141
b. A la carte items, that can be part of reimbursable meals (including milk)
|___|___|___|% $|___|___|___|___| 95, 145
c. A la carte items that are not part of reimbursable meals
|___|___|___|% $|___|___|___|___| 101, 149
Go to next page.
skp 92-94, 98-100, 104-106

EPI-CH/DCSS/IDEA 014 (4-5) 11/06 Ver.1 B. Produced by DCSS
Page 4
A La Carte Foods Consider types of a la carte foods that are offered to students through the food service program (not counting items available in vending machines or in school stores). During a typical week, what are the five top-selling food items (on an item by item basis, not in terms of dollar amounts)? First check the five top-selling a la carte food categories, then select the top-selling category.
10. Please check the five top-selling a la carte food categories, HERE:
11. Of those five, please check the one top-selling category, HERE:
1 01 a. 100% fruit juice or 100% vegetable juice? 1 02 b. Sweetened beverages such as regular soda pop, sports
drinks, or fruit drinks that are not 100% juice? 1 03 c. Diet soft drinks 1 04 d. Fruit (fresh, frozen, canned, or dried)? 1 05 e. Bread sticks, rolls, bagels, pita bread, or other bread
products? 1 06 f. Low-fat cookies, crackers, cakes, pastries, or other low-fat
baked goods? 1 07 g. Cookies, crackers, cakes, pastries, or other baked goods
that are not low in fat? 1 08 h. Low-fat or nonfat yogurt? 1 09 i. Pizza, hamburgers, or sandwiches? 1 10 j. Lettuce, vegetable, or bean salads? 1 11 k. Other vegetables? 1 12 l. French fried potatoes? 1 13 m. Chocolate candy? 1 14 n. Other kinds of candy? 1 15 o. Salty snacks that are low in fat, such as pretzels, baked
chips, or other low-fat chips? 1 16 p. Salty snacks that are not low in fat, such as regular potato
chips, or cheese puffs? 1 17 q. Low-fat or fat-free ice cream, frozen yogurt, or sherbet? 1 18 r. Ice cream or frozen yogurt that is not low in fat? 1 19 s. Milk? 1 20 t. Water?
1 21 u. Other, please specify: _________________________|___|___|
107-127 128 130
Go to next page.

EPI-CH/DCSS/IDEA 014 (5-5) 11/06 Ver.1 B. Produced by DCSS
Page 5
12. Do any commercial food vendors (like Pizza Hut, Taco Bell, Subway) offer food as part of the
lunch service? 1Yes 132
2No
13. If yes, what is offered? (please check all that apply)
1Traditional (“burger-and-fries”) fast food restaurant, such as McDonalds, Burger King, Arby’s, Wendy’s, White Castle
133-
137
1 Mexican fast food restaurant, such as Taco Bell, Taco Johns or Chipotle 1 Fried chicken, such as Kentucky Fried Chicken 1 Sandwich or sub shop, such as Subway, Panera, Quizinos 1 Pizza, such as Pizza Hut, Papa Johns, Davannis
14. How many days per week are these commercial foods offered?
1 One 138
2 Two 3 Three 4 Four 5 Five
LASTLY, WE WOULD LIKE TO ASK SOME QUESTIONS ABOUT YOU. 15. What is your gender?
1 Male 139
2 Female 16. How many years have you served in this position?
1 Less than 1 year 2 1-5 years 3 6-10 years 4 11-15 years 5 16-20 years 6 More than 20 years
140
eor 152
Go to Question 15, below.

Ammerman, AS, Benjamin, SE, Sommers, JK, Ward, DS. 2004. The Nutrition and Physical Activity Self-Assessment for Child Care (NAP SACC) environmental self-assessment instrument. Division of Public Health, NC DHHS, Raleigh, NC, and the Center for Health Promotion and Disease Prevention, University of North Carolina at Chapel Hill. Revised May 2007.
- 1 -
Your Name: Date:
Child Care Facility Name:
Please read each statement or question carefully and check the response that best fits your child care facility. Refer to the instruction sheet for clarification of question, examples, and definitions.
� �Fruit (not juice) is offered:
3 times per
week or less
4 times per
week
1 time per day 2 or more
times per day � �Fruit is offered canned � � � � �� � � (no syrups), fresh, or frozen: Rarely or
never
Some of the
time
Most of the
time
All of the time � �Vegetables (not including French fries, tater tots, hash browns, or dried beans) are offered:
2 times per
week or less
3-4 times per
week
1 time per day 2 or more
times per day � �Vegetables, other than potatoes, corn, and green beans, are offered:
Less than 1
time per week
1-2 times per
week
3-4 times per
week
1 or more
times per day �Cooked vegetables are prepared with added meat fat, margarine or butter:
All of the time Most of the
time
Some of the
time
Rarely or
never � �Fried or pre-fried potatoes (French fries, tater tots, hash browns) are offered:
3 or more
times per week
2 times per
week
1 time per
week
Less than
once a week or never � �
Fried or pre-fried (frozen and breaded) meats (chicken nuggets) or fish (fish sticks) are offered:
3 or more
times per week
2 times per
week
1 time per
week
Less than
once a week or never � �
High fat meats (sausage, bacon, hot dogs, bologna, ground beef) are offered:
3 or more
times per week
2 times per
week
1 time per
week
Less than
once a week or never

Ammerman, AS, Benjamin, SE, Sommers, JK, Ward, DS. 2004. The Nutrition and Physical Activity Self-Assessment for Child Care (NAP SACC) environmental self-assessment instrument. Division of Public Health, NC DHHS, Raleigh, NC, and the Center for Health Promotion and Disease Prevention, University of North Carolina at Chapel Hill. Revised May 2007.
- 2 -
� �Beans or lean meats (baked or broiled chicken, turkey, or fish) are offered:
Less than 1
time per week
1-2 times per
week
3-4 times per
week
1 or more
times per day �High fiber, whole grain foods (whole wheat bread, oatmeal,
brown rice, Cheerios , etc) are
offered:
1 time per
week or less
2-4 times per
week
1 times per
day
2 or more
times per day � �Sweets or salty foods (cookies, cakes, muffins, chips, etc) are offered:
1 or more
times per day
3-4 times per
week
1-2 times per
week
Less than
once a week or never � �
Drinking water outside is: Not visible Visible, but
only available during designated water breaks
Easily visible
and available on request
Easily visible
and available for self-serve � �
Drinking water inside is: Not visible Visible, but
only available during designated water breaks
Easily visible
and available on request
Easily visible
and available for self-serve � �
100% fruit juice is offered: 2 or more
times per day
1 time per
day
3-4 times per
week
2 times per
week or less � �Sugary drinks (Kool-Aid
TM, sports
drinks, sweet tea, punches, soda) other than 100% juice are offered:
1 or more
times per week
Less than 1
time per week
Less than 1
time per month
Rarely or
never �Milk served to children ages 2 years and older is usually: Whole or
regular
2% reduced
fat
1% low-fat Skim or
non-fat � �Soda and other vending machines are located: In entrance or
front of building
In public
areas, but not entrance
Out of sight of
parents and children
No vending
machines on site � �Menus used are:
1-week cycle 2-week cycle 3-week cycle
or more without seasonal change
3-week cycle
or more with seasonal change � �
Weekly menus include a combination of both new and familiar foods:
Rarely or
never
Some of the
time
Most of the
time
All of the time
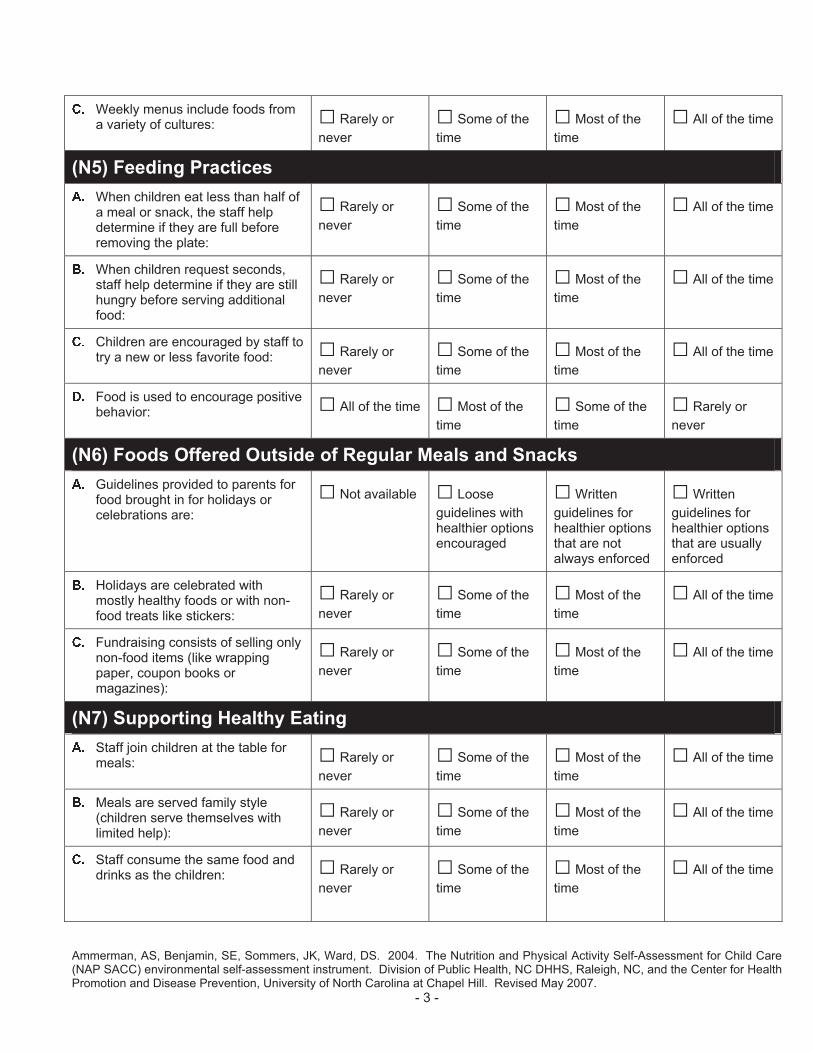
Ammerman, AS, Benjamin, SE, Sommers, JK, Ward, DS. 2004. The Nutrition and Physical Activity Self-Assessment for Child Care (NAP SACC) environmental self-assessment instrument. Division of Public Health, NC DHHS, Raleigh, NC, and the Center for Health Promotion and Disease Prevention, University of North Carolina at Chapel Hill. Revised May 2007.
- 3 -
� �Weekly menus include foods from a variety of cultures: Rarely or
never
Some of the
time
Most of the
time
All of the time � �When children eat less than half of a meal or snack, the staff help determine if they are full before removing the plate:
Rarely or
never
Some of the
time
Most of the
time
All of the time � �When children request seconds, staff help determine if they are still hungry before serving additional food:
Rarely or
never
Some of the
time
Most of the
time
All of the time � �Children are encouraged by staff to try a new or less favorite food: Rarely or
never
Some of the
time
Most of the
time
All of the time � �Food is used to encourage positive behavior: All of the time Most of the
time
Some of the
time
Rarely or
never � �Guidelines provided to parents for food brought in for holidays or celebrations are:
Not available Loose
guidelines with healthier options encouraged
Written
guidelines for healthier options that are not always enforced
Written
guidelines for healthier options that are usually enforced � �
Holidays are celebrated with mostly healthy foods or with non-food treats like stickers:
Rarely or
never
Some of the
time
Most of the
time
All of the time � �Fundraising consists of selling only non-food items (like wrapping paper, coupon books or magazines):
Rarely or
never
Some of the
time
Most of the
time
All of the time
� �Staff join children at the table for meals: Rarely or
never
Some of the
time
Most of the
time
All of the time � �Meals are served family style (children serve themselves with limited help):
Rarely or
never
Some of the
time
Most of the
time
All of the time � �Staff consume the same food and drinks as the children: Rarely or
never
Some of the
time
Most of the
time
All of the time
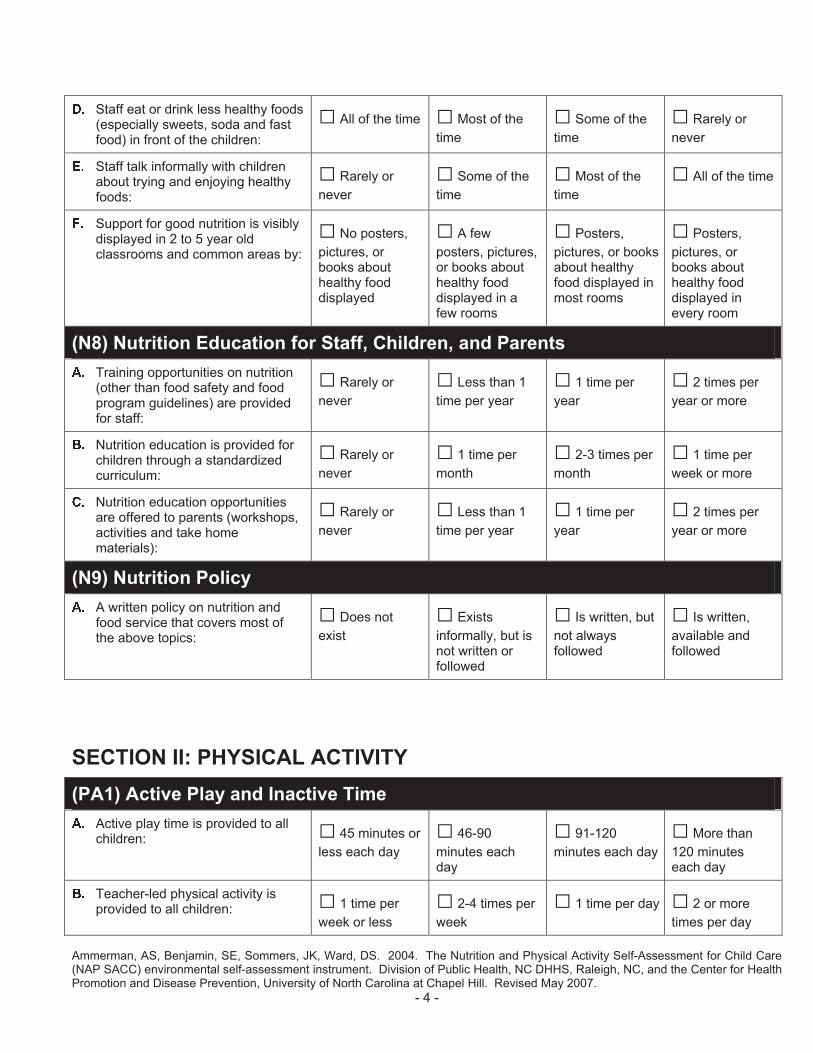
Ammerman, AS, Benjamin, SE, Sommers, JK, Ward, DS. 2004. The Nutrition and Physical Activity Self-Assessment for Child Care (NAP SACC) environmental self-assessment instrument. Division of Public Health, NC DHHS, Raleigh, NC, and the Center for Health Promotion and Disease Prevention, University of North Carolina at Chapel Hill. Revised May 2007.
- 4 -
� �Staff eat or drink less healthy foods (especially sweets, soda and fast food) in front of the children:
All of the time Most of the
time
Some of the
time
Rarely or
never �Staff talk informally with children about trying and enjoying healthy foods:
Rarely or
never
Some of the
time
Most of the
time
All of the time � �Support for good nutrition is visibly displayed in 2 to 5 year old classrooms and common areas by:
No posters,
pictures, or books about healthy food displayed
A few
posters, pictures, or books about healthy food displayed in a few rooms
Posters,
pictures, or books about healthy food displayed in most rooms
Posters,
pictures, or books about healthy food displayed in every room � �
Training opportunities on nutrition (other than food safety and food program guidelines) are provided for staff:
Rarely or
never
Less than 1
time per year
1 time per
year
2 times per
year or more � �Nutrition education is provided for children through a standardized curriculum:
Rarely or
never
1 time per
month
2-3 times per
month
1 time per
week or more � �Nutrition education opportunities are offered to parents (workshops, activities and take home materials):
Rarely or
never
Less than 1
time per year
1 time per
year
2 times per
year or more � �A written policy on nutrition and food service that covers most of the above topics:
Does not
exist
Exists
informally, but is not written or followed
Is written, but
not always followed
Is written,
available and followed
� �Active play time is provided to all children:
45 minutes or
less each day
46-90
minutes each day
91-120
minutes each day
More than
120 minutes each day � �
Teacher-led physical activity is provided to all children: 1 time per
week or less
2-4 times per
week
1 time per day 2 or more
times per day

Ammerman, AS, Benjamin, SE, Sommers, JK, Ward, DS. 2004. The Nutrition and Physical Activity Self-Assessment for Child Care (NAP SACC) environmental self-assessment instrument. Division of Public Health, NC DHHS, Raleigh, NC, and the Center for Health Promotion and Disease Prevention, University of North Carolina at Chapel Hill. Revised May 2007.
- 5 -
� �Outdoor active play is provided for all children: 1 time per
week or less
2-4 times per
week
1 time per day 2 or more
times per day � �Active play time is withheld for children who misbehave: Often Sometimes Never Never and
we provide more active play time for good behavior �
Children are seated (excluding naps and meals) more than 30 minutes at a time:
1 or more
times per day
3-4 times per
week
1-2 times per
week
Less than
once a week or never � �
Television and video use consists of the: TV turned on
for 5 or more hours per week
TV turned on
for 3-4 hours per week
TV turned on
2 hours per week or less
TV used
rarely or never � �Fixed play equipment (tunnels, balancing equipment, climbing equipment, overhead ladders) is:
Unavailable
at our site
Only one
type of equipment is available
Different
equipment available that suits most children
Wide variety
of equipment available and accommodates needs of all children � �
Portable play equipment (wheel toys, balls, hoops, ribbons) consists of:
Little variety
and children must take turns
Some variety
but children must take turns
Good variety
but children must take turns
Lots of
variety for children to use at the same time � �
Outdoor portable play equipment is: Available
during special times only
Located out
of child sight and reach, staff must access
Available on
request Freely
available by children at all times � �
Outdoor play space includes: No open
running spaces or track/path for wheeled toys
Very limited
open running space, no track/path for wheeled toys
Plenty of open
running space, no track/path for wheeled toys
Plenty of
open running spaces and a track/path for wheeled toys �
Indoor play space is available:
For quiet play
only
For very
limited movement (jumping and rolling)
For some
active play (jumping, rolling and skipping)
For all
activities, including running

� �During active play time staff:
Supervise
play only (mostly sit or stand)
Sometimes
encourage children to be active
Sometimes
encourage children to be active and join children in active play
Often
encourage children to be active and join children in active play � �
Support for physical activity is visibly displayed in 2 to 5 year old classrooms and common areas by:
No posters,
pictures, or books about physical activity displayed
A few
posters, pictures, or books about physical activity displayed in a few rooms
Posters,
pictures, or books about physical activity are displayed in most rooms
Posters,
pictures, or books about physical activity are displayed in every room � �
Training opportunities are provided for staff in physical activity (not including playground safety):
Rarely or
never
Less than 1
time per year
1 time per
year
2 times per
year or more � �Physical activity education (motor-skill development) is provided for children through a standardized curriculum:
Rarely or
never
1 time per
month
2-3 times per
month
1 time per
week or more � �Physical activity education is offered to parents (workshops, activities and take home materials):
Rarely or
never
Less than 1
time per year
1 time per
year
2 times per
year or more � �A written policy on physical activity that covers most of the above topics:
Does not
exist
Exists
informally, but is not written or followed
Is written, but
not always followed
Is written,
available and followed
For more information about this self-assessment instrument and the NAP SACC project, please visit www.napsacc.org. � � � � � � � � � � � � � � � � � � � � � � � � � � � � � � � � � � � � � � � � � � � � � � � � � � � � � � � � � �
Ammerman, AS, Benjamin, SE, Sommers, JK, Ward, DS. 2004. The Nutrition and Physical Activity Self-Assessment for Child Care (NAP SACC) environmental self-assessment instrument. Division of Public Health, NC DHHS, Raleigh, NC, and the Center for Health Promotion and Disease Prevention, University of North Carolina at Chapel Hill. Revised May 2007.
State of North Carolina Michael F. Easley, Governor Department of Health and Human Services Carmen Hooker Odom, Secretary
Division of Public Health NC Healthy Weight Initiative
Department of Nutrition UNC Schools of Public Health and Medicine UNC Center for Health Promotion and Disease Prevention
- 6 -
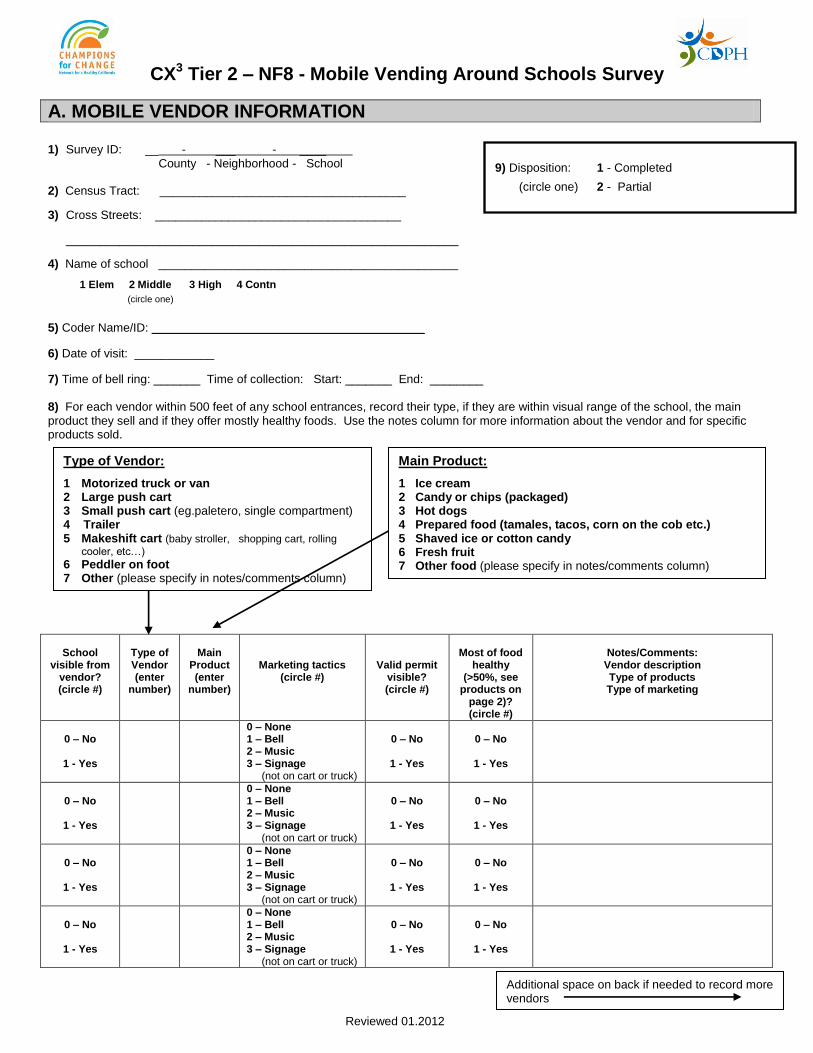
Reviewed 01.2012
CX3 Tier 2 – NF8 - Mobile Vending Around Schools Survey
A. MOBILE VENDOR INFORMATION
1) Survey ID: __ - ___ - ____
County - Neighborhood - School 2) Census Tract: _____________________________________
3) Cross Streets: _____________________________________
___________________________________________________________
4) Name of school _____________________________________________
5) Coder Name/ID: _________________________________________
6) Date of visit: ____________
7) Time of bell ring: _______ Time of collection: Start: _______ End: ________
8) For each vendor within 500 feet of any school entrances, record their type, if they are within visual range of the school, the main
product they sell and if they offer mostly healthy foods. Use the notes column for more information about the vendor and for specific products sold.
School
visible from vendor? (circle #)
Type of Vendor (enter
number)
Main
Product (enter
number)
Marketing tactics (circle #)
Valid permit visible? (circle #)
Most of food
healthy (>50%, see
products on page 2)? (circle #)
Notes/Comments:
Vendor description Type of products Type of marketing
0 – No
1 - Yes
0 – None 1 – Bell 2 – Music 3 – Signage (not on cart or truck)
0 – No
1 - Yes
0 – No
1 - Yes
0 – No
1 - Yes
0 – None 1 – Bell 2 – Music 3 – Signage (not on cart or truck)
0 – No
1 - Yes
0 – No
1 - Yes
0 – No
1 - Yes
0 – None 1 – Bell 2 – Music 3 – Signage (not on cart or truck)
0 – No
1 - Yes
0 – No
1 - Yes
0 – No
1 - Yes
0 – None 1 – Bell 2 – Music 3 – Signage (not on cart or truck)
0 – No
1 - Yes
0 – No
1 - Yes
9) Disposition: 1 - Completed
(circle one) 2 - Partial
1 Elem 2 Middle 3 High 4 Contn
(circle one)
Main Product:
1 Ice cream 2 Candy or chips (packaged) 3 Hot dogs 4 Prepared food (tamales, tacos, corn on the cob etc.) 5 Shaved ice or cotton candy 6 Fresh fruit 7 Other food (please specify in notes/comments column)
Type of Vendor:
1 Motorized truck or van 2 Large push cart 3 Small push cart (eg.paletero, single compartment) 4 Trailer 5 Makeshift cart (baby stroller, shopping cart, rolling
cooler, etc…)
6 Peddler on foot 7 Other (please specify in notes/comments column)
Additional space on back if needed to record more vendors

2
School
visible from vendor? (circle #)
Type of Vendor (enter
number)
Main
Product (enter
number)
Marketing tactics (circle #)
Valid permit visible? (circle #)
Most of food
healthy (>50%, see products below)? (circle #)
Notes/Comments:
Vendor description Type of products Type of marketing
0 – No
1 - Yes
0 – None 1 – Bell 2 – Music 3 – Signage (not on cart or truck)
0 – No
1 - Yes
0 – No
1 - Yes
0 – No
1 - Yes
0 – None 1 – Bell 2 – Music 3 – Signage (not on cart or truck)
0 – No
1 - Yes
0 – No
1 - Yes
0 – No
1 - Yes
0 – None 1 – Bell 2 – Music 3 – Signage (not on cart or truck)
0 – No
1 - Yes
0 – No
1 - Yes
0 – No
1 - Yes
0 – None 1 – Bell 2 – Music 3 – Signage (not on cart or truck)
0 – No
1 - Yes
0 – No
1 - Yes
0 – No
1 - Yes
0 – None 1 – Bell 2 – Music 3 – Signage (not on cart or truck)
0 – No
1 - Yes
0 – No
1 - Yes
0 – No
1 - Yes
0 – None 1 – Bell 2 – Music 3 – Signage (not on cart or truck)
0 – No
1 - Yes
0 – No
1 - Yes
0 – No
1 - Yes
0 – None 1 – Bell 2 – Music 3 – Signage (not on cart or truck)
0 – No
1 - Yes
0 – No
1 - Yes
Unhealthy foods and beverages are high in calories, sugar and/or fat, and/or sodium; foods that are cooked in an unhealthy way are fried
or prepared with trans fats, saturated fats or sauces high in calories, sugar and/or fat, and/or sodium; some examples are:
Foods: hamburgers, hot dogs, burritos/ tacos (with high fat meats or sauces), pizza (with high fat meat, regular amt. cheese or deep dish), fried
chicken or fish, chicken nuggets (fried not baked), deli sandwiches (with high fat meats), egg dishes (egg/muffin, egg sandwich), fried vegetables (including french fries), fried rice or fried noodles, salads made with mayo (potato, macaroni, cole slaw), cesar salad (dressing pre-mixed), fried chips
Beverages: shakes, soft drinks/soda, diet drinks, sports drinks, energy drinks, flavored & sweetened water, lemonade, sweet tea
Healthy foods are fruits, vegetables, whole grains, beans, nuts and seeds, non-fat and low fat milk products, lean meat, poultry and fish with
minimal or no added fat, sugars or sweeteners. Foods that are cooked in a healthy way are baked, broiled, roasted, grilled, or steamed. Some healthier options include:
Entree or sandwich with grilled/roast chicken, turkey or fish
Veggie, turkey or salmon burger
Salad entree w/ grilled chicken/turkey and low fat dressing
Tofu (not deep fried) and vegetable entree
Steamed dumplings or steamed spring rolls
Vegetable soup (not cream based)
Pasta marinara (vegetarian tomato sauce)
Vegetables w/out sauce/dressing or with low fat sauce/dressing
Main Product:
1 Ice cream 2 Candy or chips (packaged) 3 Hot dogs 4 Prepared food (tamales, tacos, corn on the cob etc.) 5 Shaved ice or cotton candy 6 Fresh fruit 7 Other food (please specify in notes/comments column)
Type of Vendor:
1 Motorized truck or van 2 Large push cart 3 Small push cart (eg.paletero, single compartment) 4 Trailer 5 Makeshift cart (baby stroller, shopping cart, rolling
cooler, etc…)
6 Peddler on foot 7 Other (please specify in notes/comments column)
Garden side salad
Whole grain option (whole wheat bread, tortilla, pasta, pizza crust, pita, or brown rice)
Bowl instead of burrito option
Plain rice
Vegetarian beans
Non-fat/low fat yogurt or milk
100% juice
Unsweetened iced tea/coffee
Instrument informed by June Tester, MD, MPH, Children’s Hospital and Research Center, Oakland; Tester JM, et.al. Mobile Food Vending and the After-School Food Environment American Journal of Preventive Medicine Jan 2010 2010;38(1):70-73.

Name: ____________________________ Date:______________________ Study Area: ___________________
Segment Number:___________________ Time:______________________ Weather:_____________________
0. Segment type If no sidewalk,skip now to section C. 24. Bicycle facilities (all that apply)
Low volume road 1 11. Curb cuts Bicycle route signs 1
High volume road 2 None 1 Striped bicycle lane designation 2
Bike or Ped path - skip section C 3 1 to 4 2 Visible bicycle parking facilities 3
> 4 3 Bicycle crossing warning 4
A. Environment No bicycle facilities 5
1. Uses in Segment (all that apply) 12. Sidewalk completeness/continuity
Housing - Single Family Detached 1 Sidewalk is complete 1
Housing - Multi-Family 2 Sidewalk is incomplete 2 D. Walking/Cycling Environment
Housing - Mobile Homes 3 25. Roadway/path lighting
Office/Institutional 4 13. Sidewalk connectivity to other Road-oriented lighting 1
Restaurant/Café/Commercial 5 sidewalks/crosswalks Pedestrian-scale lighting 2
Industrial 6 number of connections 1 Other lighting 3
Vacant/Undeveloped 7 No lighting 4
Recreation 8 C. Road Attributes (skip if path only)
14. Condition of road 26. Amenities (all that apply)
2. Slope Poor (many bumps/cracks/holes) 1 Public garbage cans 1
Flat 1 Fair (some bumps/cracks/holes) 2 Benches 2
Slight hill 2 Good (very few bumps/cracks/holes) 3 Water fountain 3
Steep hill 3 Under Repair 4 Street vendors/vending machines 4
No amenities 5
3. Segment Intersections 15. Number of lanes
Segment has 3 way intersection 1 Minimum # of lanes to cross 1 27. Are there wayfinding aids?
Segment has 4 way intersection 2 Maximum # of lanes to cross 1 No 1
Segment has other intersection 3 Yes 2
Segment deadends but path continues 4 16. Posted speed limit
Segment deadends 5 None posted 1 28. Number of trees shading walking area
Segment has no intersections 6 (mph): 1 None or Very Few 1
Some 2
B. Pedestrian Facility (skip if none present) 17. On-Street parking (if pavement is unmarked, Many/Dense 3
4. Type(s) of pedestrian facility (all that apply) check only if cars parked)
Footpath (worn dirt path) 1 Parallel or Diagonal 1 29. Degree of enclosure
Paved Trail 2 None 2 Little or no enclosure 1
Sidewalk 3 Some enclosure 2
Pedestrian Street (closed to cars) 4 18. Off-street parking lot spaces Highly enclosed 3
0-5 6-25 26+
The rest of the questions in section B refer 30. Powerlines along segment?
to the best pedestrian facility selected above. 1 2 3 Low Voltage/Distribution Line 1
5. Path material (all that apply) High Voltage/Transmission Line 2
Asphalt 1 19. Must you walk through a parking lot None 3
Concrete 2 to get to most buildings?
Paving Bricks or Flat Stone 3 Yes 1 31. Overall cleanliness and building maintenance
Gravel 4 No 2 Poor (much litter/graffiti/broken facilities) 1
Dirt or Sand 5 Fair (some litter/graffiti/broken facilities) 2
20. Presence of med-hi volume driveways Good (no litter/graffiti/broken facilities) 3
6. Path condition/maintenance < 2 1
Poor (many bumps/cracks/holes) 1 2 to 4 2 32. Articulation in building designs
Fair (some bumps/cracks/holes) 2 > 4 3 Little or no articulation 1
Good (very few bumps/cracks/holes) 3 Some articulation 2
Under Repair 4 21. Traffic control devices (all that apply) Highly articulated 3
Traffic light 1
7. Path obstructions (all that apply) Stop sign 2 33. Building setbacks from sidewalk
Poles or Signs 1 Traffic circle 3 At edge of sidewalk 1
Parked Cars 2 Speed bumps 4 Within 20 feet of sidewalk 2
Greenery 3 Chicanes or chokers 5 More than 20 feet from sidewalk 3
Garbage Cans 4 None 6
Other 5 34. Building height
None 6 22. Crosswalks Short 1
None 1 Medium 2
8. Buffers between road and path (all that apply) 1 to 2 2 Tall 3
Fence 1 3 to 4 3
Tress 2 > 4 4 35. Bus stops
Hedges 3 Bus stop with shelter 1
Landscape 4 23. Crossing Aids (all that apply) Bus stop with bench 2
Grass 5 Bus stop with signage only 3
None 6 Yield to Ped Paddles 1 No bus stop 4
Pedestrian Signal 2
9. Path Distance from Curb Median/Traffic Island 3 Subjective Assessment: Segment…
At edge 1 Curb Extension 4 Enter 1,2,3, or 4 for 1=Strongly Agree 2= Agree,
< 5 feet 2 Overpass/Underpass 5 3=Disagree, 4=Strongly Disagree
> 5 feel 3 Pedestrian Crossing Warning Sign 6 ……is attractive for walking. 1
Flashing Warning Light 7 ……is attractive for cycling. 1
10. Sidewalk Width Share the Road Warnign Sign 8 ……feels safe for walking. 1
< 4 feet 1 None 9 ……feels safe for cycling. 1
Between 4 and 8 feet 2
> 8 feet 3
Kelly J. Clifton, PhD - National Center for Smart Growth - University of Maryland, College Park
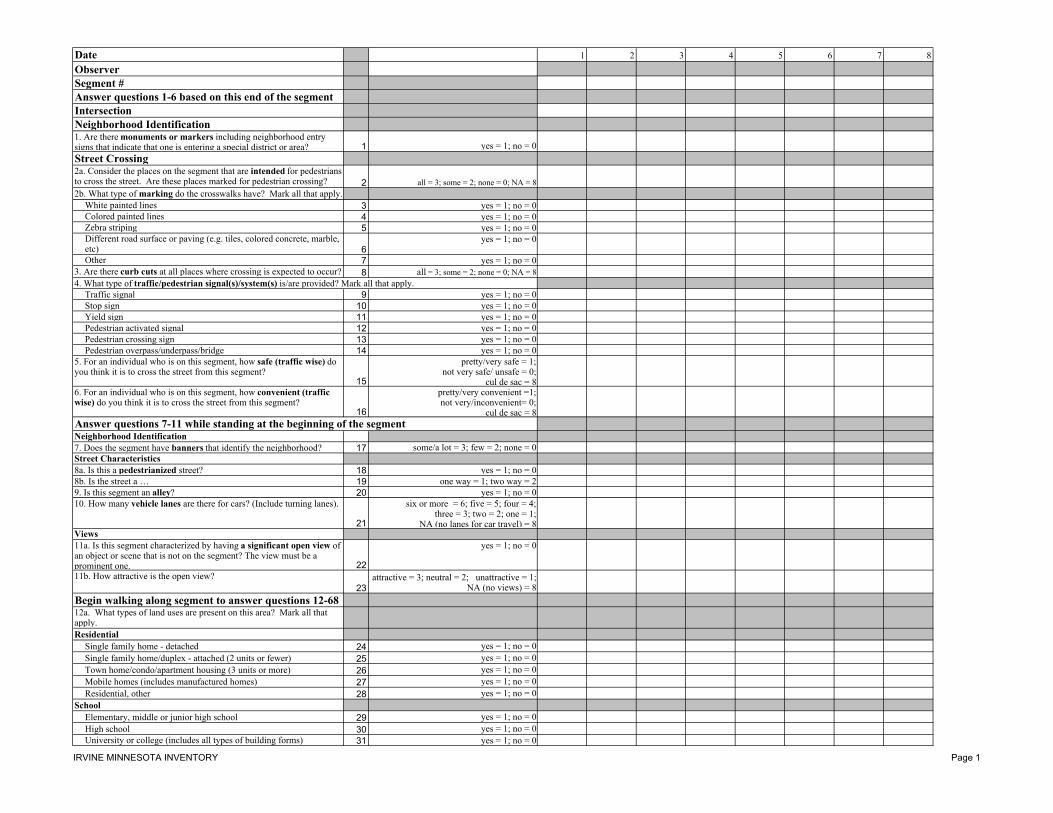
Date 1 2 3 4 5 6 7 8
ObserverSegment #Answer questions 1-6 based on this end of the segmentIntersectionNeighborhood Identification1. Are there monuments or markers including neighborhood entry signs that indicate that one is entering a special district or area? 1 yes = 1; no = 0
Street Crossing2a. Consider the places on the segment that are intended for pedestrians to cross the street. Are these places marked for pedestrian crossing? 2 all = 3; some = 2; none = 0; NA = 82b. What type of marking do the crosswalks have? Mark all that apply.
White painted lines 3 yes = 1; no = 0Colored painted lines 4 yes = 1; no = 0Zebra striping 5 yes = 1; no = 0Different road surface or paving (e.g. tiles, colored concrete, marble, etc) 6
yes = 1; no = 0
Other 7 yes = 1; no = 03. Are there curb cuts at all places where crossing is expected to occur? 8 all = 3; some = 2; none = 0; NA = 84. What type of traffic/pedestrian signal(s)/system(s) is/are provided? Mark all that apply.
Traffic signal 9 yes = 1; no = 0Stop sign 10 yes = 1; no = 0Yield sign 11 yes = 1; no = 0Pedestrian activated signal 12 yes = 1; no = 0Pedestrian crossing sign 13 yes = 1; no = 0Pedestrian overpass/underpass/bridge 14 yes = 1; no = 0
5. For an individual who is on this segment, how safe (traffic wise) do you think it is to cross the street from this segment?
15
pretty/very safe = 1; not very safe/ unsafe = 0;
cul de sac = 8 6. For an individual who is on this segment, how convenient (traffic wise) do you think it is to cross the street from this segment?
16
pretty/very convenient =1; not very/inconvenient= 0;
cul de sac = 8Answer questions 7-11 while standing at the beginning of the segmentNeighborhood Identification7. Does the segment have banners that identify the neighborhood? 17 some/a lot = 3; few = 2; none = 0Street Characteristics8a. Is this a pedestrianized street? 18 yes = 1; no = 08b. Is the street a … 19 one way = 1; two way = 29. Is this segment an alley? 20 yes = 1; no = 010. How many vehicle lanes are there for cars? (Include turning lanes).
21
six or more = 6; five = 5; four = 4; three = 3; two = 2; one = 1;
NA (no lanes for car travel) = 8Views11a. Is this segment characterized by having a significant open view of an object or scene that is not on the segment? The view must be a prominent one. 22
yes = 1; no = 0
11b. How attractive is the open view? 23
attractive = 3; neutral = 2; unattractive = 1; NA (no views) = 8
Begin walking along segment to answer questions 12-6812a. What types of land uses are present on this area? Mark all that apply.Residential
Single family home - detached 24 yes = 1; no = 0Single family home/duplex - attached (2 units or fewer) 25 yes = 1; no = 0Town home/condo/apartment housing (3 units or more) 26 yes = 1; no = 0Mobile homes (includes manufactured homes) 27 yes = 1; no = 0Residential, other 28 yes = 1; no = 0
SchoolElementary, middle or junior high school 29 yes = 1; no = 0High school 30 yes = 1; no = 0University or college (includes all types of building forms) 31 yes = 1; no = 0
IRVINE MINNESOTA INVENTORY Page 1
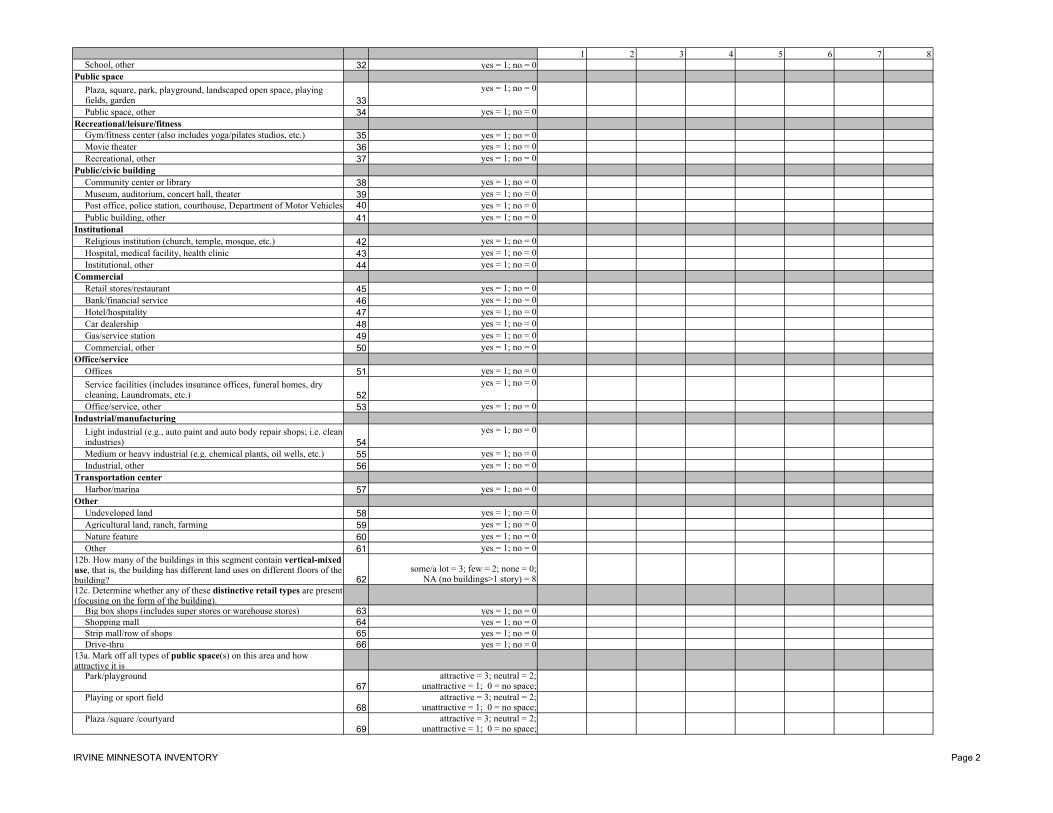
1 2 3 4 5 6 7 8School, other 32 yes = 1; no = 0
Public space
Plaza, square, park, playground, landscaped open space, playing fields, garden 33
yes = 1; no = 0
Public space, other 34 yes = 1; no = 0Recreational/leisure/fitness
Gym/fitness center (also includes yoga/pilates studios, etc.) 35 yes = 1; no = 0Movie theater 36 yes = 1; no = 0Recreational, other 37 yes = 1; no = 0
Public/civic buildingCommunity center or library 38 yes = 1; no = 0Museum, auditorium, concert hall, theater 39 yes = 1; no = 0Post office, police station, courthouse, Department of Motor Vehicles 40 yes = 1; no = 0Public building, other 41 yes = 1; no = 0
InstitutionalReligious institution (church, temple, mosque, etc.) 42 yes = 1; no = 0Hospital, medical facility, health clinic 43 yes = 1; no = 0Institutional, other 44 yes = 1; no = 0
CommercialRetail stores/restaurant 45 yes = 1; no = 0Bank/financial service 46 yes = 1; no = 0Hotel/hospitality 47 yes = 1; no = 0Car dealership 48 yes = 1; no = 0Gas/service station 49 yes = 1; no = 0Commercial, other 50 yes = 1; no = 0
Office/serviceOffices 51 yes = 1; no = 0
Service facilities (includes insurance offices, funeral homes, dry cleaning, Laundromats, etc.) 52
yes = 1; no = 0
Office/service, other 53 yes = 1; no = 0Industrial/manufacturing
Light industrial (e.g., auto paint and auto body repair shops; i.e. clean industries) 54
yes = 1; no = 0
Medium or heavy industrial (e.g. chemical plants, oil wells, etc.) 55 yes = 1; no = 0Industrial, other 56 yes = 1; no = 0
Transportation centerHarbor/marina 57 yes = 1; no = 0
OtherUndeveloped land 58 yes = 1; no = 0Agricultural land, ranch, farming 59 yes = 1; no = 0Nature feature 60 yes = 1; no = 0Other 61 yes = 1; no = 0
12b. How many of the buildings in this segment contain vertical-mixed use, that is, the building has different land uses on different floors of the building? 62
some/a lot = 3; few = 2; none = 0; NA (no buildings>1 story) = 8
12c. Determine whether any of these distinctive retail types are present (focusing on the form of the building).
Big box shops (includes super stores or warehouse stores) 63 yes = 1; no = 0Shopping mall 64 yes = 1; no = 0Strip mall/row of shops 65 yes = 1; no = 0Drive-thru 66 yes = 1; no = 0
13a. Mark off all types of public space(s) on this area and how attractive it is
Park/playground67
attractive = 3; neutral = 2; unattractive = 1; 0 = no space;
Playing or sport field68
attractive = 3; neutral = 2; unattractive = 1; 0 = no space;
Plaza /square /courtyard69
attractive = 3; neutral = 2; unattractive = 1; 0 = no space;
IRVINE MINNESOTA INVENTORY Page 2

1 2 3 4 5 6 7 8Public garden
70attractive = 3; neutral = 2;
unattractive = 1; 0 = no space; Beach
71attractive = 3; neutral = 2;
unattractive = 1; 0 = no space; Other
72attractive = 3; neutral = 2;
unattractive = 1; 0 = no space; 13b. Is it possible for the general public to use the public space(s)? 73 unclear = 2; yes = 1; no = 0Other Land Uses14. How many of these land uses are present on this segment?
Bars/night clubs 74 some/a lot = 3; few = 2; none = 0Adult uses 75 some/a lot = 3; few = 2; none = 0Check cashing stores/pawn shops/bail bond stores 76 some/a lot = 3; few = 2; none = 0Liquor stores 77 some/a lot = 3; few = 2; none = 0
15. How many of the following gathering places are on this segment?Restaurants 78 some/a lot = 3; few = 2; none = 0Coffee shops 79 some/a lot = 3; few = 2; none = 0Libraries/bookstores 80 some/a lot = 3; few = 2; none = 0“Corner” store 81 some/a lot = 3; few = 2; none = 0Art or craft galleries 82 some/a lot = 3; few = 2; none = 0Farmers market 83 yes = 1; no = 0
16. Are these nature features present on this segment? Open field/golf course 84 yes = 1; no = 0
Lake/pond 85 yes = 1; no = 0 Fountain/reflecting pool 86 yes = 1; no = 0 Stream/river/canal/creek 87 yes = 1; no = 0 Forest or woods 88 yes = 1; no = 0 Ocean 89 yes = 1; no = 0 Mountain or hills 90 yes = 1; no = 0 Desert 91 yes = 1; no = 0Barriers17. Are the following barriers present on this segment. Check all that apply, and whether barrier can be overcome e.g. there's a pedestrian bridge.
Highway (elevated or below ground)
92
no barrier = 0; can be overcome = 1; can be somewhat overcome = 2;
can not be overcome = 3Railroad track
93
no barrier = 0; can be overcome = 1; can be somewhat overcome = 2;
can not be overcome = 3Impassable land use (e.g., gated community, major industrial complex, etc.)
94
no barrier = 0; can be overcome = 1; can be somewhat overcome = 2;
can not be overcome = 3River
95
no barrier = 0; can be overcome = 1; can be somewhat overcome = 2;
can not be overcome = 3Drainage ditches
96
no barrier = 0; can be overcome = 1; can be somewhat overcome = 2;
can not be overcome = 3Road with 6 or more lanes
97
no barrier = 0; can be overcome = 1; can be somewhat overcome = 2;
can not be overcome = 3Other
98
no barrier = 0; can be overcome = 1; can be somewhat overcome = 2;
can not be overcome = 3Sidewalks18a. How many sides of the street have sidewalks? 99 count 1 or 218b. Is the sidewalk complete on one or both sides? 100 yes = 1; no = 0; 8 = NA18c. What is the condition or maintenance of the sidewalk?
101under repair = 2;
moderate or good = 1; poor = 0 18d. Is there a decorative or unique paving that covers most or all of the sidewalk on the segment? (e.g., bricks, tile, etc.) 102 yes = 1; no = 0
IRVINE MINNESOTA INVENTORY Page 3
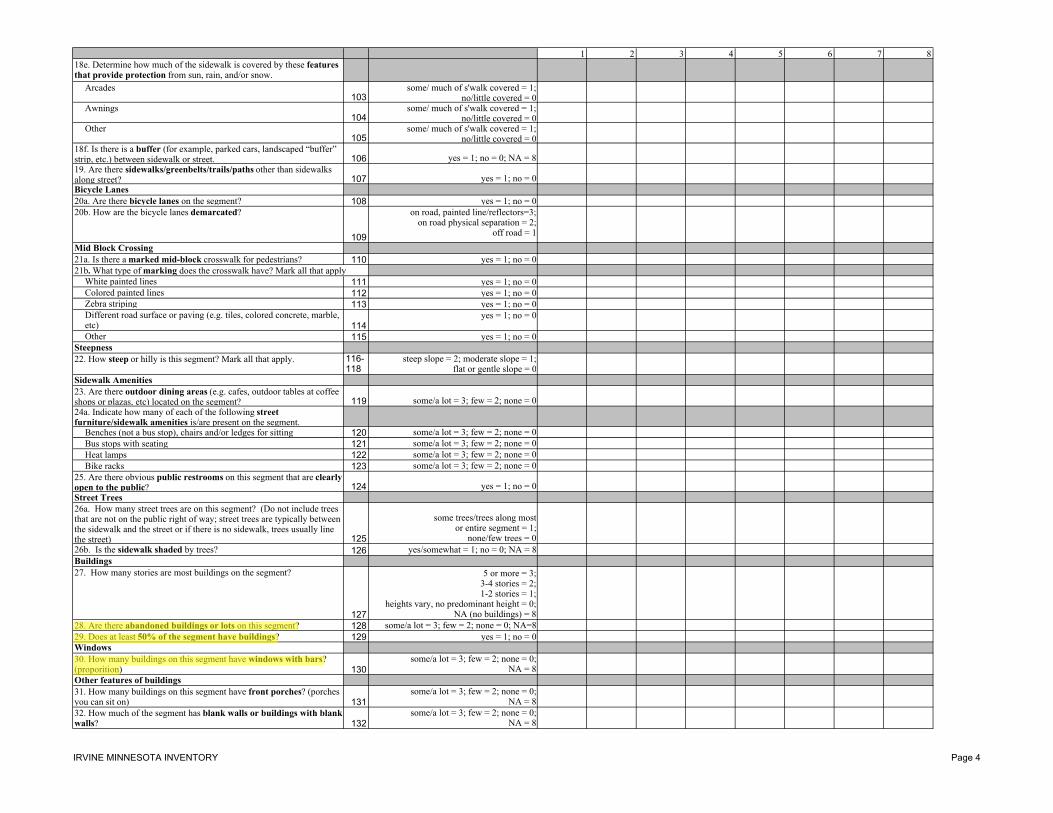
1 2 3 4 5 6 7 818e. Determine how much of the sidewalk is covered by these features that provide protection from sun, rain, and/or snow.
Arcades103
some/ much of s'walk covered = 1; no/little covered = 0
Awnings104
some/ much of s'walk covered = 1; no/little covered = 0
Other105
some/ much of s'walk covered = 1; no/little covered = 0
18f. Is there is a buffer (for example, parked cars, landscaped “buffer” strip, etc.) between sidewalk or street. 106 yes = 1; no = 0; NA = 819. Are there sidewalks/greenbelts/trails/paths other than sidewalks along street? 107 yes = 1; no = 0Bicycle Lanes20a. Are there bicycle lanes on the segment? 108 yes = 1; no = 020b. How are the bicycle lanes demarcated?
109
on road, painted line/reflectors=3; on road physical separation = 2;
off road = 1
Mid Block Crossing21a. Is there a marked mid-block crosswalk for pedestrians? 110 yes = 1; no = 021b. What type of marking does the crosswalk have? Mark all that apply
White painted lines 111 yes = 1; no = 0Colored painted lines 112 yes = 1; no = 0Zebra striping 113 yes = 1; no = 0Different road surface or paving (e.g. tiles, colored concrete, marble, etc) 114
yes = 1; no = 0
Other 115 yes = 1; no = 0Steepness22. How steep or hilly is this segment? Mark all that apply. 116-
118steep slope = 2; moderate slope = 1;
flat or gentle slope = 0Sidewalk Amenities23. Are there outdoor dining areas (e.g. cafes, outdoor tables at coffee shops or plazas, etc) located on the segment? 119 some/a lot = 3; few = 2; none = 024a. Indicate how many of each of the following street furniture/sidewalk amenities is/are present on the segment.
Benches (not a bus stop), chairs and/or ledges for sitting 120 some/a lot = 3; few = 2; none = 0Bus stops with seating 121 some/a lot = 3; few = 2; none = 0Heat lamps 122 some/a lot = 3; few = 2; none = 0Bike racks 123 some/a lot = 3; few = 2; none = 0
25. Are there obvious public restrooms on this segment that are clearly open to the public? 124 yes = 1; no = 0Street Trees 26a. How many street trees are on this segment? (Do not include trees that are not on the public right of way; street trees are typically between the sidewalk and the street or if there is no sidewalk, trees usually line the street) 125
some trees/trees along most or entire segment = 1;
none/few trees = 026b. Is the sidewalk shaded by trees? 126 yes/somewhat = 1; no = 0; NA = 8Buildings27. How many stories are most buildings on the segment?
127
5 or more = 3; 3-4 stories = 2; 1-2 stories = 1;
heights vary, no predominant height = 0; NA (no buildings) = 8
28. Are there abandoned buildings or lots on this segment? 128 some/a lot = 3; few = 2; none = 0; NA=829. Does at least 50% of the segment have buildings? 129 yes = 1; no = 0Windows30. How many buildings on this segment have windows with bars? (proporition) 130
some/a lot = 3; few = 2; none = 0; NA = 8
Other features of buildings31. How many buildings on this segment have front porches? (porches you can sit on) 131
some/a lot = 3; few = 2; none = 0; NA = 8
32. How much of the segment has blank walls or buildings with blank walls? 132
some/a lot = 3; few = 2; none = 0; NA = 8
IRVINE MINNESOTA INVENTORY Page 4
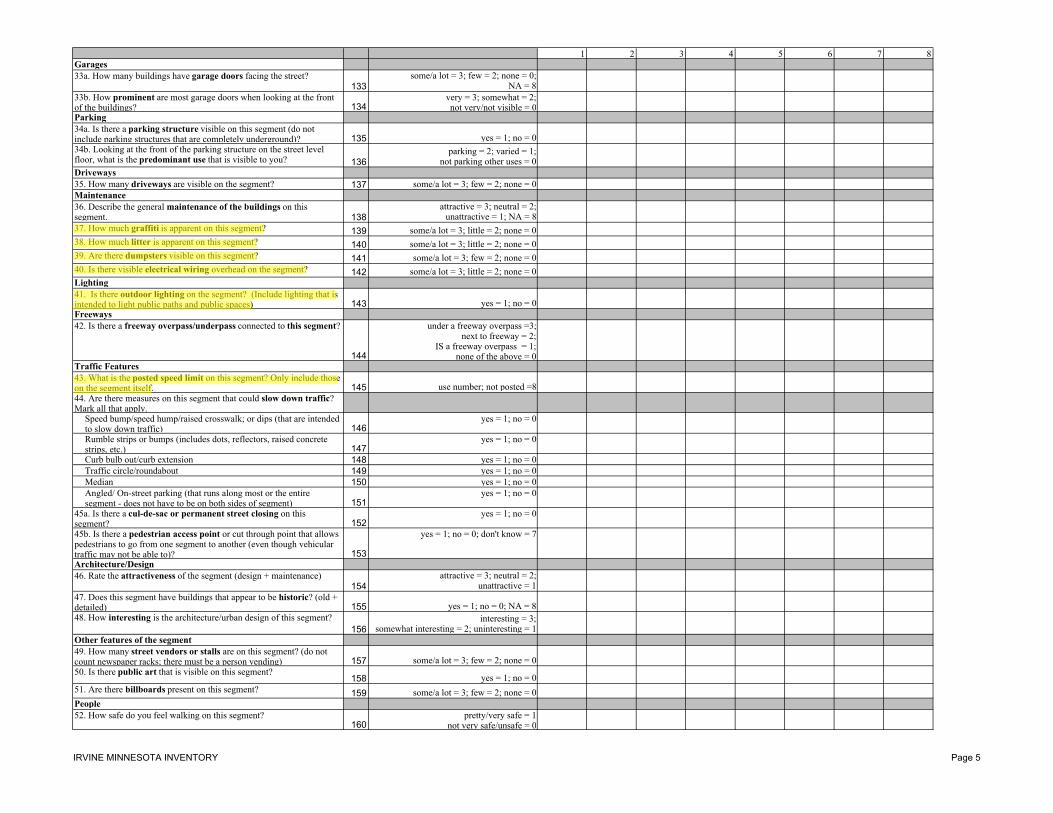
1 2 3 4 5 6 7 8Garages33a. How many buildings have garage doors facing the street?
133some/a lot = 3; few = 2; none = 0;
NA = 833b. How prominent are most garage doors when looking at the front of the buildings? 134
very = 3; somewhat = 2; not very/not visible = 0
Parking34a. Is there a parking structure visible on this segment (do not include parking structures that are completely underground)? 135 yes = 1; no = 034b. Looking at the front of the parking structure on the street level floor, what is the predominant use that is visible to you? 136
parking = 2; varied = 1; not parking other uses = 0
Driveways35. How many driveways are visible on the segment? 137 some/a lot = 3; few = 2; none = 0Maintenance36. Describe the general maintenance of the buildings on this segment. 138
attractive = 3; neutral = 2; unattractive = 1; NA = 8
37. How much graffiti is apparent on this segment? 139 some/a lot = 3; little = 2; none = 038. How much litter is apparent on this segment? 140 some/a lot = 3; little = 2; none = 039. Are there dumpsters visible on this segment? 141 some/a lot = 3; few = 2; none = 040. Is there visible electrical wiring overhead on the segment? 142 some/a lot = 3; little = 2; none = 0Lighting41. Is there outdoor lighting on the segment? (Include lighting that is intended to light public paths and public spaces) 143 yes = 1; no = 0Freeways42. Is there a freeway overpass/underpass connected to this segment?
144
under a freeway overpass =3; next to freeway = 2;
IS a freeway overpass = 1; none of the above = 0
Traffic Features43. What is the posted speed limit on this segment? Only include those on the segment itself. 145 use number; not posted =8 44. Are there measures on this segment that could slow down traffic? Mark all that apply.
Speed bump/speed hump/raised crosswalk; or dips (that are intended to slow down traffic) 146
yes = 1; no = 0
Rumble strips or bumps (includes dots, reflectors, raised concrete strips, etc.) 147
yes = 1; no = 0
Curb bulb out/curb extension 148 yes = 1; no = 0Traffic circle/roundabout 149 yes = 1; no = 0Median 150 yes = 1; no = 0Angled/ On-street parking (that runs along most or the entire segment - does not have to be on both sides of segment) 151
yes = 1; no = 0
45a. Is there a cul-de-sac or permanent street closing on this segment? 152
yes = 1; no = 0
45b. Is there a pedestrian access point or cut through point that allows pedestrians to go from one segment to another (even though vehicular traffic may not be able to)? 153
yes = 1; no = 0; don't know = 7
Architecture/Design46. Rate the attractiveness of the segment (design + maintenance)
154attractive = 3; neutral = 2;
unattractive = 147. Does this segment have buildings that appear to be historic? (old + detailed) 155 yes = 1; no = 0; NA = 848. How interesting is the architecture/urban design of this segment?
156interesting = 3;
somewhat interesting = 2; uninteresting = 1Other features of the segment49. How many street vendors or stalls are on this segment? (do not count newspaper racks; there must be a person vending) 157 some/a lot = 3; few = 2; none = 050. Is there public art that is visible on this segment?
158 yes = 1; no = 051. Are there billboards present on this segment? 159 some/a lot = 3; few = 2; none = 0People52. How safe do you feel walking on this segment?
160pretty/very safe = 1
not very safe/unsafe = 0
IRVINE MINNESOTA INVENTORY Page 5

1 2 3 4 5 6 7 8Dogs53. Are there any loose/unsupervised/barking dogs on this segment that seem menacing? 161
yes = 1; no = 0
Olfactory Character54. Is the dominant smell unpleasant? 162 yes = 1; no = 0
Neighborhood Identification (OTHER END OF SEGMENT)1. Are there monuments or markers including neighborhood entry signs that indicate that one is entering a special district or area? 163
yes = 1; no = 0
Street Crossing2a. Consider the places on the segment that are intended for pedestrians to cross the street. Are these places marked for pedestrian crossing? 164 all = 3; some = 2; none = 0; NA = 82b. What type of marking do the crosswalks have? Mark all that apply.
White painted lines 165 yes = 1; no = 0Colored painted lines 166 yes = 1; no = 0Zebra striping 167 yes = 1; no = 0Different road surface or paving (e.g. tiles, colored concrete, marble, etc) 168
yes = 1; no = 0
Other 169 yes = 1; no = 03. Are there curb cuts at all places where crossing is expected to occur? 170 all = 3; some = 2; none = 0; NA = 84. What type of traffic/pedestrian signal(s)/system(s) is/are provided? Mark all that apply.
Traffic signal 171 yes = 1; no = 0Stop sign 172 yes = 1; no = 0Yield sign 173 yes = 1; no = 0Pedestrian activated signal 174 yes = 1; no = 0Pedestrian crossing sign 175 yes = 1; no = 0Pedestrian overpass/underpass/bridge 176 yes = 1; no = 0
5. For an individual who is on this segment, how safe (traffic wise) do you think it is to cross the street from this segment?
177
pretty/very safe = 1; not very safe/ unsafe = 0;
cul de sac = 8 6. For an individual who is on this segment, how convenient (traffic wise) do you think it is to cross the street from this segment?
178
pretty/very convenient =1; not very/inconvenient= 0;
cul de sac = 8
IRVINE MINNESOTA INVENTORY Page 6

Latino Health Assessment Focus Group Protocol Santa Clara County Public Health Department
September 28, 2012 Prepared by RESOURCE DEVELOPMENT ASSOCIATES | 1
Focus Group Research Questions
1. What are the perceptions of residents regarding food access, physical activity infrastructure and neighborhood violence?
2. What are the community's social norms associated with physical activity and healthy eating?
3. What else is causing childhood and adult obesity? (i.e. What is making it hard for residents to eat healthy and exercise? Probe for cultural norms, socio-economic factors, housing, employment, family issues, etc.)
4. What are their recommendations for improving access and opportunity for healthier living, as well as improving safety/reducing violence?
Focus Group Discussion Questions
1. When someone says the word “healthy”, what do you think about?
2. More than 1 in 3 Latino Children in middle school are overweight or obese? What do you think causes obesity among Latino Children?
→ Probe/Clarification: First let them brainstorm. Then ask: Is it the type of food? Quantity or portion size? Lack of exercise? Body Image? If the discussion is moving rapidly, you may wish to point out that 68% (more than 2/3rds) of Latino adults are overweight or obese as well
3. In what ways do you think your surrounding neighborhood influences yours and your family’s health?
→ Probe/Clarification: Let them brainstorm first. Then provide some examples: street design, advertising, crime, etc.
4. How accessible and affordable are healthy foods in your community?
→ Probe/Clarification: Where do you purchase most of your foods? How far from home do you go to purchase most of your foods? Does price influence where you purchase foods and how much food you purchase?
→ Probe/Clarification: Do you have to go further if you want to purchase healthy, affordable foods? If so, how far do you have to go and how do you get there? Does price of food affect how far you go to shop?
→ Probe/Clarification: What kinds of healthy foods are available in your community? How affordable are healthy foods in your community? Compared to other communities?
5. What do you think the community can do to promote access to healthier foods?
→ Probe/Clarification: Let them brainstorm first. Then probe: What can schools and childcare providers do? What can city planners (street designers), local government, community members do?
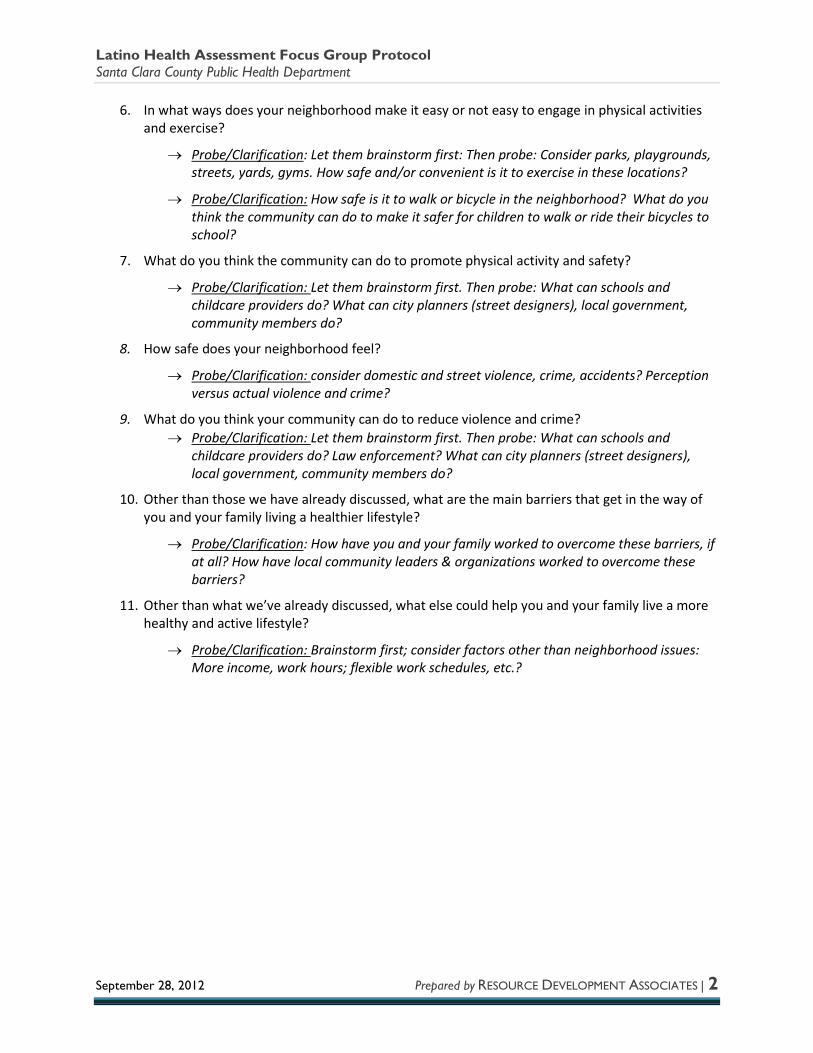
Latino Health Assessment Focus Group Protocol Santa Clara County Public Health Department
September 28, 2012 Prepared by RESOURCE DEVELOPMENT ASSOCIATES | 2
6. In what ways does your neighborhood make it easy or not easy to engage in physical activities and exercise?
→ Probe/Clarification: Let them brainstorm first: Then probe: Consider parks, playgrounds, streets, yards, gyms. How safe and/or convenient is it to exercise in these locations?
→ Probe/Clarification: How safe is it to walk or bicycle in the neighborhood? What do you think the community can do to make it safer for children to walk or ride their bicycles to school?
7. What do you think the community can do to promote physical activity and safety?
→ Probe/Clarification: Let them brainstorm first. Then probe: What can schools and childcare providers do? What can city planners (street designers), local government, community members do?
8. How safe does your neighborhood feel?
→ Probe/Clarification: consider domestic and street violence, crime, accidents? Perception versus actual violence and crime?
9. What do you think your community can do to reduce violence and crime? → Probe/Clarification: Let them brainstorm first. Then probe: What can schools and
childcare providers do? Law enforcement? What can city planners (street designers), local government, community members do?
10. Other than those we have already discussed, what are the main barriers that get in the way of you and your family living a healthier lifestyle?
→ Probe/Clarification: How have you and your family worked to overcome these barriers, if at all? How have local community leaders & organizations worked to overcome these barriers?
11. Other than what we’ve already discussed, what else could help you and your family live a more healthy and active lifestyle?
→ Probe/Clarification: Brainstorm first; consider factors other than neighborhood issues: More income, work hours; flexible work schedules, etc.?
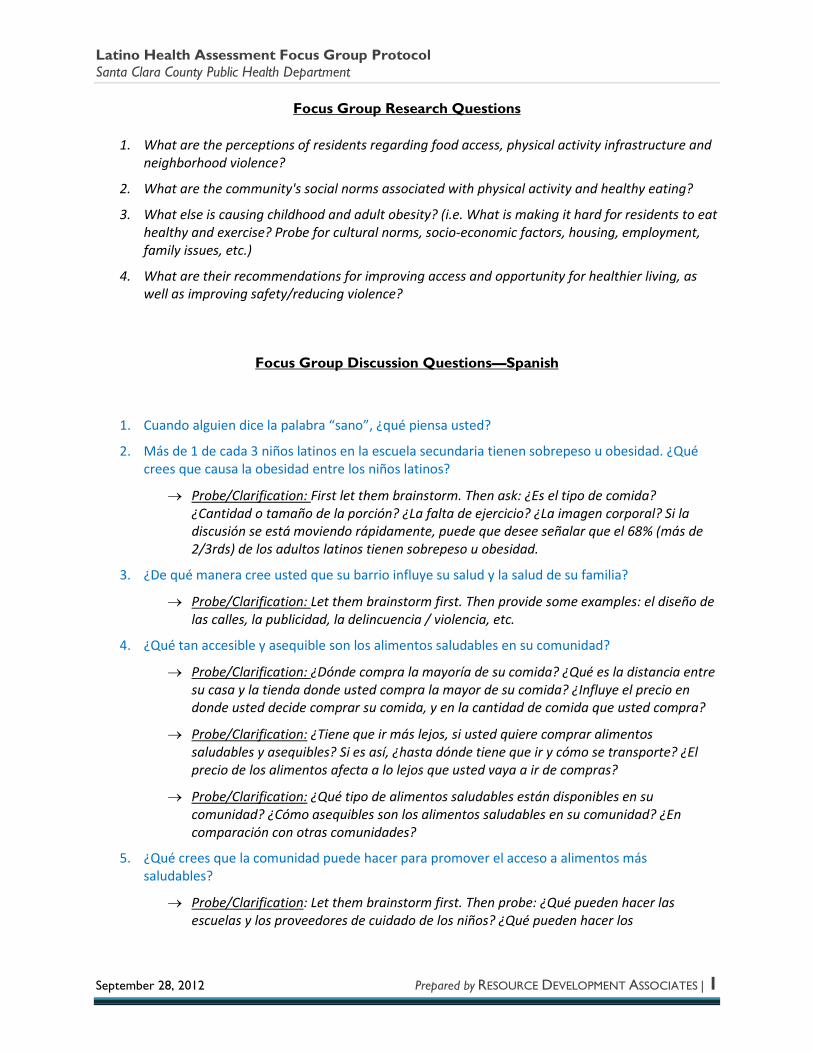
Latino Health Assessment Focus Group Protocol Santa Clara County Public Health Department
September 28, 2012 Prepared by RESOURCE DEVELOPMENT ASSOCIATES | 1
Focus Group Research Questions
1. What are the perceptions of residents regarding food access, physical activity infrastructure and neighborhood violence?
2. What are the community's social norms associated with physical activity and healthy eating?
3. What else is causing childhood and adult obesity? (i.e. What is making it hard for residents to eat healthy and exercise? Probe for cultural norms, socio-economic factors, housing, employment, family issues, etc.)
4. What are their recommendations for improving access and opportunity for healthier living, as well as improving safety/reducing violence?
Focus Group Discussion Questions—Spanish
1. Cuando alguien dice la palabra “sano”, ¿qué piensa usted?
2. Más de 1 de cada 3 niños latinos en la escuela secundaria tienen sobrepeso u obesidad. ¿Qué crees que causa la obesidad entre los niños latinos?
→ Probe/Clarification: First let them brainstorm. Then ask: ¿Es el tipo de comida? ¿Cantidad o tamaño de la porción? ¿La falta de ejercicio? ¿La imagen corporal? Si la discusión se está moviendo rápidamente, puede que desee señalar que el 68% (más de 2/3rds) de los adultos latinos tienen sobrepeso u obesidad.
3. ¿De qué manera cree usted que su barrio influye su salud y la salud de su familia?
→ Probe/Clarification: Let them brainstorm first. Then provide some examples: el diseño de las calles, la publicidad, la delincuencia / violencia, etc.
4. ¿Qué tan accesible y asequible son los alimentos saludables en su comunidad?
→ Probe/Clarification: ¿Dónde compra la mayoría de su comida? ¿Qué es la distancia entre su casa y la tienda donde usted compra la mayor de su comida? ¿Influye el precio en donde usted decide comprar su comida, y en la cantidad de comida que usted compra?
→ Probe/Clarification: ¿Tiene que ir más lejos, si usted quiere comprar alimentos saludables y asequibles? Si es así, ¿hasta dónde tiene que ir y cómo se transporte? ¿El precio de los alimentos afecta a lo lejos que usted vaya a ir de compras?
→ Probe/Clarification: ¿Qué tipo de alimentos saludables están disponibles en su comunidad? ¿Cómo asequibles son los alimentos saludables en su comunidad? ¿En comparación con otras comunidades?
5. ¿Qué crees que la comunidad puede hacer para promover el acceso a alimentos más saludables?
→ Probe/Clarification: Let them brainstorm first. Then probe: ¿Qué pueden hacer las escuelas y los proveedores de cuidado de los niños? ¿Qué pueden hacer los
Latino Health Assessment Focus Group Protocol Santa Clara County Public Health Department
September 28, 2012 Prepared by RESOURCE DEVELOPMENT ASSOCIATES | 2
planificadores de la ciudad (los diseñadores de las calles), el gobierno local, o miembros de la comunidad?
6. ¿De qué manera es fácil o no fácil de realizar actividades físicas y ejercicios?
→ Probe/Clarification: Let them brainstorm first: Then probe: Considere la posibilidad de parques, patios, calles, gimnasios. ¿Qué tan seguro y / o conveniente son estos lugares para hacer ejercicio?
→ Probe/Clarification: ¿Qué tan seguro es caminar o andar en bicicleta por el vecindario? ¿Qué piense usted que la comunidad puede hacer para que sea más seguro para que los niños pueden caminar o andar en sus bicicletas a la escuela?
7. ¿Qué crees que la comunidad puede hacer para promover la actividad física y la seguridad?
→ Probe/Clarification: Let them brainstorm first. Then probe: ¿Qué pueden hacer las escuelas y los proveedores de cuidado de los niños? ¿Qué pueden hacer los planificadores de la ciudad (los diseñadores de las calles), el gobierno local, o miembros de la comunidad?
8. ¿Qué tan seguro se siente en su vecindario?
→ Probe/Clarification: ¿Considere la posibilidad de la violencia doméstica y de la calle, la delincuencia, los accidentes? ¿La percepción de violencia contra la realidad de violencia?
9. ¿Qué piensa usted que puede hacer su comunidad para reducir la violencia y el crimen? → Probe/Clarification: Let them brainstorm first. Then probe: ¿Qué pueden hacer las
escuelas y los proveedores de cuidado de los niños? ¿La policía? ¿Qué se pueden hacer los planificadores de la ciudad (los diseñadores de las calles), el gobierno local, o miembros de la comunidad?
10. Aparte de lo que ya hemos discutido, ¿cuáles son las barreras principales que impiden que usted y su familia pueden viven una vida más sana?
→ Probe/Clarification: ¿Qué haz hecho para superar estas barreras, en todo caso? ¿Qué han hecho los líderes de las comunidades locales y las organizaciones para superar estas barreras?
11. Aparte de lo que ya hemos discutido, ¿qué otra cosa podría ayudar a que usted y su familia pueden vivir una vida más sana y activa?
→ Probe/Clarification: Brainstorm first; Tenga en cuenta factores que no sean problemas del barrio: ¿Más ingresos, horas de trabajo, horarios flexibles de trabajo, etc.?