appendix j preliminary induced seismic mitigation plan · pdf filequantify hazard from natural...
TRANSCRIPT

Newberry Geothermal Energy Establishment of the Frontier Observatory for Research in Geothermal Energy (FORGE) at Newberry Volcano, Oregon
Appendix J Preliminary Induced Seismic Mitigation Plan
April 27, 2016

J.i
Contents
Acronyms and Abbreviations .................................................................................................................... J.iiiJ.1 Summary ............................................................................................................................................ J.1J.2 Background Information on the Proposed NEWGEN FORGE Site .................................................. J.2
J.2.1NEWGEN FORGE Site Selection and History of Geothermal Development .......................... J.2J.2.2Newberry EGS Demonstration – 2011 ISMP ............................................................................ J.4J.2.3Conceptual Geologic Model ...................................................................................................... J.5J.2.4Tectonic and Geologic Setting ................................................................................................... J.5J.2.5Natural Seismicity at the NEWGEN FORGE Site .................................................................... J.9J.2.6Summary of Induced Seismicity during the Newberry EGS Demonstration .......................... J.10
J.3 Induced Seismicity Mitigation Protocol – Summary ....................................................................... J.17J.4 Step 1. Preliminary Screening Evaluation ....................................................................................... J.17
J.4.1Step 1a. Review of Laws and Regulations .............................................................................. J.17J.4.2Step 1b. Determine the Radius of Influence ............................................................................ J.20J.4.3Step 1c. Identify Potential Impacts .......................................................................................... J.20J.4.4Step 1d. Potential Damages ..................................................................................................... J.21J.4.5Step 1e. Overall Risk Level ..................................................................................................... J.22
J.5 Step 2: Communications and Outreach Program ............................................................................. J.22J.5.1Communications and Outreach Plan ........................................................................................ J.22J.5.2Field Activities with Potential Stakeholder Impact ................................................................. J.23J.5.3Communications and Outreach after Field Activities .............................................................. J.23
J.6 Step 3. Identify Criteria for Ground Vibration and Noise ............................................................... J.24J.6.1Populations within the Potential Shake Zone .......................................................................... J.24J.6.2Vulnerability of Structures ....................................................................................................... J.25J.6.3NEGSD Damage Claim Procedures ........................................................................................ J.27
J.7 Step 4: Establish a Seismic Monitoring System .............................................................................. J.27J.7.1Current Seismic Monitoring .................................................................................................... J.27J.7.2Proposed Phase 2C Seismic Monitoring System ..................................................................... J.30J.7.3Seismic Monitoring .................................................................................................................. J.31
J.8 Step 5. Quantify Hazard from Natural and Induced Seismic Events ............................................... J.31J.8.1Baseline Hazard from Natural Seismicity ............................................................................... J.31J.8.2Hazard from Induced Seismicity ............................................................................................. J.31
J.9 Step 6 Characterize Risk of Induced Seismic Events ...................................................................... J.34J.10 Conclusion ........................................................................................................................................ J.36J.11 Seismicity Terms and Background .................................................................................................. J.36J.12 References ........................................................................................................................................ J.40

J.ii
Figures
J.1 Map of Newberry Volcano showing the NNVM, Newberry Unit, and NEWGEN FORGE site ....................................................................................................................................................... J.3
J.2 Regional map showing the location of the Newberry Volcano at the intersection of three structural trends in Central Oregon .................................................................................................... J.6
J.3 Faults, fissures, ring features, and volcanic vents across the Newberry Volcano edifice and La Pine valley as mapped from LiDAR-based digital elevation model ............................................. J.8
J.4 Background seismicity within 10 km of NEWGEN FORGE site .................................................... J.10J.5 Daily rate of seismicity detected during Phase 2.2 stimulation at the NEGSD site ......................... J.13J.6 Log-log plot of size distribution of MEQs ....................................................................................... J.14J.7 Evolution of b-value during stimulation ........................................................................................... J.14J.8 Maximum seismic moment and magnitude as functions of total volume of injected fluid ............. J.15J.9 Location map and cross sections of all located events from initial seismic catalog during the
NEGSD 2014 stimulation of NWG 55-29 ........................................................................................ J.16J.10 Shake map from URS Addendum Figure 1 ...................................................................................... J.21J.11David Stowe, NEWGEN Public Outreach Coordinator, speaks to students from Oregon State
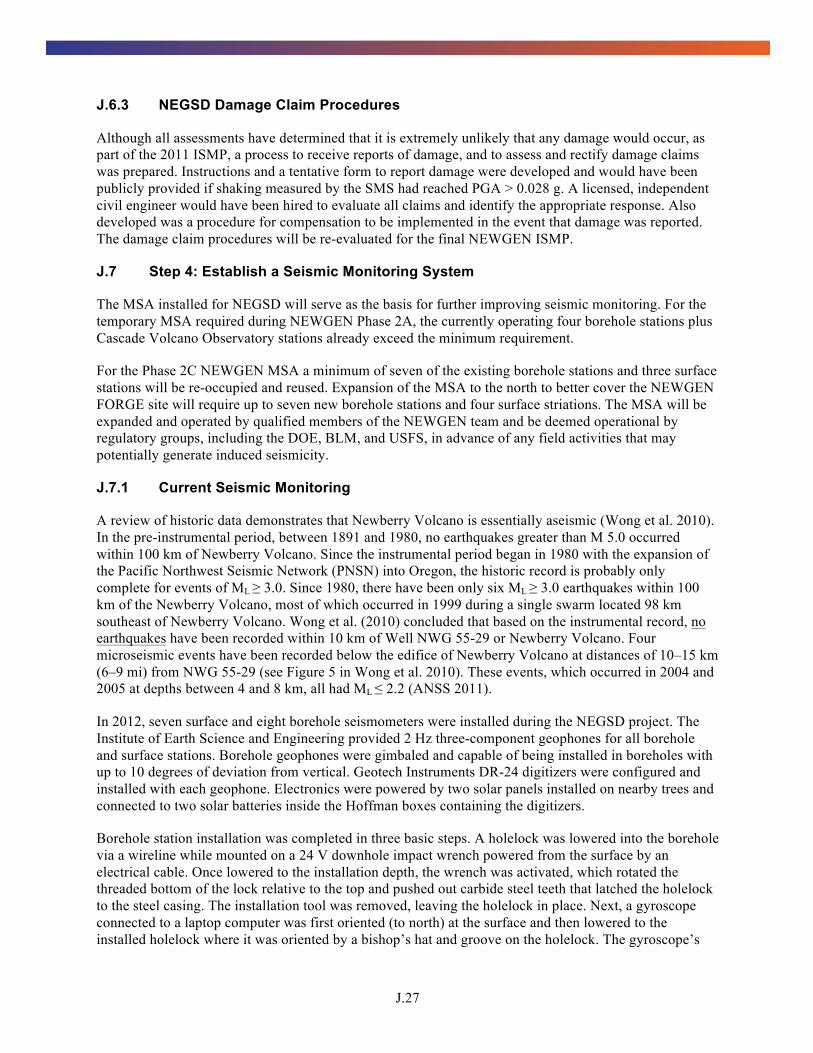
University during a field trip to the NEGSD site ............................................................................. J.23J.12 Borehole seismometer, cable, and winch trailer used to install the NEGSD MSA. ......................... J.28J.13 Pacific Northwest Seismic Network webpage showing the stations operating as of January
22, 2016, and earthquake information for events recorded within 20 km (12.4 mi) of the summit between June 3, 2015 and January 22, 2016. ...................................................................... J.29
J.14The proposed seismic monitoring system at the NEWGEN FORGE site would include up to 22 monitoring sites—5 borehole sensors and 7 surface monitoring stations. .................................. J.30
J.15 Decision tree for triggers and mitigation actions. ............................................................................ J.35
Tables
J.1 Number of people outside area of perceivable shaking as determined by Wong et al. .................... J.24J.2 Number of visitors within area of perceivable shaking as determined by AltaRock. ...................... J.25J.3 Summary of the three deterministic approaches used to estimate Mmax ........................................... J.32J.4 Calculated probability of event occurrence. ..................................................................................... J.33J.5 Comparison of quantitative and qualitative measures of ground shaking. ....................................... J.37J.6 Worldwide, annual counts of earthquakes by magnitude. ................................................................ J.37J.7 First eight of twelve levels of the Modified Mercalli Intensity Scale. ............................................. J.39J.8 Comparison of magnitude and maximum MMI. .............................................................................. J.39
J.iii
Acronyms and Abbreviations
°C degree(s) Celsius °F degree(s) Fahrenheit BHTV borehole televiewer BLM Bureau of Land Management cm centimeter(s) DCC Deschutes County Code DOE U.S. Department of Energy DOGAMI Department of Geology and Mineral Industries EA Environmental Assessment EGS enhanced geothermal system(s) FEMA Federal Emergency Management Agency FOA Funding Opportunity Announcement FONSI Finding of No Significant Impact FORGE Frontier Observatory for Research in Geothermal Energy ft foot (feet) g gravity GPa gigapascal(s) gpm gallons per minute HP horsepower Hz hertz in. inch(es) ISMP Induced Seismicity Mitigation Plan km kilometer(s) km2 square kilometer(s) kV kilovolt(s) L liter(s) LBNL Lawrence Berkeley National Laboratory LiDAR light detection and ranging M magnitude(s) m meter(s) MEQ micro-earthquake mi mile(s) ML local earthquake magnitude Mmax maximum magnitudes MMI Modified Mercalli Intensity MSA microseismic array
J.iv
MW megawatt(s) NEGSD Newberry Enhanced Geothermal System Demonstration NEPA National Environmental Policy Act of 1969 NEWGEN Newberry Geothermal Energy NNE north-northeast NNVM Newberry National Volcanic Monument OAR Oregon Administrative Rules ORS Oregon Revised Statute(s) PGA peak ground acceleration PGV peak ground velocity PNSN Pacific Northwest Seismic Network PSHA probabilistic seismic hazard assessment psi pounds per square inch s second(s) SGH Simpson Gumpertz & Heger Shmin minimum horizontal stress SMS strong-motion seismometer SSE south-southeast SSW south-southwest T&R Treadwell & Rollo TZIM thermally degradable zonal isolation material URS URS Corporation USFS U.S. Forest Service USGS U.S. Geological Survey V volt(s) W watt(s) WHP wellhead pressure

J.1
Appendix J
Preliminary Induced Seismic Mitigation Plan
J.1 Summary
According to the Funding Opportunity Announcement (FOA) for the Frontier Observatory for Research in Geothermal Energy (FORGE) (DE-FOA-0000890), the selected FORGE site must comply with the current version of the “Protocol for Induced Seismicity Associated with Enhanced Geothermal Systems” (Majer et al. 2012). Further, the FOA states that a Preliminary Induced Seismicity Mitigation Plan (ISMP) should be developed during Phase 1 that includes “a discussion and evaluation of the regional setting, structure, and stratigraphy as related to seismic risk, as well as a summary of any monitoring data collected prior to initiating the cooperative agreement.”
Lastly, FORGE Phase 2A objectives include “establishing baseline seismic monitoring to comply with the Protocol for Addressing Induced Seismicity Associated with Enhanced Geothermal Systems and Best Practices for Addressing Induced Seismicity Associated with Enhanced Geothermal Systems and to incorporate data into the hazard evaluation portion of the Preliminary Induced Seismicity Mitigation Plan.” Phase 2A requires deployment of “a telemetered seismic monitoring array comprised of at least 5 surface stations capable of recording seismic events with magnitudes as small as magnitude 1.0, and preferably magnitude 0.0 and a minimum of 30 days of recorded seismic data.” Clearly, planning for the Phase 2A microseismic array (MSA) needs to be described in the preliminary ISMP.
An enhanced geothermal systems reservoir is created by injecting fluid at high pressure into a rock formation, which increases fracture permeability and generates seismic vibrations, or “induced seismicity,” that can be detected by seismometers and used to map enhanced geothermal system (EGS) reservoir growth.1 Most induced seismic events have a magnitude less than 2.0 and are not felt at the surface. However, some EGS projects have generated events large enough to be felt and cause minor damage. Thus, it is critical that EGS projects follow procedures to evaluate, monitor, and mitigate the risk of felt or potentially damaging induced seismicity.
AltaRock Energy Inc. (AltaRock), supported by the U.S. Department of Energy (DOE) Energy Efficiency & Renewable Energy Geothermal Technologies Program (Award Number DE-EE0002777), conducted the Newberry EGS Demonstration (NEGSD) from 2011 through 2015. The National Environmental Policy Act (NEPA) permitting required by the NEGSD largely focused on development of an ISMP to allay concerns that the demonstration might result in excessive induced seismicity and unacceptable seismic risk. The ISMP developed for NEGSD (AltaRock 2011, hereafter referred to as the 2011 ISMP) was being developed at the same time as the Protocol for Induced Seismicity Associated with Enhanced Geothermal Systems (Majer et al. 2012) that is now required on all EGS projects and the Newberry Geothermal Energy (NEWGEN) FORGE site. Hence, a complete ISMP has already been developed for the NEWGEN FORGE site. The 2011 ISMP requires updating in some areas because of 1) a better theoretical and empirical understanding of induced seismicity from geothermal, wastewater, and oil and gas hydraulic fracturing worldwide; 2) a better understanding of the seismic response of the NEWGEN FORGE site to hydraulic stimulation; and 3) well stimulation activities at the NEWGEN FORGE site under the proposed FORGE project will be operationally more varied than those of the NEGSD, which
1 A primer on seismicity is provided in Section 0 for readers who may be unfamiliar with some terms.
J.2
focused on hydroshearing and zonal isolation involving treatments of thermally degradable zonal isolation materials (TZIM).
In this preliminary NEWGEN ISMP, the 2011 ISMP and the results of the NEGSD are incorporated into seven steps of the Protocol for Induced Seismicity Associated with Enhanced Geothermal Systems. Further effort during FORGE Phase 2 will be needed to turn this preliminary NEWGEN ISMP into the final NEWGEN ISMP needed for the NEWGEN FORGE project. Thanks to significant previous effort during the NEGSD related to monitoring and analysis of induced seismicity, finalizing the ISMP will require far less effort than expected. Furthermore, the final ISMP will be among the most robust and well-supported of such documents in the world.
J.2 Background Information on the Proposed NEWGEN FORGE Site
Newberry Volcano in Central Oregon has been an area of ongoing geothermal energy interest since the 1970s. The Newberry Volcano National Monument (NNVM or Monument) was created in 1990 by a stakeholder group including the U.S. Forest Service, geothermal energy companies, and local citizens. The goal of creating the NNVM was to preserve the scenic beauty and the volcanic features inside the Newberry Volcano caldera, while providing for geothermal development and other uses on adjacent lands. During Monument creation, land that had been leased for geothermal development inside the caldera was exchanged for land outside the Monument boundaries with the proviso that the presence of the Monument would not preclude development of projects suitable to the site outside the Monument. A map of Newberry Volcano showing the NNVM boundary, the Newberry Unit (a collection of about 19,000 acres of U.S. Bureau of Land Management (BLM) geothermal leases operated by a subsidiary of AltaRock), and the NEWGEN FORGE site is shown in Figure J.1.
J.2.1 NEWGEN FORGE Site Selection and History of Geothermal Development
Geoscience investigations indicate that Newberry Volcano is one of the most promising EGS sites in the United States. It has a large conductive thermal anomaly yielding high-temperature wells, but with permeability orders of magnitude less than conventional hydrothermal wells. The NEWGEN site is highly favorable for the FORGE for many reasons, including temperature at depth, geologic stress regime, data available for resource characterization (including hydrology, geology, temperature gradient, and background seismicity), and a strong history of active stakeholder engagement in the local community.
In 1994, an Environmental Impact Statement was completed for CalEnergy Newberry for the “Newberry Geothermal Pilot Project” on the volcano’s western flank. In June 1994, the U.S. Forest Service (USFS) and the BLM issued a joint Record of Decision to implement the Newberry Geothermal Pilot Project. The approved project included exploration, development, and production operations for 14 well pads, a 33 MW power plant, a 115 kV transmission line, and supporting facilities on the west flank of Newberry Volcano, outside of the NNVM. In 1995, CalEnergy drilled four exploration holes, including two production-size bore holes. The CalEnergy wells showed very high temperatures (over 600°F at 9200 ft, or over 315°C at 2800 m), but extremely low permeability and were not productive (Spielman and Finger 1998).
In 2007, an Environmental Assessment (EA) of the Newberry Geothermal Exploration Project was completed for Davenport Newberry, which had acquired adjacent leases in 1997. A Finding of No Significant Impact (FONSI) was issued by BLM and USFS for this project, including temperature gradient drilling, geophysical exploration, and drilling of two deep exploratory wells. Davenport completed the drilling of exploratory wells NWG 55-29 and NWG 46-16 in July and November 2008, respectively. These holes both reached depths of over 10,000 ft (3000 m) and exhibited maximum temperatures of more than 600°F (315°C), but were not commercially productive.

J.3
Figure J.1. Map of Newberry Volcano showing the NNVM, Newberry Unit, and NEWGEN FORGE
site.
In 2009, to prepare a proposal to the DOE under the NEGSD Project FOA, AltaRock developed an extensive EGS site selection process. Criteria for EGS site selection included 1) temperature at depth; 2) tectonic stress; 3) geology; 4) fracturing and joint spacing; 5) existing resource information; 6) geophysics; 7) social, political, and environmental factors, including the ability to secure permits; and 8) economics. Two critical components of criteria 7 were environmental impact and seismic hazard

J.4
susceptibility. Ten potential sites were evaluated using AltaRock’s site selection process; the Newberry Volcano site scored highest for many reasons and an agreement was made with Davenport to partner on the proposal. The proposal was awarded, resulting in the NEGSD project that AltaRock led from 2010 through 2015.
Based on comments received at public meetings during Phases I and II of the NEGSD, AltaRock confirmed the initial pre-demonstration impression of a favorable social and political environment for geothermal development. Furthermore, the social and political support for NEGSD has continued to build as the community has learned more about geothermal energy and become comfortable with the low risk of induced seismicity at the site.
J.2.2 Newberry EGS Demonstration – 2011 ISMP
The 2011 ISMP is 56 pages long and includes 14 appendices. Development of the 2011 ISMP started with a contract with the URS Corporation Seismic Hazards Group (URS) to perform a comprehensive study of seismic risk at the NEGSD site and surrounding area. The objectives of the study were to 1) evaluate the baseline seismic hazards in the project area, including the nearby City of La Pine; 2) estimate the potential increase in seismicity rate and the maximum magnitude of an earthquake induced by the hydroshearing in injection well NWG 55-29; and 3) evaluate the increased seismic risk imposed by hydroshearing activities. The URS report and an addendum covers the entire area of the NEWGEN FORGE project and was incorporated into the 2011 ISMP as Appendices F and G.
In addition to the URS work on seismic hazard and risk, other third-party, independent consultants provided expertise to the 2011 ISMP effort. Their analyses included the following:
• assessment of Mmax, the magnitude of the largest likely induced event during NEGSD, by Fugro WLA (William Lettis and Associates) (2011 ISMP--Appendix E)
• structural assessment of USFS assets in NNVM by Simpson Gumpertz & Heger (SGH; 2011 ISMP--Appendix H)
• geotechnical assessment of steep slopes and a dam on Paulina Lake by Treadwell & Rollo (T&R; 2011 ISMP--Appendix I).
Combining the results of the consultants, AltaRock developed procedures for control and mitigation of induced seismicity. The 2011 ISMP defined limits (or “triggers”) that, if activated, would have initiated mitigation actions up to and including stopping injection and immediately flowing the well to reduce reservoir pressure. The largest seismic events detected during 2012 and 2014 reached the magnitude that required no further increase of injection rate and wellhead pressure (WHP). This did not affect operations during either stimulation because there were no plans to increase injection rate or WHP at the time of the events.
Due to the timing of the NEGSD during a period of heightened concern regarding the risk of induced seismicity and before the DOE had fully approved the Protocol for Induced Seismicity Associated with Enhanced Geothermal Systems (Majer et al. 2012), the 2011 ISMP included some extra analyses worth mentioning. First, geoscientists from the AltaRock studied the history of injection-induced seismicity, starting with the Rocky Mountain Arsenal in 1967 and proceeding up through the Deep Heat Mining project in Basel, Switzerland. Some of the most relevant lessons learned from these projects are described in the 2011 IMSP, while details of AltaRock’s analysis can be found in articles by Cladouhos et al. (2010, 2011).

J.5
Second, the 2011 ISMP included a section on “Recent Injection-Induced Seismicity Theory.” The theory of induced seismicity has progressed a great deal in the last 5 years; therefore, much of this section is now out of date. However, the NEWGEN team is dedicated to further advancing the theory related to induced seismicity and mitigation of risk. We anticipate that if FORGE is awarded to NEWGEN, the site of the NEGSD on the flank of Newberry Volcano will once again be at the cutting edge of induced seismicity research and development.
Lastly, in writing the 2011 ISMP, AltaRock found that the audience—regulators from USFS, BLM, DOE, and local stakeholders—needed some education in seismology in order to understand the issues related to induced seismicity. Therefore, we wrote a primer on seismicity, which is also produced here as Section 0.
J.2.3 Conceptual Geologic Model
A conceptual geologic model is being developed as part of the NEWGEN project work currently underway. Over 40 years of geothermal research and exploration have taken place at Newberry Volcano. Bringing together data from geological, geophysical, geochemical, hydrological, seismic, and other studies, the comprehensive model will compile large- and small-scale information essential to understanding EGS development at Newberry Volcano. The model will be compiled in Earth Vision, a three-dimensional (3D) viewing platform that will allow remote access to researchers from across the country and around the world. Surficial geologic maps, stratigraphic columns, light detection and ranging (LiDAR), well log, seismic, gravity, magnetotelluric, and other data will be combined to generate the most comprehensive 3D subsurface model possible for Newberry Volcano. The software will allow multiple end-member modeling scenarios to be developed, and is flexible to accommodate new data as they become available. The geologic model will promote data interpretation and aid decision-making by reducing uncertainty. The model will be hosted at Pacific Northwest National Laboratory with remote access for researchers to view and access data. Further information about the conceptual geologic model can be found in Appendix A.
J.2.4 Tectonic and Geologic Setting
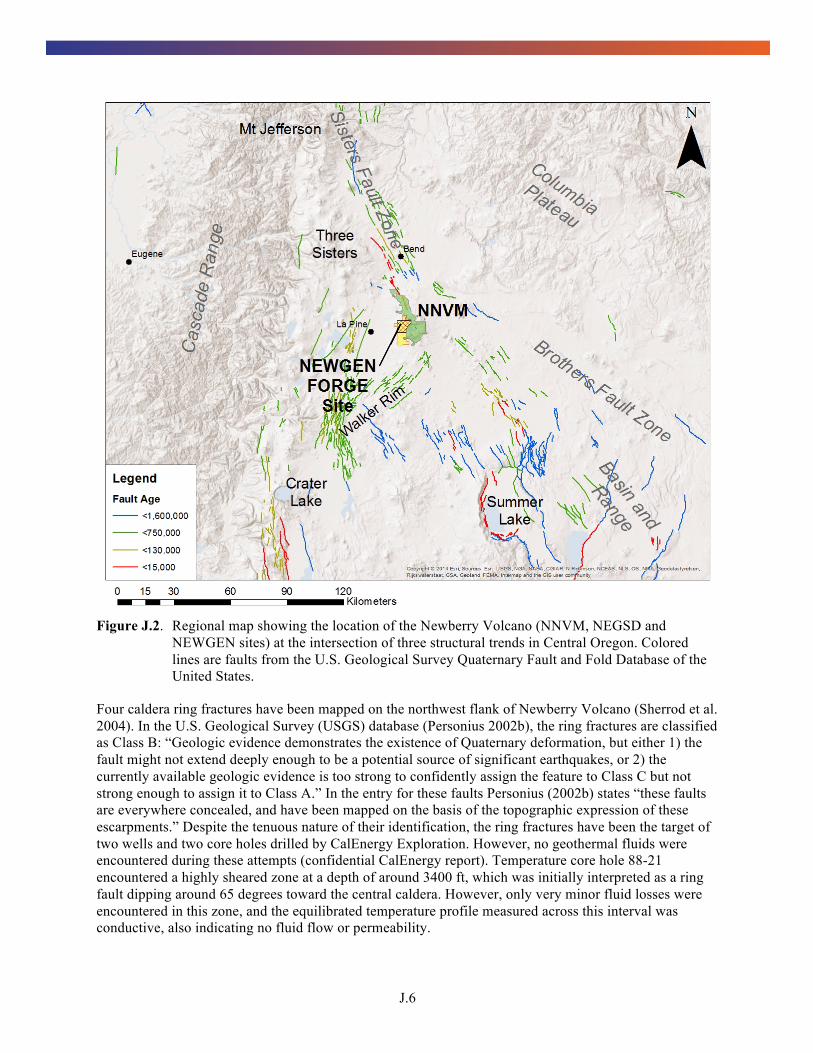
This section reviews the most salient aspects of the conceptual geologic model (Appendix A) for natural and induced seismicity risk. Newberry Volcano is located at the intersection of three distinct structural zones—the NNE-trending range bounding faults of the Basin and Range, the N-trending graben faults of the Cascade Range, and the NW-trending Brother’s Fault Zone—each with a different tectonic history, deformation style, and fault orientation (Figure J.2).
In addition, the local stress state at the NEWGEN FORGE site may be complicated by its proximity to ring fractures associated with caldera collapse. Cladouhos et al. (2011) provide further information about the regional setting of Newberry Volcano.
J.6
Figure J.2. Regional map showing the location of the Newberry Volcano (NNVM, NEGSD and
NEWGEN sites) at the intersection of three structural trends in Central Oregon. Colored lines are faults from the U.S. Geological Survey Quaternary Fault and Fold Database of the United States.
Four caldera ring fractures have been mapped on the northwest flank of Newberry Volcano (Sherrod et al. 2004). In the U.S. Geological Survey (USGS) database (Personius 2002b), the ring fractures are classified as Class B: “Geologic evidence demonstrates the existence of Quaternary deformation, but either 1) the fault might not extend deeply enough to be a potential source of significant earthquakes, or 2) the currently available geologic evidence is too strong to confidently assign the feature to Class C but not strong enough to assign it to Class A.” In the entry for these faults Personius (2002b) states “these faults are everywhere concealed, and have been mapped on the basis of the topographic expression of these escarpments.” Despite the tenuous nature of their identification, the ring fractures have been the target of two wells and two core holes drilled by CalEnergy Exploration. However, no geothermal fluids were encountered during these attempts (confidential CalEnergy report). Temperature core hole 88-21 encountered a highly sheared zone at a depth of around 3400 ft, which was initially interpreted as a ring fault dipping around 65 degrees toward the central caldera. However, only very minor fluid losses were encountered in this zone, and the equilibrated temperature profile measured across this interval was conductive, also indicating no fluid flow or permeability.

J.7
NWG 55-29, the NEGSD well, was drilled within 2 mi of the caldera rim and near the projection of ring fractures, so it was possible that it would intersect ring fractures. However, there is no evidence of ring fractures or faults in the NWG 55-29 well bore from drilling logs, mud logs, borehole televiewer data (see below), or cuttings analysis (Letvin 2011).
AltaRock joined the Oregon LiDAR consortium to add La Pine, the city nearest to the NEGSD and NEWGEN FORGE sites, to the 2010 LiDAR survey of Newberry Volcano and the Deschutes National Forest. In particular, AltaRock was interested in better characterizing the La Pine Graben faults shown in the USGS fault and fold database at the western edge of the valley (Personius 2002a), the ring fractures (Personius 2002b), and checking for evidence of faults or fractures in the NEGSD area. AltaRock’s analysis of the 880 km2 of new LiDAR data (Figure J.3) is discussed in detail by Cladouhos et al. (2011) and Grasso et al. (2012).
The ring fractures mapped in the USGS database are not prominent in AltaRock’s LiDAR analysis. The ring fractures are expressed as curved lineaments defined by fissures and an alignment of vents that end more than 3 km (1.8 mi) from NWG 55-29. Dip-slip fault offset along the ring fractures is not observed in the LiDAR surfaces. To conclude, based on the results of CalEnergy Exploration, Davenport deep drilling, and LiDAR topographic mapping, the ring fractures do not appear to be active faults at a distance of 3 km (1.8 mi) to the northeast of NWG 55-29, nor is there any evidence of the ring fractures nearer NWG 55-29. Therefore, for the 2011 ISMP the ring fractures were not considered to be at risk of slipping. The final NEWGEN ISMP will need to re-evaluate this conclusion based on possible stimulation of NWG 46-16.
On the west side of the LiDAR image AltaRock has mapped a series of short (<6 km), discontinuous normal faults that occur in nested grabens and are often related to volcanic flows and cones. The USGS fault and fold database includes many of these faults, but in less detail. The USGS database also includes two long (30 and 35 km), NNE-trending faults in the La Pine Graben fault set west of La Pine and cutting Wikiup Reservoir (Figure J.2). However, no evidence of these longer faults can be seen in LiDAR data. This is not surprising, because the notes in the USGS database for these faults indicate that “the graben margin faults inferred from the gravity data by Ake et al. (2001) have no topographic expression or demonstrated offset in Quaternary deposits” (Personius 2002a). AltaRock’s examination of the maps and figures in Ake et al. (2001) confirms that these faults are drawn on the basis of inflections in gravity profiles. Nevertheless, the seismic risk caused by faults is included in the URS seismic hazards report (Wong et al. 2010). This document makes no comment about whether these faults, which are 15 km away, do or do not exist at depth. It is outside of the scope of this document to settle the issue.
Grasso et al. (2012) indicate clear structural trends evidenced by LiDAR mapping of fault scarps and volcanic vent alignments across the Newberry Volcano edifice. Fault orientation south of the caldera is primarily NNE-SSW and rotates to NNW-SSE trending faults north of the caldera. Extension in the east-west direction is evidenced by topographic down-step from east to west across the edifice of several hundred meters. Volcanic vents, cinder cones and fissures are common in the area and appear to be aligned with fault orientations in many areas. The frequency and volume of eruption coupled with significant volcanic ash production may obscure some surface expression of these features; however, LiDAR data indicate clear structural trends across the edifice (Figure J.3).

J.8
Figure J.3. Faults, fissures, ring features, and volcanic vents across the Newberry Volcano edifice and
La Pine valley (at lower left edge) as mapped from LiDAR-based digital elevation model (Grasso et al. 2012). Dark gray area denotes LiDAR coverage; light gray is 10 m background digital elevation model.

J.9
The orientation of normal faults and fissures mapped with LiDAR can provide a first approximation of the minimum principal stress (extension) direction. The average fault orientation on the west side of the LiDAR image (Figure J.3) and the average fissure orientation on the east side of the image differ by only about 10° (Cladouhos et al. 2011). This suggests a normal fault regime with roughly east-west extension across the area shown in Figure J.3. This inferred regional stress orientation is simpler than might be expected for Newberry Volcano based on the juxtaposition of three different structural trends evident in Figure J.2.
In October 2010, NWG 55-29 was logged by the USGS and Temple University using a high-temperature borehole televiewer (BHTV). Stress-induced borehole breakouts were observed over many depth intervals in the well. Breakouts, caused by compressive failure of the borehole wall, have been analyzed by the USGS and Temple University to determine the orientation of the minimum horizontal stress and provide constraints on the relative magnitudes of the horizontal principal stresses, using image-log analysis techniques applied in other deep geothermal wells (e.g., Davatzes and Hickman 2006).
Davatzes and Hickman (2011) report that clear borehole breakouts are distributed throughout the BHTV image log and indicate a consistent minimum horizontal stress (Shmin) of 92.0° +/- 16.6°. The lack of rotation of the stress direction implies that there are no actively slipping faults within the borehole. Boreholes near active fault zones can show horizontal axis stress rotations as large as 70° and 90°, as were observed in image logs from Coso (Davatzes and Hickman 2006) and Dixie Valley (Hickman et al. 2000), respectively.
Davatzes and Hickman (2011) also report a natural fracture population of over 350 fractures in the 739 m (2425 ft) logged interval in NWG 55-29. They have identified two dominant fracture sets that strike NNE-SSW and dip approximately 50° to the west and east. Poor expression of the fractures indicates that many of them might be partially healed. The relationship between the natural fracture orientations and Shmin suggests a favorable setting for hydroshearing in NWG 55-29, which is also likely to be found elsewhere in the NEWGEN FORGE project area.
J.2.5 Natural Seismicity at the NEWGEN FORGE Site
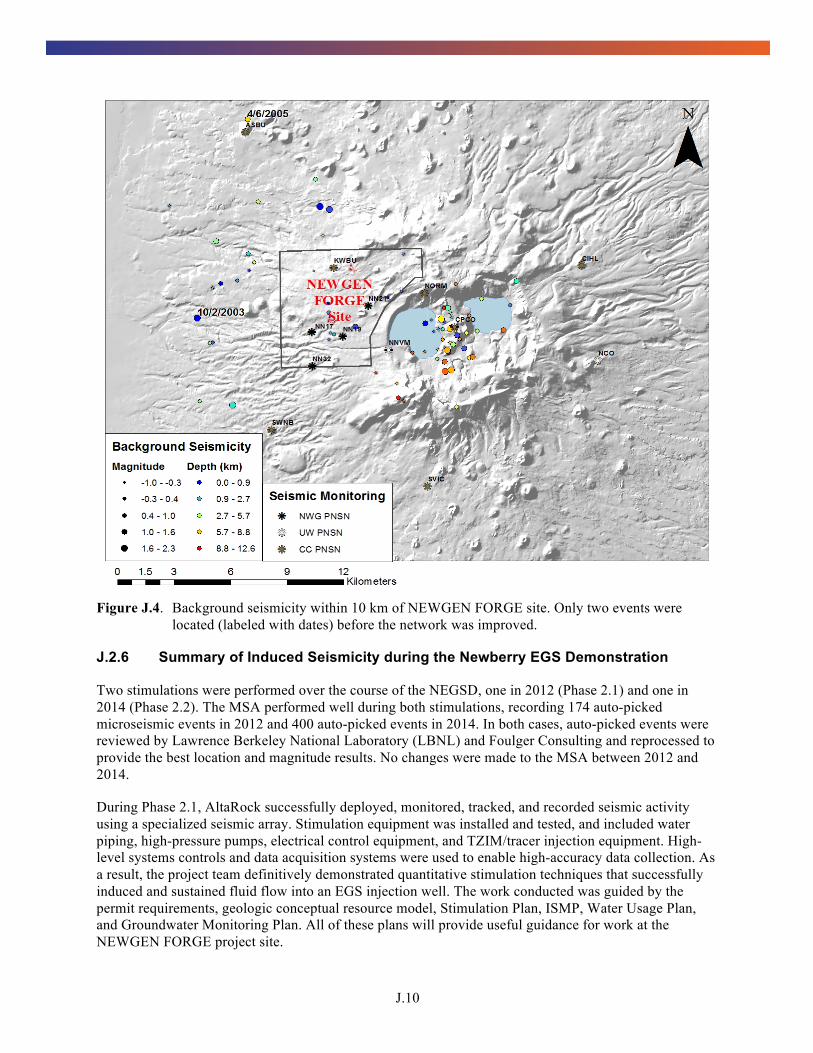
The regional seismic network at Newberry Volcano was greatly improved in 2011 and 2012. In 2009, the only station at Newberry Volcano was NCO, a single-component, short-period seismometer on the east flank and only two micro-earthquakes (MEQs) (M 1.6-2.3) were detected at the Newberry Volcano in the prior 25 years (PNSN 2015). In 2011, the USGS installed six three-component broadband seismometers and one three-component short-period sensor (PNSN 2015). In 2012, four of the borehole stations in the NEGSD MSA were added to the Pacific Northwest Seismic network. The seismic monitoring of Newberry Volcano is now comprehensive; events smaller than M 0.0 are locatable. Since 2012, 72 natural MEQs with M 2.3 to -1.0 have been located within 10 km of the NEWGEN FORGE site (Figure J.4).
For further information about MSA and injection-induced seismicity associated with the NEGSD, see sections below.
J.10
Figure J.4. Background seismicity within 10 km of NEWGEN FORGE site. Only two events were
located (labeled with dates) before the network was improved.
J.2.6 Summary of Induced Seismicity during the Newberry EGS Demonstration
Two stimulations were performed over the course of the NEGSD, one in 2012 (Phase 2.1) and one in 2014 (Phase 2.2). The MSA performed well during both stimulations, recording 174 auto-picked microseismic events in 2012 and 400 auto-picked events in 2014. In both cases, auto-picked events were reviewed by Lawrence Berkeley National Laboratory (LBNL) and Foulger Consulting and reprocessed to provide the best location and magnitude results. No changes were made to the MSA between 2012 and 2014.
During Phase 2.1, AltaRock successfully deployed, monitored, tracked, and recorded seismic activity using a specialized seismic array. Stimulation equipment was installed and tested, and included water piping, high-pressure pumps, electrical control equipment, and TZIM/tracer injection equipment. High-level systems controls and data acquisition systems were used to enable high-accuracy data collection. As a result, the project team definitively demonstrated quantitative stimulation techniques that successfully induced and sustained fluid flow into an EGS injection well. The work conducted was guided by the permit requirements, geologic conceptual resource model, Stimulation Plan, ISMP, Water Usage Plan, and Groundwater Monitoring Plan. All of these plans will provide useful guidance for work at the NEWGEN FORGE project site.

J.11
Baker Hughes HPump horizontal 14-stage centrifugal pumps with 800 HP, 60 Hz, 460 V motors, and Electrospeed 3© Variable Speed Drives were used for stimulation in 2012 and 2014. The pumps were installed with a high-pressure piping and valve configuration, which allowed them to operate in series or in parallel. The maximum injection pressure that could be achieved by the equipment is approximately 20 MPa (2900 psi), with an associated flow rate up to 63 L/s (750 gpm). More information about pumps, piping, and infrastructure used can be found in the NEGSD Phase 2.1 (AltaRock 2014) and Phase 2.2 Reports (AltaRock 2015).
Phase 2.1 stimulation was carried out in three stages separated by injection of TZIM used to block open fractures and initiate flow into new zones. During Stage 1, injectivity began to improve when the injection pressure exceeded 12.4 MPa (1798 psi) and the flow rate reached 20.6 L/s (326 gpm). Stage 1 injection operations were carried out for 18 days before mechanical issues with the pumps led to temporary shutdown. The first microseismic event recorded during this stage took place 12 hours after initial pumping at 9.3 MPa, followed 42 hours later by six events beginning at 12.5 MPa (1812 psi), indicating pressures at or above this would sustain hydroshearing in NWG 55-29. Wellhead pressure was cycled between 12.4 and 15.2 MPa (1798–2205 psi) during Stage 2. Stage 3 ran for 4 days, reaching a maximum WHP of 16.7 MPa (2422 psi). In total, 174 microseismic events ranging from M <0.0 to M 2.39 during Phase 2.1, demonstrated the efficacy of the MSA for recording and locating microseismic events.
During Phase 2.1, microseismicity in the EGS zone began on October 17, 2012, and continued for 4 months. Seismic events during stimulation were located automatically in real time by software that detected seismic signals observed from all of the seismometers simultaneously, and that had clear enough P- and S-waves to locate them in proximity to the well. The MSA network functioned well during stimulation and post-stimulation, although borehole stations returned significantly higher quality P- and S-wave data than surface stations. This is likely due to waveform attenuation by unconsolidated material (typically volcanic cinders, ash, and pumice) surrounding the shallow surface stations. Events automatically detected by the software were then reviewed by seismologists in order to qualitatively adjust the P- and S-wave arrival times as an initial analysis of the event locations. In most cases, preliminary locations were determined within 8 hours of occurrence (Cladouhos et al. 2013; AltaRock, 2014).
AltaRock developed a project-specific ISMP (AltaRock 2011b; BLM 2011) for the NEGSD that satisfied the requirements of the Induced Seismicity Mitigation Protocol adopted by the DOE (Majer et al. 2008, 2012). This included predicting the largest possible induced MEQ and developing predefined thresholds of event magnitudes and ground motion, accompanied by appropriate mitigation actions.
The first shallow seismic event with a magnitude greater than 1.0 occurred on November 3, just after the WHP had exceeded 12 MPa (1740 psi), and was followed by a drop in WHP to ~6MPa (870 psi) due to pump malfunction. At this time, there was uncertainty about whether the shallow events were being well-located, or if their locations were an artifact of inaccurate phase picks and/or a poor velocity model. In any case, the WHP and flow rates were kept low during most of November while pumps were repaired. Shallow seismicity with smaller magnitude (moment magnitude [Mw] < 1) did continue to occur even at low WHPs. At the time, we surmised that thermal expansion of previously injected water was causing the seismicity, so we did not expect that diversion at the well bore could cause the shallow events to cease.
In mid-November, after the seismologists (Ernie Majer at LBNL and Bruce Julian at Foulger Consulting) determined that the shallow depths were likely real, AltaRock planned to inject TZIM as soon as the pumps were repaired and brought back online (e.g., see November 18 seismic report, Appendix D). When the stimulation pumps were brought back online, TZIM was injected before returning to higher WHP. Although the microseismicity did seem to initially deepen, the shallow events soon returned during
J.12
Stage 2 of stimulation. After two stronger shallow events occurred on December 1, the decision to proceed to Stage 3 was made and the mixing unit personnel were called back to the site. After TZIM treatment, Stage 3 did not have any shallow events (Mw > 1.0) until the last day of stimulation, December 7. The strongest seismic event recorded during Phase 2.1 occurred on the last day of stimulation (12/7/2012) and had a Mw of 2.39, which exceeded the initial ISMP Mw limit of 2.0. The mitigation action for this limit was to wait 24 hours before increasing WHP or flow rate. Because the event occurred on the last day of planned stimulation, no modification to operational plans was necessary and the well was shut-in later that day. Ground motion at the NNVM strong-motion seismometer (SMS) due to the Mw 2.39 event was an estimated peak ground acceleration (PGA) of 0.1% g, far below the action threshold set in the 2011 ISMP of 1.4% g. From the seismometer closest to the event a PGA of 0.3% g was estimated. That level of ground motion would not necessarily have occurred at the surface, due to the highly attenuating cinders blanketing the volcano flanks. In any case, there were no reports of any felt seismicity from the field crews onsite for this or any other event.
Ultimately, the 2012 stimulation zone was found to be shallower than initially expected based on microseismic data (Cladouhos et al. 2013). Further investigation concluded that a failure in the surface casing of the stimulation well allowed the majority of the injected water to leave the casing and enter the subsurface at a depth shallower than was intended in the project plan. More information can be found in Cladouhos et al. (2013), Petty et al. (2013), and the NEGSD Phase 2.1 Report (AltaRock 2014). The casing was repaired via a tie-back cemented to the surface in early 2014, prior to Phase 2.2 stimulation.
Phase 2.2 stimulation was carried out in a manner similar to Phase 2.1. During two rounds of stimulation the MSA detected 400 microseismic events ranging in magnitude from M 0 to M 2.26. After stimulation round one, perforation shots were used to increase the number of fluid exit points through the casing. The first microseismic event occurred after 2 and a-half days of injection when the WHP exceeded 180 bar (2600 psi) (Figure J.5). After 2 more days of injection, the second event occurred when the WHP exceeded 193 bar (2800 psi) and continued at higher rates of over 30 events per day from September 30 through October 2, with a peak of 42 events/day on October 1. After 5 days of increasing seismicity and improving injectivity, the seismicity rate dropped by more than 50%.
At the beginning of Round 2, while injecting to cool for 44 hours in preparation for the perforation shots below 155 bar (2250 psi) no microseismic events were detected. After the perforation shots, injection continued for 17 hours and the first event of the second round was created at a WHP of 162 bar (2355 psi), and seven more events were detected over the next 6 hours while the WHP was below 180 bar (2600 psi). After increasing the WHP to 187 bar (2700 psi) there was a 17.5-hour seismic gap followed by a six-event swarm over 23 minutes. The rate of seismicity that day (November 16) reached 19 events/day, with a peak rate of 22 events/day at a WHP of 193 bar (2800 psi) on the final day of stimulation (November 20). Thus, we can conclude that the hydroshearing pressure is around 180 bar (2600 psi). This is significantly higher than determined in 2012, even before leaks developed in the casing.
The most reliable moment magnitudes for the induced microseismic events were determined by LBNL, and represent 350 of the 400 events detected during Phase 2.2. The 350 LBNL magnitudes were used to determine the Gutenberg-Richter Law b-value of 1.0 (Figure J.6). The only two events above M 2.0 during the stimulation were an M 2.1 on October 4 and an M 2.3 on November 17. There were 23 events between M 1.0 and 2.0. The rollover of the size distribution below M 0.0 (Figure J.6) indicates that the seismic system’s lower sensitivity threshold was near M 0.0.

J.13
At the end of each day the size distribution of the previous 100 events was plotted and the b-value calculated (as shown in Figure J.7). This figure shows that although the overall b-value was 1.0, the sliding window of 100 events started low (0.85) and trended upward (1.1). Dips in the trend were associated with events with M > 1.3 on 10/5, 10/12, 10/13, 11/16, and 11/17. McGarr (2014) proposed a simple relationship between the maximum moment of induced seismicity and volume change due to extraction or injection of fluid:
Mo(max) = G Vinj (J.1)
where Mo(max) is the moment of the largest possible induced event, G is the modulus of rigidity of the rock mass, and Vinj is the injected volume of fluid in cubic meters (we only need consider injection here). McGarr (2014) compiled data from injection projects worldwide to compare them to the theoretical limit on induced seismicity magnitudes. In order to track seismic risk at Newberry Volcano, NEGSD operators plotted cumulative injected volume, cumulative moment magnitude, and maximum moment magnitude and overlaid them on the McGarr (2014) data compilation (Figure J.8). For NEGSD data points, the values were plotted daily, and cumulative moment magnitude was included as well as the maximum moment. The ratio of seismic energy to volume of injected water at the NEGSD site was significantly lower than at other sites that have experienced seismicity due to fluid injection. Thus, Newberry Volcano appears to have a much lower seismogenic index (i.e., Shapiro et al. 2010) than other sites. The NEGSD data points fall far below the line plotted from the empirical formula developed by McGarr (2014) on a plot of maximum seismic moment to injected volume.
Figure J.5. Daily rate of seismicity detected during Phase 2.2 stimulation at the NEGSD site. Note
correlation with WHP and flow rate.

J.14
Figure J.6. Log-log plot of size distribution of MEQs. Slope of line is b-value in the Gutenberg-Richter
Law.
Figure J.7. Evolution of b-value during stimulation. Calculated from last 100 events including the date
shown.

J.15
Figure J.8. Maximum seismic moment and magnitude as functions of total volume of injected fluid.
Data compiled by McGarr (2014).
Figure J.9 shows the MEQs detected during the 2014 stimulation of NWG 55-29. The NWG 55-29 seismic cloud extends approximately 1500 m (4921 ft) in the east-west direction and 1500 m (4921 ft) vertically.
In summary, many of the lessons learned from previous work during the NEGSD will be applicable to the NEWGEN FORGE effort. These include the following:
• Permitting and environmental compliance activities have already been carried out at Newberry Volcano as part of the NEGSD project and the CalEnergy Exploration efforts within the NEWGEN project area; regulating agencies are familiar with EGS, the project area, and have been adaptable to changing situations based on the outcome of field activities.
• Public outreach activities have garnered local, regional, and national support from residents and political leaders alike. Website, blog, and Facebook pages already have an established following.
• Groundwater monitoring before, during, and after stimulation showed no connection between the EGS reservoir at NWG 55-29 and the local groundwater system; a Groundwater Monitoring Plan has already been designed and implemented, and is easily modifiable for the NEWGEN FORGE work.

J.16
Figure J.9. Location map (top) and cross sections (bottom left looking north; bottom right looking west)
of all located events from initial seismic catalog during the NEGSD 2014 stimulation of NWG 55-29.

J.17
• The design, installation, operation, and maintenance of the MSA system was very successful; microseismic events were successfully located by auto-picking software and refined by seismologists using the same data, and velocity models have been improved as well. Telemetry and solar power systems worked well under harsh environmental conditions.
• The 2011 ISMP was successfully implemented with no seismic events exceeding predicted threshold magnitude values.
• Stimulation provided valuable field experience with EGS technology for project participants, local and national contractors, academic, and other groups involved.
• Hydroshearing pressure has been shown to be around 180 bar (2600 psi) at a depth of 2,900–3,000 m in NWG 55-29; this will inform future stimulation design and operating parameters to improve successful EGS reservoir practices at the NEWGEN FORGE site.
J.3 Induced Seismicity Mitigation Protocol – Summary
The DOE requires that EGS demonstration projects throughout the United States follow the guidelines provided by the Protocol for Induced Seismicity Associated with Enhanced Geothermal Systems (Majer et al. 2012). This protocol includes the following steps:
• Step 1: Perform preliminary screening evaluation. • Step 2: Implement Communications and Outreach program. • Step 3: Identify criteria for ground vibration and noise. • Step 4: Establish seismic monitoring. • Step 5: Quantify the hazard from natural and induced seismic events. • Step 6: Characterize the risk from induced seismic events. • Step 7: Develop risk-based mitigation plans.
The following narrative summarizes how each of these steps was implemented for the 2011 ISMP and updates that will be performed during Phase 2 to transform this preliminary ISMP to the final NEWGEN ISMP. Following the summary, Sections J.4 through J.10 provide further details about the current status of ISMP development. Each step will be updated and adapted throughout the NEWGEN FORGE project based on experience and best practices in research and industry when new information becomes available.
J.4 Step 1. Preliminary Screening Evaluation
Preliminary seismic investigation of the NEWGEN FORGE site has included the URS study (summarized in Section J.4.2, details provided in Section J.8), LiDAR lineament mapping and structural analysis (see Section J.2.4.), and review of the relevant scientific literature. Additionally, the NEGSD project has provided significant data on background and induced seismicity at Newberry Volcano.
J.4.1 Step 1a. Review of Laws and Regulations
Regulatory Oversight
The project is located entirely within the Deschutes National Forest, managed by the USFS. The majority of NEWGEN FORGE project activities will take place on federal geothermal leases on these lands, which are administered by the BLM. Because the project occurs on federal lands, any proposed activities on the NEWGEN FORGE site will require NEPA compliance.
With regard to NEPA, the BLM will be the lead agency because the majority of the NEWGEN FORGE project activity would occur on land under geothermal leases issued and administered by the BLM.
J.18
Because some of the project activities may occur on lands where surface disturbance is under the authority of the Forest Service, Forest Service will be a cooperating agency for the preparation of any NEPA documents.
We foresee that BLM, as they have in the past, will elect to prepare an EA and the NEWGEN team will work with BLM to conduct this analysis. The NEWGEN team has worked closely with the BLM and USFS on three previous EAs and was successful in helping these agencies complete the EAs. Induced seismicity will be an issue of concern for NEPA compliance as it was during the NEGSD project. The successful completion of the NEGSD EA, which includes the 2011 ISMP, and the NEGSD project will provide valuable background data for any new NEPA compliance necessary.
Laws and Regulations Reviewed
As a participating member of the NEWGEN team, AltaRock has conducted a review of relevant federal, state, and local laws and regulations, and has determined that laws and regulations are not so restrictive that any effects of induced seismicity would not be allowed. No laws or regulations in Oregon specifically prohibit or regulate induced seismicity. In the absence of laws and regulations related directly to induced seismicity from EGS activities, AltaRock reviewed laws and regulations related to activities that could potentially cause vibration or induced seismicity, such as the impounding of reservoirs, and mining and quarrying (Cypser and Davis 1998), both activities that are not uncommon in Oregon.
The following laws, regulations, and administrative requirements, and Oregon Revised Statutes (ORS) were reviewed for the NEGSD project and will also be relevant to the NEWGEN FORGE project:
• National Environmental Policy Act of 1969, as amended
• Noise Control Act, 42 U.S.C. § 4901
• Clean Water Act
• 2009 ORS Chapter 517, Mining and Mining Claims
• 2009 ORS § 540.350, Dams, Dikes and Other Hydraulic Works
• 2009 ORS Chapter 467, Noise Control
• 2009 ORS Section 197, Comprehensive Land Use Coordination
• 2009 ORS § 401.918, Emergency Management and Services, Seismic Safety Policy, Advisory Commission
• 2009 ORS § 467.120, Agricultural and Forestry Operations, Mining or Rock Processing
• 2009 ORS § 469.501, Energy Facility Siting, Construction, Operation and Retirement Standards
• Oregon Water Resources Department, Division 20, Dam Safety
• Oregon Department of Geology and Mineral Industries, Division 20, Geothermal Regulations
• Oregon Department of Geology and Mineral Industries, Division 30, Oregon Mined Land Reclamation Act
• Oregon Department of Environmental Quality, Administrative Rules, Division 35, Noise Control Regulations
• Deschutes County Code (DCC), Chapter 8.08, Noise Control: County Noise Control Ordinances
• DCC Chapter 18: County Zoning

J.19
• DCC Chapter 23.76: County Comprehensive Plan, Energy
• City of La Pine, Comprehensive Plan, March 2010.
Dams, Reservoirs, Mining, and Quarrying
Laws and regulations governing dams do not specifically refer to induced or triggered seismicity or earthquakes, but do prohibit the construction of “any dam, dike or other hydraulic structure or works, the failure of which would result in damage to life or property” (2009 ORS § 540.350, 2009 ORS Chapter 517, Oregon Water Resources Department, Oregon Administrative Rules [OAR] Division 20, Dam Safety; emphasis added). Under 2009 ORS § 540.350, governing the building of dams, approval of the site and plans does not relieve the owners of liability to damage to life or property. The Oregon Water Resources Department also provides guidelines and rules on dam safety, which include “hazard ratings” for dams based on the type and extent of damage to people or property that occurs if a dam fails. No information, guidelines, or policy were found that suggested that reservoir-induced seismicity was a serious concern in Oregon. The focus appears to be on dam failure in the event of natural seismicity and flooding as a result of failure.
Mining and quarrying laws and regulations similarly aim to minimize or eliminate damage to people and property, but do not specifically have regulations directed at induced seismicity (Oregon Department of Geology and Mineral Industries [DOGAMI] Division 30, 632-030-0005, 2009 OAR Chapter 517). For example, Section 632-030-0025 of DOGAMI, Division 30, lists requirements for an operating permit, including how to minimize damage to property and people, and 2009 OAR § 517.990 provides that a person who “knowingly and recklessly causes substantial harm to human health or the environment” without a permit is subject not just to civil penalties, but also criminal penalties.
EGS and Strict Liability
AltaRock also reviewed the standard for strict liability in Oregon to determine whether a theory of strict liability would be applied to induced seismicity. While the NEWGEN FORGE project will likely be held to a high standard of care, it is also likely that if individuals are injured or property is damaged, Oregon courts will apply trespass, negligence, or nuisance theory of liabilities rather than strict liability.
Whether an activity is abnormally dangerous is a question decided by the courts, and the standard used is whether an activity is “extraordinary, exceptional, or unusual, considering the locality in which it is carried on; when there is a risk of grave harm from such abnormality; and when the risk cannot be eliminated by the exercise of reasonable care” (Buggsi, Inc. v. Chevron USA, Inc., 857 F. Supp. 1427, 1432 [D. Or. 1994]; see also Tri-County Metropolitan Transit District v. Time Warner Telecom of Oregon, Dist. Court. D. Or. 2008, finding that drilling under mass transit rail lines in an urban setting was not an ultra-hazardous activity).
Several factors suggest that a court may not apply a standard of strict liability to the NEWGEN FORGE project. For example, the activity is not located in a populated area, and “the existence of a high degree of risk of some harm to persons and property” is shown to be low in subsequent sections of this plan (see Restatement (second) of Torts § 519). Furthermore, the existence of stringent laws and regulations controlling a particular activity are also taken into account, and Oregon does not provide induced seismicity guidelines to other industries such as mining. It is likely, therefore, that Oregon courts would not apply a theory of strict liability to EGS activities.
If individuals are injured or property is damaged, it is likely that the individual could, however, claim compensation under trespass, negligence, or nuisance theory of liabilities. A similar conclusion was
J.20
reached for an analysis of Colorado law and induced seismicity (Cypser 1996). AltaRock’s research did not reveal any cases under which an individual sought compensation for induced seismicity in Oregon.
Geothermal Energy and Deschutes County
The only statute that AltaRock believes deals directly with induced seismicity from a geothermal project is the DCC Chapter 23.76 (County Comprehensive Plan, Section on Energy). This chapter states that geothermal investigations are occurring in the county near Newberry Crater and that “problems with objectionable smells from released gases, possible groundwater contamination, earth subsidence or quakes are all hazards to be considered in geothermal energy use” (emphasis added). The chapter further provides that the County’s support of geothermal development shall be conditioned upon satisfactory evidence that sufficient safeguards are provided for “induced seismicity.” This chapter suggests that Deschutes County does not prohibit activity based on the likelihood of induced seismicity.
J.4.2 Step 1b. Determine the Radius of Influence
The 2011 ISMP used a maximum magnitude (Mmax) for an induced seismic event of 3.5 (see Section J.8). Given the results of the NEGSD (Section J.2.6), this value of Mmax remains reasonable. Wong et al. (2010) developed a shake map [Figure J.10]) centered on NWG 55-29. The radius of influence for PGA > 1% g is about 10 km.
The largest induced seismic event of the NEGSD was Mw 2.39. Ground motion at the NNVM SMS due to a Mw 2.39 event was an estimated PGA of 0.1% g, far below the action threshold of 1.4% g set in the 2011 ISMP. From the seismometer closest to the event, a borehole seismometer at NN17, a PGA of 0.3% g was estimated. That level of ground motion would not necessarily have occurred at the surface because of the highly attenuating cinders blanketing the volcano flanks. In any case, there were no reports of any felt seismicity from the field crews onsite for this or any other MEQ. Due to winter conditions, no visitors were near the site.
J.4.3 Step 1c. Identify Potential Impacts
The population centers closest to the NEWGEN FORGE site are Bend, Sunriver, Three Rivers, and La Pine. All four of these population centers are located outside of the zone within which perceivable shaking (PGA > 0.01 g) may occur (Figure J.10).
Populations in the zone where perceivable shaking may occur (radius < 10 km) are limited to visitors to the NNVM and the adjacent Deschutes National Forest. This transient population is primarily limited to summer months due to winter snow closures. The 2011 ISMP estimated that 659 people could be within the zone where perceivable shaking may occur during the peak summer season daytime hours. During the night, up to 333 people might be within the zone where perceivable shaking may occur.
During Phase 1 of NEGSD the USFS provided AltaRock with a list of 52 key assets within the NNVM, which include various buildings, two bridges, a road, a dam, and three slope faces. These assets include all structures between the 0.06 g and 0.10 g contour lines of PGA in Figure J.10 as well as many other structures located within the 0.01 g to 0.05 g contour lines. The list includes Paulina Lake Lodge and associated cabins, East Lake Lodge and associated cabins, Paulina Lake Guard Station and associated USFS structures, and other structures along the Paulina-East Lake Road. The dam and collocated bridges span Paulina Creek at the outlet of Paulina Lake, adjacent to Paulina Lake Lodge.

J.21
Figure J.10. Shake map from URS Addendum Figure 1 (Wong et al. 2011). Only Class A Quaternary
faults are shown, so the Class B Newberry Caldera ring fractures are not shown. (Hazards from natural and induced seismic events are further described in Section J.8.)
J.4.4 Step 1d. Potential Damages
Third-party engineering evaluations of the potentially vulnerable buildings and bridges in NNVM were provided as Appendix H and I of the 2011 ISMP. Summary results are presented below.

J.22
For the 12 NNVM structures scored, the PGA resulting in a 10% probability of collapse was determined to be between 0.25 and 1.1 g. Further analysis indicates that in a “worst case” 0.10 g PGA the probability that an M 3.5 seismic event could produce the collapse would be 1.2% or less for all NNVM structures. SGH noted that the bridge is constructed “on fairly competent bedrock.” SGH calculates the PGA limit for the bridge to be 0.28 g, similar to most susceptible buildings.
SGH also evaluated thresholds for cosmetic damage to buildings and recommended that the peak particle velocity be limited to 2 cm/s to minimize the potential for cosmetic damage to the buildings. This correlates to an approximate PGA of 0.025 g. As will be discussed in sections below, mitigation measures designed to slow induced seismicity will begin at a PGA of 0.014 g, well below the shaking level that might cause cosmetic damage, and an order of magnitude below the shaking level that would cause collapse of NNVM buildings.
J.4.5 Step 1e. Overall Risk Level
When the 2011 ISMP was developed, prior to hydraulic stimulation of NWG 55-29, the overall risk would have likely been assigned to “Level II: Low – Can proceed with planning but may require additional analysis to confirm.” After two EGS stimulations in 2012 and 2014, with extensive new data collection and analysis, the overall risk can be confidently assigned as “Level I: Very Low – proceed with planning.”
J.5 Step 2: Communications and Outreach Program
The NEWGEN team has developed a Communications and Outreach Plan that builds on the experiences of the NEGSD public outreach work. The Communications and Outreach team will use the plan to guide outreach activities before, during, and after field activities at the NEWGEN FORGE site. Public outreach efforts will include maintaining an up-to-date online presence including:
• the NEWGEN blog, found at www.blog.newberrygeothermal.com • the NEWGEN Facebook page, found at www.facebook.com/NewberryEGS • the NEWGEN website, found at www.newberrygeothermal.com.
In addition, monthly public outreach meetings will be held in the local area during months when field operations take place. These will provide a forum for the public to engage personally with the project team; NEWGEN technical staff will be present to provide a project update and field questions and concerns from stakeholders. Public outreach meetings will be advertised via the NEWGEN blog, Facebook page, and website. Local media sources will also be notified.
Local media in the Bend and La Pine area include several newspapers, television stations, and online news sources. The communications plan includes maintaining active contact with these groups as well as national media outlets to foster positive engagement and accurate reporting.
J.5.1 Communications and Outreach Plan
The NEWGEN Communications and Outreach Plan (Appendix G) is designed to inform stakeholders about EGS, induced seismicity, NEWGEN, and FORGE, and clearly state the benefits and potential that EGS holds for adding baseload renewable energy to the grid. The plan also addresses concerns about safety, while highlighting the benefits to the community and region of locating FORGE at the NEWGEN site. The NEWGEN team will demonstrate credibility, engage new partners, solicit broad support from political and community leaders, and build a strong case for the NEWGEN FORGE project through forward communications and outreach (Figure J.11).

J.23
Figure J.11. David Stowe, NEWGEN Public Outreach Coordinator, speaks to students from Oregon
State University during a field trip to the NEGSD site. Local outreach events like this significantly improved local support for the project and will be continued throughout the course of the NEWGEN FORGE project.
J.5.2 Field Activities with Potential Stakeholder Impact
Due to the potential for induced seismicity well stimulation is a NEWGEN field activity that has potential for stakeholder impact. Therefore, prior to initiation of well stimulation, notices will be published in the local newspapers and contact information (phone numbers, email addresses, websites, etc.) will be provided for interested citizens to receive more information, ask questions, and report concerns. The project web sites will be updated to inform the public that field activities have begun. Public meetings will be held monthly during active field operations to discuss the results with stakeholders. These public meetings will include presentations to explain preliminary results and the next steps and time for questions and answers so that community members can voice their concerns. Public meetings will be advertised at least 1 week in advance in local papers and on the NEWGEN website and blog.
For example, during the NEGSD, the 2011 ISMP required that prior to seismicity-inducing field activities users of Road 500 be notified. The road, which leads to Paulina Peak, has a history of frequent rock-fall due to a road cut. Temporary signs placed at the top and top and bottom of the road included a phone number to call in the case of rock slides on the road. This indirect mitigation action was established in cooperation with USFS staff. No excess rock-fall was observed in 2012 or 2014 due to induced seismicity; therefore, this requirement should be re-evaluated for the NEWGEN ISMP to determine if it is necessary.
J.5.3 Communications and Outreach after Field Activities
After field operations deemed to have potential impacts on stakeholders, including but not limited to well drilling, stimulation, and flow testing, the results of the operations will be communicated to the public and other stakeholders through web sites, social media, press releases, peer-reviewed publications, public outreach meetings, and required DOE reporting. Plans for future activities will also be reported, including the potential for cancellation of the project and site reclamation, or continued activities including stage-gate review, stimulation activities, and drilling of production wells, etc.
J.24
In addition to the public outreach described above, frequent regulatory and technical communications with government agencies and laboratories will continue throughout the project, with increased frequency during field site activities. Based on defined magnitude threshold values, event-specific communications in response seismic events will be carried out in accordance with the NEWGEN ISMP.
J.6 Step 3. Identify Criteria for Ground Vibration and Noise
The ISMP developed for the NEGSD included two different independent engineering analyses that derived the following conclusions:
• The theoretical maximum magnitude of an induced seismic event at Newberry Volcano is M 4.0.
• The probability of a seismic event with a magnitude between M 3.0 and M 4.0 is less than 1%.
• There is no difference in seismic hazard between the natural seismicity and the hazard introduced by EGS-induced seismicity.
• If an M 3.5 seismic event did occur, the potential for damage at the nearest structures within the NNVM would be light, corresponding to a Modified Mercalli Intensity of VI.
These conclusions provide strong evidence that the NEWGEN site on the west flank of the Newberry Volcano is an appropriate and ideal location for the proposed FORGE. Reservoir stimulations carried out in 2012 and 2014 as part of the NEGSD support the above-mentioned predictions. In 2012, the largest induced seismic events recorded during 2012 and 2014 were M 2.39 and M 2.26, respectively. Further characterization of the potential effects of induced seismicity is provided below.
J.6.1 Populations within the Potential Shake Zone
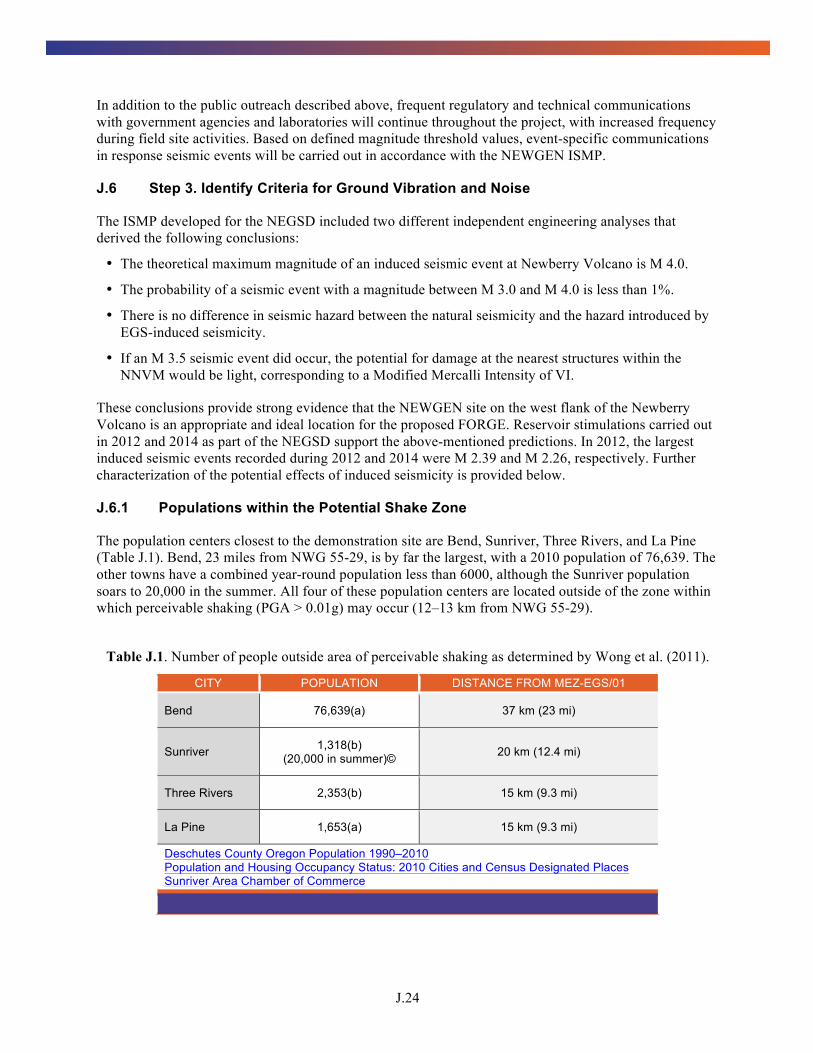
The population centers closest to the demonstration site are Bend, Sunriver, Three Rivers, and La Pine (Table J.1). Bend, 23 miles from NWG 55-29, is by far the largest, with a 2010 population of 76,639. The other towns have a combined year-round population less than 6000, although the Sunriver population soars to 20,000 in the summer. All four of these population centers are located outside of the zone within which perceivable shaking (PGA > 0.01g) may occur (12–13 km from NWG 55-29).
Table J.1. Number of people outside area of perceivable shaking as determined by Wong et al. (2011).
CITY POPULATION DISTANCE FROM MEZ-EGS/01
Bend 76,639(a) 37 km (23 mi)
Sunriver 1,318(b) (20,000 in summer)© 20 km (12.4 mi)
Three Rivers 2,353(b) 15 km (9.3 mi)
La Pine 1,653(a) 15 km (9.3 mi)
Deschutes County Oregon Population 1990–2010 Population and Housing Occupancy Status: 2010 Cities and Census Designated Places Sunriver Area Chamber of Commerce

J.25
Populations in the zone where perceivable shaking may occur are limited to visitors to the NNVM and the adjacent Deschutes National Forest. This transient population is primarily limited to summer months due to winter snow closures (Table J.2). An estimated 659 people could be within the zone where perceivable shaking may occur during the peak summer season daytime hours. During the night, up to 333 people might be within the zone where perceivable shaking may occur. Some visitors are also present during winter days and overnight stays, accessing the area only by foot, ski, or snowmobile. These populations are probably 10 to 100 times lower than summer populations.
Table J.2. Number of visitors within area of perceivable shaking as determined by AltaRock (2011).
LOCATION SEASON TOTAL 2010 (MAY–OCT)
PEAK MONTH TOTAL (AUGUST)
ESTIMATED DAILY AVERAGE DURING
PEAK SEASON
DAYTIME 56,118 20,405 659
Entrance Station 56,118(a) 20,405(a) 659(b)
Paulina Lake VC(c) 3,707(a) 1,994(a) 65(b)
OVERNIGHT 29,891 ND 333
Campgrounds(c) 20,502(a,d) ND 228(e)
Paulina Lake Cabins(c) 4,896(f) ND 55(f)
East Lake Cabins(c) 4,493(g) ND 50(g)
ND = no data (a) Statistics provided by Rod Bonacker (USFS) via email on June 14, 2011. (b) Calculated by dividing the Peak Month Total (August) by 31 days. (c) Visitors to these locations are also counted at the Entrance Station. (d) Season total extends through March 2011. (e) Calculated by dividing the Campground Season Total by 90 days (length of peak season); likely overestimated
because Campground Season Total extends through March 2011.
(f) Estimate assumes Paulina Lake Cabins are 80% occupied for 80% of the peak season. (g) Estimate assumes East Lake Cabins are 80% occupied for 80% of the peak season.
J.6.2 Vulnerability of Structures
As part of the 2011 ISMP, key assets within the NNVM, including various buildings, two bridges, a road, a dam, and three slope faces, were scored for seismic vulnerability. The assets include all structures between the 0.06 g and 0.10 g contour lines of PGA in Figure J.10, as well as many other structures located within the 0.01 g to 0.05 g contour lines. The list includes Paulina Lake Lodge and associated cabins, East Lake Lodge and associated cabins, Paulina Lake Guard Station and associated USFS structures, and other structures along the Paulina-East Lake Road. The dam and collocated bridges span Paulina Creek at the outlet of Paulina Lake, adjacent to Paulina Lake Lodge. One of the slopes crosses a road cut on Road 500 leading to Paulina Peak, which is prone to rock-fall that results in rocks on the roadway. The two other slopes are located on the north sides of Paulina and East Lakes, respectively, which USFS presented as a slope stability concern. The vulnerability of structures in and around La Pine were not assessed because analysis by URS (Wong et al. 2011) indicated that damage at that distance (15 km, 9 mi) is extremely unlikely.

J.26
On June 9, 2011, a SGH structural engineer and a T&R geotechnical engineer accompanied Rod Bonacker of the USFS to conducta visual inspection of the bridges, the dam, and 15 representative buildings and cabins. The purpose of the visit was to become familiar with the construction types of the buildings and the bridges. They determined that the buildings are all of wood-frame construction. The older vintage buildings are log cabin style, while the newer buildings are more traditional modern wood-frame construction, all with either a stone or concrete foundation. The three structures at the outlet of Paulina Lake were also inspected: the small (3 to 4 ft high) dam, the older (1954) and integral concrete bridge, which is no longer in use, and the new (2008) steel bridge installed over the concrete bridge. The talus slopes could not be observed in the field due to snow cover. On June 22, 2011, AltaRock presented the preliminary results of the field visit to the BLM, USFS, and DOE, and proposed the methodologies for evaluating the assets. All agencies agreed that the proposed method would adequately characterize the structural vulnerability of these assets.
The results of the SGH structural engineering evaluation of the buildings and bridges are included in Appendix H of the 2011 ISMP. Twelve representative structures were scored using the national standard document, FEMA 154, Rapid Visual Screening of Buildings for Potential Seismic Hazards: A Handbook. For the 12 NNVM structures scored, the PGA resulting in a 10% probability of collapse was determined to be between 0.25 and 1.1 g. Further analysis indicates that in a “worst case” 0.10 g PGA the probability that an M 3.5 seismic event could produce the collapse would be 1.2% or less for all NNVM structures. SGH noted that the bridge is constructed “on fairly competent bedrock.” SGH calculates the PGA limit for the bridge to be 0.28 g, similar to most susceptible buildings.
SGH also evaluated thresholds for cosmetic damage to buildings and recommended that the peak particle velocity be limited to 2 cm/s to minimize the potential for cosmetic damage to the buildings. This correlates to an approximate PGA of 0.025 g. As will be discussed in sections below, mitigation measures designed to slow induced seismicity will begin at a PGA of 0.014 g, well below the shaking level that might cause cosmetic damage, and an order of magnitude below the shaking level that would cause collapse of NNVM buildings.
The T&R geotechnical engineering evaluation of the dam and steep slopes is provided in Appendix I of the 2011 ISMP. The dam is described as a concrete wall .9–1.2 m (3–4 ft) high and 30–35 cm (12–14 in.) thick, connected to a concrete bridge on the downstream side. Both concrete structures are “keyed into and bottomed in” bedrock. According to the evaluation, no concrete dam is known to have failed as a result of earthquake-induced ground motion, including a 113 m (372 ft) high concrete arch dam that survived accelerations of 0.6 to 0.8 g caused by an M 6.6 earthquake. Therefore, the engineers conclude that “the probability of additional damage to the dam is low and the probability of failure of the dam is extremely remote.”
The likelihood of landslides on the slopes of concern in the NNVM was evaluated by comparing the maximum stable slope inclination for the five rock types exposed to the slope inclinations measured from LiDAR imagery. The T&R geotechnical engineer concluded that “all geologic units have a low to very low risk of a deep seated landslide during static and minor earthquake loading with PGA’s up to 0.1g.” T&R provides further support for this conclusion from a survey conducted by the USGS (Keefer 1984) of landslides caused by earthquakes, which concluded that for a landslide to occur during an M 4 earthquake, the epicentral distance would need to be less than 0.2 km (.1 mi). At Newberry Volcano, the nearest slope of concern is more than 4 km (2.5 mi) away from the project site.
In 2011, the USFS expressed concern about snow avalanches being triggered by induced seismicity. While possible, the 2011 ISMP considered this a very low risk. Despite the low risk, a plan to post signage to warn winter users of avalanche risk was developed. The final NEWGEN ISMP may need to revisit this concern.
J.27
J.6.3 NEGSD Damage Claim Procedures
Although all assessments have determined that it is extremely unlikely that any damage would occur, as part of the 2011 ISMP, a process to receive reports of damage, and to assess and rectify damage claims was prepared. Instructions and a tentative form to report damage were developed and would have been publicly provided if shaking measured by the SMS had reached PGA > 0.028 g. A licensed, independent civil engineer would have been hired to evaluate all claims and identify the appropriate response. Also developed was a procedure for compensation to be implemented in the event that damage was reported. The damage claim procedures will be re-evaluated for the final NEWGEN ISMP.
J.7 Step 4: Establish a Seismic Monitoring System
The MSA installed for NEGSD will serve as the basis for further improving seismic monitoring. For the temporary MSA required during NEWGEN Phase 2A, the currently operating four borehole stations plus Cascade Volcano Observatory stations already exceed the minimum requirement.
For the Phase 2C NEWGEN MSA a minimum of seven of the existing borehole stations and three surface stations will be re-occupied and reused. Expansion of the MSA to the north to better cover the NEWGEN FORGE site will require up to seven new borehole stations and four surface striations. The MSA will be expanded and operated by qualified members of the NEWGEN team and be deemed operational by regulatory groups, including the DOE, BLM, and USFS, in advance of any field activities that may potentially generate induced seismicity.
J.7.1 Current Seismic Monitoring
A review of historic data demonstrates that Newberry Volcano is essentially aseismic (Wong et al. 2010). In the pre-instrumental period, between 1891 and 1980, no earthquakes greater than M 5.0 occurred within 100 km of Newberry Volcano. Since the instrumental period began in 1980 with the expansion of the Pacific Northwest Seismic Network (PNSN) into Oregon, the historic record is probably only complete for events of ML ≥ 3.0. Since 1980, there have been only six ML ≥ 3.0 earthquakes within 100 km of the Newberry Volcano, most of which occurred in 1999 during a single swarm located 98 km southeast of Newberry Volcano. Wong et al. (2010) concluded that based on the instrumental record, no earthquakes have been recorded within 10 km of Well NWG 55-29 or Newberry Volcano. Four microseismic events have been recorded below the edifice of Newberry Volcano at distances of 10–15 km (6–9 mi) from NWG 55-29 (see Figure 5 in Wong et al. 2010). These events, which occurred in 2004 and 2005 at depths between 4 and 8 km, all had ML ≤ 2.2 (ANSS 2011).
In 2012, seven surface and eight borehole seismometers were installed during the NEGSD project. The Institute of Earth Science and Engineering provided 2 Hz three-component geophones for all borehole and surface stations. Borehole geophones were gimbaled and capable of being installed in boreholes with up to 10 degrees of deviation from vertical. Geotech Instruments DR-24 digitizers were configured and installed with each geophone. Electronics were powered by two solar panels installed on nearby trees and connected to two solar batteries inside the Hoffman boxes containing the digitizers.
Borehole station installation was completed in three basic steps. A holelock was lowered into the borehole via a wireline while mounted on a 24 V downhole impact wrench powered from the surface by an electrical cable. Once lowered to the installation depth, the wrench was activated, which rotated the threaded bottom of the lock relative to the top and pushed out carbide steel teeth that latched the holelock to the steel casing. The installation tool was removed, leaving the holelock in place. Next, a gyroscope connected to a laptop computer was first oriented (to north) at the surface and then lowered to the installed holelock where it was oriented by a bishop’s hat and groove on the holelock. The gyroscope’s
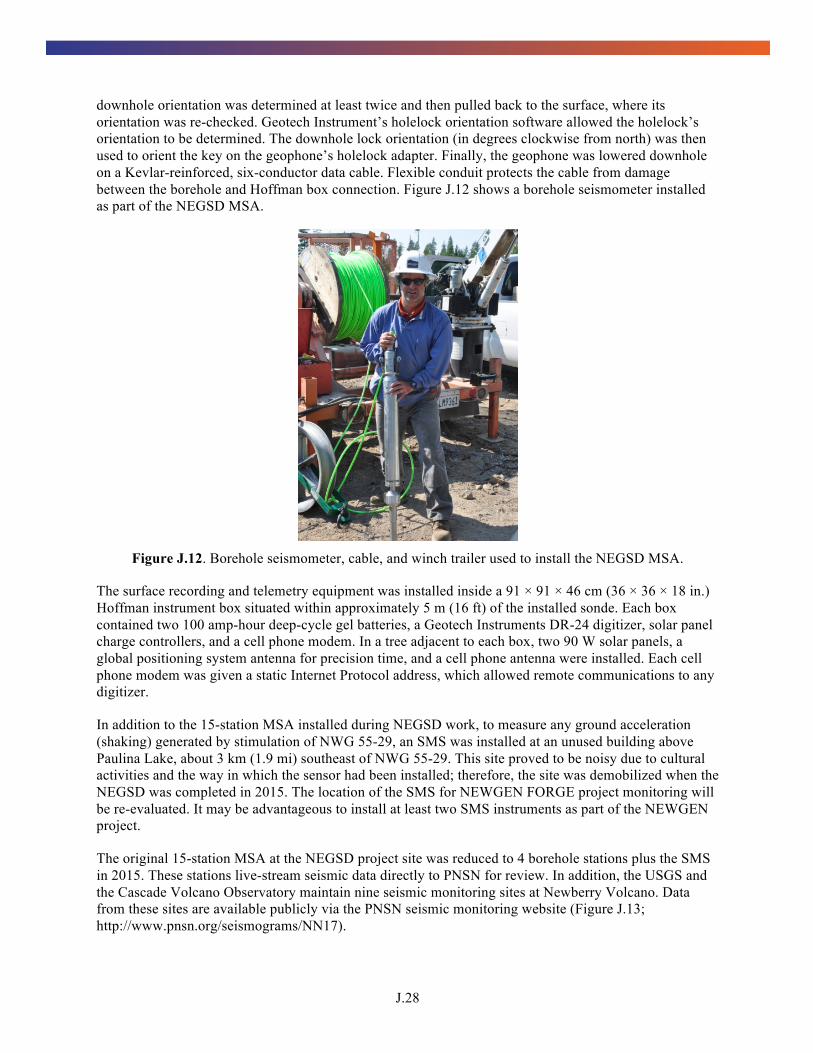
J.28
downhole orientation was determined at least twice and then pulled back to the surface, where its orientation was re-checked. Geotech Instrument’s holelock orientation software allowed the holelock’s orientation to be determined. The downhole lock orientation (in degrees clockwise from north) was then used to orient the key on the geophone’s holelock adapter. Finally, the geophone was lowered downhole on a Kevlar-reinforced, six-conductor data cable. Flexible conduit protects the cable from damage between the borehole and Hoffman box connection. Figure J.12 shows a borehole seismometer installed as part of the NEGSD MSA.
Figure J.12. Borehole seismometer, cable, and winch trailer used to install the NEGSD MSA.
The surface recording and telemetry equipment was installed inside a 91 × 91 × 46 cm (36 × 36 × 18 in.) Hoffman instrument box situated within approximately 5 m (16 ft) of the installed sonde. Each box contained two 100 amp-hour deep-cycle gel batteries, a Geotech Instruments DR-24 digitizer, solar panel charge controllers, and a cell phone modem. In a tree adjacent to each box, two 90 W solar panels, a global positioning system antenna for precision time, and a cell phone antenna were installed. Each cell phone modem was given a static Internet Protocol address, which allowed remote communications to any digitizer.
In addition to the 15-station MSA installed during NEGSD work, to measure any ground acceleration (shaking) generated by stimulation of NWG 55-29, an SMS was installed at an unused building above Paulina Lake, about 3 km (1.9 mi) southeast of NWG 55-29. This site proved to be noisy due to cultural activities and the way in which the sensor had been installed; therefore, the site was demobilized when the NEGSD was completed in 2015. The location of the SMS for NEWGEN FORGE project monitoring will be re-evaluated. It may be advantageous to install at least two SMS instruments as part of the NEWGEN project.
The original 15-station MSA at the NEGSD project site was reduced to 4 borehole stations plus the SMS in 2015. These stations live-stream seismic data directly to PNSN for review. In addition, the USGS and the Cascade Volcano Observatory maintain nine seismic monitoring sites at Newberry Volcano. Data from these sites are available publicly via the PNSN seismic monitoring website (Figure J.13; http://www.pnsn.org/seismograms/NN17).
J.29
Figure J.13. Pacific Northwest Seismic Network webpage showing the stations (triangles) operating as
of January 22, 2016, and earthquake information for events recorded within 20 km (12.4 mi) of the summit between June 3, 2015 and January 22, 2016.
Lessons learned from the NEGSD site will be incorporated into the design and implementation of the NEWGEN MSA design, installation, and operation and maintenance plan. Previous stimulation work in 2012 and 2014 showed that a well-designed, properly installed and operated MSA is capable of detecting small magnitude seismic events at Newberry Volcano. During the 2012 stimulation of NWG 55-29, about 175 events were located in the stimulation zone with magnitudes between M 0.0 and M 2.3 (Cladouhos et al. 2013). Between March 1, 2013 and September 20, 2014, about 60 natural seismic events were located on the Newberry Volcano edifice (PNSN 2015). This apparent increase in Newberry Volcano seismicity since 2012 is due to a much-improved seismic monitoring network that has better detection abilities, and not EGS activities. In 2014, the NEGSD MSA located 400 events ranging in magnitude from M 0 to M 2.26, demonstrating that the NEGSD MSA design and operation functioned as intended and is capable of detecting both natural and induced seismic events.
Seismic monitoring equipment removed in 2015 is currently in storage and available for deployment at the NEWGEN FORGE site. AltaRock’s team of experienced staff is capable of installation, operation, and maintenance of this equipment with little outside (contractor) support. For the preliminary Phase 2A MSA, NEWGEN’s plan is to restore at least one of the three inactive borehole sites (NN-09, NN07, NN-24, or NN-18) and stream the data to PNSN. Seismologists at the University of Oregon, a NEWGEN Extended Consortium member, will perform waveform template matching on the background data to increase the natural seismicity catalog size and double-difference relocations to improve the location accuracy.
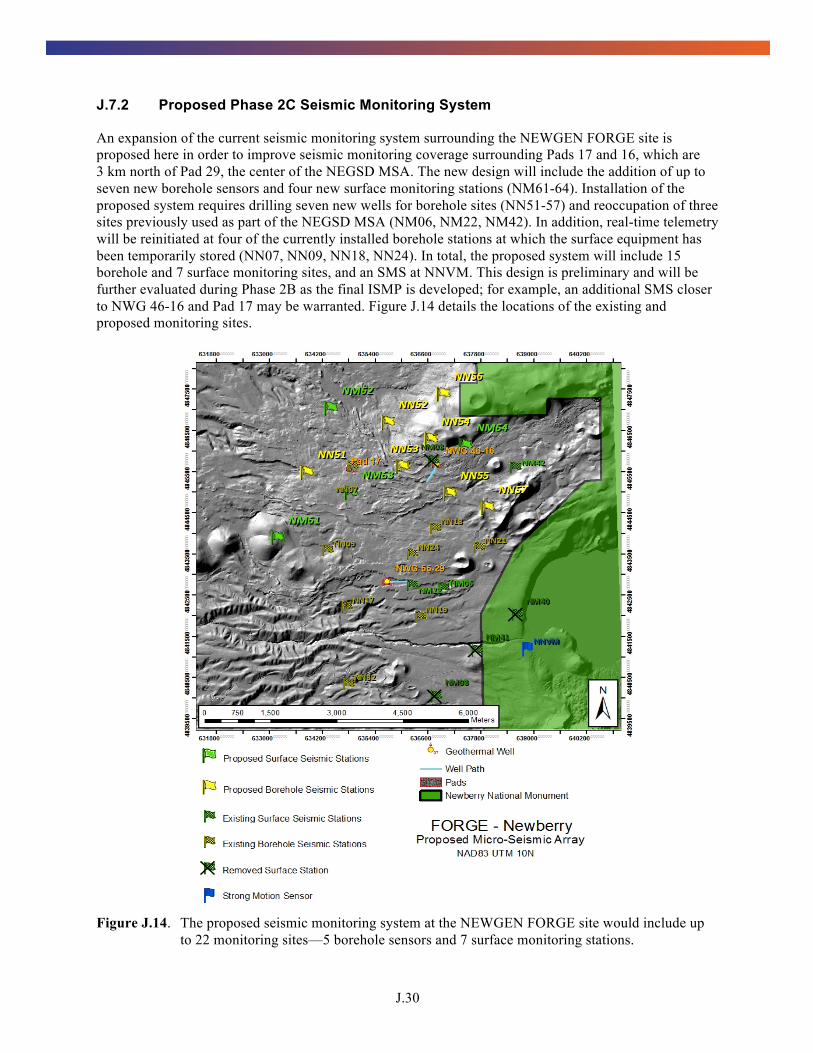
J.30
J.7.2 Proposed Phase 2C Seismic Monitoring System
An expansion of the current seismic monitoring system surrounding the NEWGEN FORGE site is proposed here in order to improve seismic monitoring coverage surrounding Pads 17 and 16, which are 3 km north of Pad 29, the center of the NEGSD MSA. The new design will include the addition of up to seven new borehole sensors and four new surface monitoring stations (NM61-64). Installation of the proposed system requires drilling seven new wells for borehole sites (NN51-57) and reoccupation of three sites previously used as part of the NEGSD MSA (NM06, NM22, NM42). In addition, real-time telemetry will be reinitiated at four of the currently installed borehole stations at which the surface equipment has been temporarily stored (NN07, NN09, NN18, NN24). In total, the proposed system will include 15 borehole and 7 surface monitoring sites, and an SMS at NNVM. This design is preliminary and will be further evaluated during Phase 2B as the final ISMP is developed; for example, an additional SMS closer to NWG 46-16 and Pad 17 may be warranted. Figure J.14 details the locations of the existing and proposed monitoring sites.
Figure J.14. The proposed seismic monitoring system at the NEWGEN FORGE site would include up
to 22 monitoring sites—5 borehole sensors and 7 surface monitoring stations.

J.31
J.7.3 Seismic Monitoring
Stimulation operations at the NEWGEN FORGE site will be monitored in real time by appropriate staff both onsite and offsite. At the operational center located near the well site, seismologists and engineers will be able to monitor and compare the injection rate, wellhead and downhole pressure, event locations, maximum event size, the size distribution of microseismicity (the b-value), and other parameters 24 hours a day.
During the NEGSD stimulations, daily activity reports were transmitted to the stakeholders. The daily report was accompanied by several graphs that included surface pressure, bottom-hole pressure and flow rate versus time, and temperature versus depth. If induced seismicity had occurred that day, the daily report included information about the magnitude and location of the events. The frequency and detail of reporting during NEWGEN FORGE operational activities will be determined during later phases.
During the NEGSD all seismic data were first streamed directly to AltaRock’s Seattle office and then provided in real time to LBNL and PNSN, where software automatically determined preliminary locations (epicenters) and magnitudes without review by a seismologist. The data flow for seismic data during NEWGEN FORGE operations is yet to be determined. Seismologists and engineers on the NEWGEN team will review the microseismic data and provide timely refinements and analysis of induced microseismic event hypocenters and magnitudes, as well as the development of the EGS reservoir with respect to the NEWGEN plans and goals.
J.8 Step 5. Quantify Hazard from Natural and Induced Seismic Events
Based on review of relevant scientific literature, industry best practices, lessons learned from the NEGSD Phase I and II reports, and work by URS, the NEWGEN FORGE site has a low likelihood of naturally occurring earthquakes of large enough magnitude to be felt or cause damage to local structures. It is also unlikely that any induced seismic event due to well stimulation activities at the NEWGEN FORGE site will incur events larger than M 3.5–4.0; the calculated maximum probability of a M > 4.0 event is 0.09%.
J.8.1 Baseline Hazard from Natural Seismicity
A baseline probabilistic seismic hazard assessment (PSHA) was developed for the 2011 ISMP by Wong et al. (2010) and provided as Appendix F of that report. Potential natural seismic sources included known tectonic faults, potential volcanic earthquakes within 100 km of the site, and the Cascadia Subduction zone megathrust. The risks of natural earthquake at Newberry Volcano were poorly known at that time due to lack of seismic monitoring.
Since 2010, a better understanding of both Newberry Volcano seismicity and regional seismicity will warrant an update of the 2010 PSHA. Fortunately, PNNL has a strong background in PSHA and can lead the effort to update the 2011 ISMP in this regard.
J.8.2 Hazard from Induced Seismicity
Maximum Magnitude Predictions
Mmax and earthquake rates are the two most important inputs into seismic hazard analyses. The magnitude of an earthquake is proportional to the area of the fault that slips in an event and the amount of stress that is released (i.e., stress drop). Several conditions must be met for a potentially damaging earthquake to occur. There must be a large enough fault, stresses must be high enough to cause slip, and the fault needs to be pre-stressed and near failure. As recognized by many, the characteristics of induced seismicity are

J.32
controlled by the characteristics and distribution of preexisting fractures and faults, and the local stress field in the volume of rock surrounding the well where fluid is being introduced (Majer et al. 2007).
Two basic approaches were used to estimate the potential Mmax for NEGSD activities—analogs from other EGS and geothermal projects and theoretical models. Because few EGS projects have been undertaken worldwide, finding suitable analogs is challenging. Theoretical approaches depend on an a priori knowledge of the rupture characteristics of future induced seismicity, which requires subsurface characterization of the affected volume of rock around the well. This information is now available due to the NEGSD. The largest events induced during the NEGSD stimulations were an M 2.39 in 2012 and an M 2.26 in 2014. The implications of these events have not yet been fully evaluated to determine the impact on the Mmax analysis performed for the 2011 ISMP. At this stage, we suggest that the Mmax analysis below is still valid, but can be further updated during Phase 2B based on the NEGSD results.
To develop site-specific, theoretical models of Mmax for NEGSD, AltaRock commissioned the William Lettis & Associates division of Fugro Consultants (Fugro). The Fugro assessment included additional analysis of LiDAR data, updated physical and injection plan parameters, a model incorporating high heat flow at Newberry Volcano, and estimates of the probability of the different Mmax levels. The Fugro report is included as Appendix E of the 2011 ISMP and summarized below.
Additional lineament analyses of LiDAR data did not disclose any significant features within a 1 km radius of NWG 55-29 that could be activated by EGS stimulation. Within a 5 km radius, mapped lineaments are associated with drainage and depositional features on the flanks and margins of the Newberry Volcano (Figure 8 of Appendix E). None of these lineaments were identified as faults and, in any case, their orientations make them unlikely to slip in the current stress field determined from the BHTV breakouts and active tectonic features mapped in the broader region (Cladouhos et al. 2011).
Fugro used three alternative approaches to evaluate Mmax for the NEGSD project based on physical properties of the surrounding rock mass and proposed injection process. These approaches provide single-valued deterministic estimates of Mmax for specific combinations of physical parameters estimated for the site (Table J.3).
The first method, taken from Brune (1970), is based on dynamic stress drop, which controls the absolute amplitude of radiated seismic waves, and corresponding ground shaking. For an induced event created by slip on a fault with a 500 m (1640 ft) radius (the radius of the maximum dimension of the proposed EGS reservoir) and a stress drop of 3 MPa, an Mmax of 3.89 is calculated.
Table J.3. Summary of the three deterministic approaches used to estimate Mmax. Only the highest Mmax estimated by each method is shown in this table. Mmax based on a wider range of input values is shown in Appendix E of the 2011 ISMP.
TECHNIQUE CHARACTERISTICS HIGHEST Mmax
Brune (1970) Dynamic stress drop, 500 m (1640 ft) radius, 3 MPa stress drop 3.89
McGarr (1976, 2014) Injected volume of 30,545 m3 (8 million gallons) 3.24
Leonard (2010) Based on fault area 1000 m (3280 ft) strike length and 1473 m (4833 ft) vertical extent limited by shallow (3.5 km) brittle-ductile transition
3.98
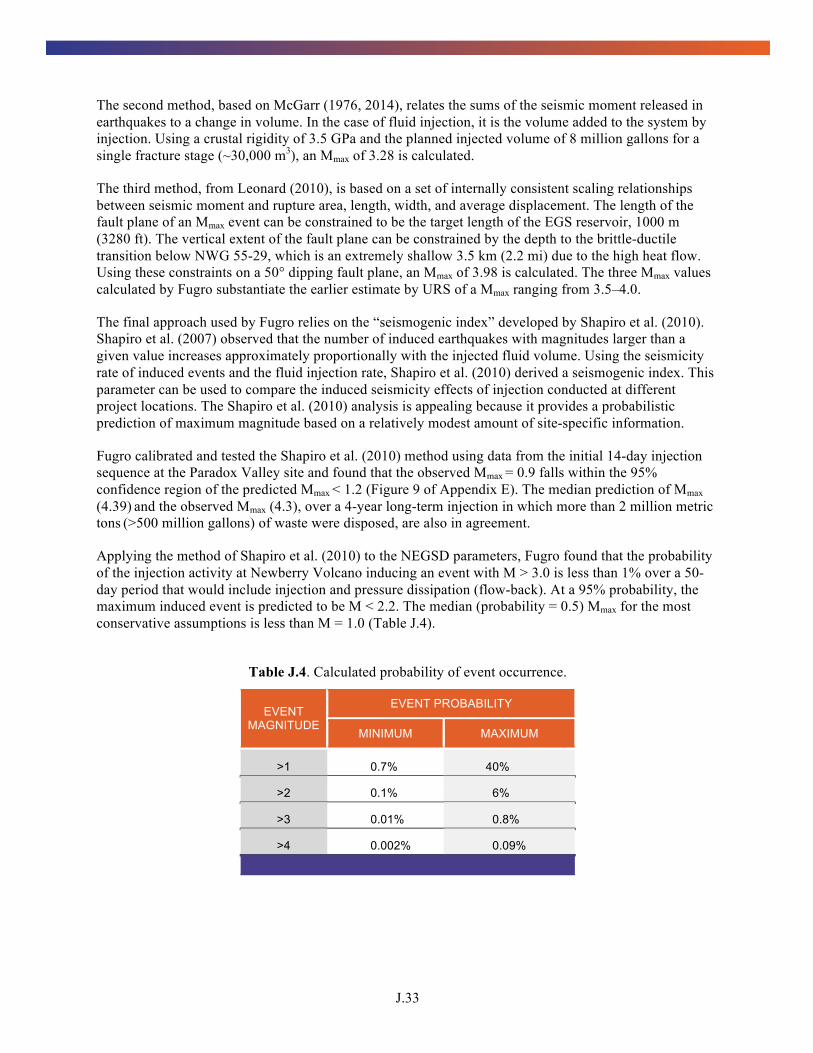
J.33
The second method, based on McGarr (1976, 2014), relates the sums of the seismic moment released in earthquakes to a change in volume. In the case of fluid injection, it is the volume added to the system by injection. Using a crustal rigidity of 3.5 GPa and the planned injected volume of 8 million gallons for a single fracture stage (~30,000 m3), an Mmax of 3.28 is calculated.
The third method, from Leonard (2010), is based on a set of internally consistent scaling relationships between seismic moment and rupture area, length, width, and average displacement. The length of the fault plane of an Mmax event can be constrained to be the target length of the EGS reservoir, 1000 m (3280 ft). The vertical extent of the fault plane can be constrained by the depth to the brittle-ductile transition below NWG 55-29, which is an extremely shallow 3.5 km (2.2 mi) due to the high heat flow. Using these constraints on a 50° dipping fault plane, an Mmax of 3.98 is calculated. The three Mmax values calculated by Fugro substantiate the earlier estimate by URS of a Mmax ranging from 3.5–4.0.
The final approach used by Fugro relies on the “seismogenic index” developed by Shapiro et al. (2010). Shapiro et al. (2007) observed that the number of induced earthquakes with magnitudes larger than a given value increases approximately proportionally with the injected fluid volume. Using the seismicity rate of induced events and the fluid injection rate, Shapiro et al. (2010) derived a seismogenic index. This parameter can be used to compare the induced seismicity effects of injection conducted at different project locations. The Shapiro et al. (2010) analysis is appealing because it provides a probabilistic prediction of maximum magnitude based on a relatively modest amount of site-specific information.
Fugro calibrated and tested the Shapiro et al. (2010) method using data from the initial 14-day injection sequence at the Paradox Valley site and found that the observed Mmax = 0.9 falls within the 95% confidence region of the predicted Mmax < 1.2 (Figure 9 of Appendix E). The median prediction of Mmax (4.39) and the observed Mmax (4.3), over a 4-year long-term injection in which more than 2 million metric tons (>500 million gallons) of waste were disposed, are also in agreement.
Applying the method of Shapiro et al. (2010) to the NEGSD parameters, Fugro found that the probability of the injection activity at Newberry Volcano inducing an event with M > 3.0 is less than 1% over a 50-day period that would include injection and pressure dissipation (flow-back). At a 95% probability, the maximum induced event is predicted to be M < 2.2. The median (probability = 0.5) Mmax for the most conservative assumptions is less than M = 1.0 (Table J.4).
Table J.4. Calculated probability of event occurrence.
EVENT MAGNITUDE
EVENT PROBABILITY
MINIMUM MAXIMUM
>1 0.7% 40%
>2 0.1% 6%
>3 0.01% 0.8%
>4 0.002% 0.09%

J.34
In light of the largest seismic events induced during previous EGS projects and three deterministic models, an upper bound for Mmax for the NEGSD of M 3.5 to 4.0 is defensible. Applying the recently developed Shapiro model, the probability of an event with M > 3.0 is less than 1%, with the most likely (median) Mmax < 1.0.
Given the results of the NEGSD project (Section J.2.6), the Mmax analysis and probabilities appear to be reasonable for the NEWGEN FORGE project as well. During Phase 2B, the NEWGEN technical team will revisit the analysis provided above in light of the 2012 and 2014 NEGSD stimulation results and update Mmax calculations if warranted.
J.9 Step 6 Characterize Risk of Induced Seismic Events
AltaRock contracted with URS to conduct an independent Induced Seismicity and Seismic Hazards Risk Analysis for NEGSD (Wong et al. 2010) and it is provided as Appendix F of the 2011 ISMP. The tasks performed in the Wong et al. (2010) analysis included the following:
• review of available data from previous EGS projects,
• evaluation of local and regional faults for seismic risk,
• site-specific probabilistic seismic hazard analysis, and
• seismic risk evaluation.
The executive summary of the report by Wong et al. (2010) concludes:
The results of the probabilistic seismic hazard analysis indicate that there is no difference in hazard at La Pine, Sunriver, and the project site NWG 55-29 between the baseline conditions (which incorporates the hazard from both natural tectonic and volcanic seismicity) and the EGS-induced seismicity. As a result, potential EGS- induced seismicity poses no seismic risk to the residents in the neighboring communities. However, potentially larger EGS earthquakes of M 3.0 and higher, should they occur, will probably be felt in La Pine and Sunriver, but not at damaging levels of ground motions (>0.10 g). Individual residents within 10 km of the project site will feel the larger events. The strength of shaking will depend on the size of the event, and distance to and site conditions at each location. The effects of induced seismicity will be more of a nuisance than a hazard to the vast majority of local residents because of the small size of the events and distances to centers of population.
URS also developed shake maps based on a predicted upper-range seismic event of M 3.5 at 1 km depth (3280 ft) in the target well (Wong et al. 2011). The shake map predicts PGAs of 0.25 g at the wellhead, 0.10 g at Paulina Lake, and less than 0.01 g at La Pine (Figure J.10). For natural earthquakes, a PGA of 0.10 g is perceived by humans as strong shaking and the potential for damage is light (Wald et al. 1999). However, it has been observed that perceived shaking and damage due to EGS-induced seismicity is typically lower (Majer et al. 2007).
Based on results from the NEGSD we believe that the model used by URS to generate the shake map (Figure J.10), which is based on data from The Geysers geothermal field in California, overestimated the shaking that might occur and thus represents a cautious approach. A shake map calibrated to The Geysers geology and geophysics will overestimate the shaking expected at Newberry Volcano; greater shaking is expected for a seismic event of a given magnitude at The Geysers due to the presence of competent bedrock near the surface, which more readily propagates seismic energy due to higher internal friction.
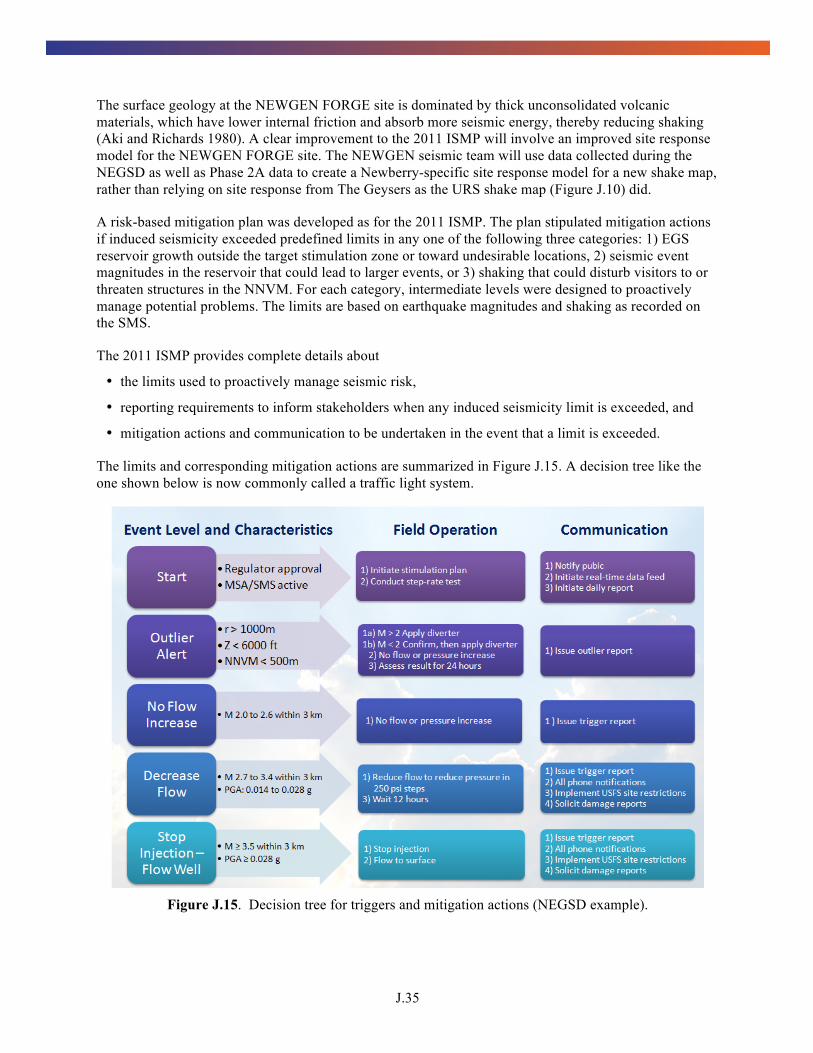
J.35
The surface geology at the NEWGEN FORGE site is dominated by thick unconsolidated volcanic materials, which have lower internal friction and absorb more seismic energy, thereby reducing shaking (Aki and Richards 1980). A clear improvement to the 2011 ISMP will involve an improved site response model for the NEWGEN FORGE site. The NEWGEN seismic team will use data collected during the NEGSD as well as Phase 2A data to create a Newberry-specific site response model for a new shake map, rather than relying on site response from The Geysers as the URS shake map (Figure J.10) did.
A risk-based mitigation plan was developed as for the 2011 ISMP. The plan stipulated mitigation actions if induced seismicity exceeded predefined limits in any one of the following three categories: 1) EGS reservoir growth outside the target stimulation zone or toward undesirable locations, 2) seismic event magnitudes in the reservoir that could lead to larger events, or 3) shaking that could disturb visitors to or threaten structures in the NNVM. For each category, intermediate levels were designed to proactively manage potential problems. The limits are based on earthquake magnitudes and shaking as recorded on the SMS.
The 2011 ISMP provides complete details about
• the limits used to proactively manage seismic risk,
• reporting requirements to inform stakeholders when any induced seismicity limit is exceeded, and
• mitigation actions and communication to be undertaken in the event that a limit is exceeded.
The limits and corresponding mitigation actions are summarized in Figure J.15. A decision tree like the one shown below is now commonly called a traffic light system.
Figure J.15. Decision tree for triggers and mitigation actions (NEGSD example).
J.36
Important details of FORGE operational procedures will not be known until Phase 2C and/or Phase 3. Therefore, it is premature to propose a NEWGEN risk-based mitigation plan at this time. The action levels and mitigation steps of the 2011 ISMP are provided above as a starting point for guidance to an improved NEWGEN ISMP.
The final ISMP will serve as the initial guide for risk-based seismic mitigation at the NEWGEN FORGE site. New data collected during site characterization will provide the basis for future updates to the ISMP, and appropriate adjustments will be made over the course of the project as new data become available. Updates to the ISMP may include, but are not limited to, defining specific threshold values based on magnitude or g-force detected by the MSA and SMS; and identifying specific mitigation actions to be taken in response to induced seismicity magnitude or frequency.
J.10 Conclusion
In this preliminary NEWGEN ISMP, the 2011 ISMP and the results of the NEGSD are incorporated into seven steps of the “Protocol for Induced Seismicity Associated with Enhanced Geothermal Systems.” Further effort during FORGE Phase 2 will be needed to turn this preliminary NEWGEN ISMP into the final NEWGEN ISMP needed for the NEWGEN FORGE project. Thanks to significant previous effort during the NEGSD related to monitoring and analysis of induced seismicity, finalizing the ISMP will require far less effort than expected. Furthermore, the final ISMP will be among the most robust and well-supported of such documents in the world.
J.11 Seismicity Terms and Background
The topics and concepts covered in this document are necessarily technical. This subsection provides some basic background on seismicity and earthquakes.
Earthquake – This term is used to describe both sudden slip on a fault, and the resulting ground shaking and radiated seismic energy caused by the slip, or by volcanic or magmatic activity, or other sudden stress changes in the Earth. A shaking or trembling of the Earth that is volcanic or tectonic in origin.
Seismic Waves – When an earthquake occurs, it releases energy in the form of seismic waves that radiate from the earthquake source in all directions. The different types of energy waves shake the ground in different ways and also travel through the Earth at different velocities. The fastest wave, and therefore the first to arrive at a given location, is called the P-wave. The P-wave, or compressional wave, alternately compresses and expands material in the same direction it is traveling. The S-wave is slower than the P-wave and arrives next, shaking the ground up and down, and back and forth, perpendicular to the direction it is traveling. Surface waves follow the P- and S-waves.
Seismic Event – A generic term for occurrences in which energy is briefly released in the Earth’s crust, resulting in a series of seismic waves. Because an earthquake implies to the layman a shaking of the Earth that is felt by humans or animals, the term seismic event or microseismic event is often used by geoscientists when communicating with the public about minor and micro-earthquakes (Table J.5). Many seismic events are too small to be felt, and can only be measured by precision instruments.

J.37
Table J.5. Comparison of quantitative and qualitative measures of ground shaking.
MMI(a) PEAK GROUND ACCELERATION (g)
PEAK GROUND VELOCITY
(cm/s)
PERCEIVED SHAKING
POTENTIAL DAMAGE
I < 0.0017 <0.1 Not Felt None
II-III 0.0017 – 0.014 0.1 – 1.1 Weak None
IV 0.014 – 0.039 1.1 – 3.4 Light None
V 0.039 – 0.092 3.4 – 8.1 Moderate Very light
VI 0.092 – 0.18 8.1 – 16 Strong Light
VII 0.18 – 0.34 16 – 31 Very Strong Moderate
VIII 0.34 – 0.65 31 – 60 Severe Moderate/Heavy
(a) Continues to Modified Mercalli Intensity (MMI) XII, but not relevant for this discussion. Please see Intensity definition below for discussion of MMI.
Earthquake Size Distributions – It has long been recognized that small earthquakes are far more common than big earthquakes. This relationship can be expressed by a formula called the Gutenberg-Richter relationship:
log (N) = a - bM
where N is the number of events having a magnitude greater than or equal to M, and a and b are parameters fit to the data. The parameter b, called the b-value, is usually close to 1, which means that for each logarithmic decrease in magnitude there are about 10 times as many earthquakes (Table J.6). Most of the earthquakes generated by the NEGSD projects had have magnitudes less than 2.0. Worldwide there are estimated to be over 36,000 events of this size range per day.
Table J.6. Worldwide, annual counts of earthquakes by magnitude.(a)
CLASS MAGNITUDE ANNUALLY AVERAGE DAILY AVERAGE
Great 8 and higher 1
Major 7 – 7.9 15
Strong 6 – 6.9 134
Moderate 5 – 5.9 1319 4
Light 4 – 4.9 13,000 (estimated) 36
Minor 3 – 3.9 130,000 (estimated) 360
Micro 2 – 2.9 1,300,000 (estimated) 3,600
Micro 1 – 1.9 13,000,000 (estimated) 36,000
USGS Earthquake Magnitude Policy
J.38
Shear Slip – Slip is the relative displacement of formerly adjacent points on opposite sides of a fault, measured on the fault surface. Shear slip can occur seismically or aseismically (without creating seismic waves).
Seismometer and Seismogram – A seismometer is an instrument used to record the seismic waves generated by earthquakes on a seismogram.
Seismic Array – Many seismometers are installed in networks or arrays spread across the area of interest to locate seismic events in the region. To determine the location of seismic events, seismologists identify the arrival times of P- and S-waves on the seismograms of all instruments that have recorded the seismic waves. These arrival times are commonly called P-picks and S-picks. Theoretically, three P-picks and three S-picks can be used to triangulate the location of a seismic event. In practice, on a microseismic array like that described below, five P-picks and two S-picks will yield acceptable location accuracy, and seven P-picks and three S-picks will yield good location accuracy (Gillian Foulger, personal communication).
Hypocenter and Epicenter – The hypocenter is the point within the Earth where an earthquake rupture starts. The epicenter is the point directly above it at the surface of the Earth.
Magnitude – The magnitude of an earthquake is determined from the logarithm of the amplitude of waves recorded on a seismogram at a certain period. The original magnitude scale was the Richter scale, usually denoted as ML.
Moment and Moment Magnitude – Moment is a physical quantity proportional to the slip on the fault times the area of the fault surface that slips; it is related to the total energy released in the seismic event, and is denoted Mo. The moment can be estimated from seismograms. The moment is then converted into a number similar to other earthquake magnitudes by a standard formula. The result is called the moment magnitude (Mw). Moment magnitude provides an estimate of earthquake size that is valid over the entire range of magnitudes, a characteristic that was lacking in previous magnitude scales, like the Richter scale. Therefore, seismologists now prefer the moment magnitude scale and it is common practice to use just magnitude and M to refer to moment magnitude.
Comparative Energy Release – The formula relating moment magnitude (Mw) to moment (Mo) in dyne-cm is:
Mw = log10 (Mo) / 1.5 - 10.7
Practically, this means that for each increase in moment magnitude, there is a 31.6 × (101.5) increase in total seismic energy. That is, an M 3.5 event releases the same amount of energy as about 32 M 2.5 events.
Intensity – The intensity is a number (written as a Roman numeral) describing the severity of an earthquake in terms of its effects on the Earth's surface and on humans and their structures. The Modified Mercalli Intensity (MMI) scale is most commonly used in the United States. There are many intensities for an earthquake, depending on where the observer is located, unlike the magnitude, which is one number for each earthquake. Table J.7 shows the qualitative MMI scale. Table J.8 relates the MMI that would be typically felt at the earthquake epicenter to ranges of magnitudes.
Ground Velocity and Acceleration – Ground velocity is a measure of how fast a point on the ground is shaking as a result of the passage of the seismic waves of an earthquake. During an earthquake, ground shaking also produces acceleration, the change from one velocity to another. Ground velocity and acceleration decrease with distance from the earthquake’s epicenter. The peak ground velocity and PGA

J.39
are the largest velocity and acceleration, respectively, recorded by a particular station during an earthquake. Both peak ground velocity (PGV) and PGA can be used to quantify the potential for damage from an earthquake. Engineers typically use PGV, or particle velocity, while seismologists more commonly use PGA. Ground velocity and acceleration are both measured on special seismometers called SMS. PGA is typically quantified with respect to gravity (g). Table J.8 compares intensity, PGA, and PGV.
Table J.7. First eight of twelve levels of the Modified Mercalli Intensity Scale.
I. Not felt except by a very few under especially favorable conditions.
II. Felt only by a few persons at rest, especially on upper floors of buildings.
III. Felt quite noticeably by persons indoors, especially on upper floors of buildings. Many people do not recognize it as an earthquake. Standing motor cars may rock slightly. Vibrations similar to the passing of a truck. Duration estimated.
IV. Felt indoors by many, outdoors by few during the day. At night, some awakened. Dishes, windows, doors disturbed; walls make cracking sound. Sensation like heavy truck striking building. Standing motor cars rocked noticeably.
V. Felt by nearly everyone; many awakened. Some dishes, windows broken. Unstable objects overturned. Pendulum clocks may stop.
VI. Felt by all, many frightened. Some heavy furniture moved; a few instances of fallen plaster. Damage slight.
VII. Damage negligible in buildings of good design and construction; slight to moderate in well-built ordinary structures; considerable damage in poorly built or badly designed structures; some chimneys broken.
VIII. Damage slight in specially designed structures; considerable damage in ordinary substantial buildings with partial collapse. Damage great in poorly built structures. Fall of chimneys, factory stacks, columns, monuments, walls. Heavy furniture overturned.
Continues to XII, but not relevant for this discussion.
Table J.8. Comparison of magnitude and maximum MMI.(a)
MAGNITUDE TYPICAL MAXIMUM MODIFIED
MERCALLI INTENSITY AT EPICENTER
1.0 – 3.0 I
3.0 – 3.9 II – III
4.0 – 4.9 IV – V
5.0 – 5.9 VI – VII
6.0 – 6.9 VII – IX
7.0 and higher VIII or higher
USGS Magnitude/Intensity Comparison

J.40
J.12 References
Ake, J., R. LaForge, and F. Hawkins. 2001. Probabilistic seismic hazard analysis for Wickiup Dam-Deschutes project, central Oregon: U.S. Bureau of Reclamation Seismotectonic Report 2000-04, 71 p.
Aki, K., and G. Richards. 1980. Quantitative Seismology. W.H. Freeman, New York.
ANSS (Advanced National Seismic System). 2011. Catalog search at http://quake.geo.berkeley.edu/anss/ catalog-search.html, accessed 01/19/2011.
AltaRock (AltaRock Energy, Inc.). 2011. Newberry EGS Demonstration Induced Seismicity Mitigation Plan, 64 pp. plus 14 appendices. Available at: http://altarockenergy.com.
Brune, J.N. 1970. Tectonic stress and the spectra of seismic shear waves from earthquakes. Journal of Geophysical Research 75:4997–5009.
BLM (U.S. Bureau of Land Management). 2011. Newberry Volcano Enhanced Geothermal System (EGS) Demonstration Project, Environmental Assessment, 148 pp. plus 2 appendices, Available at: http://www.blm.gov/or/districts/prineville/plans/newberryegs/index.php. (2011).
Cladouhos, T., S. Petty, G. Foulger, B. Julian, and M. Fehler. 2010. “Injection Induced Seismicity and Geothermal Energy.” GRC Transactions 32:1213–1220.
Cladouhos, T., S. Petty, O. Callahan, W. Osborn, S. Hickman, and N. Davatzes. 2011. “The Role of Stress Modeling in Stimulation Planning at the Newberry Volcano EGS Demonstration Project.” In Proceedings, Thirty-Sixth Workshop on Geothermal Reservoir Engineering, Stanford University, Stanford, California, January 31–February 2, 2011, pp. 630–637.
Cladouhos, T., S. Petty, Y. Nordin, M. Moore, K. Grasso, M. Uddenberg, M. Swyer, B. Julian, and G. Foulger. 2013. “Microseismic Monitoring of Newberry Volcano EGS Demonstration.” In Proceedings, Thirty-Eighth Workshop on Geothermal Reservoir Engineering, Stanford University, Stanford, California, February 11–13, 2013.
Cypser, D.A. 1996. Colorado Law & Induced Seismicity.http://www.darlenecypser.com/ColoradoLawandInducedSeismicity.html
Cypser, D.A., and S.D. Davis. 1998. “Induced seismicity and the potential for liability under U.S. law.” Tectonophysics 289(1):239–255.
Davatzes, N.C., and S. Hickman. 2006. Stress and faulting in the Coso Geothermal Feld: Update and recent results from the East Flank and Coso Wash. In Proceedings of 31st Workshop on Geothermal Reservoir Engineering, Stanford University, Stanford, California, SGP-TR-179.
Davatzes, N.C., and S.H. Hickman. 2011. Preliminary Analysis of Stress in the Newberry EGS Well NWG 55-29. GRC Transactions 35:323–332.
Grasso, K., A. Meigs, and T. Cladouhos. 2012. “Origin of faults, fissures and volcanic vent alignments at a structural triple junction, Newberry Volcano, Central Oregon.” American Geophysical Union Cordilleran Section Meeting, March 2012.

J.41
Grasso, K., T. Cladouhos, S. Petty, G. Garrision, M. Uddenberg, M. Swyer, and Y. Nordin. 2014. “Deep Stimulation at Newberry Volcano EGS Demonstration.” Paper H43A-0940, American Geophysical Union Annual Meeting, December 2014.
Hickman, S.H., M.D. Zoback, C.A. Barton, R. Benoit, J. Svitek, and R. Summers. 2000. “Stress and permeability heterogeneity within the Dixie Valley geothermal reservoir: recent results from well 82-5.” In Proceedings, Twenty-fifth Workshop on Geothermal Reservoir Engineering, Stanford University, Stanford, California, January 24–26, SGP-TR-165.
Keefer, D.K. 1984. Landslides caused by earthquakes. Bulletin of the Geological Society of America 95:406–421.
Leonard, M. 2010. “Earthquake fault scaling: self-consistent relating of rupture length, width, average displacement, and moment release.” Bulletin of the Seismological Society of America 100:1971–1988.
Letvin, A.I. 2011. “Analysis of drill cutting mineralogy and geophysical logs to investigate alteration history at Newberry well 55-29 in preparation for EGS stimulation.” MS Thesis, School for Renewable Energy Science, Akureyi, Iceland, 199 pp.
Majer, E., R. Baria, and M. Stark. 2008. “Protocol for induced seismicity associated with enhanced geothermal systems.” Report produced in Task D Annex I (9 April 2008), International Energy Agency-Geothermal Implementing Agreement (incorporating comments by: C. Bromley, W. Cumming, A. Jelacic and L. Rybach). Available at: http://www.iea-gia.org/publications.asp.
Majer, E., J. Nelson, A. Robertson-Tait, J. Savy, and I. Wong. 2012. Protocol for Addressing Induced Seismicity Associated with Enhanced Geothermal Systems (EGS). Available at: http://www1.eere.energy.gov/geothermal/pdfs/geothermal_seismicity_protocol_012012.pdf
McGarr, A. 1976. “Seismic moments and volume changes.” Journal of Geophysical Research 81:1487.
McGarr, A. 2014. “Maximum magnitude earthquakes induced by fluid injection.” Journal of Geophysical Research: Solid Earth 119.
Personius, S.F., compiler. 2002a. “Fault number 838, La Pine graben faults, in Quaternary fault and fold database of the United States.” U.S. Geological Survey website, http://earthquakes.usgs.gov/reg3ional/qfaults, accessed 01/13/2011 01:44 PM.
Personius, S.F., compiler. 2002b. “Fault number 1806, Newberry volcano ring faults, in Quaternary fault and fold database of the United States.” U.S. Geological Survey website, http://earthquakes.usgs.gov/regional/qfaults, accessed 01/14/2011 03:49 PM.
Petty, S.Y. Nordin, W. Glassely, and T. Cladouhos. 2013. “Improving Geothermal Project Economics with Multi-zone Stimulation: Results from the Newberry Volcano EGS Demonstration.” In Proceedings, 38th Workshop on Geothermal Reservoir Engineering, Stanford University, Stanford, California.
PNSN (Pacific Northwest Seismic Network). 2015. http://pnsn.org/volcanoes/newberry.
Shapiro, S., C. Dinske, and J. Kummerow. 2007. “Probability of a given-magnitude earthquake induced by fluid injection.” Geophysical Research Letters V34, L14312.

J.42
Shapiro, S.A., C. Dinske, C. Lagenbruch, and F. Wenzel. 2010. Seismogenic index and magnitude probability of earthquakes induced during reservoir fluid stimulations. The Leading Edge, March 2010, 304–309.
Sherrod, D.R., E.M. Taylor, M.L. Ferns, W.E. Scott, R.M. Conrey, and G.A. Smith. 2004. “Geologic map of the Bend 30-x-60-minute quadrangle, central Oregon.” U.S. Geological Survey Geologic Investigations Series 1-2683.
Spielman, P.B., and J.T. Finger. 1998. Well Test Results of Exploration Drilling at Newberry Crater, Oregon in 1995. In Proceedings, Twenty-third Workshop on Geothermal Reservoir Engineering, Stanford University, Stanford, California, January 26–28, SGP-TR-158.
Wald, D.J., V. Quitoriano, T.H. Heaton, and H. Kanamori. 1999. Relationships between peak ground acceleration, peak ground velocity, and modified Mercalli intensity in California. Earthquake Spectra 15:557–564.
Wong, I., S. Pezzopane, M. Dober, and F. Terra. 2010. Evaluation of Induced Seismicity/Seismic Hazards and Risk, for the Newberry Volcano EGS Demonstration. Appendix F to Altarock (2011). Available at http://altarockenergy.com.
Wong, I., S. Pezzopane, and F. Terra. 2011. “Development of scenario ground shaking maps and evaluations of the impacts of ground shaking on local buildings, avalanches, and the Lava River Cave, Newberry Volcano EGS Demonstration.” Appendix G to Altarock (2011). Available at http://altarockenergy.com.