appendix g - transform 66inside.transform66.org/...nov._2016/appendix_g_exits_69_and_71_off... ·...
TRANSCRIPT

Transform Interstate 66: Inside the Beltway, Eastbound Widening
Traffic and Transportation Technical Report
Appendix G
Exits 69 and 71 Off-Ramps Traffic Analysis Technical Memorandums
DRAFT – NOVEMBER 2016

TRANSFORM I-66 INSIDE THE BELTWAY
EASTBOUND WIDENING PROJECT
EASTBOUND I-66 EXIT 69 AT WASHINGTON BOULEVARD / LEE HIGHWAY
TRAFFIC OPERATIONAL ANALYSIS
TECHNICAL MEMORANDUM
September 15, 2016 (Initial Submittal)
October 5, 2016 (Revised)
INTRODUCTION
The purpose of this technical memorandum is to present the traffic operations analysis of one-lane and
two-lane options at the eastbound I-66 off-ramp to Washington Boulevard / Lee Highway (Exit 69). The
options are being investigated as part of the eastbound I-66 widening project.
The study area for this analysis is shown in Figure 1.
Figure 1: Study Area of Eastbound I-66 Exit 69

TECHINICAL MEMORANDUM Eastbound I-66 Exit 69 Off-Ramp At Washington Boulevard / Lee Highway Traffic Operational Analysis
Transform I-66 Inside The Beltway Eastbound Widening Project Revised October 5, 2016 Page 2 of 17
TRAFFIC VOLUMES
The post-processed AM/PM peak hour traffic volumes in the study area are shown in Figure 2. The off-ramp
volumes at Exit 69 are shown in Table 1. It can be seen from the table that the heaviest volumes at the Exit
69 off-ramp are observed during the 2025 Build PM peak hour scenario where eastbound I-66 is widened
but not tolled during the PM peak period. By 2040, the PM peak period is tolled as well, therefore the
volumes at this ramp are lower than 2025 volumes.
Table 1: Eastbound I-66 Exit 69 – Off-Ramp Volumes
Year Eastbound I-66 Exit 69 – Off-Ramp Volume (veh/hour)
AM Peak Hour PM Peak Hour
Existing (2016) 335 730
2025 Build 495 1,550
2040 Build 505 1,395
The traffic volumes at the downstream ramp terminal intersection of Fairfax Drive at Lee Highway are shown
in Table 2. It can be seen from this table that the heaviest volumes at the intersection are observed during
the 2040 Build PM peak hour scenario.
Based on the above, the options for eastbound I-66 Exit 69 were analyzed for both the 2025 and 2040 Build
PM peak hour scenarios.

TECHINICAL MEMORANDUM Eastbound I-66 Exit 69 Off-Ramp At Washington Boulevard / Lee Highway Traffic Operational Analysis
Transform I-66 Inside The Beltway Eastbound Widening Project Revised October 5, 2016 Page 3 of 17
Figure 2: Peak Hour Volumes on I-66 in the Study Area

TECHINICAL MEMORANDUM Eastbound I-66 Exit 69 Off-Ramp At Washington Boulevard / Lee Highway Traffic Operational Analysis
Transform I-66 Inside The Beltway Eastbound Widening Project Revised October 5, 2016 Page 4 of 17
Table 2: Peak Hour Volumes – Intersection of Fairfax Drive at Lee Highway
Year Movement
Intersection at Fairfax Drive and Lee Highway
AM Peak Hour PM Peak Hour
NBT NBR EBT EBR EBL SBT SBL NBT NBR EBT EBR EBL SBT SBL
Existing (2016)
Movement 1111 257 649 97 540 380 11 600 205 933 216 378 1116 16
Approach 1368 1286 391 805 1527 1132
Intersection 3045 3464
2025 Build
Movement 1129 279 669 106 514 474 12 700 133 1050 208 446 1245 19
Approach 1408 1289 486 833 1704 1264
Intersection 3183 3801
2040 Build
Movement 1180 265 746 112 569 423 13 686 168 1106 233 495 1212 21
Approach 1445 1427 436 854 1834 1233
Intersection 3308 3921

TECHINICAL MEMORANDUM Eastbound I-66 Exit 69 Off-Ramp At Washington Boulevard / Lee Highway Traffic Operational Analysis
Transform I-66 Inside The Beltway Eastbound Widening Project Revised October 5, 2016 Page 5 of 17
ALTERNATIVES
Five options for the off-ramp configuration were tested for each of the 2025 and 2040 Build PM scenarios.
These alternatives are described below:
Option 1 – Existing Configuration
This option retains the existing geometry and configuration of the one-lane off-ramp at Exit 69 and the
intersection configuration at Fairfax Drive / Lee Highway. The existing configuration is shown in Figure 3.
Option 2 – PFI Configuration
This option consists of the Preliminary Field Inspection (PFI) configuration that was proposed by VDOT. In
this option, the off-ramp will be widened to a two-lane segment. An additional left-turn lane was added from
the off-ramp to the eastbound approach at the intersection of Fairfax Drive and Lee Highway, and the
approach lane configuration was modified to have two left-turn lanes, two through lanes and a right-turn
lane. Figure 4 depicts the lane configuration for PFI scenario.
Option 3 – Modified PFI
This option retains the existing intersection footprint at the Fairfax Drive / Lee Highway intersection while
widening the off-ramp to two lanes. Fairfax Drive will be reduced from a two-lane section to a one-lane
section before the merge point with the eastbound I-66 off-ramp. Figure 5 depicts the lane configuration
for Option 3.

TECHINICAL MEMORANDUM Eastbound I-66 Exit 69 Off-Ramp At Washington Boulevard / Lee Highway Traffic Operational Analysis
Transform I-66 Inside The Beltway Eastbound Widening Project Revised October 5, 2016 Page 6 of 17
Figure 3: Option 1 - Existing Lane Configuration

TECHINICAL MEMORANDUM Eastbound I-66 Exit 69 Off-Ramp At Washington Boulevard / Lee Highway Traffic Operational Analysis
Transform I-66 Inside The Beltway Eastbound Widening Project Revised October 5, 2016 Page 7 of 17
Figure 4: Option 2 - PFI Scenario Lane Configuration

TECHINICAL MEMORANDUM Eastbound I-66 Exit 69 Off-Ramp At Washington Boulevard / Lee Highway Traffic Operational Analysis
Transform I-66 Inside The Beltway Eastbound Widening Project Revised October 5, 2016 Page 8 of 17
Figure 5: Option 3 - Two-Lane Off-Ramp Configuration with Lane Drop along Fairfax Drive

TECHINICAL MEMORANDUM Eastbound I-66 Exit 69 Off-Ramp At Washington Boulevard / Lee Highway Traffic Operational Analysis
Transform I-66 Inside The Beltway Eastbound Widening Project Revised October 5, 2016 Page 9 of 17
Option 4 – Modified PFI
Option 4 scenario is a modified configuration of Option 3 where the existing parking lane on Fairfax Drive
is partially removed to retain two lanes on Fairfax Drive. Figure 6 depicts the lane configuration for Option
4.
Figure 6: Option 4 - Two-lane Off-Ramp Configuration with No Lane Drop along Fairfax Drive
Option 5 – Modified Existing Configuration
Option 5 is a modified configuration of the existing conditions with a reduced one-lane configuration at
Fairfax Drive. Figure 7 depicts the lane configuration for Option 5.
Figure 7: Option 5 - One-lane Off-ramp with Lane Drop along Fairfax Drive
OPERATIONAL ANALYSIS
Microsimulation traffic analysis software, VISSIM version 8.00-08, was used as the analysis tool to perform
the operational analysis. The PM peak hour was modeled since this represents the highest levels of traffic
volume at the off-ramp during a typical day. As part of the I-66 eastbound widening project, a
comprehensive set of VISSIM microsimulation models are being developed that encompass the entire I-66
eastbound widening study area from I-495 to Lee Highway (Spout Run). Several mini-models were

TECHINICAL MEMORANDUM Eastbound I-66 Exit 69 Off-Ramp At Washington Boulevard / Lee Highway Traffic Operational Analysis
Transform I-66 Inside The Beltway Eastbound Widening Project Revised October 5, 2016 Page 10 of 17
extracted from this comprehensive model to analyze the options at Exit 69. For each option, all signal
timings in the study area intersections were optimized using Synchro.
ANALYSIS RESULTS
The five options were tested for the 2025 and 2040 Build PM conditions. The following measures of
effectiveness (MOEs) were used to compare the options:
1. Eastbound I-66 mainline – demand vs. throughputs
2. Eastbound I-66 mainline – average segment travel speeds
3. Exit 69 off-ramp – queue lengths
4. Fairfax Drive / Lee Highway Intersection – intersection delay and LOS
2025 Conditions
Table 3 and Figure 8 summarize the demand vs. throughputs on eastbound I-66 for the options under
2025 conditions. From the table and figure, it can be seen that in the options with a two-lane exit ramp
(Options 2, 3 and 4), the throughput is comparable to demand, and the difference is less than 3 percent.
For those options with a single-lane exit ramp (Options 1 and 5), the difference between throughput and
demand ranges between 11 and 16 percent.
It can also be seen that throughputs are similar between the single-lane exit ramp options (Options 1 and
5) and between the two-lane exit ramp options (Options 2, 3 and 4).

TECHINICAL MEMORANDUM Eastbound I-66 Exit 69 Off-Ramp At Washington Boulevard / Lee Highway Traffic Operational Analysis
Transform I-66 Inside The Beltway Eastbound Widening Project Revised October 5, 2016 Page 11 of 17
Table 3: I-66 Eastbound Mainline Demand vs. Throughputs – 2025 Scenarios
Segment Demand
(veh/hr)
Option 1 Option 2 Option 3 Option 4 Option 5
Throughput
(veh/hr) Δ%
Throughput
(veh/hr) Δ%
Throughput
(veh/hr) Δ%
Throughput
(veh/hr) Δ%
Throughput
(veh/hr) Δ%
Eastbound I-66 before the Dulles Toll Road (DTR) merge point 3,725 3,304 -11% 3,702 -1% 3,713 0% 3,714 0% 3,311 -11%
From DTR merge point to Exit 68 (Westmoreland Street) 6,460 5,658 -12% 6,413 -1% 6,423 -1% 6,427 -1% 5,679 -12%
From Exit 68 to Exit 69 (Washington Boulevard / Lee Highway) 6,310 5,293 -16% 6,136 -3% 6,135 -3% 6,145 -3% 5,315 -16%
From Exit 69 to Sycamore Street on-ramp 4,760 4,101 -14% 4,729 -1% 4,719 -1% 4,732 -1% 4,098 -14%
Eastbound I-66 after Sycamore Street on-ramp 4,940 4,267 -14% 4,902 -1% 4,866 -1% 4,872 -1% 4,269 -14%
Figure 8: I-66 Eastbound Mainline Demand vs. Throughputs – 2025 scenarios
0
1,000
2,000
3,000
4,000
5,000
6,000
7,000
Eastbound I-66
before the Dulles Toll
Road (DTR) merge
point
From DTR merge
point to Exit 68
(Westmoreland
Street)
From Exit 68 to Exit
69 (Washington
Boulevard / Lee
Highway)
From Exit 69 to
Sycamore Street on-
ramp
Eastbound I-66 after
Sycamore Street on-
ramp
Pe
ak
Ho
ur
Vo
lum
e (
veh
/hr)
Demand Option 1 Option 2 Option 3 Option 4 Option 5

TECHINICAL MEMORANDUM Eastbound I-66 Exit 69 Off-Ramp At Washington Boulevard / Lee Highway Traffic Operational Analysis
Transform I-66 Inside The Beltway Eastbound Widening Project Revised October 5, 2016 Page 12 of 17
Figure 9 shows the speed congestion diagram along eastbound I-66 in the study area. The mainline
experiences congestion in Options 1 and 5, which are single-lane exit ramps. For Options 2, 3 and 4 which
are two-lane exit ramps, the mainline experiences no congestion.
Figure 9: Eastbound I-66 Speed Congestion Diagram - 2025 Scenarios
Table 4 shows the average and maximum queue lengths of the options at the Exit 69 off-ramp measured
from the intersection at Fairfax Drive / Lee Highway. The distance from the intersection stop line to the gore
point of the off-ramp and eastbound I-66 mainline is about 1,000 feet. Any queue that spills back beyond
1,000 feet is expected to impact the freeway mainline operations. Queue lengths for Options 2, 3 and 4 are
comparable with queues well within 1,000 feet. Options 1 and 5, however, have queue lengths that are
much longer than 1,000 feet indicating a spillback to the eastbound I-66 mainline.
Table 4: Average and Maximum Queue Lengths at Exit 69 - 2025 Scenarios
Location
Option 1 Option 2 Option 3 Option 4 Option 5
Avg.
Queue
(ft.)
Max.
Queue
(ft.)
Avg.
Queue
(ft.)
Max.
Queue
(ft.)
Avg.
Queue
(ft.)
Max.
Queue
(ft.)
Avg.
Queue
(ft.)
Max.
Queue
(ft.)
Avg.
Queue
(ft.)
Max.
Queue
(ft.)
Exit 69
Off-Ramp 10,295 16,443 152 628 177 494 165 736 6,674 12,956

TECHINICAL MEMORANDUM Eastbound I-66 Exit 69 Off-Ramp At Washington Boulevard / Lee Highway Traffic Operational Analysis
Transform I-66 Inside The Beltway Eastbound Widening Project Revised October 5, 2016 Page 13 of 17
Table 5 compares the intersection delays and LOS at the intersections on Lee Highway / Washington
Street. The Fairfax Drive / Lee Highway intersection is the ramp terminal intersection for the Exit 69 off-
ramp and directly impacts the delays and queues for the off-ramp traffic. From this table, it can be seen that
this intersection performs poorly at an LOS F for Options 1 and 5; whereas for the other options, the
intersection operates at LOS C. The other intersections on Lee Highway operate at LOS D or better in all
the options.
Table 5: Intersection Level of Service (LOS) – 2025 Scenarios
Intersection
Option 1 Option 2 Option 3 Option 4 Option 5
Avg.
Delay
(sec/veh)
LOS
Avg.
Delay
(sec/veh)
LOS
Avg.
Delay
(sec/veh)
LOS
Avg.
Delay
(sec/veh)
LOS
Avg.
Delay
(sec/veh)
LOS
Fairfax Drive at Lee
Highway 134.6 F 33.3 C 34.6 C 33.5 C 134.7 F
Washington Boulevard at
Lee Highway 38.3 D 33.3 C 37.4 D 34.9 C 38.9 D
N Westmoreland Street at
N Washington Street 13.8 B 12.7 B 14.2 B 13.7 B 13.9 B
2040 Conditions
Table 6 and Figure 10 summarize the demand vs. throughputs on eastbound I-66 for the options under
2040 conditions. From the table and figure, it can be seen that in all the options, the throughput is
comparable to demand, and the difference is less than 5 percent.

TECHINICAL MEMORANDUM Eastbound I-66 Exit 69 Off-Ramp At Washington Boulevard / Lee Highway Traffic Operational Analysis
Transform I-66 Inside The Beltway Eastbound Widening Project Revised October 5, 2016 Page 14 of 17
Table 6: I-66 Eastbound Mainline Demand vs. Throughputs – 2040 Scenarios
Segment Demand
(veh/hr)
Option 1 Option 2 Option 3 Option 4 Option 5
Throughput
(veh/hr) Δ%
Throughput
(veh/hr) Δ%
Throughput
(veh/hr) Δ%
Throughput
(veh/hr) Δ%
Throughput
(veh/hr) Δ%
Eastbound I-66 before the Dulles Toll Road (DTR) merge point 2,090 2,086 0% 2,086 0% 2,086 0% 2,086 0% 2,086 0%
From DTR merge point to Exit 68 (Westmoreland Street) 4,655 4,613 -1% 4,636 0% 4,636 0% 4,636 0% 4,599 -1%
From Exit 68 to Exit 69 (Washington Boulevard / Lee Highway) 4,520 4,321 -4% 4,408 -2% 4,408 -2% 4,405 -3% 4,281 -5%
From Exit 69 to Sycamore Street on-ramp 3,125 3,092 -1% 3,107 -1% 3,106 -1% 3,105 -1% 3,061 -2%
Eastbound I-66 after Sycamore Street on-ramp 3,435 3,394 -1% 3,410 -1% 3,410 -1% 3,408 -1% 3,368 -2%
Figure 10: I-66 Eastbound Mainline Demand vs. Throughputs – 2040 Scenarios
0
500
1,000
1,500
2,000
2,500
3,000
3,500
4,000
4,500
5,000
Eastbound I-66
before the Dulles Toll
Road (DTR) merge
point
From DTR merge
point to Exit 68
(Westmoreland
Street)
From Exit 68 to Exit
69 (Washington
Boulevard / Lee
Highway)
From Exit 69 to
Sycamore Street on-
ramp
Eastbound I-66 after
Sycamore Street on-
ramp
Pe
ak
Ho
ur
Vo
lum
e (
veh
/hr)
Demand Option 1 Option 2 Option 3 Option 4 Option 5

TECHINICAL MEMORANDUM Eastbound I-66 Exit 69 Off-Ramp At Washington Boulevard / Lee Highway Traffic Operational Analysis
Transform I-66 Inside The Beltway Eastbound Widening Project Revised October 5, 2016 Page 15 of 17
Figure 11 shows the speed congestion diagram along eastbound I-66 in the study area. The mainline
operates above 55 mph for Options 2, 3 and 4; whereas there is a slight reduction in speed to 45 mph for
Options 1 and 5 near Exit 69.
Figure 11: Eastbound I-66 Speed Congestion Diagram - 2040 Scenarios
Table 7 shows the average and maximum queue lengths of the options at the Exit 69 off-ramp measured
from the intersection at Fairfax Drive / Lee Highway. As mentioned previously, queue lengths greater than
1,000 feet indicates a spillback into the eastbound I-66 mainline. The results show that, similar to 2025
conditions, Options 2, 3 and 4 are comparable with queues well within 1,000 feet. Options 1 and 5 have
queue lengths that are greater than 1,000 feet but are lower than the 2025 queue lengths shown in Table
4.
Table 7: Average and Maximum Queue Lengths at Exit 69 - 2040 Scenarios
Location
Option 1 Option 2 Option 3 Option 4 Option 5
Avg.
Queue
(ft.)
Max.
Queue
(ft.)
Avg.
Queue
(ft.)
Max.
Queue
(ft.)
Avg.
Queue
(ft.)
Max.
Queue
(ft.)
Avg.
Queue
(ft.)
Max.
Queue
(ft.)
Avg.
Queue
(ft.)
Max.
Queue
(ft.)
Exit 69
Off-Ramp 2,782 5,545 151 532 191 604 171 578 3,824 5,970
TECHINICAL MEMORANDUM Eastbound I-66 Exit 69 Off-Ramp At Washington Boulevard / Lee Highway Traffic Operational Analysis
Transform I-66 Inside The Beltway Eastbound Widening Project Revised October 5, 2016 Page 16 of 17
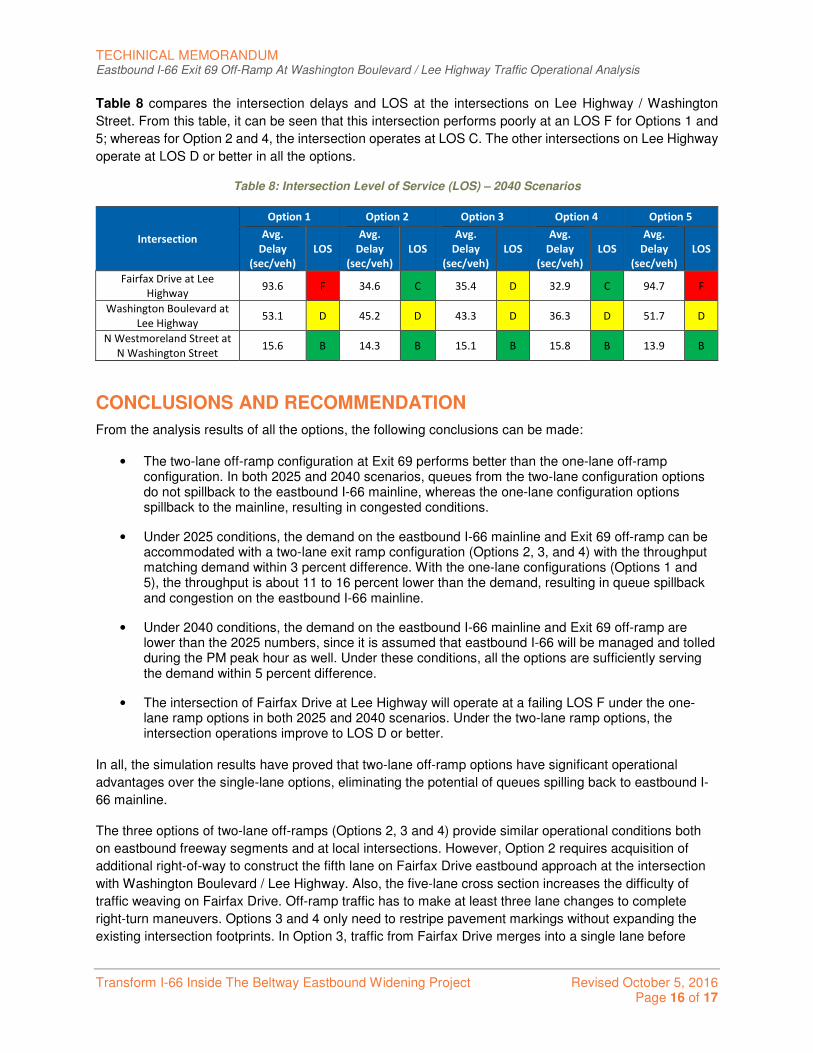
Table 8 compares the intersection delays and LOS at the intersections on Lee Highway / Washington
Street. From this table, it can be seen that this intersection performs poorly at an LOS F for Options 1 and
5; whereas for Option 2 and 4, the intersection operates at LOS C. The other intersections on Lee Highway
operate at LOS D or better in all the options.
Table 8: Intersection Level of Service (LOS) – 2040 Scenarios
Intersection
Option 1 Option 2 Option 3 Option 4 Option 5
Avg.
Delay
(sec/veh)
LOS
Avg.
Delay
(sec/veh)
LOS
Avg.
Delay
(sec/veh)
LOS
Avg.
Delay
(sec/veh)
LOS
Avg.
Delay
(sec/veh)
LOS
Fairfax Drive at Lee
Highway 93.6 F 34.6 C 35.4 D 32.9 C 94.7 F
Washington Boulevard at
Lee Highway 53.1 D 45.2 D 43.3 D 36.3 D 51.7 D
N Westmoreland Street at
N Washington Street 15.6 B 14.3 B 15.1 B 15.8 B 13.9 B
CONCLUSIONS AND RECOMMENDATION
From the analysis results of all the options, the following conclusions can be made:
• The two-lane off-ramp configuration at Exit 69 performs better than the one-lane off-ramp configuration. In both 2025 and 2040 scenarios, queues from the two-lane configuration options do not spillback to the eastbound I-66 mainline, whereas the one-lane configuration options spillback to the mainline, resulting in congested conditions.
• Under 2025 conditions, the demand on the eastbound I-66 mainline and Exit 69 off-ramp can be accommodated with a two-lane exit ramp configuration (Options 2, 3, and 4) with the throughput matching demand within 3 percent difference. With the one-lane configurations (Options 1 and 5), the throughput is about 11 to 16 percent lower than the demand, resulting in queue spillback and congestion on the eastbound I-66 mainline.
• Under 2040 conditions, the demand on the eastbound I-66 mainline and Exit 69 off-ramp are lower than the 2025 numbers, since it is assumed that eastbound I-66 will be managed and tolled during the PM peak hour as well. Under these conditions, all the options are sufficiently serving the demand within 5 percent difference.
• The intersection of Fairfax Drive at Lee Highway will operate at a failing LOS F under the one-lane ramp options in both 2025 and 2040 scenarios. Under the two-lane ramp options, the intersection operations improve to LOS D or better.
In all, the simulation results have proved that two-lane off-ramp options have significant operational
advantages over the single-lane options, eliminating the potential of queues spilling back to eastbound I-
66 mainline.
The three options of two-lane off-ramps (Options 2, 3 and 4) provide similar operational conditions both
on eastbound freeway segments and at local intersections. However, Option 2 requires acquisition of
additional right-of-way to construct the fifth lane on Fairfax Drive eastbound approach at the intersection
with Washington Boulevard / Lee Highway. Also, the five-lane cross section increases the difficulty of
traffic weaving on Fairfax Drive. Off-ramp traffic has to make at least three lane changes to complete
right-turn maneuvers. Options 3 and 4 only need to restripe pavement markings without expanding the
existing intersection footprints. In Option 3, traffic from Fairfax Drive merges into a single lane before

TECHINICAL MEMORANDUM Eastbound I-66 Exit 69 Off-Ramp At Washington Boulevard / Lee Highway Traffic Operational Analysis
Transform I-66 Inside The Beltway Eastbound Widening Project Revised October 5, 2016 Page 17 of 17
approaching the intersection, but Option 4 still keeps Fairfax Drive eastbound approach as two lanes as
in the existing condition. Off-ramp traffic in Option 3 only needs to weave against one-lane traffic from
Fairfax Drive, as compared to two-lane traffic in Option 4, to make the right-turn movements. In addition,
the projected traffic volumes on eastbound Fairfax Drive are less than the capacity of a single lane
approach. Hence, Option 3 provides a “cleaner” and safer traffic operational configuration on the
eastbound Fairfax Drive approach without compromising arterial and intersection level of service.
In light of the foregoing consideration, Option 3 is recommended as the Preferred Alternative of the lane
configurations at Exit 69 off-ramp and ramp intersection.

TRANSFORM I-66 INSIDE THE BELTWAY
EASTBOUND WIDENING PROJECT
EASTBOUND I-66 EXIT 71 OFF-RAMP AT FAIRFAX DRIVE
TRAFFIC OPERATIONAL ANALYSIS
TECHNICAL MEMORANDUM
September 15, 2016 (Initial Submittal)
October 5, 2016 (Revised)
INTRODUCTION
The Virginia Department of Transportation (VDOT) is planning to widen a four-mile stretch of eastbound I-
66 from the Dulles Connector Road (VA-267) to Fairfax Drive (Exit 71) in Ballston from two to three lanes.
Specifically, at eastbound Exit 71 to Fairfax Drive, the current Preliminary Field Inspection (PFI) plan
proposed to widen the off-ramp from a single lane to two lanes. This task is to perform a detailed analysis
for 2025 and 2040 Build scenarios during the PM peak hour to determine if the proposed additional lane on
the off-ramp (Exit 71) is beneficial in regards to traffic operations. This memorandum summarizes traffic
volumes, land configurations, operational analysis results, and conclusions of the operational analysis.
Figure 1 shows the study area for eastbound I-66 Exit 71 off-ramp operational analysis.
Figure 1: Aerial Map of Eastbound I-66 Exit 71 – Off-Ramp to Fairfax Drive/Glebe Road

TECHINICAL MEMORANDUM
Eastbound I-66 Exit 71 Off-Ramp At Fairfax Drive Traffic Operational Analysis
Transform I-66 Inside The Beltway Eastbound Widening Project Revised October 5, 2016 Page 2 of 8
ANALYSIS YEARS AND TIME PERIOD
The analysis years are interim year (2025) and design year (2040). The widening project will be completed
before 2020 and open to traffic in both analysis years. However, in 2025, only the peak directions will be
tolled during peak periods; while in 2040, both directions will be tolled during peak periods.
The eastbound corridor and the study ramp are projected to experience higher peak hour traffic in the PM
peak hour than in the AM. Therefore, we will only test traffic operational conditions during PM peak hour
since it represents a worst case.
TRAFFIC VOLUMES
Existing peak hour traffic volumes were collected in the field in April 2016. Projected traffic volumes for
future years were processed based on travel demand forecasting results. Figure 2 shows the peak hour
traffic volumes on I-66 mainlines and ramps within the study area for 2016, 2025 and 2040. On the
eastbound Exit 71 off-ramp to Fairfax Drive, traffic volumes are the highest during the 2025 Build PM peak
hour scenario where eastbound I-66 is widened but not tolled during the PM peak period. By 2040, the PM
peak period is tolled as well, therefore the volumes at this ramp are lower than 2025 volumes.
Figure 2: Peak Hour Traffic Volumes of Existing Year 2016, Interim Year 2025 and Design Year 2040
In addition to the off-ramp volumes presented above, the future traffic volumes at the ramp terminus
intersection, Fairfax Drive and N Wakefield Street (intersection ID: 7106), and the first adjacent intersection,
Fairfax Drive and Glebe Road (intersection ID 7105), are shown in Figure 3.

TECHINICAL MEMORANDUM
Eastbound I-66 Exit 71 Off-Ramp At Fairfax Drive Traffic Operational Analysis
Transform I-66 Inside The Beltway Eastbound Widening Project Revised October 5, 2016 Page 3 of 8
Figure 3: Intersection Turning Movement Volumes in PM Peak Hour of Existing Year 2016, Interim Year 2025 and Design Year 2040
ALTERNATIVES
Two alternatives of lane configurations at the eastbound Exit 71 off-ramp have been analyzed in this task:
• Existing configuration: single-lane off-ramp
• PFI proposed configuration: two-lane off-ramp
Existing Configuration
Currently, the eastbound I-66 Exit 71 to Fairfax Drive is a single-lane ramp with a 1,000-foot-long
deceleration lane on the I-66 mainline. From the theoretical gore point, the off-ramp is in a single-lane
configuration for about 500 feet and then expands to two lanes for about 1,140 feet before becoming the
eastbound approach at the signalized intersection of Fairfax Drive and Wakefield Street. Figure 4 illustrates
the schematic existing lane configurations.
Proposed PFI Configuration
Based on the current PFI plan, there will be no auxiliary lanes available on the eastbound I-66 mainline
after widening. The rightmost lane on the eastbound mainline would be an “Exit Only” lane terminating onto
the right lane of the Exit 71 off-ramp to Fairfax Drive. The center lane on the eastbound mainline would be
designated as a choice lane, from which one branch will become the additional left lane along the Exit 71
off-ramp, and the other branch will continue onto the eastbound mainline to Washington, DC. This design
alternative is assumed to be unchanged for both interim year (2025) and design year (2040) conditions.
Figure 5 presents the proposed lane configuration schematic at the Exit 71 off-ramp.

TECHINICAL MEMORANDUM
Eastbound I-66 Exit 71 Off-Ramp At Fairfax Drive Traffic Operational Analysis
Transform I-66 Inside The Beltway Eastbound Widening Project Revised October 5, 2016 Page 4 of 8
Figure 4: Existing Lane Configurations at EB I-66 Exit 71
Figure 5: PFI Proposed Lane Configurations at EB I-66 Exit 71

TECHINICAL MEMORANDUM
Eastbound I-66 Exit 71 Off-Ramp At Fairfax Drive Traffic Operational Analysis
Transform I-66 Inside The Beltway Eastbound Widening Project Revised October 5, 2016 Page 5 of 8
OPERATIONAL ANALYSIS RESULTS
Microsimulation traffic software, VISSIM version 8.0-08, was used to perform the operational analysis along
the eastbound I-66 off-ramp to Fairfax Drive at Exit 71. Only the PM peak hour scenario was analyzed as
it represents the time period with worst traffic conditions during a typical day. The mini-models for the study
areas were created from the calibrated existing condition VISSIM models developed for the full network
analysis of the I-66 Inside the Beltway eastbound widening project.
The measures of effectiveness (MOEs) considered for this analysis are throughput volumes and queue
lengths along the subject off-ramp at Exit 71. A comparison of the demand vs. throughput results of the
VISSIM analysis along the off-ramp would indicate where or not there are any congestion or capacity
problems. For the two signalized intersections, Fairfax Drive/N Wakefield Street and Fairfax Drive/Glebe
Road, intersection delay and LOS were used to compare the operational performance between the existing
single-lane and proposed two-lane configurations. Signal timing at both intersections has been optimized
based on the projected traffic volumes in the future years without changing cycle lengths and phase
sequences.
2025 Build Conditions
The Exit 71 off-ramp hourly volume during the PM peak hour in the 2025 Build is projected to be 1,585
vehicles per hour. This is about 65 percent increase from the existing PM peak hour volume (955 vehicles
per hour). The simulated queuing lengths and throughputs at the Exit 71 off-ramp are presented in Table
1. With both configurations, the Exit 71 off-ramp will be able to process more than 98 percent of the full
demand in 2025, which means no major bottleneck occurring at the ramp terminus during the PM peak
hours of both years. The available storage length at the Exit 71 off-ramp is about 1,610 feet, measured from
the theoretical gore point to the stop bar on Fairfax Drive eastbound approach with Wakefield Street
intersection. The average queuing conditions under both configurations will not be significant. However, the
maximum queue length of the existing configuration will be 1,596 feet, still within the available storage.
Based on the observation of VISSIM simulation, for the majority of time in the PM peak hour, the queue will
not spill beyond the gore point. Very occasionally, the queues may extend to the freeway mainline but will
quickly diminish back within the off-ramp during the green time at the ramp terminus intersection. The PFI
configuration will have an additional lane; therefore, it can accommodate more queuing vehicles. The
maximum queue length will be 632 feet, well under the storage length.
Table 1: Exit 71 Off-Ramp Traffic Operational Conditions in 2025 Build PM Peak Hour
2025 Build MOE Existing
Configuration PFI Configuration
Demand (veh/hr) Demand vs.
Throughputs
Throughputs (veh/hr) 1558 1561
1585 Unserved Demand (%) 1.7% 1.5%
Storage Length* (ft) Queue
Length**(ft)
Average Queue 467 298
1610 Maximum Queue 1596 632
* Measured from the theoretical gore point to the stop bar on Fairfax Drive eastbound approach with Wakefield Street intersection.
** Measured from the stop bar on Fairfax Drive eastbound approach with Wakefield Street intersection.
On the freeway mainline of eastbound I-66 near Exit 71, there are marginal differences in freeway speeds
between the two off-ramp configurations. As shown in Figure 6, under the single-lane configuration, the
freeway traffic upstream of Exit 71 will be slightly slower than the freeway flow speed, around 50 mph,
mostly because of the ramp queues; while with the two-lane configuration, the traffic flows will be able to
maintain the free flow speed of 55 mph.

TECHINICAL MEMORANDUM
Eastbound I-66 Exit 71 Off-Ramp At Fairfax Drive Traffic Operational Analysis
Transform I-66 Inside The Beltway Eastbound Widening Project Revised October 5, 2016 Page 6 of 8
Figure 6: Eastbound I-66 Speed Congestion Diagram near Exit 71 - 2025 Build Scenarios
Table 2 presents the LOS and delay information of the subject intersection for all analysis scenarios. Both
intersections will operate at LOS D or better in the PM peak hour of 2025 Build scenarios.
Table 2: Intersection Operational Conditions in PM Peak Hour of 2025 Build Scenarios
Intersection
LOS Delay (sec/veh)
Existing
Configuration
PFI
Configuration
Existing
Configuration
PFI
Configuration
Fairfax Dr/N Glebe Rd D D 40.6 36.5
Fairfax Dr/N Wakefield St D C 47.0 22.4
2040 Build Conditions
Because of eastbound tolling restriction in 2040 Build scenarios, the Exit 71 off-ramp volume in the PM
peak hour is projected to be 1,130 vehicles, only 71 percent of the 2025 Build volumes. Therefore, the
traffic operations at the off-ramp and freeway mainline will be better than in 2025 Build scenarios. As
summarized in Table 3, the ramp demand will be fully served and no significant queuing conditions will be
present under both configurations. Also, freeway mainline traffic will be able to maintain free flow speed of
55 mph (shown in Figure 7).

TECHINICAL MEMORANDUM
Eastbound I-66 Exit 71 Off-Ramp At Fairfax Drive Traffic Operational Analysis
Transform I-66 Inside The Beltway Eastbound Widening Project Revised October 5, 2016 Page 7 of 8
Table 3: Exit 71 Off-Ramp Traffic Operational Conditions in 2040 Build PM Peak Hour
2040 Build MOE Existing
Configuration PFI Configuration
Demand (veh/hr) Demand vs.
Throughputs
Throughputs (veh/hr) 1116 1118
1130 Unserved Demand (%) 1.2% 1.2%
Storage Length* (ft) Queue
Length**(ft)
Average Queue 40 25
1610 Maximum Queue 334 221
* Measured from the theoretical gore point to the stop bar on Fairfax Drive eastbound approach with Wakefield Street intersection.
** Measured from the stop bar on Fairfax Drive eastbound approach with Wakefield Street intersection.
Figure 7: Eastbound I-66 Speed Congestion Diagram near Exit 71 - 2040 Build Scenarios
Table 4 presents the LOS and delay information of the subject intersections for all analysis scenarios. Both
intersections will operate at LOS C or better in the PM peak hour of 2040 Build scenarios.
Table 4: Intersection Operational Conditions in PM Peak Hour of 2040 Build Scenarios
Intersection
LOS Delay (sec/veh)
Existing
Configuration
PFI
Configuration
Existing
Configuration
PFI
Configuration
Fairfax Dr/N Glebe Rd C C 34.4 33.7
Fairfax Dr/N Wakefield St B B 13.2 12.0

TECHINICAL MEMORANDUM
Eastbound I-66 Exit 71 Off-Ramp At Fairfax Drive Traffic Operational Analysis
Transform I-66 Inside The Beltway Eastbound Widening Project Revised October 5, 2016 Page 8 of 8
CONCLUSIONS AND RECOMMENDATION
The results of the traffic operational analysis indicate the following conclusions:
• Both the existing single-lane configuration and the PFI two-lane configuration along the eastbound
I-66 off-ramp to Fairfax Drive at Exit 71 are expected to operate at generally acceptable conditions
in 2025 and 2040 Build scenarios. The off-ramp demand will be able to be fully served under both
configurations in both years.
• It has been observed from the VISSIM simulation, under the existing single-lane off-ramp
configuration, that the queues occasionally extend to the freeway mainline in the 2025 Build
scenarios and slightly impact travel speeds of mainline traffic. This is primarily caused by the heavy
right-turn traffic at the intersection of Fairfax Drive and Glebe Road. The PFI two-lane configuration
will provide more queuing storage space and therefore improve the queuing conditions at the off-
ramp. The queue lengths will be well under the available storage length using a two-lane exit ramp
configuration.
• With both configurations, there would be no spillback of queues onto the eastbound I-66 mainline
during design year 2040.
• The ramp terminus intersection at Wakefield Street and the adjacent intersection of Fairfax Drive /
Glebe Road will operate at LOS D or better in both 2025 and 2040 Build scenarios. No intersection
operation failure or street gridlock were observed based on simulation results.
Even though the single-lane off-ramp configuration is adequate to accommodate off-ramp queues in 2040,
the off-ramp queues still potentially spillback to freeway mainlines in 2025, and up until the 2040 tolling
operations scenario is implemented. The two-lane configuration will not have adverse queuing conditions
in either horizon years. Also, the cost to construct the second lane for about 500 feet of pavement is not
significant, as compared to the total cost of the entire widening project. It is a cost-effective measure to
mitigate the queuing conditions caused by the congestion at the downstream arterial intersections.
Therefore, the two-lane off-ramp configuration is recommended as the Preferred Alternative at Exit 71.