appendix b1 pennsylvania avenue: intersection los reports · movement ebl ebt ebr wbl wbt wbr nbl...
TRANSCRIPT

Appendix B1 Pennsylvania Avenue: Intersection LOS Reports
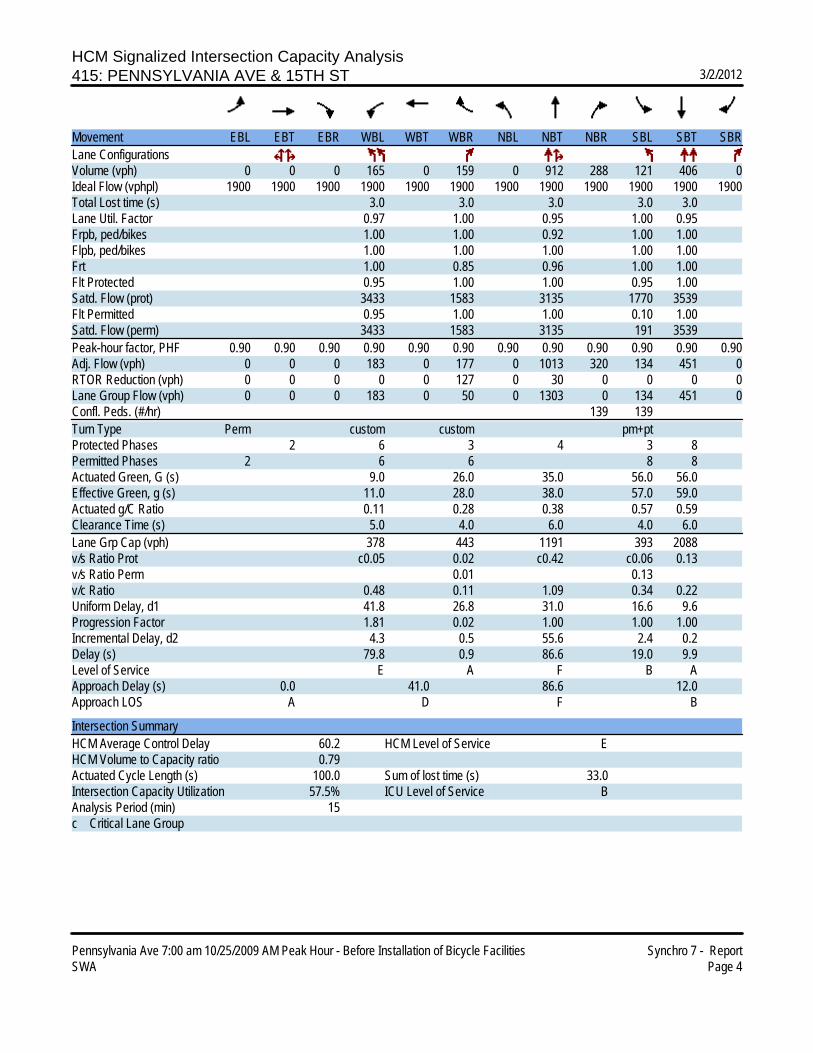
HCM Signalized Intersection Capacity Analysis415: PENNSYLVANIA AVE & 15TH ST 3/2/2012
Pennsylvania Ave 7:00 am 10/25/2009 AM Peak Hour - Before Installation of Bicycle Facilities Synchro 7 - ReportSWA Page 4
Movement EBL EBT EBR WBL WBT WBR NBL NBT NBR SBL SBT SBRLane ConfigurationsVolume (vph) 0 0 0 165 0 159 0 912 288 121 406 0Ideal Flow (vphpl) 1900 1900 1900 1900 1900 1900 1900 1900 1900 1900 1900 1900Total Lost time (s) 3.0 3.0 3.0 3.0 3.0Lane Util. Factor 0.97 1.00 0.95 1.00 0.95Frpb, ped/bikes 1.00 1.00 0.92 1.00 1.00Flpb, ped/bikes 1.00 1.00 1.00 1.00 1.00Frt 1.00 0.85 0.96 1.00 1.00Flt Protected 0.95 1.00 1.00 0.95 1.00Satd. Flow (prot) 3433 1583 3135 1770 3539Flt Permitted 0.95 1.00 1.00 0.10 1.00Satd. Flow (perm) 3433 1583 3135 191 3539Peak-hour factor, PHF 0.90 0.90 0.90 0.90 0.90 0.90 0.90 0.90 0.90 0.90 0.90 0.90Adj. Flow (vph) 0 0 0 183 0 177 0 1013 320 134 451 0RTOR Reduction (vph) 0 0 0 0 0 127 0 30 0 0 0 0Lane Group Flow (vph) 0 0 0 183 0 50 0 1303 0 134 451 0Confl. Peds. (#/hr) 139 139Turn Type Perm custom custom pm+ptProtected Phases 2 6 3 4 3 8Permitted Phases 2 6 6 8 8Actuated Green, G (s) 9.0 26.0 35.0 56.0 56.0Effective Green, g (s) 11.0 28.0 38.0 57.0 59.0Actuated g/C Ratio 0.11 0.28 0.38 0.57 0.59Clearance Time (s) 5.0 4.0 6.0 4.0 6.0Lane Grp Cap (vph) 378 443 1191 393 2088v/s Ratio Prot c0.05 0.02 c0.42 c0.06 0.13v/s Ratio Perm 0.01 0.13v/c Ratio 0.48 0.11 1.09 0.34 0.22Uniform Delay, d1 41.8 26.8 31.0 16.6 9.6Progression Factor 1.81 0.02 1.00 1.00 1.00Incremental Delay, d2 4.3 0.5 55.6 2.4 0.2Delay (s) 79.8 0.9 86.6 19.0 9.9Level of Service E A F B AApproach Delay (s) 0.0 41.0 86.6 12.0Approach LOS A D F B
Intersection SummaryHCM Average Control Delay 60.2 HCM Level of Service EHCM Volume to Capacity ratio 0.79Actuated Cycle Length (s) 100.0 Sum of lost time (s) 33.0Intersection Capacity Utilization 57.5% ICU Level of Service BAnalysis Period (min) 15c Critical Lane Group
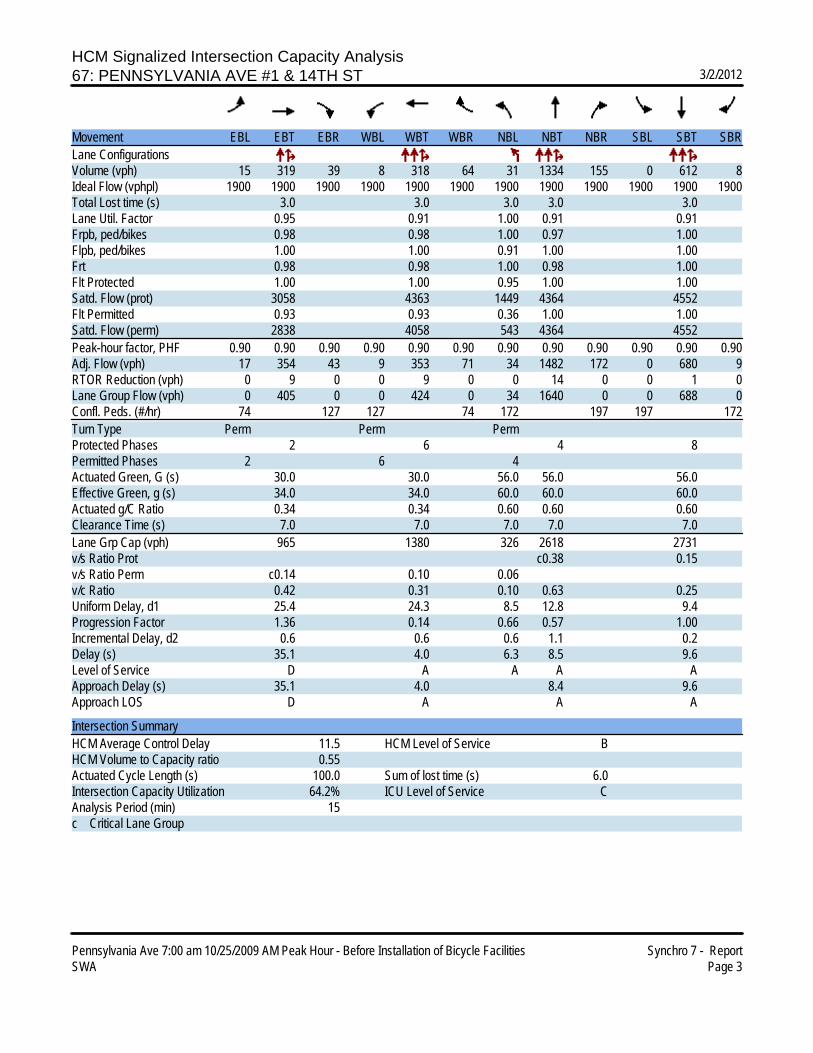
HCM Signalized Intersection Capacity Analysis67: PENNSYLVANIA AVE #1 & 14TH ST 3/2/2012
Pennsylvania Ave 7:00 am 10/25/2009 AM Peak Hour - Before Installation of Bicycle Facilities Synchro 7 - ReportSWA Page 3
Movement EBL EBT EBR WBL WBT WBR NBL NBT NBR SBL SBT SBRLane ConfigurationsVolume (vph) 15 319 39 8 318 64 31 1334 155 0 612 8Ideal Flow (vphpl) 1900 1900 1900 1900 1900 1900 1900 1900 1900 1900 1900 1900Total Lost time (s) 3.0 3.0 3.0 3.0 3.0Lane Util. Factor 0.95 0.91 1.00 0.91 0.91Frpb, ped/bikes 0.98 0.98 1.00 0.97 1.00Flpb, ped/bikes 1.00 1.00 0.91 1.00 1.00Frt 0.98 0.98 1.00 0.98 1.00Flt Protected 1.00 1.00 0.95 1.00 1.00Satd. Flow (prot) 3058 4363 1449 4364 4552Flt Permitted 0.93 0.93 0.36 1.00 1.00Satd. Flow (perm) 2838 4058 543 4364 4552Peak-hour factor, PHF 0.90 0.90 0.90 0.90 0.90 0.90 0.90 0.90 0.90 0.90 0.90 0.90Adj. Flow (vph) 17 354 43 9 353 71 34 1482 172 0 680 9RTOR Reduction (vph) 0 9 0 0 9 0 0 14 0 0 1 0Lane Group Flow (vph) 0 405 0 0 424 0 34 1640 0 0 688 0Confl. Peds. (#/hr) 74 127 127 74 172 197 197 172Turn Type Perm Perm PermProtected Phases 2 6 4 8Permitted Phases 2 6 4Actuated Green, G (s) 30.0 30.0 56.0 56.0 56.0Effective Green, g (s) 34.0 34.0 60.0 60.0 60.0Actuated g/C Ratio 0.34 0.34 0.60 0.60 0.60Clearance Time (s) 7.0 7.0 7.0 7.0 7.0Lane Grp Cap (vph) 965 1380 326 2618 2731v/s Ratio Prot c0.38 0.15v/s Ratio Perm c0.14 0.10 0.06v/c Ratio 0.42 0.31 0.10 0.63 0.25Uniform Delay, d1 25.4 24.3 8.5 12.8 9.4Progression Factor 1.36 0.14 0.66 0.57 1.00Incremental Delay, d2 0.6 0.6 0.6 1.1 0.2Delay (s) 35.1 4.0 6.3 8.5 9.6Level of Service D A A A AApproach Delay (s) 35.1 4.0 8.4 9.6Approach LOS D A A A
Intersection SummaryHCM Average Control Delay 11.5 HCM Level of Service BHCM Volume to Capacity ratio 0.55Actuated Cycle Length (s) 100.0 Sum of lost time (s) 6.0Intersection Capacity Utilization 64.2% ICU Level of Service CAnalysis Period (min) 15c Critical Lane Group

HCM Signalized Intersection Capacity Analysis855: PENNSYLVANIA AVE #1 & 13 1/2 ST 3/2/2012
Pennsylvania Ave 7:00 am 10/25/2009 AM Peak Hour - Before Installation of Bicycle Facilities Synchro 7 - ReportSWA Page 8
Movement EBT EBR WBL WBT NBL NBRLane ConfigurationsVolume (vph) 444 55 124 416 0 5Ideal Flow (vphpl) 1900 1900 1900 1900 1900 1900Total Lost time (s) 3.0 3.0 3.0 3.0Lane Util. Factor 0.91 1.00 0.91 1.00Frpb, ped/bikes 1.00 1.00 1.00 0.92Flpb, ped/bikes 1.00 1.00 1.00 1.00Frt 0.98 1.00 1.00 0.86Flt Protected 1.00 0.95 1.00 1.00Satd. Flow (prot) 4482 1593 4577 1328Flt Permitted 1.00 0.95 1.00 1.00Satd. Flow (perm) 4482 1593 4577 1328Peak-hour factor, PHF 0.90 0.90 0.90 0.90 0.90 0.90Adj. Flow (vph) 493 61 138 462 0 6RTOR Reduction (vph) 15 0 0 0 5 0Lane Group Flow (vph) 539 0 138 462 1 0Confl. Peds. (#/hr) 7 7 36 54Turn Type ProtProtected Phases 2 1 6 4Permitted PhasesActuated Green, G (s) 41.0 24.5 70.0 20.0Effective Green, g (s) 43.0 26.0 72.0 22.0Actuated g/C Ratio 0.43 0.26 0.72 0.22Clearance Time (s) 5.0 4.5 5.0 5.0Lane Grp Cap (vph) 1927 414 3295 292v/s Ratio Prot c0.12 c0.09 0.10 c0.00v/s Ratio Permv/c Ratio 0.28 0.33 0.14 0.00Uniform Delay, d1 18.5 30.0 4.4 30.5Progression Factor 0.57 1.14 0.16 1.00Incremental Delay, d2 0.3 2.1 0.1 0.0Delay (s) 10.8 36.4 0.8 30.5Level of Service B D A CApproach Delay (s) 10.8 9.0 30.5Approach LOS B A C
Intersection SummaryHCM Average Control Delay 10.0 HCM Level of Service AHCM Volume to Capacity ratio 0.23Actuated Cycle Length (s) 100.0 Sum of lost time (s) 9.0Intersection Capacity Utilization 46.0% ICU Level of Service AAnalysis Period (min) 15c Critical Lane Group
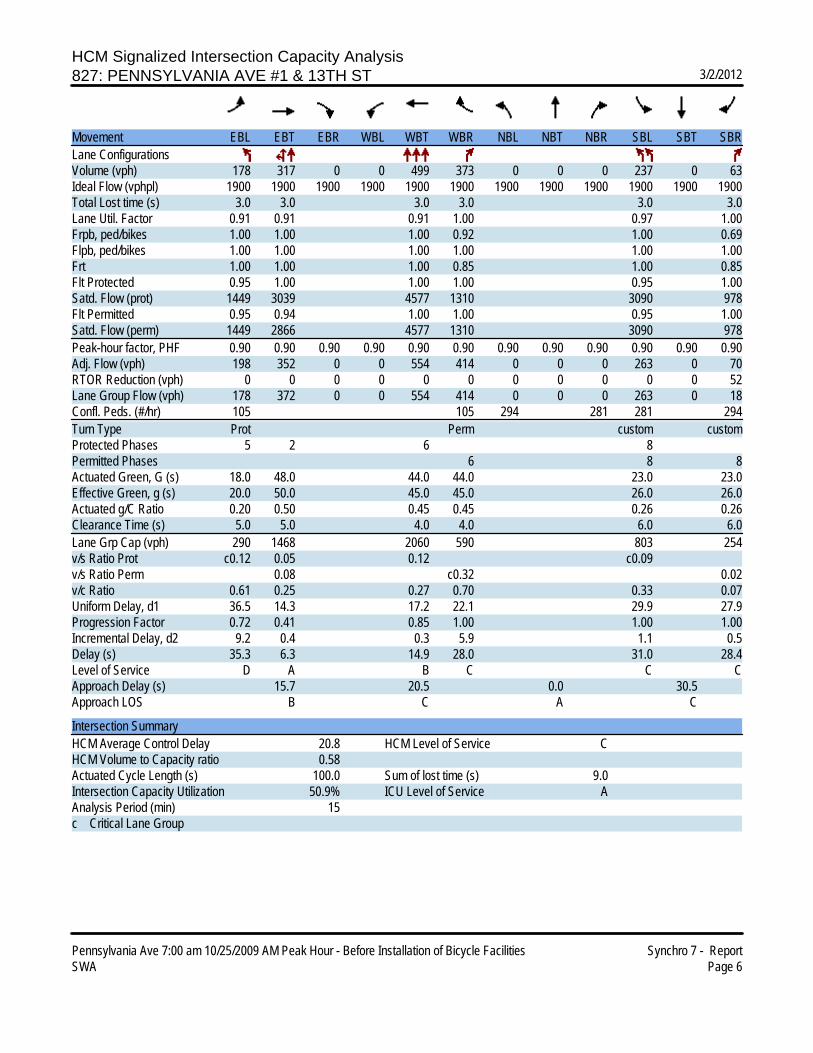
HCM Signalized Intersection Capacity Analysis827: PENNSYLVANIA AVE #1 & 13TH ST 3/2/2012
Pennsylvania Ave 7:00 am 10/25/2009 AM Peak Hour - Before Installation of Bicycle Facilities Synchro 7 - ReportSWA Page 6
Movement EBL EBT EBR WBL WBT WBR NBL NBT NBR SBL SBT SBRLane ConfigurationsVolume (vph) 178 317 0 0 499 373 0 0 0 237 0 63Ideal Flow (vphpl) 1900 1900 1900 1900 1900 1900 1900 1900 1900 1900 1900 1900Total Lost time (s) 3.0 3.0 3.0 3.0 3.0 3.0Lane Util. Factor 0.91 0.91 0.91 1.00 0.97 1.00Frpb, ped/bikes 1.00 1.00 1.00 0.92 1.00 0.69Flpb, ped/bikes 1.00 1.00 1.00 1.00 1.00 1.00Frt 1.00 1.00 1.00 0.85 1.00 0.85Flt Protected 0.95 1.00 1.00 1.00 0.95 1.00Satd. Flow (prot) 1449 3039 4577 1310 3090 978Flt Permitted 0.95 0.94 1.00 1.00 0.95 1.00Satd. Flow (perm) 1449 2866 4577 1310 3090 978Peak-hour factor, PHF 0.90 0.90 0.90 0.90 0.90 0.90 0.90 0.90 0.90 0.90 0.90 0.90Adj. Flow (vph) 198 352 0 0 554 414 0 0 0 263 0 70RTOR Reduction (vph) 0 0 0 0 0 0 0 0 0 0 0 52Lane Group Flow (vph) 178 372 0 0 554 414 0 0 0 263 0 18Confl. Peds. (#/hr) 105 105 294 281 281 294Turn Type Prot Perm custom customProtected Phases 5 2 6 8Permitted Phases 6 8 8Actuated Green, G (s) 18.0 48.0 44.0 44.0 23.0 23.0Effective Green, g (s) 20.0 50.0 45.0 45.0 26.0 26.0Actuated g/C Ratio 0.20 0.50 0.45 0.45 0.26 0.26Clearance Time (s) 5.0 5.0 4.0 4.0 6.0 6.0Lane Grp Cap (vph) 290 1468 2060 590 803 254v/s Ratio Prot c0.12 0.05 0.12 c0.09v/s Ratio Perm 0.08 c0.32 0.02v/c Ratio 0.61 0.25 0.27 0.70 0.33 0.07Uniform Delay, d1 36.5 14.3 17.2 22.1 29.9 27.9Progression Factor 0.72 0.41 0.85 1.00 1.00 1.00Incremental Delay, d2 9.2 0.4 0.3 5.9 1.1 0.5Delay (s) 35.3 6.3 14.9 28.0 31.0 28.4Level of Service D A B C C CApproach Delay (s) 15.7 20.5 0.0 30.5Approach LOS B C A C
Intersection SummaryHCM Average Control Delay 20.8 HCM Level of Service CHCM Volume to Capacity ratio 0.58Actuated Cycle Length (s) 100.0 Sum of lost time (s) 9.0Intersection Capacity Utilization 50.9% ICU Level of Service AAnalysis Period (min) 15c Critical Lane Group

HCM Signalized Intersection Capacity Analysis996: PENNSYLVANIA AVE #1 & 12TH ST 3/2/2012
Pennsylvania Ave 7:00 am 10/25/2009 AM Peak Hour - Before Installation of Bicycle Facilities Synchro 7 - ReportSWA Page 15
Movement EBL EBT EBR WBL WBT WBR NBL NBT NBR SBL SBT SBRLane ConfigurationsVolume (vph) 0 533 67 0 750 188 166 1607 135 0 0 0Ideal Flow (vphpl) 1900 1900 1900 1900 1900 1900 1900 1900 1900 1900 1900 1900Total Lost time (s) 3.0 3.0 3.0 3.0Lane Util. Factor 0.91 0.86 0.95 1.00Frt 0.98 0.97 1.00 0.85Flt Protected 1.00 1.00 1.00 1.00Satd. Flow (prot) 5001 6215 3523 1583Flt Permitted 1.00 1.00 1.00 1.00Satd. Flow (perm) 5001 6215 3523 1583Peak-hour factor, PHF 0.90 0.90 0.90 0.90 0.90 0.90 0.90 0.90 0.90 0.90 0.90 0.90Adj. Flow (vph) 0 592 74 0 833 209 184 1786 150 0 0 0RTOR Reduction (vph) 0 0 0 0 0 0 0 0 0 0 0 0Lane Group Flow (vph) 0 666 0 0 1042 0 0 1970 150 0 0 0Turn Type Perm PermProtected Phases 2 6 4Permitted Phases 4 4Actuated Green, G (s) 38.0 38.0 48.0 48.0Effective Green, g (s) 42.0 42.0 52.0 52.0Actuated g/C Ratio 0.42 0.42 0.52 0.52Clearance Time (s) 7.0 7.0 7.0 7.0Lane Grp Cap (vph) 2100 2610 1832 823v/s Ratio Prot 0.13 c0.17v/s Ratio Perm 0.56 0.09v/c Ratio 0.32 0.40 1.08 0.18Uniform Delay, d1 19.4 20.2 24.0 12.7Progression Factor 0.63 1.12 0.85 0.73Incremental Delay, d2 0.4 0.4 44.5 0.5Delay (s) 12.6 23.1 64.9 9.8Level of Service B C E AApproach Delay (s) 12.6 23.1 61.0 0.0Approach LOS B C E A
Intersection SummaryHCM Average Control Delay 42.3 HCM Level of Service DHCM Volume to Capacity ratio 0.77Actuated Cycle Length (s) 100.0 Sum of lost time (s) 6.0Intersection Capacity Utilization 69.9% ICU Level of Service CAnalysis Period (min) 15c Critical Lane Group

HCM Signalized Intersection Capacity Analysis839: PENNSYLVANIA AVE #1 & 11TH ST 3/2/2012
Pennsylvania Ave 7:00 am 10/25/2009 AM Peak Hour - Before Installation of Bicycle Facilities Synchro 7 - ReportSWA Page 7
Movement EBL EBT WBT WBR SBL SBRLane ConfigurationsVolume (vph) 192 360 936 301 97 39Ideal Flow (vphpl) 1900 1900 1900 1900 1900 1900Total Lost time (s) 3.0 3.0 3.0 3.0Lane Util. Factor 1.00 0.91 0.86 0.97Frpb, ped/bikes 1.00 1.00 0.89 0.96Flpb, ped/bikes 1.00 1.00 1.00 1.00Frt 1.00 1.00 0.96 0.96Flt Protected 0.95 1.00 1.00 0.97Satd. Flow (prot) 1765 5085 5526 3203Flt Permitted 0.12 1.00 1.00 0.97Satd. Flow (perm) 214 5085 5526 3203Peak-hour factor, PHF 0.90 0.90 0.90 0.90 0.90 0.90Adj. Flow (vph) 213 400 1040 334 108 43RTOR Reduction (vph) 0 0 58 0 31 0Lane Group Flow (vph) 213 400 1316 0 120 0Confl. Peds. (#/hr) 143 143 128 90Turn Type pm+ptProtected Phases 5 2 6 8Permitted Phases 2Actuated Green, G (s) 59.0 59.0 42.0 26.0Effective Green, g (s) 60.0 65.0 48.0 29.0Actuated g/C Ratio 0.60 0.65 0.48 0.29Clearance Time (s) 4.0 9.0 9.0 6.0Lane Grp Cap (vph) 346 3305 2652 929v/s Ratio Prot c0.09 0.08 0.24 c0.04v/s Ratio Perm c0.28v/c Ratio 0.62 0.12 0.50 0.13Uniform Delay, d1 12.5 6.6 17.7 26.2Progression Factor 0.77 0.19 0.37 1.00Incremental Delay, d2 7.8 0.1 0.6 0.3Delay (s) 17.4 1.3 7.2 26.5Level of Service B A A CApproach Delay (s) 6.9 7.2 26.5Approach LOS A A C
Intersection SummaryHCM Average Control Delay 8.5 HCM Level of Service AHCM Volume to Capacity ratio 0.43Actuated Cycle Length (s) 100.0 Sum of lost time (s) 6.0Intersection Capacity Utilization 57.6% ICU Level of Service BAnalysis Period (min) 15c Critical Lane Group

HCM Signalized Intersection Capacity Analysis995: PENNSYLVANIA AVE #1 & 10TH ST 3/2/2012
Pennsylvania Ave 7:00 am 10/25/2009 AM Peak Hour - Before Installation of Bicycle Facilities Synchro 7 - ReportSWA Page 14
Movement EBL EBT EBR WBL WBT WBR NBL NBT NBR SBL SBT SBRLane ConfigurationsVolume (vph) 0 469 22 3 1061 0 171 0 109 54 13 33Ideal Flow (vphpl) 1900 1900 1900 1900 1900 1900 1900 1900 1900 1900 1900 1900Total Lost time (s) 3.0 3.0 3.0 3.0 3.0Lane Util. Factor 0.91 0.91 1.00 1.00 0.95Frpb, ped/bikes 0.99 1.00 1.00 0.84 0.96Flpb, ped/bikes 1.00 1.00 0.91 1.00 0.92Frt 0.99 1.00 1.00 0.85 0.95Flt Protected 1.00 1.00 0.95 1.00 0.97Satd. Flow (prot) 5019 5084 1619 1323 2889Flt Permitted 1.00 0.94 0.68 1.00 0.97Satd. Flow (perm) 5019 4774 1162 1323 2889Peak-hour factor, PHF 0.90 0.90 0.90 0.90 0.90 0.90 0.90 0.90 0.90 0.90 0.90 0.90Adj. Flow (vph) 0 521 24 3 1179 0 190 0 121 60 14 37RTOR Reduction (vph) 0 5 0 0 0 0 0 0 77 0 24 0Lane Group Flow (vph) 0 540 0 0 1182 0 190 0 44 0 87 0Confl. Peds. (#/hr) 90 91 91 90 53 83 83 53Turn Type Perm custom custom PermProtected Phases 2 6 8Permitted Phases 6 4 4 8Actuated Green, G (s) 54.0 54.0 31.0 31.0 31.0Effective Green, g (s) 58.0 58.0 36.0 36.0 36.0Actuated g/C Ratio 0.58 0.58 0.36 0.36 0.36Clearance Time (s) 7.0 7.0 8.0 8.0 8.0Lane Grp Cap (vph) 2911 2769 418 476 1040v/s Ratio Prot 0.11v/s Ratio Perm c0.25 c0.16 0.03 0.03v/c Ratio 0.19 0.43 0.45 0.09 0.08Uniform Delay, d1 9.9 11.7 24.5 21.2 21.1Progression Factor 0.54 0.13 1.00 1.00 1.00Incremental Delay, d2 0.1 0.5 3.5 0.4 0.2Delay (s) 5.4 1.9 28.0 21.6 21.3Level of Service A A C C CApproach Delay (s) 5.4 1.9 25.5 21.3Approach LOS A A C C
Intersection SummaryHCM Average Control Delay 7.2 HCM Level of Service AHCM Volume to Capacity ratio 0.44Actuated Cycle Length (s) 100.0 Sum of lost time (s) 6.0Intersection Capacity Utilization 53.3% ICU Level of Service AAnalysis Period (min) 15c Critical Lane Group

HCM Signalized Intersection Capacity Analysis994: PENNSYLVANIA AVE #2 & 9TH ST 3/2/2012
Pennsylvania Ave 7:00 am 10/25/2009 AM Peak Hour - Before Installation of Bicycle Facilities Synchro 7 - ReportSWA Page 13
Movement EBL EBT EBR WBL WBT WBR NBL NBT NBR SBL SBT SBRLane ConfigurationsVolume (vph) 0 438 124 12 1082 0 0 0 49 260 717 57Ideal Flow (vphpl) 1900 1900 1900 1900 1900 1900 1900 1900 1900 1900 1900 1900Total Lost time (s) 3.0 3.0 3.0 3.0 3.0Lane Util. Factor 0.86 0.86 0.86 1.00 0.91Frpb, ped/bikes 0.99 0.70 1.00 0.73 0.98Flpb, ped/bikes 1.00 1.00 1.00 1.00 0.93Frt 1.00 0.85 1.00 0.86 0.99Flt Protected 1.00 1.00 1.00 1.00 0.99Satd. Flow (prot) 4716 951 6362 1168 4531Flt Permitted 1.00 1.00 0.92 1.00 0.99Satd. Flow (perm) 4716 951 5886 1168 4531Peak-hour factor, PHF 0.93 0.93 0.93 0.93 0.93 0.93 0.93 0.93 0.93 0.93 0.93 0.93Adj. Flow (vph) 0 471 133 13 1163 0 0 0 53 280 771 61RTOR Reduction (vph) 0 3 9 0 0 0 0 0 31 0 1 0Lane Group Flow (vph) 0 481 111 0 1176 0 0 0 22 0 1111 0Confl. Peds. (#/hr) 632 197 197 632 226 152 152 226Bus Blockages (#/hr) 0 5 0 0 5 0 0 5 0 0 5 0Turn Type Perm Perm custom PermProtected Phases 4 8 6Permitted Phases 4 8 2 6Actuated Green, G (s) 48.0 48.0 48.0 38.0 38.0Effective Green, g (s) 52.0 52.0 52.0 42.0 42.0Actuated g/C Ratio 0.52 0.52 0.52 0.42 0.42Clearance Time (s) 7.0 7.0 7.0 7.0 7.0Lane Grp Cap (vph) 2452 495 3061 491 1903v/s Ratio Prot 0.10v/s Ratio Perm 0.12 c0.20 0.02 0.25v/c Ratio 0.20 0.22 0.38 0.05 0.58Uniform Delay, d1 12.8 13.0 14.4 17.1 22.3Progression Factor 0.95 0.91 0.56 1.00 0.59Incremental Delay, d2 0.2 1.0 0.3 0.2 1.1Delay (s) 12.4 12.9 8.4 17.3 14.3Level of Service B B A B BApproach Delay (s) 12.5 8.4 17.3 14.3Approach LOS B A B B
Intersection SummaryHCM Average Control Delay 11.6 HCM Level of Service BHCM Volume to Capacity ratio 0.47Actuated Cycle Length (s) 100.0 Sum of lost time (s) 6.0Intersection Capacity Utilization 64.2% ICU Level of Service CAnalysis Period (min) 15c Critical Lane Group

HCM Signalized Intersection Capacity Analysis993: PENNSYLVANIA AVE #2 & 7TH ST 3/2/2012
Pennsylvania Ave 7:00 am 10/25/2009 AM Peak Hour - Before Installation of Bicycle Facilities Synchro 7 - ReportSWA Page 12
Movement EBL EBT EBR WBL WBT WBR NBL NBT NBR SBL SBT SBRLane ConfigurationsVolume (vph) 183 436 122 2 830 125 245 682 28 3 314 19Ideal Flow (vphpl) 1900 1900 1900 1900 1900 1900 1900 1900 1900 1900 1900 1900Total Lost time (s) 3.0 3.0 3.0 3.0 3.0 3.0Lane Util. Factor 1.00 0.86 0.86 1.00 0.95 0.95Frpb, ped/bikes 1.00 0.98 0.95 1.00 0.99 0.99Flpb, ped/bikes 0.99 1.00 1.00 0.93 1.00 1.00Frt 1.00 0.97 0.98 1.00 0.99 0.99Flt Protected 0.95 1.00 1.00 0.95 1.00 1.00Satd. Flow (prot) 1755 6073 5956 1646 3438 3444Flt Permitted 0.18 1.00 0.93 0.46 1.00 0.95Satd. Flow (perm) 340 6073 5549 798 3438 3270Peak-hour factor, PHF 0.93 0.93 0.93 0.93 0.93 0.93 0.93 0.93 0.93 0.93 0.93 0.93Adj. Flow (vph) 197 469 131 2 892 134 263 733 30 3 338 20RTOR Reduction (vph) 0 51 0 0 27 0 0 3 0 0 4 0Lane Group Flow (vph) 197 549 0 0 1001 0 263 760 0 0 357 0Confl. Peds. (#/hr) 348 69 69 348 76 247 247 76Bus Blockages (#/hr) 0 5 0 0 5 0 0 5 0 0 5 0Turn Type pm+pt Perm Perm PermProtected Phases 5 2 6 4 8Permitted Phases 2 6 4 8Actuated Green, G (s) 56.0 56.0 39.0 30.0 30.0 30.0Effective Green, g (s) 57.0 60.0 43.0 34.0 34.0 34.0Actuated g/C Ratio 0.57 0.60 0.43 0.34 0.34 0.34Clearance Time (s) 4.0 7.0 7.0 7.0 7.0 7.0Lane Grp Cap (vph) 392 3644 2386 271 1169 1112v/s Ratio Prot c0.07 0.09 0.22v/s Ratio Perm c0.22 0.18 c0.33 0.11v/c Ratio 0.50 0.15 0.42 0.97 0.65 0.32Uniform Delay, d1 11.5 8.8 19.8 32.5 28.0 24.4Progression Factor 1.70 1.70 0.54 0.70 0.67 1.00Incremental Delay, d2 4.4 0.1 0.5 47.3 2.8 0.8Delay (s) 24.0 15.0 11.1 70.2 21.5 25.2Level of Service C B B E C CApproach Delay (s) 17.2 11.1 34.0 25.2Approach LOS B B C C
Intersection SummaryHCM Average Control Delay 21.5 HCM Level of Service CHCM Volume to Capacity ratio 0.65Actuated Cycle Length (s) 100.0 Sum of lost time (s) 6.0Intersection Capacity Utilization 92.1% ICU Level of Service FAnalysis Period (min) 15c Critical Lane Group

HCM Signalized Intersection Capacity Analysis997: PENNSYLVANIA AVE #2 & 6TH ST 3/2/2012
Pennsylvania Ave 7:00 am 10/25/2009 AM Peak Hour - Before Installation of Bicycle Facilities Synchro 7 - ReportSWA Page 16
Movement EBL EBT EBR WBL WBT WBR NBL NBT NBR SBL SBT SBRLane ConfigurationsVolume (vph) 57 431 12 2 845 55 39 439 1 22 250 70Ideal Flow (vphpl) 1900 1900 1900 1900 1900 1900 1900 1900 1900 1900 1900 1900Total Lost time (s) 3.0 3.0 3.0 3.0 3.0Lane Util. Factor 1.00 0.86 0.86 0.95 0.95Frpb, ped/bikes 1.00 1.00 1.00 1.00 0.98Flpb, ped/bikes 1.00 1.00 1.00 1.00 1.00Frt 1.00 1.00 0.99 1.00 0.97Flt Protected 0.95 1.00 1.00 1.00 1.00Satd. Flow (prot) 1770 6343 6287 3473 3297Flt Permitted 0.95 1.00 0.93 0.89 0.90Satd. Flow (perm) 1770 6343 5859 3108 2980Peak-hour factor, PHF 0.95 0.95 0.95 0.95 0.95 0.95 0.95 0.95 0.95 0.95 0.95 0.95Adj. Flow (vph) 60 454 13 2 889 58 41 462 1 23 263 74RTOR Reduction (vph) 0 4 0 0 9 0 0 0 0 0 23 0Lane Group Flow (vph) 60 463 0 0 940 0 0 504 0 0 337 0Confl. Peds. (#/hr) 46 17 17 46 67 93 93 67Bus Blockages (#/hr) 0 5 0 0 5 0 0 5 0 0 5 0Turn Type Prot Perm Perm PermProtected Phases 5 2 6 4 8Permitted Phases 6 4 8Actuated Green, G (s) 19.0 61.0 38.0 26.0 26.0Effective Green, g (s) 20.0 64.0 41.0 30.0 30.0Actuated g/C Ratio 0.20 0.64 0.41 0.30 0.30Clearance Time (s) 4.0 6.0 6.0 7.0 7.0Lane Grp Cap (vph) 354 4060 2402 932 894v/s Ratio Prot c0.03 0.07v/s Ratio Perm c0.16 c0.16 0.11v/c Ratio 0.17 0.11 0.39 0.54 0.38Uniform Delay, d1 33.1 7.0 20.7 29.2 27.6Progression Factor 1.21 0.83 1.04 1.22 1.00Incremental Delay, d2 1.0 0.1 0.0 2.2 1.2Delay (s) 41.2 5.9 21.7 38.0 28.8Level of Service D A C D CApproach Delay (s) 9.9 21.7 38.0 28.8Approach LOS A C D C
Intersection SummaryHCM Average Control Delay 23.6 HCM Level of Service CHCM Volume to Capacity ratio 0.39Actuated Cycle Length (s) 100.0 Sum of lost time (s) 9.0Intersection Capacity Utilization 81.7% ICU Level of Service DAnalysis Period (min) 15c Critical Lane Group

HCM Signalized Intersection Capacity Analysis415: PENNSYLVANIA AVE & 15TH ST 3/2/2012
Pennsylvania Ave 5:00 pm 10/25/2009 PM Peak Hour - Before Installation of Bicycle Facilities Synchro 7 - ReportSWA Page 3
Movement EBL EBT EBR WBL WBT WBR NBL NBT NBR SBL SBT SBRLane ConfigurationsVolume (vph) 0 0 0 298 0 143 0 414 167 209 950 0Ideal Flow (vphpl) 1900 1900 1900 1900 1900 1900 1900 1900 1900 1900 1900 1900Total Lost time (s) 3.0 3.0 3.0 3.0 3.0Lane Util. Factor 0.97 1.00 0.95 1.00 0.95Frpb, ped/bikes 1.00 1.00 0.91 1.00 1.00Flpb, ped/bikes 1.00 1.00 1.00 1.00 1.00Frt 1.00 0.85 0.96 1.00 1.00Flt Protected 0.95 1.00 1.00 0.95 1.00Satd. Flow (prot) 3433 1583 3077 1770 3539Flt Permitted 0.95 1.00 1.00 0.22 1.00Satd. Flow (perm) 3433 1583 3077 410 3539Peak-hour factor, PHF 0.90 0.90 0.90 0.90 0.90 0.90 0.90 0.90 0.90 0.90 0.90 0.90Adj. Flow (vph) 0 0 0 331 0 159 0 460 186 232 1056 0RTOR Reduction (vph) 0 0 0 0 0 107 0 44 0 0 0 0Lane Group Flow (vph) 0 0 0 331 0 52 0 602 0 232 1056 0Confl. Peds. (#/hr) 107 107Turn Type Perm custom custom pm+pt PermProtected Phases 2 6 3 4 3 8Permitted Phases 2 6 6 8 8 8Actuated Green, G (s) 16.0 31.0 30.0 49.0 49.0Effective Green, g (s) 18.0 33.0 33.0 50.0 52.0Actuated g/C Ratio 0.18 0.33 0.33 0.50 0.52Clearance Time (s) 5.0 4.0 6.0 4.0 6.0Lane Grp Cap (vph) 618 522 1015 423 1840v/s Ratio Prot c0.10 0.02 0.20 0.09 c0.30v/s Ratio Perm 0.02 0.19v/c Ratio 0.54 0.10 0.59 0.55 0.57Uniform Delay, d1 37.2 23.2 27.9 16.1 16.4Progression Factor 0.50 1.47 1.00 1.00 1.00Incremental Delay, d2 3.1 0.4 2.6 5.0 1.3Delay (s) 21.7 34.5 30.5 21.2 17.7Level of Service C C C C BApproach Delay (s) 0.0 25.8 30.5 18.4Approach LOS A C C B
Intersection SummaryHCM Average Control Delay 23.1 HCM Level of Service CHCM Volume to Capacity ratio 0.56Actuated Cycle Length (s) 100.0 Sum of lost time (s) 30.0Intersection Capacity Utilization 48.6% ICU Level of Service AAnalysis Period (min) 15c Critical Lane Group

HCM Signalized Intersection Capacity Analysis67: PENNSYLVANIA AVE #1 & 14TH ST 3/2/2012
Pennsylvania Ave 5:00 pm 10/25/2009 PM Peak Hour - Before Installation of Bicycle Facilities Synchro 7 - ReportSWA Page 2
Movement EBL EBT EBR WBL WBT WBR NBL NBT NBR SBL SBT SBRLane ConfigurationsVolume (vph) 11 366 59 13 368 58 50 771 148 0 1094 29Ideal Flow (vphpl) 1900 1900 1900 1900 1900 1900 1900 1900 1900 1900 1900 1900Total Lost time (s) 3.0 3.0 3.0 3.0 3.0Lane Util. Factor 0.95 0.91 1.00 0.91 0.91Frpb, ped/bikes 0.97 0.99 1.00 0.96 0.99Flpb, ped/bikes 1.00 1.00 0.96 1.00 1.00Frt 0.98 0.98 1.00 0.98 1.00Flt Protected 1.00 1.00 0.95 1.00 1.00Satd. Flow (prot) 3029 4404 1526 4294 4522Flt Permitted 0.94 0.92 0.18 1.00 1.00Satd. Flow (perm) 2842 4055 286 4294 4522Peak-hour factor, PHF 0.90 0.90 0.90 0.90 0.90 0.90 0.90 0.90 0.90 0.90 0.90 0.90Adj. Flow (vph) 12 407 66 14 409 64 56 857 164 0 1216 32RTOR Reduction (vph) 0 12 0 0 20 0 0 22 0 0 3 0Lane Group Flow (vph) 0 473 0 0 467 0 56 999 0 0 1245 0Confl. Peds. (#/hr) 69 127 127 69 247 155 155 247Turn Type Perm Perm PermProtected Phases 2 6 4 8Permitted Phases 2 6 4Actuated Green, G (s) 28.0 28.0 58.0 58.0 58.0Effective Green, g (s) 32.0 32.0 62.0 62.0 62.0Actuated g/C Ratio 0.32 0.32 0.62 0.62 0.62Clearance Time (s) 7.0 7.0 7.0 7.0 7.0Lane Grp Cap (vph) 909 1298 177 2662 2804v/s Ratio Prot 0.23 c0.28v/s Ratio Perm c0.17 0.12 0.20v/c Ratio 0.52 0.36 0.32 0.38 0.44Uniform Delay, d1 27.7 26.1 9.0 9.4 10.0Progression Factor 1.06 2.42 1.00 1.00 1.00Incremental Delay, d2 1.9 0.8 4.6 0.4 0.5Delay (s) 31.3 64.0 13.6 9.8 10.5Level of Service C E B A BApproach Delay (s) 31.3 64.0 10.0 10.5Approach LOS C E B B
Intersection SummaryHCM Average Control Delay 21.3 HCM Level of Service CHCM Volume to Capacity ratio 0.47Actuated Cycle Length (s) 100.0 Sum of lost time (s) 6.0Intersection Capacity Utilization 62.6% ICU Level of Service BAnalysis Period (min) 15c Critical Lane Group

HCM Signalized Intersection Capacity Analysis855: PENNSYLVANIA AVE #1 & 13 1/2 ST 3/2/2012
Pennsylvania Ave 5:00 pm 10/25/2009 PM Peak Hour - Before Installation of Bicycle Facilities Synchro 7 - ReportSWA Page 7
Movement EBT EBR WBL WBT NBL NBRLane ConfigurationsVolume (vph) 491 63 107 456 0 88Ideal Flow (vphpl) 1900 1900 1900 1900 1900 1900Total Lost time (s) 3.0 3.0 3.0 3.0Lane Util. Factor 0.91 1.00 0.91 1.00Frpb, ped/bikes 0.99 1.00 1.00 0.95Flpb, ped/bikes 1.00 1.00 1.00 1.00Frt 0.98 1.00 1.00 0.86Flt Protected 1.00 0.95 1.00 1.00Satd. Flow (prot) 4457 1593 4577 1381Flt Permitted 1.00 0.95 1.00 1.00Satd. Flow (perm) 4457 1593 4577 1381Peak-hour factor, PHF 0.90 0.90 0.90 0.90 0.90 0.90Adj. Flow (vph) 546 70 119 507 0 98RTOR Reduction (vph) 16 0 0 0 60 0Lane Group Flow (vph) 600 0 119 507 38 0Confl. Peds. (#/hr) 23 23 51 47Turn Type ProtProtected Phases 2 1 6 4Permitted PhasesActuated Green, G (s) 33.0 15.5 53.0 37.0Effective Green, g (s) 35.0 17.0 55.0 39.0Actuated g/C Ratio 0.35 0.17 0.55 0.39Clearance Time (s) 5.0 4.5 5.0 5.0Lane Grp Cap (vph) 1560 271 2517 539v/s Ratio Prot c0.13 c0.07 0.11 c0.03v/s Ratio Permv/c Ratio 0.38 0.44 0.20 0.07Uniform Delay, d1 24.4 37.2 11.4 19.1Progression Factor 0.65 1.05 0.64 1.00Incremental Delay, d2 0.7 5.0 0.2 0.3Delay (s) 16.4 44.2 7.5 19.4Level of Service B D A BApproach Delay (s) 16.4 14.5 19.4Approach LOS B B B
Intersection SummaryHCM Average Control Delay 15.7 HCM Level of Service BHCM Volume to Capacity ratio 0.26Actuated Cycle Length (s) 100.0 Sum of lost time (s) 9.0Intersection Capacity Utilization 44.9% ICU Level of Service AAnalysis Period (min) 15c Critical Lane Group

HCM Signalized Intersection Capacity Analysis827: PENNSYLVANIA AVE #1 & 13TH ST 3/2/2012
Pennsylvania Ave 5:00 pm 10/25/2009 PM Peak Hour - Before Installation of Bicycle Facilities Synchro 7 - ReportSWA Page 5
Movement EBL EBT EBR WBL WBT WBR NBL NBT NBR SBL SBT SBRLane ConfigurationsVolume (vph) 175 476 0 0 428 372 0 0 0 577 0 153Ideal Flow (vphpl) 1900 1900 1900 1900 1900 1900 1900 1900 1900 1900 1900 1900Total Lost time (s) 3.0 3.0 3.0 3.0 3.0 3.0Lane Util. Factor 0.91 0.91 0.91 1.00 0.97 1.00Frpb, ped/bikes 1.00 1.00 1.00 0.79 1.00 0.67Flpb, ped/bikes 1.00 1.00 1.00 1.00 1.00 1.00Frt 1.00 1.00 1.00 0.85 1.00 0.85Flt Protected 0.95 1.00 1.00 1.00 0.95 1.00Satd. Flow (prot) 1449 3037 4577 1128 3090 960Flt Permitted 0.95 0.95 1.00 1.00 0.95 1.00Satd. Flow (perm) 1449 2881 4577 1128 3090 960Peak-hour factor, PHF 0.90 0.90 0.90 0.90 0.90 0.90 0.90 0.90 0.90 0.90 0.90 0.90Adj. Flow (vph) 194 529 0 0 476 413 0 0 0 641 0 170RTOR Reduction (vph) 0 0 0 0 0 227 0 0 0 0 0 126Lane Group Flow (vph) 175 548 0 0 476 186 0 0 0 641 0 44Confl. Peds. (#/hr) 301 301 351 398 398 351Turn Type Prot Perm custom customProtected Phases 5 2 6 8Permitted Phases 6 8 8Actuated Green, G (s) 18.0 48.0 44.0 44.0 23.0 23.0Effective Green, g (s) 20.0 50.0 45.0 45.0 26.0 26.0Actuated g/C Ratio 0.20 0.50 0.45 0.45 0.26 0.26Clearance Time (s) 5.0 5.0 4.0 4.0 6.0 6.0Lane Grp Cap (vph) 290 1472 2060 508 803 250v/s Ratio Prot c0.12 0.07 0.10 c0.21v/s Ratio Perm 0.11 c0.16 0.05v/c Ratio 0.60 0.37 0.23 0.37 0.80 0.18Uniform Delay, d1 36.4 15.4 16.9 18.1 34.6 28.7Progression Factor 0.52 0.38 0.42 1.23 1.00 1.00Incremental Delay, d2 8.7 0.7 0.2 1.9 8.1 1.5Delay (s) 27.6 6.5 7.4 24.2 42.7 30.2Level of Service C A A C D CApproach Delay (s) 11.6 15.2 0.0 40.1Approach LOS B B A D
Intersection SummaryHCM Average Control Delay 22.5 HCM Level of Service CHCM Volume to Capacity ratio 0.54Actuated Cycle Length (s) 100.0 Sum of lost time (s) 9.0Intersection Capacity Utilization 56.2% ICU Level of Service BAnalysis Period (min) 15c Critical Lane Group

HCM Signalized Intersection Capacity Analysis996: PENNSYLVANIA AVE #1 & 12TH ST 3/2/2012
Pennsylvania Ave 5:00 pm 10/25/2009 PM Peak Hour - Before Installation of Bicycle Facilities Synchro 7 - ReportSWA Page 14
Movement EBL EBT EBR WBL WBT WBR NBL NBT NBR SBL SBT SBRLane ConfigurationsVolume (vph) 0 1001 109 0 730 119 124 854 106 0 0 0Ideal Flow (vphpl) 1900 1900 1900 1900 1900 1900 1900 1900 1900 1900 1900 1900Total Lost time (s) 3.0 3.0 3.0 3.0Lane Util. Factor 0.91 0.86 0.95 1.00Frt 0.99 0.98 1.00 0.85Flt Protected 1.00 1.00 0.99 1.00Satd. Flow (prot) 5010 6273 3517 1583Flt Permitted 1.00 1.00 0.99 1.00Satd. Flow (perm) 5010 6273 3517 1583Peak-hour factor, PHF 0.90 0.90 0.90 0.90 0.90 0.90 0.90 0.90 0.90 0.90 0.90 0.90Adj. Flow (vph) 0 1112 121 0 811 132 138 949 118 0 0 0RTOR Reduction (vph) 0 13 0 0 29 0 0 0 10 0 0 0Lane Group Flow (vph) 0 1220 0 0 914 0 0 1087 108 0 0 0Turn Type Perm PermProtected Phases 2 6 4Permitted Phases 4 4Actuated Green, G (s) 35.0 35.0 51.0 51.0Effective Green, g (s) 39.0 39.0 55.0 55.0Actuated g/C Ratio 0.39 0.39 0.55 0.55Clearance Time (s) 7.0 7.0 7.0 7.0Lane Grp Cap (vph) 1954 2446 1934 871v/s Ratio Prot c0.24 0.15v/s Ratio Perm 0.31 0.07v/c Ratio 0.62 0.37 0.56 0.12Uniform Delay, d1 24.6 21.8 14.7 10.9Progression Factor 1.15 0.38 1.00 1.00Incremental Delay, d2 1.1 0.4 1.2 0.3Delay (s) 29.5 8.7 15.8 11.2Level of Service C A B BApproach Delay (s) 29.5 8.7 15.4 0.0Approach LOS C A B A
Intersection SummaryHCM Average Control Delay 18.7 HCM Level of Service BHCM Volume to Capacity ratio 0.59Actuated Cycle Length (s) 100.0 Sum of lost time (s) 6.0Intersection Capacity Utilization 55.6% ICU Level of Service BAnalysis Period (min) 15c Critical Lane Group

HCM Signalized Intersection Capacity Analysis839: PENNSYLVANIA AVE #1 & 11TH ST 3/2/2012
Pennsylvania Ave 5:00 pm 10/25/2009 PM Peak Hour - Before Installation of Bicycle Facilities Synchro 7 - ReportSWA Page 6
Movement EBL EBT WBT WBR SBL SBRLane ConfigurationsVolume (vph) 36 1150 730 119 314 108Ideal Flow (vphpl) 1900 1900 1900 1900 1900 1900Total Lost time (s) 3.0 3.0 3.0 3.0Lane Util. Factor 1.00 0.91 0.86 0.97Frt 1.00 1.00 0.98 0.96Flt Protected 0.95 1.00 1.00 0.96Satd. Flow (prot) 1770 5085 6273 3350Flt Permitted 0.19 1.00 1.00 0.96Satd. Flow (perm) 360 5085 6273 3350Peak-hour factor, PHF 0.90 0.90 0.90 0.90 0.90 0.90Adj. Flow (vph) 40 1278 811 132 349 120RTOR Reduction (vph) 0 0 29 0 36 0Lane Group Flow (vph) 40 1278 914 0 433 0Turn Type pm+ptProtected Phases 5 2 6 8Permitted Phases 2Actuated Green, G (s) 54.0 54.0 33.0 31.0Effective Green, g (s) 55.0 60.0 39.0 34.0Actuated g/C Ratio 0.55 0.60 0.39 0.34Clearance Time (s) 4.0 9.0 9.0 6.0Lane Grp Cap (vph) 452 3051 2446 1139v/s Ratio Prot 0.02 c0.25 0.15 c0.13v/s Ratio Perm 0.03v/c Ratio 0.09 0.42 0.37 0.38Uniform Delay, d1 11.0 10.7 21.8 25.0Progression Factor 0.49 0.41 0.36 1.00Incremental Delay, d2 0.3 0.4 0.4 1.0Delay (s) 5.8 4.7 8.3 26.0Level of Service A A A CApproach Delay (s) 4.8 8.3 26.0Approach LOS A A C
Intersection SummaryHCM Average Control Delay 9.6 HCM Level of Service AHCM Volume to Capacity ratio 0.40Actuated Cycle Length (s) 100.0 Sum of lost time (s) 6.0Intersection Capacity Utilization 41.2% ICU Level of Service AAnalysis Period (min) 15c Critical Lane Group

HCM Signalized Intersection Capacity Analysis995: PENNSYLVANIA AVE #1 & 10TH ST 3/2/2012
Pennsylvania Ave 5:00 pm 10/25/2009 PM Peak Hour - Before Installation of Bicycle Facilities Synchro 7 - ReportSWA Page 13
Movement EBL EBT EBR WBL WBT WBR NBL NBT NBR SBL SBT SBRLane ConfigurationsVolume (vph) 0 1391 16 18 802 0 81 0 74 48 8 30Ideal Flow (vphpl) 1900 1900 1900 1900 1900 1900 1900 1900 1900 1900 1900 1900Total Lost time (s) 3.0 3.0 3.0 3.0 3.0Lane Util. Factor 0.91 0.91 1.00 1.00 0.95Frt 1.00 1.00 1.00 0.85 0.95Flt Protected 1.00 1.00 0.95 1.00 0.97Satd. Flow (prot) 5077 5080 1770 1583 3264Flt Permitted 1.00 0.87 0.69 1.00 0.97Satd. Flow (perm) 5077 4442 1290 1583 3264Peak-hour factor, PHF 0.90 0.90 0.90 0.90 0.90 0.90 0.90 0.90 0.90 0.90 0.90 0.90Adj. Flow (vph) 0 1546 18 20 891 0 90 0 82 53 9 33RTOR Reduction (vph) 0 1 0 0 0 0 0 0 15 0 20 0Lane Group Flow (vph) 0 1563 0 0 911 0 90 0 67 0 75 0Turn Type Perm custom custom PermProtected Phases 2 6 8Permitted Phases 6 4 4 8Actuated Green, G (s) 51.0 51.0 34.0 34.0 34.0Effective Green, g (s) 55.0 55.0 39.0 39.0 39.0Actuated g/C Ratio 0.55 0.55 0.39 0.39 0.39Clearance Time (s) 7.0 7.0 8.0 8.0 8.0Lane Grp Cap (vph) 2792 2443 503 617 1273v/s Ratio Prot c0.31v/s Ratio Perm 0.21 c0.07 0.04 0.02v/c Ratio 0.56 0.37 0.18 0.11 0.06Uniform Delay, d1 14.6 12.7 20.0 19.4 19.0Progression Factor 0.56 0.19 1.00 1.00 1.00Incremental Delay, d2 0.8 0.4 0.8 0.4 0.1Delay (s) 9.0 2.9 20.8 19.8 19.1Level of Service A A C B BApproach Delay (s) 9.0 2.9 20.3 19.1Approach LOS A A C B
Intersection SummaryHCM Average Control Delay 8.0 HCM Level of Service AHCM Volume to Capacity ratio 0.40Actuated Cycle Length (s) 100.0 Sum of lost time (s) 6.0Intersection Capacity Utilization 53.9% ICU Level of Service AAnalysis Period (min) 15c Critical Lane Group

HCM Signalized Intersection Capacity Analysis994: PENNSYLVANIA AVE #2 & 9TH ST 3/2/2012
Pennsylvania Ave 5:00 pm 10/25/2009 PM Peak Hour - Before Installation of Bicycle Facilities Synchro 7 - ReportSWA Page 12
Movement EBL EBT EBR WBL WBT WBR NBL NBT NBR SBL SBT SBRLane ConfigurationsVolume (vph) 0 1069 374 23 821 0 0 0 44 291 1345 63Ideal Flow (vphpl) 1900 1900 1900 1900 1900 1900 1900 1900 1900 1900 1900 1900Total Lost time (s) 3.0 3.0 3.0 3.0 3.0Lane Util. Factor 0.86 0.86 0.86 1.00 0.91Frpb, ped/bikes 0.98 0.65 1.00 0.62 0.99Flpb, ped/bikes 1.00 1.00 1.00 1.00 0.94Frt 0.99 0.85 1.00 0.86 0.99Flt Protected 1.00 1.00 1.00 1.00 0.99Satd. Flow (prot) 4663 892 6360 996 4600Flt Permitted 1.00 1.00 0.87 1.00 0.99Satd. Flow (perm) 4663 892 5555 996 4600Peak-hour factor, PHF 0.96 0.96 0.96 0.96 0.96 0.96 0.96 0.96 0.96 0.96 0.96 0.96Adj. Flow (vph) 0 1114 390 24 855 0 0 0 46 303 1401 66RTOR Reduction (vph) 0 0 0 0 0 0 0 0 2 0 0 0Lane Group Flow (vph) 0 1169 335 0 879 0 0 0 44 0 1770 0Confl. Peds. (#/hr) 752 333 333 752 263 389 389 263Bus Blockages (#/hr) 0 5 0 0 5 0 0 5 0 0 5 0Turn Type Perm Perm custom PermProtected Phases 4 8 6Permitted Phases 4 8 2 6Actuated Green, G (s) 42.0 42.0 42.0 44.0 44.0Effective Green, g (s) 46.0 46.0 46.0 48.0 48.0Actuated g/C Ratio 0.46 0.46 0.46 0.48 0.48Clearance Time (s) 7.0 7.0 7.0 7.0 7.0Lane Grp Cap (vph) 2145 410 2555 478 2208v/s Ratio Prot 0.25v/s Ratio Perm c0.38 0.16 0.04 0.38v/c Ratio 0.54 0.82 0.34 0.09 0.80Uniform Delay, d1 19.5 23.4 17.3 14.1 22.0Progression Factor 1.43 1.32 0.55 1.00 0.83Incremental Delay, d2 0.9 14.4 0.4 0.4 3.1Delay (s) 28.6 45.3 9.9 14.5 21.4Level of Service C D A B CApproach Delay (s) 32.3 9.9 14.5 21.4Approach LOS C A B C
Intersection SummaryHCM Average Control Delay 22.8 HCM Level of Service CHCM Volume to Capacity ratio 0.81Actuated Cycle Length (s) 100.0 Sum of lost time (s) 6.0Intersection Capacity Utilization 84.6% ICU Level of Service EAnalysis Period (min) 15c Critical Lane Group

HCM Signalized Intersection Capacity Analysis993: PENNSYLVANIA AVE #2 & 7TH ST 3/2/2012
Pennsylvania Ave 5:00 pm 10/25/2009 PM Peak Hour - Before Installation of Bicycle Facilities Synchro 7 - ReportSWA Page 11
Movement EBL EBT EBR WBL WBT WBR NBL NBT NBR SBL SBT SBRLane ConfigurationsVolume (vph) 166 1027 178 1 691 98 100 348 36 6 523 45Ideal Flow (vphpl) 1900 1900 1900 1900 1900 1900 1900 1900 1900 1900 1900 1900Total Lost time (s) 3.0 3.0 3.0 3.0 3.0 3.0Lane Util. Factor 1.00 0.86 0.86 1.00 0.95 0.95Frpb, ped/bikes 1.00 0.95 0.94 1.00 0.96 0.97Flpb, ped/bikes 0.97 1.00 1.00 0.91 1.00 1.00Frt 1.00 0.98 0.98 1.00 0.99 0.99Flt Protected 0.95 1.00 1.00 0.95 1.00 1.00Satd. Flow (prot) 1725 5943 5909 1602 3327 3368Flt Permitted 0.26 1.00 0.93 0.29 1.00 0.95Satd. Flow (perm) 481 5943 5503 494 3327 3203Peak-hour factor, PHF 0.97 0.97 0.97 0.97 0.97 0.97 0.97 0.97 0.97 0.97 0.97 0.97Adj. Flow (vph) 171 1059 184 1 712 101 103 359 37 6 539 46RTOR Reduction (vph) 0 7 0 0 25 0 0 8 0 0 6 0Lane Group Flow (vph) 171 1236 0 0 789 0 103 388 0 0 585 0Confl. Peds. (#/hr) 613 405 405 613 215 433 433 215Bus Blockages (#/hr) 0 5 0 0 5 0 0 5 0 0 5 0Turn Type pm+pt Perm Perm PermProtected Phases 5 2 6 4 8Permitted Phases 2 6 4 8Actuated Green, G (s) 56.0 56.0 44.0 30.0 30.0 30.0Effective Green, g (s) 57.0 60.0 48.0 34.0 34.0 34.0Actuated g/C Ratio 0.57 0.60 0.48 0.34 0.34 0.34Clearance Time (s) 4.0 7.0 7.0 7.0 7.0 7.0Lane Grp Cap (vph) 386 3566 2641 168 1131 1089v/s Ratio Prot c0.04 0.21 0.12v/s Ratio Perm c0.21 0.14 c0.21 0.18v/c Ratio 0.44 0.35 0.30 0.61 0.34 0.54Uniform Delay, d1 10.7 10.1 15.8 27.5 24.7 26.6Progression Factor 1.96 1.64 0.43 1.14 0.94 1.00Incremental Delay, d2 3.0 0.2 0.3 14.7 0.8 1.9Delay (s) 23.9 16.8 7.1 46.0 24.0 28.5Level of Service C B A D C CApproach Delay (s) 17.7 7.1 28.5 28.5Approach LOS B A C C
Intersection SummaryHCM Average Control Delay 18.6 HCM Level of Service BHCM Volume to Capacity ratio 0.49Actuated Cycle Length (s) 100.0 Sum of lost time (s) 6.0Intersection Capacity Utilization 88.4% ICU Level of Service EAnalysis Period (min) 15c Critical Lane Group

HCM Signalized Intersection Capacity Analysis997: PENNSYLVANIA AVE #2 & 6TH ST 3/2/2012
Pennsylvania Ave 5:00 pm 10/25/2009 PM Peak Hour - Before Installation of Bicycle Facilities Synchro 7 - ReportSWA Page 15
Movement EBL EBT EBR WBL WBT WBR NBL NBT NBR SBL SBT SBRLane ConfigurationsVolume (vph) 62 1100 7 4 491 39 34 259 3 188 570 140Ideal Flow (vphpl) 1900 1900 1900 1900 1900 1900 1900 1900 1900 1900 1900 1900Total Lost time (s) 3.0 3.0 3.0 3.0 3.0Lane Util. Factor 1.00 0.86 0.86 0.95 0.95Frpb, ped/bikes 1.00 1.00 1.00 1.00 0.98Flpb, ped/bikes 1.00 1.00 1.00 1.00 0.99Frt 1.00 1.00 0.99 1.00 0.98Flt Protected 0.95 1.00 1.00 0.99 0.99Satd. Flow (prot) 1770 6362 6273 3475 3270Flt Permitted 0.95 1.00 0.92 0.72 0.75Satd. Flow (perm) 1770 6362 5784 2514 2477Peak-hour factor, PHF 0.90 0.90 0.90 0.90 0.90 0.90 0.90 0.90 0.90 0.90 0.90 0.90Adj. Flow (vph) 69 1222 8 4 546 43 38 288 3 209 633 156RTOR Reduction (vph) 0 1 0 0 12 0 0 1 0 0 15 0Lane Group Flow (vph) 69 1229 0 0 581 0 0 328 0 0 983 0Confl. Peds. (#/hr) 38 121 121 38 85 72 72 85Bus Blockages (#/hr) 0 5 0 0 5 0 0 5 0 0 5 0Turn Type Prot Perm Perm PermProtected Phases 5 2 6 4 8Permitted Phases 6 4 8Actuated Green, G (s) 19.0 50.0 27.0 37.0 37.0Effective Green, g (s) 20.0 53.0 30.0 41.0 41.0Actuated g/C Ratio 0.20 0.53 0.30 0.41 0.41Clearance Time (s) 4.0 6.0 6.0 7.0 7.0Lane Grp Cap (vph) 354 3372 1735 1031 1016v/s Ratio Prot 0.04 c0.19v/s Ratio Perm 0.10 0.13 c0.40v/c Ratio 0.19 0.36 0.33 0.32 0.97Uniform Delay, d1 33.3 13.7 27.2 20.0 28.8Progression Factor 1.17 0.73 0.20 1.72 1.00Incremental Delay, d2 1.2 0.3 0.5 0.8 21.3Delay (s) 40.1 10.3 6.0 35.2 50.2Level of Service D B A D DApproach Delay (s) 11.9 6.0 35.2 50.2Approach LOS B A D D
Intersection SummaryHCM Average Control Delay 25.1 HCM Level of Service CHCM Volume to Capacity ratio 0.63Actuated Cycle Length (s) 100.0 Sum of lost time (s) 6.0Intersection Capacity Utilization 91.5% ICU Level of Service FAnalysis Period (min) 15c Critical Lane Group

HCM Signalized Intersection Capacity Analysis415: PENNSYLVANIA AVE & 15TH ST 3/2/2012
Pennsylvania Ave 9/6/2011 AM Peak Hour - After Installation of Bicycle Facilities Synchro 7 - ReportPage 3
Movement EBL EBT EBR WBL WBT WBR NBL NBT NBR SBL SBT SBRLane ConfigurationsVolume (vph) 0 0 0 175 0 161 0 734 236 172 349 12Ideal Flow (vphpl) 1900 1900 1900 1900 1900 1900 1900 1900 1900 1900 1900 1900Total Lost time (s) 3.0 3.0 3.0 3.0 3.0 3.0Lane Util. Factor 0.97 1.00 0.95 1.00 0.95 1.00Frpb, ped/bikes 1.00 1.00 0.92 1.00 1.00 1.00Flpb, ped/bikes 1.00 1.00 1.00 1.00 1.00 1.00Frt 1.00 0.85 0.96 1.00 1.00 0.85Flt Protected 0.95 1.00 1.00 0.95 1.00 1.00Satd. Flow (prot) 3433 1583 3147 1770 3539 1583Flt Permitted 0.95 1.00 1.00 0.10 1.00 1.00Satd. Flow (perm) 3433 1583 3147 191 3539 1583Peak-hour factor, PHF 0.90 0.90 0.90 0.90 0.90 0.90 0.90 0.90 0.90 0.90 0.90 0.90Adj. Flow (vph) 0 0 0 194 0 179 0 816 262 191 388 13RTOR Reduction (vph) 0 0 0 0 0 129 0 31 0 0 0 5Lane Group Flow (vph) 0 0 0 194 0 50 0 1047 0 191 388 8Confl. Peds. (#/hr) 107 107Turn Type Perm custom custom pm+pt PermProtected Phases 2 6 3 6 4 3 8Permitted Phases 2 6 8 8 8Actuated Green, G (s) 9.0 31.0 35.0 56.0 56.0 56.0Effective Green, g (s) 11.0 28.0 38.0 57.0 59.0 59.0Actuated g/C Ratio 0.11 0.28 0.38 0.57 0.59 0.59Clearance Time (s) 5.0 6.0 4.0 6.0 6.0Lane Grp Cap (vph) 378 443 1196 393 2088 934v/s Ratio Prot c0.06 0.03 c0.33 c0.09 0.11v/s Ratio Perm 0.19 0.00v/c Ratio 0.51 0.11 0.88 0.49 0.19 0.01Uniform Delay, d1 42.0 26.8 28.8 15.9 9.4 8.4Progression Factor 0.50 1.77 1.00 1.00 1.00 1.00Incremental Delay, d2 4.8 0.5 9.1 4.3 0.2 0.0Delay (s) 25.8 48.0 37.9 20.2 9.6 8.5Level of Service C D D C A AApproach Delay (s) 0.0 36.4 37.9 13.0Approach LOS A D D B
Intersection SummaryHCM Average Control Delay 30.4 HCM Level of Service CHCM Volume to Capacity ratio 0.71Actuated Cycle Length (s) 100.0 Sum of lost time (s) 33.0Intersection Capacity Utilization 53.9% ICU Level of Service AAnalysis Period (min) 15c Critical Lane Group

HCM Signalized Intersection Capacity Analysis67: PENNSYLVANIA AVE #1 & 14TH ST 3/2/2012
Pennsylvania Ave 9/6/2011 AM Peak Hour - After Installation of Bicycle Facilities Synchro 7 - ReportPage 2
Movement EBL EBT EBR WBL WBT WBR NBL NBT NBR SBL SBT SBRLane ConfigurationsVolume (vph) 0 334 60 0 284 84 56 1621 208 0 843 15Ideal Flow (vphpl) 1900 1900 1900 1900 1900 1900 1900 1900 1900 1900 1900 1900Total Lost time (s) 3.0 3.0 3.0 3.0 3.0Lane Util. Factor 0.95 0.91 1.00 0.91 0.91Frpb, ped/bikes 0.98 0.98 1.00 0.99 1.00Flpb, ped/bikes 1.00 1.00 0.97 1.00 1.00Frt 0.98 0.97 1.00 0.98 1.00Flt Protected 1.00 1.00 0.95 1.00 1.00Satd. Flow (prot) 3045 4338 1542 4453 4554Flt Permitted 1.00 1.00 0.26 1.00 1.00Satd. Flow (perm) 3045 4338 416 4453 4554Peak-hour factor, PHF 0.90 0.90 0.90 0.90 0.90 0.90 0.90 0.90 0.90 0.90 0.90 0.90Adj. Flow (vph) 0 371 67 0 316 93 62 1801 231 0 937 17RTOR Reduction (vph) 0 15 0 0 5 0 0 0 0 0 2 0Lane Group Flow (vph) 0 423 0 0 404 0 62 2032 0 0 952 0Confl. Peds. (#/hr) 69 127 127 69 247 155 155 247Turn Type PermProtected Phases 2 6 4 8Permitted Phases 4Actuated Green, G (s) 31.0 31.0 57.0 57.0 57.0Effective Green, g (s) 34.0 34.0 60.0 60.0 60.0Actuated g/C Ratio 0.34 0.34 0.60 0.60 0.60Clearance Time (s) 6.0 6.0 6.0 6.0 6.0Lane Grp Cap (vph) 1035 1475 250 2672 2732v/s Ratio Prot c0.14 0.09 c0.46 0.21v/s Ratio Perm 0.15v/c Ratio 0.41 0.27 0.25 0.76 0.35Uniform Delay, d1 25.3 24.0 9.4 14.7 10.1Progression Factor 0.93 1.18 1.00 1.00 1.00Incremental Delay, d2 0.8 0.5 2.4 2.1 0.4Delay (s) 24.3 28.8 11.8 16.8 10.5Level of Service C C B B BApproach Delay (s) 24.3 28.8 16.7 10.5Approach LOS C C B B
Intersection SummaryHCM Average Control Delay 17.3 HCM Level of Service BHCM Volume to Capacity ratio 0.63Actuated Cycle Length (s) 100.0 Sum of lost time (s) 6.0Intersection Capacity Utilization 82.5% ICU Level of Service EAnalysis Period (min) 15c Critical Lane Group

HCM Signalized Intersection Capacity Analysis855: PENNSYLVANIA AVE #1 & 13 1/2 ST 3/2/2012
Pennsylvania Ave 9/6/2011 AM Peak Hour - After Installation of Bicycle Facilities Synchro 7 - ReportPage 7
Movement EBL EBT EBR WBL WBT WBR NBL NBT NBR SBL SBT SBRLane ConfigurationsVolume (vph) 0 459 55 132 408 0 0 0 5 0 0 0Ideal Flow (vphpl) 1900 1900 1900 1900 1900 1900 1900 1900 1900 1900 1900 1900Total Lost time (s) 3.0 3.0 3.0 3.0Lane Util. Factor 0.91 1.00 0.95 1.00Frpb, ped/bikes 1.00 1.00 1.00 1.00Flpb, ped/bikes 1.00 1.00 1.00 1.00Frt 0.98 1.00 1.00 0.86Flt Protected 1.00 0.95 1.00 1.00Satd. Flow (prot) 4484 1593 3185 1450Flt Permitted 1.00 0.95 1.00 1.00Satd. Flow (perm) 4484 1593 3185 1450Peak-hour factor, PHF 0.90 0.90 0.90 0.90 0.90 0.90 0.90 0.90 0.90 0.90 0.90 0.90Adj. Flow (vph) 0 510 61 147 453 0 0 0 6 0 0 0RTOR Reduction (vph) 0 15 0 0 0 0 0 0 5 0 0 0Lane Group Flow (vph) 0 556 0 147 453 0 0 0 1 0 0 0Confl. Peds. (#/hr) 23 23 51 47Turn Type Prot OverProtected Phases 2 1 6 1Permitted PhasesActuated Green, G (s) 68.0 22.5 68.0 22.5Effective Green, g (s) 70.0 24.0 70.0 24.0Actuated g/C Ratio 0.70 0.24 0.70 0.24Clearance Time (s) 5.0 4.5 5.0 4.5Lane Grp Cap (vph) 3139 382 2230 348v/s Ratio Prot 0.12 c0.09 c0.14 0.00v/s Ratio Permv/c Ratio 0.18 0.38 0.20 0.00Uniform Delay, d1 5.1 31.8 5.2 28.9Progression Factor 0.46 0.71 0.50 1.00Incremental Delay, d2 0.1 2.8 0.2 0.0Delay (s) 2.5 25.5 2.8 28.9Level of Service A C A CApproach Delay (s) 2.5 8.4 28.9 0.0Approach LOS A A C A
Intersection SummaryHCM Average Control Delay 5.6 HCM Level of Service AHCM Volume to Capacity ratio 0.25Actuated Cycle Length (s) 100.0 Sum of lost time (s) 6.0Intersection Capacity Utilization 76.1% ICU Level of Service DAnalysis Period (min) 15c Critical Lane Group

HCM Signalized Intersection Capacity Analysis827: PENNSYLVANIA AVE #1 & 13TH ST 3/2/2012
Pennsylvania Ave 9/6/2011 AM Peak Hour - After Installation of Bicycle Facilities Synchro 7 - ReportPage 5
Movement EBL EBT WBT WBR SBL SBRLane ConfigurationsVolume (vph) 209 302 443 388 267 75Ideal Flow (vphpl) 1900 1900 1900 1900 1900 1900Total Lost time (s) 3.0 3.0 3.0 3.0 3.0 3.0Lane Util. Factor 1.00 0.95 0.95 1.00 0.97 1.00Frpb, ped/bikes 1.00 1.00 1.00 0.77 1.00 0.66Flpb, ped/bikes 1.00 1.00 1.00 1.00 1.00 1.00Frt 1.00 1.00 1.00 0.85 1.00 0.85Flt Protected 0.95 1.00 1.00 1.00 0.95 1.00Satd. Flow (prot) 1593 3185 3185 1100 3090 939Flt Permitted 0.95 1.00 1.00 1.00 0.95 1.00Satd. Flow (perm) 1593 3185 3185 1100 3090 939Peak-hour factor, PHF 0.90 0.90 0.90 0.90 0.90 0.90Adj. Flow (vph) 232 336 492 431 297 83RTOR Reduction (vph) 0 0 0 0 0 62Lane Group Flow (vph) 232 336 492 431 297 21Confl. Peds. (#/hr) 301 301 398 351Turn Type Prot Perm PermProtected Phases 5 2 6 4Permitted Phases 6 4 4Actuated Green, G (s) 21.0 41.0 41.0 41.0 22.0 22.0Effective Green, g (s) 23.0 43.0 43.0 43.0 25.0 25.0Actuated g/C Ratio 0.23 0.43 0.43 0.43 0.25 0.25Clearance Time (s) 5.0 5.0 5.0 5.0 6.0 6.0Lane Grp Cap (vph) 366 1370 1370 473 773 235v/s Ratio Prot c0.15 0.11 0.15 c0.10v/s Ratio Perm c0.39 0.02v/c Ratio 0.63 0.25 0.36 0.91 0.38 0.09Uniform Delay, d1 34.7 18.2 19.2 26.7 31.1 28.8Progression Factor 1.66 1.04 1.10 1.07 1.48 4.09Incremental Delay, d2 8.1 0.4 0.6 21.1 1.0 0.5Delay (s) 65.5 19.3 21.7 49.6 46.9 118.1Level of Service E B C D D FApproach Delay (s) 38.2 34.7 62.5Approach LOS D C E
Intersection SummaryHCM Average Control Delay 41.4 HCM Level of Service DHCM Volume to Capacity ratio 0.70Actuated Cycle Length (s) 100.0 Sum of lost time (s) 9.0Intersection Capacity Utilization 75.4% ICU Level of Service DAnalysis Period (min) 15c Critical Lane Group

HCM Signalized Intersection Capacity Analysis996: PENNSYLVANIA AVE #1 & 12TH ST 3/2/2012
Pennsylvania Ave 9/6/2011 AM Peak Hour - After Installation of Bicycle Facilities Synchro 7 - ReportPage 15
Movement EBL EBT EBR WBL WBT WBR NBL NBT NBR SBL SBT SBRLane ConfigurationsVolume (vph) 0 495 85 0 680 283 142 1523 117 0 0 0Ideal Flow (vphpl) 1900 1900 1900 1900 1900 1900 1900 1900 1900 1900 1900 1900Total Lost time (s) 3.0 3.0 3.0 3.0Lane Util. Factor 0.91 0.91 0.95 1.00Frt 0.98 0.96 1.00 0.85Flt Protected 1.00 1.00 1.00 1.00Satd. Flow (prot) 4974 4861 3524 1583Flt Permitted 1.00 1.00 1.00 1.00Satd. Flow (perm) 4974 4861 3524 1583Peak-hour factor, PHF 0.90 0.90 0.90 0.90 0.90 0.90 0.90 0.90 0.90 0.90 0.90 0.90Adj. Flow (vph) 0 550 94 0 756 314 158 1692 130 0 0 0RTOR Reduction (vph) 0 0 0 0 0 0 0 0 0 0 0 0Lane Group Flow (vph) 0 644 0 0 1070 0 0 1850 130 0 0 0Turn Type Perm PermProtected Phases 2 6 4Permitted Phases 4 4Actuated Green, G (s) 43.0 43.0 43.0 43.0Effective Green, g (s) 47.0 47.0 47.0 47.0Actuated g/C Ratio 0.47 0.47 0.47 0.47Clearance Time (s) 7.0 7.0 7.0 7.0Lane Grp Cap (vph) 2338 2285 1656 744v/s Ratio Prot 0.13 c0.22v/s Ratio Perm 0.52 0.08v/c Ratio 0.28 0.47 1.12 0.17Uniform Delay, d1 16.1 18.0 26.5 15.3Progression Factor 0.48 1.31 0.76 0.59Incremental Delay, d2 0.3 0.6 60.8 0.5Delay (s) 8.1 24.1 81.0 9.5Level of Service A C F AApproach Delay (s) 8.1 24.1 76.3 0.0Approach LOS A C E A
Intersection SummaryHCM Average Control Delay 49.3 HCM Level of Service DHCM Volume to Capacity ratio 0.79Actuated Cycle Length (s) 100.0 Sum of lost time (s) 6.0Intersection Capacity Utilization 72.4% ICU Level of Service CAnalysis Period (min) 15c Critical Lane Group

HCM Signalized Intersection Capacity Analysis839: PENNSYLVANIA AVE #1 & 11TH ST 3/2/2012
Pennsylvania Ave 9/6/2011 AM Peak Hour - After Installation of Bicycle Facilities Synchro 7 - ReportPage 6
Movement EBL EBT WBT WBR SBL SBRLane ConfigurationsVolume (vph) 168 487 885 368 185 75Ideal Flow (vphpl) 1900 1900 1900 1900 1900 1900Total Lost time (s) 3.0 3.0 3.0 3.0Lane Util. Factor 1.00 0.91 0.91 0.97Frt 1.00 1.00 0.96 0.96Flt Protected 0.95 1.00 1.00 0.97Satd. Flow (prot) 1770 5085 4861 3339Flt Permitted 0.95 1.00 1.00 0.97Satd. Flow (perm) 1770 5085 4861 3339Peak-hour factor, PHF 0.90 0.90 0.90 0.90 0.90 0.90Adj. Flow (vph) 187 541 983 409 206 83RTOR Reduction (vph) 0 0 75 0 45 0Lane Group Flow (vph) 187 541 1317 0 244 0Turn Type ProtProtected Phases 5 2 6 8Permitted PhasesActuated Green, G (s) 14.0 41.0 41.0 26.0Effective Green, g (s) 15.0 44.0 44.0 29.0Actuated g/C Ratio 0.15 0.44 0.44 0.29Clearance Time (s) 4.0 6.0 6.0 6.0Lane Grp Cap (vph) 266 2237 2139 968v/s Ratio Prot c0.11 0.11 c0.27 c0.07v/s Ratio Permv/c Ratio 0.70 0.24 0.62 0.25Uniform Delay, d1 40.4 17.5 21.5 27.2Progression Factor 0.92 0.52 0.24 1.00Incremental Delay, d2 14.2 0.3 1.3 0.6Delay (s) 51.6 9.3 6.4 27.8Level of Service D A A CApproach Delay (s) 20.2 6.4 27.8Approach LOS C A C
Intersection SummaryHCM Average Control Delay 13.1 HCM Level of Service BHCM Volume to Capacity ratio 0.49Actuated Cycle Length (s) 100.0 Sum of lost time (s) 9.0Intersection Capacity Utilization 53.8% ICU Level of Service AAnalysis Period (min) 15c Critical Lane Group

HCM Signalized Intersection Capacity Analysis995: PENNSYLVANIA AVE #1 & 10TH ST 3/2/2012
Pennsylvania Ave 9/6/2011 AM Peak Hour - After Installation of Bicycle Facilities Synchro 7 - ReportPage 14
Movement EBL EBT EBR WBL WBT WBR NBL NBT NBR SBL SBT SBRLane ConfigurationsVolume (vph) 0 601 65 0 1000 0 179 0 64 65 29 29Ideal Flow (vphpl) 1900 1900 1900 1900 1900 1900 1900 1900 1900 1900 1900 1900Total Lost time (s) 3.0 3.0 3.0 3.0 3.0Lane Util. Factor 0.91 0.91 1.00 1.00 0.95Frt 0.99 1.00 1.00 0.85 0.96Flt Protected 1.00 1.00 0.95 1.00 0.97Satd. Flow (prot) 5011 5085 1770 1583 3326Flt Permitted 1.00 1.00 0.67 1.00 0.97Satd. Flow (perm) 5011 5085 1240 1583 3326Peak-hour factor, PHF 0.90 0.90 0.90 0.90 0.90 0.90 0.90 0.90 0.90 0.90 0.90 0.90Adj. Flow (vph) 0 668 72 0 1111 0 199 0 71 72 32 32RTOR Reduction (vph) 0 13 0 0 0 0 0 0 49 0 22 0Lane Group Flow (vph) 0 727 0 0 1111 0 199 0 22 0 114 0Turn Type custom custom PermProtected Phases 2 6 8Permitted Phases 4 4 8Actuated Green, G (s) 56.0 56.0 26.0 26.0 26.0Effective Green, g (s) 60.0 60.0 31.0 31.0 31.0Actuated g/C Ratio 0.60 0.60 0.31 0.31 0.31Clearance Time (s) 7.0 7.0 8.0 8.0 8.0Lane Grp Cap (vph) 3007 3051 384 491 1031v/s Ratio Prot 0.15 c0.22v/s Ratio Perm c0.16 0.01 0.03v/c Ratio 0.24 0.36 0.52 0.04 0.11Uniform Delay, d1 9.4 10.2 28.4 24.1 24.6Progression Factor 0.81 0.07 1.00 1.00 1.00Incremental Delay, d2 0.2 0.3 4.9 0.2 0.2Delay (s) 7.8 1.1 33.3 24.3 24.9Level of Service A A C C CApproach Delay (s) 7.8 1.1 30.9 24.9Approach LOS A A C C
Intersection SummaryHCM Average Control Delay 8.3 HCM Level of Service AHCM Volume to Capacity ratio 0.40Actuated Cycle Length (s) 100.0 Sum of lost time (s) 6.0Intersection Capacity Utilization 42.6% ICU Level of Service AAnalysis Period (min) 15c Critical Lane Group

HCM Signalized Intersection Capacity Analysis994: PENNSYLVANIA AVE #2 & 9TH ST 3/2/2012
Pennsylvania Ave 9/6/2011 AM Peak Hour - After Installation of Bicycle Facilities Synchro 7 - ReportPage 13
Movement EBL EBT EBR WBL WBT WBR NBL NBT NBR SBL SBT SBRLane ConfigurationsVolume (vph) 0 584 160 0 1002 0 0 0 58 211 747 40Ideal Flow (vphpl) 1900 1900 1900 1900 1900 1900 1900 1900 1900 1900 1900 1900Total Lost time (s) 3.0 3.0 3.0 3.0 3.0Lane Util. Factor 0.91 0.91 0.91 1.00 0.91Frpb, ped/bikes 0.99 0.77 1.00 0.72 0.99Flpb, ped/bikes 1.00 1.00 1.00 1.00 0.92Frt 1.00 0.85 1.00 0.86 0.99Flt Protected 1.00 1.00 1.00 1.00 0.99Satd. Flow (prot) 3321 1103 5051 1153 4509Flt Permitted 1.00 1.00 1.00 1.00 0.99Satd. Flow (perm) 3321 1103 5051 1153 4509Peak-hour factor, PHF 0.96 0.96 0.96 0.96 0.96 0.96 0.96 0.96 0.96 0.96 0.96 0.96Adj. Flow (vph) 0 608 167 0 1044 0 0 0 60 220 778 42RTOR Reduction (vph) 0 0 0 0 0 0 0 0 32 0 4 0Lane Group Flow (vph) 0 625 150 0 1044 0 0 0 28 0 1036 0Confl. Peds. (#/hr) 752 333 333 752 263 389 389 263Bus Blockages (#/hr) 0 5 0 0 5 0 0 5 0 0 5 0Turn Type Perm custom PermProtected Phases 4 8 6Permitted Phases 4 2 6Actuated Green, G (s) 37.0 37.0 37.0 43.0 43.0Effective Green, g (s) 41.0 41.0 41.0 47.0 47.0Actuated g/C Ratio 0.41 0.41 0.41 0.47 0.47Clearance Time (s) 7.0 7.0 7.0 7.0 7.0Lane Grp Cap (vph) 1362 452 2071 542 2119v/s Ratio Prot 0.19 c0.21v/s Ratio Perm 0.14 0.02 0.23v/c Ratio 0.46 0.33 0.50 0.05 0.49Uniform Delay, d1 21.4 20.1 21.9 14.4 18.2Progression Factor 1.68 1.69 0.29 1.00 0.59Incremental Delay, d2 1.1 1.9 0.7 0.2 0.8Delay (s) 37.1 35.9 7.1 14.6 11.5Level of Service D D A B BApproach Delay (s) 36.9 7.1 14.6 11.5Approach LOS D A B B
Intersection SummaryHCM Average Control Delay 16.7 HCM Level of Service BHCM Volume to Capacity ratio 0.46Actuated Cycle Length (s) 100.0 Sum of lost time (s) 6.0Intersection Capacity Utilization 101.6% ICU Level of Service GAnalysis Period (min) 15c Critical Lane Group

HCM Signalized Intersection Capacity Analysis993: PENNSYLVANIA AVE #2 & 7TH ST 3/2/2012
Pennsylvania Ave 9/6/2011 AM Peak Hour - After Installation of Bicycle Facilities Synchro 7 - ReportPage 12
Movement EBL EBT EBR WBL WBT WBR NBL NBT NBR SBL SBT SBRLane ConfigurationsVolume (vph) 152 573 143 0 772 119 208 650 28 1 238 28Ideal Flow (vphpl) 1900 1900 1900 1900 1900 1900 1900 1900 1900 1900 1900 1900Total Lost time (s) 3.0 3.0 3.0 3.0 3.0 3.0Lane Util. Factor 1.00 0.91 0.91 1.00 0.95 0.95Frpb, ped/bikes 1.00 0.93 0.95 1.00 0.99 0.97Flpb, ped/bikes 1.00 1.00 1.00 1.00 1.00 1.00Frt 1.00 0.97 0.98 1.00 0.99 0.98Flt Protected 0.95 1.00 1.00 0.95 1.00 1.00Satd. Flow (prot) 1770 4558 4682 1770 3438 3350Flt Permitted 0.95 1.00 1.00 0.95 1.00 0.95Satd. Flow (perm) 1770 4558 4682 1770 3438 3193Peak-hour factor, PHF 0.97 0.97 0.97 0.97 0.97 0.97 0.97 0.97 0.97 0.97 0.97 0.97Adj. Flow (vph) 157 591 147 0 796 123 214 670 29 1 245 29RTOR Reduction (vph) 0 43 0 0 20 0 0 3 0 0 9 0Lane Group Flow (vph) 157 695 0 0 899 0 214 696 0 0 266 0Confl. Peds. (#/hr) 613 405 405 613 215 433 433 215Bus Blockages (#/hr) 0 5 0 0 5 0 0 5 0 0 5 0Turn Type Prot Prot PermProtected Phases 5 2 6 7 4 8Permitted Phases 8Actuated Green, G (s) 11.0 28.0 28.0 12.0 40.0 22.0Effective Green, g (s) 12.0 32.0 32.0 15.0 44.0 26.0Actuated g/C Ratio 0.12 0.32 0.32 0.15 0.44 0.26Clearance Time (s) 4.0 7.0 7.0 6.0 7.0 7.0Lane Grp Cap (vph) 212 1459 1498 266 1513 830v/s Ratio Prot c0.09 0.15 c0.19 c0.12 c0.20v/s Ratio Perm 0.08v/c Ratio 0.74 0.48 0.60 0.80 0.46 0.32Uniform Delay, d1 42.5 27.3 28.6 41.1 19.7 29.9Progression Factor 1.00 1.31 0.19 0.74 0.71 1.17Incremental Delay, d2 19.1 1.0 1.5 21.9 1.0 1.0Delay (s) 61.5 36.8 7.1 52.4 14.9 36.0Level of Service E D A D B DApproach Delay (s) 41.1 7.1 23.7 36.0Approach LOS D A C D
Intersection SummaryHCM Average Control Delay 24.9 HCM Level of Service CHCM Volume to Capacity ratio 0.59Actuated Cycle Length (s) 100.0 Sum of lost time (s) 12.0Intersection Capacity Utilization 96.8% ICU Level of Service FAnalysis Period (min) 15c Critical Lane Group

HCM Signalized Intersection Capacity Analysis997: PENNSYLVANIA AVE #2 & 6TH ST 3/2/2012
Pennsylvania Ave 9/6/2011 AM Peak Hour - After Installation of Bicycle Facilities Synchro 7 - ReportPage 16
Movement EBL EBT EBR WBL WBT WBR NBL NBT NBR SBL SBT SBRLane ConfigurationsVolume (vph) 68 508 11 0 760 263 37 438 0 84 194 92Ideal Flow (vphpl) 1900 1900 1900 1900 1900 1900 1900 1900 1900 1900 1900 1900Total Lost time (s) 3.0 3.0 3.0 3.0 3.0Lane Util. Factor 1.00 0.91 0.91 0.95 0.95Frpb, ped/bikes 1.00 1.00 0.99 1.00 0.98Flpb, ped/bikes 1.00 1.00 1.00 1.00 0.99Frt 1.00 1.00 0.96 1.00 0.96Flt Protected 0.95 1.00 1.00 1.00 0.99Satd. Flow (prot) 1770 5021 4790 3481 3252Flt Permitted 0.95 1.00 1.00 0.89 0.67Satd. Flow (perm) 1770 5021 4790 3105 2196Peak-hour factor, PHF 0.90 0.90 0.90 0.90 0.90 0.90 0.90 0.90 0.90 0.90 0.90 0.90Adj. Flow (vph) 76 564 12 0 844 292 41 487 0 93 216 102RTOR Reduction (vph) 0 2 0 0 62 0 0 0 0 0 32 0Lane Group Flow (vph) 76 574 0 0 1074 0 0 528 0 0 379 0Confl. Peds. (#/hr) 38 121 121 38 85 72 72 85Bus Blockages (#/hr) 0 5 0 0 5 0 0 5 0 0 5 0Turn Type Prot Perm PermProtected Phases 5 2 6 4 8Permitted Phases 4 8Actuated Green, G (s) 17.0 37.0 37.0 29.0 29.0Effective Green, g (s) 18.0 40.0 40.0 33.0 33.0Actuated g/C Ratio 0.18 0.40 0.40 0.33 0.33Clearance Time (s) 4.0 6.0 6.0 7.0 7.0Lane Grp Cap (vph) 319 2008 1916 1025 725v/s Ratio Prot c0.04 0.11 c0.22v/s Ratio Perm 0.17 c0.17v/c Ratio 0.24 0.29 0.56 0.52 0.52Uniform Delay, d1 35.1 20.3 23.2 27.0 27.1Progression Factor 0.44 0.99 0.57 0.55 1.00Incremental Delay, d2 1.6 0.3 1.1 1.8 2.7Delay (s) 17.1 20.5 14.4 16.6 29.8Level of Service B C B B CApproach Delay (s) 20.1 14.4 16.6 29.8Approach LOS C B B C
Intersection SummaryHCM Average Control Delay 18.5 HCM Level of Service BHCM Volume to Capacity ratio 0.48Actuated Cycle Length (s) 100.0 Sum of lost time (s) 9.0Intersection Capacity Utilization 101.3% ICU Level of Service GAnalysis Period (min) 15c Critical Lane Group

HCM Signalized Intersection Capacity Analysis415: PENNSYLVANIA AVE & 15TH ST 3/2/2012
Pennsylvania Ave 5:00 pm 10/25/2009 PM Peak Hour - After Installation of Bicycle Facilities Synchro 7 - ReportSWA Page 3
Movement EBL EBT EBR WBL WBT WBR NBL NBT NBR SBL SBT SBRLane ConfigurationsVolume (vph) 0 6 3 375 0 139 0 369 147 196 613 5Ideal Flow (vphpl) 1900 1900 1900 1900 1900 1900 1900 1900 1900 1900 1900 1900Total Lost time (s) 3.0 3.0 3.0 3.0 3.0 3.0 3.0Lane Util. Factor 1.00 0.97 1.00 0.95 1.00 0.95 1.00Frpb, ped/bikes 1.00 1.00 1.00 0.91 1.00 1.00 1.00Flpb, ped/bikes 1.00 1.00 1.00 1.00 1.00 1.00 1.00Frt 0.96 1.00 0.85 0.96 1.00 1.00 0.85Flt Protected 1.00 0.95 1.00 1.00 0.95 1.00 1.00Satd. Flow (prot) 1787 3433 1583 3083 1770 3539 1583Flt Permitted 1.00 0.95 1.00 1.00 0.26 1.00 1.00Satd. Flow (perm) 1787 3433 1583 3083 491 3539 1583Peak-hour factor, PHF 0.90 0.90 0.90 0.90 0.90 0.90 0.90 0.90 0.90 0.90 0.90 0.90Adj. Flow (vph) 0 7 3 417 0 154 0 410 163 218 681 6RTOR Reduction (vph) 0 2 0 0 0 103 0 42 0 0 0 3Lane Group Flow (vph) 0 8 0 417 0 51 0 531 0 218 681 3Confl. Peds. (#/hr) 107 107Turn Type Perm custom custom pm+pt PermProtected Phases 2 6 3 6 4 3 8Permitted Phases 2 6 8 8 8Actuated Green, G (s) 19.0 16.0 36.0 30.0 49.0 49.0 49.0Effective Green, g (s) 21.0 18.0 33.0 33.0 50.0 52.0 52.0Actuated g/C Ratio 0.21 0.18 0.33 0.33 0.50 0.52 0.52Clearance Time (s) 5.0 5.0 6.0 4.0 6.0 6.0Lane Grp Cap (vph) 375 618 522 1017 450 1840 823v/s Ratio Prot c0.00 c0.12 0.03 c0.17 c0.08 0.19v/s Ratio Perm 0.16 0.00v/c Ratio 0.02 0.67 0.10 0.52 0.48 0.37 0.00Uniform Delay, d1 31.3 38.3 23.2 27.1 15.5 14.3 11.5Progression Factor 1.00 0.48 1.37 1.00 1.00 1.00 1.00Incremental Delay, d2 0.1 5.4 0.3 1.9 3.7 0.6 0.0Delay (s) 31.4 23.7 32.1 29.0 19.2 14.8 11.6Level of Service C C C C B B BApproach Delay (s) 31.4 26.0 29.0 15.9Approach LOS C C C B
Intersection SummaryHCM Average Control Delay 22.4 HCM Level of Service CHCM Volume to Capacity ratio 0.43Actuated Cycle Length (s) 100.0 Sum of lost time (s) 12.0Intersection Capacity Utilization 54.9% ICU Level of Service AAnalysis Period (min) 15c Critical Lane Group

HCM Signalized Intersection Capacity Analysis67: PENNSYLVANIA AVE #1 & 14TH ST 3/2/2012
Pennsylvania Ave 5:00 pm 10/25/2009 PM Peak Hour - After Installation of Bicycle Facilities Synchro 7 - ReportSWA Page 2
Movement EBL EBT EBR WBL WBT WBR NBL NBT NBR SBL SBT SBRLane ConfigurationsVolume (vph) 0 250 130 0 450 68 65 904 142 11 1337 12Ideal Flow (vphpl) 1900 1900 1900 1900 1900 1900 1900 1900 1900 1900 1900 1900Total Lost time (s) 3.0 3.0 3.0 3.0 3.0Lane Util. Factor 0.95 0.91 1.00 0.91 0.91Frpb, ped/bikes 0.95 0.99 1.00 0.99 1.00Flpb, ped/bikes 1.00 1.00 0.99 1.00 1.00Frt 0.95 0.98 1.00 0.98 1.00Flt Protected 1.00 1.00 0.95 1.00 1.00Satd. Flow (prot) 2877 4438 1571 4429 4563Flt Permitted 1.00 1.00 0.12 1.00 0.93Satd. Flow (perm) 2877 4438 206 4429 4228Peak-hour factor, PHF 0.90 0.90 0.90 0.90 0.90 0.90 0.90 0.90 0.90 0.90 0.90 0.90Adj. Flow (vph) 0 278 144 0 500 76 72 1004 158 12 1486 13RTOR Reduction (vph) 0 9 0 0 20 0 0 0 0 0 1 0Lane Group Flow (vph) 0 413 0 0 556 0 72 1162 0 0 1510 0Confl. Peds. (#/hr) 69 127 127 69 247 155 155 247Turn Type Perm PermProtected Phases 2 6 4 8Permitted Phases 4 8Actuated Green, G (s) 29.0 29.0 59.0 59.0 59.0Effective Green, g (s) 32.0 32.0 62.0 62.0 62.0Actuated g/C Ratio 0.32 0.32 0.62 0.62 0.62Clearance Time (s) 6.0 6.0 6.0 6.0 6.0Lane Grp Cap (vph) 921 1420 128 2746 2621v/s Ratio Prot c0.14 0.13 0.26v/s Ratio Perm 0.35 c0.36v/c Ratio 0.45 0.39 0.56 0.42 0.58Uniform Delay, d1 27.0 26.4 11.1 9.8 11.2Progression Factor 1.06 1.15 1.00 1.00 1.00Incremental Delay, d2 1.4 0.8 16.7 0.5 0.9Delay (s) 30.1 31.2 27.8 10.3 12.2Level of Service C C C B BApproach Delay (s) 30.1 31.2 11.3 12.2Approach LOS C C B B
Intersection SummaryHCM Average Control Delay 16.8 HCM Level of Service BHCM Volume to Capacity ratio 0.53Actuated Cycle Length (s) 100.0 Sum of lost time (s) 6.0Intersection Capacity Utilization 90.9% ICU Level of Service EAnalysis Period (min) 15c Critical Lane Group

HCM Signalized Intersection Capacity Analysis855: PENNSYLVANIA AVE #1 & 13 1/2 ST 3/2/2012
Pennsylvania Ave 5:00 pm 10/25/2009 PM Peak Hour - After Installation of Bicycle Facilities Synchro 7 - ReportSWA Page 7
Movement EBL EBT EBR WBL WBT WBR NBL NBT NBR SBL SBT SBRLane ConfigurationsVolume (vph) 0 502 63 107 456 0 0 0 88 0 0 0Ideal Flow (vphpl) 1900 1900 1900 1900 1900 1900 1900 1900 1900 1900 1900 1900Total Lost time (s) 3.0 3.0 3.0 3.0Lane Util. Factor 0.91 1.00 0.95 1.00Frpb, ped/bikes 1.00 1.00 1.00 1.00Flpb, ped/bikes 1.00 1.00 1.00 1.00Frt 0.98 1.00 1.00 0.86Flt Protected 1.00 0.95 1.00 1.00Satd. Flow (prot) 4480 1593 3185 1450Flt Permitted 1.00 0.95 1.00 1.00Satd. Flow (perm) 4480 1593 3185 1450Peak-hour factor, PHF 0.90 0.90 0.90 0.90 0.90 0.90 0.90 0.90 0.90 0.90 0.90 0.90Adj. Flow (vph) 0 558 70 119 507 0 0 0 98 0 0 0RTOR Reduction (vph) 0 16 0 0 0 0 0 0 60 0 0 0Lane Group Flow (vph) 0 612 0 119 507 0 0 0 38 0 0 0Confl. Peds. (#/hr) 23 23 51 47Turn Type Prot OverProtected Phases 2 1 6 1Permitted PhasesActuated Green, G (s) 53.0 37.5 53.0 37.5Effective Green, g (s) 55.0 39.0 55.0 39.0Actuated g/C Ratio 0.55 0.39 0.55 0.39Clearance Time (s) 5.0 4.5 5.0 4.5Lane Grp Cap (vph) 2464 621 1752 566v/s Ratio Prot 0.14 c0.07 c0.16 0.03v/s Ratio Permv/c Ratio 0.25 0.19 0.29 0.07Uniform Delay, d1 11.7 20.1 12.0 19.1Progression Factor 0.87 0.74 1.35 1.00Incremental Delay, d2 0.2 0.6 0.4 0.2Delay (s) 10.4 15.5 16.7 19.3Level of Service B B B BApproach Delay (s) 10.4 16.4 19.3 0.0Approach LOS B B B A
Intersection SummaryHCM Average Control Delay 13.8 HCM Level of Service BHCM Volume to Capacity ratio 0.25Actuated Cycle Length (s) 100.0 Sum of lost time (s) 6.0Intersection Capacity Utilization 77.3% ICU Level of Service DAnalysis Period (min) 15c Critical Lane Group

HCM Signalized Intersection Capacity Analysis827: PENNSYLVANIA AVE #1 & 13TH ST 3/2/2012
Pennsylvania Ave 5:00 pm 10/25/2009 PM Peak Hour - After Installation of Bicycle Facilities Synchro 7 - ReportSWA Page 5
Movement EBL EBT WBT WBR SBL SBRLane ConfigurationsVolume (vph) 123 376 470 205 366 168Ideal Flow (vphpl) 1900 1900 1900 1900 1900 1900Total Lost time (s) 3.0 3.0 3.0 3.0 3.0 3.0Lane Util. Factor 1.00 0.95 0.95 1.00 0.97 1.00Frpb, ped/bikes 1.00 1.00 1.00 0.67 1.00 0.65Flpb, ped/bikes 1.00 1.00 1.00 1.00 1.00 1.00Frt 1.00 1.00 1.00 0.85 1.00 0.85Flt Protected 0.95 1.00 1.00 1.00 0.95 1.00Satd. Flow (prot) 1593 3185 3185 949 3090 933Flt Permitted 0.95 1.00 1.00 1.00 0.95 1.00Satd. Flow (perm) 1593 3185 3185 949 3090 933Peak-hour factor, PHF 0.90 0.90 0.90 0.90 0.90 0.90Adj. Flow (vph) 137 418 522 228 407 187RTOR Reduction (vph) 0 0 0 0 0 140Lane Group Flow (vph) 137 418 522 228 407 47Confl. Peds. (#/hr) 301 301 398 351Turn Type Prot Perm PermProtected Phases 5 2 6 4Permitted Phases 6 4 4Actuated Green, G (s) 21.0 41.0 41.0 41.0 22.0 22.0Effective Green, g (s) 23.0 43.0 43.0 43.0 25.0 25.0Actuated g/C Ratio 0.23 0.43 0.43 0.43 0.25 0.25Clearance Time (s) 5.0 5.0 5.0 5.0 6.0 6.0Lane Grp Cap (vph) 366 1370 1370 408 773 233v/s Ratio Prot c0.09 0.13 0.16 c0.13v/s Ratio Perm c0.24 0.05v/c Ratio 0.37 0.31 0.38 0.56 0.53 0.20Uniform Delay, d1 32.4 18.7 19.4 21.4 32.4 29.6Progression Factor 1.44 0.56 0.28 0.28 1.00 1.00Incremental Delay, d2 2.9 0.6 0.8 5.2 2.6 1.9Delay (s) 49.7 11.1 6.1 11.2 34.9 31.5Level of Service D B A B C CApproach Delay (s) 20.6 7.7 33.9Approach LOS C A C
Intersection SummaryHCM Average Control Delay 19.7 HCM Level of Service BHCM Volume to Capacity ratio 0.50Actuated Cycle Length (s) 100.0 Sum of lost time (s) 9.0Intersection Capacity Utilization 74.2% ICU Level of Service DAnalysis Period (min) 15c Critical Lane Group

HCM Signalized Intersection Capacity Analysis996: PENNSYLVANIA AVE #1 & 12TH ST 3/2/2012
Pennsylvania Ave 5:00 pm 10/25/2009 PM Peak Hour - After Installation of Bicycle Facilities Synchro 7 - ReportSWA Page 14
Movement EBL EBT EBR WBL WBT WBR NBL NBT NBR SBL SBT SBRLane ConfigurationsVolume (vph) 0 638 114 0 601 192 51 783 83 0 0 0Ideal Flow (vphpl) 1900 1900 1900 1900 1900 1900 1900 1900 1900 1900 1900 1900Total Lost time (s) 3.0 3.0 3.0 3.0Lane Util. Factor 0.91 0.91 0.95 1.00Frt 0.98 0.96 1.00 0.85Flt Protected 1.00 1.00 1.00 1.00Satd. Flow (prot) 4969 4901 3528 1583Flt Permitted 1.00 1.00 1.00 1.00Satd. Flow (perm) 4969 4901 3528 1583Peak-hour factor, PHF 0.90 0.90 0.90 0.90 0.90 0.90 0.90 0.90 0.90 0.90 0.90 0.90Adj. Flow (vph) 0 709 127 0 668 213 57 870 92 0 0 0RTOR Reduction (vph) 0 0 0 0 0 0 0 0 0 0 0 0Lane Group Flow (vph) 0 836 0 0 881 0 0 927 92 0 0 0Turn Type Perm PermProtected Phases 2 6 4Permitted Phases 4 4Actuated Green, G (s) 48.0 48.0 38.0 38.0Effective Green, g (s) 52.0 52.0 42.0 42.0Actuated g/C Ratio 0.52 0.52 0.42 0.42Clearance Time (s) 7.0 7.0 7.0 7.0Lane Grp Cap (vph) 2584 2549 1482 665v/s Ratio Prot 0.17 c0.18v/s Ratio Perm 0.26 0.06v/c Ratio 0.32 0.35 0.63 0.14Uniform Delay, d1 13.9 14.0 22.8 17.9Progression Factor 0.19 0.46 1.00 1.00Incremental Delay, d2 0.3 0.3 2.0 0.4Delay (s) 2.9 6.8 24.8 18.3Level of Service A A C BApproach Delay (s) 2.9 6.8 24.2 0.0Approach LOS A A C A
Intersection SummaryHCM Average Control Delay 12.1 HCM Level of Service BHCM Volume to Capacity ratio 0.47Actuated Cycle Length (s) 100.0 Sum of lost time (s) 6.0Intersection Capacity Utilization 45.7% ICU Level of Service AAnalysis Period (min) 15c Critical Lane Group

HCM Signalized Intersection Capacity Analysis839: PENNSYLVANIA AVE #1 & 11TH ST 3/2/2012
Pennsylvania Ave 5:00 pm 10/25/2009 PM Peak Hour - After Installation of Bicycle Facilities Synchro 7 - ReportSWA Page 6
Movement EBL EBT WBT WBR SBL SBRLane ConfigurationsVolume (vph) 68 657 620 171 496 185Ideal Flow (vphpl) 1900 1900 1900 1900 1900 1900Total Lost time (s) 3.0 3.0 3.0 3.0Lane Util. Factor 1.00 0.91 0.91 0.97Frt 1.00 1.00 0.97 0.96Flt Protected 0.95 1.00 1.00 0.96Satd. Flow (prot) 1770 5085 4920 3344Flt Permitted 0.95 1.00 1.00 0.96Satd. Flow (perm) 1770 5085 4920 3344Peak-hour factor, PHF 0.90 0.90 0.90 0.90 0.90 0.90Adj. Flow (vph) 76 730 689 190 551 206RTOR Reduction (vph) 0 0 50 0 40 0Lane Group Flow (vph) 76 730 829 0 717 0Turn Type ProtProtected Phases 5 2 6 8Permitted PhasesActuated Green, G (s) 12.0 44.0 44.0 25.0Effective Green, g (s) 13.0 47.0 47.0 28.0Actuated g/C Ratio 0.13 0.47 0.47 0.28Clearance Time (s) 4.0 6.0 6.0 6.0Lane Grp Cap (vph) 230 2390 2312 936v/s Ratio Prot c0.04 0.14 c0.17 c0.21v/s Ratio Permv/c Ratio 0.33 0.31 0.36 0.77Uniform Delay, d1 39.5 16.4 16.9 33.0Progression Factor 1.54 0.32 0.34 1.00Incremental Delay, d2 3.7 0.3 0.4 5.9Delay (s) 64.7 5.5 6.2 38.9Level of Service E A A DApproach Delay (s) 11.1 6.2 38.9Approach LOS B A D
Intersection SummaryHCM Average Control Delay 18.0 HCM Level of Service BHCM Volume to Capacity ratio 0.47Actuated Cycle Length (s) 100.0 Sum of lost time (s) 9.0Intersection Capacity Utilization 50.8% ICU Level of Service AAnalysis Period (min) 15c Critical Lane Group

HCM Signalized Intersection Capacity Analysis995: PENNSYLVANIA AVE #1 & 10TH ST 3/2/2012
Pennsylvania Ave 5:00 pm 10/25/2009 PM Peak Hour - After Installation of Bicycle Facilities Synchro 7 - ReportSWA Page 13
Movement EBL EBT EBR WBL WBT WBR NBL NBT NBR SBL SBT SBRLane ConfigurationsVolume (vph) 0 1073 83 0 643 0 32 0 43 269 243 123Ideal Flow (vphpl) 1900 1900 1900 1900 1900 1900 1900 1900 1900 1900 1900 1900Total Lost time (s) 3.0 3.0 3.0 3.0 3.0Lane Util. Factor 0.91 0.91 1.00 1.00 0.95Frt 0.99 1.00 1.00 0.85 0.97Flt Protected 1.00 1.00 0.95 1.00 0.98Satd. Flow (prot) 5031 5085 1770 1583 3365Flt Permitted 1.00 1.00 0.20 1.00 0.98Satd. Flow (perm) 5031 5085 370 1583 3365Peak-hour factor, PHF 0.90 0.90 0.90 0.90 0.90 0.90 0.90 0.90 0.90 0.90 0.90 0.90Adj. Flow (vph) 0 1192 92 0 714 0 36 0 48 299 270 137RTOR Reduction (vph) 0 9 0 0 0 0 0 0 33 0 21 0Lane Group Flow (vph) 0 1275 0 0 714 0 36 0 15 0 685 0Turn Type custom custom PermProtected Phases 2 6 8Permitted Phases 4 4 8Actuated Green, G (s) 56.0 56.0 26.0 26.0 26.0Effective Green, g (s) 60.0 60.0 31.0 31.0 31.0Actuated g/C Ratio 0.60 0.60 0.31 0.31 0.31Clearance Time (s) 7.0 7.0 8.0 8.0 8.0Lane Grp Cap (vph) 3019 3051 115 491 1043v/s Ratio Prot c0.25 0.14v/s Ratio Perm 0.10 0.01 0.20v/c Ratio 0.42 0.23 0.31 0.03 0.66Uniform Delay, d1 10.7 9.3 26.4 24.0 29.9Progression Factor 1.04 0.77 1.00 1.00 1.00Incremental Delay, d2 0.4 0.2 7.0 0.1 3.2Delay (s) 11.5 7.4 33.3 24.1 33.1Level of Service B A C C CApproach Delay (s) 11.5 7.4 28.1 33.1Approach LOS B A C C
Intersection SummaryHCM Average Control Delay 16.4 HCM Level of Service BHCM Volume to Capacity ratio 0.49Actuated Cycle Length (s) 100.0 Sum of lost time (s) 6.0Intersection Capacity Utilization 59.4% ICU Level of Service BAnalysis Period (min) 15c Critical Lane Group

HCM Signalized Intersection Capacity Analysis994: PENNSYLVANIA AVE #2 & 9TH ST 3/2/2012
Pennsylvania Ave 5:00 pm 10/25/2009 PM Peak Hour - After Installation of Bicycle Facilities Synchro 7 - ReportSWA Page 12
Movement EBL EBT EBR WBL WBT WBR NBL NBT NBR SBL SBT SBRLane ConfigurationsVolume (vph) 0 933 456 0 547 0 0 0 51 184 1379 84Ideal Flow (vphpl) 1900 1900 1900 1900 1900 1900 1900 1900 1900 1900 1900 1900Total Lost time (s) 3.0 3.0 3.0 3.0 3.0Lane Util. Factor 0.91 0.91 0.91 1.00 0.91Frpb, ped/bikes 0.99 0.77 1.00 0.72 0.98Flpb, ped/bikes 1.00 1.00 1.00 1.00 0.96Frt 0.99 0.85 1.00 0.86 0.99Flt Protected 1.00 1.00 1.00 1.00 0.99Satd. Flow (prot) 3296 1103 5051 1153 4691Flt Permitted 1.00 1.00 1.00 1.00 0.99Satd. Flow (perm) 3296 1103 5051 1153 4691Peak-hour factor, PHF 0.96 0.96 0.96 0.96 0.96 0.96 0.96 0.96 0.96 0.96 0.96 0.96Adj. Flow (vph) 0 972 475 0 570 0 0 0 53 192 1436 88RTOR Reduction (vph) 0 0 0 0 0 0 0 0 29 0 6 0Lane Group Flow (vph) 0 1020 427 0 570 0 0 0 24 0 1710 0Confl. Peds. (#/hr) 752 333 333 752 263 389 389 263Bus Blockages (#/hr) 0 5 0 0 5 0 0 5 0 0 5 0Turn Type Perm custom PermProtected Phases 4 8 6Permitted Phases 4 2 6Actuated Green, G (s) 39.0 39.0 39.0 41.0 41.0Effective Green, g (s) 43.0 43.0 43.0 45.0 45.0Actuated g/C Ratio 0.43 0.43 0.43 0.45 0.45Clearance Time (s) 7.0 7.0 7.0 7.0 7.0Lane Grp Cap (vph) 1417 474 2172 519 2111v/s Ratio Prot 0.31 0.11v/s Ratio Perm c0.39 0.02 0.36v/c Ratio 0.72 0.90 0.26 0.05 0.81Uniform Delay, d1 23.5 26.5 18.3 15.4 23.8Progression Factor 1.62 1.58 0.69 1.00 0.82Incremental Delay, d2 2.9 21.1 0.3 0.2 3.4Delay (s) 41.0 63.1 12.9 15.6 22.8Level of Service D E B B CApproach Delay (s) 47.5 12.9 15.6 22.8Approach LOS D B B C
Intersection SummaryHCM Average Control Delay 30.7 HCM Level of Service CHCM Volume to Capacity ratio 0.80Actuated Cycle Length (s) 100.0 Sum of lost time (s) 6.0Intersection Capacity Utilization 114.3% ICU Level of Service HAnalysis Period (min) 15c Critical Lane Group

HCM Signalized Intersection Capacity Analysis993: PENNSYLVANIA AVE #2 & 7TH ST 3/2/2012
Pennsylvania Ave 5:00 pm 10/25/2009 PM Peak Hour - After Installation of Bicycle Facilities Synchro 7 - ReportSWA Page 11
Movement EBL EBT EBR WBL WBT WBR NBL NBT NBR SBL SBT SBRLane ConfigurationsVolume (vph) 114 875 176 0 442 83 64 401 29 0 458 35Ideal Flow (vphpl) 1900 1900 1900 1900 1900 1900 1900 1900 1900 1900 1900 1900Total Lost time (s) 3.0 3.0 3.0 3.0 3.0 3.0Lane Util. Factor 1.00 0.91 0.91 1.00 0.95 0.95Frpb, ped/bikes 1.00 0.94 0.94 1.00 0.98 0.98Flpb, ped/bikes 1.00 1.00 1.00 1.00 1.00 1.00Frt 1.00 0.97 0.98 1.00 0.99 0.99Flt Protected 0.95 1.00 1.00 0.95 1.00 1.00Satd. Flow (prot) 1770 4636 4615 1770 3396 3402Flt Permitted 0.95 1.00 1.00 0.95 1.00 1.00Satd. Flow (perm) 1770 4636 4615 1770 3396 3402Peak-hour factor, PHF 0.97 0.97 0.97 0.97 0.97 0.97 0.97 0.97 0.97 0.97 0.97 0.97Adj. Flow (vph) 118 902 181 0 456 86 66 413 30 0 472 36RTOR Reduction (vph) 0 30 0 0 27 0 0 5 0 0 6 0Lane Group Flow (vph) 118 1053 0 0 515 0 66 438 0 0 502 0Confl. Peds. (#/hr) 613 405 405 613 215 433 433 215Bus Blockages (#/hr) 0 5 0 0 5 0 0 5 0 0 5 0Turn Type Prot Prot PermProtected Phases 5 2 6 7 4 8Permitted Phases 8Actuated Green, G (s) 8.0 35.0 35.0 8.0 36.0 22.0Effective Green, g (s) 9.0 39.0 39.0 11.0 40.0 26.0Actuated g/C Ratio 0.09 0.39 0.39 0.11 0.40 0.26Clearance Time (s) 4.0 7.0 7.0 6.0 7.0 7.0Lane Grp Cap (vph) 159 1808 1800 195 1358 885v/s Ratio Prot c0.07 c0.23 0.11 0.04 c0.13 c0.15v/s Ratio Permv/c Ratio 0.74 0.58 0.29 0.34 0.32 0.57Uniform Delay, d1 44.4 24.1 20.9 41.1 20.7 32.1Progression Factor 1.33 0.33 0.99 0.61 0.22 1.00Incremental Delay, d2 19.4 1.0 0.4 4.4 0.6 2.6Delay (s) 78.3 8.9 21.2 29.3 5.1 34.7Level of Service E A C C A CApproach Delay (s) 15.8 21.2 8.2 34.7Approach LOS B C A C
Intersection SummaryHCM Average Control Delay 18.9 HCM Level of Service BHCM Volume to Capacity ratio 0.53Actuated Cycle Length (s) 100.0 Sum of lost time (s) 9.0Intersection Capacity Utilization 88.7% ICU Level of Service EAnalysis Period (min) 15c Critical Lane Group

HCM Signalized Intersection Capacity Analysis997: PENNSYLVANIA AVE #2 & 6TH ST 3/2/2012
Pennsylvania Ave 5:00 pm 10/25/2009 PM Peak Hour - After Installation of Bicycle Facilities Synchro 7 - ReportSWA Page 15
Movement EBL EBT EBR WBL WBT WBR NBL NBT NBR SBL SBT SBRLane ConfigurationsVolume (vph) 63 852 21 0 430 132 21 291 4 238 437 92Ideal Flow (vphpl) 1900 1900 1900 1900 1900 1900 1900 1900 1900 1900 1900 1900Total Lost time (s) 3.0 3.0 3.0 3.0 3.0Lane Util. Factor 1.00 0.91 0.91 0.95 0.95Frpb, ped/bikes 1.00 1.00 0.99 1.00 0.99Flpb, ped/bikes 1.00 1.00 1.00 1.00 0.99Frt 1.00 1.00 0.96 1.00 0.98Flt Protected 0.95 1.00 1.00 1.00 0.98Satd. Flow (prot) 1770 5016 4812 3480 3321Flt Permitted 0.95 1.00 1.00 0.82 0.69Satd. Flow (perm) 1770 5016 4812 2878 2323Peak-hour factor, PHF 0.90 0.90 0.90 0.90 0.90 0.90 0.90 0.90 0.90 0.90 0.90 0.90Adj. Flow (vph) 70 947 23 0 478 147 23 323 4 264 486 102RTOR Reduction (vph) 0 2 0 0 56 0 0 1 0 0 11 0Lane Group Flow (vph) 70 968 0 0 569 0 0 349 0 0 841 0Confl. Peds. (#/hr) 38 121 121 38 85 72 72 85Bus Blockages (#/hr) 0 5 0 0 5 0 0 5 0 0 5 0Turn Type Prot Perm PermProtected Phases 5 2 6 4 8Permitted Phases 4 8Actuated Green, G (s) 12.0 39.0 39.0 32.0 32.0Effective Green, g (s) 13.0 42.0 42.0 36.0 36.0Actuated g/C Ratio 0.13 0.42 0.42 0.36 0.36Clearance Time (s) 4.0 6.0 6.0 7.0 7.0Lane Grp Cap (vph) 230 2107 2021 1036 836v/s Ratio Prot c0.04 c0.19 0.12v/s Ratio Perm 0.12 c0.36v/c Ratio 0.30 0.46 0.28 0.34 1.01Uniform Delay, d1 39.4 20.8 19.1 23.3 32.0Progression Factor 0.79 0.20 0.57 1.68 1.00Incremental Delay, d2 2.9 0.6 0.3 0.9 32.6Delay (s) 34.1 4.8 11.2 39.9 64.6Level of Service C A B D EApproach Delay (s) 6.7 11.2 39.9 64.6Approach LOS A B D E
Intersection SummaryHCM Average Control Delay 29.0 HCM Level of Service CHCM Volume to Capacity ratio 0.65Actuated Cycle Length (s) 100.0 Sum of lost time (s) 9.0Intersection Capacity Utilization 101.0% ICU Level of Service GAnalysis Period (min) 15c Critical Lane Group

Appendix B2 Pennsylvania Avenue: Bicycle Count Data

Sabra, Wang & Associates, Inc.1504 Joh Avenue Suite 160
Baltimore, MD 21227(410) 737-6564
File Name : Pennsvylvania @ 7th ST.Site Code : 00000000Start Date : 10/22/2009Page No : 1
Weather:SUNNYCounted By:SH, GSTown:WASHINGTON D.C.County:
Groups Printed- BIKES7 TH ST
From NorthPENNSYLVANIA AVE
From East7 TH ST
From SouthPENNSYLVANIA AVE
From WestStartTime
Right
Thru Left Ped
sApp.Total
Right
Thru Left Ped
sApp.Total
Right
Thru Left Ped
sApp.Total
Right
Thru Left Ped
sApp.Total
Int.Total
Factor 1.0 1.0 1.0 1.0 1.0 1.0 1.0 1.0 1.0 1.0 1.0 1.0 1.0 1.0 1.0 1.007:00 AM 0 3 0 0 3 0 3 0 0 3 0 0 0 0 0 0 0 0 0 0 607:15 AM 0 1 0 0 1 0 1 0 0 1 0 6 0 0 6 0 1 0 0 1 907:30 AM 0 0 0 0 0 0 3 0 0 3 0 2 0 0 2 0 1 0 0 1 607:45 AM 0 3 0 0 3 0 1 0 0 1 0 4 0 0 4 0 0 0 0 0 8
Total 0 7 0 0 7 0 8 0 0 8 0 12 0 0 12 0 2 0 0 2 29
08:00 AM 0 3 0 0 3 0 3 0 0 3 0 8 0 0 8 0 4 0 0 4 1808:15 AM 0 8 0 0 8 0 3 0 0 3 0 3 0 0 3 0 1 0 0 1 1508:30 AM 0 3 0 0 3 0 5 0 0 5 0 0 0 0 0 0 1 0 0 1 908:45 AM 0 5 0 0 5 0 6 0 0 6 0 0 0 0 0 0 2 0 0 2 13
Total 0 19 0 0 19 0 17 0 0 17 0 11 0 0 11 0 8 0 0 8 55
09:00 AM 0 0 0 0 0 0 0 0 0 0 0 0 0 0 0 0 0 0 0 0 009:15 AM 0 0 0 0 0 0 0 0 0 0 0 0 0 0 0 0 0 0 0 0 009:30 AM 0 0 0 0 0 0 0 0 0 0 0 0 0 0 0 0 0 0 0 0 009:45 AM 0 0 0 0 0 0 0 0 0 0 0 0 0 0 0 0 0 0 0 0 0
Total 0 0 0 0 0 0 0 0 0 0 0 0 0 0 0 0 0 0 0 0 0
10:00 AM 0 0 0 0 0 0 0 0 0 0 0 0 0 0 0 0 0 0 0 0 010:15 AM 0 0 0 0 0 0 0 0 0 0 0 0 0 0 0 0 0 0 0 0 010:30 AM 0 0 0 0 0 0 0 0 0 0 0 0 0 0 0 0 0 0 0 0 010:45 AM 0 0 0 0 0 0 0 0 0 0 0 0 0 0 0 0 0 0 0 0 0
Total 0 0 0 0 0 0 0 0 0 0 0 0 0 0 0 0 0 0 0 0 0
11:00 AM 0 0 0 0 0 0 0 0 0 0 0 0 0 0 0 0 0 0 0 0 011:15 AM 0 0 0 0 0 0 0 0 0 0 0 0 0 0 0 0 0 0 0 0 011:30 AM 0 0 0 0 0 0 0 0 0 0 0 0 0 0 0 0 0 0 0 0 011:45 AM 0 0 0 0 0 0 0 0 0 0 0 0 0 0 0 0 0 0 0 0 0
Total 0 0 0 0 0 0 0 0 0 0 0 0 0 0 0 0 0 0 0 0 0
12:00 PM 0 0 0 0 0 0 0 0 0 0 0 0 0 0 0 0 0 0 0 0 012:15 PM 0 0 0 0 0 0 0 0 0 0 0 0 0 0 0 0 0 0 0 0 012:30 PM 0 0 0 0 0 0 0 0 0 0 0 0 0 0 0 0 0 0 0 0 012:45 PM 0 0 0 0 0 0 0 0 0 0 0 0 0 0 0 0 0 0 0 0 0
Total 0 0 0 0 0 0 0 0 0 0 0 0 0 0 0 0 0 0 0 0 0
01:00 PM 0 0 0 0 0 0 0 0 0 0 0 0 0 0 0 0 0 0 0 0 001:15 PM 0 0 0 0 0 0 0 0 0 0 0 0 0 0 0 0 0 0 0 0 001:30 PM 0 0 0 0 0 0 0 0 0 0 0 0 0 0 0 0 0 0 0 0 001:45 PM 0 0 0 0 0 0 0 0 0 0 0 0 0 0 0 0 0 0 0 0 0
Total 0 0 0 0 0 0 0 0 0 0 0 0 0 0 0 0 0 0 0 0 0
02:00 PM 0 0 0 0 0 0 0 0 0 0 0 0 0 0 0 0 0 0 0 0 002:15 PM 0 0 0 0 0 0 0 0 0 0 0 0 0 0 0 0 0 0 0 0 002:30 PM 0 0 0 0 0 0 0 0 0 0 0 0 0 0 0 0 0 0 0 0 002:45 PM 0 0 0 0 0 0 0 0 0 0 0 0 0 0 0 0 0 0 0 0 0
Total 0 0 0 0 0 0 0 0 0 0 0 0 0 0 0 0 0 0 0 0 0

Sabra, Wang & Associates, Inc.1504 Joh Avenue Suite 160
Baltimore, MD 21227(410) 737-6564
File Name : Pennsvylvania @ 7th ST.Site Code : 00000000Start Date : 10/22/2009Page No : 2
Groups Printed- BIKES7 TH ST
From NorthPENNSYLVANIA AVE
From East7 TH ST
From SouthPENNSYLVANIA AVE
From WestStartTime
Right
Thru Left Ped
sApp.Total
Right
Thru Left Ped
sApp.Total
Right
Thru Left Ped
sApp.Total
Right
Thru Left Ped
sApp.Total
Int.Total
Factor 1.0 1.0 1.0 1.0 1.0 1.0 1.0 1.0 1.0 1.0 1.0 1.0 1.0 1.0 1.0 1.003:00 PM 0 0 0 0 0 0 0 0 0 0 0 0 0 0 0 0 0 0 0 0 003:15 PM 0 0 0 0 0 0 0 0 0 0 0 0 0 0 0 0 0 0 0 0 003:30 PM 0 0 0 0 0 0 0 0 0 0 0 0 0 0 0 0 0 0 0 0 003:45 PM 0 0 0 0 0 0 0 0 0 0 0 0 0 0 0 0 0 0 0 0 0
Total 0 0 0 0 0 0 0 0 0 0 0 0 0 0 0 0 0 0 0 0 0
04:00 PM 0 2 0 0 2 0 1 0 0 1 0 1 0 0 1 0 1 0 0 1 504:15 PM 0 6 0 0 6 0 3 0 0 3 0 2 0 0 2 0 0 0 0 0 1104:30 PM 0 3 0 0 3 0 5 0 0 5 0 0 1 0 1 0 1 0 0 1 1004:45 PM 0 2 0 0 2 0 1 0 0 1 0 2 0 0 2 0 0 0 0 0 5
Total 0 13 0 0 13 0 10 0 0 10 0 5 1 0 6 0 2 0 0 2 31
05:00 PM 1 4 0 0 5 0 3 0 0 3 0 0 0 0 0 0 0 0 0 0 805:15 PM 0 3 0 0 3 0 3 0 0 3 0 0 0 0 0 0 2 0 0 2 805:30 PM 0 7 0 0 7 0 5 0 0 5 0 3 0 0 3 0 0 0 0 0 1505:45 PM 0 7 0 0 7 0 3 0 0 3 0 3 0 0 3 0 2 0 0 2 15
Total 1 21 0 0 22 0 14 0 0 14 0 6 0 0 6 0 4 0 0 4 46
GrandTotal 1 60 0 0 61 0 49 0 0 49 0 34 1 0 35 0 16 0 0 16 161
Apprch % 1.6 98.4 0.0 0.0 0.0 100
.0 0.0 0.0 0.0 97.1 2.9 0.0 0.0 100
.0 0.0 0.0
Total % 0.6 37.3 0.0 0.0 37.9 0.0 30.
4 0.0 0.0 30.4 0.0 21.1 0.6 0.0 21.7 0.0 9.9 0.0 0.0 9.9

Sabra, Wang & Associates, Inc.1504 Joh Avenue, Suite 160
Baltimore, MD 21227410-737-6564
File Name : pennsylvania @ 14th St.Site Code : 00000001Start Date : 12/16/2009Page No : 1
Weather: SUNNYCounted By:AUNGLA, RYANTown: WASHINGTONCounty:
Groups Printed- BICYCLES14th STREETFrom North
PENNSYLVANIA AVENUEFrom East
14th STREETFrom South
PENNSYLVANIA AVENUEFrom West
Start Time Right
Thru Left Ped
sApp.Total
Right
Thru Left Ped
sApp.Total
Right
Thru Left Ped
sApp.Total
Right
Thru Left Ped
sApp.Total
Int.Total
Factor 1.0 1.0 1.0 1.0 1.0 1.0 1.0 1.0 1.0 1.0 1.0 1.0 1.0 1.0 1.0 1.0
07:15 AM 0 2 0 0 2 0 0 0 0 0 0 0 0 0 0 0 1 0 0 1 307:30 AM 0 0 1 0 1 0 0 0 2 2 0 0 0 0 0 0 2 0 0 2 507:45 AM 0 0 0 0 0 0 0 0 0 0 0 2 0 0 2 0 1 0 0 1 3
Total 0 2 1 0 3 0 0 0 2 2 0 2 0 0 2 0 4 0 0 4 11
08:00 AM 0 1 0 0 1 0 0 0 2 2 0 0 0 1 1 0 4 0 0 4 808:15 AM 0 5 0 0 5 1 1 0 0 2 0 1 0 0 1 0 2 0 0 2 1008:30 AM 0 4 0 0 4 0 0 0 0 0 0 0 0 0 0 0 3 0 0 3 708:45 AM 0 3 0 0 3 0 0 0 1 1 0 1 0 1 2 2 5 0 1 8 14
Total 0 13 0 0 13 1 1 0 3 5 0 2 0 2 4 2 14 0 1 17 39
09:00 AM 0 1 2 1 4 0 0 0 0 0 0 0 0 0 0 0 1 0 2 3 7
09:30 AM 0 1 0 1 2 0 1 0 2 3 0 0 0 0 0 0 3 0 0 3 809:45 AM 0 1 0 1 2 0 0 0 0 0 1 0 0 0 1 0 3 0 0 3 6
Total 0 3 2 3 8 0 1 0 2 3 1 0 0 0 1 0 7 0 2 9 21
10:00 AM 0 0 0 0 0 0 0 0 0 0 1 1 0 0 2 1 1 0 0 2 4
Total 0 0 0 0 0 0 0 0 0 0 1 1 0 0 2 1 1 0 0 2 4
11:15 AM 1 0 0 0 1 0 0 0 0 0 0 1 0 0 1 0 2 0 2 4 611:30 AM 0 0 0 0 0 0 0 0 0 0 0 0 0 1 1 0 1 0 0 1 211:45 AM 0 1 0 0 1 0 0 0 1 1 0 0 0 0 0 0 1 0 0 1 3
Total 1 1 0 0 2 0 0 0 1 1 0 1 0 1 2 0 4 0 2 6 11
12:00 PM 0 0 0 0 0 0 0 0 2 2 0 0 0 0 0 0 1 0 1 2 412:15 PM 0 1 0 0 1 0 1 0 0 1 0 0 0 0 0 0 0 0 0 0 212:30 PM 0 0 0 0 0 0 0 0 0 0 1 1 0 1 3 0 1 0 0 1 412:45 PM 0 0 0 0 0 0 0 0 1 1 0 0 0 0 0 0 0 0 0 0 1
Total 0 1 0 0 1 0 1 0 3 4 1 1 0 1 3 0 2 0 1 3 11
01:00 PM 0 1 0 0 1 0 3 0 0 3 0 0 0 0 0 0 0 0 0 0 401:15 PM 0 0 0 0 0 0 0 0 0 0 0 1 0 0 1 0 1 0 0 1 201:30 PM 0 0 0 0 0 0 0 0 0 0 0 0 0 1 1 0 1 0 0 1 201:45 PM 0 0 1 0 1 0 0 0 0 0 0 0 0 0 0 0 2 0 0 2 3
Total 0 1 1 0 2 0 3 0 0 3 0 1 0 1 2 0 4 0 0 4 11
02:00 PM 0 0 0 0 0 0 2 0 0 2 0 0 0 1 1 0 0 0 0 0 3
Total 0 0 0 0 0 0 2 0 0 2 0 0 0 1 1 0 0 0 0 0 3
03:00 PM 0 0 0 0 0 0 0 0 0 0 0 0 0 0 0 0 0 0 1 1 103:15 PM 0 0 0 0 0 0 0 0 0 0 0 1 0 1 2 0 0 1 1 2 403:30 PM 1 1 0 0 2 0 0 0 1 1 0 2 0 0 2 0 2 0 0 2 703:45 PM 0 0 0 0 0 0 0 0 0 0 0 2 0 1 3 0 0 0 0 0 3
Total 1 1 0 0 2 0 0 0 1 1 0 5 0 2 7 0 2 1 2 5 15

Sabra, Wang & Associates, Inc.1504 Joh Avenue, Suite 160
Baltimore, MD 21227410-737-6564
File Name : pennsylvania @ 14th St.Site Code : 00000001Start Date : 12/16/2009Page No : 2
Groups Printed- BICYCLES14th STREETFrom North
PENNSYLVANIA AVENUEFrom East
14th STREETFrom South
PENNSYLVANIA AVENUEFrom West
Start Time Right
Thru Left Ped
sApp.Total
Right
Thru Left Ped
sApp.Total
Right
Thru Left Ped
sApp.Total
Right
Thru Left Ped
sApp.Total
Int.Total
Factor 1.0 1.0 1.0 1.0 1.0 1.0 1.0 1.0 1.0 1.0 1.0 1.0 1.0 1.0 1.0 1.004:00 PM 0 0 0 0 0 0 0 0 0 0 0 0 0 0 0 0 2 0 0 2 204:15 PM 0 0 1 0 1 0 0 0 0 0 0 1 0 0 1 0 1 1 0 2 404:30 PM 1 0 0 1 2 0 0 0 0 0 0 3 0 0 3 0 2 0 0 2 704:45 PM 0 1 0 0 1 0 3 1 0 4 0 4 0 0 4 0 0 0 0 0 9
Total 1 1 1 1 4 0 3 1 0 4 0 8 0 0 8 0 5 1 0 6 22
05:00 PM 0 0 0 0 0 0 1 0 0 1 0 0 0 0 0 0 0 0 0 0 105:15 PM 0 1 1 1 3 0 4 0 0 4 0 2 0 0 2 0 0 0 0 0 905:30 PM 0 0 0 0 0 0 1 0 0 1 0 2 0 0 2 0 2 0 0 2 505:45 PM 0 1 0 0 1 0 0 0 0 0 0 1 0 0 1 0 2 0 1 3 5
Total 0 2 1 1 4 0 6 0 0 6 0 5 0 0 5 0 4 0 1 5 20
GrandTotal 3 25 6 5 39 1 17 1 12 31 3 26 0 8 37 3 47 2 9 61 168
Apprch % 7.7 64.1 15.4 12.8 3.2 54.8 3.2 38.7 8.1 70.3 0.0 21.6 4.9 77.0 3.3 14.8Total % 1.8 14.9 3.6 3.0 23.2 0.6 10.1 0.6 7.1 18.5 1.8 15.5 0.0 4.8 22.0 1.8 28.0 1.2 5.4 36.3

Street: Pennsylvania Ave, NW Start/End Times: 6:00-10:00 AM 15:00-19:00 PM
Between These Intersections: 6th St. and 7th St. Number of Auto Lanes: 6
Day of the Week: Thursday Parking (No, 1, 2): 2
Date: 4/1/2010 Speed Limit:Weather: warm, clear Bike lanes? no(Temp, Conditions) One Way Street? no
Counter's Name:
Time West Bound East Bound West Bound East Bound Total Check of Check of Time Hour Totalson Sidewalk on Sidewalk Yes No Male Female Yes No Helmet Gender
6:00 0 0 0 0 0 0 0 0 0 0 0 0 0 6:00-7:00 76:15 1 2 0 2 5 3 2 4 1 0 0 5 5 6:15-7:15 96:30 0 1 0 0 1 1 0 1 0 0 0 1 1 6:30-7:30 136:45 1 0 0 0 1 1 0 1 0 0 0 1 1 6:45-7:45 137:00 1 0 1 0 2 1 1 2 0 0 0 2 2 7:00-8:00 217:15 3 5 0 1 9 7 2 8 1 0 0 9 9 7:15-8:15 237:30 1 0 0 0 1 0 1 1 0 0 0 1 1 7:30-8:30 297:45 5 3 1 0 9 7 2 9 0 0 0 9 9 7:45-8:45 338:00 2 0 2 0 4 4 0 3 1 0 0 4 4 8:00-9:00 388:15 6 4 3 2 15 10 5 11 4 0 0 15 15 8:15-9:15 528:30 4 0 1 0 5 3 2 4 1 0 0 5 5 8:30-9:30 408:45 4 6 2 2 14 9 5 9 5 0 0 14 14 8:45-9:45 429:00 5 9 2 2 18 13 5 13 5 0 0 18 18 9:00-10:00 29
9:15 3 0 0 0 3 3 0 3 0 0 0 3 3 Peak Hour 52
9:30 6 1 0 0 7 4 3 4 3 0 0 7 7
9:45 1 0 0 0 1 0 1 1 0 0 0 1 1
Total: 43 31 12 9 95 66 29 74 21 0 0 95 95% Traveling N/E % Traveling S/W % N/E on Sidewalk % S/W on Sidewalk % Yes % No % Male % Fem. % Yes % No
45% 33% 13% 9% 69% 31% 78% 22% 0% #DIV/0! Time Hour Totals
15:00 2 2 0 2 6 6 0 4 2 0 0 6 6 15:00-16:0 3315:15 2 5 2 0 9 2 7 8 1 0 0 9 9 15:15-16:1 4415:30 7 0 0 0 7 1 6 7 0 0 0 7 7 15:30-16:3 4615:45 5 6 0 0 11 4 7 9 2 0 0 11 11 15:45-16:4 4416:00 3 6 8 0 17 8 9 10 7 0 0 17 17 16:00-17:0 4416:15 9 2 0 0 11 2 9 9 2 0 0 11 11 16:15-17:1 3616:30 1 1 0 3 5 2 3 4 1 0 0 5 5 16:30-17:3 3016:45 8 2 0 1 11 4 7 9 2 0 0 11 11 16:45-17:4 3817:00 5 3 0 1 9 3 6 7 2 0 0 9 9 17:00-18:0 38
17:15 4 1 0 0 5 4 1 5 0 0 0 5 5 17:15-18:1 36
17:30 11 2 0 0 13 8 5 8 5 0 0 13 13 17:30-18:3 4517:45 8 3 0 0 11 7 4 5 6 0 0 11 11 17:45-18:4 3818:00 5 2 0 0 7 7 0 5 2 0 0 7 7 18:00-19:0 3118:15 6 6 0 2 14 7 7 10 4 0 0 14 14 Peak Hour 4618:30 3 0 1 2 6 4 2 4 2 0 0 6 618:45 1 2 0 1 4 4 0 3 1 0 0 4 4
Total: 80 43 11 12 146 73 73 107 39 0 0 146 146% Traveling N/E % Traveling S/W % N/E on Sidewalk % S/W on Sidewalk % Yes % No % Male % Fem. % Yes % No
55% 29% 8% 8% 50% 50% 73% 27% 0% #DIV/0!
1)Comments
Bicycle Count Data Entry Sheet
GenderPeak Hour
Peak Hour
Helmet? Biking in Median
PA Ave 2.xlsx Page 1

Street: Pennsylvania Ave, NW Start/End Times: 6:00-10:00 AM 15:00-19:00 PM
Between These Intersections: 14th St. And 15th St. Number of Auto Lanes: 6
Day of the Week: Thursday Parking (No, 1, 2): 2
Date: 4/1/2010 Speed Limit:Weather: warm, clear Bike lanes? no(Temp, Conditions) One Way Street? no
Counter's Name:
Time West Bound East Bound West Bound East Bound Total Check of Check of Time Hour Totalson Sidewalk on Sidewalk Yes No Male Female Yes No Helmet Gender
6:00 0 1 0 0 1 1 0 1 0 0 0 1 1 6:00-7:00 46:15 0 1 0 0 1 1 0 1 0 0 0 1 1 6:15-7:15 106:30 0 2 0 0 2 2 0 0 2 0 0 2 2 6:30-7:30 136:45 0 0 0 0 0 0 0 0 0 0 0 0 0 6:45-7:45 137:00 0 7 0 0 7 7 0 2 5 0 0 7 7 7:00-8:00 197:15 0 3 1 0 4 4 0 4 0 0 0 4 4 7:15-8:15 227:30 1 1 0 0 2 1 1 1 1 0 0 2 2 7:30-8:30 227:45 0 6 0 0 6 6 0 4 2 0 0 6 6 7:45-8:45 308:00 1 9 0 0 10 10 0 7 3 0 0 10 10 8:00-9:00 358:15 1 3 0 0 4 4 0 3 1 0 0 4 4 8:15-9:15 358:30 2 8 0 0 10 10 0 8 2 0 0 10 10 8:30-9:30 418:45 1 10 0 0 11 9 2 8 3 0 0 11 11 8:45-9:45 349:00 1 9 0 0 10 8 2 5 5 0 0 10 10 9:00-10:00 28
9:15 1 9 0 0 10 10 0 6 4 0 0 10 10 Peak Hour 41
9:30 2 1 0 0 3 2 1 2 1 0 0 3 3
9:45 0 5 0 0 5 3 2 5 0 0 5 5
Total: 10 75 1 0 86 78 8 57 29 0 0 86 86% Traveling N/E % Traveling S/W % N/E on Sidewalk % S/W on Sidewalk % Yes % No % Male % Fem. % Yes % No
12% 87% 1% 0% 91% 9% 66% 34% 0% #DIV/0! Time Hour Totals
15:00 3 0 10 0 13 5 8 8 5 0 0 13 13 15:00-16:0 2015:15 1 0 0 0 1 1 0 1 0 0 0 1 1 15:15-16:1 1415:30 0 2 0 0 2 1 1 2 0 0 0 2 2 15:30-16:3 2315:45 4 0 0 0 4 0 4 3 1 0 0 4 4 15:45-16:4 2916:00 2 5 0 0 7 5 2 6 1 0 0 7 7 16:00-17:0 3716:15 1 5 0 4 10 4 6 6 4 0 0 10 10 16:15-17:1 3816:30 0 8 0 0 8 7 1 4 4 0 0 8 8 16:30-17:3 4716:45 2 7 1 2 12 8 4 7 5 0 0 12 12 16:45-17:4 4917:00 4 2 1 1 8 6 2 6 2 0 0 8 8 17:00-18:0 40
17:15 1 1 0 17 19 17 2 15 4 0 0 19 19 17:15-18:1 43
17:30 4 2 4 0 10 6 4 4 6 0 0 10 10 17:30-18:3 3317:45 2 1 0 0 3 2 1 3 0 0 3 3 17:45-18:4 4418:00 4 7 0 0 11 6 5 6 5 0 0 11 11 18:00-19:0 4418:15 2 5 2 0 9 6 3 8 1 0 0 9 9 Peak Hour 4918:30 19 2 0 0 21 16 5 12 9 0 0 21 2118:45 2 1 0 0 3 3 3 0 0 0 3 3
Total: 51 48 18 24 141 93 48 94 47 0 0 141 141% Traveling N/E % Traveling S/W % N/E on Sidewalk % S/W on Sidewalk % Yes % No % Male % Fem. % Yes % No
36% 34% 13% 17% 66% 34% 67% 33% 0% #DIV/0!
1)Comments
Bicycle Count Data Entry Sheet
GenderPeak Hour
Peak Hour
Helmet? Biking in Median
PA Ave 1.xlsx Page 1

Street: Pennsylvania Ave, NW Start/End Times: 6:00-10:00 15:00-19:00
Between These Intersections: 6th St. & 7th St. Number of Auto Lanes: 8
Day of the Week: Wednesday Parking (No, 1, 2):Date: 9/8/2010 Speed Limit: 25
Weather: clear Bike lanes? yes(Temp, Conditions) One Way Street? no
Counter's Name:
Time West Bound East Bound West Bound East Bound Total Check of Check of Time Hour Totalson Sidewalk on Sidewalk Yes No Male Female Yes No Helmet Gender
6:00 1 0 0 0 1 1 0 1 0 0 1 1 1 6:00-7:00 136:15 2 2 0 0 4 2 2 3 1 4 0 4 4 6:15-7:15 176:30 2 0 0 1 3 1 2 3 0 2 1 3 3 6:30-7:30 226:45 2 3 0 0 5 5 0 5 0 5 0 5 5 6:45-7:45 287:00 4 1 0 0 5 3 2 5 0 3 2 5 5 7:00-8:00 367:15 4 5 0 0 9 8 1 6 3 9 0 9 9 7:15-8:15 427:30 6 3 0 0 9 8 1 8 1 9 0 9 9 7:30-8:30 537:45 8 5 0 0 13 13 0 7 6 13 0 13 13 7:45-8:45 698:00 7 4 0 0 11 9 2 8 3 11 0 11 11 8:00-9:00 758:15 18 2 0 0 20 16 4 15 5 20 0 20 20 8:15-9:15 838:30 19 5 0 1 25 17 8 20 5 22 3 25 25 8:30-9:30 768:45 14 4 0 1 19 13 6 17 2 18 1 19 19 8:45-9:45 609:00 15 3 0 1 19 15 4 11 8 16 3 19 19 9:00-10:00 50
9:15 10 3 0 0 13 10 3 10 3 12 1 13 13 Peak Hour 83
9:30 5 2 1 1 9 7 2 4 5 7 2 9 9
9:45 5 3 1 0 9 8 1 8 1 7 2 9 9
Total: 122 45 2 5 174 136 38 131 43 158 16 174 174% Traveling N/E % Traveling S/W % N/E on Sidewalk % S/W on Sidewalk % Yes % No % Male % Fem. % Yes % No
70% 26% 1% 3% 78% 22% 75% 25% 79% 9% Time Hour Totals
15:00 1 3 0 0 4 2 2 4 0 4 0 4 4 15:00-16:0 3515:15 7 4 0 1 12 7 5 10 2 10 2 12 12 15:15-16:1 3715:30 5 3 0 0 8 5 3 6 2 8 0 8 8 15:30-16:3 3415:45 3 8 0 0 11 8 3 6 5 9 2 11 11 15:45-16:4 3816:00 2 3 1 0 6 4 2 3 3 5 1 6 6 16:00-17:0 4316:15 4 3 2 0 9 4 5 6 3 7 2 9 9 16:15-17:1 4916:30 10 1 0 1 12 10 2 9 3 9 3 12 12 16:30-17:3 5516:45 8 5 3 0 16 10 6 13 3 7 9 16 16 16:45-17:4 6217:00 5 7 0 0 12 7 5 10 2 12 0 12 12 17:00-18:0 65
17:15 8 7 0 0 15 11 4 11 4 13 2 15 15 17:15-18:1 78
17:30 9 9 1 0 19 12 7 10 9 17 2 19 19 17:30-18:3 8117:45 7 9 3 0 19 12 7 15 4 16 3 19 19 17:45-18:4 7818:00 13 12 0 0 25 20 5 18 7 23 2 25 25 18:00-19:0 7718:15 9 9 0 0 18 13 5 13 5 15 3 18 18 Peak Hour 8118:30 7 7 0 2 16 12 4 13 3 11 5 16 1618:45 5 11 2 0 18 12 6 13 5 16 2 18 18
Total: 103 101 12 4 220 149 71 160 60 182 38 220 220% Traveling N/E % Traveling S/W % N/E on Sidewalk % S/W on Sidewalk % Yes % No % Male % Fem. % Yes % No
47% 46% 5% 2% 68% 32% 73% 27% 75% 17%
2201)Comments
Bicycle Count Data Entry Sheet
GenderPeak Hour
Peak Hour
Helmet? Biking in Median
PA AVE B.xlsx Page 1

Street: Pennsylvania Ave, NW Start/End Times: 6:00-10:00 15:00-19:00
Between These Intersections: 14th & 15th streets Number of Auto Lanes: 5
Day of the Week: Friday Parking (No, 1, 2): 2
Date: 9/24/2010 Speed Limit: 25
Weather: clear Bike lanes? no(Temp, Conditions) One Way Street? no
Counter's Name:
Time West Bound East Bound West Bound East Bound Total Check of Check of Time Hour Totalson Sidewalk on Sidewalk Yes No Male Female Yes No Helmet Gender
6:00 0 0 0 0 0 0 0 0 0 0 0 6:00-7:00 36:15 1 0 0 0 1 1 0 1 0 1 1 6:15-7:15 96:30 1 0 0 0 1 1 0 1 0 1 1 6:30-7:30 156:45 1 0 0 0 1 1 0 1 0 1 1 6:45-7:45 197:00 2 3 1 0 6 6 0 5 1 6 6 7:00-8:00 277:15 3 2 1 1 7 7 0 6 1 7 7 7:15-8:15 347:30 3 2 0 0 5 5 0 3 2 5 5 7:30-8:30 377:45 3 6 0 0 9 9 0 5 4 9 9 7:45-8:45 418:00 6 6 0 1 13 11 2 8 5 13 13 8:00-9:00 608:15 5 5 0 0 10 10 0 8 2 10 10 8:15-9:15 648:30 3 5 0 1 9 9 0 7 2 9 9 8:30-9:30 698:45 8 20 0 0 28 26 2 21 7 28 28 8:45-9:45 669:00 5 11 1 0 17 13 4 12 5 17 17 9:00-10:00 48
9:15 3 12 0 0 15 14 1 13 2 15 15 Peak Hour 69
9:30 2 3 0 1 6 4 2 6 0 6 6
9:45 3 6 1 0 10 6 4 8 2 10 10
Total: 49 81 4 4 138 123 15 105 33 0 0 138 138% Traveling N/E % Traveling S/W % N/E on Sidewalk % S/W on Sidewalk % Yes % No % Male % Fem. % Yes % No
36% 59% 3% 3% 89% 11% 76% 24% 0% #DIV/0! Time Hour Totals
15:00 2 2 0 0 4 1 3 2 2 4 4 15:00-16:0 2315:15 3 6 0 0 9 2 7 6 3 9 9 15:15-16:1 3415:30 3 3 0 0 6 4 2 5 1 6 6 15:30-16:3 3415:45 1 2 0 1 4 2 2 4 0 4 4 15:45-16:4 3616:00 8 7 0 0 15 7 8 10 5 15 15 16:00-17:0 4016:15 6 3 0 0 9 5 4 9 0 9 9 16:15-17:1 3816:30 2 1 0 5 8 0 8 7 1 8 8 16:30-17:3 4516:45 8 0 0 0 8 4 4 8 0 8 8 16:45-17:4 4917:00 2 11 0 0 13 7 6 8 5 13 13 17:00-18:0 53
17:15 11 3 2 0 16 10 6 14 2 16 16 17:15-18:1 58
17:30 4 7 1 0 12 7 5 8 4 12 12 17:30-18:3 5417:45 4 6 2 0 12 10 2 11 1 12 12 17:45-18:4 4518:00 7 8 3 0 18 14 4 9 9 18 18 18:00-19:0 4218:15 7 5 0 0 12 9 3 10 2 12 12 Peak Hour 5818:30 1 1 1 0 3 2 1 2 1 3 318:45 5 4 0 0 9 7 2 7 2 9 9
Total: 74 69 9 6 158 91 67 120 38 0 0 158 158% Traveling N/E % Traveling S/W % N/E on Sidewalk % S/W on Sidewalk % Yes % No % Male % Fem. % Yes % No
47% 44% 6% 4% 58% 42% 76% 24% 0% #DIV/0!
1)Comments
Bicycle Count Data Entry Sheet
GenderPeak Hour
Peak Hour
Helmet? Biking in Median
PA AVE A recount.xlsx Page 1

Street: Pennsylvania Ave, (#44) Start/End Times: 6:00-10:00 15:00-19:00
Between These Intersections: 6th St. & 7th St. Number of Auto Lanes: 8
Day of the Week: Wednesday Parking (No, 1, 2):Date: 6/29/2011 Speed Limit: 25
Weather: Bike lanes? yes(Temp, Conditions) One Way Street? no
Counter's Name:
Time West Bound East Bound West Bound East Bound Total Check of Check of Time Hour TotalsIn Bike Lane In Bike Lane on Sidewalk on Sidewalk Yes No Male Female West East Helmet Gender
6:00 1 0 1 0 2 1 1 2 0 0 0 2 2 6:00-7:00 246:15 4 0 1 0 5 4 1 4 1 0 0 5 5 6:15-7:15 286:30 2 1 0 0 3 3 0 3 0 0 0 3 3 6:30-7:30 336:45 9 4 1 0 14 10 4 9 5 0 0 14 14 6:45-7:45 497:00 4 2 0 0 6 5 1 4 2 0 0 6 6 7:00-8:00 657:15 7 3 0 0 10 9 1 8 2 0 0 10 10 7:15-8:15 957:30 10 8 1 0 19 16 3 12 7 0 0 19 19 7:30-8:30 1187:45 21 5 0 0 30 27 3 20 10 2 2 30 30 7:45-8:45 1508:00 24 9 0 0 36 30 6 22 14 1 2 36 36 8:00-9:00 1678:15 23 7 2 1 33 27 6 20 13 0 0 33 33 8:15-9:15 1568:30 35 14 0 1 51 37 14 38 13 1 0 51 51 8:30-9:30 1518:45 34 11 1 1 47 34 13 36 11 0 0 47 47 8:45-9:45 1179:00 14 6 0 0 25 22 3 15 10 4 1 25 25 9:00-10:00 89
9:15 20 5 0 0 28 24 4 18 10 1 2 28 28 Peak Hour 167
9:30 12 2 0 0 17 10 7 12 5 2 1 17 17
9:45 11 5 0 0 19 17 2 12 7 3 0 19 19
Total: 231 82 7 3 345 276 69 235 110 14 8 345 345% Traveling N/E % Traveling S/W % N/E on Sidewalk % S/W on Sidewalk % Yes % No % Male % Fem. % Yes % No
72% 25% 2% 1% 80% 20% 68% 32% 11% 36% Time Hour Totals
15:00 7 4 4 0 16 6 10 13 3 1 0 16 16 15:00-16:0 4715:15 3 4 2 0 13 5 8 10 3 2 2 13 13 15:15-16:1 4115:30 3 7 0 0 10 7 3 7 3 0 0 10 10 15:30-16:3 3815:45 1 4 0 1 8 3 5 4 4 2 0 8 8 15:45-16:4 4416:00 7 3 0 0 10 6 4 6 4 0 0 10 10 16:00-17:0 5216:15 3 5 1 1 10 5 5 7 3 0 0 10 10 16:15-17:1 7216:30 5 5 3 1 16 8 8 14 2 0 2 16 16 16:30-17:3 9116:45 6 7 0 2 16 11 5 14 2 1 0 16 16 16:45-17:4 12217:00 15 13 1 0 30 16 14 21 9 1 0 30 30 17:00-18:0 145
17:15 8 17 1 0 29 17 12 21 8 1 2 29 29 17:15-18:1 140
17:30 12 35 0 0 47 38 9 38 9 0 0 47 47 17:30-18:3 15517:45 10 24 2 0 39 30 9 29 10 3 0 39 39 17:45-18:4 13218:00 10 12 3 0 25 15 10 19 6 0 0 25 25 18:00-19:0 11118:15 23 16 4 1 44 34 10 29 15 0 0 44 44 Peak Hour 15518:30 7 14 1 2 24 19 5 11 13 0 0 24 2418:45 3 15 0 0 18 16 2 13 5 0 0 18 18
Total: 123 185 22 8 355 236 119 256 99 11 6 355 355% Traveling N/E % Traveling S/W % N/E on Sidewalk % S/W on Sidewalk % Yes % No % Male % Fem. % Yes % No
36% 55% 7% 2% 66% 34% 72% 28% 10% 35%
171)Comments
Bicycle Count Data Entry Sheet
GenderPeak Hour
Peak Hour
Helmet? Biking in Street
Station #44 2011.xls Page 1

Street: Pennsylvania Ave, (#43) Start/End Times: 6:00-10:00 15:00-19:00
Between These Intersections: 14th St. & 15th St. Number of Auto Lanes: 5
Day of the Week: Wednesday Parking (No, 1, 2): 2
Date: 6/29/2011 Speed Limit: 25
Weather: Bike lanes? no(Temp, Conditions) One Way Street? no
Counter's Name:
Time West Bound East Bound West Bound East Bound Total Check of Check of Time Hour TotalsIn Bike Lane In Bike Lane on Sidewalk on Sidewalk Yes No Male Female West East Helmet Gender
6:00 1 1 0 0 2 1 1 2 0 0 0 2 2 6:00-7:00 276:15 2 2 1 0 5 4 1 4 1 0 0 5 5 6:15-7:15 276:30 5 2 1 0 9 7 2 9 0 0 1 9 9 6:30-7:30 316:45 2 5 0 0 11 11 0 8 3 0 4 11 11 6:45-7:45 417:00 0 2 0 0 2 2 0 2 0 0 0 2 2 7:00-8:00 557:15 1 1 0 0 9 6 3 7 2 1 6 9 9 7:15-8:15 787:30 5 12 0 0 19 16 3 13 6 0 2 19 19 7:30-8:30 1107:45 7 15 0 0 25 23 2 17 8 0 3 25 25 7:45-8:45 1448:00 13 9 0 1 25 21 4 18 7 0 2 25 25 8:00-9:00 1648:15 13 23 0 0 41 34 7 34 7 0 5 41 41 8:15-9:15 1708:30 14 34 0 0 53 39 14 38 15 0 5 53 53 8:30-9:30 1498:45 27 17 0 0 45 35 10 32 13 0 1 45 45 8:45-9:45 1269:00 12 17 0 0 31 26 5 19 12 2 0 31 31 9:00-10:00 104
9:15 7 10 0 1 20 18 2 14 6 1 1 20 20 Peak Hour 170
9:30 16 10 0 1 30 27 3 20 10 0 3 30 30
9:45 7 10 0 1 23 19 4 19 4 0 5 23 23
Total: 132 170 2 4 350 289 61 256 94 4 38 350 350% Traveling N/E % Traveling S/W % N/E on Sidewalk % S/W on Sidewalk % Yes % No % Male % Fem. % Yes % No
43% 55% 1% 1% 83% 17% 73% 27% 4% 90% Time Hour Totals
15:00 9 7 1 4 23 12 11 17 6 1 1 23 23 15:00-16:0 5815:15 3 5 1 5 14 10 4 10 4 0 0 14 14 15:15-16:1 4015:30 2 5 0 1 8 3 5 7 1 0 0 8 8 15:30-16:3 4515:45 6 7 0 0 13 5 8 9 4 0 0 13 13 15:45-16:4 5516:00 1 3 1 0 5 2 3 3 2 0 0 5 5 16:00-17:0 6816:15 12 5 2 0 19 7 12 12 7 0 0 19 19 16:15-17:1 8416:30 6 11 1 0 18 8 10 10 8 0 0 18 18 16:30-17:3 10916:45 15 11 0 0 26 20 6 11 15 0 0 26 26 16:45-17:4 13817:00 10 10 0 0 21 11 10 14 7 0 1 21 21 17:00-18:0 153
17:15 14 24 3 1 44 29 15 37 7 1 1 44 44 17:15-18:1 167
17:30 21 22 0 2 47 33 14 29 18 0 2 47 47 17:30-18:3 16317:45 11 29 0 0 41 30 11 29 12 1 0 41 41 17:45-18:4 15918:00 21 13 0 0 35 26 9 24 11 0 1 35 35 18:00-19:0 14818:15 28 11 1 0 40 25 15 33 7 0 0 40 40 Peak Hour 16718:30 27 16 0 0 43 37 6 28 15 0 0 43 4318:45 13 15 0 0 30 23 7 17 13 0 2 30 30
Total: 199 194 10 13 427 281 146 290 137 3 8 427 427% Traveling N/E % Traveling S/W % N/E on Sidewalk % S/W on Sidewalk % Yes % No % Male % Fem. % Yes % No
48% 47% 2% 3% 66% 34% 68% 32% 2% 73%
1)Comments
Bicycle Count Data Entry Sheet
GenderPeak Hour
Peak Hour
Helmet? Biking in Street
Station #43 2011.xls Page 1

Appendix B3 Pennsylvania Avenue: MMLOS Data

Multimodal Level of Service for Urban Streets
Street: Date:
Limits: Observer:
Analysis Direction: EB(Down Direction on this Sheet)
Auto LOS Model: NCHRP 3-70 Stops Model
Seg 1 Score Seg LOS Int LOS310 ft Seg. Auto 2.34 B N/A
35 mph #1 Transit #DIV/0! N/A N/A1278 vph Bike 3.51 C B
4 lanes Ped 2.02 A A
Seg 2 Score Seg LOS Int LOS325 ft Seg. Auto 2.34 B N/A
35 mph #2 Transit #DIV/0! N/A N/A1546 vph Bike 3.84 C D
4 lanes Ped 2.16 A A
Seg 3 Score Seg LOS Int LOS610 ft Seg. Auto 2.34 B N/A
35 mph #3 Transit #DIV/0! N/A N/A1114 vph Bike 3.83 C D
4 lanes Ped 2.33 A A
Seg 4 Score Seg LOS Int LOS620 ft Seg. Auto 2.34 B N/A
35 mph #4 Transit #DIV/0! N/A N/A1059 vph Bike 3.81 C D
4 lanes Ped 2.64 A B
Seg 5 Score Seg LOS Int LOS610 ft Seg. Auto 2.34 B N/A
35 mph #5 Transit #DIV/0! N/A N/A1222 vph Bike 3.78 C D
4 lanes Ped 2.58 A B
Street Score LOSAuto 2.34 BTransit 0.00 ABike 3.77 DPed 2.41 B
11th St NW
10th St NW
9th St NW
7th St NW
6th St NW
Results
Pennsylvania Ave: Before Bike Lanes Installed 0
6th NW-12th NW 0
12th St NW

Multimodal Level of Service for Urban Streets
Street: Date:
Limits: Observer:
Analysis Direction: WB(Down Direction on this Sheet)
Auto LOS Model: NCHRP 3-70 Stops Model
Seg 1 Score Seg LOS Int LOS610 ft Seg. Auto 2.34 B N/A
35 mph #1 Transit #DIV/0! N/A N/A712 vph Bike 3.90 C C
4 lanes Ped 2.62 A B
Seg 2 Score Seg LOS Int LOS610 ft Seg. Auto 2.34 B N/A
35 mph #2 Transit #DIV/0! N/A N/A855 vph Bike 3.61 C C
4 lanes Ped 2.45 A B
Seg 3 Score Seg LOS Int LOS610 ft Seg. Auto 2.34 B N/A
35 mph #3 Transit #DIV/0! N/A N/A891 vph Bike 3.60 C C
4 lanes Ped 2.02 A A
Seg 4 Score Seg LOS Int LOS325 ft Seg. Auto 2.34 B N/A
35 mph #4 Transit #DIV/0! N/A N/A811 vph Bike 3.72 C C
4 lanes Ped 1.94 A A
Seg 5 Score Seg LOS Int LOS320 ft Seg. Auto 2.34 B N/A
35 mph #5 Transit #DIV/0! N/A N/A810 vph Bike 3.62 C C
4 lanes Ped 2.51 A A
Street Score LOSAuto 2.34 BTransit 0.00 ABike 3.70 DPed 2.33 B
7th St NW
9th St NW
10th St NW
11th St NW
12th St NW
Results
Pennsylvania Ave: Before Bike Lane 0
6th NW-12th NW 0
6th St NW

Multimodal Level of Service for Urban Streets
Street: Date:
Limits: Observer:
Analysis Direction: EB(Down Direction on this Sheet)
Auto LOS Model: NCHRP 3-70 Stops Model
Seg 1 Score Seg LOS Int LOS480 ft Seg. Auto 2.34 B N/A
35 mph #1 Transit #DIV/0! N/A N/A419 vph Bike 2.84 A A
2 lanes Ped 2.36 A B
Seg 2 Score Seg LOS Int LOS360 ft Seg. Auto 2.34 B N/A
35 mph #2 Transit #DIV/0! N/A N/A547 vph Bike 3.54 C C
3 lanes Ped 2.21 A A
Seg 3 Score Seg LOS Int LOS310 ft Seg. Auto 2.34 B N/A
35 mph #3 Transit #DIV/0! N/A N/A521 vph Bike 3.47 C B
3 lanes Ped 2.07 A A
Seg 4 Score Seg LOS Int LOS450 ft Seg. Auto 2.34 B N/A
35 mph #4 Transit #DIV/0! N/A N/A1112 vph Bike 3.86 C D
3 lanes Ped 2.53 A B
Seg 5 Score Seg LOS Int LOS0 ft Seg. Auto N/A #N/A N/A0 mph #5 Transit #DIV/0! N/A N/A0 vph Bike #DIV/0! #DIV/0! D0 lanes Ped #DIV/0! A #DIV/0!
Street Score LOSAuto 2.34 BTransit 0.00 ABike 3.41 CPed 2.32 B
Results
Pennsylvania Ave: Before Bike Lanes 0
12th NW-15th NW (EB) 0
15th St NW
14th St NW
13 1/2th St NW
13th St NW
12th St NW
0

Multimodal Level of Service for Urban Streets
Street: Date:
Limits: Observer:
Analysis Direction: WB(Down Direction on this Sheet)
Auto LOS Model: NCHRP 3-70 Stops Model
Seg 1 Score Seg LOS Int LOS460 ft Seg. Auto 2.34 B N/A
35 mph #1 Transit #DIV/0! N/A N/A476 vph Bike 3.66 C C
4 lanes Ped 2.66 A B
Seg 2 Score Seg LOS Int LOS360 ft Seg. Auto 2.34 B N/A
35 mph #2 Transit #DIV/0! N/A N/A507 vph Bike 3.41 C B
4 lanes Ped 2.43 B A
Seg 3 Score Seg LOS Int LOS300 ft Seg. Auto 2.34 B N/A
35 mph #3 Transit #DIV/0! N/A N/A421 vph Bike 3.62 C C
3 lanes Ped 2.78 B B
Seg 4 Score Seg LOS Int LOS480 ft Seg. Auto 2.34 B N/A
35 mph #4 Transit #DIV/0! N/A N/A0 vph Bike 3.35 C A3 lanes Ped 2.54 A C
Seg 5 Score Seg LOS Int LOS0 ft Seg. Auto N/A #N/A N/A0 mph #5 Transit #DIV/0! N/A N/A0 vph Bike #DIV/0! #DIV/0! D0 lanes Ped #DIV/0! A #DIV/0!
Street Score LOSAuto 2.34 BTransit 0.00 ABike 3.50 DPed 2.60 B
13th St NW
13 1/2th St NW
14th St NW
15th St NW
0
Results
Pennsylvania Ave: Before Bike LaneS 0
12th NW-15th NW 0
12th St NW

Multimodal Level of Service for Urban Streets
Street: Date:
Limits: Observer:
Analysis Direction: EB(Down Direction on this Sheet)
Auto LOS Model: NCHRP 3-70 Stops Model
Seg 1 Score Seg LOS Int LOS310 ft Seg. Auto 2.34 B N/A
35 mph #1 Transit #DIV/0! N/A N/A1278 vph Bike 2.93 A A
4 lanes Ped 2.00 A A
Seg 2 Score Seg LOS Int LOS325 ft Seg. Auto 2.34 B N/A
35 mph #2 Transit #DIV/0! N/A N/A1546 vph Bike 3.00 A B
4 lanes Ped 2.12 A A
Seg 3 Score Seg LOS Int LOS610 ft Seg. Auto 2.34 B N/A
35 mph #3 Transit #DIV/0! N/A N/A1114 vph Bike 3.00 A A
4 lanes Ped 2.30 A A
Seg 4 Score Seg LOS Int LOS620 ft Seg. Auto 2.34 B N/A
35 mph #4 Transit #DIV/0! N/A N/A1059 vph Bike 2.99 A A
4 lanes Ped 2.59 A B
Seg 5 Score Seg LOS Int LOS610 ft Seg. Auto 2.34 B N/A
35 mph #5 Transit #DIV/0! N/A N/A1222 vph Bike 2.98 A A
4 lanes Ped 2.53 A B
Street Score LOSAuto 2.34 BTransit 0.00 ABike 2.98 CPed 2.37 B
12th St NW
11th St NW
10th St NW
9th St NW
7th St NW
6th St NW
Results
Pennsylvania Ave: After Bike Lanes Installed 0
6th NW-12th NW 0

Multimodal Level of Service for Urban Streets
Street: Date:
Limits: Observer:
Analysis Direction: WB(Down Direction on this Sheet)
Auto LOS Model: NCHRP 3-70 Stops Model
Seg 1 Score Seg LOS Int LOS610 ft Seg. Auto 2.34 B N/A
35 mph #1 Transit #DIV/0! N/A N/A712 vph Bike 3.24 A A
4 lanes Ped 2.56 A B
Seg 2 Score Seg LOS Int LOS610 ft Seg. Auto 2.34 B N/A
35 mph #2 Transit #DIV/0! N/A N/A855 vph Bike 2.94 A A
4 lanes Ped 2.41 A B
Seg 3 Score Seg LOS Int LOS610 ft Seg. Auto 2.34 B N/A
35 mph #3 Transit #DIV/0! N/A N/A891 vph Bike 2.94 A A
4 lanes Ped 2.00 A A
Seg 4 Score Seg LOS Int LOS325 ft Seg. Auto 2.34 B N/A
35 mph #4 Transit #DIV/0! N/A N/A811 vph Bike 2.97 A A
4 lanes Ped 1.92 A A
Seg 5 Score Seg LOS Int LOS320 ft Seg. Auto 2.34 B N/A
35 mph #5 Transit #DIV/0! N/A N/A810 vph Bike 2.95 A A
4 lanes Ped 2.43 A A
Street Score LOSAuto 2.34 BTransit 0.00 ABike 3.02 CPed 2.28 B
Results
Pennsylvania Ave: After Bike Lane Installation 40763
6th NW-12th NW (WB) 0
6th St NW
7th St NW
9th St NW
10th St NW
11th St NW
12th St NW

Multimodal Level of Service for Urban Streets
Street: Date:
Limits: Observer:
Analysis Direction: EB(Down Direction on this Sheet)
Auto LOS Model: NCHRP 3-70 Stops Model
Seg 1 Score Seg LOS Int LOS480 ft Seg. Auto 2.34 B N/A
35 mph #1 Transit #DIV/0! N/A N/A419 vph Bike 2.84 A A
2 lanes Ped 2.36 A B
Seg 2 Score Seg LOS Int LOS360 ft Seg. Auto 2.34 B N/A
35 mph #2 Transit #DIV/0! N/A N/A547 vph Bike 2.91 A A
3 lanes Ped 2.18 A A
Seg 3 Score Seg LOS Int LOS310 ft Seg. Auto 2.34 B N/A
35 mph #3 Transit #DIV/0! N/A N/A521 vph Bike 3.15 A A
3 lanes Ped 2.05 A A
Seg 4 Score Seg LOS Int LOS450 ft Seg. Auto 2.34 B N/A
35 mph #4 Transit #DIV/0! N/A N/A1112 vph Bike 2.97 A A
4 lanes Ped 2.40 A B
Seg 5 Score Seg LOS Int LOS0 ft Seg. Auto N/A #N/A N/A0 mph #5 Transit #DIV/0! N/A N/A0 vph Bike #DIV/0! #DIV/0! D0 lanes Ped #DIV/0! A #DIV/0!
Street Score LOSAuto 2.34 BTransit 0.00 ABike 2.95 CPed 2.27 B
14th St NW
13 1/2th St NW
13th St NW
12th St NW
0
Results
Pennsylvania Ave: After Bike Lane Installation 0
12th NW-15th NW (EB) 0
15th St NW

Multimodal Level of Service for Urban Streets
Street: Date:
Limits: Observer:
Analysis Direction: WB(Down Direction on this Sheet)
Auto LOS Model: NCHRP 3-70 Stops Model
Seg 1 Score Seg LOS Int LOS460 ft Seg. Auto 2.34 B N/A
35 mph #1 Transit #DIV/0! N/A N/A476 vph Bike 2.93 A A
4 lanes Ped 2.58 A B
Seg 2 Score Seg LOS Int LOS360 ft Seg. Auto 2.34 B N/A
35 mph #2 Transit #DIV/0! N/A N/A507 vph Bike 3.13 A A
3 lanes Ped 2.40 A A
Seg 3 Score Seg LOS Int LOS300 ft Seg. Auto 2.34 B N/A
35 mph #3 Transit #DIV/0! N/A N/A421 vph Bike 2.95 A A
2 lanes Ped 2.74 A B
Seg 4 Score Seg LOS Int LOS480 ft Seg. Auto 2.34 B N/A
35 mph #4 Transit #DIV/0! N/A N/A0 vph Bike 2.90 A A3 lanes Ped 2.70 A B
Seg 5 Score Seg LOS Int LOS0 ft Seg. Auto N/A #N/A N/A0 mph #5 Transit #DIV/0! N/A N/A0 vph Bike #DIV/0! #DIV/0! D0 lanes Ped #DIV/0! A #DIV/0!
Street Score LOSAuto 2.34 BTransit 0.00 ABike 2.97 CPed 2.61 B
Results
Pennsylvania Ave: After Bike Lane Installation 0
12th NW-15th NW (WB) 0
12th St NW
13th St NW
13 1/2th St NW
14th St NW
15th St NW
0

Appendix B4 Pennsylvania Avenue: Danish Bicycle LOS Data

LevelVery
satisfiedModerately
satisfiedA little
satisfiedA little
dissatisfiedModerately dissatisfied
Very dissatisfied
1 South Side - Pennsylvania Avenue After 15th Street 14th Street C Average 2.8 13% 33% 27% 14% 9% 4% 89172 South Side - Pennsylvania Avenue After 14th Street 13 1/2 Street B Average 2.7 16% 36% 26% 12% 7% 3% 81223 South Side - Pennsylvania Avenue After 13 1/2 Street 13th Street C Average 2.8 13% 33% 27% 14% 9% 3% 67184 South Side - Pennsylvania Avenue After 13th Street 12th Street C Average 3.2 8% 25% 29% 19% 14% 6% 42715 South Side - Pennsylvania Avenue After 12th Street 11th Street C Average 2.7 15% 35% 27% 13% 8% 3% 70296 South Side - Pennsylvania Avenue After 11th Street 10th Street C Average 2.8 14% 34% 27% 13% 8% 3% 69577 South Side - Pennsylvania Avenue After 10th Street 9th Street C Average 3.3 7% 24% 28% 19% 15% 7% 40958 South Side - Pennsylvania Avenue After 9th Street 7th Street C Average 2.8 14% 34% 27% 13% 8% 3% 147659 South Side - Pennsylvania Avenue After 7th Street 6th Street C Average 3.2 8% 25% 29% 19% 14% 6% 506910 North Side - Pennsylvania Avenue After 15th Street 14th Street C Average 3.0 11% 31% 28% 16% 10% 4% 739011 North Side - Pennsylvania Avenue After 14th Street 13 1/2 Street C Average 3.0 11% 30% 28% 16% 10% 4% 534012 North Side - Pennsylvania Avenue After 13 1/2 Street 13th Street C Average 2.8 13% 33% 27% 14% 9% 3% 671813 North Side - Pennsylvania Avenue After 13th Street 12th Street C Average 3.2 8% 25% 29% 19% 14% 6% 427114 North Side - Pennsylvania Avenue After 12th Street 11th Street C Average 3.2 8% 25% 28% 19% 14% 6% 254815 North Side - Pennsylvania Avenue After 11th Street 10th Street C Average 2.8 14% 34% 27% 13% 8% 3% 695716 North Side - Pennsylvania Avenue After 10th Street 9th Street C Average 2.8 14% 34% 27% 14% 9% 3% 1352717 North Side - Pennsylvania Avenue After 9th Street 7th Street C Average 3.3 8% 24% 28% 19% 14% 6% 505118 North Side - Pennsylvania Avenue After 7th Street 6th Street C Average 3.2 8% 25% 29% 19% 14% 6% 506919 South Side - Pennsylvania Avenue Before 15th Street 14th Street D Average 4.1 3% 11% 20% 23% 27% 17% -776420 South Side - Pennsylvania Avenue Before 14th Street 13 1/2 Street D Average 4.3 2% 9% 18% 22% 29% 20% -706021 South Side - Pennsylvania Avenue Before 13 1/2 Street 13th Street E Average 4.4 2% 8% 16% 21% 31% 22% -807122 South Side - Pennsylvania Avenue Before 13th Street 12th Street E Poor 5.0 1% 3% 8% 14% 32% 41% -2048523 South Side - Pennsylvania Avenue Before 12th Street 11th Street E Average 4.6 1% 6% 14% 19% 32% 27% -932024 South Side - Pennsylvania Avenue Before 11th Street 10th Street E Poor 4.8 1% 5% 11% 17% 33% 33% -1153125 South Side - Pennsylvania Avenue Before 10th Street 9th Street F Poor 5.2 1% 2% 6% 11% 29% 52% -3023926 South Side - Pennsylvania Avenue Before 9th Street 7th Street E Poor 4.7 1% 6% 12% 18% 33% 30% -2165727 South Side - Pennsylvania Avenue Before 7th Street 6th Street E Poor 5.0 1% 3% 8% 14% 32% 41% -2428028 North Side - Pennsylvania Avenue Before 15th Street 14th Street D Average 4.2 2% 9% 18% 22% 29% 19% -937429 North Side - Pennsylvania Avenue Before 14th Street 13 1/2 Street E Poor 4.7 1% 5% 11% 17% 33% 33% -1152530 North Side - Pennsylvania Avenue Before 13 1/2 Street 13th Street E Average 4.4 2% 8% 16% 21% 31% 22% -807131 North Side - Pennsylvania Avenue Before 13th Street 12th Street E Poor 5.0 1% 3% 8% 14% 32% 41% -2048532 North Side - Pennsylvania Avenue Before 12th Street 11th Street E Poor 5.0 1% 3% 8% 13% 32% 43% -1304933 North Side - Pennsylvania Avenue Before 11th Street 10th Street E Poor 4.8 1% 5% 11% 17% 33% 33% -1153134 North Side - Pennsylvania Avenue Before 10th Street 9th Street E Poor 4.8 1% 5% 10% 17% 33% 35% -2337335 North Side - Pennsylvania Avenue Before 9th Street 7th Street E Poor 5.1 1% 3% 7% 12% 31% 46% -2937936 North Side - Pennsylvania Avenue Before 7th Street 6th Street E Poor 5.0 1% 3% 8% 14% 32% 41% -24280
Service SumUserLevel of ServiceTo Road
Satisfaction: Level and Split on Rating Categories
Number Name of Road From RoadRoad ID

Appendix B5 Pennsylvania Avenue: BEQI Data

Pennsylvania Avenue BEQI ResultsBefore Conditions
Streets_Value_Dom
_ID Streets_IDIntersectio
ns_ID Primary Street Cross Street1 Cross Street 2Side_of_the_Street
Presence_of_Marked
_AreaWidth_of_Bike_Lane
Bicycle_Lane_markin
gs
Connectivity_of_Bicycle_Lanes
Pavement_Type_Co
nditionDriveway_
Cuts
Posted_Speed_Limi
t
PP_Adjacent_To_Lane_Route
Traffic_Calming_Fea
tures
Presence_of_Bicycle
_SignsPresence_of_Trees
Scale_Lightning
Line_of_Site
Bicycle_Parking
Retail_Use
Traffic_Volume
Percent_HeavyVehicl
esNo_of_La
nesStreetSlop
e BEQI
91 1 1 Pennsylvania Avenue 15th Street 14th Street N 4 0 4 13 40 27 18 27 24 15 29 36 36 12 14 27 36 15 27 48.67
94 4 1 Pennsylvania Avenue 15th Street 14th Street S 4 0 4 13 40 27 18 27 24 15 29 36 36 12 14 27 22 15 27 45.58
92 2 2 Pennsylvania Avenue 14th Street 13 1/2 Street N 4 0 4 13 40 27 18 27 24 15 29 15 36 12 14 27 36 15 27 44.03
93 3 2 Pennsylvania Avenue 14th Street 13 1/2 Street S 4 0 4 13 40 27 18 27 24 15 29 36 36 12 14 27 22 15 27 45.58
95 5 3 Pennsylvania Avenue 13 1/2 Street 13th Street N 4 0 4 13 40 27 18 27 24 15 29 15 36 12 14 27 36 15 27 44.03
96 6 3 Pennsylvania Avenue 13 1/2 Street 13th Street S 4 0 4 13 40 27 18 27 24 15 29 36 36 12 16 27 22 15 27 46.02
97 7 4 Pennsylvania Avenue 13th Street 12th Street N 4 0 4 13 40 27 18 27 24 15 29 36 36 12 16 27 36 15 27 49.12
98 8 4 Pennsylvania Avenue 13th Street 12th Street S 4 0 4 13 40 27 18 27 24 15 29 36 36 12 16 27 22 15 27 46.02
99 9 5 Pennsylvania Avenue 12th Street 11th Street N 4 0 4 13 40 27 18 27 24 15 29 36 36 12 16 27 36 15 27 49.12
100 10 5 Pennsylvania Avenue 12th Street 11th Street S 4 0 4 13 40 27 18 27 24 15 29 36 36 12 16 27 22 15 27 46.02
101 11 6 Pennsylvania Avenue 11th Street 10th Street N 4 0 4 13 40 27 18 27 24 15 29 36 36 12 16 27 22 15 27 46.02
102 12 6 Pennsylvania Avenue 11th Street 10th Street S 4 0 4 13 40 27 18 27 24 15 29 36 36 12 14 19 22 15 27 43.81
103 13 7 Pennsylvania Avenue 10th Street 9th Street N 4 0 4 13 40 27 18 27 24 15 29 36 36 12 14 27 22 15 27 45.58
104 14 7 Pennsylvania Avenue 10th Street 9th Street S 4 0 4 13 40 27 18 27 24 15 29 36 36 12 14 19 22 15 27 43.81
105 15 8 Pennsylvania Avenue 9th Street 8th Street N 4 0 4 13 40 27 18 27 24 15 29 36 36 12 16 27 22 15 27 46.02
106 16 8 Pennsylvania Avenue 9th Street 8th Street S 4 0 4 13 40 27 18 27 24 15 29 36 36 12 14 19 15 15 27 42.26
107 17 9 Pennsylvania Avenue 7th Street 6th Street N 4 0 4 13 40 27 18 27 24 15 29 36 36 12 16 27 22 15 27 46.02
108 18 9 Pennsylvania Avenue 7th Street 6th Street S 4 0 4 13 40 27 18 27 24 15 29 36 36 12 14 27 36 15 27 48.67

Pennsylvania Avenue BEQI ResultsAfter Conditions
Streets_Value_Dom
_ID Streets_IDIntersectio
ns_ID Primary Street Cross Street1 Cross Street 2Side_of_the_Street
Presence_of_Marked
_AreaWidth_of_Bike_Lane
Bicycle_Lane_markin
gs
Connectivity_of_Bicycle_Lanes
Pavement_Type_Co
nditionDriveway_
Cuts
Posted_Speed_Limi
t
PP_Adjacent_To_Lane_Route
Traffic_Calming_Fea
tures
Presence_of_Bicycle
_SignsPresence_of_Trees
Scale_Lightning
Line_of_Site
Bicycle_Parking
Retail_Use
Traffic_Volume
Percent_HeavyVehicl
esNo_of_La
nesStreetSlop
e BEQI
91 1 1 Pennsylvania Avenue 15th Street 14th Street N 11 36 36 13 40 27 18 27 24 36 29 36 36 12 14 27 36 15 27 69.91
94 4 1 Pennsylvania Avenue 15th Street 14th Street S 11 36 36 36 40 27 18 27 24 36 29 36 36 12 14 27 22 15 27 71.90
92 2 2 Pennsylvania Avenue 14th Street 13 1/2 Street N 11 36 36 36 40 27 18 27 24 36 29 15 36 12 14 27 36 15 27 70.35
93 3 2 Pennsylvania Avenue 14th Street 13 1/2 Street S 11 36 36 36 40 27 18 27 24 36 29 36 36 12 14 27 22 15 27 71.90
95 5 3 Pennsylvania Avenue 13 1/2 Street 13th Street N 11 29 36 36 40 27 18 27 24 36 29 15 36 12 14 27 36 15 27 68.81
96 6 3 Pennsylvania Avenue 13 1/2 Street 13th Street S 11 29 36 36 40 27 18 27 24 36 29 36 36 12 16 27 22 15 27 70.80
97 7 4 Pennsylvania Avenue 13th Street 12th Street N 11 36 36 36 40 27 18 27 24 36 29 36 36 12 16 27 36 15 27 75.44
98 8 4 Pennsylvania Avenue 13th Street 12th Street S 11 36 36 36 40 27 18 27 24 36 29 36 36 12 16 27 22 15 27 72.35
99 9 5 Pennsylvania Avenue 12th Street 11th Street N 11 36 36 36 40 27 18 27 24 36 29 36 36 12 16 27 36 15 27 75.44
100 10 5 Pennsylvania Avenue 12th Street 11th Street S 11 36 36 36 40 27 18 27 24 36 29 36 36 12 16 27 22 15 27 72.35
101 11 6 Pennsylvania Avenue 11th Street 10th Street N 11 36 36 36 40 27 18 27 24 36 29 36 36 12 16 27 22 15 27 72.35
102 12 6 Pennsylvania Avenue 11th Street 10th Street S 11 36 36 36 40 27 18 27 24 36 29 36 36 12 14 19 22 15 27 70.13
103 13 7 Pennsylvania Avenue 10th Street 9th Street N 11 36 36 36 40 27 18 27 24 36 29 36 36 12 14 27 22 15 27 71.90
104 14 7 Pennsylvania Avenue 10th Street 9th Street S 11 36 36 36 40 27 18 27 24 36 29 36 36 12 14 19 22 15 27 70.13
105 15 8 Pennsylvania Avenue 9th Street 8th Street N 11 36 36 36 40 27 18 27 24 36 29 36 36 12 16 27 22 15 27 72.35
106 16 8 Pennsylvania Avenue 9th Street 8th Street S 11 36 36 36 40 27 18 27 24 36 29 36 36 12 14 19 15 15 27 68.58
107 17 9 Pennsylvania Avenue 7th Street 6th Street N 11 36 36 36 40 27 18 27 24 36 29 36 36 12 16 27 22 15 27 72.35
108 18 9 Pennsylvania Avenue 7th Street 6th Street S 11 36 36 36 40 27 18 27 24 36 29 36 36 12 14 27 36 15 27 75.00
Appendix B6 Pennsylvania Avenue: Bicycle Progression Analysis
Data

Bicycle Progression Analysis Data
Street Section DirectionTime
PeriodAnalysis Bike Speed
(mph)
Average of Total
Distance (ft)
Average Bike Speed (mph)
Average Number of
Times Stopped
Average Time Stopped
(seconds)
Pennsylvania Avenue
10th Street to 15th Street
Eastbound AM 10 2249 6.5 1.5 83.0
15 2249 15.0 0.0 0.0PM 10 2249 6.3 2.5 91.0
15 2249 11.2 1.0 35.0Westbound AM 10 2249 6.3 3.0 91.0
15 2249 8.4 2.3 87.3PM 10 2249 5.3 3.0 137.0
15 2249 12.9 2.0 89.03rd Street to 9th
StreetEastbound AM 10 2642 5.1 5.0 173.0
15 2642 6.2 5.5 178.0PM 10 2642 7.5 3.0 63.0
15 2642 15.0 0.0 0.0Westbound AM 10 2642 6.3 3.0 104.0
15 2642 8.6 2.3 98.8PM 10 2642 5.0 4.3 181.7
15 2642 7.5 3.0 119.0
15th StreetLower E Street
to I StreetNorthbound AM 10 2144 6.8 4.0 70.0
15 2144 11.8 1.0 26.0PM 10 2144 6.0 4.0 96.0
15 2144 11.7 1.5 36.5Southbound AM 10 2144 6.7 2.0 72.0
15 2144 14.9 0.0 0.0PM 10 2144 8.7 2.0 22.0
15 2144 10.3 1.0 45.0I Street to
Rhode Island Northbound AM 10 2425 5.2 4.0 154.0
15 2425 7.1 3.0 122.0PM 10 2425 6.6 2.0 83.0
15 2425 6.6 2.0 139.0Southbound AM 10 2425 4.4 4.0 214.0
15 2425 5.9 3.0 170.0PM 10 2425 3.7 5.0 285.0
15 2425 4.2 4.5 290.5Rhode Island Avenue to U
StreetNorthbound AM 10 3156 4.5 4.0 261.0
15 3156 7.6 2.0 139.5PM 10 3156 5.5 3.0 174.0
15 3156 7.4 2.0 146.0Southbound AM 10 3156 4.1 6.0 306.0
15 3156 5.9 4.5 229.5PM 10 3156 4.2 6.0 295.0
15 3156 6.9 4.0 168.0


Appendix B7 Pennsylvania Avenue: Arterial LOS Reports

Arterial Level of Service3/2/2012
Pennsylvania Ave 7:00 am 10/25/2009 AM Peak Hour - Before Installation of Bicycle Facilities Synchro 7 - ReportSWA Page 1
Arterial Level of Service: EB PENNSYLVANIA AVE #1
Arterial Flow Running Signal Travel Dist Arterial ArterialCross Street Class Speed Time Delay Time (s) (mi) Speed LOS14TH ST IV 25 19.9 34.4 54.3 0.09 6.0 F13 1/2 ST IV 25 17.8 10.4 28.2 0.07 8.6 E13TH ST IV 25 15.9 8.7 24.6 0.06 8.8 E12TH ST IV 25 19.1 12.7 31.8 0.09 9.8 D11TH ST IV 25 15.7 1.3 17.0 0.06 12.6 D10TH ST IV 25 16.5 5.3 21.8 0.06 10.3 DTotal IV 104.9 72.8 177.7 0.43 8.6 E
Arterial Level of Service: WB PENNSYLVANIA AVE #1
Arterial Flow Running Signal Travel Dist Arterial ArterialCross Street Class Speed Time Delay Time (s) (mi) Speed LOS11TH ST IV 25 16.5 6.7 23.2 0.06 9.7 D12TH ST IV 25 15.7 23.2 38.9 0.06 5.5 F13TH ST IV 25 19.1 15.0 34.1 0.09 9.2 D13 1/2 ST IV 25 15.9 0.8 16.7 0.06 12.9 D14TH ST IV 25 17.8 4.0 21.8 0.07 11.1 D15TH ST IV 25 19.9 80.5 100.4 0.09 3.2 FTotal IV 104.9 130.2 235.1 0.43 6.5 F
Arterial Level of Service: EB PENNSYLVANIA AVE #2
Arterial Flow Running Signal Travel Dist Arterial ArterialCross Street Class Speed Time Delay Time (s) (mi) Speed LOS9TH ST IV 25 25.6 12.3 37.9 0.12 11.1 D7TH ST IV 25 25.8 11.8 37.6 0.12 11.2 D6TH ST IV 25 25.0 5.8 30.8 0.11 13.3 CTotal IV 76.4 29.9 106.3 0.35 11.8 D
Arterial Level of Service: WB PENNSYLVANIA AVE #2
Arterial Flow Running Signal Travel Dist Arterial ArterialCross Street Class Speed Time Delay Time (s) (mi) Speed LOS7TH ST IV 25 25.0 10.7 35.7 0.11 11.5 D9TH ST IV 25 25.8 8.5 34.3 0.12 12.3 D10TH ST IV 25 25.6 1.9 27.5 0.12 15.2 CTotal IV 76.4 21.1 97.5 0.35 12.8 D

Arterial Level of Service3/2/2012
Pennsylvania Ave 5:00 pm 10/25/2009 PM Peak Hour - Before Installation of Bicycle Facilities Synchro 7 - ReportSWA Page 1
Arterial Level of Service: EB PENNSYLVANIA AVE #1
Arterial Flow Running Signal Travel Dist Arterial ArterialCross Street Class Speed Time Delay Time (s) (mi) Speed LOS14TH ST IV 25 19.9 30.6 50.5 0.09 6.5 F13 1/2 ST IV 25 17.8 15.9 33.7 0.07 7.2 E13TH ST IV 25 15.9 10.7 26.6 0.06 8.1 E12TH ST IV 25 19.1 29.3 48.4 0.09 6.5 F11TH ST IV 25 15.7 4.8 20.5 0.06 10.4 D10TH ST IV 25 16.5 9.0 25.5 0.06 8.8 ETotal IV 104.9 100.3 205.2 0.43 7.5 E
Arterial Level of Service: WB PENNSYLVANIA AVE #1
Arterial Flow Running Signal Travel Dist Arterial ArterialCross Street Class Speed Time Delay Time (s) (mi) Speed LOS11TH ST IV 25 16.5 8.0 24.5 0.06 9.2 D12TH ST IV 25 15.7 8.3 24.0 0.06 8.9 E13TH ST IV 25 19.1 7.4 26.5 0.09 11.8 D13 1/2 ST IV 25 15.9 7.5 23.4 0.06 9.2 D14TH ST IV 25 17.8 60.6 78.4 0.07 3.1 F15TH ST IV 25 19.9 21.8 41.7 0.09 7.8 ETotal IV 104.9 113.6 218.5 0.43 7.0 E
Arterial Level of Service: EB PENNSYLVANIA AVE #2
Arterial Flow Running Signal Travel Dist Arterial ArterialCross Street Class Speed Time Delay Time (s) (mi) Speed LOS9TH ST IV 25 25.6 28.9 54.5 0.12 7.7 E7TH ST IV 25 25.8 16.7 42.5 0.12 9.9 D6TH ST IV 25 25.0 10.4 35.4 0.11 11.6 DTotal IV 76.4 56.0 132.4 0.35 9.4 D
Arterial Level of Service: WB PENNSYLVANIA AVE #2
Arterial Flow Running Signal Travel Dist Arterial ArterialCross Street Class Speed Time Delay Time (s) (mi) Speed LOS7TH ST IV 25 25.0 6.7 31.7 0.11 12.9 D9TH ST IV 25 25.8 9.9 35.7 0.12 11.8 D10TH ST IV 25 25.6 2.9 28.5 0.12 14.7 CTotal IV 76.4 19.5 95.9 0.35 13.0 C

Arterial Level of Service3/2/2012
Pennsylvania Ave 9/6/2011 AM Peak Hour - After Installation of Bicycle Facilities Synchro 7 - ReportPage 1
Arterial Level of Service: EB PENNSYLVANIA AVE #1
Arterial Flow Running Signal Travel Dist Arterial ArterialCross Street Class Speed Time Delay Time (s) (mi) Speed LOS14TH ST IV 25 19.9 23.4 43.3 0.09 7.5 E13 1/2 ST IV 25 17.8 2.3 20.1 0.07 12.0 D13TH ST IV 25 15.9 19.5 35.4 0.06 6.1 F12TH ST IV 25 19.1 8.1 27.2 0.09 11.5 D11TH ST IV 25 15.7 9.4 25.1 0.06 8.5 E10TH ST IV 25 16.5 7.5 24.0 0.06 9.3 DTotal IV 104.9 70.2 175.1 0.43 8.8 E
Arterial Level of Service: WB PENNSYLVANIA AVE #1
Arterial Flow Running Signal Travel Dist Arterial ArterialCross Street Class Speed Time Delay Time (s) (mi) Speed LOS11TH ST IV 25 16.5 5.9 22.4 0.06 10.0 D12TH ST IV 25 15.7 24.3 40.0 0.06 5.3 F13TH ST IV 25 19.1 22.0 41.1 0.09 7.6 E13 1/2 ST IV 25 15.9 2.8 18.7 0.06 11.5 D14TH ST IV 25 17.8 28.4 46.2 0.07 5.2 F15TH ST IV 25 19.9 25.9 45.8 0.09 7.1 ETotal IV 104.9 109.3 214.2 0.43 7.2 E
Arterial Level of Service: EB PENNSYLVANIA AVE #2
Arterial Flow Running Signal Travel Dist Arterial ArterialCross Street Class Speed Time Delay Time (s) (mi) Speed LOS9TH ST IV 25 25.6 37.6 63.2 0.12 6.6 F7TH ST IV 25 25.8 33.9 59.7 0.12 7.1 E6TH ST IV 25 25.0 20.5 45.5 0.11 9.0 DTotal IV 76.4 92.0 168.4 0.35 7.4 E
Arterial Level of Service: WB PENNSYLVANIA AVE #2
Arterial Flow Running Signal Travel Dist Arterial ArterialCross Street Class Speed Time Delay Time (s) (mi) Speed LOS7TH ST IV 25 25.0 6.9 31.9 0.11 12.8 D9TH ST IV 25 25.8 7.1 32.9 0.12 12.8 D10TH ST IV 25 25.6 1.1 26.7 0.12 15.7 CTotal IV 76.4 15.1 91.5 0.35 13.7 C

Arterial Level of Service3/2/2012
Pennsylvania Ave 5:00 pm 10/25/2009 PM Peak Hour - After Installation of Bicycle Facilities Synchro 7 - ReportSWA Page 1
Arterial Level of Service: EB PENNSYLVANIA AVE #1
Arterial Flow Running Signal Travel Dist Arterial ArterialCross Street Class Speed Time Delay Time (s) (mi) Speed LOS14TH ST IV 25 19.9 29.6 49.5 0.09 6.6 F13 1/2 ST IV 25 17.8 9.9 27.7 0.07 8.7 E13TH ST IV 25 15.9 11.2 27.1 0.06 8.0 E12TH ST IV 25 19.1 2.9 22.0 0.09 14.2 C11TH ST IV 25 15.7 5.6 21.3 0.06 10.0 D10TH ST IV 25 16.5 11.4 27.9 0.06 8.0 ETotal IV 104.9 70.6 175.5 0.43 8.7 E
Arterial Level of Service: WB PENNSYLVANIA AVE #1
Arterial Flow Running Signal Travel Dist Arterial ArterialCross Street Class Speed Time Delay Time (s) (mi) Speed LOS11TH ST IV 25 16.5 5.6 22.1 0.06 10.2 D12TH ST IV 25 15.7 6.9 22.6 0.06 9.4 D13TH ST IV 25 19.1 6.2 25.3 0.09 12.4 D13 1/2 ST IV 25 15.9 16.8 32.7 0.06 6.6 F14TH ST IV 25 17.8 29.9 47.7 0.07 5.1 F15TH ST IV 25 19.9 23.9 43.8 0.09 7.4 ETotal IV 104.9 89.3 194.2 0.43 7.9 E
Arterial Level of Service: EB PENNSYLVANIA AVE #2
Arterial Flow Running Signal Travel Dist Arterial ArterialCross Street Class Speed Time Delay Time (s) (mi) Speed LOS9TH ST IV 25 25.6 41.6 67.2 0.12 6.2 F7TH ST IV 25 25.8 8.6 34.4 0.12 12.3 D6TH ST IV 25 25.0 4.8 29.8 0.11 13.8 CTotal IV 76.4 55.0 131.4 0.35 9.5 D
Arterial Level of Service: WB PENNSYLVANIA AVE #2
Arterial Flow Running Signal Travel Dist Arterial ArterialCross Street Class Speed Time Delay Time (s) (mi) Speed LOS7TH ST IV 25 25.0 19.5 44.5 0.11 9.2 D9TH ST IV 25 25.8 13.0 38.8 0.12 10.9 D10TH ST IV 25 25.6 7.4 33.0 0.12 12.7 DTotal IV 76.4 39.9 116.3 0.35 10.8 D

Appendix B8 Pennsylvania Avenue: Crash Data

Pedestrian Action #ACC %In Crosswalk with Signal: 50.0%1In Crosswalk against Signal: 0.0%0In Crosswalk no Signal: 0.0%0In Unmarked Crosswalk: 0.0%0Not in Crosswalk: 0.0%0From Between Parked Cars: 0.0%0Unspecified: 50.0%1
Contributing Factor #VEH %Driver: Speed: 0.0%0Driver: Alcohol/Drug: 0.0%0Driver: Electronic Device: 1.3%1Driver: Others: 21.5%17Vehicle: 1.3%1Roadway: 0.0%0Unspecified: 75.9%60
Light Condition #ACC %Daylight: 83.3%35Dawn/Dusk: 0.0%0Dark(Lighted): 0.0%3Dark(Not Lighted): 0.0%0Dark(Unknown Lighting): 7.1%3Unspecified: 2.4%1
Accident Severity Type #ACC %Fatal Collision: 0.0%0Injury Collision: 21.4%9PDO Collision: 78.6%33
Type of Vehicle #VEH %Passenger Car: 54.4%43Bus: 13.9%11Truck: 6.3%5Taxi: 19.0%15Minivan: 0.0%0Police/Emergency Vehicle: 2.5%2Motorcycle/Moped: 1.3%1Bicycle: 2.5%2Fixed Object: 0.0%0Unspecified: 0.0%0
Surface Condition #ACC %Dry: 85.7%36Wet: 11.9%5Snow/Ice: 2.4%1Slush: 0.0%0Water/Sand: 0.0%0Repairing: 0.0%0Unspecified: 0.0%0
Weather Condition #ACC %Clear: 78.6%33Rain: 11.9%5Snow: 2.4%1Sleet/Hail: 0.0%0Fog/Mist: 0.0%0Crosswind/Blowing Sand: 0.0%0Unspecified: 7.1%3
Day of Week #ACC %Sunday: 2.4%1Monday: 16.7%7Tuesday: 16.7%7Wednesday: 16.7%7Thursday: 9.5%4Friday: 19.0%8Saturday: 19.0%8
Time of Day #ACC %
07:30 ~ 09:30: 11.9%509:30 ~ 11:30: 26.2%1111:30 ~ 13:30: 7.1%313:30 ~ 16:00: 21.4%9
16:00 ~18:30: 11.9%518:30 ~ 07:30: 21.4%9Unspecified: 0.0%0
DC Department of Transportation - Traffic Accident Reporting and Analysis System
Accident Summary Report (R-7)
Total Number of Accident:
Total Number of Injuries:Total Number of Disabling Injuries:Total Number of NonDisabling Injuries:Total Number of Pedestrians Involved:Total Number of Bicycles Involved:Total Number of Motorcycles Involved:
Total Number of Fatalities:42
010
15221
Time Period Covered:
Intersection:
Collision Type #ACC % Collision Type #ACC %Right Angle: 5 11.9% Fixed Object: 1 2.4%Left Turn: 4 9.5% Ran Off Road: 0 0.0%Right Turn: 1 2.4% Ped. Involved: 3 7.1%Rear End: 2 4.8% Backing: 2 4.8%Side Swiped: 17 40.5% Non Collision: 0 0.0%Head On: 0 0.0% Under/Over Ride: 0 0.0%Parked: 2 4.8% Unspecified: 5 11.9%
admin TARAS 12/15/2011
PENNSYLVANIA AVE and SIXTH ST, NW
From 07/01/2006 To 06/30/2010 Prepared Date:Prepared By:
4 Records are not approved as of 12/15/2011 2:46:58 PM

Pedestrian Action #ACC %In Crosswalk with Signal: 33.3%2In Crosswalk against Signal: 16.7%1In Crosswalk no Signal: 0.0%0In Unmarked Crosswalk: 0.0%0Not in Crosswalk: 0.0%0From Between Parked Cars: 16.7%1Unspecified: 33.3%2
Contributing Factor #VEH %Driver: Speed: 2.0%2Driver: Alcohol/Drug: 0.0%0Driver: Electronic Device: 0.0%0Driver: Others: 29.6%29Vehicle: 0.0%0Roadway: 2.0%2Unspecified: 66.3%65
Light Condition #ACC %Daylight: 72.7%40Dawn/Dusk: 5.5%3Dark(Lighted): 0.0%5Dark(Not Lighted): 0.0%0Dark(Unknown Lighting): 12.7%7Unspecified: 0.0%0
Accident Severity Type #ACC %Fatal Collision: 1.8%1Injury Collision: 27.3%15PDO Collision: 70.9%39
Type of Vehicle #VEH %Passenger Car: 55.1%54Bus: 23.5%23Truck: 5.1%5Taxi: 11.2%11Minivan: 0.0%0Police/Emergency Vehicle: 0.0%0Motorcycle/Moped: 1.0%1Bicycle: 3.1%3Fixed Object: 1.0%1Unspecified: 0.0%0
Surface Condition #ACC %Dry: 78.2%43Wet: 16.4%9Snow/Ice: 1.8%1Slush: 0.0%0Water/Sand: 0.0%0Repairing: 0.0%0Unspecified: 3.6%2
Weather Condition #ACC %Clear: 81.8%45Rain: 12.7%7Snow: 1.8%1Sleet/Hail: 0.0%0Fog/Mist: 0.0%0Crosswind/Blowing Sand: 0.0%0Unspecified: 3.6%2
Day of Week #ACC %Sunday: 5.5%3Monday: 16.4%9Tuesday: 20.0%11Wednesday: 27.3%15Thursday: 12.7%7Friday: 10.9%6Saturday: 7.3%4
Time of Day #ACC %
07:30 ~ 09:30: 14.5%809:30 ~ 11:30: 14.5%811:30 ~ 13:30: 3.6%213:30 ~ 16:00: 14.5%8
16:00 ~18:30: 34.5%1918:30 ~ 07:30: 18.2%10Unspecified: 0.0%0
DC Department of Transportation - Traffic Accident Reporting and Analysis System
Accident Summary Report (R-7)
Total Number of Accident:
Total Number of Injuries:Total Number of Disabling Injuries:Total Number of NonDisabling Injuries:Total Number of Pedestrians Involved:Total Number of Bicycles Involved:Total Number of Motorcycles Involved:
Total Number of Fatalities:55
220
06731
Time Period Covered:
Intersection:
Collision Type #ACC % Collision Type #ACC %Right Angle: 2 3.6% Fixed Object: 3 5.5%Left Turn: 6 10.9% Ran Off Road: 0 0.0%Right Turn: 7 12.7% Ped. Involved: 8 14.5%Rear End: 10 18.2% Backing: 1 1.8%Side Swiped: 16 29.1% Non Collision: 0 0.0%Head On: 0 0.0% Under/Over Ride: 0 0.0%Parked: 0 0.0% Unspecified: 2 3.6%
admin TARAS 12/15/2011
PENNSYLVANIA AVE and SEVENTH ST, NW
From 07/01/2006 To 06/30/2010 Prepared Date:Prepared By:
9 Records are not approved as of 12/15/2011 2:47:45 PM

Pedestrian Action #ACC %In Crosswalk with Signal: 70.0%7In Crosswalk against Signal: 10.0%1In Crosswalk no Signal: 0.0%0In Unmarked Crosswalk: 0.0%0Not in Crosswalk: 10.0%1From Between Parked Cars: 0.0%0Unspecified: 10.0%1
Contributing Factor #VEH %Driver: Speed: 0.8%1Driver: Alcohol/Drug: 1.7%2Driver: Electronic Device: 0.0%0Driver: Others: 30.8%37Vehicle: 0.0%0Roadway: 0.8%1Unspecified: 65.8%79
Light Condition #ACC %Daylight: 62.1%41Dawn/Dusk: 6.1%4Dark(Lighted): 0.0%10Dark(Not Lighted): 0.0%0Dark(Unknown Lighting): 15.2%10Unspecified: 1.5%1
Accident Severity Type #ACC %Fatal Collision: 0.0%0Injury Collision: 36.4%24PDO Collision: 63.6%42
Type of Vehicle #VEH %Passenger Car: 65.8%79Bus: 9.2%11Truck: 3.3%4Taxi: 12.5%15Minivan: 0.0%0Police/Emergency Vehicle: 2.5%3Motorcycle/Moped: 0.0%0Bicycle: 0.0%0Fixed Object: 0.0%0Unspecified: 6.7%8
Surface Condition #ACC %Dry: 78.8%52Wet: 15.2%10Snow/Ice: 3.0%2Slush: 0.0%0Water/Sand: 0.0%0Repairing: 0.0%0Unspecified: 3.0%2
Weather Condition #ACC %Clear: 78.8%52Rain: 15.2%10Snow: 3.0%2Sleet/Hail: 0.0%0Fog/Mist: 1.5%1Crosswind/Blowing Sand: 0.0%0Unspecified: 1.5%1
Day of Week #ACC %Sunday: 13.6%9Monday: 16.7%11Tuesday: 12.1%8Wednesday: 15.2%10Thursday: 19.7%13Friday: 12.1%8Saturday: 10.6%7
Time of Day #ACC %
07:30 ~ 09:30: 7.6%509:30 ~ 11:30: 9.1%611:30 ~ 13:30: 15.2%1013:30 ~ 16:00: 9.1%6
16:00 ~18:30: 25.8%1718:30 ~ 07:30: 33.3%22Unspecified: 0.0%0
DC Department of Transportation - Traffic Accident Reporting and Analysis System
Accident Summary Report (R-7)
Total Number of Accident:
Total Number of Injuries:Total Number of Disabling Injuries:Total Number of NonDisabling Injuries:Total Number of Pedestrians Involved:Total Number of Bicycles Involved:Total Number of Motorcycles Involved:
Total Number of Fatalities:66
027
27
1000
Time Period Covered:
Intersection:
Collision Type #ACC % Collision Type #ACC %Right Angle: 9 13.6% Fixed Object: 1 1.5%Left Turn: 2 3.0% Ran Off Road: 0 0.0%Right Turn: 7 10.6% Ped. Involved: 12 18.2%Rear End: 10 15.2% Backing: 1 1.5%Side Swiped: 17 25.8% Non Collision: 0 0.0%Head On: 1 1.5% Under/Over Ride: 0 0.0%Parked: 1 1.5% Unspecified: 5 7.6%
admin TARAS 12/15/2011
PENNSYLVANIA AVE and NINTH ST, NW
From 07/01/2006 To 06/30/2010 Prepared Date:Prepared By:
3 Records are not approved as of 12/15/2011 2:48:24 PM

Pedestrian Action #ACC %In Crosswalk with Signal: 50.0%2In Crosswalk against Signal: 25.0%1In Crosswalk no Signal: 0.0%0In Unmarked Crosswalk: 0.0%0Not in Crosswalk: 25.0%1From Between Parked Cars: 0.0%0Unspecified: 0.0%0
Contributing Factor #VEH %Driver: Speed: 0.0%0Driver: Alcohol/Drug: 0.0%0Driver: Electronic Device: 0.0%0Driver: Others: 29.3%12Vehicle: 0.0%0Roadway: 0.0%0Unspecified: 70.7%29
Light Condition #ACC %Daylight: 69.6%16Dawn/Dusk: 4.3%1Dark(Lighted): 0.0%2Dark(Not Lighted): 0.0%0Dark(Unknown Lighting): 17.4%4Unspecified: 0.0%0
Accident Severity Type #ACC %Fatal Collision: 0.0%0Injury Collision: 30.4%7PDO Collision: 69.6%16
Type of Vehicle #VEH %Passenger Car: 61.0%25Bus: 14.6%6Truck: 2.4%1Taxi: 14.6%6Minivan: 0.0%0Police/Emergency Vehicle: 2.4%1Motorcycle/Moped: 0.0%0Bicycle: 2.4%1Fixed Object: 0.0%0Unspecified: 2.4%1
Surface Condition #ACC %Dry: 65.2%15Wet: 34.8%8Snow/Ice: 0.0%0Slush: 0.0%0Water/Sand: 0.0%0Repairing: 0.0%0Unspecified: 0.0%0
Weather Condition #ACC %Clear: 65.2%15Rain: 34.8%8Snow: 0.0%0Sleet/Hail: 0.0%0Fog/Mist: 0.0%0Crosswind/Blowing Sand: 0.0%0Unspecified: 0.0%0
Day of Week #ACC %Sunday: 8.7%2Monday: 13.0%3Tuesday: 17.4%4Wednesday: 13.0%3Thursday: 13.0%3Friday: 30.4%7Saturday: 4.3%1
Time of Day #ACC %
07:30 ~ 09:30: 13.0%309:30 ~ 11:30: 8.7%211:30 ~ 13:30: 13.0%313:30 ~ 16:00: 17.4%4
16:00 ~18:30: 21.7%518:30 ~ 07:30: 26.1%6Unspecified: 0.0%0
DC Department of Transportation - Traffic Accident Reporting and Analysis System
Accident Summary Report (R-7)
Total Number of Accident:
Total Number of Injuries:Total Number of Disabling Injuries:Total Number of NonDisabling Injuries:Total Number of Pedestrians Involved:Total Number of Bicycles Involved:Total Number of Motorcycles Involved:
Total Number of Fatalities:23
0800410
Time Period Covered:
Intersection:
Collision Type #ACC % Collision Type #ACC %Right Angle: 2 8.7% Fixed Object: 1 4.3%Left Turn: 0 0.0% Ran Off Road: 0 0.0%Right Turn: 0 0.0% Ped. Involved: 4 17.4%Rear End: 10 43.5% Backing: 0 0.0%Side Swiped: 6 26.1% Non Collision: 0 0.0%Head On: 0 0.0% Under/Over Ride: 0 0.0%Parked: 0 0.0% Unspecified: 0 0.0%
admin TARAS 12/15/2011
PENNSYLVANIA AVE and TENTH ST, NW
From 07/01/2006 To 06/30/2010 Prepared Date:Prepared By:
2 Records are not approved as of 12/15/2011 2:49:55 PM

Pedestrian Action #ACC %In Crosswalk with Signal: 0.0%0In Crosswalk against Signal: 0.0%0In Crosswalk no Signal: 0.0%0In Unmarked Crosswalk: 0.0%0Not in Crosswalk: 100.0%1From Between Parked Cars: 0.0%0Unspecified: 0.0%0
Contributing Factor #VEH %Driver: Speed: 2.7%2Driver: Alcohol/Drug: 0.0%0Driver: Electronic Device: 0.0%0Driver: Others: 21.3%16Vehicle: 1.3%1Roadway: 0.0%0Unspecified: 74.7%56
Light Condition #ACC %Daylight: 74.4%29Dawn/Dusk: 2.6%1Dark(Lighted): 0.0%4Dark(Not Lighted): 0.0%0Dark(Unknown Lighting): 12.8%5Unspecified: 0.0%0
Accident Severity Type #ACC %Fatal Collision: 0.0%0Injury Collision: 10.3%4PDO Collision: 89.7%35
Type of Vehicle #VEH %Passenger Car: 61.3%46Bus: 17.3%13Truck: 1.3%1Taxi: 13.3%10Minivan: 0.0%0Police/Emergency Vehicle: 0.0%0Motorcycle/Moped: 0.0%0Bicycle: 0.0%0Fixed Object: 0.0%0Unspecified: 6.7%5
Surface Condition #ACC %Dry: 71.8%28Wet: 20.5%8Snow/Ice: 0.0%0Slush: 0.0%0Water/Sand: 0.0%0Repairing: 0.0%0Unspecified: 7.7%3
Weather Condition #ACC %Clear: 82.1%32Rain: 12.8%5Snow: 0.0%0Sleet/Hail: 0.0%0Fog/Mist: 2.6%1Crosswind/Blowing Sand: 0.0%0Unspecified: 2.6%1
Day of Week #ACC %Sunday: 5.1%2Monday: 10.3%4Tuesday: 28.2%11Wednesday: 15.4%6Thursday: 5.1%2Friday: 17.9%7Saturday: 17.9%7
Time of Day #ACC %
07:30 ~ 09:30: 5.1%209:30 ~ 11:30: 7.7%311:30 ~ 13:30: 10.3%413:30 ~ 16:00: 20.5%8
16:00 ~18:30: 28.2%1118:30 ~ 07:30: 28.2%11Unspecified: 0.0%0
DC Department of Transportation - Traffic Accident Reporting and Analysis System
Accident Summary Report (R-7)
Total Number of Accident:
Total Number of Injuries:Total Number of Disabling Injuries:Total Number of NonDisabling Injuries:Total Number of Pedestrians Involved:Total Number of Bicycles Involved:Total Number of Motorcycles Involved:
Total Number of Fatalities:39
0602100
Time Period Covered:
Intersection:
Collision Type #ACC % Collision Type #ACC %Right Angle: 3 7.7% Fixed Object: 2 5.1%Left Turn: 4 10.3% Ran Off Road: 0 0.0%Right Turn: 4 10.3% Ped. Involved: 1 2.6%Rear End: 7 17.9% Backing: 1 2.6%Side Swiped: 10 25.6% Non Collision: 0 0.0%Head On: 1 2.6% Under/Over Ride: 0 0.0%Parked: 5 12.8% Unspecified: 1 2.6%
admin TARAS 12/15/2011
PENNSYLVANIA AVE and ELEVENTH ST, NW
From 07/01/2006 To 06/30/2010 Prepared Date:Prepared By:
0 Records are not approved as of 12/15/2011 2:50:51 PM

Pedestrian Action #ACC %In Crosswalk with Signal: 33.3%1In Crosswalk against Signal: 0.0%0In Crosswalk no Signal: 0.0%0In Unmarked Crosswalk: 0.0%0Not in Crosswalk: 0.0%0From Between Parked Cars: 33.3%1Unspecified: 33.3%1
Contributing Factor #VEH %Driver: Speed: 0.0%0Driver: Alcohol/Drug: 0.0%0Driver: Electronic Device: 0.0%0Driver: Others: 20.8%16Vehicle: 0.0%0Roadway: 0.0%0Unspecified: 79.2%61
Light Condition #ACC %Daylight: 84.6%33Dawn/Dusk: 2.6%1Dark(Lighted): 0.0%0Dark(Not Lighted): 0.0%0Dark(Unknown Lighting): 10.3%4Unspecified: 2.6%1
Accident Severity Type #ACC %Fatal Collision: 0.0%0Injury Collision: 15.4%6PDO Collision: 84.6%33
Type of Vehicle #VEH %Passenger Car: 59.7%46Bus: 6.5%5Truck: 7.8%6Taxi: 14.3%11Minivan: 0.0%0Police/Emergency Vehicle: 2.6%2Motorcycle/Moped: 1.3%1Bicycle: 1.3%1Fixed Object: 0.0%0Unspecified: 6.5%5
Surface Condition #ACC %Dry: 84.6%33Wet: 7.7%3Snow/Ice: 2.6%1Slush: 0.0%0Water/Sand: 0.0%0Repairing: 0.0%0Unspecified: 5.1%2
Weather Condition #ACC %Clear: 84.6%33Rain: 7.7%3Snow: 0.0%0Sleet/Hail: 0.0%0Fog/Mist: 0.0%0Crosswind/Blowing Sand: 0.0%0Unspecified: 7.7%3
Day of Week #ACC %Sunday: 0.0%0Monday: 10.3%4Tuesday: 15.4%6Wednesday: 41.0%16Thursday: 15.4%6Friday: 15.4%6Saturday: 2.6%1
Time of Day #ACC %
07:30 ~ 09:30: 15.4%609:30 ~ 11:30: 10.3%411:30 ~ 13:30: 23.1%913:30 ~ 16:00: 20.5%8
16:00 ~18:30: 17.9%718:30 ~ 07:30: 12.8%5Unspecified: 0.0%0
DC Department of Transportation - Traffic Accident Reporting and Analysis System
Accident Summary Report (R-7)
Total Number of Accident:
Total Number of Injuries:Total Number of Disabling Injuries:Total Number of NonDisabling Injuries:Total Number of Pedestrians Involved:Total Number of Bicycles Involved:Total Number of Motorcycles Involved:
Total Number of Fatalities:39
012
11310
Time Period Covered:
Intersection:
Collision Type #ACC % Collision Type #ACC %Right Angle: 6 15.4% Fixed Object: 0 0.0%Left Turn: 0 0.0% Ran Off Road: 0 0.0%Right Turn: 4 10.3% Ped. Involved: 5 12.8%Rear End: 8 20.5% Backing: 3 7.7%Side Swiped: 7 17.9% Non Collision: 0 0.0%Head On: 0 0.0% Under/Over Ride: 0 0.0%Parked: 4 10.3% Unspecified: 2 5.1%
admin TARAS 12/15/2011
PENNSYLVANIA AVE and TWELFTH ST, NW
From 07/01/2006 To 06/30/2010 Prepared Date:Prepared By:
2 Records are not approved as of 12/15/2011 2:51:23 PM

Pedestrian Action #ACC %In Crosswalk with Signal: 0.0%0In Crosswalk against Signal: 0.0%0In Crosswalk no Signal: 0.0%0In Unmarked Crosswalk: 0.0%0Not in Crosswalk: 0.0%0From Between Parked Cars: 0.0%0Unspecified: 0.0%0
Contributing Factor #VEH %Driver: Speed: 0.0%0Driver: Alcohol/Drug: 0.0%0Driver: Electronic Device: 0.0%0Driver: Others: 12.5%2Vehicle: 0.0%0Roadway: 0.0%0Unspecified: 87.5%14
Light Condition #ACC %Daylight: 75.0%6Dawn/Dusk: 0.0%0Dark(Lighted): 0.0%2Dark(Not Lighted): 0.0%0Dark(Unknown Lighting): 0.0%0Unspecified: 0.0%0
Accident Severity Type #ACC %Fatal Collision: 0.0%0Injury Collision: 12.5%1PDO Collision: 87.5%7
Type of Vehicle #VEH %Passenger Car: 56.3%9Bus: 12.5%2Truck: 0.0%0Taxi: 18.8%3Minivan: 0.0%0Police/Emergency Vehicle: 0.0%0Motorcycle/Moped: 0.0%0Bicycle: 0.0%0Fixed Object: 0.0%0Unspecified: 12.5%2
Surface Condition #ACC %Dry: 87.5%7Wet: 12.5%1Snow/Ice: 0.0%0Slush: 0.0%0Water/Sand: 0.0%0Repairing: 0.0%0Unspecified: 0.0%0
Weather Condition #ACC %Clear: 87.5%7Rain: 12.5%1Snow: 0.0%0Sleet/Hail: 0.0%0Fog/Mist: 0.0%0Crosswind/Blowing Sand: 0.0%0Unspecified: 0.0%0
Day of Week #ACC %Sunday: 0.0%0Monday: 12.5%1Tuesday: 12.5%1Wednesday: 25.0%2Thursday: 12.5%1Friday: 12.5%1Saturday: 25.0%2
Time of Day #ACC %
07:30 ~ 09:30: 25.0%209:30 ~ 11:30: 0.0%011:30 ~ 13:30: 0.0%013:30 ~ 16:00: 25.0%2
16:00 ~18:30: 37.5%318:30 ~ 07:30: 12.5%1Unspecified: 0.0%0
DC Department of Transportation - Traffic Accident Reporting and Analysis System
Accident Summary Report (R-7)
Total Number of Accident:
Total Number of Injuries:Total Number of Disabling Injuries:Total Number of NonDisabling Injuries:Total Number of Pedestrians Involved:Total Number of Bicycles Involved:Total Number of Motorcycles Involved:
Total Number of Fatalities:80100000
Time Period Covered:
Intersection:
Collision Type #ACC % Collision Type #ACC %Right Angle: 0 0.0% Fixed Object: 0 0.0%Left Turn: 0 0.0% Ran Off Road: 0 0.0%Right Turn: 2 25.0% Ped. Involved: 0 0.0%Rear End: 1 12.5% Backing: 1 12.5%Side Swiped: 4 50.0% Non Collision: 0 0.0%Head On: 0 0.0% Under/Over Ride: 0 0.0%Parked: 0 0.0% Unspecified: 0 0.0%
admin TARAS 12/15/2011
PENNSYLVANIA AVE and THIRTEENTH ST, NW
From 07/01/2006 To 06/30/2010 Prepared Date:Prepared By:
2 Records are not approved as of 12/15/2011 2:52:22 PM

Pedestrian Action #ACC %In Crosswalk with Signal: 0.0%0In Crosswalk against Signal: 0.0%0In Crosswalk no Signal: 0.0%0In Unmarked Crosswalk: 0.0%0Not in Crosswalk: 0.0%0From Between Parked Cars: 0.0%0Unspecified: 0.0%0
Contributing Factor #VEH %Driver: Speed: 0.0%0Driver: Alcohol/Drug: 0.0%0Driver: Electronic Device: 0.0%0Driver: Others: 33.3%3Vehicle: 0.0%0Roadway: 0.0%0Unspecified: 66.7%6
Light Condition #ACC %Daylight: 60.0%3Dawn/Dusk: 0.0%0Dark(Lighted): 0.0%0Dark(Not Lighted): 0.0%0Dark(Unknown Lighting): 20.0%1Unspecified: 20.0%1
Accident Severity Type #ACC %Fatal Collision: 0.0%0Injury Collision: 20.0%1PDO Collision: 80.0%4
Type of Vehicle #VEH %Passenger Car: 44.4%4Bus: 0.0%0Truck: 0.0%0Taxi: 44.4%4Minivan: 0.0%0Police/Emergency Vehicle: 0.0%0Motorcycle/Moped: 0.0%0Bicycle: 0.0%0Fixed Object: 0.0%0Unspecified: 11.1%1
Surface Condition #ACC %Dry: 80.0%4Wet: 0.0%0Snow/Ice: 0.0%0Slush: 0.0%0Water/Sand: 0.0%0Repairing: 0.0%0Unspecified: 20.0%1
Weather Condition #ACC %Clear: 80.0%4Rain: 0.0%0Snow: 0.0%0Sleet/Hail: 0.0%0Fog/Mist: 0.0%0Crosswind/Blowing Sand: 0.0%0Unspecified: 20.0%1
Day of Week #ACC %Sunday: 40.0%2Monday: 0.0%0Tuesday: 20.0%1Wednesday: 20.0%1Thursday: 20.0%1Friday: 0.0%0Saturday: 0.0%0
Time of Day #ACC %
07:30 ~ 09:30: 0.0%009:30 ~ 11:30: 20.0%111:30 ~ 13:30: 20.0%113:30 ~ 16:00: 40.0%2
16:00 ~18:30: 0.0%018:30 ~ 07:30: 20.0%1Unspecified: 0.0%0
DC Department of Transportation - Traffic Accident Reporting and Analysis System
Accident Summary Report (R-7)
Total Number of Accident:
Total Number of Injuries:Total Number of Disabling Injuries:Total Number of NonDisabling Injuries:Total Number of Pedestrians Involved:Total Number of Bicycles Involved:Total Number of Motorcycles Involved:
Total Number of Fatalities:50100000
Time Period Covered:
Intersection:
Collision Type #ACC % Collision Type #ACC %Right Angle: 0 0.0% Fixed Object: 0 0.0%Left Turn: 0 0.0% Ran Off Road: 0 0.0%Right Turn: 0 0.0% Ped. Involved: 0 0.0%Rear End: 0 0.0% Backing: 0 0.0%Side Swiped: 3 60.0% Non Collision: 0 0.0%Head On: 0 0.0% Under/Over Ride: 0 0.0%Parked: 0 0.0% Unspecified: 2 40.0%
admin TARAS 12/15/2011
PENNSYLVANIA AVE and 13 1/2 ST, NW
From 07/01/2006 To 06/30/2010 Prepared Date:Prepared By:
2 Records are not approved as of 12/15/2011 2:52:58 PM

Pedestrian Action #ACC %In Crosswalk with Signal: 0.0%0In Crosswalk against Signal: 0.0%0In Crosswalk no Signal: 0.0%0In Unmarked Crosswalk: 0.0%0Not in Crosswalk: 0.0%0From Between Parked Cars: 0.0%0Unspecified: 0.0%0
Contributing Factor #VEH %Driver: Speed: 3.8%1Driver: Alcohol/Drug: 0.0%0Driver: Electronic Device: 0.0%0Driver: Others: 23.1%6Vehicle: 0.0%0Roadway: 0.0%0Unspecified: 73.1%19
Light Condition #ACC %Daylight: 38.5%5Dawn/Dusk: 0.0%0Dark(Lighted): 0.0%8Dark(Not Lighted): 0.0%0Dark(Unknown Lighting): 0.0%0Unspecified: 0.0%0
Accident Severity Type #ACC %Fatal Collision: 0.0%0Injury Collision: 38.5%5PDO Collision: 61.5%8
Type of Vehicle #VEH %Passenger Car: 57.7%15Bus: 7.7%2Truck: 3.8%1Taxi: 23.1%6Minivan: 0.0%0Police/Emergency Vehicle: 0.0%0Motorcycle/Moped: 0.0%0Bicycle: 3.8%1Fixed Object: 0.0%0Unspecified: 3.8%1
Surface Condition #ACC %Dry: 84.6%11Wet: 7.7%1Snow/Ice: 0.0%0Slush: 0.0%0Water/Sand: 0.0%0Repairing: 0.0%0Unspecified: 7.7%1
Weather Condition #ACC %Clear: 92.3%12Rain: 0.0%0Snow: 0.0%0Sleet/Hail: 0.0%0Fog/Mist: 0.0%0Crosswind/Blowing Sand: 0.0%0Unspecified: 7.7%1
Day of Week #ACC %Sunday: 7.7%1Monday: 0.0%0Tuesday: 15.4%2Wednesday: 0.0%0Thursday: 30.8%4Friday: 30.8%4Saturday: 15.4%2
Time of Day #ACC %
07:30 ~ 09:30: 7.7%109:30 ~ 11:30: 7.7%111:30 ~ 13:30: 7.7%113:30 ~ 16:00: 15.4%2
16:00 ~18:30: 7.7%118:30 ~ 07:30: 53.8%7Unspecified: 0.0%0
DC Department of Transportation - Traffic Accident Reporting and Analysis System
Accident Summary Report (R-7)
Total Number of Accident:
Total Number of Injuries:Total Number of Disabling Injuries:Total Number of NonDisabling Injuries:Total Number of Pedestrians Involved:Total Number of Bicycles Involved:Total Number of Motorcycles Involved:
Total Number of Fatalities:13
011
00010
Time Period Covered:
Intersection:
Collision Type #ACC % Collision Type #ACC %Right Angle: 0 0.0% Fixed Object: 0 0.0%Left Turn: 1 7.7% Ran Off Road: 0 0.0%Right Turn: 0 0.0% Ped. Involved: 1 7.7%Rear End: 4 30.8% Backing: 0 0.0%Side Swiped: 4 30.8% Non Collision: 0 0.0%Head On: 0 0.0% Under/Over Ride: 1 7.7%Parked: 1 7.7% Unspecified: 1 7.7%
admin TARAS 12/15/2011
PENNSYLVANIA AVE and FOURTEENTH ST, NW
From 07/01/2006 To 06/30/2010 Prepared Date:Prepared By:
0 Records are not approved as of 12/15/2011 2:54:00 PM

Pedestrian Action #ACC %In Crosswalk with Signal: 100.0%1In Crosswalk against Signal: 0.0%0In Crosswalk no Signal: 0.0%0In Unmarked Crosswalk: 0.0%0Not in Crosswalk: 0.0%0From Between Parked Cars: 0.0%0Unspecified: 0.0%0
Contributing Factor #VEH %Driver: Speed: 7.2%6Driver: Alcohol/Drug: 2.4%2Driver: Electronic Device: 0.0%0Driver: Others: 24.1%20Vehicle: 0.0%0Roadway: 0.0%0Unspecified: 66.3%55
Light Condition #ACC %Daylight: 53.7%22Dawn/Dusk: 7.3%3Dark(Lighted): 4.9%7Dark(Not Lighted): 4.9%2Dark(Unknown Lighting): 14.6%6Unspecified: 2.4%1
Accident Severity Type #ACC %Fatal Collision: 0.0%0Injury Collision: 24.4%10PDO Collision: 75.6%31
Type of Vehicle #VEH %Passenger Car: 77.1%64Bus: 2.4%2Truck: 2.4%2Taxi: 6.0%5Minivan: 0.0%0Police/Emergency Vehicle: 2.4%2Motorcycle/Moped: 2.4%2Bicycle: 1.2%1Fixed Object: 0.0%0Unspecified: 6.0%5
Surface Condition #ACC %Dry: 80.5%33Wet: 17.1%7Snow/Ice: 0.0%0Slush: 0.0%0Water/Sand: 0.0%0Repairing: 0.0%0Unspecified: 2.4%1
Weather Condition #ACC %Clear: 80.5%33Rain: 14.6%6Snow: 0.0%0Sleet/Hail: 0.0%0Fog/Mist: 2.4%1Crosswind/Blowing Sand: 0.0%0Unspecified: 2.4%1
Day of Week #ACC %Sunday: 14.6%6Monday: 14.6%6Tuesday: 14.6%6Wednesday: 12.2%5Thursday: 17.1%7Friday: 9.8%4Saturday: 17.1%7
Time of Day #ACC %
07:30 ~ 09:30: 4.9%209:30 ~ 11:30: 12.2%511:30 ~ 13:30: 4.9%213:30 ~ 16:00: 4.9%2
16:00 ~18:30: 24.4%1018:30 ~ 07:30: 48.8%20Unspecified: 0.0%0
DC Department of Transportation - Traffic Accident Reporting and Analysis System
Accident Summary Report (R-7)
Total Number of Accident:
Total Number of Injuries:Total Number of Disabling Injuries:Total Number of NonDisabling Injuries:Total Number of Pedestrians Involved:Total Number of Bicycles Involved:Total Number of Motorcycles Involved:
Total Number of Fatalities:41
012
01211
Time Period Covered:
Intersection:
Collision Type #ACC % Collision Type #ACC %Right Angle: 3 7.3% Fixed Object: 1 2.4%Left Turn: 2 4.9% Ran Off Road: 0 0.0%Right Turn: 2 4.9% Ped. Involved: 2 4.9%Rear End: 17 41.5% Backing: 3 7.3%Side Swiped: 8 19.5% Non Collision: 0 0.0%Head On: 1 2.4% Under/Over Ride: 0 0.0%Parked: 1 2.4% Unspecified: 1 2.4%
admin TARAS 12/15/2011
PENNSYLVANIA AVE and FIFTEENTH ST, NW
From 07/01/2006 To 06/30/2010 Prepared Date:Prepared By:
4 Records are not approved as of 12/15/2011 2:54:38 PM

Pedestrian Action #ACC %In Crosswalk with Signal: 0.0%0In Crosswalk against Signal: 0.0%0In Crosswalk no Signal: 0.0%0In Unmarked Crosswalk: 0.0%0Not in Crosswalk: 0.0%0From Between Parked Cars: 0.0%0Unspecified: 0.0%0
Contributing Factor #VEH %Driver: Speed: 0.0%0Driver: Alcohol/Drug: 0.0%0Driver: Electronic Device: 0.0%0Driver: Others: 11.1%5Vehicle: 0.0%0Roadway: 0.0%0Unspecified: 88.9%40
Light Condition #ACC %Daylight: 79.2%19Dawn/Dusk: 0.0%0Dark(Lighted): 0.0%5Dark(Not Lighted): 0.0%0Dark(Unknown Lighting): 0.0%0Unspecified: 0.0%0
Accident Severity Type #ACC %Fatal Collision: 0.0%0Injury Collision: 20.8%5PDO Collision: 79.2%19
Type of Vehicle #VEH %Passenger Car: 55.6%25Bus: 8.9%4Truck: 4.4%2Taxi: 24.4%11Minivan: 0.0%0Police/Emergency Vehicle: 0.0%0Motorcycle/Moped: 0.0%0Bicycle: 6.7%3Fixed Object: 0.0%0Unspecified: 0.0%0
Surface Condition #ACC %Dry: 91.7%22Wet: 8.3%2Snow/Ice: 0.0%0Slush: 0.0%0Water/Sand: 0.0%0Repairing: 0.0%0Unspecified: 0.0%0
Weather Condition #ACC %Clear: 91.7%22Rain: 8.3%2Snow: 0.0%0Sleet/Hail: 0.0%0Fog/Mist: 0.0%0Crosswind/Blowing Sand: 0.0%0Unspecified: 0.0%0
Day of Week #ACC %Sunday: 0.0%0Monday: 4.2%1Tuesday: 20.8%5Wednesday: 12.5%3Thursday: 25.0%6Friday: 25.0%6Saturday: 12.5%3
Time of Day #ACC %
07:30 ~ 09:30: 8.3%209:30 ~ 11:30: 4.2%111:30 ~ 13:30: 20.8%513:30 ~ 16:00: 16.7%4
16:00 ~18:30: 20.8%518:30 ~ 07:30: 29.2%7Unspecified: 0.0%0
DC Department of Transportation - Traffic Accident Reporting and Analysis System
Accident Summary Report (R-7)
Total Number of Accident:
Total Number of Injuries:Total Number of Disabling Injuries:Total Number of NonDisabling Injuries:Total Number of Pedestrians Involved:Total Number of Bicycles Involved:Total Number of Motorcycles Involved:
Total Number of Fatalities:24
0501030
Time Period Covered:
Intersection:
Collision Type #ACC % Collision Type #ACC %Right Angle: 2 8.3% Fixed Object: 1 4.2%Left Turn: 2 8.3% Ran Off Road: 0 0.0%Right Turn: 3 12.5% Ped. Involved: 1 4.2%Rear End: 2 8.3% Backing: 1 4.2%Side Swiped: 9 37.5% Non Collision: 0 0.0%Head On: 0 0.0% Under/Over Ride: 0 0.0%Parked: 0 0.0% Unspecified: 3 12.5%
admin TARAS 12/15/2011
PENNSYLVANIA AVE and SIXTH ST, NW
From 07/01/2010 To 09/30/2011 Prepared Date:Prepared By:
0 Records are not approved as of 12/15/2011 3:25:38 PM

Pedestrian Action #ACC %In Crosswalk with Signal: 50.0%1In Crosswalk against Signal: 0.0%0In Crosswalk no Signal: 0.0%0In Unmarked Crosswalk: 0.0%0Not in Crosswalk: 50.0%1From Between Parked Cars: 0.0%0Unspecified: 0.0%0
Contributing Factor #VEH %Driver: Speed: 0.0%0Driver: Alcohol/Drug: 0.0%0Driver: Electronic Device: 0.0%0Driver: Others: 27.3%6Vehicle: 0.0%0Roadway: 0.0%0Unspecified: 72.7%16
Light Condition #ACC %Daylight: 92.3%12Dawn/Dusk: 0.0%0Dark(Lighted): 0.0%1Dark(Not Lighted): 0.0%0Dark(Unknown Lighting): 0.0%0Unspecified: 0.0%0
Accident Severity Type #ACC %Fatal Collision: 0.0%0Injury Collision: 38.5%5PDO Collision: 61.5%8
Type of Vehicle #VEH %Passenger Car: 31.8%7Bus: 22.7%5Truck: 0.0%0Taxi: 22.7%5Minivan: 0.0%0Police/Emergency Vehicle: 0.0%0Motorcycle/Moped: 0.0%0Bicycle: 13.6%3Fixed Object: 0.0%0Unspecified: 9.1%2
Surface Condition #ACC %Dry: 92.3%12Wet: 7.7%1Snow/Ice: 0.0%0Slush: 0.0%0Water/Sand: 0.0%0Repairing: 0.0%0Unspecified: 0.0%0
Weather Condition #ACC %Clear: 84.6%11Rain: 15.4%2Snow: 0.0%0Sleet/Hail: 0.0%0Fog/Mist: 0.0%0Crosswind/Blowing Sand: 0.0%0Unspecified: 0.0%0
Day of Week #ACC %Sunday: 7.7%1Monday: 23.1%3Tuesday: 15.4%2Wednesday: 7.7%1Thursday: 38.5%5Friday: 7.7%1Saturday: 0.0%0
Time of Day #ACC %
07:30 ~ 09:30: 15.4%209:30 ~ 11:30: 7.7%111:30 ~ 13:30: 38.5%513:30 ~ 16:00: 7.7%1
16:00 ~18:30: 15.4%218:30 ~ 07:30: 15.4%2Unspecified: 0.0%0
DC Department of Transportation - Traffic Accident Reporting and Analysis System
Accident Summary Report (R-7)
Total Number of Accident:
Total Number of Injuries:Total Number of Disabling Injuries:Total Number of NonDisabling Injuries:Total Number of Pedestrians Involved:Total Number of Bicycles Involved:Total Number of Motorcycles Involved:
Total Number of Fatalities:13
0501230
Time Period Covered:
Intersection:
Collision Type #ACC % Collision Type #ACC %Right Angle: 0 0.0% Fixed Object: 2 15.4%Left Turn: 1 7.7% Ran Off Road: 0 0.0%Right Turn: 0 0.0% Ped. Involved: 2 15.4%Rear End: 2 15.4% Backing: 0 0.0%Side Swiped: 4 30.8% Non Collision: 0 0.0%Head On: 0 0.0% Under/Over Ride: 0 0.0%Parked: 0 0.0% Unspecified: 2 15.4%
admin TARAS 12/15/2011
PENNSYLVANIA AVE and SEVENTH ST, NW
From 07/01/2010 To 09/30/2011 Prepared Date:Prepared By:
0 Records are not approved as of 12/15/2011 3:27:12 PM

Pedestrian Action #ACC %In Crosswalk with Signal: 100.0%1In Crosswalk against Signal: 0.0%0In Crosswalk no Signal: 0.0%0In Unmarked Crosswalk: 0.0%0Not in Crosswalk: 0.0%0From Between Parked Cars: 0.0%0Unspecified: 0.0%0
Contributing Factor #VEH %Driver: Speed: 0.0%0Driver: Alcohol/Drug: 0.0%0Driver: Electronic Device: 0.0%0Driver: Others: 22.9%8Vehicle: 2.9%1Roadway: 0.0%0Unspecified: 74.3%26
Light Condition #ACC %Daylight: 57.9%11Dawn/Dusk: 5.3%1Dark(Lighted): 10.5%5Dark(Not Lighted): 10.5%2Dark(Unknown Lighting): 0.0%0Unspecified: 0.0%0
Accident Severity Type #ACC %Fatal Collision: 0.0%0Injury Collision: 26.3%5PDO Collision: 73.7%14
Type of Vehicle #VEH %Passenger Car: 51.4%18Bus: 5.7%2Truck: 2.9%1Taxi: 25.7%9Minivan: 0.0%0Police/Emergency Vehicle: 2.9%1Motorcycle/Moped: 0.0%0Bicycle: 2.9%1Fixed Object: 0.0%0Unspecified: 8.6%3
Surface Condition #ACC %Dry: 78.9%15Wet: 21.1%4Snow/Ice: 0.0%0Slush: 0.0%0Water/Sand: 0.0%0Repairing: 0.0%0Unspecified: 0.0%0
Weather Condition #ACC %Clear: 78.9%15Rain: 15.8%3Snow: 0.0%0Sleet/Hail: 0.0%0Fog/Mist: 0.0%0Crosswind/Blowing Sand: 5.3%1Unspecified: 0.0%0
Day of Week #ACC %Sunday: 5.3%1Monday: 15.8%3Tuesday: 5.3%1Wednesday: 15.8%3Thursday: 26.3%5Friday: 21.1%4Saturday: 10.5%2
Time of Day #ACC %
07:30 ~ 09:30: 5.3%109:30 ~ 11:30: 5.3%111:30 ~ 13:30: 15.8%313:30 ~ 16:00: 21.1%4
16:00 ~18:30: 21.1%418:30 ~ 07:30: 31.6%6Unspecified: 0.0%0
DC Department of Transportation - Traffic Accident Reporting and Analysis System
Accident Summary Report (R-7)
Total Number of Accident:
Total Number of Injuries:Total Number of Disabling Injuries:Total Number of NonDisabling Injuries:Total Number of Pedestrians Involved:Total Number of Bicycles Involved:Total Number of Motorcycles Involved:
Total Number of Fatalities:19
0710110
Time Period Covered:
Intersection:
Collision Type #ACC % Collision Type #ACC %Right Angle: 1 5.3% Fixed Object: 1 5.3%Left Turn: 1 5.3% Ran Off Road: 0 0.0%Right Turn: 2 10.5% Ped. Involved: 2 10.5%Rear End: 4 21.1% Backing: 0 0.0%Side Swiped: 5 26.3% Non Collision: 0 0.0%Head On: 0 0.0% Under/Over Ride: 0 0.0%Parked: 0 0.0% Unspecified: 3 15.8%
admin TARAS 12/15/2011
PENNSYLVANIA AVE and NINTH ST, NW
From 07/01/2010 To 09/30/2011 Prepared Date:Prepared By:
1 Records are not approved as of 12/15/2011 3:27:48 PM

Pedestrian Action #ACC %In Crosswalk with Signal: 0.0%0In Crosswalk against Signal: 50.0%1In Crosswalk no Signal: 0.0%0In Unmarked Crosswalk: 0.0%0Not in Crosswalk: 50.0%1From Between Parked Cars: 0.0%0Unspecified: 0.0%0
Contributing Factor #VEH %Driver: Speed: 0.0%0Driver: Alcohol/Drug: 4.8%1Driver: Electronic Device: 0.0%0Driver: Others: 14.3%3Vehicle: 0.0%0Roadway: 0.0%0Unspecified: 81.0%17
Light Condition #ACC %Daylight: 83.3%10Dawn/Dusk: 0.0%0Dark(Lighted): 0.0%2Dark(Not Lighted): 0.0%0Dark(Unknown Lighting): 0.0%0Unspecified: 0.0%0
Accident Severity Type #ACC %Fatal Collision: 0.0%0Injury Collision: 16.7%2PDO Collision: 83.3%10
Type of Vehicle #VEH %Passenger Car: 52.4%11Bus: 4.8%1Truck: 0.0%0Taxi: 19.0%4Minivan: 0.0%0Police/Emergency Vehicle: 4.8%1Motorcycle/Moped: 0.0%0Bicycle: 9.5%2Fixed Object: 0.0%0Unspecified: 9.5%2
Surface Condition #ACC %Dry: 83.3%10Wet: 0.0%0Snow/Ice: 8.3%1Slush: 0.0%0Water/Sand: 0.0%0Repairing: 0.0%0Unspecified: 8.3%1
Weather Condition #ACC %Clear: 91.7%11Rain: 0.0%0Snow: 8.3%1Sleet/Hail: 0.0%0Fog/Mist: 0.0%0Crosswind/Blowing Sand: 0.0%0Unspecified: 0.0%0
Day of Week #ACC %Sunday: 0.0%0Monday: 33.3%4Tuesday: 0.0%0Wednesday: 8.3%1Thursday: 16.7%2Friday: 33.3%4Saturday: 8.3%1
Time of Day #ACC %
07:30 ~ 09:30: 25.0%309:30 ~ 11:30: 8.3%111:30 ~ 13:30: 25.0%313:30 ~ 16:00: 8.3%1
16:00 ~18:30: 16.7%218:30 ~ 07:30: 16.7%2Unspecified: 0.0%0
DC Department of Transportation - Traffic Accident Reporting and Analysis System
Accident Summary Report (R-7)
Total Number of Accident:
Total Number of Injuries:Total Number of Disabling Injuries:Total Number of NonDisabling Injuries:Total Number of Pedestrians Involved:Total Number of Bicycles Involved:Total Number of Motorcycles Involved:
Total Number of Fatalities:12
0200220
Time Period Covered:
Intersection:
Collision Type #ACC % Collision Type #ACC %Right Angle: 2 16.7% Fixed Object: 1 8.3%Left Turn: 1 8.3% Ran Off Road: 0 0.0%Right Turn: 1 8.3% Ped. Involved: 1 8.3%Rear End: 1 8.3% Backing: 0 0.0%Side Swiped: 2 16.7% Non Collision: 0 0.0%Head On: 0 0.0% Under/Over Ride: 0 0.0%Parked: 0 0.0% Unspecified: 3 25.0%
admin TARAS 12/15/2011
PENNSYLVANIA AVE and TENTH ST, NW
From 07/01/2010 To 09/30/2011 Prepared Date:Prepared By:
1 Records are not approved as of 12/15/2011 3:28:18 PM

Pedestrian Action #ACC %In Crosswalk with Signal: 0.0%0In Crosswalk against Signal: 0.0%0In Crosswalk no Signal: 0.0%0In Unmarked Crosswalk: 0.0%0Not in Crosswalk: 100.0%1From Between Parked Cars: 0.0%0Unspecified: 0.0%0
Contributing Factor #VEH %Driver: Speed: 0.0%0Driver: Alcohol/Drug: 0.0%0Driver: Electronic Device: 0.0%0Driver: Others: 16.7%4Vehicle: 0.0%0Roadway: 0.0%0Unspecified: 83.3%20
Light Condition #ACC %Daylight: 78.6%11Dawn/Dusk: 7.1%1Dark(Lighted): 0.0%2Dark(Not Lighted): 0.0%0Dark(Unknown Lighting): 0.0%0Unspecified: 0.0%0
Accident Severity Type #ACC %Fatal Collision: 0.0%0Injury Collision: 14.3%2PDO Collision: 85.7%12
Type of Vehicle #VEH %Passenger Car: 45.8%11Bus: 20.8%5Truck: 4.2%1Taxi: 29.2%7Minivan: 0.0%0Police/Emergency Vehicle: 0.0%0Motorcycle/Moped: 0.0%0Bicycle: 0.0%0Fixed Object: 0.0%0Unspecified: 0.0%0
Surface Condition #ACC %Dry: 92.9%13Wet: 0.0%0Snow/Ice: 0.0%0Slush: 7.1%1Water/Sand: 0.0%0Repairing: 0.0%0Unspecified: 0.0%0
Weather Condition #ACC %Clear: 92.9%13Rain: 0.0%0Snow: 7.1%1Sleet/Hail: 0.0%0Fog/Mist: 0.0%0Crosswind/Blowing Sand: 0.0%0Unspecified: 0.0%0
Day of Week #ACC %Sunday: 0.0%0Monday: 0.0%0Tuesday: 7.1%1Wednesday: 42.9%6Thursday: 35.7%5Friday: 7.1%1Saturday: 7.1%1
Time of Day #ACC %
07:30 ~ 09:30: 0.0%009:30 ~ 11:30: 21.4%311:30 ~ 13:30: 28.6%413:30 ~ 16:00: 0.0%0
16:00 ~18:30: 28.6%418:30 ~ 07:30: 21.4%3Unspecified: 0.0%0
DC Department of Transportation - Traffic Accident Reporting and Analysis System
Accident Summary Report (R-7)
Total Number of Accident:
Total Number of Injuries:Total Number of Disabling Injuries:Total Number of NonDisabling Injuries:Total Number of Pedestrians Involved:Total Number of Bicycles Involved:Total Number of Motorcycles Involved:
Total Number of Fatalities:14
0211100
Time Period Covered:
Intersection:
Collision Type #ACC % Collision Type #ACC %Right Angle: 0 0.0% Fixed Object: 0 0.0%Left Turn: 1 7.1% Ran Off Road: 0 0.0%Right Turn: 1 7.1% Ped. Involved: 2 14.3%Rear End: 1 7.1% Backing: 0 0.0%Side Swiped: 6 42.9% Non Collision: 0 0.0%Head On: 1 7.1% Under/Over Ride: 0 0.0%Parked: 0 0.0% Unspecified: 2 14.3%
admin TARAS 12/15/2011
PENNSYLVANIA AVE and ELEVENTH ST, NW
From 07/01/2010 To 09/30/2011 Prepared Date:Prepared By:
0 Records are not approved as of 12/15/2011 3:28:47 PM

Pedestrian Action #ACC %In Crosswalk with Signal: 0.0%0In Crosswalk against Signal: 0.0%0In Crosswalk no Signal: 0.0%0In Unmarked Crosswalk: 0.0%0Not in Crosswalk: 0.0%0From Between Parked Cars: 0.0%0Unspecified: 0.0%0
Contributing Factor #VEH %Driver: Speed: 0.0%0Driver: Alcohol/Drug: 0.0%0Driver: Electronic Device: 0.0%0Driver: Others: 25.0%2Vehicle: 0.0%0Roadway: 0.0%0Unspecified: 75.0%6
Light Condition #ACC %Daylight: 75.0%3Dawn/Dusk: 0.0%0Dark(Lighted): 0.0%1Dark(Not Lighted): 0.0%0Dark(Unknown Lighting): 0.0%0Unspecified: 0.0%0
Accident Severity Type #ACC %Fatal Collision: 0.0%0Injury Collision: 25.0%1PDO Collision: 75.0%3
Type of Vehicle #VEH %Passenger Car: 50.0%4Bus: 25.0%2Truck: 0.0%0Taxi: 12.5%1Minivan: 0.0%0Police/Emergency Vehicle: 0.0%0Motorcycle/Moped: 0.0%0Bicycle: 12.5%1Fixed Object: 0.0%0Unspecified: 0.0%0
Surface Condition #ACC %Dry: 100.0%4Wet: 0.0%0Snow/Ice: 0.0%0Slush: 0.0%0Water/Sand: 0.0%0Repairing: 0.0%0Unspecified: 0.0%0
Weather Condition #ACC %Clear: 100.0%4Rain: 0.0%0Snow: 0.0%0Sleet/Hail: 0.0%0Fog/Mist: 0.0%0Crosswind/Blowing Sand: 0.0%0Unspecified: 0.0%0
Day of Week #ACC %Sunday: 0.0%0Monday: 25.0%1Tuesday: 25.0%1Wednesday: 0.0%0Thursday: 25.0%1Friday: 25.0%1Saturday: 0.0%0
Time of Day #ACC %
07:30 ~ 09:30: 25.0%109:30 ~ 11:30: 25.0%111:30 ~ 13:30: 0.0%013:30 ~ 16:00: 0.0%0
16:00 ~18:30: 25.0%118:30 ~ 07:30: 25.0%1Unspecified: 0.0%0
DC Department of Transportation - Traffic Accident Reporting and Analysis System
Accident Summary Report (R-7)
Total Number of Accident:
Total Number of Injuries:Total Number of Disabling Injuries:Total Number of NonDisabling Injuries:Total Number of Pedestrians Involved:Total Number of Bicycles Involved:Total Number of Motorcycles Involved:
Total Number of Fatalities:40100010
Time Period Covered:
Intersection:
Collision Type #ACC % Collision Type #ACC %Right Angle: 0 0.0% Fixed Object: 0 0.0%Left Turn: 0 0.0% Ran Off Road: 0 0.0%Right Turn: 0 0.0% Ped. Involved: 1 25.0%Rear End: 0 0.0% Backing: 0 0.0%Side Swiped: 3 75.0% Non Collision: 0 0.0%Head On: 0 0.0% Under/Over Ride: 0 0.0%Parked: 0 0.0% Unspecified: 0 0.0%
admin TARAS 12/15/2011
PENNSYLVANIA AVE and TWELFTH ST, NW
From 07/01/2010 To 09/30/2011 Prepared Date:Prepared By:
0 Records are not approved as of 12/15/2011 3:29:17 PM

Pedestrian Action #ACC %In Crosswalk with Signal: 0.0%0In Crosswalk against Signal: 0.0%0In Crosswalk no Signal: 0.0%0In Unmarked Crosswalk: 0.0%0Not in Crosswalk: 0.0%0From Between Parked Cars: 0.0%0Unspecified: 100.0%1
Contributing Factor #VEH %Driver: Speed: 0.0%0Driver: Alcohol/Drug: 0.0%0Driver: Electronic Device: 0.0%0Driver: Others: 12.5%2Vehicle: 0.0%0Roadway: 0.0%0Unspecified: 87.5%14
Light Condition #ACC %Daylight: 88.9%8Dawn/Dusk: 0.0%0Dark(Lighted): 0.0%1Dark(Not Lighted): 0.0%0Dark(Unknown Lighting): 0.0%0Unspecified: 0.0%0
Accident Severity Type #ACC %Fatal Collision: 0.0%0Injury Collision: 33.3%3PDO Collision: 66.7%6
Type of Vehicle #VEH %Passenger Car: 43.8%7Bus: 12.5%2Truck: 18.8%3Taxi: 12.5%2Minivan: 0.0%0Police/Emergency Vehicle: 6.3%1Motorcycle/Moped: 0.0%0Bicycle: 6.3%1Fixed Object: 0.0%0Unspecified: 0.0%0
Surface Condition #ACC %Dry: 88.9%8Wet: 11.1%1Snow/Ice: 0.0%0Slush: 0.0%0Water/Sand: 0.0%0Repairing: 0.0%0Unspecified: 0.0%0
Weather Condition #ACC %Clear: 88.9%8Rain: 11.1%1Snow: 0.0%0Sleet/Hail: 0.0%0Fog/Mist: 0.0%0Crosswind/Blowing Sand: 0.0%0Unspecified: 0.0%0
Day of Week #ACC %Sunday: 0.0%0Monday: 11.1%1Tuesday: 22.2%2Wednesday: 11.1%1Thursday: 11.1%1Friday: 33.3%3Saturday: 11.1%1
Time of Day #ACC %
07:30 ~ 09:30: 11.1%109:30 ~ 11:30: 33.3%311:30 ~ 13:30: 0.0%013:30 ~ 16:00: 11.1%1
16:00 ~18:30: 11.1%118:30 ~ 07:30: 33.3%3Unspecified: 0.0%0
DC Department of Transportation - Traffic Accident Reporting and Analysis System
Accident Summary Report (R-7)
Total Number of Accident:
Total Number of Injuries:Total Number of Disabling Injuries:Total Number of NonDisabling Injuries:Total Number of Pedestrians Involved:Total Number of Bicycles Involved:Total Number of Motorcycles Involved:
Total Number of Fatalities:90300110
Time Period Covered:
Intersection:
Collision Type #ACC % Collision Type #ACC %Right Angle: 0 0.0% Fixed Object: 0 0.0%Left Turn: 0 0.0% Ran Off Road: 0 0.0%Right Turn: 0 0.0% Ped. Involved: 2 22.2%Rear End: 2 22.2% Backing: 0 0.0%Side Swiped: 5 55.6% Non Collision: 0 0.0%Head On: 0 0.0% Under/Over Ride: 0 0.0%Parked: 0 0.0% Unspecified: 0 0.0%
admin TARAS 12/15/2011
PENNSYLVANIA AVE and THIRTEENTH ST, NW
From 07/01/2010 To 09/30/2011 Prepared Date:Prepared By:
0 Records are not approved as of 12/15/2011 3:29:51 PM

Pedestrian Action #ACC %In Crosswalk with Signal: 0.0%0In Crosswalk against Signal: 0.0%0In Crosswalk no Signal: 0.0%0In Unmarked Crosswalk: 0.0%0Not in Crosswalk: 66.7%2From Between Parked Cars: 0.0%0Unspecified: 33.3%1
Contributing Factor #VEH %Driver: Speed: 0.0%0Driver: Alcohol/Drug: 1.5%1Driver: Electronic Device: 0.0%0Driver: Others: 16.9%11Vehicle: 0.0%0Roadway: 0.0%0Unspecified: 81.5%53
Light Condition #ACC %Daylight: 65.7%23Dawn/Dusk: 2.9%1Dark(Lighted): 2.9%10Dark(Not Lighted): 2.9%1Dark(Unknown Lighting): 0.0%0Unspecified: 0.0%0
Accident Severity Type #ACC %Fatal Collision: 0.0%0Injury Collision: 20.0%7PDO Collision: 80.0%28
Type of Vehicle #VEH %Passenger Car: 58.5%38Bus: 10.8%7Truck: 3.1%2Taxi: 20.0%13Minivan: 0.0%0Police/Emergency Vehicle: 1.5%1Motorcycle/Moped: 0.0%0Bicycle: 4.6%3Fixed Object: 0.0%0Unspecified: 1.5%1
Surface Condition #ACC %Dry: 85.7%30Wet: 11.4%4Snow/Ice: 0.0%0Slush: 0.0%0Water/Sand: 0.0%0Repairing: 0.0%0Unspecified: 2.9%1
Weather Condition #ACC %Clear: 82.9%29Rain: 11.4%4Snow: 0.0%0Sleet/Hail: 0.0%0Fog/Mist: 2.9%1Crosswind/Blowing Sand: 0.0%0Unspecified: 2.9%1
Day of Week #ACC %Sunday: 2.9%1Monday: 8.6%3Tuesday: 20.0%7Wednesday: 8.6%3Thursday: 17.1%6Friday: 20.0%7Saturday: 22.9%8
Time of Day #ACC %
07:30 ~ 09:30: 8.6%309:30 ~ 11:30: 8.6%311:30 ~ 13:30: 14.3%513:30 ~ 16:00: 17.1%6
16:00 ~18:30: 11.4%418:30 ~ 07:30: 40.0%14Unspecified: 0.0%0
DC Department of Transportation - Traffic Accident Reporting and Analysis System
Accident Summary Report (R-7)
Total Number of Accident:
Total Number of Injuries:Total Number of Disabling Injuries:Total Number of NonDisabling Injuries:Total Number of Pedestrians Involved:Total Number of Bicycles Involved:Total Number of Motorcycles Involved:
Total Number of Fatalities:35
0703330
Time Period Covered:
Intersection:
Collision Type #ACC % Collision Type #ACC %Right Angle: 2 5.7% Fixed Object: 1 2.9%Left Turn: 2 5.7% Ran Off Road: 0 0.0%Right Turn: 3 8.6% Ped. Involved: 3 8.6%Rear End: 6 17.1% Backing: 1 2.9%Side Swiped: 15 42.9% Non Collision: 1 2.9%Head On: 0 0.0% Under/Over Ride: 0 0.0%Parked: 0 0.0% Unspecified: 1 2.9%
admin TARAS 12/15/2011
PENNSYLVANIA AVE and FOURTEENTH ST, NW
From 07/01/2010 To 09/30/2011 Prepared Date:Prepared By:
0 Records are not approved as of 12/15/2011 3:33:39 PM

Pedestrian Action #ACC %In Crosswalk with Signal: 0.0%0In Crosswalk against Signal: 0.0%0In Crosswalk no Signal: 0.0%0In Unmarked Crosswalk: 0.0%0Not in Crosswalk: 0.0%0From Between Parked Cars: 0.0%0Unspecified: 0.0%0
Contributing Factor #VEH %Driver: Speed: 0.0%0Driver: Alcohol/Drug: 5.3%1Driver: Electronic Device: 0.0%0Driver: Others: 26.3%5Vehicle: 0.0%0Roadway: 0.0%0Unspecified: 68.4%13
Light Condition #ACC %Daylight: 75.0%9Dawn/Dusk: 0.0%0Dark(Lighted): 0.0%3Dark(Not Lighted): 0.0%0Dark(Unknown Lighting): 0.0%0Unspecified: 0.0%0
Accident Severity Type #ACC %Fatal Collision: 0.0%0Injury Collision: 25.0%3PDO Collision: 75.0%9
Type of Vehicle #VEH %Passenger Car: 42.1%8Bus: 5.3%1Truck: 21.1%4Taxi: 21.1%4Minivan: 0.0%0Police/Emergency Vehicle: 0.0%0Motorcycle/Moped: 0.0%0Bicycle: 10.5%2Fixed Object: 0.0%0Unspecified: 0.0%0
Surface Condition #ACC %Dry: 91.7%11Wet: 8.3%1Snow/Ice: 0.0%0Slush: 0.0%0Water/Sand: 0.0%0Repairing: 0.0%0Unspecified: 0.0%0
Weather Condition #ACC %Clear: 91.7%11Rain: 8.3%1Snow: 0.0%0Sleet/Hail: 0.0%0Fog/Mist: 0.0%0Crosswind/Blowing Sand: 0.0%0Unspecified: 0.0%0
Day of Week #ACC %Sunday: 8.3%1Monday: 0.0%0Tuesday: 8.3%1Wednesday: 25.0%3Thursday: 8.3%1Friday: 41.7%5Saturday: 8.3%1
Time of Day #ACC %
07:30 ~ 09:30: 8.3%109:30 ~ 11:30: 16.7%211:30 ~ 13:30: 33.3%413:30 ~ 16:00: 8.3%1
16:00 ~18:30: 16.7%218:30 ~ 07:30: 16.7%2Unspecified: 0.0%0
DC Department of Transportation - Traffic Accident Reporting and Analysis System
Accident Summary Report (R-7)
Total Number of Accident:
Total Number of Injuries:Total Number of Disabling Injuries:Total Number of NonDisabling Injuries:Total Number of Pedestrians Involved:Total Number of Bicycles Involved:Total Number of Motorcycles Involved:
Total Number of Fatalities:12
0301020
Time Period Covered:
Intersection:
Collision Type #ACC % Collision Type #ACC %Right Angle: 0 0.0% Fixed Object: 3 25.0%Left Turn: 1 8.3% Ran Off Road: 0 0.0%Right Turn: 0 0.0% Ped. Involved: 1 8.3%Rear End: 0 0.0% Backing: 0 0.0%Side Swiped: 3 25.0% Non Collision: 0 0.0%Head On: 0 0.0% Under/Over Ride: 0 0.0%Parked: 0 0.0% Unspecified: 4 33.3%
admin TARAS 12/15/2011
PENNSYLVANIA AVE and FIFTEENTH ST, NW
From 07/01/2010 To 09/30/2011 Prepared Date:Prepared By:
0 Records are not approved as of 12/15/2011 3:34:48 PM

Appendix B9 Pennsylvania Avenue: Field of View Snapshots

Pennsylvania AvenueVid StillVideo Stills
Pennsylvania Avenue at 6th Street

Pennsylvania Avenue at 9th Street
Pennsylvania Avenue at 11th Street

Pennsylvania Avenue at 12th Street
Pennsylvania Avenue at 13th Street