appendix f: transportation and traffic
TRANSCRIPT

Ini t ial Study for Mit igated Negative Declarat ion No. 2014-01 Page 77
APPENDIX F: TRANSPORTATION AND TRAFFIC

Trames #0092-0002-02
100 E San Marcos Blvd. Ste 400 San Marcos, CA 92069 (760) 291 - 1400
December 16, 2013 Mr. Jim Todd California Gold Development Corporation 133 Old Wards Ferry Road, Suite G Sonora, CA 95370 Subject: Lake Elsinore Tractor Supply Company - Traffic Analysis (JN 0092-
0002) Dear Mr. Todd: Trames Solutions Inc. is pleased to submit the following traffic analysis for the proposed Tractor Supply Company project. It is our understanding that the project consists of a 19,031 square foot tractor supply building. The site is located on the northwest corner of Collier Avenue and Enterprise Way in the City of Lake Elsinore (See Figure A). The following tasks have been conducted to determine the potential impacts of the proposed project on the adjacent roadway system:
• Determine the peak and daily trip generation for the proposed project. • Route the project traffic to the surrounding roadway network • Evaluate existing traffic conditions • Evaluate traffic conditions with the development of the proposed project
PROJECT TRIP GENERATION The number of trips generated by a project is based on the specific uses proposed and the size of the overall project. The Institute of Transportation Engineers, Trip Generation manual (9th Edition, 2012) is the industry standard in determining the number of trips generated by a development project on a daily and peak hour basis. The 19,031 square foot tractor supply building is a unique use that serves farming activities. The ITE manual has trip rates for the evening peak hour but does not have trip rates for the morning and daily conditions. The description for a home improvement store which sells hardware, lumber, etc. most closely resembles the proposed project. However, since a home improvement store sells many items that the proposed tractor supply store will not, the AM and daily trip rate can be considered to be conservatively high. The trip rates are presented on Table 1. Based on the land use assumptions for the project, it is anticipated that the tractor supply store would generate approximately 585 trips per day with 28 AM peak hour trip ends and
1

2

TABLE 1
In Out Total In Out Total Daily
Tractor Supply Store 810 19.031 TSF 0.85 0.63 1.48 0.66 0.74 1.40 30.74
1 Source: ITE (Institute of Transportation Engineers) Trip Generation Manual, 9th Edition, 2012.2 TSF = Thousand Square Feet
TRIP GENERATION RATES1
Land Use
AM Peak Hour PM Peak Hour
Quantity 2ITE
Code
C:\TRAMES\0092-0002\Excel\0092-0002_02 Report\13
Mr. Jim Todd California Gold Development Corporation December 16, 2013
Trames #0092-0002-02
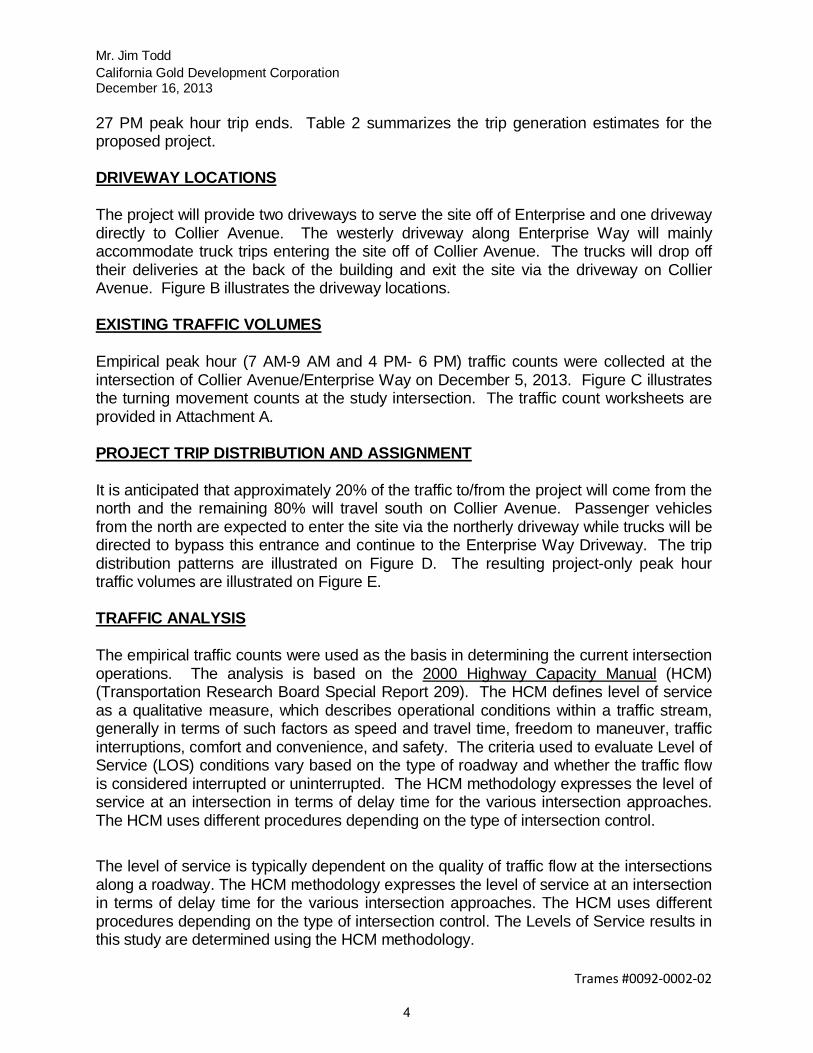
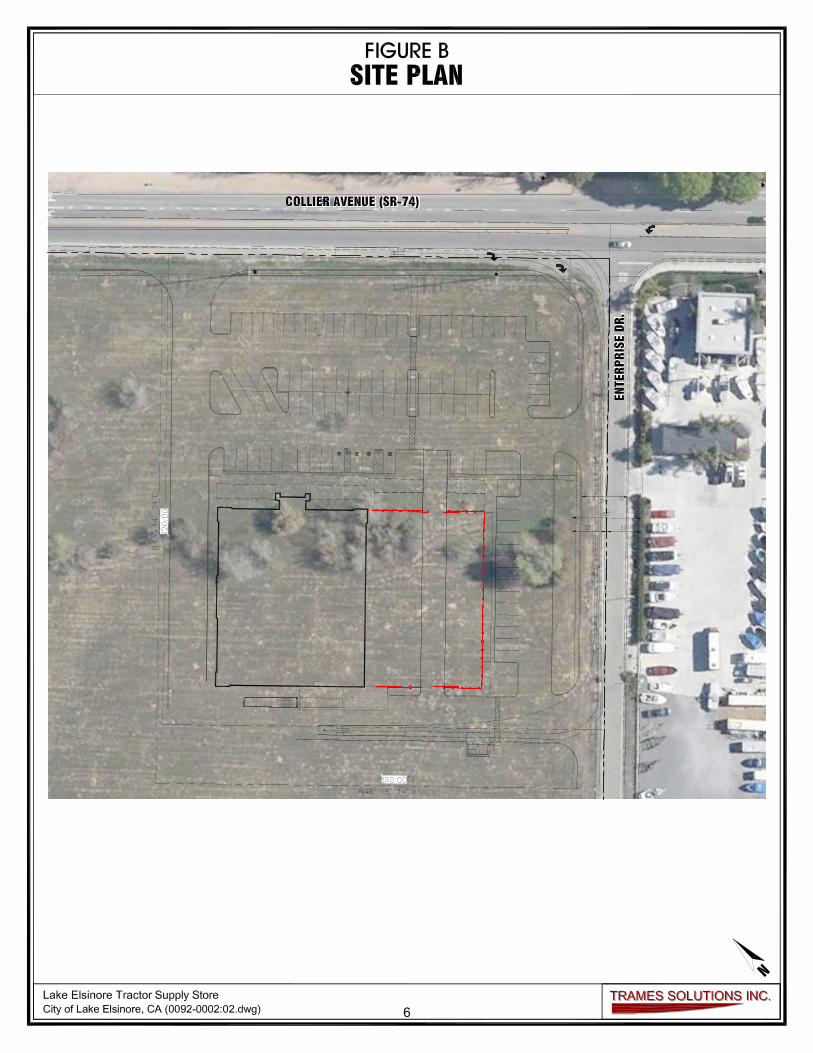
27 PM peak hour trip ends. Table 2 summarizes the trip generation estimates for the proposed project. DRIVEWAY LOCATIONS The project will provide two driveways to serve the site off of Enterprise and one driveway directly to Collier Avenue. The westerly driveway along Enterprise Way will mainly accommodate truck trips entering the site off of Collier Avenue. The trucks will drop off their deliveries at the back of the building and exit the site via the driveway on Collier Avenue. Figure B illustrates the driveway locations. EXISTING TRAFFIC VOLUMES Empirical peak hour (7 AM-9 AM and 4 PM- 6 PM) traffic counts were collected at the intersection of Collier Avenue/Enterprise Way on December 5, 2013. Figure C illustrates the turning movement counts at the study intersection. The traffic count worksheets are provided in Attachment A. PROJECT TRIP DISTRIBUTION AND ASSIGNMENT It is anticipated that approximately 20% of the traffic to/from the project will come from the north and the remaining 80% will travel south on Collier Avenue. Passenger vehicles from the north are expected to enter the site via the northerly driveway while trucks will be directed to bypass this entrance and continue to the Enterprise Way Driveway. The trip distribution patterns are illustrated on Figure D. The resulting project-only peak hour traffic volumes are illustrated on Figure E. TRAFFIC ANALYSIS The empirical traffic counts were used as the basis in determining the current intersection operations. The analysis is based on the 2000 Highway Capacity Manual (HCM) (Transportation Research Board Special Report 209). The HCM defines level of service as a qualitative measure, which describes operational conditions within a traffic stream, generally in terms of such factors as speed and travel time, freedom to maneuver, traffic interruptions, comfort and convenience, and safety. The criteria used to evaluate Level of Service (LOS) conditions vary based on the type of roadway and whether the traffic flow is considered interrupted or uninterrupted. The HCM methodology expresses the level of service at an intersection in terms of delay time for the various intersection approaches. The HCM uses different procedures depending on the type of intersection control.
The level of service is typically dependent on the quality of traffic flow at the intersections along a roadway. The HCM methodology expresses the level of service at an intersection in terms of delay time for the various intersection approaches. The HCM uses different procedures depending on the type of intersection control. The Levels of Service results in this study are determined using the HCM methodology.
4

TABLE 2
In Out Total In Out Total Daily
Tractor Supply Store 19.031 TSF 16 12 28 13 14 27 585
16 12 28 13 14 27 585
1 TSF = Thousand Square Feet
PM Peak Hour
TOTAL
TRIP GENERATION SUMMARY
Land Use
AM Peak Hour
Quantity 1
C:\TRAMES\0092-0002\Excel\0092-0002_02 Report\25
6

7

8

9

Mr. Jim Todd California Gold Development Corporation December 16, 2013
Trames #0092-0002-02
Intersections that are stop sign controlled with stop control on the minor street only have been analyzed using the unsignalized intersection methodology of the HCM. The calculation of level of service is dependent on the occurrence of gaps occurring in the traffic flow of the main street. Using data collected describing the intersection configuration and traffic volumes at the study area locations; the level of service has been calculated. The level of service criteria for this type of intersection analysis is based on average total delay per vehicle for the worst minor street movement(s). The levels of service are defined as follows:
LEVEL OF SERVICE
AVERAGE TOTAL DELAY PER VEHICLE (SECONDS)
UNSIGNALIZED A 0 to 10.00 B 10.01 to 15.00 C 15.01 to 25.00 D 25.01 to 35.00 E 35.01 to 50.00 F 50.01 and up
Traffic operations are quantified through the determination of "Level of Service" (LOS). Level of Service is a qualitative measure of traffic operating conditions, whereby a letter grade "A" through "F" is assigned to an infrastructure facility (intersection) representing progressively worsening traffic conditions. Level of Service Definition The definitions of Level of Service for uninterrupted flow (flow unrestrained by the existence of traffic control devices) are:
• LOS "A": Completely free-flow conditions. The operation of vehicles is virtually unaffected by the presence of other vehicles, and operations are constrained only by the geometric features of the highway and by driver preferences. Maneuverability within the traffic stream is good. Minor disruptions to flow are easily absorbed without a change in travel speed.
• LOS "B": Free flow conditions, although the presence of other vehicles
becomes noticeable. Average travel speeds are the same as in LOS "A", but drivers have slightly less freedom to maneuver. Minor disruptions are still easily absorbed, although local deterioration in LOS will be more obvious.
10

Mr. Jim Todd California Gold Development Corporation December 16, 2013
Trames #0092-0002-02
• LOS "C": The influence of traffic density on operations becomes marked.
The ability to maneuver within the traffic stream is clearly affected by other vehicles. Minor disruptions can cause serious local deterioration in service, and queues will form behind any significant traffic disruption.
• LOS "D": The ability to maneuver is restricted due to traffic congestion.
Travel speed is reduced by the increasing volume. Only minor disruptions can be absorbed without extensive queues forming and the service deteriorating.
• LOS "E": Operations at or near capacity, an unstable level. Vehicles are
operating with the minimum spacing for maintaining uniform flow.
• LOS "F": Forced or breakdown flow. It occurs either when vehicles arrive at a rate greater than the rate at which they are discharged or when the forecast demand exceeds the computed capacity of a planned facility. Although operations at these points – and on sections immediately downstream – appear to be at capacity, queues form behind these breakdowns. Operations within queues are highly unstable, with vehicles experiencing brief periods of movement followed by stoppages.
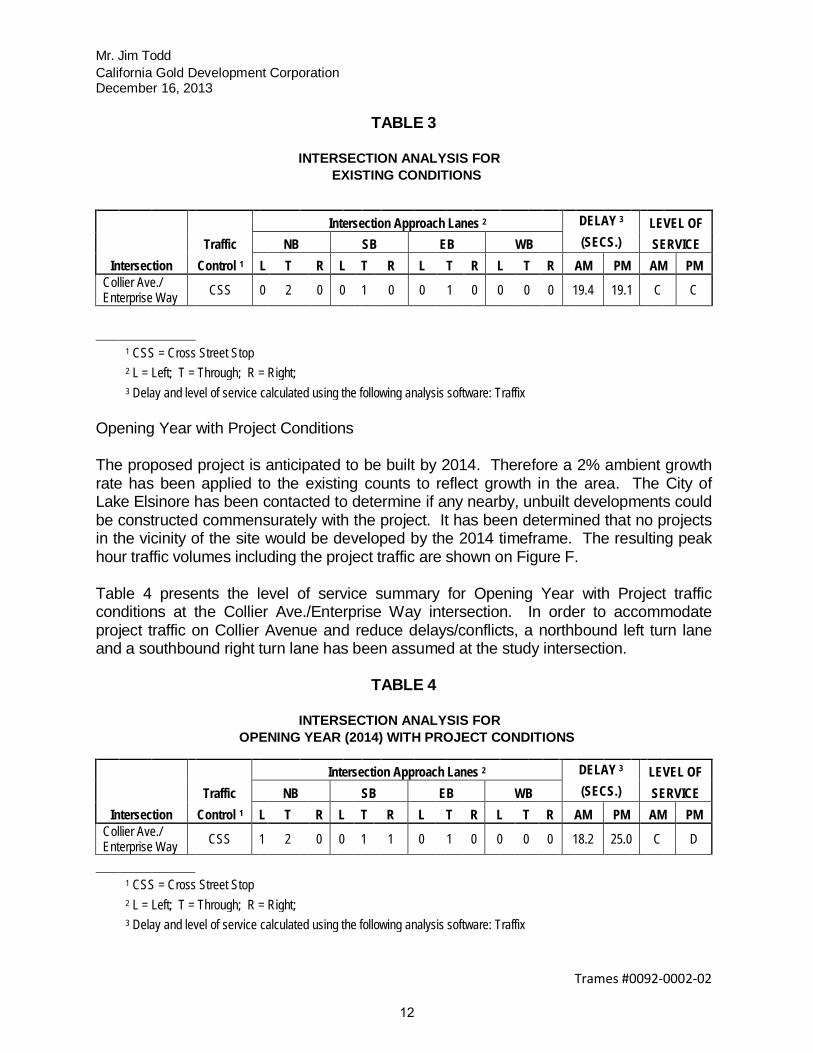
City of Lake Elsinore Level of Service Criteria The City of Lake Elsinore has established Level of Service (LOS) “D” as the maximum allowable threshold for the intersection operations. Therefore, LOS “E” or “F” is considered unacceptable and requires improvements measures. Existing Conditions Based on the existing traffic control (stop sign on Enterprise Way), current lane geometry, and empirical peak hour counts, the intersection of Collier Avenue/Enterprise Way is operating at acceptable service levels. Table 3 below summarizes the delay and corresponding level of service during the morning and evening peak hours.
11
Mr. Jim Todd California Gold Development Corporation December 16, 2013
Trames #0092-0002-02
TABLE 3
INTERSECTION ANALYSIS FOR EXISTING CONDITIONS
Intersection
Intersection Approach Lanes 2 DELAY 3 LEVEL OF Traffic NB SB EB WB (SECS.) SERVICE
Control 1 L T R L T R L T R L T R AM PM AM PM Collier Ave./ Enterprise Way CSS 0 2 0 0 1 0 0 1 0 0 0 0 19.4 19.1 C C
1 CSS = Cross Street Stop
2 L = Left; T = Through; R = Right;
3 Delay and level of service calculated using the following analysis software: Traffix
Opening Year with Project Conditions The proposed project is anticipated to be built by 2014. Therefore a 2% ambient growth rate has been applied to the existing counts to reflect growth in the area. The City of Lake Elsinore has been contacted to determine if any nearby, unbuilt developments could be constructed commensurately with the project. It has been determined that no projects in the vicinity of the site would be developed by the 2014 timeframe. The resulting peak hour traffic volumes including the project traffic are shown on Figure F. Table 4 presents the level of service summary for Opening Year with Project traffic conditions at the Collier Ave./Enterprise Way intersection. In order to accommodate project traffic on Collier Avenue and reduce delays/conflicts, a northbound left turn lane and a southbound right turn lane has been assumed at the study intersection.
TABLE 4
INTERSECTION ANALYSIS FOR OPENING YEAR (2014) WITH PROJECT CONDITIONS
Intersection
Intersection Approach Lanes 2 DELAY 3 LEVEL OF Traffic NB SB EB WB (SECS.) SERVICE
Control 1 L T R L T R L T R L T R AM PM AM PM Collier Ave./ Enterprise Way CSS 1 2 0 0 1 1 0 1 0 0 0 0 18.2 25.0 C D
1 CSS = Cross Street Stop
2 L = Left; T = Through; R = Right;
3 Delay and level of service calculated using the following analysis software: Traffix
12

13
Mr. Jim Todd California Gold Development Corporation December 16, 2013
Trames #0092-0002-02
Based on the analysis presented above, the project can be accommodated without significantly impacting the Collier Avenue/Enterprise Way intersection. The level of service worksheets are included in Attachment B. CONCLUSIONS The proposed project will consist of a 19,031 square foot tractor supply building which is estimated to generate 585 trips per day with 28 AM peak hour trip ends and 27 PM peak hour trip ends. Three driveways will be provided to serve the project site. Based on the operational analysis for the Collier Avenue/Enterprise Way intersection, the project will not cause a significant impact during the peak hours at its opening year timeframe. The improvement of a northbound left turn lane and a southbound right turn lane at Collier Avenue/Enterprise Way is recommended to accommodate the project inbound traffic and reduce the delays/conflicts with the adjacent through traffic. If there are any questions regarding the evaluation provided above, please do not hesitate to call me at (949) 244-2436. Respectfully submitted,
Trames Solutions Inc.
Scott Sato, P.E. Senior Associate
14

ATTACHMENT A
TRAFFIC COUNT WORKSHEETS
15

File Name : LKEENCOAMSite Code : 20113498Start Date : 12/5/2013Page No : 1
City of Lake ElsinoreN/S: EnterpriseE/W: Collier AvenueWeather: Sunny
Groups Printed- Total VolumeCollier Avenue
WestboundEnterprise
NorthboundCollier Avenue
EastboundStart Time Left Thru App. Total Left Right App. Total Thru Right App. Total Int. Total07:00 AM 0 131 131 0 1 1 165 1 166 29807:15 AM 0 175 175 1 1 2 198 1 199 37607:30 AM 1 142 143 0 0 0 187 2 189 33207:45 AM 0 160 160 0 0 0 234 0 234 394
Total 1 608 609 1 2 3 784 4 788 1400
08:00 AM 2 164 166 0 0 0 194 0 194 36008:15 AM 4 130 134 0 1 1 174 0 174 30908:30 AM 3 133 136 1 1 2 181 1 182 32008:45 AM 3 130 133 0 2 2 160 0 160 295
Total 12 557 569 1 4 5 709 1 710 1284
Grand Total 13 1165 1178 2 6 8 1493 5 1498 2684Apprch % 1.1 98.9 25 75 99.7 0.3
Total % 0.5 43.4 43.9 0.1 0.2 0.3 55.6 0.2 55.8
Collier AvenueWestbound
EnterpriseNorthbound
Collier AvenueEastbound
Start Time Left Thru App. Total Left Right App. Total Thru Right App. Total Int. TotalPeak Hour Analysis From 07:00 AM to 08:45 AM - Peak 1 of 1Peak Hour for Entire Intersection Begins at 07:15 AM
07:15 AM 0 175 175 1 1 2 198 1 199 37607:30 AM 1 142 143 0 0 0 187 2 189 33207:45 AM 0 160 160 0 0 0 234 0 234 39408:00 AM 2 164 166 0 0 0 194 0 194 360
Total Volume 3 641 644 1 1 2 813 3 816 1462% App. Total 0.5 99.5 50 50 99.6 0.4
PHF .375 .916 .920 .250 .250 .250 .869 .375 .872 .928
Counts Unlimited, Inc.PO Box 1178
Corona, CA 92878(951) 268-6268
16

File Name : LKEENCOAMSite Code : 20113498Start Date : 12/5/2013Page No : 2
City of Lake ElsinoreN/S: EnterpriseE/W: Collier AvenueWeather: Sunny
Col
lier A
venu
e C
ollier Avenue
Enterprise
Thru641
Left3
Out
TotalIn
814 644
1458
Left1
Right1
Out TotalIn6 2 8
Thru81
3 R
ight3
Tota
lO
utIn
642
816
1458
Peak Hour Begins at 07:15 AM Total Volume
Peak Hour Data
North
Peak Hour Analysis From 07:00 AM to 08:45 AM - Peak 1 of 1Peak Hour for Each Approach Begins at:
07:15 AM 08:00 AM 07:15 AM+0 mins. 0 175 175 0 0 0 198 1 199
+15 mins. 1 142 143 0 1 1 187 2 189+30 mins. 0 160 160 1 1 2 234 0 234+45 mins. 2 164 166 0 2 2 194 0 194
Total Volume 3 641 644 1 4 5 813 3 816% App. Total 0.5 99.5 20 80 99.6 0.4
PHF .375 .916 .920 .250 .500 .625 .869 .375 .872
Counts Unlimited, Inc.PO Box 1178
Corona, CA 92878(951) 268-6268
17

File Name : LKEENCOPMSite Code : 20113498Start Date : 12/5/2013Page No : 1
City of Lake ElsinoreN/S: EnterpriseE/W: Collier AvenueWeather: Sunny
Groups Printed- Total VolumeCollier Avenue
WestboundEnterprise
NorthboundCollier Avenue
EastboundStart Time Left Thru App. Total Left Right App. Total Thru Right App. Total Int. Total04:00 PM 0 260 260 0 0 0 253 1 254 51404:15 PM 4 255 259 1 1 2 259 1 260 52104:30 PM 0 308 308 0 2 2 269 0 269 57904:45 PM 1 290 291 0 1 1 289 0 289 581
Total 5 1113 1118 1 4 5 1070 2 1072 2195
05:00 PM 3 322 325 0 2 2 251 0 251 57805:15 PM 1 266 267 0 1 1 264 0 264 53205:30 PM 0 265 265 0 1 1 215 0 215 48105:45 PM 0 248 248 0 0 0 249 0 249 497
Total 4 1101 1105 0 4 4 979 0 979 2088
Grand Total 9 2214 2223 1 8 9 2049 2 2051 4283Apprch % 0.4 99.6 11.1 88.9 99.9 0.1
Total % 0.2 51.7 51.9 0 0.2 0.2 47.8 0 47.9
Collier AvenueWestbound
EnterpriseNorthbound
Collier AvenueEastbound
Start Time Left Thru App. Total Left Right App. Total Thru Right App. Total Int. TotalPeak Hour Analysis From 04:00 PM to 05:45 PM - Peak 1 of 1Peak Hour for Entire Intersection Begins at 04:30 PM
04:30 PM 0 308 308 0 2 2 269 0 269 57904:45 PM 1 290 291 0 1 1 289 0 289 58105:00 PM 3 322 325 0 2 2 251 0 251 57805:15 PM 1 266 267 0 1 1 264 0 264 532
Total Volume 5 1186 1191 0 6 6 1073 0 1073 2270% App. Total 0.4 99.6 0 100 100 0
PHF .417 .921 .916 .000 .750 .750 .928 .000 .928 .977
Counts Unlimited, Inc.PO Box 1178
Corona, CA 92878(951) 268-6268
18

File Name : LKEENCOPMSite Code : 20113498Start Date : 12/5/2013Page No : 2
City of Lake ElsinoreN/S: EnterpriseE/W: Collier AvenueWeather: Sunny
Col
lier A
venu
e C
ollier Avenue
Enterprise
Thru1186
Left5
Out
TotalIn
1079 1191
2270
Left0
Right6
Out TotalIn5 6 11
Thru
1073
R
ight0
Tota
lO
utIn
1186
10
73
2259
Peak Hour Begins at 04:30 PM Total Volume
Peak Hour Data
North
Peak Hour Analysis From 04:00 PM to 05:45 PM - Peak 1 of 1Peak Hour for Each Approach Begins at:
04:30 PM 04:15 PM 04:30 PM+0 mins. 0 308 308 1 1 2 269 0 269
+15 mins. 1 290 291 0 2 2 289 0 289+30 mins. 3 322 325 0 1 1 251 0 251+45 mins. 1 266 267 0 2 2 264 0 264
Total Volume 5 1186 1191 1 6 7 1073 0 1073% App. Total 0.4 99.6 14.3 85.7 100 0
PHF .417 .921 .916 .250 .750 .875 .928 .000 .928
Counts Unlimited, Inc.PO Box 1178
Corona, CA 92878(951) 268-6268
19

ATTACHMENT B
INTERSECTION ANALYSIS CALCULATION WORKSHEETS
20
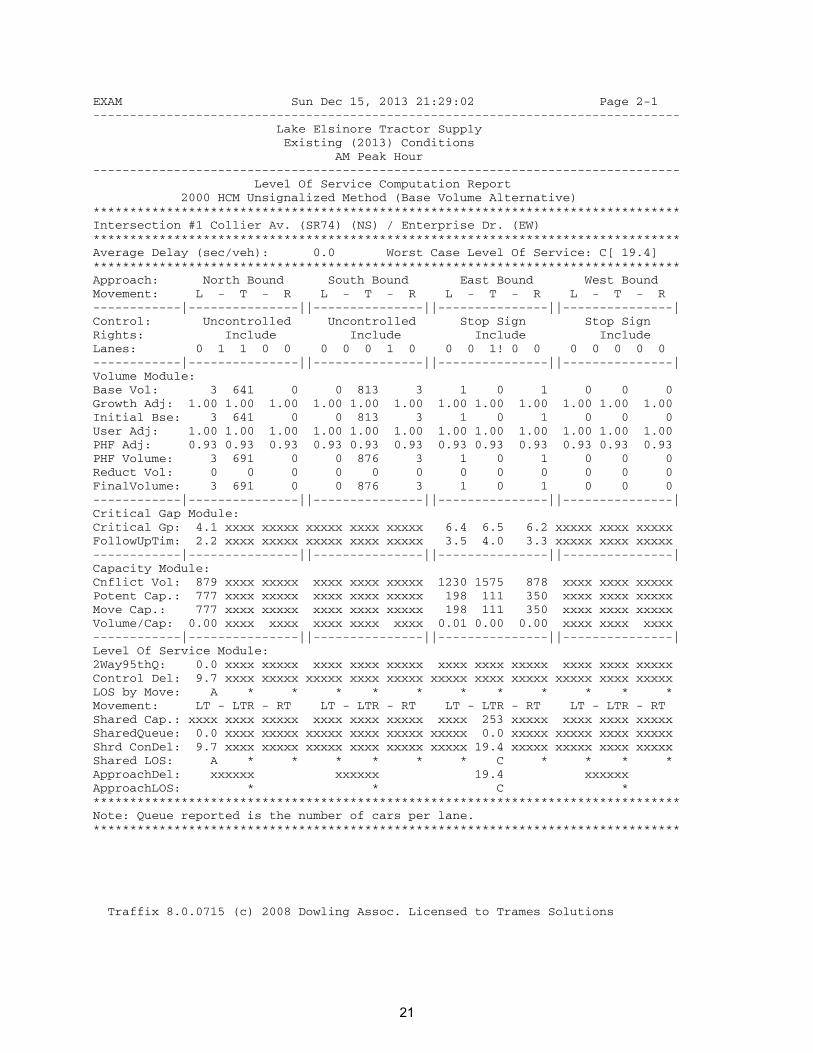
EXAM Sun Dec 15, 2013 21:29:02 Page 2-1 -------------------------------------------------------------------------------- Lake Elsinore Tractor Supply Existing (2013) Conditions AM Peak Hour -------------------------------------------------------------------------------- Level Of Service Computation Report 2000 HCM Unsignalized Method (Base Volume Alternative) ********************************************************************************Intersection #1 Collier Av. (SR74) (NS) / Enterprise Dr. (EW) ********************************************************************************Average Delay (sec/veh): 0.0 Worst Case Level Of Service: C[ 19.4]********************************************************************************Approach: North Bound South Bound East Bound West Bound Movement: L - T - R L - T - R L - T - R L - T - R ------------|---------------||---------------||---------------||---------------|Control: Uncontrolled Uncontrolled Stop Sign Stop Sign Rights: Include Include Include Include Lanes: 0 1 1 0 0 0 0 0 1 0 0 0 1! 0 0 0 0 0 0 0 ------------|---------------||---------------||---------------||---------------|Volume Module:Base Vol: 3 641 0 0 813 3 1 0 1 0 0 0 Growth Adj: 1.00 1.00 1.00 1.00 1.00 1.00 1.00 1.00 1.00 1.00 1.00 1.00 Initial Bse: 3 641 0 0 813 3 1 0 1 0 0 0 User Adj: 1.00 1.00 1.00 1.00 1.00 1.00 1.00 1.00 1.00 1.00 1.00 1.00 PHF Adj: 0.93 0.93 0.93 0.93 0.93 0.93 0.93 0.93 0.93 0.93 0.93 0.93 PHF Volume: 3 691 0 0 876 3 1 0 1 0 0 0 Reduct Vol: 0 0 0 0 0 0 0 0 0 0 0 0 FinalVolume: 3 691 0 0 876 3 1 0 1 0 0 0 ------------|---------------||---------------||---------------||---------------|Critical Gap Module:Critical Gp: 4.1 xxxx xxxxx xxxxx xxxx xxxxx 6.4 6.5 6.2 xxxxx xxxx xxxxx FollowUpTim: 2.2 xxxx xxxxx xxxxx xxxx xxxxx 3.5 4.0 3.3 xxxxx xxxx xxxxx ------------|---------------||---------------||---------------||---------------|Capacity Module:Cnflict Vol: 879 xxxx xxxxx xxxx xxxx xxxxx 1230 1575 878 xxxx xxxx xxxxx Potent Cap.: 777 xxxx xxxxx xxxx xxxx xxxxx 198 111 350 xxxx xxxx xxxxx Move Cap.: 777 xxxx xxxxx xxxx xxxx xxxxx 198 111 350 xxxx xxxx xxxxx Volume/Cap: 0.00 xxxx xxxx xxxx xxxx xxxx 0.01 0.00 0.00 xxxx xxxx xxxx ------------|---------------||---------------||---------------||---------------|Level Of Service Module:2Way95thQ: 0.0 xxxx xxxxx xxxx xxxx xxxxx xxxx xxxx xxxxx xxxx xxxx xxxxx Control Del: 9.7 xxxx xxxxx xxxxx xxxx xxxxx xxxxx xxxx xxxxx xxxxx xxxx xxxxx LOS by Move: A * * * * * * * * * * * Movement: LT - LTR - RT LT - LTR - RT LT - LTR - RT LT - LTR - RT Shared Cap.: xxxx xxxx xxxxx xxxx xxxx xxxxx xxxx 253 xxxxx xxxx xxxx xxxxx SharedQueue: 0.0 xxxx xxxxx xxxxx xxxx xxxxx xxxxx 0.0 xxxxx xxxxx xxxx xxxxx Shrd ConDel: 9.7 xxxx xxxxx xxxxx xxxx xxxxx xxxxx 19.4 xxxxx xxxxx xxxx xxxxx Shared LOS: A * * * * * * C * * * * ApproachDel: xxxxxx xxxxxx 19.4 xxxxxxApproachLOS: * * C * ********************************************************************************Note: Queue reported is the number of cars per lane.********************************************************************************
Traffix 8.0.0715 (c) 2008 Dowling Assoc. Licensed to Trames Solutions
21

EXPM Sun Dec 15, 2013 21:29:47 Page 2-1 -------------------------------------------------------------------------------- Lake Elsinore Tractor Supply Existing (2013) Conditions PM Peak Hour -------------------------------------------------------------------------------- Level Of Service Computation Report 2000 HCM Unsignalized Method (Base Volume Alternative) ********************************************************************************Intersection #1 Collier Av. (SR74) (NS) / Enterprise Dr. (EW) ********************************************************************************Average Delay (sec/veh): 0.1 Worst Case Level Of Service: C[ 19.1]********************************************************************************Approach: North Bound South Bound East Bound West Bound Movement: L - T - R L - T - R L - T - R L - T - R ------------|---------------||---------------||---------------||---------------|Control: Uncontrolled Uncontrolled Stop Sign Stop Sign Rights: Include Include Include Include Lanes: 0 1 1 0 0 0 0 1 0 0 0 0 0 0 1 0 0 0 0 0 ------------|---------------||---------------||---------------||---------------|Volume Module:Base Vol: 5 1186 0 0 1073 0 0 0 6 0 0 0 Growth Adj: 1.00 1.00 1.00 1.00 1.00 1.00 1.00 1.00 1.00 1.00 1.00 1.00 Initial Bse: 5 1186 0 0 1073 0 0 0 6 0 0 0 User Adj: 1.00 1.00 1.00 1.00 1.00 1.00 1.00 1.00 1.00 1.00 1.00 1.00 PHF Adj: 0.98 0.98 0.98 0.98 0.98 0.98 0.98 0.98 0.98 0.98 0.98 0.98 PHF Volume: 5 1214 0 0 1098 0 0 0 6 0 0 0 Reduct Vol: 0 0 0 0 0 0 0 0 0 0 0 0 FinalVolume: 5 1214 0 0 1098 0 0 0 6 0 0 0 ------------|---------------||---------------||---------------||---------------|Critical Gap Module:Critical Gp: 4.1 xxxx xxxxx xxxxx xxxx xxxxx xxxxx xxxx 6.2 xxxxx xxxx xxxxx FollowUpTim: 2.2 xxxx xxxxx xxxxx xxxx xxxxx xxxxx xxxx 3.3 xxxxx xxxx xxxxx ------------|---------------||---------------||---------------||---------------|Capacity Module:Cnflict Vol: 1098 xxxx xxxxx xxxx xxxx xxxxx xxxx xxxx 1098 xxxx xxxx xxxxx Potent Cap.: 643 xxxx xxxxx xxxx xxxx xxxxx xxxx xxxx 261 xxxx xxxx xxxxx Move Cap.: 643 xxxx xxxxx xxxx xxxx xxxxx xxxx xxxx 261 xxxx xxxx xxxxx Volume/Cap: 0.01 xxxx xxxx xxxx xxxx xxxx xxxx xxxx 0.02 xxxx xxxx xxxx ------------|---------------||---------------||---------------||---------------|Level Of Service Module:2Way95thQ: 0.0 xxxx xxxxx xxxx xxxx xxxxx xxxx xxxx 0.1 xxxx xxxx xxxxx Control Del: 10.6 xxxx xxxxx xxxxx xxxx xxxxx xxxxx xxxx 19.1 xxxxx xxxx xxxxx LOS by Move: B * * * * * * * C * * * Movement: LT - LTR - RT LT - LTR - RT LT - LTR - RT LT - LTR - RT Shared Cap.: xxxx xxxx xxxxx xxxx xxxx xxxxx xxxx xxxx xxxxx xxxx xxxx xxxxx SharedQueue: 0.0 xxxx xxxxx xxxxx xxxx xxxxx xxxxx xxxx xxxxx xxxxx xxxx xxxxx Shrd ConDel: 10.6 xxxx xxxxx xxxxx xxxx xxxxx xxxxx xxxx xxxxx xxxxx xxxx xxxxx Shared LOS: B * * * * * * * * * * * ApproachDel: xxxxxx xxxxxx 19.1 xxxxxxApproachLOS: * * C * ********************************************************************************Note: Queue reported is the number of cars per lane.********************************************************************************
Traffix 8.0.0715 (c) 2008 Dowling Assoc. Licensed to Trames Solutions
22

E + A + C + P AM Tue Dec 17, 2013 08:35:42 Page 3-1 -------------------------------------------------------------------------------- Lake Elsinore Tractor Supply Store Traffic Impact Analysis (#0092-0002) Existing + Ambient + Project + Cumulative (2014) Conditions AM Peak Hour -------------------------------------------------------------------------------- Level Of Service Computation Report 2000 HCM Unsignalized Method (Future Volume Alternative) ********************************************************************************Intersection #1 Collier Av. (SR74) (NS) / Enterprise Dr. (EW) ********************************************************************************Average Delay (sec/veh): 0.3 Worst Case Level Of Service: C[ 18.2]********************************************************************************Approach: North Bound South Bound East Bound West Bound Movement: L - T - R L - T - R L - T - R L - T - R ------------|---------------||---------------||---------------||---------------|Control: Uncontrolled Uncontrolled Stop Sign Stop Sign Rights: Include Include Include Include Lanes: 1 0 2 0 0 0 0 1 0 1 0 0 1! 0 0 0 0 0 0 0 ------------|---------------||---------------||---------------||---------------|Volume Module:Base Vol: 3 641 0 0 813 3 1 0 1 0 0 0 Growth Adj: 1.02 1.02 1.02 1.02 1.02 1.02 1.02 1.02 1.02 1.02 1.02 1.02 Initial Bse: 3 654 0 0 829 3 1 0 1 0 0 0 Added Vol: 13 0 0 0 0 1 2 0 10 0 0 0 PasserByVol: 0 0 0 0 0 0 0 0 0 0 0 0 Initial Fut: 16 654 0 0 829 4 3 0 11 0 0 0 User Adj: 1.00 1.00 1.00 1.00 1.00 1.00 1.00 1.00 1.00 1.00 1.00 1.00 PHF Adj: 0.93 0.93 0.93 0.93 0.93 0.93 0.93 0.93 0.93 0.93 0.93 0.93 PHF Volume: 17 705 0 0 894 4 3 0 12 0 0 0 Reduct Vol: 0 0 0 0 0 0 0 0 0 0 0 0 FinalVolume: 17 705 0 0 894 4 3 0 12 0 0 0 ------------|---------------||---------------||---------------||---------------|Critical Gap Module:Critical Gp: 4.1 xxxx xxxxx xxxxx xxxx xxxxx 6.4 6.5 6.2 xxxxx xxxx xxxxx FollowUpTim: 2.2 xxxx xxxxx xxxxx xxxx xxxxx 3.5 4.0 3.3 xxxxx xxxx xxxxx ------------|---------------||---------------||---------------||---------------|Capacity Module:Cnflict Vol: 898 xxxx xxxxx xxxx xxxx xxxxx 1280 1633 894 xxxx xxxx xxxxx Potent Cap.: 765 xxxx xxxxx xxxx xxxx xxxxx 185 102 343 xxxx xxxx xxxxx Move Cap.: 765 xxxx xxxxx xxxx xxxx xxxxx 181 100 343 xxxx xxxx xxxxx Volume/Cap: 0.02 xxxx xxxx xxxx xxxx xxxx 0.02 0.00 0.03 xxxx xxxx xxxx ------------|---------------||---------------||---------------||---------------|Level Of Service Module:2Way95thQ: 0.1 xxxx xxxxx xxxx xxxx xxxxx xxxx xxxx xxxxx xxxx xxxx xxxxx Control Del: 9.8 xxxx xxxxx xxxxx xxxx xxxxx xxxxx xxxx xxxxx xxxxx xxxx xxxxx LOS by Move: A * * * * * * * * * * * Movement: LT - LTR - RT LT - LTR - RT LT - LTR - RT LT - LTR - RT Shared Cap.: xxxx xxxx xxxxx xxxx xxxx xxxxx xxxx 288 xxxxx xxxx xxxx xxxxx SharedQueue:xxxxx xxxx xxxxx xxxxx xxxx xxxxx xxxxx 0.2 xxxxx xxxxx xxxx xxxxx Shrd ConDel:xxxxx xxxx xxxxx xxxxx xxxx xxxxx xxxxx 18.2 xxxxx xxxxx xxxx xxxxx Shared LOS: * * * * * * * C * * * * ApproachDel: xxxxxx xxxxxx 18.2 xxxxxxApproachLOS: * * C * ********************************************************************************Note: Queue reported is the number of cars per lane.********************************************************************************
Traffix 8.0.0715 (c) 2008 Dowling Assoc. Licensed to Trames Solutions
23

E + A + C + P PM Tue Dec 17, 2013 08:36:09 Page 3-1 -------------------------------------------------------------------------------- Lake Elsinore Tractor Supply Store Traffic Impact Analysis (#0092-0002) Existing + Ambient + Project + Cumulative (2014) Conditions PM Peak Hour -------------------------------------------------------------------------------- Level Of Service Computation Report 2000 HCM Unsignalized Method (Future Volume Alternative) ********************************************************************************Intersection #1 Collier Av. (SR74) (NS) / Enterprise Dr. (EW) ********************************************************************************Average Delay (sec/veh): 0.3 Worst Case Level Of Service: D[ 25.0]********************************************************************************Approach: North Bound South Bound East Bound West Bound Movement: L - T - R L - T - R L - T - R L - T - R ------------|---------------||---------------||---------------||---------------|Control: Uncontrolled Uncontrolled Stop Sign Stop Sign Rights: Include Include Include Include Lanes: 1 0 2 0 0 0 0 1 0 1 0 0 1! 0 0 0 0 0 0 0 ------------|---------------||---------------||---------------||---------------|Volume Module:Base Vol: 5 1186 0 0 1073 0 0 0 6 0 0 0 Growth Adj: 1.02 1.02 1.02 1.02 1.02 1.02 1.02 1.02 1.02 1.02 1.02 1.02 Initial Bse: 5 1210 0 0 1094 0 0 0 6 0 0 0 Added Vol: 10 0 0 0 0 1 3 0 11 0 0 0 PasserByVol: 0 0 0 0 0 0 0 0 0 0 0 0 Initial Fut: 15 1210 0 0 1094 1 3 0 17 0 0 0 User Adj: 1.00 1.00 1.00 1.00 1.00 1.00 1.00 1.00 1.00 1.00 1.00 1.00 PHF Adj: 0.98 0.98 0.98 0.98 0.98 0.98 0.98 0.98 0.98 0.98 0.98 0.98 PHF Volume: 15 1238 0 0 1120 1 3 0 18 0 0 0 Reduct Vol: 0 0 0 0 0 0 0 0 0 0 0 0 FinalVolume: 15 1238 0 0 1120 1 3 0 18 0 0 0 ------------|---------------||---------------||---------------||---------------|Critical Gap Module:Critical Gp: 4.1 xxxx xxxxx xxxxx xxxx xxxxx 6.4 6.5 6.2 xxxxx xxxx xxxxx FollowUpTim: 2.2 xxxx xxxxx xxxxx xxxx xxxxx 3.5 4.0 3.3 xxxxx xxxx xxxxx ------------|---------------||---------------||---------------||---------------|Capacity Module:Cnflict Vol: 1121 xxxx xxxxx xxxx xxxx xxxxx 1770 2389 1120 xxxx xxxx xxxxx Potent Cap.: 630 xxxx xxxxx xxxx xxxx xxxxx 93 34 254 xxxx xxxx xxxxx Move Cap.: 630 xxxx xxxxx xxxx xxxx xxxxx 91 34 254 xxxx xxxx xxxxx Volume/Cap: 0.02 xxxx xxxx xxxx xxxx xxxx 0.03 0.00 0.07 xxxx xxxx xxxx ------------|---------------||---------------||---------------||---------------|Level Of Service Module:2Way95thQ: 0.1 xxxx xxxxx xxxx xxxx xxxxx xxxx xxxx xxxxx xxxx xxxx xxxxx Control Del: 10.9 xxxx xxxxx xxxxx xxxx xxxxx xxxxx xxxx xxxxx xxxxx xxxx xxxxx LOS by Move: B * * * * * * * * * * * Movement: LT - LTR - RT LT - LTR - RT LT - LTR - RT LT - LTR - RT Shared Cap.: xxxx xxxx xxxxx xxxx xxxx xxxxx xxxx 200 xxxxx xxxx xxxx xxxxx SharedQueue:xxxxx xxxx xxxxx xxxxx xxxx xxxxx xxxxx 0.3 xxxxx xxxxx xxxx xxxxx Shrd ConDel:xxxxx xxxx xxxxx xxxxx xxxx xxxxx xxxxx 25.0 xxxxx xxxxx xxxx xxxxx Shared LOS: * * * * * * * D * * * * ApproachDel: xxxxxx xxxxxx 25.0 xxxxxxApproachLOS: * * D * ********************************************************************************Note: Queue reported is the number of cars per lane.********************************************************************************
Traffix 8.0.0715 (c) 2008 Dowling Assoc. Licensed to Trames Solutions
24