appendix d transportati on and traffic … · janelle trant - project manger, transportation...
TRANSCRIPT

APPENDIX
D TRANSPORTATION AND TRAFFIC ANALYSIS


TECHNICAL MEMORANDUM
161-09178_MEM-01 Traffic Report_v1-20161209.docx
WSP Canada Inc. 100 Commerce Valley Drive West Thornhill, ON L3T 0A1 Telephone: 905.882-1100 Fax: 905.882-0055 www.wspgroup.com
Date: December 9, 2016
To: Janelle Trant - Project Manger, Transportation Management - City of Hamilton
From: Mehemed Delibasic and Juan P. Perez
Project No.: 161-09178-00
Subject: King Street West (Dundas) Bridge 248 Municipal Class Environmental Assessment Transportation and Traffic Analysis
We are pleased to provide the following memorandum detailing the Transportation and Traffic Analysis components as part of the Municipal Class Environmental Assessment for the King Street (Dundas) Bridge 248, in the City of Hamilton. This Traffic Study is associated with the subject EA.
1. Introduction
The City of Hamilton has initiated a Municipal Class Environmental Assessment (EA) process to facilitate the bridge rehabilitation works on the ‘King Street West Bridge (Bridge #248). The King Street West Bridge is located at the crossing of King Street West/Highway 8 and Spencer Creek, just north of the intersection with Bond Street North.
The study will examine various options such as rehabilitate the existing bridge, confirm the need to replace the bridge and construct a new bridge downstream with a re-alignment of King Street West. The study will also identify the environmental impacts, social impacts, cultural impacts, economic impacts and costs for each of the alternative designs, and determine the preferred alternative.
The King Street West Bridge (Bridge #248) provides a connection between the communities of Dundas and Greensville, over Spencer Creek. The bridge consists of two vehicular traffic lanes located over the river, and has an operational status of being open and in use. There is a sidewalk along the east side of the bridge. This Traffic Study includes a traffic operations analysis, roadway capacity analysis, collision analysis, active transportation review, and transit review. The horizon years are existing (2016) and 2026, while the time periods contained in the analysis include roadway AM and PM peak hours.
Figure 1-1 describes the study area along King Street West/Highway 8.

Janelle Trant - Project Manger, Transportation Management - City of Hamilton December 9, 2016 161-09178-00 Page 2
161-09178_MEM-01 Traffic Report_v1-20161209.docx
Figure 1-1 Study Area
2. Existing Traffic Conditions
2.1 Existing Road Network
King Street West/Highway 8 is a 2-lane highway under the jurisdiction of the City of Hamilton. Highway 8 runs east-west within the study area and connects the communities of Greensville and Dundas. There is a grade-separated rail crossing approximately 330m west of the bridge with a vertical clearance of 4.0m. There are no signalized intersections along Highway 8 within the study area. The posted speed limit on Highway 8 is 50 km/h and there are advisory speed limit signs before the bridge (30 km/h).
The Spencer Creek Bridge carries two lanes of north-south traffic and has a width of 7.32 to 7.52m (curb to curb). The bridge has a 2.5m sidewalk on the east side. King Street West/Highway 8 has an urban cross section east of the Spencer Creek Bridge and a rural cross section west of the bridge.
There are two intersections within the study area, both are two-way stop control with the right-of-way assigned to King Street/Highway 8:
→ Woodleys Lane: is a skewed “T” intersection and Woodleys Lane serves as access to the Dundas Valley Golf and Curling Club. The eastbound approach from King Street/Highway 8 has a “Hidden Intersection” sign approximately 150m before the intersection with Woodleys Lane.
→ Bond Street: is a four-leg intersection in a residential area with no dedicated lanes for turning movements. There is a bus stop on the southeast corner which is served by Hamilton Street Railway (HSR) Route 5 – Delaware.

Janelle Trant - Project Manger, Transportation Management - City of Hamilton December 9, 2016 161-09178-00 Page 3
161-09178_MEM-01 Traffic Report_v1-20161209.docx
2.2 Existing Traffic Volumes
2.2.1 Link/ Midblock Volumes
Based on City of Hamilton website information, Annual Average Daily Traffic (AADT) on King Street West/Highway 8 was approximately 9,300 vehicles per day in 2013. The City also provided midblock traffic counts at the Spencer Creek Bridge (carried out in October 5, 2016). Table 2-1 summarizes historic AADT data.
Table 2-1 – Historic AADT’s on King Street West/Highway 8 within Study Area
Year EB Count WB Count Total AADT
2013 4,644 4,656 9,300
2016 4,358 4,386 8,744
After reviewing previous traffic count data, very little variation in link volume was observed during the last three years.
In terms of link/midblock capacity analysis within King Street/Highway 8, a maximum link capacity of 880 vehicles per hour per lane is typically assumed. Volumes higher than 792 vehicles per hour per lane will indicate the need for additional link capacity as the volume-to-capacity (V/C) ratio will be greater than 0.90. Table 2-2 shows existing peak direction link volumes and v/c ratios based on 2016 traffic counts.
Table 2-2 – 2016 Existing Conditions Link Capacity Analysis on King Street/ Highway 8 between Bond Street and Woodleys Lane
Peak Hour Hourly Volume (peak direction) V/C
7:45AM – 8:45AM 428 (EB) 0.49
4:30PM – 5:30PM 384 (WB) 0.44
Based on these link V/C ratios, currently there is no need for widening of King Street/Highway 8 within the study area.
Detailed midblock traffic data is included in Attachment 1.
2.2.2 Intersection Turning Volumes
The following study intersections are included in this report:
→ King Street West/Highway 8 at Woodleys Lane
→ King Street West/Highway 8 at Bond Street
Analysis peak hours included the weekday AM and PM peak hours. Turning movement counts were obtained from the City of Hamilton and are described in Table 2-3.

Janelle Trant - Project Manger, Transportation Management - City of Hamilton December 9, 2016 161-09178-00 Page 4
161-09178_MEM-01 Traffic Report_v1-20161209.docx
Table 2-3 – Intersection Turning Movement Count Sources
Intersection Survey Date and Time Weekday Peak Hour
AM Peak Hour PM Peak Hour
King Street West/ Highway 8 at Woodleys Lane
Friday, October 14, 2016
7:00AM – 10:00AM, 1:30PM – 3:30PM, 4:00PM – 7:00PM
8:00AM – 9:00AM 4:45PM – 5:45PM
King Street West/Highway 8 at Bond Street
Thursday, October 13, 2016
7:00AM – 10:00AM, 1:30PM – 3:30PM, 4:00PM – 7:00PM
8:15AM – 9:15AM 4:30PM – 5:30PM
Existing traffic volumes in the AM and PM peak hours are provided in Figure 2-1. Detailed turning movement counts are provided in Attachment 2.

Existing Traffic Volumes, AM Peak Hour
N
Sbd Nbd
17 7
R T L
8 3 6
Wbd 249 271 Wbd Wbd 273 L 2 4 R 261 Wbd
T 398 1 249 T T 411 2 254 T
Ebd 406 R 8 22 L 398 Ebd Ebd 422 R 9 3 L 426 Ebd
0 0 11 1 9
L R L T R
30 0 15 21
Sbd Nbd Sbd Nbd
Existing Traffic Volumes, PM Peak Hour
Sbd Nbd
18 20
R T L
13 0 5
Wbd 410 413 Wbd Wbd 400 L 12 6 R 397 Wbd
T 393 1 405 T T 356 2 381 T
Ebd 395 R 2 8 L 414 Ebd Ebd 379 R 11 10 L 372 Ebd
5 21 6 2 11
L R L T R
10 26 21 19
Sbd Nbd Sbd Nbd
Source: City of Hamilton November 8, 2016 Schematic
Figure 2-1
Existing (2016) Traffic Volumes, Weekday AM and PM Peak Hour
King Street West Bridge 248 Municipal Class EA - Transportation Analysis
161-09178_TrafficModel_v0-1_20161130.xlsx
Bond Street
North
Kin
g S
tre
et/
Hig
hw
ay 8
Kin
g S
tre
et/
Hig
hw
ay 8
Woodleys LaneBond Street
South
Bond Street
North
Kin
g S
tre
et/
Hig
hw
ay 8
Kin
g S
tre
et/
Hig
hw
ay 8
Woodleys LaneBond Street
South
12/9/2016 WSP 161-09178_TrafficModel_v0-1_20161130.xlsx

Janelle Trant - Project Manger, Transportation Management - City of Hamilton December 9, 2016 161-09178-00 Page 6
161-09178_MEM-01 Traffic Report_v1-20161209.docx
2.3 Existing Traffic Operations
WSP performed capacity analysis for the indicated intersections by using Highway Capacity Manual (HCM) Methodology and Synchro 8.0 software. Traffic operations analysis was based on Synchro Modelling requirements from the City of Hamilton Traffic Impact Study Guidelines (July 2009). This analysis is based on existing lane configurations and takes into consideration a peak hour factor of 0.92 and heavy vehicle percentages from the actual traffic counts. Table 2-4 provides a summary of intersection levels of service (LOS) and V/C ratios
Table 2-4 – Existing Intersection Capacity Analyses
Intersection AM Peak Hour PM Peak Hour
Movement V/C Delay (sec.) LOS V/C
Delay (sec.) LOS
King Street West and Woodleys Lane
Eastbound Through/Right 0.26 0 A 0.25 0 A
Westbound Through/Left 0.02 1 A 0.01 0 A
Northbound Left/Right 0.00 0 A 0.05 12 B
King Street West and Bond Street
Eastbound Left/Through/Right 0.00 0 A 0.01 0 A
Westbound Left/Through/Right 0.00 0 A 0.01 0 A
Northbound Left/Through/Right 0.06 15 B 0.05 15 B
Southbound Left/Through/Right 0.04 14 B 0.04 13 B
Results of the capacity analyses for existing conditions indicate that all intersection movements are operating at good levels of service and delay during the weekday AM and PM peak hours, as shown in Table 2-4.
Detailed Synchro Reports are included in Attachment 3.
2.4 Review of Collision Data
WSP conducted a review of existing conditions within the study area including the last five years of collision history (October 2011 to October 2016). Collision data was extracted from the City’s collision database by the City staff and provided to WSP on November 21, 2016.
Seventeen collisions occurred during the last five years within the study area. Four of the collisions were intersection-related, with three collisions occurring at the intersection of King Road at Woodleys Lane. These collisions may have occurred due to an ‘unconventional’ intersection configuration and could be avoided by the provision of a better alignment and sight distance.
In terms of severity, approximately 41 percent of collisions (7 out of 17) caused property damage only, approximately 59 percent involved non-fatal injuries (10 out of 17) and there were no fatalities.
Most of collisions, approximately 76 percent, occurred during daylight (13 out of 17) while approximately 12 percent occurred during dark/artificial lighting conditions (2 out of 17) and approximately 6 percent occurred at dusk.
Regarding impact type, a significant amount of collisions involved single moving vehicles (SMV). Approximately 47 percent of collisions involved single moving vehicles (8 out of 17, and two of them struck unattended/parked vehicles very close to the Bond Street intersection.

Janelle Trant - Project Manger, Transportation Management - City of Hamilton December 9, 2016 161-09178-00 Page 7
161-09178_MEM-01 Traffic Report_v1-20161209.docx
Rain and road alignment (either curve on hill or curve on level) might be a factor on approximately 47 percent of collisions (8 out of 17). In four of those events, the driver lost control of the vehicle and it skidded/sled. The potential realignment of this road section may help prevent future accident occurrences.
Detailed Accident Reports are included in Attachment 4.
3. Future Traffic Conditions
3.1 Growth Rates
WSP reviewed two sources of information in order to estimate future year traffic on King Road/Highway 8:
→ historic traffic volumes
→ City of Hamilton Travel Demand Model (EMME model – volume plots within study area)
As indicated in Section 2.2.1, historic AADT volumes indicate a slight decrease during the 2013 to 2016 time period.
Furthermore, the City’s Travel Demand Model plots for the Spencer Creek Bridge 248 location provided volume information for years 2011 and 2031 as described in Table 3-1.
Table 3-1 – Link Volumes from Hamilton Travel Demand Model
Year Link Flow
EB WB Total
2011 343 505 848
2031 685 330 1,015
Table 3-1 indicates a forecasted average growth rate of approximately 0.9 percent per year for both directions.
According to information provided by the City of Hamilton, population growth in the study area is estimated at approximately 1.0 percent per year.
A growth rate of 1.0 percent per annum was assumed for King Street West/ Highway 8 and Bond Street. No growth rate was applied to turning movements associated with Woodleys Lane since this road serves primarily the Dundas Valley Golf and Curling Club, which is a facility that is not expected to generate additional traffic growth in the foreseeable future.

Janelle Trant - Project Manger, Transportation Management - City of Hamilton December 9, 2016 161-09178-00 Page 8
161-09178_MEM-01 Traffic Report_v1-20161209.docx
3.2 Future (2026) Traffic
The horizon year for future traffic analysis is 2026 (ten years from existing conditions).
3.2.1 Link/Midblock Volumes
Future (2026) traffic for the study horizon was calculated by applying a 1.0 percent annual growth rate over ten years to the existing volumes. Table 3-2 shows a comparison of existing and future volumes along with their respective volume-over-capacity ratios.
Table 3-2 - Link Capacity Analysis on King Street/ Highway 8 between Bond Street and Woodleys Lane – Year Comparison 2016/2026
Hourly Volume (peak direction) V/C
Peak Hour 2016 2026 2016 2026
7:45AM – 8:45AM 428 (EB) 473 (EB) 0.49 0.54
4:30PM – 5:30PM 384 (WB) 424 (WB) 0.44 0.48
Based on these link V/C ratios, there is no need for widening of King Street/Highway 8 within the study area for the following ten years.
3.2.2 Intersection Turning Volumes
Future (2026) traffic for the study horizon was calculated by adding the projected traffic growth and the existing traffic. Future (2026) volumes for the AM and PM peak hours are presented in Figure 3-1.

Existing Traffic Volumes, AM Peak Hour
N
Sbd Nbd
19 8
R T L
9 3 7
Wbd 275 297 Wbd Wbd 302 L 2 4 R 288 Wbd
T 440 1 275 T T 454 2 281 T
Ebd 448 R 8 22 L 440 Ebd Ebd 466 R 10 3 L 471 Ebd
0 0 12 1 10
L R L T R
30 0 17 23
Sbd Nbd Sbd Nbd
Existing Traffic Volumes, PM Peak Hour
Sbd Nbd
20 22
R T L
14 0 6
Wbd 452 455 Wbd Wbd 442 L 13 7 R 439 Wbd
T 434 1 447 T T 393 2 421 T
Ebd 436 R 2 8 L 455 Ebd Ebd 419 R 12 11 L 411 Ebd
5 21 7 2 12
L R L T R
10 26 23 21
Sbd Nbd Sbd Nbd
Source: City of Hamilton November 8, 2016 Schematic
Figure 3-1
Future (2026) Traffic Volumes, Weekday AM and PM Peak Hour
King Street West Bridge 248 Municipal Class EA - Transportation Analysis
161-09178_TrafficModel_v0-1_20161130.xlsx
Bond Street
North
Kin
g S
tre
et/
Hig
hw
ay 8
Kin
g S
tre
et/
Hig
hw
ay 8
Woodleys LaneBond Street
South
Bond Street
North
Kin
g S
tre
et/
Hig
hw
ay 8
Kin
g S
tre
et/
Hig
hw
ay 8
Woodleys LaneBond Street
South
12/9/2016 WSP 161-09178_TrafficModel_v0-1_20161130.xlsx

Janelle Trant - Project Manger, Transportation Management - City of Hamilton December 9, 2016 161-09178-00 Page 10
161-09178_MEM-01 Traffic Report_v1-20161209.docx
3.3 Future (2026) Traffic Operations Analysis
Intersection capacity analyses for the future (2026) horizon traffic conditions were completed for the two study area intersections to determine Levels of service and volume-over-capacity ratios during the AM and PM peak hours. Intersection operations were analyzed using HCM methodology and Synchro 8.0 software. Table 7 provides a summary of intersection operation metrics under future (2026) traffic conditions.
Table 3-3 – Future (2026) Intersection Traffic Operations
Intersection AM Peak Hour PM Peak Hour
Movement V/C Delay (sec.) LOS V/C
Delay (sec.) LOS
King Street West and Woodleys Lane
Eastbound Through/Right 0.29 0 A 0.28 0 A
Westbound Through/Left 0.02 1 A 0.01 0 A
Northbound Left/Right 0.00 0 A 0.06 13 B
King Street West and Bond Street
Eastbound Left/Through/Right 0.00 0 A 0.01 0 A
Westbound Left/Through/Right 0.00 0 A 0.01 0 A
Northbound Left/Through/Right 0.07 16 C 0.07 16 C
Southbound Left/Through/Right 0.05 15 B 0.06 15 B
Results of the capacity analyses for future (2026) conditions indicate that all intersection movements will operate at good levels of service and delay during the weekday AM and PM peak hours, as shown in Table 3-3. Furthermore, there will not be deterioration of traffic conditions at the study intersections with the projected traffic growth.
4. Transit
Hamilton’s Transportation Master Plan - City in Motion (2007) summarizes transit services under existing conditions and provides high level recommendations for implementation.
HSR Transit route No. 5 – Delaware serves the residential area and has a stop at the corner of King Street West/Highway 8 with Bond Street. Bus service is provided Monday to Sunday approximately every 30 minutes at this stop. Figure 4-1 describes transit service in the study area.

Janelle Trant - Project Manger, Transportation Management - City of Hamilton December 9, 2016 161-09178-00 Page 11
161-09178_MEM-01 Traffic Report_v1-20161209.docx
Figure 4-1 – Transit Route in Study Area
Source: HSR System Map – September 2016
Hamilton’s Transportation Master Plan - City in Motion (2007) does not anticipate a need for transit expansion within the study area.
5. Active Transportation
Hamilton’s Cycling Master Plan – Shifting Gears (2009) establishes priorities for implementation of cycling facilities within the City. The Plan proposed multi-use path on the section of King Street West/ Highway 8 west of Spencer Bridge. On the east section of King Road West/ Highway 8 (east of the Spencer Creek Bridge), the Plan proposes a bike lane. Figure 3 illustrates the preferred cycling network as proposed by the Cycling Master Plan.
Hamilton’s Transportation Master Plan - City in Motion (2007) proposed an on-street bike lane on a 1.7 km section of King Street West/ Highway 8 from bond Street to Brock Road, with Spencer Creek Bridge 248 being included in this section. In terms of timing, this on-street infrastructure facility was proposed for medium-term (2012 to 2016). Figure 5-1 describes existing and proposed cycling facilities in the study area.

Janelle Trant - Project Manger, Transportation Management - City of Hamilton December 9, 2016 161-09178-00 Page 12
161-09178_MEM-01 Traffic Report_v1-20161209.docx
Figure 5-1 – Preferred Cycling Network from Cycling Master Plan
Source: Hamilton’s Cycling Master Plan – Appendix B – Preferred Cycling Network Map
It is expected that the new bridge will provide accommodation for bicyclists and pedestrians in order to promote active modes of transportation.
6. Summary and Recommendations
The Traffic analysis associated with the Traffic Report for the Municipal Class EA process to facilitate the bridge rehabilitation works on the ‘King Street West Bridge (Bridge #248) in the City of Hamilton is summarized as follows:
→ The existing roadway in the study area, King Street West/ Highway 8 (running east to west) provides connection between the communities of Dundas and Greensville, with Bridge 248 crossing over Spencer Creek.
→ This Traffic Study includes a traffic operations analysis and roadway capacity analysis for horizon years 2016/ existing and 2026, while the time periods contained in the analysis include roadway AM and PM peak hours.
→ There are no signalized intersections along Highway 8 within the study area. The posted speed limit on Highway 8 is 50 km/h and there are advisory speed limit signs before the bridge (30 km/h).
→ Total AADT’s on Highway 8 within the study area have decreased slightly from 9,300 vehicles per day in 2013 to 8,744 in 2016.
→ Based on these link V/C ratios, currently there is no need for widening of King Street/Highway 8 within the study area.

Janelle Trant - Project Manger, Transportation Management - City of Hamilton December 9, 2016 161-09178-00 Page 13
161-09178_MEM-01 Traffic Report_v1-20161209.docx
→ Results of the intersection capacity analyses for existing conditions indicate that all intersection movements are operating at good levels of service and delay during the weekday AM and PM peak hours.
→ Seventeen collisions occurred during the last five years within the study area. Four of the collisions were intersection-related, with three collisions occurring at the intersection of King Road at Woodleys Lane. These collisions may have occurred due to an ‘unconventional’ intersection configuration and could be avoided by the provision of a better alignment and sight distance.
→ Approximately 41 percent of collisions caused property damage only, 59 percent involved non-fatal injuries and there were no fatalities.
→ Potential realignment of King Street West/ Highway 8 within the study area may help prevent future accident occurrences, especially during winter and rainy seasons.
→ Based on review of historic traffic data and Region’s Demand Model, a growth rate of 1.0 percent per annum was assumed for King Street West/ Highway 8 and Bond Street for ten-year horizon analysis (2026).
→ Based on projected V/C ratios, there is no need for widening of King Street/Highway 8 within the study area for the following ten years.
→ Results of the capacity analyses for future (2026) conditions indicate that all intersection movements will operate at good levels of service and delay during the weekday AM and PM peak hours.
→ Currently, the study area is served by HSR Transit route No. 5 – Delaware, with a stop at the corner of King Street West/Highway 8 with Bond Street.
→ Hamilton’s Transportation Master Plan - City in Motion (2007) does not anticipate a need for transit expansion within the study area.
→ The City of Hamilton has a large pathway system that connects parks and valleys, and provides convenient pedestrian and cycling routes across the study area.
→ Hamilton’s Cycling Master Plan – Shifting Gears (2009) proposed multi-use path on the section of King Street West/ Highway 8 west of Spencer Bridge. On the east section of King Road West/ Highway 8 (east of the Spencer Creek Bridge), the Plan proposes a bike lane.
→ Hamilton’s Transportation Master Plan - City in Motion (2007) proposed an on-street bike lane on a 1.7 km section of King Street West/ Highway 8 from bond Street to Brock Road, with Spencer Creek Bridge 248 being included in this section.
→ The new bridge (if constructed) should provide accommodation for bicyclists and pedestrians in order to promote active modes of transportation.

Attachment 1
MIDBLOCK TRAFFIC DATA


Prepared For: City of Hamilton
Prepared By: PYRAMID Traffic Inc. Site ID: 1
Location: King St W, btwn Bond St & Woodley Ln Interval: 15 min.
Start Date: Wednesday Oct 5, 2016
Period Channel 1 Channel 2 Hourly Period Channel 1 Channel 2 Hourly
Ending EB WB Summary Ending EB WB Summary
0:15 7 8 12:15 67 62 494
0:30 4 6 12:30 70 62 517
0:45 1 5 12:45 68 53 499
1:00 7 0 38 13:00 64 82 528
1:15 7 1 31 13:15 70 74 543
1:30 2 4 27 13:30 68 69 548
1:45 0 4 25 13:45 65 71 563
2:00 4 2 24 14:00 63 59 539
2:15 1 2 19 14:15 58 61 514
2:30 2 3 18 14:30 66 84 527
2:45 3 1 18 14:45 80 78 549
3:00 3 1 16 15:00 70 96 593
3:15 0 3 16 15:15 76 84 634
3:30 2 3 16 15:30 90 82 656
3:45 3 1 16 15:45 90 88 676
4:00 2 2 16 16:00 83 99 692
4:15 1 0 14 16:15 78 98 708
4:30 2 3 14 16:30 91 85 712
4:45 5 3 18 16:45 70 100 704
5:00 1 4 19 17:00 70 97 689
5:15 8 3 29 17:15 82 83 678
5:30 8 12 44 17:30 103 104 7095:45 5 12 53 17:45 84 99 722
6:00 12 12 72 18:00 86 96 737
6:15 13 17 91 18:15 71 67 710
6:30 19 29 119 18:30 78 72 653
6:45 29 26 157 18:45 68 67 605
7:00 39 36 208 19:00 80 65 568
7:15 36 43 257 19:15 65 77 572
7:30 57 58 324 19:30 58 56 536
7:45 75 69 413 19:45 56 48 505
8:00 104 81 523 20:00 55 41 456
8:15 114 55 613 20:15 47 51 4128:30 119 94 711 20:30 43 44 385
8:45 91 66 724 20:45 49 44 374
9:00 84 89 712 21:00 44 35 357
9:15 86 66 695 21:15 27 53 339
9:30 65 64 611 21:30 26 41 319
9:45 66 56 576 21:45 18 31 275
10:00 76 61 540 22:00 33 27 256
10:15 77 52 517 22:15 23 32 231
10:30 55 46 489 22:30 13 32 209
10:45 49 70 486 22:45 7 18 185
11:00 65 54 468 23:00 14 13 152
11:15 54 57 450 23:15 8 10 115
11:30 57 52 458 23:30 12 9 91
11:45 60 79 478 23:45 7 8 8112:00 56 61 476 0:00 8 3 65
AM Peak: 724 PM Peak: 737 24 HR VOLUME: 8744

Street: King St W - EB
City: City of Hamilton
Computer Generated Summary Report
MH Corbin Traffic Analyzer Study
Location: 1
A study of vehicle traffic was conducted with the device having serial number 134624. The study was donein the EB lane at King St W - EB in City of Hamilton, ON in btwn Bond St & Woodley Ln county. The studybegan on 2016-10-05 at 12:00 AM and concluded on 2016-10-06 at 12:00 AM, lasting a total of 24.00 hours.Traffic statistics were recorded in 15 minute time periods. The total recorded volume showed 4,358 vehiclespassed through the location with a peak volume of 119 on 2016-10-05 at [08:15 AM-08:30 AM] and aminimum volume of 0 on 2016-10-05 at [01:30 AM-01:45 AM]. The AADT count for this study was 4,358.
Chart 1 lists the values of the speed bins and the total traffic volume for each bin. At least half the vehicleswere traveling in the 40 - 50 KM/H range or lower. The average speed for all classifed vehicles was 49KM/H with 45.49% vehicles exceeding the posted speed of 50 KM/H. 0.21% percent of the total vehicleswere traveling in excess of 89 KM/H. The mode speed for this traffic study was 40KM/H and the 85thpercentile was 57.25 KM/H.
SPEED
< 10 20 30 40 50 60 70 80 90 100 110 120 130 140
9 19 29 39 49 59 69 79 89 99 109 119 129 139 >
CHART 1
0 5 28 268 2042 1808 118 20 4 5 0 0 0 0 0
to to to to to to to to to to to to to to to
Chart 2 lists the values of the classification bins and the total traffic volume accumulated for each bin.
CLASSIFICATION
Most of the vehicles classified during the study were Passenger Vehicles. The number of PassengerVehicles in the study was 4193 which represents 98 percent of the total classified vehicles. The number ofSmall Trucks in the study was 28 which represents 1 percent of the total classified vehicles. The number ofTrucks/Buses in the study was 48 which represents 1 percent of the total classified vehicles. The number ofTractor Trailers in the study was 29 which represents 1 percent of the total classified vehicles.
< 5.0 8.5 10.0 13.0 19.0 22.5
4.9 8.4 9.9 12.9 15.9 18.9 22.4 >
16.0
CHART 2
2784 1409 28 48 16 10 3 0
to to to to to to to to
During the peak traffic period, on 2016-10-05 at [08:15 AM-08:30 AM] the average headway betweenvehicles was 7.5 seconds. During the slowest traffic period, on 2016-10-05 at [01:30 AM-01:45 AM] theaverage headway between vehicles was 900 seconds.
HEADWAY
WEATHER
The roadway surface temperature over the period of the study varied between 15.00 and 37.00 degrees C.
Page:2016-10-19 01:09 PM 1

Class/Volume Report Graph
HI-Star ID: 20DE0 Begin: 2016-10-05 12:00 AM End: 2016-10-06 12:00 AM
Street: King St W - EB Lane: EB Hours: 24:00
State: ON Oper: MD Period: 15
City: City of Hamilton Posted: 50 Raw Count: 4358
Area: btwn Bond St & Woodley Ln AADT Factor: 1 AADT Count: 4358
NC200 - Metres 0.0 to 4.9 5.0 to 8.4 8.5 to 9.9 10.0 to 12.913.0 to 15.916.0 to 18.919.0 to 22.4 22.5 > Total
2016-10-05 [12:00 AM-12:15 AM] 7 5 2 0 0 0 0 0 0 7 |||
2016-10-05 [12:15 AM-12:30 AM] 4 3 1 0 0 0 0 0 0 4 ||
2016-10-05 [12:30 AM-12:45 AM] 1 0 0 0 0 0 0 0 0 0
2016-10-05 [12:45 AM-01:00 AM] 7 4 3 0 0 0 0 0 0 7 |||
19 12 6 0 0 0 0 0 0 18
2016-10-05 [01:00 AM-01:15 AM] 7 3 4 0 0 0 0 0 0 7 |||
2016-10-05 [01:15 AM-01:30 AM] 2 2 0 0 0 0 0 0 0 2 |
2016-10-05 [01:30 AM-01:45 AM] 0 0 0 0 0 0 0 0 0 0
2016-10-05 [01:45 AM-02:00 AM] 4 3 1 0 0 0 0 0 0 4 ||
13 8 5 0 0 0 0 0 0 13
2016-10-05 [02:00 AM-02:15 AM] 1 1 0 0 0 0 0 0 0 1
2016-10-05 [02:15 AM-02:30 AM] 2 1 1 0 0 0 0 0 0 2 |
2016-10-05 [02:30 AM-02:45 AM] 3 3 0 0 0 0 0 0 0 3 |
2016-10-05 [02:45 AM-03:00 AM] 3 2 1 0 0 0 0 0 0 3 |
9 7 2 0 0 0 0 0 0 9
2016-10-05 [03:00 AM-03:15 AM] 0 0 0 0 0 0 0 0 0 0
2016-10-05 [03:15 AM-03:30 AM] 2 2 0 0 0 0 0 0 0 2 |
2016-10-05 [03:30 AM-03:45 AM] 3 1 2 0 0 0 0 0 0 3 |
2016-10-05 [03:45 AM-04:00 AM] 2 1 0 1 0 0 0 0 0 2 |
7 4 2 1 0 0 0 0 0 7
2016-10-05 [04:00 AM-04:15 AM] 1 1 0 0 0 0 0 0 0 1
2016-10-05 [04:15 AM-04:30 AM] 2 0 2 0 0 0 0 0 0 2 |
2016-10-05 [04:30 AM-04:45 AM] 5 2 3 0 0 0 0 0 0 5 ||
2016-10-05 [04:45 AM-05:00 AM] 1 0 1 0 0 0 0 0 0 1
9 3 6 0 0 0 0 0 0 9
2016-10-05 [05:00 AM-05:15 AM] 8 4 4 0 0 0 0 0 0 8 |||
2016-10-05 [05:15 AM-05:30 AM] 8 4 4 0 0 0 0 0 0 8 |||
2016-10-05 [05:30 AM-05:45 AM] 5 3 2 0 0 0 0 0 0 5 ||
2016-10-05 [05:45 AM-06:00 AM] 12 8 4 0 0 0 0 0 0 12 |||||
33 19 14 0 0 0 0 0 0 33
2016-10-05 [06:00 AM-06:15 AM] 13 9 4 0 0 0 0 0 0 13 |||||
2016-10-05 [06:15 AM-06:30 AM] 19 17 2 0 0 0 0 0 0 19 ||||||||
2016-10-05 [06:30 AM-06:45 AM] 29 18 10 0 0 0 0 0 0 28 ||||||||||||
2016-10-05 [06:45 AM-07:00 AM] 39 19 18 0 1 0 0 0 0 38 ||||||||||||||||
100 63 34 0 1 0 0 0 0 98
2016-10-05 [07:00 AM-07:15 AM] 36 26 10 0 0 0 0 0 0 36 |||||||||||||||
2016-10-05 [07:15 AM-07:30 AM] 57 34 20 1 0 1 0 0 0 56 ||||||||||||||||||||||||
2016-10-05 [07:30 AM-07:45 AM] 75 49 22 2 1 1 0 0 0 75 ||||||||||||||||||||||||||||||||
2016-10-05 [07:45 AM-08:00 AM] 104 68 28 1 4 1 0 0 0 102 |||||||||||||||||||||||||||||||||||||||||||
272 177 80 4 5 3 0 0 0 269
2016-10-05 [08:00 AM-08:15 AM] 114 76 32 1 2 0 0 0 0 111 |||||||||||||||||||||||||||||||||||||||||||||||
2016-10-05 [08:15 AM-08:30 AM] 119 75 39 3 1 0 0 0 0 118 ||||||||||||||||||||||||||||||||||||||||||||||||||
2016-10-05 [08:30 AM-08:45 AM] 91 57 29 0 3 0 0 1 0 90 ||||||||||||||||||||||||||||||||||||||
2016-10-05 [08:45 AM-09:00 AM] 84 49 30 0 3 0 0 0 0 82 ||||||||||||||||||||||||||||||||||
408 257 130 4 9 0 0 1 0 401
2016-10-05 [09:00 AM-09:15 AM] 86 53 30 0 1 0 0 0 0 84 |||||||||||||||||||||||||||||||||||
2016-10-05 [09:15 AM-09:30 AM] 65 43 20 0 0 2 0 0 0 65 |||||||||||||||||||||||||||
2016-10-05 [09:30 AM-09:45 AM] 66 42 23 0 1 0 0 0 0 66 ||||||||||||||||||||||||||||
2016-10-05 [09:45 AM-10:00 AM] 76 45 27 0 1 0 0 0 0 73 |||||||||||||||||||||||||||||||
293 183 100 0 3 2 0 0 0 288
2016-10-05 [10:00 AM-10:15 AM] 77 46 26 0 2 1 0 0 0 75 ||||||||||||||||||||||||||||||||
2016-10-05 [10:15 AM-10:30 AM] 55 33 21 1 0 0 0 0 0 55 |||||||||||||||||||||||
2016-10-05 [10:30 AM-10:45 AM] 49 27 19 2 0 0 0 0 0 48 ||||||||||||||||||||
2016-10-05 [10:45 AM-11:00 AM] 65 46 18 0 0 0 0 0 0 64 |||||||||||||||||||||||||||
246 152 84 3 2 1 0 0 0 242
2016-10-05 [11:00 AM-11:15 AM] 54 33 20 0 0 0 1 0 0 54 |||||||||||||||||||||||
2016-10-05 [11:15 AM-11:30 AM] 57 33 20 2 1 0 0 0 0 56 ||||||||||||||||||||||||
2016-10-05 [11:30 AM-11:45 AM] 60 31 26 0 1 0 0 0 0 58 ||||||||||||||||||||||||
2016-10-05 [11:45 AM-12:00 PM] 56 39 16 0 0 0 1 0 0 56 ||||||||||||||||||||||||
227 136 82 2 2 0 2 0 0 224
2016-10-05 [12:00 PM-12:15 PM] 67 41 22 2 0 0 0 0 0 65 |||||||||||||||||||||||||||
2016-10-05 [12:15 PM-12:30 PM] 70 42 24 1 2 0 1 0 0 70 |||||||||||||||||||||||||||||
2016-10-05 [12:30 PM-12:45 PM] 68 43 24 0 0 0 0 0 0 67 ||||||||||||||||||||||||||||
2016-10-05 [12:45 PM-01:00 PM] 64 45 17 0 0 0 0 0 0 62 ||||||||||||||||||||||||||
269 171 87 3 2 0 1 0 0 264
2016-10-05 [01:00 PM-01:15 PM] 70 46 22 1 0 0 0 0 0 69 |||||||||||||||||||||||||||||
2016-10-05 [01:15 PM-01:30 PM] 68 45 20 0 2 1 0 0 0 68 |||||||||||||||||||||||||||||
2016-10-05 [01:30 PM-01:45 PM] 65 35 27 1 1 0 1 0 0 65 |||||||||||||||||||||||||||
2016-10-05 [01:45 PM-02:00 PM] 63 36 26 0 0 0 0 0 0 62 ||||||||||||||||||||||||||
266 162 95 2 3 1 1 0 0 264
2016-10-05 [02:00 PM-02:15 PM] 58 39 15 0 0 1 1 0 0 56 ||||||||||||||||||||||||
2016-10-05 [02:15 PM-02:30 PM] 66 36 28 1 0 1 0 0 0 66 ||||||||||||||||||||||||||||
2016-10-05 [02:30 PM-02:45 PM] 80 51 28 0 1 0 0 0 0 80 ||||||||||||||||||||||||||||||||||
2016-10-05 [02:45 PM-03:00 PM] 70 53 15 1 0 0 0 0 0 69 |||||||||||||||||||||||||||||
274 179 86 2 1 2 1 0 0 271
2016-10-05 [03:00 PM-03:15 PM] 76 54 21 0 1 0 0 0 0 76 ||||||||||||||||||||||||||||||||
2016-10-05 [03:15 PM-03:30 PM] 90 53 31 1 1 1 1 0 0 88 |||||||||||||||||||||||||||||||||||||
2016-10-05 [03:30 PM-03:45 PM] 90 54 32 0 3 0 1 0 0 90 ||||||||||||||||||||||||||||||||||||||
2016-10-05 [03:45 PM-04:00 PM] 83 53 25 2 2 0 1 0 0 83 |||||||||||||||||||||||||||||||||||

339 214 109 3 7 1 3 0 0 337
2016-10-05 [04:00 PM-04:15 PM] 78 41 31 0 3 2 0 0 0 77 ||||||||||||||||||||||||||||||||
2016-10-05 [04:15 PM-04:30 PM] 91 65 23 0 2 0 1 0 0 91 ||||||||||||||||||||||||||||||||||||||
2016-10-05 [04:30 PM-04:45 PM] 70 45 22 0 3 0 0 0 0 70 |||||||||||||||||||||||||||||
2016-10-05 [04:45 PM-05:00 PM] 70 44 23 0 0 0 0 0 0 67 ||||||||||||||||||||||||||||
309 195 99 0 8 2 1 0 0 305
2016-10-05 [05:00 PM-05:15 PM] 82 59 23 0 0 0 0 0 0 82 ||||||||||||||||||||||||||||||||||
2016-10-05 [05:15 PM-05:30 PM] 103 70 31 0 0 0 0 0 0 101 ||||||||||||||||||||||||||||||||||||||||||
2016-10-05 [05:30 PM-05:45 PM] 84 62 21 0 0 0 0 0 0 83 |||||||||||||||||||||||||||||||||||
2016-10-05 [05:45 PM-06:00 PM] 86 54 30 1 1 0 0 0 0 86 ||||||||||||||||||||||||||||||||||||
355 245 105 1 1 0 0 0 0 352
2016-10-05 [06:00 PM-06:15 PM] 71 50 19 0 1 0 0 0 0 70 |||||||||||||||||||||||||||||
2016-10-05 [06:15 PM-06:30 PM] 78 54 22 0 0 0 0 0 0 76 ||||||||||||||||||||||||||||||||
2016-10-05 [06:30 PM-06:45 PM] 68 52 15 0 0 0 0 0 0 67 ||||||||||||||||||||||||||||
2016-10-05 [06:45 PM-07:00 PM] 80 48 32 0 0 0 0 0 0 80 ||||||||||||||||||||||||||||||||||
297 204 88 0 1 0 0 0 0 293
2016-10-05 [07:00 PM-07:15 PM] 65 46 18 1 0 0 0 0 0 65 |||||||||||||||||||||||||||
2016-10-05 [07:15 PM-07:30 PM] 58 39 17 0 0 1 0 0 0 57 ||||||||||||||||||||||||
2016-10-05 [07:30 PM-07:45 PM] 56 41 15 0 0 0 0 0 0 56 ||||||||||||||||||||||||
2016-10-05 [07:45 PM-08:00 PM] 55 31 23 0 0 0 0 0 0 54 |||||||||||||||||||||||
234 157 73 1 0 1 0 0 0 232
2016-10-05 [08:00 PM-08:15 PM] 47 33 14 0 0 0 0 0 0 47 ||||||||||||||||||||
2016-10-05 [08:15 PM-08:30 PM] 43 30 13 0 0 0 0 0 0 43 ||||||||||||||||||
2016-10-05 [08:30 PM-08:45 PM] 49 31 16 0 1 0 0 0 0 48 ||||||||||||||||||||
2016-10-05 [08:45 PM-09:00 PM] 44 26 17 0 0 1 0 0 0 44 ||||||||||||||||||
183 120 60 0 1 1 0 0 0 182
2016-10-05 [09:00 PM-09:15 PM] 27 14 12 0 0 1 0 0 0 27 |||||||||||
2016-10-05 [09:15 PM-09:30 PM] 26 13 6 1 0 0 0 0 0 20 ||||||||
2016-10-05 [09:30 PM-09:45 PM] 18 14 2 0 0 0 1 1 0 18 ||||||||
2016-10-05 [09:45 PM-10:00 PM] 33 19 13 0 0 0 0 0 0 32 |||||||||||||
104 60 33 1 0 1 1 1 0 97
2016-10-05 [10:00 PM-10:15 PM] 23 10 8 1 1 1 0 1 0 22 |||||||||
2016-10-05 [10:15 PM-10:30 PM] 13 12 1 0 0 0 0 0 0 13 |||||
2016-10-05 [10:30 PM-10:45 PM] 7 4 2 0 1 0 0 0 0 7 |||
2016-10-05 [10:45 PM-11:00 PM] 14 8 6 0 0 0 0 0 0 14 ||||||
57 34 17 1 2 1 0 1 0 56
2016-10-05 [11:00 PM-11:15 PM] 8 5 3 0 0 0 0 0 0 8 |||
2016-10-05 [11:15 PM-11:30 PM] 12 7 4 0 0 0 0 0 0 11 |||||
2016-10-05 [11:30 PM-11:45 PM] 7 6 1 0 0 0 0 0 0 7 |||
2016-10-05 [11:45 PM-12:00 AM] 8 4 4 0 0 0 0 0 0 8 |||
35 22 12 0 0 0 0 0 0 34
Daily Totals: 4358 2784 1409 28 48 16 10 3 0 4298
Total Counted: 4358
Total Classified: 4298 4358 2784 1409 28 48 16 10 3 0 4298
Total Unclassified: 60
Report Percentages: 64.77% 32.78% 0.65% 1.12% 0.37% 0.23% 0.07% 0.00%
Peak Time: (AM): 2016-10-05 [08:15 AM-08:30 AM] Peak Count: 119
Peak Time: (PM): 2016-10-05 [05:15 PM-05:30 PM] Peak Count: 103

Time/Speed Report
HI-Star ID: 20DE0 Begin: 2016-10-05 12:00 AM End: 2016-10-06 12:00 AM
Street: King St W - EB Lane: EB Hours: 24:00
State: ON Oper: MD Period: 15
City: City of Hamilton Posted: 50 Raw Count: 4358
Area: btwn Bond St & Woodley Ln AADT Factor: 1 AADT Count: 4358
NC200 - km/h 0 to 9 10 to 19 20 to 29 30 to 39 40 to 49 50 to 59 60 to 69 70 to 79 80 to 89 90 to 99 100 to 109 110 to 119 120 to 129 130 to 139 140 > Total
2016-10-05 [12:00 AM-12:15 AM] 0 0 0 0 0 6 1 0 0 0 0 0 0 0 0 7
2016-10-05 [12:15 AM-12:30 AM] 0 0 0 0 4 0 0 0 0 0 0 0 0 0 0 4
2016-10-05 [12:30 AM-12:45 AM] 0 0 0 0 0 0 0 0 0 0 0 0 0 0 0 0
2016-10-05 [12:45 AM-01:00 AM] 0 0 0 0 1 6 0 0 0 0 0 0 0 0 0 7
0 0 0 0 5 12 1 0 0 0 0 0 0 0 0 18
2016-10-05 [01:00 AM-01:15 AM] 0 0 0 0 2 4 1 0 0 0 0 0 0 0 0 7
2016-10-05 [01:15 AM-01:30 AM] 0 0 0 0 2 0 0 0 0 0 0 0 0 0 0 2
2016-10-05 [01:30 AM-01:45 AM] 0 0 0 0 0 0 0 0 0 0 0 0 0 0 0 0
2016-10-05 [01:45 AM-02:00 AM] 0 0 0 0 2 2 0 0 0 0 0 0 0 0 0 4
0 0 0 0 6 6 1 0 0 0 0 0 0 0 0 13
2016-10-05 [02:00 AM-02:15 AM] 0 0 0 0 0 1 0 0 0 0 0 0 0 0 0 1
2016-10-05 [02:15 AM-02:30 AM] 0 0 0 1 0 1 0 0 0 0 0 0 0 0 0 2
2016-10-05 [02:30 AM-02:45 AM] 0 0 0 0 1 1 1 0 0 0 0 0 0 0 0 3
2016-10-05 [02:45 AM-03:00 AM] 0 0 0 0 0 2 1 0 0 0 0 0 0 0 0 3
0 0 0 1 1 5 2 0 0 0 0 0 0 0 0 9
2016-10-05 [03:00 AM-03:15 AM] 0 0 0 0 0 0 0 0 0 0 0 0 0 0 0 0
2016-10-05 [03:15 AM-03:30 AM] 0 0 0 0 2 0 0 0 0 0 0 0 0 0 0 2
2016-10-05 [03:30 AM-03:45 AM] 0 0 0 0 2 1 0 0 0 0 0 0 0 0 0 3
2016-10-05 [03:45 AM-04:00 AM] 0 0 0 0 0 1 0 0 0 1 0 0 0 0 0 2
0 0 0 0 4 2 0 0 0 1 0 0 0 0 0 7
2016-10-05 [04:00 AM-04:15 AM] 0 0 0 0 0 0 1 0 0 0 0 0 0 0 0 1
2016-10-05 [04:15 AM-04:30 AM] 0 0 0 0 0 2 0 0 0 0 0 0 0 0 0 2
2016-10-05 [04:30 AM-04:45 AM] 0 0 0 0 1 3 1 0 0 0 0 0 0 0 0 5
2016-10-05 [04:45 AM-05:00 AM] 0 0 0 0 0 0 1 0 0 0 0 0 0 0 0 1
0 0 0 0 1 5 3 0 0 0 0 0 0 0 0 9
2016-10-05 [05:00 AM-05:15 AM] 0 0 0 0 2 5 1 0 0 0 0 0 0 0 0 8
2016-10-05 [05:15 AM-05:30 AM] 0 0 0 0 2 6 0 0 0 0 0 0 0 0 0 8
2016-10-05 [05:30 AM-05:45 AM] 0 0 0 0 0 5 0 0 0 0 0 0 0 0 0 5
2016-10-05 [05:45 AM-06:00 AM] 0 0 0 1 4 6 1 0 0 0 0 0 0 0 0 12
0 0 0 1 8 22 2 0 0 0 0 0 0 0 0 33
2016-10-05 [06:00 AM-06:15 AM] 0 0 0 0 6 5 1 1 0 0 0 0 0 0 0 13
2016-10-05 [06:15 AM-06:30 AM] 0 0 0 0 4 13 2 0 0 0 0 0 0 0 0 19
2016-10-05 [06:30 AM-06:45 AM] 0 0 0 2 8 15 3 0 0 0 0 0 0 0 0 28
2016-10-05 [06:45 AM-07:00 AM] 0 0 0 1 12 24 1 0 0 0 0 0 0 0 0 38
0 0 0 3 30 57 7 1 0 0 0 0 0 0 0 98
2016-10-05 [07:00 AM-07:15 AM] 0 0 1 0 13 20 2 0 0 0 0 0 0 0 0 36
2016-10-05 [07:15 AM-07:30 AM] 0 0 0 0 15 37 4 0 0 0 0 0 0 0 0 56
2016-10-05 [07:30 AM-07:45 AM] 0 0 0 7 35 31 1 1 0 0 0 0 0 0 0 75
2016-10-05 [07:45 AM-08:00 AM] 0 0 0 0 52 48 2 0 0 0 0 0 0 0 0 102
0 0 1 7 115 136 9 1 0 0 0 0 0 0 0 269
2016-10-05 [08:00 AM-08:15 AM] 0 0 0 1 58 50 2 0 0 0 0 0 0 0 0 111
2016-10-05 [08:15 AM-08:30 AM] 0 0 1 8 61 44 3 1 0 0 0 0 0 0 0 118
2016-10-05 [08:30 AM-08:45 AM] 0 0 2 4 25 58 1 0 0 0 0 0 0 0 0 90
2016-10-05 [08:45 AM-09:00 AM] 0 0 6 1 34 39 1 0 0 1 0 0 0 0 0 82
0 0 9 14 178 191 7 1 0 1 0 0 0 0 0 401
2016-10-05 [09:00 AM-09:15 AM] 0 0 0 1 50 32 1 0 0 0 0 0 0 0 0 84
2016-10-05 [09:15 AM-09:30 AM] 0 0 0 4 29 30 1 1 0 0 0 0 0 0 0 65
2016-10-05 [09:30 AM-09:45 AM] 0 0 0 14 23 26 3 0 0 0 0 0 0 0 0 66
2016-10-05 [09:45 AM-10:00 AM] 0 0 4 6 24 39 0 0 0 0 0 0 0 0 0 73
0 0 4 25 126 127 5 1 0 0 0 0 0 0 0 288
2016-10-05 [10:00 AM-10:15 AM] 0 0 0 10 35 29 1 0 0 0 0 0 0 0 0 75
2016-10-05 [10:15 AM-10:30 AM] 0 0 0 3 29 23 0 0 0 0 0 0 0 0 0 55
2016-10-05 [10:30 AM-10:45 AM] 0 0 0 2 27 18 1 0 0 0 0 0 0 0 0 48
2016-10-05 [10:45 AM-11:00 AM] 0 1 0 10 27 24 1 1 0 0 0 0 0 0 0 64
0 1 0 25 118 94 3 1 0 0 0 0 0 0 0 242
2016-10-05 [11:00 AM-11:15 AM] 0 0 2 5 21 24 0 0 1 1 0 0 0 0 0 54
2016-10-05 [11:15 AM-11:30 AM] 0 0 0 8 31 14 3 0 0 0 0 0 0 0 0 56
2016-10-05 [11:30 AM-11:45 AM] 0 0 0 7 32 18 0 0 1 0 0 0 0 0 0 58
2016-10-05 [11:45 AM-12:00 PM] 0 0 0 4 27 24 1 0 0 0 0 0 0 0 0 56
0 0 2 24 111 80 4 0 2 1 0 0 0 0 0 224
2016-10-05 [12:00 PM-12:15 PM] 0 0 0 9 35 18 2 1 0 0 0 0 0 0 0 65
2016-10-05 [12:15 PM-12:30 PM] 0 1 0 3 38 28 0 0 0 0 0 0 0 0 0 70
2016-10-05 [12:30 PM-12:45 PM] 0 0 0 4 40 22 1 0 0 0 0 0 0 0 0 67
2016-10-05 [12:45 PM-01:00 PM] 0 0 0 2 39 19 1 1 0 0 0 0 0 0 0 62
0 1 0 18 152 87 4 2 0 0 0 0 0 0 0 264
2016-10-05 [01:00 PM-01:15 PM] 0 0 1 7 38 22 0 1 0 0 0 0 0 0 0 69
2016-10-05 [01:15 PM-01:30 PM] 0 0 1 9 30 27 1 0 0 0 0 0 0 0 0 68
2016-10-05 [01:30 PM-01:45 PM] 0 0 0 3 33 29 0 0 0 0 0 0 0 0 0 65
2016-10-05 [01:45 PM-02:00 PM] 0 1 0 4 33 23 0 1 0 0 0 0 0 0 0 62
0 1 2 23 134 101 1 2 0 0 0 0 0 0 0 264
2016-10-05 [02:00 PM-02:15 PM] 0 0 0 3 30 20 1 1 0 1 0 0 0 0 0 56
2016-10-05 [02:15 PM-02:30 PM] 0 0 0 4 33 26 3 0 0 0 0 0 0 0 0 66
2016-10-05 [02:30 PM-02:45 PM] 0 0 0 2 39 36 3 0 0 0 0 0 0 0 0 80
2016-10-05 [02:45 PM-03:00 PM] 0 0 1 6 38 22 2 0 0 0 0 0 0 0 0 69
0 0 1 15 140 104 9 1 0 1 0 0 0 0 0 271
2016-10-05 [03:00 PM-03:15 PM] 0 0 0 7 45 24 0 0 0 0 0 0 0 0 0 76
2016-10-05 [03:15 PM-03:30 PM] 0 0 0 5 56 26 1 0 0 0 0 0 0 0 0 88
2016-10-05 [03:30 PM-03:45 PM] 0 0 0 2 37 46 4 1 0 0 0 0 0 0 0 90
2016-10-05 [03:45 PM-04:00 PM] 0 0 0 4 46 28 3 1 1 0 0 0 0 0 0 83
0 0 0 18 184 124 8 2 1 0 0 0 0 0 0 337
2016-10-05 [04:00 PM-04:15 PM] 0 0 0 11 31 33 2 0 0 0 0 0 0 0 0 77
2016-10-05 [04:15 PM-04:30 PM] 0 0 1 11 38 38 3 0 0 0 0 0 0 0 0 91
2016-10-05 [04:30 PM-04:45 PM] 0 0 0 0 40 29 0 0 1 0 0 0 0 0 0 70
2016-10-05 [04:45 PM-05:00 PM] 0 0 0 6 32 29 0 0 0 0 0 0 0 0 0 67
0 0 1 28 141 129 5 0 1 0 0 0 0 0 0 305
2016-10-05 [05:00 PM-05:15 PM] 0 0 0 4 38 36 3 1 0 0 0 0 0 0 0 82
2016-10-05 [05:15 PM-05:30 PM] 0 0 0 0 58 40 2 1 0 0 0 0 0 0 0 101
2016-10-05 [05:30 PM-05:45 PM] 0 0 0 2 32 45 4 0 0 0 0 0 0 0 0 83
2016-10-05 [05:45 PM-06:00 PM] 0 0 1 4 35 41 4 1 0 0 0 0 0 0 0 86
0 0 1 10 163 162 13 3 0 0 0 0 0 0 0 352
2016-10-05 [06:00 PM-06:15 PM] 0 0 0 0 28 36 4 2 0 0 0 0 0 0 0 70
2016-10-05 [06:15 PM-06:30 PM] 0 0 0 2 39 34 1 0 0 0 0 0 0 0 0 76
2016-10-05 [06:30 PM-06:45 PM] 0 0 0 6 28 30 2 0 0 1 0 0 0 0 0 67

2016-10-05 [06:45 PM-07:00 PM] 0 0 0 2 32 43 2 1 0 0 0 0 0 0 0 80
0 0 0 10 127 143 9 3 0 1 0 0 0 0 0 293
2016-10-05 [07:00 PM-07:15 PM] 0 0 1 2 36 24 1 1 0 0 0 0 0 0 0 65
2016-10-05 [07:15 PM-07:30 PM] 0 0 0 3 34 20 0 0 0 0 0 0 0 0 0 57
2016-10-05 [07:30 PM-07:45 PM] 0 0 0 5 31 18 2 0 0 0 0 0 0 0 0 56
2016-10-05 [07:45 PM-08:00 PM] 0 0 3 5 19 24 3 0 0 0 0 0 0 0 0 54
0 0 4 15 120 86 6 1 0 0 0 0 0 0 0 232
2016-10-05 [08:00 PM-08:15 PM] 0 0 0 1 25 19 2 0 0 0 0 0 0 0 0 47
2016-10-05 [08:15 PM-08:30 PM] 0 0 0 5 27 9 2 0 0 0 0 0 0 0 0 43
2016-10-05 [08:30 PM-08:45 PM] 0 0 0 4 28 14 2 0 0 0 0 0 0 0 0 48
2016-10-05 [08:45 PM-09:00 PM] 0 0 0 5 23 13 3 0 0 0 0 0 0 0 0 44
0 0 0 15 103 55 9 0 0 0 0 0 0 0 0 182
2016-10-05 [09:00 PM-09:15 PM] 0 0 0 3 19 5 0 0 0 0 0 0 0 0 0 27
2016-10-05 [09:15 PM-09:30 PM] 0 2 3 4 7 2 2 0 0 0 0 0 0 0 0 20
2016-10-05 [09:30 PM-09:45 PM] 0 0 0 4 9 5 0 0 0 0 0 0 0 0 0 18
2016-10-05 [09:45 PM-10:00 PM] 0 0 0 1 12 17 2 0 0 0 0 0 0 0 0 32
0 2 3 12 47 29 4 0 0 0 0 0 0 0 0 97
2016-10-05 [10:00 PM-10:15 PM] 0 0 0 3 8 10 1 0 0 0 0 0 0 0 0 22
2016-10-05 [10:15 PM-10:30 PM] 0 0 0 0 4 9 0 0 0 0 0 0 0 0 0 13
2016-10-05 [10:30 PM-10:45 PM] 0 0 0 0 2 4 1 0 0 0 0 0 0 0 0 7
2016-10-05 [10:45 PM-11:00 PM] 0 0 0 0 5 9 0 0 0 0 0 0 0 0 0 14
0 0 0 3 19 32 2 0 0 0 0 0 0 0 0 56
2016-10-05 [11:00 PM-11:15 PM] 0 0 0 1 4 1 1 1 0 0 0 0 0 0 0 8
2016-10-05 [11:15 PM-11:30 PM] 0 0 0 0 2 7 2 0 0 0 0 0 0 0 0 11
2016-10-05 [11:30 PM-11:45 PM] 0 0 0 0 2 4 1 0 0 0 0 0 0 0 0 7
2016-10-05 [11:45 PM-12:00 AM] 0 0 0 0 1 7 0 0 0 0 0 0 0 0 0 8
0 0 0 1 9 19 4 1 0 0 0 0 0 0 0 34
Daily Totals: 0 5 28 268 2042 1808 118 20 4 5 0 0 0 0 0 4298
Report Totals: 0 5 28 268 2042 1808 118 20 4 5 0 0 0 0 0 4298
Report Percentages: 0.00% 0.12% 0.65% 6.24% 47.51% 42.07% 2.75% 0.47% 0.09% 0.12% 0.00% 0.00% 0.00% 0.00% 0.00%

Street: King St W - WB
City: City of Hamilton
Computer Generated Summary Report
MH Corbin Traffic Analyzer Study
Location: 1
A study of vehicle traffic was conducted with the device having serial number 113547. The study was donein the WB lane at King St W - WB in City of Hamilton, ON in btwn Bond St & Woodley Ln county. The studybegan on 2016-10-05 at 12:00 AM and concluded on 2016-10-06 at 12:00 AM, lasting a total of 24.00 hours.Traffic statistics were recorded in 15 minute time periods. The total recorded volume showed 4,386 vehiclespassed through the location with a peak volume of 104 on 2016-10-05 at [05:15 PM-05:30 PM] and aminimum volume of 0 on 2016-10-05 at [12:45 AM-01:00 AM]. The AADT count for this study was 4,386.
Chart 1 lists the values of the speed bins and the total traffic volume for each bin. At least half the vehicleswere traveling in the 50 - 60 KM/H range or lower. The average speed for all classifed vehicles was 57KM/H with 84.46% vehicles exceeding the posted speed of 50 KM/H. 1.48% percent of the total vehicleswere traveling in excess of 89 KM/H. The mode speed for this traffic study was 50KM/H and the 85thpercentile was 66.90 KM/H.
SPEED
< 10 20 30 40 50 60 70 80 90 100 110 120 130 140
9 19 29 39 49 59 69 79 89 99 109 119 129 139 >
CHART 1
0 4 22 93 551 2159 1211 207 47 17 0 0 0 0 0
to to to to to to to to to to to to to to to
Chart 2 lists the values of the classification bins and the total traffic volume accumulated for each bin.
CLASSIFICATION
Most of the vehicles classified during the study were Passenger Vehicles. The number of PassengerVehicles in the study was 4204 which represents 98 percent of the total classified vehicles. The number ofSmall Trucks in the study was 40 which represents 1 percent of the total classified vehicles. The number ofTrucks/Buses in the study was 50 which represents 1 percent of the total classified vehicles. The number ofTractor Trailers in the study was 17 which represents 0 percent of the total classified vehicles.
< 5.0 8.5 10.0 13.0 19.0 22.5
4.9 8.4 9.9 12.9 15.9 18.9 22.4 >
16.0
CHART 2
1941 2263 40 50 10 2 2 3
to to to to to to to to
During the peak traffic period, on 2016-10-05 at [05:15 PM-05:30 PM] the average headway betweenvehicles was 8.571 seconds. During the slowest traffic period, on 2016-10-05 at [12:45 AM-01:00 AM] theaverage headway between vehicles was 900 seconds.
HEADWAY
WEATHER
The roadway surface temperature over the period of the study varied between 15.00 and 37.00 degrees C.
Page:2016-10-19 01:10 PM 1

Class/Volume Report Graph
HI-Star ID: 10FDCB Begin: 2016-10-05 12:00 AM End: 2016-10-06 12:00 AM
Street: King St W - WB Lane: WB Hours: 24:00
State: ON Oper: MD Period: 15
City: City of Hamilton Posted: 50 Raw Count: 4386
Area: btwn Bond St & Woodley Ln AADT Factor: 1 AADT Count: 4386
NC200 - Metres 0.0 to 4.9 5.0 to 8.4 8.5 to 9.9 10.0 to 12.913.0 to 15.916.0 to 18.919.0 to 22.4 22.5 > Total
2016-10-05 [12:00 AM-12:15 AM] 8 3 5 0 0 0 0 0 0 8 ||||
2016-10-05 [12:15 AM-12:30 AM] 6 3 3 0 0 0 0 0 0 6 |||
2016-10-05 [12:30 AM-12:45 AM] 5 3 2 0 0 0 0 0 0 5 ||
2016-10-05 [12:45 AM-01:00 AM] 0 0 0 0 0 0 0 0 0 0
19 9 10 0 0 0 0 0 0 19
2016-10-05 [01:00 AM-01:15 AM] 1 0 1 0 0 0 0 0 0 1
2016-10-05 [01:15 AM-01:30 AM] 4 3 1 0 0 0 0 0 0 4 ||
2016-10-05 [01:30 AM-01:45 AM] 4 3 1 0 0 0 0 0 0 4 ||
2016-10-05 [01:45 AM-02:00 AM] 2 1 1 0 0 0 0 0 0 2 |
11 7 4 0 0 0 0 0 0 11
2016-10-05 [02:00 AM-02:15 AM] 2 1 1 0 0 0 0 0 0 2 |
2016-10-05 [02:15 AM-02:30 AM] 3 2 1 0 0 0 0 0 0 3 |
2016-10-05 [02:30 AM-02:45 AM] 1 1 0 0 0 0 0 0 0 1
2016-10-05 [02:45 AM-03:00 AM] 1 1 0 0 0 0 0 0 0 1
7 5 2 0 0 0 0 0 0 7
2016-10-05 [03:00 AM-03:15 AM] 3 1 1 0 0 0 0 0 0 2 |
2016-10-05 [03:15 AM-03:30 AM] 3 2 1 0 0 0 0 0 0 3 |
2016-10-05 [03:30 AM-03:45 AM] 1 0 1 0 0 0 0 0 0 1
2016-10-05 [03:45 AM-04:00 AM] 2 0 2 0 0 0 0 0 0 2 |
9 3 5 0 0 0 0 0 0 8
2016-10-05 [04:00 AM-04:15 AM] 0 0 0 0 0 0 0 0 0 0
2016-10-05 [04:15 AM-04:30 AM] 3 1 2 0 0 0 0 0 0 3 |
2016-10-05 [04:30 AM-04:45 AM] 3 1 2 0 0 0 0 0 0 3 |
2016-10-05 [04:45 AM-05:00 AM] 4 1 2 0 0 0 0 0 0 3 |
10 3 6 0 0 0 0 0 0 9
2016-10-05 [05:00 AM-05:15 AM] 3 1 1 0 0 0 0 0 0 2 |
2016-10-05 [05:15 AM-05:30 AM] 12 7 5 0 0 0 0 0 0 12 ||||||
2016-10-05 [05:30 AM-05:45 AM] 12 3 9 0 0 0 0 0 0 12 ||||||
2016-10-05 [05:45 AM-06:00 AM] 12 2 10 0 0 0 0 0 0 12 ||||||
39 13 25 0 0 0 0 0 0 38
2016-10-05 [06:00 AM-06:15 AM] 17 6 9 1 0 0 0 0 0 16 ||||||||
2016-10-05 [06:15 AM-06:30 AM] 29 12 15 0 0 0 1 0 0 28 |||||||||||||
2016-10-05 [06:30 AM-06:45 AM] 26 14 10 0 0 1 0 0 0 25 ||||||||||||
2016-10-05 [06:45 AM-07:00 AM] 36 14 17 1 2 0 0 0 0 34 ||||||||||||||||
108 46 51 2 2 1 1 0 0 103
2016-10-05 [07:00 AM-07:15 AM] 43 16 22 0 3 0 0 1 0 42 ||||||||||||||||||||
2016-10-05 [07:15 AM-07:30 AM] 58 27 31 0 0 0 0 0 0 58 ||||||||||||||||||||||||||||
2016-10-05 [07:30 AM-07:45 AM] 69 27 38 2 1 0 0 0 0 68 |||||||||||||||||||||||||||||||||
2016-10-05 [07:45 AM-08:00 AM] 81 40 34 1 4 0 0 0 0 79 ||||||||||||||||||||||||||||||||||||||
251 110 125 3 8 0 0 1 0 247
2016-10-05 [08:00 AM-08:15 AM] 55 25 28 0 0 0 0 0 0 53 |||||||||||||||||||||||||
2016-10-05 [08:15 AM-08:30 AM] 94 38 54 0 0 1 0 0 0 93 |||||||||||||||||||||||||||||||||||||||||||||
2016-10-05 [08:30 AM-08:45 AM] 66 34 31 0 1 0 0 0 0 66 ||||||||||||||||||||||||||||||||
2016-10-05 [08:45 AM-09:00 AM] 89 34 52 1 1 1 0 0 0 89 |||||||||||||||||||||||||||||||||||||||||||
304 131 165 1 2 2 0 0 0 301
2016-10-05 [09:00 AM-09:15 AM] 66 26 35 1 3 0 0 0 0 65 |||||||||||||||||||||||||||||||
2016-10-05 [09:15 AM-09:30 AM] 64 22 41 0 1 0 0 0 0 64 |||||||||||||||||||||||||||||||
2016-10-05 [09:30 AM-09:45 AM] 56 35 21 0 0 0 0 0 0 56 |||||||||||||||||||||||||||
2016-10-05 [09:45 AM-10:00 AM] 61 28 29 0 2 0 0 0 0 59 ||||||||||||||||||||||||||||
247 111 126 1 6 0 0 0 0 244
2016-10-05 [10:00 AM-10:15 AM] 52 14 34 1 3 0 0 0 0 52 |||||||||||||||||||||||||
2016-10-05 [10:15 AM-10:30 AM] 46 22 24 0 0 0 0 0 0 46 ||||||||||||||||||||||
2016-10-05 [10:30 AM-10:45 AM] 70 30 39 0 0 0 0 0 0 69 |||||||||||||||||||||||||||||||||
2016-10-05 [10:45 AM-11:00 AM] 54 26 24 1 1 0 0 0 0 52 |||||||||||||||||||||||||
222 92 121 2 4 0 0 0 0 219
2016-10-05 [11:00 AM-11:15 AM] 57 26 27 3 0 0 0 0 1 57 |||||||||||||||||||||||||||
2016-10-05 [11:15 AM-11:30 AM] 52 22 29 0 0 1 0 0 0 52 |||||||||||||||||||||||||
2016-10-05 [11:30 AM-11:45 AM] 79 37 37 2 2 0 0 0 0 78 ||||||||||||||||||||||||||||||||||||||
2016-10-05 [11:45 AM-12:00 PM] 61 26 26 1 2 0 0 0 0 55 ||||||||||||||||||||||||||
249 111 119 6 4 1 0 0 1 242
2016-10-05 [12:00 PM-12:15 PM] 62 27 32 0 1 0 0 1 0 61 |||||||||||||||||||||||||||||
2016-10-05 [12:15 PM-12:30 PM] 62 29 27 2 1 0 0 0 0 59 ||||||||||||||||||||||||||||
2016-10-05 [12:30 PM-12:45 PM] 53 21 28 1 0 0 0 0 0 50 ||||||||||||||||||||||||
2016-10-05 [12:45 PM-01:00 PM] 82 37 43 0 1 0 0 0 0 81 |||||||||||||||||||||||||||||||||||||||
259 114 130 3 3 0 0 1 0 251
2016-10-05 [01:00 PM-01:15 PM] 74 26 42 1 4 1 0 0 0 74 ||||||||||||||||||||||||||||||||||||
2016-10-05 [01:15 PM-01:30 PM] 69 31 36 0 0 1 0 0 0 68 |||||||||||||||||||||||||||||||||
2016-10-05 [01:30 PM-01:45 PM] 71 34 35 1 1 0 0 0 0 71 ||||||||||||||||||||||||||||||||||
2016-10-05 [01:45 PM-02:00 PM] 59 26 31 0 0 0 0 0 0 57 |||||||||||||||||||||||||||
273 117 144 2 5 2 0 0 0 270
2016-10-05 [02:00 PM-02:15 PM] 61 25 31 1 1 0 0 0 0 58 ||||||||||||||||||||||||||||
2016-10-05 [02:15 PM-02:30 PM] 84 46 37 0 1 0 0 0 0 84 ||||||||||||||||||||||||||||||||||||||||
2016-10-05 [02:30 PM-02:45 PM] 78 38 34 1 3 2 0 0 0 78 ||||||||||||||||||||||||||||||||||||||
2016-10-05 [02:45 PM-03:00 PM] 96 33 61 0 2 0 0 0 0 96 ||||||||||||||||||||||||||||||||||||||||||||||
319 142 163 2 7 2 0 0 0 316
2016-10-05 [03:00 PM-03:15 PM] 84 35 40 3 2 0 0 0 0 80 ||||||||||||||||||||||||||||||||||||||
2016-10-05 [03:15 PM-03:30 PM] 82 34 44 2 1 0 0 0 0 81 |||||||||||||||||||||||||||||||||||||||
2016-10-05 [03:30 PM-03:45 PM] 88 38 45 2 0 0 0 0 1 86 |||||||||||||||||||||||||||||||||||||||||
2016-10-05 [03:45 PM-04:00 PM] 99 49 46 1 0 0 1 0 1 98 |||||||||||||||||||||||||||||||||||||||||||||||

353 156 175 8 3 0 1 0 2 345
2016-10-05 [04:00 PM-04:15 PM] 98 40 54 0 1 1 0 0 0 96 ||||||||||||||||||||||||||||||||||||||||||||||
2016-10-05 [04:15 PM-04:30 PM] 85 40 42 1 1 0 0 0 0 84 ||||||||||||||||||||||||||||||||||||||||
2016-10-05 [04:30 PM-04:45 PM] 100 48 50 1 0 0 0 0 0 99 ||||||||||||||||||||||||||||||||||||||||||||||||
2016-10-05 [04:45 PM-05:00 PM] 97 48 48 0 1 0 0 0 0 97 |||||||||||||||||||||||||||||||||||||||||||||||
380 176 194 2 3 1 0 0 0 376
2016-10-05 [05:00 PM-05:15 PM] 83 36 45 0 1 0 0 0 0 82 |||||||||||||||||||||||||||||||||||||||
2016-10-05 [05:15 PM-05:30 PM] 104 37 66 1 0 0 0 0 0 104 ||||||||||||||||||||||||||||||||||||||||||||||||||
2016-10-05 [05:30 PM-05:45 PM] 99 48 47 3 0 1 0 0 0 99 ||||||||||||||||||||||||||||||||||||||||||||||||
2016-10-05 [05:45 PM-06:00 PM] 96 48 44 0 0 0 0 0 0 92 ||||||||||||||||||||||||||||||||||||||||||||
382 169 202 4 1 1 0 0 0 377
2016-10-05 [06:00 PM-06:15 PM] 67 31 36 0 0 0 0 0 0 67 ||||||||||||||||||||||||||||||||
2016-10-05 [06:15 PM-06:30 PM] 72 31 38 0 1 0 0 0 0 70 ||||||||||||||||||||||||||||||||||
2016-10-05 [06:30 PM-06:45 PM] 67 39 26 1 0 0 0 0 0 66 ||||||||||||||||||||||||||||||||
2016-10-05 [06:45 PM-07:00 PM] 65 28 37 0 0 0 0 0 0 65 |||||||||||||||||||||||||||||||
271 129 137 1 1 0 0 0 0 268
2016-10-05 [07:00 PM-07:15 PM] 77 32 41 0 1 0 0 0 0 74 ||||||||||||||||||||||||||||||||||||
2016-10-05 [07:15 PM-07:30 PM] 56 24 32 0 0 0 0 0 0 56 |||||||||||||||||||||||||||
2016-10-05 [07:30 PM-07:45 PM] 48 25 22 0 0 0 0 0 0 47 |||||||||||||||||||||||
2016-10-05 [07:45 PM-08:00 PM] 41 20 21 0 0 0 0 0 0 41 ||||||||||||||||||||
222 101 116 0 1 0 0 0 0 218
2016-10-05 [08:00 PM-08:15 PM] 51 25 26 0 0 0 0 0 0 51 |||||||||||||||||||||||||
2016-10-05 [08:15 PM-08:30 PM] 44 18 26 0 0 0 0 0 0 44 |||||||||||||||||||||
2016-10-05 [08:30 PM-08:45 PM] 44 22 21 1 0 0 0 0 0 44 |||||||||||||||||||||
2016-10-05 [08:45 PM-09:00 PM] 35 12 23 0 0 0 0 0 0 35 |||||||||||||||||
174 77 96 1 0 0 0 0 0 174
2016-10-05 [09:00 PM-09:15 PM] 53 26 26 0 0 0 0 0 0 52 |||||||||||||||||||||||||
2016-10-05 [09:15 PM-09:30 PM] 41 13 26 1 0 0 0 0 0 40 |||||||||||||||||||
2016-10-05 [09:30 PM-09:45 PM] 31 13 15 1 0 0 0 0 0 29 ||||||||||||||
2016-10-05 [09:45 PM-10:00 PM] 27 5 20 0 0 0 0 0 0 25 ||||||||||||
152 57 87 2 0 0 0 0 0 146
2016-10-05 [10:00 PM-10:15 PM] 32 11 20 0 0 0 0 0 0 31 |||||||||||||||
2016-10-05 [10:15 PM-10:30 PM] 32 15 16 0 0 0 0 0 0 31 |||||||||||||||
2016-10-05 [10:30 PM-10:45 PM] 18 10 7 0 0 0 0 0 0 17 ||||||||
2016-10-05 [10:45 PM-11:00 PM] 13 6 7 0 0 0 0 0 0 13 ||||||
95 42 50 0 0 0 0 0 0 92
2016-10-05 [11:00 PM-11:15 PM] 10 8 2 0 0 0 0 0 0 10 |||||
2016-10-05 [11:15 PM-11:30 PM] 9 6 3 0 0 0 0 0 0 9 ||||
2016-10-05 [11:30 PM-11:45 PM] 8 4 4 0 0 0 0 0 0 8 ||||
2016-10-05 [11:45 PM-12:00 AM] 3 2 1 0 0 0 0 0 0 3 |
30 20 10 0 0 0 0 0 0 30
Daily Totals: 4386 1941 2263 40 50 10 2 2 3 4311
Total Counted: 4386
Total Classified: 4311 4386 1941 2263 40 50 10 2 2 3 4311
Total Unclassified: 75
Report Percentages: 45.02% 52.49% 0.93% 1.16% 0.23% 0.05% 0.05% 0.07%
Peak Time: (AM): 2016-10-05 [08:15 AM-08:30 AM] Peak Count: 94
Peak Time: (PM): 2016-10-05 [05:15 PM-05:30 PM] Peak Count: 104

Time/Speed Report
HI-Star ID: 10FDCB Begin: 2016-10-05 12:00 AM End: 2016-10-06 12:00 AM
Street: King St W - WB Lane: WB Hours: 24:00
State: ON Oper: MD Period: 15
City: City of Hamilton Posted: 50 Raw Count: 4386
Area: btwn Bond St & Woodley Ln AADT Factor: 1 AADT Count: 4386
NC200 - km/h 0 to 9 10 to 19 20 to 29 30 to 39 40 to 49 50 to 59 60 to 69 70 to 79 80 to 89 90 to 99 100 to 109 110 to 119 120 to 129 130 to 139 140 > Total
2016-10-05 [12:00 AM-12:15 AM] 0 0 0 0 1 4 3 0 0 0 0 0 0 0 0 8
2016-10-05 [12:15 AM-12:30 AM] 0 0 0 1 0 1 2 1 1 0 0 0 0 0 0 6
2016-10-05 [12:30 AM-12:45 AM] 0 0 0 0 0 2 3 0 0 0 0 0 0 0 0 5
2016-10-05 [12:45 AM-01:00 AM] 0 0 0 0 0 0 0 0 0 0 0 0 0 0 0 0
0 0 0 1 1 7 8 1 1 0 0 0 0 0 0 19
2016-10-05 [01:00 AM-01:15 AM] 0 0 0 0 0 0 0 1 0 0 0 0 0 0 0 1
2016-10-05 [01:15 AM-01:30 AM] 0 0 0 0 0 2 2 0 0 0 0 0 0 0 0 4
2016-10-05 [01:30 AM-01:45 AM] 0 0 0 0 0 1 3 0 0 0 0 0 0 0 0 4
2016-10-05 [01:45 AM-02:00 AM] 0 0 0 0 1 1 0 0 0 0 0 0 0 0 0 2
0 0 0 0 1 4 5 1 0 0 0 0 0 0 0 11
2016-10-05 [02:00 AM-02:15 AM] 0 0 0 0 1 0 1 0 0 0 0 0 0 0 0 2
2016-10-05 [02:15 AM-02:30 AM] 0 0 0 0 0 1 1 1 0 0 0 0 0 0 0 3
2016-10-05 [02:30 AM-02:45 AM] 0 0 0 0 0 0 1 0 0 0 0 0 0 0 0 1
2016-10-05 [02:45 AM-03:00 AM] 0 0 0 1 0 0 0 0 0 0 0 0 0 0 0 1
0 0 0 1 1 1 3 1 0 0 0 0 0 0 0 7
2016-10-05 [03:00 AM-03:15 AM] 0 0 0 1 0 1 0 0 0 0 0 0 0 0 0 2
2016-10-05 [03:15 AM-03:30 AM] 0 0 0 1 0 1 0 1 0 0 0 0 0 0 0 3
2016-10-05 [03:30 AM-03:45 AM] 0 0 0 0 0 0 0 0 1 0 0 0 0 0 0 1
2016-10-05 [03:45 AM-04:00 AM] 0 0 0 0 0 0 2 0 0 0 0 0 0 0 0 2
0 0 0 2 0 2 2 1 1 0 0 0 0 0 0 8
2016-10-05 [04:00 AM-04:15 AM] 0 0 0 0 0 0 0 0 0 0 0 0 0 0 0 0
2016-10-05 [04:15 AM-04:30 AM] 0 0 0 0 0 0 0 3 0 0 0 0 0 0 0 3
2016-10-05 [04:30 AM-04:45 AM] 0 0 0 0 0 1 1 1 0 0 0 0 0 0 0 3
2016-10-05 [04:45 AM-05:00 AM] 0 0 0 0 0 1 1 1 0 0 0 0 0 0 0 3
0 0 0 0 0 2 2 5 0 0 0 0 0 0 0 9
2016-10-05 [05:00 AM-05:15 AM] 0 0 0 0 0 2 0 0 0 0 0 0 0 0 0 2
2016-10-05 [05:15 AM-05:30 AM] 0 0 0 0 2 4 4 2 0 0 0 0 0 0 0 12
2016-10-05 [05:30 AM-05:45 AM] 0 0 0 0 1 5 4 2 0 0 0 0 0 0 0 12
2016-10-05 [05:45 AM-06:00 AM] 0 0 0 0 1 5 5 1 0 0 0 0 0 0 0 12
0 0 0 0 4 16 13 5 0 0 0 0 0 0 0 38
2016-10-05 [06:00 AM-06:15 AM] 0 0 0 1 1 4 6 1 1 2 0 0 0 0 0 16
2016-10-05 [06:15 AM-06:30 AM] 0 0 1 0 1 14 7 4 1 0 0 0 0 0 0 28
2016-10-05 [06:30 AM-06:45 AM] 0 0 1 0 2 14 6 1 1 0 0 0 0 0 0 25
2016-10-05 [06:45 AM-07:00 AM] 0 0 0 0 2 9 19 2 1 1 0 0 0 0 0 34
0 0 2 1 6 41 38 8 4 3 0 0 0 0 0 103
2016-10-05 [07:00 AM-07:15 AM] 0 0 0 0 6 16 14 4 2 0 0 0 0 0 0 42
2016-10-05 [07:15 AM-07:30 AM] 0 0 0 0 4 24 23 6 1 0 0 0 0 0 0 58
2016-10-05 [07:30 AM-07:45 AM] 0 0 0 0 12 28 27 1 0 0 0 0 0 0 0 68
2016-10-05 [07:45 AM-08:00 AM] 0 0 1 0 10 36 28 2 2 0 0 0 0 0 0 79
0 0 1 0 32 104 92 13 5 0 0 0 0 0 0 247
2016-10-05 [08:00 AM-08:15 AM] 0 0 0 1 5 27 17 3 0 0 0 0 0 0 0 53
2016-10-05 [08:15 AM-08:30 AM] 0 0 0 0 12 54 21 4 1 1 0 0 0 0 0 93
2016-10-05 [08:30 AM-08:45 AM] 0 0 0 0 12 34 16 4 0 0 0 0 0 0 0 66
2016-10-05 [08:45 AM-09:00 AM] 0 0 0 0 16 49 20 2 1 1 0 0 0 0 0 89
0 0 0 1 45 164 74 13 2 2 0 0 0 0 0 301
2016-10-05 [09:00 AM-09:15 AM] 0 0 1 2 13 37 10 2 0 0 0 0 0 0 0 65
2016-10-05 [09:15 AM-09:30 AM] 0 0 0 1 12 36 15 0 0 0 0 0 0 0 0 64
2016-10-05 [09:30 AM-09:45 AM] 0 0 0 0 12 33 9 1 1 0 0 0 0 0 0 56
2016-10-05 [09:45 AM-10:00 AM] 0 1 0 1 14 28 11 3 1 0 0 0 0 0 0 59
0 1 1 4 51 134 45 6 2 0 0 0 0 0 0 244
2016-10-05 [10:00 AM-10:15 AM] 0 0 2 2 5 21 19 2 1 0 0 0 0 0 0 52
2016-10-05 [10:15 AM-10:30 AM] 0 0 0 2 6 22 13 3 0 0 0 0 0 0 0 46
2016-10-05 [10:30 AM-10:45 AM] 0 0 0 1 4 50 11 1 2 0 0 0 0 0 0 69
2016-10-05 [10:45 AM-11:00 AM] 0 0 1 2 10 30 6 2 1 0 0 0 0 0 0 52
0 0 3 7 25 123 49 8 4 0 0 0 0 0 0 219
2016-10-05 [11:00 AM-11:15 AM] 0 0 0 3 7 34 13 0 0 0 0 0 0 0 0 57
2016-10-05 [11:15 AM-11:30 AM] 0 0 0 1 10 24 16 0 1 0 0 0 0 0 0 52
2016-10-05 [11:30 AM-11:45 AM] 0 1 2 2 8 48 14 1 2 0 0 0 0 0 0 78
2016-10-05 [11:45 AM-12:00 PM] 0 0 0 3 17 25 8 0 0 2 0 0 0 0 0 55
0 1 2 9 42 131 51 1 3 2 0 0 0 0 0 242
2016-10-05 [12:00 PM-12:15 PM] 0 0 0 4 6 34 11 5 1 0 0 0 0 0 0 61
2016-10-05 [12:15 PM-12:30 PM] 0 0 0 0 19 30 8 1 0 1 0 0 0 0 0 59
2016-10-05 [12:30 PM-12:45 PM] 0 0 0 3 14 26 6 1 0 0 0 0 0 0 0 50
2016-10-05 [12:45 PM-01:00 PM] 0 0 1 7 20 41 8 3 1 0 0 0 0 0 0 81
0 0 1 14 59 131 33 10 2 1 0 0 0 0 0 251
2016-10-05 [01:00 PM-01:15 PM] 0 0 0 1 13 42 17 1 0 0 0 0 0 0 0 74
2016-10-05 [01:15 PM-01:30 PM] 0 0 1 0 7 30 23 6 1 0 0 0 0 0 0 68
2016-10-05 [01:30 PM-01:45 PM] 0 0 0 2 12 41 15 1 0 0 0 0 0 0 0 71
2016-10-05 [01:45 PM-02:00 PM] 0 0 0 1 6 24 21 5 0 0 0 0 0 0 0 57
0 0 1 4 38 137 76 13 1 0 0 0 0 0 0 270
2016-10-05 [02:00 PM-02:15 PM] 0 1 0 2 6 32 16 1 0 0 0 0 0 0 0 58
2016-10-05 [02:15 PM-02:30 PM] 0 0 0 1 10 58 12 2 1 0 0 0 0 0 0 84
2016-10-05 [02:30 PM-02:45 PM] 0 0 0 0 5 47 21 2 3 0 0 0 0 0 0 78
2016-10-05 [02:45 PM-03:00 PM] 0 0 0 2 14 43 32 4 0 1 0 0 0 0 0 96

0 1 0 5 35 180 81 9 4 1 0 0 0 0 0 316
2016-10-05 [03:00 PM-03:15 PM] 0 0 0 1 22 44 13 0 0 0 0 0 0 0 0 80
2016-10-05 [03:15 PM-03:30 PM] 0 0 1 3 12 46 16 3 0 0 0 0 0 0 0 81
2016-10-05 [03:30 PM-03:45 PM] 0 0 0 0 9 47 25 1 2 2 0 0 0 0 0 86
2016-10-05 [03:45 PM-04:00 PM] 0 0 0 0 18 44 32 3 1 0 0 0 0 0 0 98
0 0 1 4 61 181 86 7 3 2 0 0 0 0 0 345
2016-10-05 [04:00 PM-04:15 PM] 0 0 0 5 7 43 34 7 0 0 0 0 0 0 0 96
2016-10-05 [04:15 PM-04:30 PM] 0 0 0 2 6 43 27 3 2 1 0 0 0 0 0 84
2016-10-05 [04:30 PM-04:45 PM] 0 0 0 2 5 46 42 4 0 0 0 0 0 0 0 99
2016-10-05 [04:45 PM-05:00 PM] 0 0 0 1 12 42 35 7 0 0 0 0 0 0 0 97
0 0 0 10 30 174 138 21 2 1 0 0 0 0 0 376
2016-10-05 [05:00 PM-05:15 PM] 0 0 0 0 4 42 31 3 2 0 0 0 0 0 0 82
2016-10-05 [05:15 PM-05:30 PM] 0 0 0 1 14 44 38 6 1 0 0 0 0 0 0 104
2016-10-05 [05:30 PM-05:45 PM] 0 0 0 5 12 45 32 4 1 0 0 0 0 0 0 99
2016-10-05 [05:45 PM-06:00 PM] 0 0 0 0 8 42 37 4 1 0 0 0 0 0 0 92
0 0 0 6 38 173 138 17 5 0 0 0 0 0 0 377
2016-10-05 [06:00 PM-06:15 PM] 0 0 0 0 2 33 26 5 0 1 0 0 0 0 0 67
2016-10-05 [06:15 PM-06:30 PM] 0 0 0 2 6 31 25 5 1 0 0 0 0 0 0 70
2016-10-05 [06:30 PM-06:45 PM] 0 0 0 1 9 33 15 5 2 1 0 0 0 0 0 66
2016-10-05 [06:45 PM-07:00 PM] 0 0 1 3 4 24 20 12 1 0 0 0 0 0 0 65
0 0 1 6 21 121 86 27 4 2 0 0 0 0 0 268
2016-10-05 [07:00 PM-07:15 PM] 0 0 4 8 10 35 16 1 0 0 0 0 0 0 0 74
2016-10-05 [07:15 PM-07:30 PM] 0 0 0 0 8 33 14 1 0 0 0 0 0 0 0 56
2016-10-05 [07:30 PM-07:45 PM] 0 0 1 4 2 27 10 3 0 0 0 0 0 0 0 47
2016-10-05 [07:45 PM-08:00 PM] 0 0 0 0 5 18 16 2 0 0 0 0 0 0 0 41
0 0 5 12 25 113 56 7 0 0 0 0 0 0 0 218
2016-10-05 [08:00 PM-08:15 PM] 0 0 0 0 2 30 13 3 3 0 0 0 0 0 0 51
2016-10-05 [08:15 PM-08:30 PM] 0 0 0 0 5 17 19 3 0 0 0 0 0 0 0 44
2016-10-05 [08:30 PM-08:45 PM] 0 0 0 1 1 24 16 2 0 0 0 0 0 0 0 44
2016-10-05 [08:45 PM-09:00 PM] 0 0 0 0 2 21 5 6 0 1 0 0 0 0 0 35
0 0 0 1 10 92 53 14 3 1 0 0 0 0 0 174
2016-10-05 [09:00 PM-09:15 PM] 0 0 1 1 6 27 12 4 1 0 0 0 0 0 0 52
2016-10-05 [09:15 PM-09:30 PM] 0 1 3 1 5 16 7 6 0 1 0 0 0 0 0 40
2016-10-05 [09:30 PM-09:45 PM] 0 0 0 2 5 10 11 1 0 0 0 0 0 0 0 29
2016-10-05 [09:45 PM-10:00 PM] 0 0 0 0 1 13 10 0 0 1 0 0 0 0 0 25
0 1 4 4 17 66 40 11 1 2 0 0 0 0 0 146
2016-10-05 [10:00 PM-10:15 PM] 0 0 0 1 1 16 10 3 0 0 0 0 0 0 0 31
2016-10-05 [10:15 PM-10:30 PM] 0 0 0 0 4 15 9 3 0 0 0 0 0 0 0 31
2016-10-05 [10:30 PM-10:45 PM] 0 0 0 0 3 7 7 0 0 0 0 0 0 0 0 17
2016-10-05 [10:45 PM-11:00 PM] 0 0 0 0 1 7 4 1 0 0 0 0 0 0 0 13
0 0 0 1 9 45 30 7 0 0 0 0 0 0 0 92
2016-10-05 [11:00 PM-11:15 PM] 0 0 0 0 0 5 5 0 0 0 0 0 0 0 0 10
2016-10-05 [11:15 PM-11:30 PM] 0 0 0 0 0 6 3 0 0 0 0 0 0 0 0 9
2016-10-05 [11:30 PM-11:45 PM] 0 0 0 0 0 4 4 0 0 0 0 0 0 0 0 8
2016-10-05 [11:45 PM-12:00 AM] 0 0 0 0 0 2 0 1 0 0 0 0 0 0 0 3
0 0 0 0 0 17 12 1 0 0 0 0 0 0 0 30
Daily Totals: 0 4 22 93 551 2159 1211 207 47 17 0 0 0 0 0 4311
Report Totals: 0 4 22 93 551 2159 1211 207 47 17 0 0 0 0 0 4311
Report Percentages: 0.00% 0.09% 0.51% 2.16% 12.78% 50.08% 28.09% 4.80% 1.09% 0.39% 0.00% 0.00% 0.00% 0.00% 0.00%

Attachment 2
TURNING MOVEMENT COUNTS


City of Hamilton T U R N I N G M O V E M E N T F L O W C H A R T Loc. Code: 133
Intersection: King St W at Bond St Total Vehicles: 4,548 Date: Thursday
Direction: (East/West) (North/South) M.V.E./Year: 2.984 Oct 13, 2016
Road Condition: Dry Weather: Clear AWDT Factor: 1.93 Period: 7 hours
Comments:
Pedestrians 1 7 0 7 2 Pedestrians 1 8 0 2 0 1
0 1 3
4 4
4 1 6
8 0 3 0 6 0 2 3 0 0 0 5 0 0
2 7 3 2 5 4 4 0 0 3 8 1
1 4 1 4 2 1 0 1 0 3
6 1 9 1
2 3 1 6 1 2 1 0 7 0
0 0 1 0
4 1 1 4 2 6 3 5 6 3 7 2
4 1 5 1 8 3 6 8
2 1 7
2 5 9 9 7 1 1
0 0
1 1
1 0 1 0 9 3 6 0 2 0 1 2
0 6
1 5 0 2 1 3 Pedestrians 2 1 0 1 9 2 Pedestrians
0 2
A.M. PEAK HOUR = 8:15 AM - 9:15 AM P.M. PEAK HOUR = 4:30 PM - 5:30 PM
N 2 0 3 24 Hr 1 4 9 24 Hr
Pedestrians 1 0 1 1 8 0 Pedestrians 1 0 5 2 7 7 5
8 1 9 2
3 9
8 24 Hr 6 3 2 9
6 1 1 0 3 0 0 4 0 5 7 1 2 9 0 5 0 2
3 1 0 2 9 2 2 1 0 2 1 9 8 1 2 3
1 8 1 7 3 9 1 8 8 0 9
0 1 5 9 6
9 9 9 7 3 7 4 6 6 2 8
0 0 2 2 24 Hr
3 2 1 3 3 4 4 2 2 1 6 7 2 2 7 4
3 1 4 1 7 3 2 1 1 0 0 1 1 7
3 1 3 4 0
4 4 4 1 4 4 4 0 4 3 8 9 24 Hr
0 24 Hr 2
1 1 6 1 7 1
2 0 1 0 0 3 0 1 1 1 2 7
0 1 3
1 4 0 2 3 3 Pedestrians 9 5 4 1 4 3 1 9 Pedestrians
0 9
NORMAL HOUR = 2:15 PM - 3:15 PM 1 8 3 24 Hr 2 7 6 24 Hr
7 Hr & 24 Hr TOTAL VOLUMES
Pedestr
ians
Pedestr
ians
Pedestr
ians
Pedestr
ians
Pedestr
ians
Pedestr
ians
Pedestr
ians
Pedestr
ians

City of Hamilton T U R N I N G M O V E M E N T C O U N T Loc. Code: 133
Intersection: King St W at Bond St Total Vehicles: 5,156 Date: Thursday
Direction: (East/West) (North/South) Oct 13, 2016
Road Condition: Dry Weather: Clear Period: 8 hours
Comments:
TOTAL VEHICLES
15 mins.
Ending Total N E S W
L S R L S R L S R L S R Veh's side side side side7:15 0 0 3 0 47 0 0 1 1 1 32 0 85 0 0 0 07:30 2 0 0 1 56 0 0 0 1 1 43 0 104 0 0 0 07:45 2 0 2 1 83 0 1 0 4 3 57 0 153 0 0 0 18:00 2 0 5 1 88 0 3 0 1 1 68 0 169 0 0 0 28:15 0 0 2 1 98 2 0 1 2 1 42 0 149 0 0 0 08:30 2 1 1 1 117 3 2 0 1 0 64 2 194 0 0 0 08:45 6 0 3 1 105 2 2 1 1 0 59 1 181 0 14 0 09:00 0 0 2 0 93 1 0 0 3 3 68 1 171 0 0 0 09:15 3 0 3 0 96 3 2 2 3 0 63 0 175 0 0 0 09:30 1 0 0 1 52 1 0 0 0 0 62 1 118 0 0 1 09:45 1 0 2 0 63 0 2 0 3 2 67 0 140 0 0 0 0
10:00 1 0 1 0 58 1 2 1 1 0 44 0 109 0 0 0 213:45 0 0 2 0 75 2 1 0 3 0 60 0 143 1 0 0 014:00 3 1 2 3 60 0 1 1 3 1 58 0 133 0 0 0 014:15 2 1 2 3 63 2 7 0 2 1 79 1 163 0 1 0 014:30 4 1 4 2 79 1 0 0 0 4 74 1 170 4 2 0 014:45 3 0 2 5 75 2 0 0 3 1 64 2 157 1 0 0 015:00 2 0 2 0 94 0 2 1 0 1 64 2 168 2 1 0 015:15 3 0 2 2 73 1 1 0 3 3 90 3 181 1 0 0 015:30 2 0 4 1 64 3 1 0 2 2 72 1 152 1 0 0 016:15 5 3 6 1 73 2 0 0 3 3 86 3 185 2 0 0 016:30 4 0 4 0 69 1 1 1 1 3 103 2 189 0 1 4 016:45 3 1 1 5 78 4 0 0 2 2 83 1 180 3 3 0 017:00 2 1 4 3 103 1 1 0 8 4 98 2 227 0 0 2 117:15 0 0 2 3 95 2 2 0 3 3 101 1 212 0 1 2 117:30 1 0 4 1 80 4 2 0 0 1 99 2 194 0 0 2 017:45 3 2 6 1 60 1 1 0 4 3 91 0 172 3 5 1 218:00 3 0 1 0 70 1 1 0 3 2 90 3 174 1 1 1 018:15 1 0 3 1 81 1 0 1 7 1 76 2 174 4 0 0 018:30 1 0 0 1 66 0 2 0 5 0 68 0 143 0 1 0 018:45 2 0 1 1 63 3 0 0 3 2 62 1 138 0 0 0 019:00 4 1 2 3 85 0 0 0 3 4 50 1 153 0 0 0 0
TOTAL 68 12 78 43 2,462 44 37 10 79 53 2,237 33 23 30 13 9
APPR. 158 2,549 126 2,323 5,156 75
TRUCKS & BUSES
15 mins. West Bd. on
Ending
L S R L S R L S R L S R Total7:15 0 0 1 0 4 0 0 0 1 0 2 0 87:30 0 0 0 0 5 0 0 0 0 0 1 0 67:45 0 0 1 0 6 0 0 0 0 1 4 0 128:00 0 0 0 0 13 0 0 0 0 1 8 0 228:15 0 0 1 1 10 0 0 0 0 0 5 0 178:30 0 0 0 0 2 0 0 0 0 0 3 2 78:45 0 0 1 0 6 0 0 0 0 0 3 0 109:00 0 0 1 0 5 0 0 0 0 0 1 0 79:15 0 0 1 0 2 0 0 0 0 0 7 0 109:30 0 0 0 0 1 0 0 0 0 0 2 0 39:45 0 0 1 0 3 0 0 0 0 0 0 0 4
10:00 0 0 1 0 4 0 0 0 0 0 3 0 813:45 0 0 0 0 3 1 0 0 0 0 0 0 414:00 1 0 1 0 3 0 0 0 0 0 3 0 814:15 0 1 0 0 3 0 0 0 0 0 5 0 914:30 0 0 2 0 3 0 0 0 0 0 5 0 1014:45 0 0 0 0 2 0 0 0 0 0 2 0 415:00 0 0 1 0 6 0 0 0 0 0 1 0 815:15 0 0 0 0 3 0 0 0 1 0 9 0 1315:30 0 0 1 0 2 1 0 0 0 0 6 0 1016:15 0 0 1 0 3 0 0 0 0 0 5 0 916:30 0 0 1 0 5 0 0 0 0 0 2 0 816:45 0 0 0 1 3 0 0 0 0 0 2 0 617:00 0 0 1 0 1 0 0 0 0 0 1 0 317:15 0 0 0 0 1 0 0 0 0 0 4 0 517:30 0 0 1 0 1 0 0 0 0 0 3 0 517:45 0 0 0 0 0 0 0 0 0 0 0 0 018:00 0 0 0 0 0 0 0 0 0 0 1 0 118:15 0 0 1 0 2 0 0 0 0 1 1 0 518:30 0 0 0 0 0 0 0 0 0 0 0 0 018:45 0 0 1 0 0 0 0 0 0 0 1 0 219:00 0 0 0 0 1 0 0 0 0 0 2 0 3
TOTAL 1 1 19 2 103 2 0 0 2 3 92 2
APPR. 21 107 2 97 227
TRUCKS7:15 0 0 0 0 4 0 0 0 0 0 0 0 47:30 0 0 0 0 3 0 0 0 0 0 1 0 47:45 0 0 0 0 4 0 0 0 0 1 4 0 98:00 0 0 0 0 10 0 0 0 0 1 6 0 178:15 0 0 0 0 1 0 0 0 0 0 3 0 48:30 0 0 0 0 2 0 0 0 0 0 1 1 48:45 0 0 0 0 2 0 0 0 0 0 2 0 49:00 0 0 0 0 3 0 0 0 0 0 1 0 49:15 0 0 0 0 1 0 0 0 0 0 5 0 69:30 0 0 0 0 0 0 0 0 0 0 1 0 19:45 0 0 0 0 2 0 0 0 0 0 0 0 2
10:00 0 0 0 0 4 0 0 0 0 0 2 0 613:45 0 0 0 0 2 1 0 0 0 0 0 0 314:00 1 0 0 0 3 0 0 0 0 0 2 0 614:15 0 1 0 0 3 0 0 0 0 0 2 0 614:30 0 0 1 0 1 0 0 0 0 0 3 0 514:45 0 0 0 0 2 0 0 0 0 0 0 0 215:00 0 0 0 0 3 0 0 0 0 0 0 0 315:15 0 0 0 0 2 0 0 0 0 0 2 0 415:30 0 0 0 0 2 0 0 0 0 0 3 0 516:15 0 0 0 0 1 0 0 0 0 0 4 0 516:30 0 0 0 0 4 0 0 0 0 0 1 0 516:45 0 0 0 1 3 0 0 0 0 0 2 0 617:00 0 0 0 0 0 0 0 0 0 0 1 0 117:15 0 0 0 0 1 0 0 0 0 0 2 0 317:30 0 0 0 0 1 0 0 0 0 0 3 0 417:45 0 0 0 0 0 0 0 0 0 0 0 0 018:00 0 0 0 0 0 0 0 0 0 0 0 0 018:15 0 0 0 0 2 0 0 0 0 1 0 0 318:30 0 0 0 0 0 0 0 0 0 0 0 0 018:45 0 0 0 0 0 0 0 0 0 0 1 0 119:00 0 0 0 0 0 0 0 0 0 0 2 0 2
TOTAL 1 1 1 1 66 1 0 0 0 3 54 1
APPR. 3 68 0 58 129
E/W
North Bd. on East Bd. on South Bd. on
N/S E/W N/S
Pedestrians
N/S E/W N/S E/W
North Bd. on East Bd. on South Bd. on West Bd. on

City of Hamilton T U R N I N G M O V E M E N T F L O W C H A R T Loc. Code: 132
Intersection: Highway 8 at Woodley Lane Total Vehicles: 4,655 Date: Friday
Direction: (East/West) (North/South) M.V.E./Year: 2.896 Oct 14, 2016
Road Condition: Dry Weather: Clear AWDT Factor: 1.83 Period: 7 hours
Comments:
Pedestrians 0 0 0 0 Pedestrians 0 0 0 0
0 0
0 2
0 0
0 0 0 0 0 0 0 0 0 0 0 0 0 0
2 4 9 2 4 9 4 1 0 4 0 5
2 4 2 4 2 1 0 1 0 4
7 2 1 1
0 2 2 1 5 0 8 3 0
0 1 0 0
3 9 8 3 9 8 3 9 3 4 1 4
4 3 5 3 5 3 3 3
0 3 9
6 5 8 5 3 2
0 0
2
0 0 0 0 0 0 5 0 0 0 1 0
0 0
3 0 1 0 0 Pedestrians 1 0 0 2 6 0 Pedestrians
0 0
A.M. PEAK HOUR = 8:00 AM - 9:00 AM P.M. PEAK HOUR = 4:45 PM - 5:45 PM
N 0 24 Hr 0 24 Hr
Pedestrians 0 0 0 0 Pedestrians 0 0 0 0
0 0
0 2
0 24 Hr 0
0 0 0 0 0 0 0 3 8 8 9 0 0 0 0 0 0 0
3 4 9 3 4 3 2 1 2 5 2 1 0 5 2 4
3 2 3 2 3 1 3 9 1 3 8 2 1 0
5 3 3 4 8
0 1 5 8 2 0 1 2 5 0 0 1
0 0 0 2 24 Hr
3 2 8 3 5 4 4 2 2 2 6 4 2 3 7 0
3 2 0 2 0 2 2 1 1 2 9 1 2 9
3 2 0 9 2
4 0 6 7 9 9 3 5 4 3 3 7 24 Hr
0 24 Hr 0
1
2 2 0
6 0 0 0 6 0 0 1 0 0 6 0
0 0
2 1 0 3 2 0 Pedestrians 1 6 0 2 1 2 6 1 Pedestrians
3 9
NORMAL HOUR = 2:30 PM - 3:30 PM 2 9 3 24 Hr 2 3 1 24 Hr
7 Hr & 24 Hr TOTAL VOLUMES
Pedestr
ians
Pedestr
ians
Pedestr
ians
Pedestr
ians
Pedestr
ians
Pedestr
ians
Pedestr
ians
Pedestr
ians

City of Hamilton T U R N I N G M O V E M E N T C O U N T Loc. Code: 132
Intersection: Highway 8 at Woodley Lane Total Vehicles: 5,307 Date: Friday
Direction: (East/West) (North/South) Oct 14, 2016
Road Condition: Dry Weather: Clear Period: 8 hours
Comments:
TOTAL VEHICLES
15 mins.
Ending Total N E S W
L S R L S R L S R L S R Veh's side side side side7:15 0 0 0 0 49 1 0 0 0 0 38 0 88 0 0 0 07:30 0 0 1 0 38 0 0 0 0 4 57 0 100 0 0 0 07:45 0 0 1 0 79 2 0 0 0 2 58 0 142 0 0 0 08:00 0 0 1 0 92 1 0 0 0 4 66 0 164 0 0 0 08:15 0 0 0 0 105 1 0 0 0 3 50 0 159 0 0 0 08:30 0 0 0 0 115 0 0 0 0 1 58 0 174 0 0 0 08:45 0 0 0 0 95 2 0 0 0 8 62 0 167 0 0 0 09:00 0 0 0 0 83 5 0 0 0 10 79 0 177 0 0 0 09:15 0 0 0 0 68 4 0 0 0 9 60 0 141 0 0 0 09:30 1 0 1 0 84 1 0 0 0 10 59 0 156 0 0 0 09:45 2 0 2 0 58 5 0 0 0 13 42 0 122 0 0 0 0
10:00 0 0 2 0 63 1 0 0 0 10 52 0 128 0 0 0 013:45 0 0 0 0 79 0 0 0 0 5 71 0 155 0 0 0 214:00 2 0 3 0 61 4 0 0 0 6 54 0 130 0 0 0 014:15 0 0 6 0 68 0 0 0 0 5 75 0 154 0 0 0 314:30 0 0 4 0 72 0 0 0 0 4 92 0 172 0 0 0 014:45 2 0 12 0 71 3 0 0 0 4 81 0 173 0 0 0 015:00 1 0 4 0 89 1 0 0 0 2 81 0 178 0 0 0 115:15 2 0 5 0 79 2 0 0 0 3 98 0 189 0 0 0 215:30 1 0 5 0 89 0 0 0 0 6 83 0 184 0 0 0 016:15 2 0 11 0 83 0 0 0 0 2 98 0 196 0 0 0 016:30 1 0 5 0 88 0 0 0 0 3 87 0 184 0 0 0 016:45 1 0 10 0 67 0 0 0 0 3 100 0 181 0 0 0 117:00 0 0 2 0 106 1 0 0 0 0 108 0 217 0 1 0 017:15 2 0 6 0 94 0 0 0 0 5 107 0 214 0 1 0 017:30 1 0 7 0 111 1 0 0 0 2 95 0 217 0 0 0 017:45 2 0 6 0 82 0 0 0 0 1 95 0 186 0 0 0 018:00 0 0 12 0 96 0 0 0 0 0 99 0 207 0 0 0 018:15 1 0 5 0 87 0 0 0 0 4 68 0 165 0 0 0 018:30 2 0 10 0 72 1 0 0 0 4 74 0 163 0 0 0 018:45 6 0 6 0 69 6 0 0 0 6 73 0 166 0 0 0 219:00 2 0 8 0 66 0 0 0 0 5 77 0 158 0 0 0 0
TOTAL 31 0 135 0 2,558 42 0 0 0 144 2,397 0 0 2 0 11
APPR. 166 2,600 0 2,541 5,307 13
TRUCKS & BUSES
15 mins. West Bd. on
Ending
L S R L S R L S R L S R Total7:15 0 0 0 0 4 0 0 0 0 0 2 0 67:30 0 0 0 0 5 0 0 0 0 0 6 0 117:45 0 0 0 0 6 0 0 0 0 0 5 0 118:00 0 0 0 0 10 0 0 0 0 0 3 0 138:15 0 0 0 0 15 0 0 0 0 0 3 0 188:30 0 0 0 0 10 0 0 0 0 0 5 0 158:45 0 0 0 0 7 0 0 0 0 0 8 0 159:00 0 0 0 0 3 0 0 0 0 1 8 0 129:15 0 0 0 0 5 0 0 0 0 0 1 0 69:30 0 0 0 0 8 0 0 0 0 0 7 0 159:45 1 0 0 0 4 0 0 0 0 0 8 0 13
10:00 0 0 0 0 3 0 0 0 0 0 4 0 713:45 0 0 0 0 5 0 0 0 0 0 3 0 814:00 0 0 0 0 2 0 0 0 0 0 4 0 614:15 0 0 0 0 5 0 0 0 0 1 10 0 1614:30 0 0 0 0 3 0 0 0 0 0 6 0 914:45 0 0 0 0 1 0 0 0 0 0 8 0 915:00 0 0 0 0 8 0 0 0 0 0 6 0 1415:15 0 0 0 0 6 0 0 0 0 0 9 0 1515:30 0 0 0 0 5 0 0 0 0 0 9 0 1416:15 0 0 0 0 4 0 0 0 0 0 6 0 1016:30 0 0 0 0 2 0 0 0 0 0 2 0 416:45 0 0 0 0 2 0 0 0 0 0 4 0 617:00 0 0 0 0 1 0 0 0 0 0 5 0 617:15 0 0 0 0 1 0 0 0 0 0 1 0 217:30 0 0 0 0 1 0 0 0 0 0 3 0 417:45 0 0 0 0 0 0 0 0 0 0 1 0 118:00 0 0 0 0 3 0 0 0 0 0 1 0 418:15 0 0 0 0 0 0 0 0 0 0 4 0 418:30 0 0 0 0 1 0 0 0 0 0 2 0 318:45 0 0 0 0 0 0 0 0 0 0 1 0 119:00 0 0 0 0 2 0 0 0 0 0 0 0 2
TOTAL 1 0 0 0 132 0 0 0 0 2 145 0
APPR. 1 132 0 147 280
TRUCKS7:15 0 0 0 0 4 0 0 0 0 0 0 0 47:30 0 0 0 0 3 0 0 0 0 0 5 0 87:45 0 0 0 0 4 0 0 0 0 0 4 0 88:00 0 0 0 0 6 0 0 0 0 0 2 0 88:15 0 0 0 0 6 0 0 0 0 0 1 0 78:30 0 0 0 0 8 0 0 0 0 0 3 0 118:45 0 0 0 0 3 0 0 0 0 0 6 0 99:00 0 0 0 0 1 0 0 0 0 1 6 0 89:15 0 0 0 0 5 0 0 0 0 0 0 0 59:30 0 0 0 0 8 0 0 0 0 0 5 0 139:45 1 0 0 0 4 0 0 0 0 0 7 0 12
10:00 0 0 0 0 3 0 0 0 0 0 3 0 613:45 0 0 0 0 5 0 0 0 0 0 3 0 814:00 0 0 0 0 2 0 0 0 0 0 3 0 514:15 0 0 0 0 4 0 0 0 0 1 8 0 1314:30 0 0 0 0 2 0 0 0 0 0 3 0 514:45 0 0 0 0 1 0 0 0 0 0 4 0 515:00 0 0 0 0 3 0 0 0 0 0 4 0 715:15 0 0 0 0 5 0 0 0 0 0 3 0 815:30 0 0 0 0 2 0 0 0 0 0 3 0 516:15 0 0 0 0 1 0 0 0 0 0 4 0 516:30 0 0 0 0 0 0 0 0 0 0 1 0 116:45 0 0 0 0 2 0 0 0 0 0 3 0 517:00 0 0 0 0 0 0 0 0 0 0 4 0 417:15 0 0 0 0 1 0 0 0 0 0 1 0 217:30 0 0 0 0 1 0 0 0 0 0 3 0 417:45 0 0 0 0 0 0 0 0 0 0 1 0 118:00 0 0 0 0 3 0 0 0 0 0 1 0 418:15 0 0 0 0 0 0 0 0 0 0 3 0 318:30 0 0 0 0 1 0 0 0 0 0 2 0 318:45 0 0 0 0 0 0 0 0 0 0 1 0 119:00 0 0 0 0 1 0 0 0 0 0 0 0 1
TOTAL 1 0 0 0 89 0 0 0 0 2 97 0
APPR. 1 89 0 99 189
E/W
North Bd. on East Bd. on South Bd. on
N/S E/W N/S
Pedestrians
N/S E/W N/S E/W
North Bd. on East Bd. on South Bd. on West Bd. on

Attachment 3
SYNCHRO ANALYSIS REPORTS


HCM Unsignalized Intersection Capacity Analysis <Existing> AM Peak Hour
1: Woodleys Ln & King St W 11/30/2016
Spencer Creek Bridge 248 Class EA - Hamilton Synchro 8 Report
WSP Canada Inc. Page 1
Movement EBT EBR WBL WBT NEL NER
Lane Configurations
Volume (veh/h) 398 8 22 249 0 0
Sign Control Free Free Stop
Grade 0% 0% 0%
Peak Hour Factor 0.92 0.92 0.92 0.92 0.92 0.92
Hourly flow rate (vph) 433 9 24 271 0 0
Pedestrians
Lane Width (m)
Walking Speed (m/s)
Percent Blockage
Right turn flare (veh)
Median type None None
Median storage veh)
Upstream signal (m)
pX, platoon unblocked
vC, conflicting volume 441 755 437
vC1, stage 1 conf vol
vC2, stage 2 conf vol
vCu, unblocked vol 441 755 437
tC, single (s) 4.1 6.4 6.2
tC, 2 stage (s)
tF (s) 2.2 3.5 3.3
p0 queue free % 98 100 100
cM capacity (veh/h) 1103 371 624
Direction, Lane # EB 1 WB 1 NE 1
Volume Total 441 295 0
Volume Left 0 24 0
Volume Right 9 0 0
cSH 1700 1103 1700
Volume to Capacity 0.26 0.02 0.00
Queue Length 95th (m) 0.0 0.5 0.0
Control Delay (s) 0.0 0.9 0.0
Lane LOS A A
Approach Delay (s) 0.0 0.9 0.0
Approach LOS A
Intersection Summary
Average Delay 0.3
Intersection Capacity Utilization 34.7% ICU Level of Service A
Analysis Period (min) 15
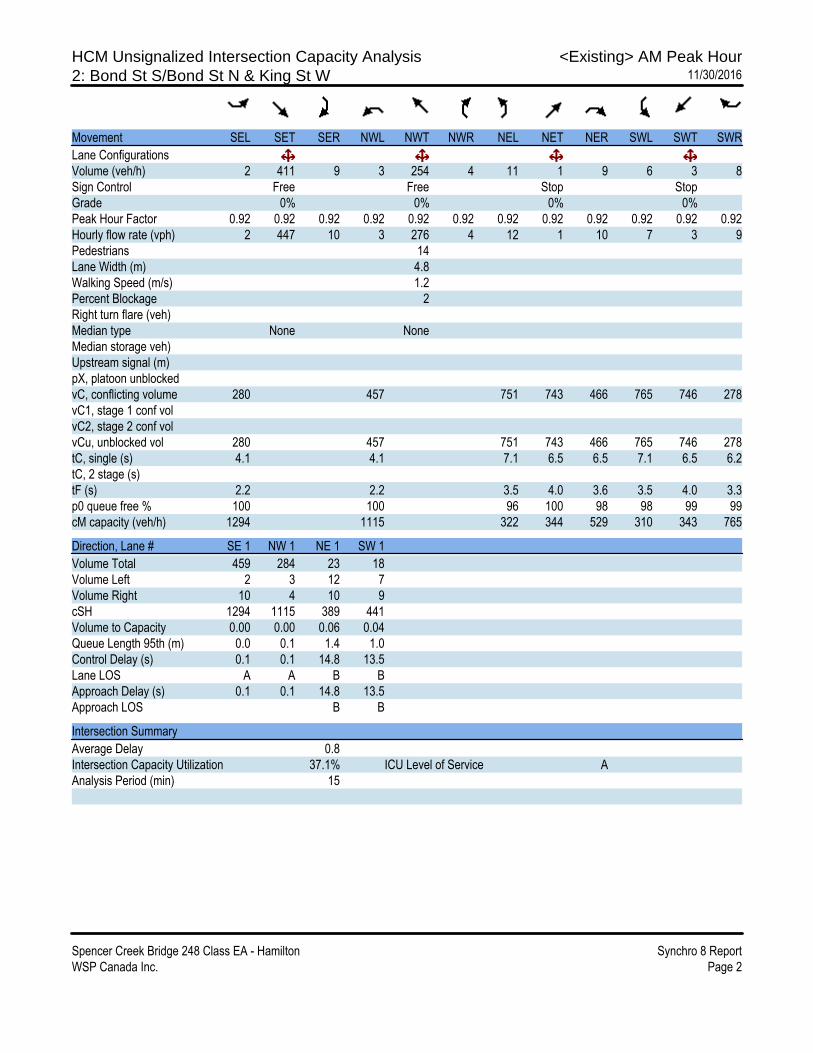
HCM Unsignalized Intersection Capacity Analysis <Existing> AM Peak Hour
2: Bond St S/Bond St N & King St W 11/30/2016
Spencer Creek Bridge 248 Class EA - Hamilton Synchro 8 Report
WSP Canada Inc. Page 2
Movement SEL SET SER NWL NWT NWR NEL NET NER SWL SWT SWR
Lane Configurations
Volume (veh/h) 2 411 9 3 254 4 11 1 9 6 3 8
Sign Control Free Free Stop Stop
Grade 0% 0% 0% 0%
Peak Hour Factor 0.92 0.92 0.92 0.92 0.92 0.92 0.92 0.92 0.92 0.92 0.92 0.92
Hourly flow rate (vph) 2 447 10 3 276 4 12 1 10 7 3 9
Pedestrians 14
Lane Width (m) 4.8
Walking Speed (m/s) 1.2
Percent Blockage 2
Right turn flare (veh)
Median type None None
Median storage veh)
Upstream signal (m)
pX, platoon unblocked
vC, conflicting volume 280 457 751 743 466 765 746 278
vC1, stage 1 conf vol
vC2, stage 2 conf vol
vCu, unblocked vol 280 457 751 743 466 765 746 278
tC, single (s) 4.1 4.1 7.1 6.5 6.5 7.1 6.5 6.2
tC, 2 stage (s)
tF (s) 2.2 2.2 3.5 4.0 3.6 3.5 4.0 3.3
p0 queue free % 100 100 96 100 98 98 99 99
cM capacity (veh/h) 1294 1115 322 344 529 310 343 765
Direction, Lane # SE 1 NW 1 NE 1 SW 1
Volume Total 459 284 23 18
Volume Left 2 3 12 7
Volume Right 10 4 10 9
cSH 1294 1115 389 441
Volume to Capacity 0.00 0.00 0.06 0.04
Queue Length 95th (m) 0.0 0.1 1.4 1.0
Control Delay (s) 0.1 0.1 14.8 13.5
Lane LOS A A B B
Approach Delay (s) 0.1 0.1 14.8 13.5
Approach LOS B B
Intersection Summary
Average Delay 0.8
Intersection Capacity Utilization 37.1% ICU Level of Service A
Analysis Period (min) 15

HCM Unsignalized Intersection Capacity Analysis <Existing> PM Peak Hour
1: Woodleys Ln & King St W 11/30/2016
Spencer Creek Bridge 248 Class EA - Hamilton Synchro 8 Report
WSP Canada Inc. Page 1
Movement EBT EBR WBL WBT NEL NER
Lane Configurations
Volume (veh/h) 393 2 8 405 5 21
Sign Control Free Free Stop
Grade 0% 0% 0%
Peak Hour Factor 0.92 0.92 0.92 0.92 0.92 0.92
Hourly flow rate (vph) 427 2 9 440 5 23
Pedestrians 2
Lane Width (m) 4.2
Walking Speed (m/s) 1.2
Percent Blockage 0
Right turn flare (veh)
Median type None None
Median storage veh)
Upstream signal (m)
pX, platoon unblocked
vC, conflicting volume 429 886 430
vC1, stage 1 conf vol
vC2, stage 2 conf vol
vCu, unblocked vol 429 886 430
tC, single (s) 4.1 6.4 6.2
tC, 2 stage (s)
tF (s) 2.2 3.5 3.3
p0 queue free % 99 98 96
cM capacity (veh/h) 1141 315 628
Direction, Lane # EB 1 WB 1 NE 1
Volume Total 429 449 28
Volume Left 0 9 5
Volume Right 2 0 23
cSH 1700 1141 527
Volume to Capacity 0.25 0.01 0.05
Queue Length 95th (m) 0.0 0.2 1.3
Control Delay (s) 0.0 0.2 12.2
Lane LOS A B
Approach Delay (s) 0.0 0.2 12.2
Approach LOS B
Intersection Summary
Average Delay 0.5
Intersection Capacity Utilization 38.4% ICU Level of Service A
Analysis Period (min) 15

HCM Unsignalized Intersection Capacity Analysis <Existing> PM Peak Hour
2: Bond St S/Bond St N & King St W 11/30/2016
Spencer Creek Bridge 248 Class EA - Hamilton Synchro 8 Report
WSP Canada Inc. Page 2
Movement SEL SET SER NWL NWT NWR NEL NET NER SWL SWT SWR
Lane Configurations
Volume (veh/h) 12 356 11 10 381 6 6 2 11 5 0 13
Sign Control Free Free Stop Stop
Grade 0% 0% 0% 0%
Peak Hour Factor 0.92 0.92 0.92 0.92 0.92 0.92 0.92 0.92 0.92 0.92 0.92 0.92
Hourly flow rate (vph) 13 387 12 11 414 7 7 2 12 5 0 14
Pedestrians 2 4 6 3
Lane Width (m) 4.8 4.8 4.8 4.8
Walking Speed (m/s) 1.2 1.2 1.2 1.2
Percent Blockage 0 0 1 0
Right turn flare (veh)
Median type None None
Median storage veh)
Upstream signal (m)
pX, platoon unblocked
vC, conflicting volume 424 405 880 870 403 878 873 422
vC1, stage 1 conf vol
vC2, stage 2 conf vol
vCu, unblocked vol 424 405 880 870 403 878 873 422
tC, single (s) 4.2 4.1 7.1 6.5 6.4 7.1 6.5 6.2
tC, 2 stage (s)
tF (s) 2.3 2.2 3.5 4.0 3.5 3.5 4.0 3.3
p0 queue free % 99 99 97 99 98 98 100 98
cM capacity (veh/h) 1100 1157 255 283 607 256 282 632
Direction, Lane # SE 1 NW 1 NE 1 SW 1
Volume Total 412 432 21 20
Volume Left 13 11 7 5
Volume Right 12 7 12 14
cSH 1100 1157 390 448
Volume to Capacity 0.01 0.01 0.05 0.04
Queue Length 95th (m) 0.3 0.2 1.3 1.0
Control Delay (s) 0.4 0.3 14.7 13.4
Lane LOS A A B B
Approach Delay (s) 0.4 0.3 14.7 13.4
Approach LOS B B
Intersection Summary
Average Delay 1.0
Intersection Capacity Utilization 36.3% ICU Level of Service A
Analysis Period (min) 15

HCM Unsignalized Intersection Capacity Analysis <Future 2026> AM Peak Hour
1: Woodleys Ln & King St W 11/30/2016
Spencer Creek Bridge 248 Class EA - Hamilton Synchro 8 Report
WSP Canada Inc. Page 1
Movement EBT EBR WBL WBT NEL NER
Lane Configurations
Volume (veh/h) 440 8 22 275 0 0
Sign Control Free Free Stop
Grade 0% 0% 0%
Peak Hour Factor 0.92 0.92 0.92 0.92 0.92 0.92
Hourly flow rate (vph) 478 9 24 299 0 0
Pedestrians
Lane Width (m)
Walking Speed (m/s)
Percent Blockage
Right turn flare (veh)
Median type None None
Median storage veh)
Upstream signal (m)
pX, platoon unblocked
vC, conflicting volume 487 829 483
vC1, stage 1 conf vol
vC2, stage 2 conf vol
vCu, unblocked vol 487 829 483
tC, single (s) 4.1 6.4 6.2
tC, 2 stage (s)
tF (s) 2.2 3.5 3.3
p0 queue free % 98 100 100
cM capacity (veh/h) 1061 335 588
Direction, Lane # EB 1 WB 1 NE 1
Volume Total 487 323 0
Volume Left 0 24 0
Volume Right 9 0 0
cSH 1700 1061 1700
Volume to Capacity 0.29 0.02 0.00
Queue Length 95th (m) 0.0 0.5 0.0
Control Delay (s) 0.0 0.8 0.0
Lane LOS A A
Approach Delay (s) 0.0 0.8 0.0
Approach LOS A
Intersection Summary
Average Delay 0.3
Intersection Capacity Utilization 36.0% ICU Level of Service A
Analysis Period (min) 15

HCM Unsignalized Intersection Capacity Analysis <Future 2026> AM Peak Hour
2: Bond St S/Bond St N & King St W 11/30/2016
Spencer Creek Bridge 248 Class EA - Hamilton Synchro 8 Report
WSP Canada Inc. Page 2
Movement SEL SET SER NWL NWT NWR NEL NET NER SWL SWT SWR
Lane Configurations
Volume (veh/h) 2 454 10 3 281 4 12 1 10 7 3 9
Sign Control Free Free Stop Stop
Grade 0% 0% 0% 0%
Peak Hour Factor 0.92 0.92 0.92 0.92 0.92 0.92 0.92 0.92 0.92 0.92 0.92 0.92
Hourly flow rate (vph) 2 493 11 3 305 4 13 1 11 8 3 10
Pedestrians 14
Lane Width (m) 4.8
Walking Speed (m/s) 1.2
Percent Blockage 2
Right turn flare (veh)
Median type None None
Median storage veh)
Upstream signal (m)
pX, platoon unblocked
vC, conflicting volume 310 504 829 820 513 843 823 308
vC1, stage 1 conf vol
vC2, stage 2 conf vol
vCu, unblocked vol 310 504 829 820 513 843 823 308
tC, single (s) 4.1 4.1 7.1 6.5 6.5 7.1 6.5 6.2
tC, 2 stage (s)
tF (s) 2.2 2.2 3.5 4.0 3.6 3.5 4.0 3.3
p0 queue free % 100 100 95 100 98 97 99 99
cM capacity (veh/h) 1262 1071 285 311 497 274 309 737
Direction, Lane # SE 1 NW 1 NE 1 SW 1
Volume Total 507 313 25 21
Volume Left 2 3 13 8
Volume Right 11 4 11 10
cSH 1262 1071 351 400
Volume to Capacity 0.00 0.00 0.07 0.05
Queue Length 95th (m) 0.0 0.1 1.7 1.2
Control Delay (s) 0.1 0.1 16.0 14.5
Lane LOS A A C B
Approach Delay (s) 0.1 0.1 16.0 14.5
Approach LOS C B
Intersection Summary
Average Delay 0.9
Intersection Capacity Utilization 39.4% ICU Level of Service A
Analysis Period (min) 15

HCM Unsignalized Intersection Capacity Analysis
1: Woodleys Ln & King St W 11/30/2016
Spencer Creek Bridge 248 Class EA - Future 2026 PM 11/23/2016 Future 2026 Synchro 8 Report
WSP Canada Inc. Page 1
Movement EBT EBR WBL WBT NEL NER
Lane Configurations
Volume (veh/h) 434 2 8 447 5 21
Sign Control Free Free Stop
Grade 0% 0% 0%
Peak Hour Factor 0.92 0.92 0.92 0.92 0.92 0.92
Hourly flow rate (vph) 472 2 9 486 5 23
Pedestrians 2
Lane Width (m) 4.2
Walking Speed (m/s) 1.2
Percent Blockage 0
Right turn flare (veh)
Median type None None
Median storage veh)
Upstream signal (m)
pX, platoon unblocked
vC, conflicting volume 474 976 475
vC1, stage 1 conf vol
vC2, stage 2 conf vol
vCu, unblocked vol 474 976 475
tC, single (s) 4.1 6.4 6.2
tC, 2 stage (s)
tF (s) 2.2 3.5 3.3
p0 queue free % 99 98 96
cM capacity (veh/h) 1099 279 593
Direction, Lane # EB 1 WB 1 NE 1
Volume Total 474 495 28
Volume Left 0 9 5
Volume Right 2 0 23
cSH 1700 1099 487
Volume to Capacity 0.28 0.01 0.06
Queue Length 95th (m) 0.0 0.2 1.4
Control Delay (s) 0.0 0.2 12.8
Lane LOS A B
Approach Delay (s) 0.0 0.2 12.8
Approach LOS B
Intersection Summary
Average Delay 0.5
Intersection Capacity Utilization 40.6% ICU Level of Service A
Analysis Period (min) 15

HCM Unsignalized Intersection Capacity Analysis
2: Bond St S/Bond St N & King St W 11/30/2016
Spencer Creek Bridge 248 Class EA - Future 2026 PM 11/23/2016 Future 2026 Synchro 8 Report
WSP Canada Inc. Page 2
Movement SEL SET SER NWL NWT NWR NEL NET NER SWL SWT SWR
Lane Configurations
Volume (veh/h) 13 393 12 11 421 7 7 2 12 6 0 14
Sign Control Free Free Stop Stop
Grade 0% 0% 0% 0%
Peak Hour Factor 0.92 0.92 0.92 0.92 0.92 0.92 0.92 0.92 0.92 0.92 0.92 0.92
Hourly flow rate (vph) 14 427 13 12 458 8 8 2 13 7 0 15
Pedestrians 2 4 6 3
Lane Width (m) 4.8 4.8 4.8 4.8
Walking Speed (m/s) 1.2 1.2 1.2 1.2
Percent Blockage 0 0 1 0
Right turn flare (veh)
Median type None None
Median storage veh)
Upstream signal (m)
pX, platoon unblocked
vC, conflicting volume 468 446 970 960 444 968 963 466
vC1, stage 1 conf vol
vC2, stage 2 conf vol
vCu, unblocked vol 468 446 970 960 444 968 963 466
tC, single (s) 4.2 4.1 7.1 6.5 6.4 7.1 6.5 6.2
tC, 2 stage (s)
tF (s) 2.3 2.2 3.5 4.0 3.5 3.5 4.0 3.3
p0 queue free % 99 99 97 99 98 97 100 97
cM capacity (veh/h) 1059 1117 221 250 575 221 249 597
Direction, Lane # SE 1 NW 1 NE 1 SW 1
Volume Total 454 477 23 22
Volume Left 14 12 8 7
Volume Right 13 8 13 15
cSH 1059 1117 347 395
Volume to Capacity 0.01 0.01 0.07 0.06
Queue Length 95th (m) 0.3 0.2 1.6 1.3
Control Delay (s) 0.4 0.3 16.1 14.6
Lane LOS A A C B
Approach Delay (s) 0.4 0.3 16.1 14.6
Approach LOS C B
Intersection Summary
Average Delay 1.1
Intersection Capacity Utilization 38.8% ICU Level of Service A
Analysis Period (min) 15
Attachment 4
ACCIDENT REPORTS


Co
rrid
or:
Kin
g St
W-
Wo
od
leys
Lan
e to
Bo
nd
St
Ran
ge: J
anu
ary
1, 2
01
1 -
No
vem
ber
6, 2
01
6
Co
mp
iled
: No
vem
ber
21
, 20
16
CA
SE ID
DA
TETI
ME
STR
EET
1ST
REE
T 2
DIS
TAN
CE
DIR
FR
OM
INT
CO
LLIS
ION
LO
CW
EATH
ERLI
GH
TIN
GC
OLL
CLA
SS
20
11
79
39
59
12
/14
/20
11
13
:25
KIN
G D
BO
ND
D8
0W
est
No
n in
ters
ecti
on
Rai
nD
aylig
ht
PD
on
ly
20
12
54
94
06
02
/29
/20
12
23
:50
KIN
G D
WO
OD
LEY
15
No
rth
No
n in
ters
ecti
on
Rai
nD
aylig
ht
arti
fici
alN
on
fat
al in
jury
20
12
57
49
15
03
/31
/20
12
17
:00
HW
Y 8
DW
OO
DLE
Y7
0N
ort
hO
verp
ass
or
bri
dge
Cle
arD
aylig
ht
No
n f
atal
inju
ry
20
12
60
40
68
05
/04
/20
12
17
:35
BO
ND
DK
ING
D1
1So
uth
Inte
rsec
tio
n r
ela
ted
Cle
arD
aylig
ht
PD
on
ly
20
12
62
85
62
06
/01
/20
12
15
:35
KIN
G D
BO
ND
D1
59
We
stO
verp
ass
or
bri
dge
Rai
nD
aylig
ht
No
n f
atal
inju
ry
20
13
58
17
25
04
/17
/20
13
6:4
5K
ING
DW
OO
DLE
Y0
0A
t in
ters
ecti
on
Cle
arD
aylig
ht
No
n f
atal
inju
ry
20
13
65
52
15
07
/16
/20
13
13
:00
KIN
G D
BO
ND
D2
2W
est
No
n in
ters
ecti
on
Cle
arD
aylig
ht
PD
on
ly
20
13
77
56
27
12
/17
/20
13
8:5
5K
ING
DB
ON
D D
35
East
No
n in
ters
ecti
on
Cle
arD
aylig
ht
PD
on
ly
20
14
52
08
90
01
/29
/20
14
17
:00
KIN
G D
BO
ND
D2
0W
est
No
n in
ters
ecti
on
Cle
arD
ark
arti
fici
alPD
on
ly
20
14
56
22
89
03
/25
/20
14
11
:55
KIN
G D
WO
OD
LEY
00
At
inte
rsec
tio
nC
lear
Day
ligh
tN
on
fat
al in
jury
20
14
70
77
17
06
/25
/20
14
19
:05
KIN
G D
WO
OD
LEY
00
At
inte
rsec
tio
nC
lear
Day
ligh
tN
on
fat
al in
jury
20
15
73
16
96
10
/14
/20
15
6:4
4K
ING
DW
OO
DLE
Y4
3Ea
stN
on
inte
rsec
tio
nR
ain
Day
ligh
tN
on
fat
al in
jury
20
15
74
94
88
11
/06
/20
15
9:1
5K
ING
DB
ON
D D
40
We
stN
on
inte
rsec
tio
nR
ain
Day
ligh
tN
on
fat
al in
jury
20
15
77
69
19
12
/13
/20
15
13
:12
KIN
G D
BO
ND
D2
00
We
stN
on
inte
rsec
tio
nR
ain
Day
ligh
tP
D o
nly
20
15
78
27
61
12
/21
/20
15
15
:45
KIN
G D
BO
ND
D1
35
We
stN
ear
pri
vate
dri
veR
ain
Dar
k ar
tifi
cialP
D o
nly
20
16
72
39
53
09
/22
/20
16
16
:24
KIN
G D
BO
ND
D2
6Ea
stN
ear
pri
vate
dri
veC
lear
Day
ligh
tN
on
fat
al in
jury
20
16
74
73
89
10
/20
/20
16
17
:00
KIN
G D
BO
ND
D1
00
We
stN
on
inte
rsec
tio
nR
ain
Du
skN
on
fat
al in
jury

INIT
IAL
IMP
AC
TR
OA
D 1
ALI
GN
RO
AD
2 A
LIG
NR
OA
D 1
SU
RF
CO
ND
RO
AD
2 S
UR
F C
ON
DTR
AF
CO
NT
DR
V 1
AC
T
SMV
oth
erC
urv
e o
n h
illSt
raig
ht
on
leve
lW
etW
etN
o c
on
tro
lLo
st c
on
tro
l
SMV
oth
erC
urv
e o
n h
illC
urv
e o
n h
illW
etW
etN
o c
on
tro
lLo
st c
on
tro
l
Rea
r e
nd
Cu
rve
on
hill
Cu
rve
on
hill
Dry
Dry
No
co
ntr
ol
Dri
vin
g P
rop
erly
SMV
oth
erSt
raig
ht
on
leve
lSt
raig
ht
on
leve
lD
ryD
rySt
op
sig
nLo
st c
on
tro
l
Hea
d o
nC
urv
e o
n h
illSt
raig
ht
on
leve
lW
etW
etN
o c
on
tro
lD
rivi
ng
Pro
per
ly
Rea
r e
nd
Stra
igh
t o
n h
illD
rySt
op
sig
nO
ther
dri
ver
acti
on
Sid
e sw
ipe
Cu
rve
on
hill
Stra
igh
t o
n le
vel
Dry
Dry
No
co
ntr
ol
Oth
er d
rive
r ac
tio
n
SMV
str
ikes
un
atte
nd
edSt
raig
ht
on
leve
lSt
raig
ht
on
leve
lW
etW
etN
o c
on
tro
lD
rivi
ng
Pro
per
ly
SMV
str
ikes
un
atte
nd
edSt
raig
ht
on
leve
lSt
raig
ht
on
leve
lD
ryD
ryN
o c
on
tro
lIm
pro
per
pas
sin
g
Rea
r e
nd
Cu
rve
on
hill
Dry
Sto
p s
ign
Lost
co
ntr
ol
Left
tu
rn (
on
com
ing)
Cu
rve
on
hill
Dry
Sto
p s
ign
Imp
rop
er t
urn
SMV
oth
erC
urv
e o
n h
illC
urv
e o
n h
illW
etW
etN
o c
on
tro
lO
ther
dri
ver
acti
on
Sid
e sw
ipe
Cu
rve
on
hill
Stra
igh
t o
n le
vel
Wet
Wet
No
co
ntr
ol
Spee
d t
oo
fas
t
SMV
oth
erC
urv
e o
n le
vel
Stra
igh
t o
n le
vel
Wet
Wet
No
co
ntr
ol
Lost
co
ntr
ol
SMV
oth
erC
urv
e o
n h
illSt
raig
ht
on
leve
lW
etW
etN
o c
on
tro
lLo
st c
on
tro
l
Left
tu
rn (
op
po
site
th
ru)
Stra
igh
t o
n le
vel
Stra
igh
t o
n le
vel
Dry
Dry
No
co
ntr
ol
Dri
vin
g P
rop
erly
Sid
e sw
ipe
Cu
rve
on
hill
Stra
igh
t o
n le
vel
Wet
Wet
No
co
ntr
ol
Spee
d t
oo
fas
t

DR
V 2
AC
TV
EH 1
DIR
VEH
2 D
IRV
EH 1
MA
NEU
VER
VEH
2 M
AN
EUV
ERV
EH 1
EV
ENT
East
Go
ing
ahea
dSk
idd
ing/
slid
ing
East
Go
ing
ahea
dO
ther
mo
tor
veh
icle
Dri
vin
g P
rop
erly
Wes
tW
est
Slo
win
g o
r st
op
pin
gG
oin
g ah
ead
An
imal
- d
om
esti
c
East
Turn
ing
righ
tSk
idd
ing/
slid
ing
Spee
d t
oo
fas
tW
est
East
Go
ing
ahea
dG
oin
g ah
ead
Oth
er m
oto
r ve
hic
le
Dri
vin
g P
rop
erly
Wes
tW
est
Go
ing
ahea
dSt
op
ped
Oth
er m
oto
r ve
hic
le
Dri
vin
g P
rop
erly
East
Wes
tG
oin
g ah
ead
Go
ing
ahea
dLo
ad s
pill
East
Go
ing
ahea
dP
arke
dU
nat
ten
ded
veh
icle
Oth
er d
rive
r ac
tio
nW
est
Wes
tG
oin
g ah
ead
Par
ked
Un
atte
nd
ed v
ehic
le
Dri
vin
g P
rop
erly
Wes
tW
est
Sto
pp
edG
oin
g ah
ead
Oth
er m
oto
r ve
hic
le
No
rth
East
Turn
ing
left
Slo
win
g o
r st
op
pin
gC
yclis
t
East
Turn
ing
left
Bri
dge
su
pp
ort
Dri
vin
g P
rop
erly
East
Wes
tG
oin
g ah
ead
Go
ing
ahea
dO
ther
mo
tor
veh
icle
East
Go
ing
ahea
dSk
idd
ing/
slid
ing
East
Go
ing
ahea
dSk
idd
ing/
slid
ing
Imp
rop
er t
urn
Wes
tEa
stG
oin
g ah
ead
Turn
ing
left
Oth
er m
oto
r ve
hic
le
Dri
vin
g P
rop
erly
Sou
thN
ort
hG
oin
g ah
ead
Go
ing
ahea
dO
ther
mo
tor
veh
icle