appendix e ip14 area geomorphology and groundwater
TRANSCRIPT

APPENDIX E
IP14 Area Geomorphology and Groundwater Investigation (Umwelt Environmental Consultants, 2009)
LandCorp
IP14 Area Geomorphology and Groundwater Investigation
June 2009
Environmental Consultants
IP14 Area Geomorphology and Groundwater Investigation
Prepared by
Umwelt (Australia) Pty Limited
on behalf of
Project Director:
Project Manager:
LandCorp
Peter Jamieson
Catherine Pepper
Report No. 2310/R01N2/FINAL Date: June 2009
- Umwelt Environmental Consultants
144 Churchill Avenue PO Box 8177
Subiaco WA· 6008
Ph: 08 6260 0700 Fax: 08 9388 7577
Email: [email protected] Website: www.umwelt.com.au

IP14 Area Geomorphology & Groundwater Table of Contents
TABLE OF CONTENTS
1.0 Introduction .............................................................................. 1.1
2.0 Environmental Characteristics of the IP14 Area ................... 2.1 2.1 Topography ........................................................................................ 2.1 2.2 Stratigraphy and Geomorphology of Becher Plain ........................ 2.1
2.2.1 Terminology for Beach Ridges ........................................................................ 2.2
2.2.2 A Cuspate Beach Ridge Plain ......................................................................... 2.2
2.2.3 Post-deposition Modification of Beach Ridge Morphology .............................. 2.3
2.2.4 Details of Surface Morphology: IP14 Area ..................................................... 2.3
2.2.5 Soil Forming Processes in Beach Ridges ....................................................... 2.4
2.3 Age Structure and Morphology of Wetlands of the Rockingham-Becher Plain ....................................................................................... 2.5
2.4 I P14 Wetlands/Dam plands ................................................................ 2. 7 2.5 Climate ............................................................................................... 2.9 2.6 Hydrogeology .................................................................................. 2.10 2.7 Surface Water Features .................................................................. 2.11
2. 7 .1 Lake Coo long up ............................................................................................ 2.11
2.7.2 Wetlands ........................................................................................................ 2.11
3.0 Groundwater Modelling Methodology .................................... 3.1 3.1 Pre-development Scenario Model Properties ................................. 3.1 3.2 Pre-development Scenario Model Calibration ................................ 3.2 3.3 Groundwater Influence on Damplands within the IP14 Area ......... 3.3 3.4 Conceptual Post-development Scenario Modelling Methodology 3.3 3.5 Comments on Assumptions in Modelling ....................................... 3.4
4.0 Groundwater Modelling Results and Discussion .................. 4.1 4.1 Pre-Development Scenario Model Calibration ................................ 4.1 4.2 Damplands within the IP14 Area ...................................................... 4.1 4.3 Conceptual Post-development Scenario Model Results ................ 4.1
5.0 Conclusion ................................................................................ 5.1
6.0 References ................................................................................ 6.1
2310/R01/FINAL Umwelt (Australia) Pty Limited
June 2009

IP14 Area Geomorphology & Groundwater Table of Contents
FIGURES
1.1 Locality Plan ............................................................................................... 1.1
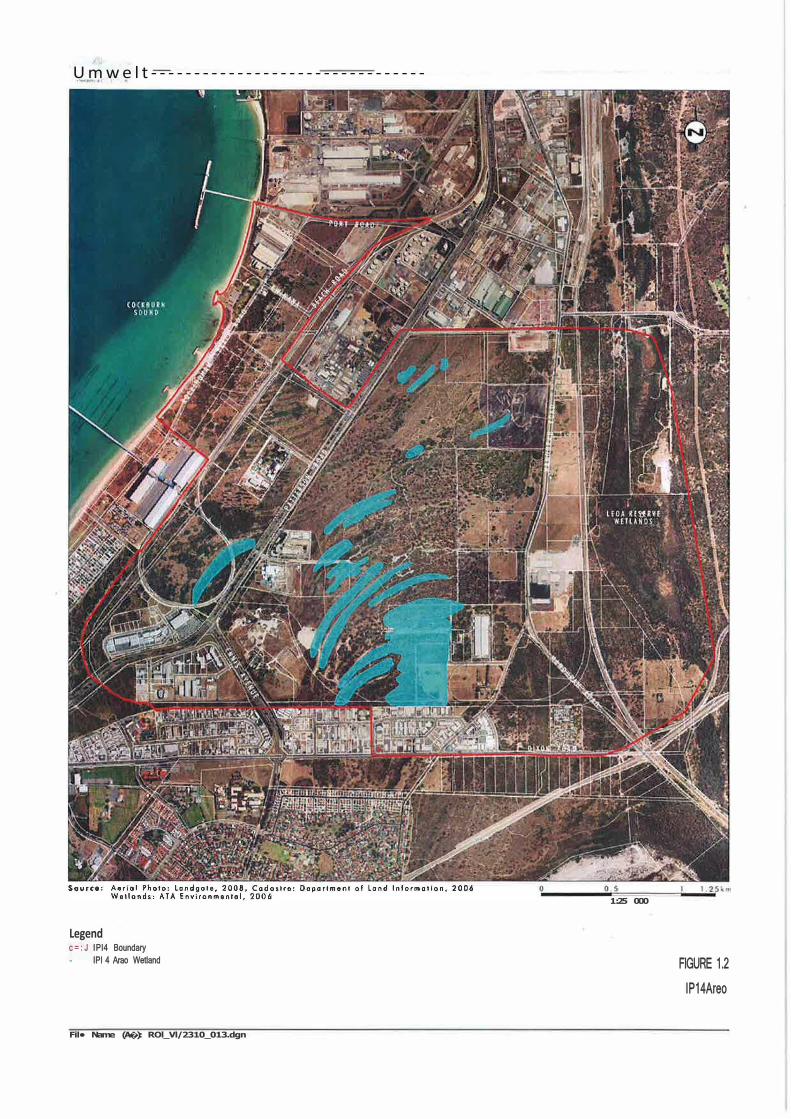
1.2 IP14Area .................................................................................................... 1.1
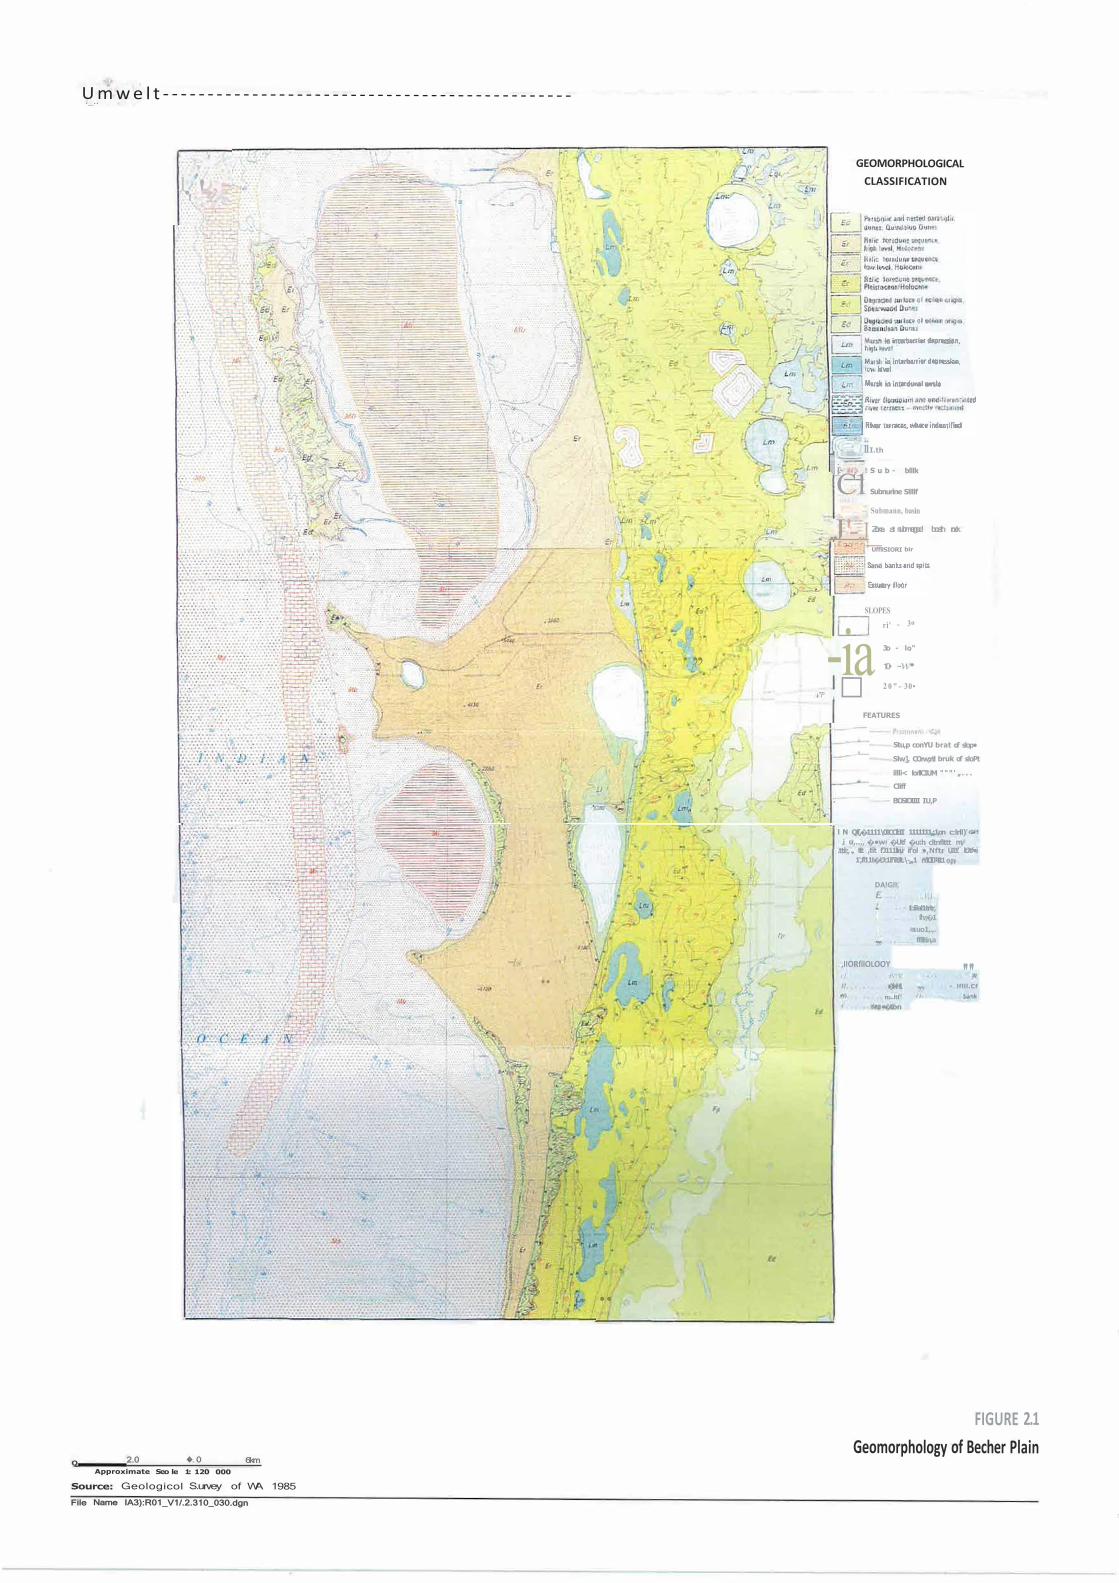
2.1 Geomorphology of Becher Plain .............................................................. 2.1
2.2 IP14 Area Topography ............................................................................... 2.1
2.3 IP14 Area Topographic Height Units ........................................................ 2.1
2.4 Geological Sequence ................................................................................. 2.1
2.5 Groundwater Bore Locations and May 2003 Regional Groundwater Profile .......................................................................................................... 2.3
2.6 Cross Section Elevations .......................................................................... 2.3
2.7 IP14 Area Monthly Rainfall and Evaporation ........................................... 2.9
2.8 DoW Groundwater Bore 64140033 Long Term Groundwater Level Record ...................................................................................................... 2.10
2.9 Annual Rainfall at Kwinana BP Refinery (BoM Station 009064) ........... 2.10
2.10 Water Table Elevation in LandCorp Groundwater Bores ..................... 2.10
3.1 IP14 Area Groundwater Model Domain and Boundaries ........................ 3.1
4.1 Bore EGRM9/A Hydraulic Conductivity Calibration Graphs .................. 4.1
4.2 Bore EGRM9/A Specific Yield Calibration Graphs .................................. 4.1
4.3 Bore EGRM9/A Recharge Calibration Graphs ......................................... 4.1
4.4 Bore EGRM9/A Extinction Depth Calibration Graphs ............................. 4.1
4.5 Bore EGRM9/A Final Parameters Calibration Graphs ............................ 4.1
4.6 IP14 Area with Water Table within 2.5 m of the Ground Surface in May 2004 ............................................................................................................. 4.1
4. 7 Modelled IP14 Area Pre-development Scenario Groundwater Contours May 2004 .................................................................................... 4.1
4.8 Modelled IP14 Area Conceptual Post-development Scenario Groundwater Contour May 2004 ............................................................... 4.1
2310/R01/FINAL Umwelt (Australia) Pty Limited
June 2009 II

IP14 Area Geomorphology & Groundwater - Table of Contents
APPENDICES
1 Groundwater Model Input Data
2 East Rockingham Industrial Park IP-14 (1998) Structure Plan
231 0/R01/FINAL Umwelt (Australia) Pty Limited
June 2009 iii

IP14 Area Geomorphology & Groundwater Introduction
1.0 Introduction The East Rockingham Industrial Park covers approximately 1150 hectares of land primarily zoned for industrial development within the Town of Kwinana and the City of Rockingham, approximately 40 kilometres south-west of Perth Central Business District. The East Rockingham Industrial Park is located immediately to the south of the Kwinana Industrial Area (refer to Figures 1.1 and 1.2).
The East Rockingham Industrial Park is subject to Improvement Plan 14 (IP14), which was initiated in 1988 under the provisions the Metropolitan Region Town Planning Scheme Act 1959 by the Western Australian Planning Commission. The objective of IP14 was 'to ensure that the area is developed in a manner which has regard to potential industries and their future needs in addition to their pollution and hazard influences on neighbouring urban areas'. The East Rockingham Industrial Park (known as the IP14 area) has been developed progressively over many years, however a significant area of land remains undeveloped. A Structure Plan was prepared for the IP14 Area in 1999, and proposed development over most of the remaining undeveloped land within the area. The structure plan also recommended retention of some areas in their natural state as buffers to surrounding land uses including the Leda Reserve to the east and residential areas to the south-west and the coastal area to the north-west (ATA Environmental Consultants, in prep).
Since the preparation of the structure plan in 1999, the central and eastern areas of the IP14 area have been identified as potentially significant habitat areas due to the presence of a threatened ecological community (TEC) within the area. The TEC, Sedge/ands in Holocene dune swa/es of the Southern Swan Coastal Plain (referred to from here on as TEC 19), occurs between Patterson Road and Mandurah Road (refer to Figure 1.2) and is a groundwater dependent wetland plant community that exists in this location as a result of the geomorphology of the area. The presence of the TEC within the IP14 area has bearing on which areas need to be maintained in their natural state and which areas can be developed to meet present and future demand for industrial land in the area.
The geomorphology of the area and the groundwater regime of IP14 have been investigated to provide a greater understanding of where TEC 19 might occur and where it might be sustainable in the long term based on observed groundwater levels and groundwater modelling.
Umwelt (Australia) Pty Limited (Umwelt) was engaged by LandCorp to describe the geomorphology of the area and conduct a study of the groundwater system of the IP14 area and then use the findings of this study to explore the interaction between groundwater levels across the IP14 area and the location of TEC 19. This report sets out the geomorphic context of the IP14 area and the methodology used and results obtained from the groundwater investigation. The objectives of the study were to:
• explore and document the geomorphic characteristics of the area that may influence the existence of TEC 19 in the IP14 area;
• develop a hydrogeological model of the IP14 area;
• calibrate the model to available groundwater level information for the IP14 area;
• investigate the relationship between groundwater levels and the presence of the TEC;
• provide information on the areas most likely to sustain the TEC in the longer term based on groundwater modelling results; and
2310/R01/FINAL Umwelt (Australia) Pty Limited
June 2009 1.1

-------------------------------------= Umwelt ·---
ROTTNEST ISLAND
GARDEN ISLAND
Filo Name (A-4): R0l_Vl/2310_010 dgn
tJ ANNEROO
OBARTONS
FIGURE l.1
IP14 Area Locality Pion
U m w e l t - - - - - - - - - - - - - - - - - - - - - - - - - - - - - - - -• v ♦ C . l '
Legend c = : J IPl4 Boundary - IPI 4 Arao Wetland
Fil• Name (A�): ROl_Vl/2310_013.dgn
1 :25 000
FIGURE 1.2
IP14Areo

IP14 Area Geomorphology & Groundwater Introduction
• develop a hydrogeological model of the conceptual post-development IP14 areaincorporating water sensitive urban design (WSUD) features to determine the potentialimpact of development of the IP14 area on groundwater levels.
231 0/R01/FINAL Umwelt (Australla) Pty Limited
June 2009 1.2

IP14 Area Geomorphology & Groundwater Environmental Characteristics
2.0 Environmental Characteristics of the IP14 Area 2.1 Topography
IP14 is situated on the Holocene coastal plain north-east of Rockingham and form part of the Swan Coastal Plain in the Perth Basin. The geomorphic and surface features of the area are shown in Figure 2.1.
The topography of the IP14 area is generally flat, with elevation ranging from approximately 0 metres Australian Height Datum (mAHD) at the coast in the west, to approximately 9 mAHD in the north of the site in the vicinity of Mandurah Road. An area of high elevation (approximately 10 mAHD) also exists in the south west of the site near Ennis Avenue. The existing topography of the site is shown in Figure 2.2.
Areas of shallow undulation, which form remnants of the irregular dune and swale system of the Becher Plain, are present within the IP14 Area. The dunes and swales were formed as the beach prograded seaward during the last major sea level rise which commenced approximately 10,000 years ago. The dune system has been heavily modified through the process of development of the area.
To gain a better understanding of the topographic relief across the IP14 area, landform units based on a 0.25 metre contour interval have been derived as shown on Figure 2.3. As shown on Figures 2.2 and 2.3, the majority of the remaining dune system within the IP14 area is located in the central portion of the area, between Patterson Road and Mandurah Avenue. The elevation of the dune system in this area generally ranges from 3 mAHD to 5 mAHD.
2.2 Stratigraphy and Geomorphology of Becher Plain
The Swan Coastal Plain is 'a narrow belt of Aeolian, alluvial and colluvial deposits generally of Holocene or Pleistocene age' (Gibson et al 1994 ). The plain extends from the Darling Scarp in the east, to the Indian Ocean in the west, maintaining a width of less than 30 kilometres along most of its length, and ranging in elevation from O to 75 metres above sea level (Wilde & Low, 1978).
The IP14 Area is located at the northern end of Becher Plain, within the Quindalup dune system (ATA Environmental Consultants, 2002). Becher Plain consists of calcareous sands of Holocene origin which have been deposited parallel to the beach to form a succession of irregular beach ridges, dunes and swales (ATA Environmental Consultants, 2002).
The coastal plain is comprised of calcareous sand deposits known as the Safety Bay Sand or Quindalup Dune System. Safety Bay Sand unconformably overlies the Pleistocene Tamala limestone, which is fully lithified and consists of calcareous eolianite containing solution channels and cavities (Davidson, 1995). The Safety Bay Sand and Tamala limestone together make up the superficial formations in the IP14 Area. The Safety Bay Sand also forms the surface of Garden Island, which partially encloses Cockburn Sound. The geological sequence of the IP14 Area is illustrated in Figure 2.4.
Safety Bay Sand has a maximum known thickness of approximately 24 metres (Davidson, 1995). In the IP14 Area, the Safety Bay Sand has a thickness of approximately 15 metres to 20 metres with typically 10 to 15 metres of this sand deposit being below sea level.
2310/R01/FINAL Umwelt (Australia) Pty Limited
June 2009 2.1
Umwe l t - - - - - - - - - - - - - - - - - - - - - - - - - - - - - - - - - - - - - - - - - - - - - -
Q_
._..
· '. '
l ,I
2.0 � 0 6km Approximate Seo le 1: 120 000
Source: Geologicol S.urvey of WA 1985
File Name IA3):R01_V1/.2.310_030.dgn
·1:-s
. ,, I • ., w'-l' (
l'p
. q ,
..
i '
..
GEOMORPHOLOGICAL CLASSIFICATION
ii I.th
j:- , . ! S u b - blllk
C1 Subnurine Sllllf
Submann, basin
.J '-. _ J Zona at submergod boath rock
r - - - - ; UffllSIORI bir
SLOPES
ri' - 30
-ia 3o - lo"
10• -w•
"P , □ 2 0 " - 30•
FEATURES
Stu,p conYU brat of slop•
Slw], COrw;rtl bruk of sloPt
illli< lorllCIUM """ ' ,, . . .
Cliff
EtOSIOIIII IU,P
l N Qf(,�1111\0ICCll:II 1111111,,;,1,on c:lrll)' .i u,..,, �•w �Utf �u:h cltnflttt m,
.ttii;, . ., ttt ,tit f'J111llri,i if'ol • ,Nftr U.11' ltJtf•i 1',fl11t�tJ:1lf'iltllt.\-,,,1 rYIClll0"411
DA!Gll, E. . ,1,1
,,,
1:iilal1trtr, fh.·,�1
uo1,.,. ffllltin,a
,IIORfllOLOOY c f n
rtV'!'II' '"' :�lwH1 ,, • lflll.Cf
n:..ltl" 0
•�t.io-n
FIGURE 2.1 Geomorphology of Becher Plain

� U m w e l t - - - - - - - - - - - - - - - - - - - - - - - - - - - - - - - -... "'""
SoufCl!!I!. /\a,Tol ?1,010 lot1clgolei, 2008. Codoslte l.. Coir,iour,• Depo,tmtSr,t or lond lnro,.m011on. 2006 O Noto: Contour lntn,Yal Im
Legend c::::::J IPI Boundury
Filo Namo (A4), ROI_Vl/2310_014 dgn
I 25km
FIGURE 2.2
IP14 Area Topography


U m w e l t - - - - - - - - - - - - - - - - - - - - - - - - - - - - - - -•"'"vn'-- ,.
CUCUEOUS SAND
!Sof11, eo, So•• I b11hor Soo4)
- 1 S m 1 - - - - - - - - - - - - - - - V '
- 3 0 m 1 - - - - - - - - - - - - - - - V 'M o j o r U n [ o n f o r m i t y --i---A_S(;.;..o_r_fo.:,_ _11•_1_10..:. _:l'_''.:.''_:_".::. '.:_:" l _ _ ! , ,
t S I O U H E FHIIATIGN
-SOm ' - -- - - - - - - - - - - .....v
File Namo (A4): R0I_Vl/2310_017.dgn
FIGURE 2.4 Geological Sequence

IP14 Area Geomorphology & Groundwater Environmental Characteristics
Whilst the Holocene Safety Bay Sands occur at several locations along the coastline, the deposit is discontinuous and its width is variable. For instance, north of Cockburn Sound, lithified Pleistocene dune forms (Tamala Limestone) are exposed at the shoreline. Similar sequences of Holocene beach ridges to those at Point Becher/Point Peron have been recorded at Jurien Bay (Lowry 1974 and Woods, 1983) and on the Leschenault Peninsula (Semeniuk and Searle, 1985). The discontinuous distribution and ongoing geomorphic modification of the coastal margin of the Safety Bay Sand influence the conservation value of morphological and ecological features on its surface.
The sediments of the Safety Bay Sand unit (shell fragments, quartz and feldspar sands), are generally unlithified, but weak lithification occurs in the older deposits. The Safety Bay Sands are generally described (CSIRO, 2003) as cream, unlithified, calcareous, fine grained to medium grained quartz sand and shell fragments with traces of black heavy mineral.
The Safety Bay Sands are marine (swash zone and back beach) and aeolian sand deposits which have accreted over the Holocene period. A well dated depositional sequence, extending from approximately 6400 years in the east (approximately four kilometres from the present coast), to less than 500 years close to the coast, provides evidence of Holocene sea level fluctuations. An early to mid Holocene high sea level of 1 to 1.5 metres higher than present, is now well established at several sites in south-eastern Australia and Western Australia, followed by a regression of approximately 1.2 metres between 3200 and 2500 years ago (Sloss et al, 2005).
2.2.1 Terminology for Beach Ridges
Thom et al (1992) present a discussion of the origins of 'beach ridges' based predominantly on morphological and stratigraphic studies from south-eastern Australia. The authors refer to the roles and relationships of beach berms, incipient foredunes, storm bites, foredunes and beach ridges, all of which occur in coastal plain landscapes. They also note considerable confusion in the Australian literature about the appropriate terminology for the low relief ridged coastal plains that occur around the entire coastline. Thom et al (1992) conclude that 'beach ridge' is synonymous with 'incipient foredune'. Each shore parallel ridge along an oceanic shoreline contains a combination of wave deposited and wind blown sand. As a general process, wind blown sand accumulates around pioneering plant communities that colonise the (wave deposited) backshore area. This raises the level of the surface and isolates the previous (landward) shore parallel dune from both marine and aeolian sand sources.
Ridge spacing, height and amplitude can vary significantly within a beach ridge plain, depending on location within an embayment, exposure to onshore winds, frequency and severity of storm events, subsequent effects of dune transgression and subaerial erosion.
2.2.2 A Cuspate Beach Ridge Plain
The principal morphology of the Safety Bay Sand unit that forms the Rockingham-Becher Plain derives from sequential shore parallel beach ridges (continuous or discontinuous sequences of varying relief). The surface is classified (Tingay 1991, Semeniuk et al 1989 and Bowman, Bishaw and Associates 1988) as a cuspate beach ridge plain. The beach ridges are cuspate at the coast, reflecting the presence of triangular shaped depositional headlands.
The most important of these cuspate coastal forms are Point Becher and Point Peron (see Figure 2.1 ). In general, the ridges forming the coastal plain have crest elevations of 3 metres to 5 metres. Whilst the minimum swale floor elevation is less than 0.5 mAHD, swale floors occur at up to 3.0 mAHD. Figure 2.3 shows the distribution of swale elevations for the IP14 area of the coastal plain.
231 O/R01/FINAL Umwelt (Australia) Pty Limited
June 2009 2.2

IP14 Area Geomorphology & Groundwater Environmental Characteristics
Small scale cuspate features also occur north of Point Peron along the shoreline of Cockburn Sound. The East Rockingham Industrial Park is located adjacent to one of these small cuspate forelands in Mangles Bay (see Figure 2.1). The small scale cuspate features on the modern shoreline appear to be recent features and are not linked to the alignment of the Holocene beach ridges.
2.2.3 Post-deposition Modification of Beach Ridge Morphology
Since the beach ridges were deposited, the basic ridge and linear swale morphology has been interrupted in some areas by a range of transgressive aeolian forms. Semeniuk et al (1989), Bowman et al (1988) and Tingay (1991) have identified four main dune forms superimposed on the beach ridges of the Rockingham-Becher Plain. These are described below and their distribution is show in Figure 2.1.
• Attenuated parabolic dunes - these dunes are U-shaped in plan and convex downwind.They are described as attenuated when they are markedly elongate (parallel arms only)(transgressive dune form).
• Fretted parabolic dunes - nested parabolics where subsidiary parabolic forms occurwithin the larger blowout (transgressive dune form).
• Chaots - conical sand hills of various sizes and relief (transgressive dune form).
• Modern foredunes - a low ridge immediately landward of the modern coastline.
Other forms that may occur within the coastal plain are broader sandy flats or undulating plains (without sufficient relief to be identified as beach ridges).
For the three transgressive forms, the depth of deflation is limited by the intersection of the water table with the ground surface. A range of small wetland types have developed in both the original swales between beach ridges and in localised deflation basins.
Whilst the superimposed forms are mostly described from locations relatively close to the present shoreline (i.e. from dunes that are less than about 2000 years old), Bowman et al (1988) also map parabolic disturbance and reshaping of the parallel beach ridges in the Becher Point area, dating to 4000-5000 years BP (see Figure 2.1). Similar levels of detailed morphological analysis have not been presented for the coastal plain north of Point Peron. However, the initiation of transgressive dune activity soon after the deposition of the Holocene beach ridge barrier is consistent with evidence from other parts of the Australian coast.
2.2.4 Details of Surface Morphology: IP14 Area
Figure 2.3 shows surface contours for the IP14 area, at 0.25 metre intervals. The contours are derived from recent orthorectified, low level aerial photography and show a comparatively low-lying area in the central southern section of IP14 that has reasonable correlation with known areas of TEC 19. In this area there are a series of ridges and swales where TEC 19 has been recorded. The landform in this area typically ranges in elevation from approximately 2.5 mAHD to approximately 3.25 mAHD in the swales with intervening ridges extending up to approximately 4.0 mAHD. The surrounding area ranges in elevation from approximately 3.5 mAHD to approximately 5 mAHD.
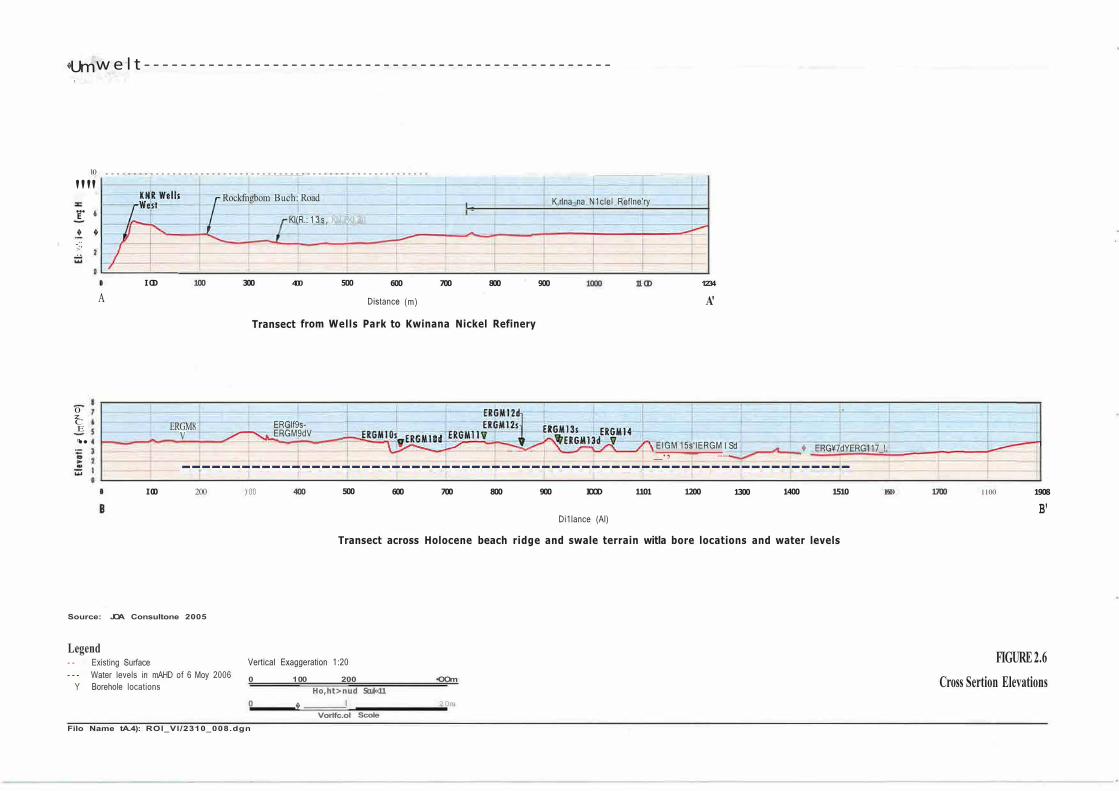
As shown on Figures 2.5 and 2.6, transects across two sections of IP14 have been compiled showing the distributions and elevations of ridges and swales across the site.
2310/R01/FINAL Umwelt (Australia) Pty Limited
June 2009 2.3

U m w e l t - - - - - - - - - - - - - - - - - - - - - - - - - - - - - - -, .,
2008, Codostre: Deportment Of land lnformotion, 2006, of Water, 2008 Groundwater Contours: Deportment
Legend c : J I Pl 4 Boundary
• Oepa1tment of Water Groundwater Bore locations• londcarp Groundwater Bore locations• Kwinono Nikel Refinery Groundwater Bore locations
Groundwater Contours
Filo Namo (A4): ROl_Vl/2310_015.dgn
1:25 000
FIGURE 2.5 Groundwater Bore Locations and
May 2003 Regional Groundwater Profile
� Um w e l t - - - - - - - - - - - - - - - - - - - - - - - - - - - - - - - - - - - - - - - - - - - - - - - - - - -,
10 - - - - - - - - - - - - - - - - - - - - - - - - - - - - - - - - - - - - - - - - - - - - - - - - - - - - - - - - - -
"'' ... E
� � -:; > . ,
0 :z: C E
I OD
A 100
ERGM8 V
Rockfngbom Buch: Road
Kl(R.: 1_3_s_, _KN_R•J_3)1
300 400 500 600
Distance (m)
700 800
Transect from Wells Park to Kwinana Nickel Refinery
ERGlf9s-ERGM9dV
K,rlna_na N1clel Reflne'ry
900 1000 11 OD 1234
A'
.. " EIGM 15s'IERGM l Sd _., ....... � ERG¥7dYERG117_!.
-------------------------------------------------------------------I 00 200 )00 400 500 600 700 800 900 IOOD 1101 1200 1300 1400 1510 1600
Di1lance (Al)
Transect across Holocene beach ridge and swale terrain witla bore locations and water levels
Source: JOA Consultone 2005
Legend - - Existing Surface Vertical Exaggeration 1 :20 - - - Water levels in mAHD of 6 Moy 2006
Y Borehole locations0 1 00 200 •OOm
Ho,ht>nud Scul«11 0 � l 20m
Vorlfc.ol Scole
Filo Name tA.4): ROl_Vl/2310_008.dgn
1700 1100 1908
B'
FIGURE 2.6 Cross Sertion Elevations

IP14 Area Geomorphology & Groundwater Environmental Characteristics
Several broad forms can be identified from these images:
• The eastern margin of the plain, where the Safety Bay Sands encroach on the Pleistocene Tamala Limestone includes low-lying (large areas of less than 2.5 mAHD elevation}, interbarrier lagoons/marshes.
• The eastern-most ridge of the Holocene sequence is a high relict 'foredune', whichencloses the interbarrier depression.
• The central part of IP14 is a broad north-south trending flat, generally at an elevation of2.75 mAHD to 3.25 mAHD. The flat form extends to the modern beach and separatesareas of undulating ridge and swale forms in the north and south of the IP14 area.
• The trend of the crests of the ridges is generally south-west to north-east, but the orientation varies with position in relation to the broad cuspate form. To the north of the central flat, the beach ridges are aligned broadly concave to the coastline, whilst south ofthe central flat, the ridges are generally aligned convex to the modern coastline.
• The distance from swale centre to adjoining swale centre varies from approximately60 metres to 120 metres. The width of the swale is also variable. Figure 2.3 shows thatthe width (within the swale) of the area that is less than 3 mAHD varies from less than 20 metres to more than 100 metres. Low-lying terrain is also discontinuous along the length of individual swales.
• Swale floor elevations of less than 2.75 mAHD occur in only isolated locations, largelyrestricted to the south-eastern corner of the Safety Bay Sand unit in IP14.
• Dune forms (ridges and swales) in the south-western portion of IP14, (e.g. in the rail loop area) have elevations of typically greater than 3.5 mAHD however there are small sections with elevations down to 2.75 mAHD.
• Throughout the Safety Bay Sand unit in IP14, vegetation has established in elongatedstrip patterns related to elevation and proximity to groundwater, even though the base levels of the swales are variable.
2.2.5 Soil Forming Processes in Beach Ridges
In addition to morphological changes which occur due to subsequent wind erosion of the beach ridge forms, the morphology of the beach ridge plain is also modified over time by slow sub-aerial denudation, linked to soil formation and ecological processes. These processes are important drivers of wetland formation and differentiation on the Rockingham-Becher Plain.
Unconsolidated coastal dune ridges formed of fine to medium sand are highly permeable and infiltration rates are high, reducing surface runoff. Notwithstanding this, investigations of dune form and soils have demonstrated that over time, surface processes tend to lower the crest elevation of dunes, widen the dune flanks and raise the floor of swales.
In Rockingham-Becher Plain, where dune geochemistry is carbonate based, calcrete or eolianite can form an indurated unit in barrier dune terrain. As noted, the Tamala Limestone is entirely cemented as eolianite, and Tingay (1991) observes that some parts of the eastern (older) portion of the Safety Bay Sands also show preliminary induration.
Semeniuk and Meagher (1981) describe the formation of thin sheets (10-50 cm thick) of non-pedogenic calcrete in response to the evapotranspiration regime of beach ridges in the Point Becher area. Various structural types of calcrete are recognised, depending on the
2310/R01/FINAL Umwelt (Australia) Pty Limited
June 2009 2.4
IP14 Area Geomorphology & Groundwater Environmental Characteristics
relationship to the water table. Semeniuk and Meagher (1981) argue that 'these occur in a definite stratigraphic sequence related to maturity of profile, vegetation cover, and thickness of the vadose zone.'
JOA Consultant Hydrologists (2005) report lithology from drill cores in the Rockingham-Becher Plain. Whilst the lithological detail is limited, they note particularly the presence of fine silt in the upper 1 metre of the profiles. This material was described as cemented in places, to varying extents. In general, the cemented layers were 'harder and thicker (0.5 to 1.0 metres)' in wetlands. JOA interpret this as an indication that the water table may perch in the wetlands during the wetter winter period. However, at the time the drill logs were recorded (May), the water table was approximately 1 metre below the hard pan layer with water levels recorded across the site indicating that localised perched water tables in the immediate vicinity of the wetlands either don't exist or aren't influencing groundwater levels at these locations. In reality, the increased levels of silt and organic matter in the upper layers would enhance the moisture holding capacity of these areas without the water table being perched.
2.3 Age Structure and Morphology of Wetlands of the Rockingham-Becher Plain
Semeniuk (2006) presents a summary of the development of wetland basins in the Holocene beach ridge plain, due to the interaction of geomorphic, pedogenic and hydrological processes. Semeniuk (2006 p2) argues:
The wetlands were shown to have come into existence as the coast prograded and the regional water table sympathetically rose to intersect the basins in the landscape. As inter ridge basins became damplands, then sumplands, they filled with carbonate mud. The evolution of the wetlands was traced from incipient soil-floored stages, to carbonate mud infiltrated basins, to mud filled basins, to peat capped basins.'
Damplands are systems that are rainfall controlled and have periodically waterlogged soil, but experience only short (seasonal) periods of inundation, with shallow water levels (less than 20 cm water depth). In these systems, fluctuating water levels can cause summer water stress for wetland species. Rates of change of groundwater levels are important to the ongoing survival of wetland species.
Semeniuk (2006) considers that in the latter stages of the dampland to peat capped basin sequence, the wetland basins intercept the groundwater flow, reducing flow through and creating semi-closed systems. Wetlands evolve from rain dominated to sediment dominated and vegetation dominated chemistry.
Semeniuk (1988) (in Tingay 1991) distinguishes three suites of wetlands on the Rockingham-Becher Plain, based on their geomorphic and soil character. The classification system appears only to have been applied to the southern part of the plain (i.e. around Point Becher), although it is apparent that similar forms occur north of Point Peron. The three groups recognised by Semeniuk (1988) are:
• Cooloongup Suite - medium to large lakes (Cooloongup, Walyungup and Richmond).
• Becher Suite - small to very small sumplands and damplands in linear depressions,close to or at the maximum elevation of the water table in the wettest months of the year. The age of the ridge and swale topography in which these wetlands are located variesfrom approximately 5000 BP to 1000 BP.
2310/R01/FINAL Umwelt (Australia) Pty Limited
June 2009 2.5

IP14 Area Geomorphology & Groundwater Environmental Characteristics
• Peelhurst Suite - very small to small sumplands (roughly circular or slightly linear) withinblowouts and parabolic dunes. This group comprises only a small number of wetlands in transgressive dunes that are less than 2000 years old. Tingay (1991) suggests thatthese wetlands are likely to be subject to ongoing sand inundation by mobile dunes and are therefore transitory features, some of which may be only decades old. These smalltransitory features do not occur on the coastal plain north of Point Peron.
The wetlands in the IP14 area appear to be similar in plan form and morphology to the Becher Suite of Semeniuk's (1988) threefold classification. They are shallow linear depressions. If this surficial similarity derives from similar geomorphic and ecological processes operating in the wetlands, the following characteristics and processes would be expected:
• small and discontinuous wetlands in dune swales, with varying complexity depending on age and whether the low-lying area is a remnant of a beach ridge swale or is part of adeflation basin within a transgressive dune sequence;
• 'Wetland' used in the sense of ephemerally wet or damp areas, which can be distinguished by vegetation communities, even when surface sediments are dry;
• surface water is most likely to be present during the winter months, corresponding to higher seasonal rainfall and lower evapotranspiration. During the winter, the water tablemay be higher than the surface elevation of the swale floor, but is not necessarilyperched;
• gradual accretion of swale floor sediments by the addition of both lithic material from surface processes and organic matter from plants within the swale; i.e. detailed cores ofthe materials in the swale floor should reveal an accreting mixture of lithic and organicmaterial, although proportions would vary. This suggests a trend over time for the swalefloor to be accreted above the general water table;
• Semeniuk (1988) proposes that over time, calcification and increased organic depositionin the swale floor tend to create a partially independent groundwater system, based on alocally perched water table that functions out of synchronisation with the seasonalpatterns of water table elevation in the broader area. Semeniuk (1988 and 2006) arguesthat wetlands become more diverse and complex as this process proceeds. In thiscontext, the swale wetlands of the eastern part of IP14 should be associated with calcification at the water table, perched water tables, the presence of peat and betterdeveloped and more diverse vegetation assemblages than those closer to the coast. As discussed in Section 2.5, available groundwater level information does not indicate thepresence of perched water tables in the IP14 area; and
• English et al (2002) have mapped vegetation communities in Holocene dune swales in the Swan Coastal Plain and linked community assemblages to groundwater regimes.Sedgelands in this area typically occur in damplands and sumplands that arewaterlogged in winter and retain significant moisture close to the surface even in summer(water table 0.4 to 1.9 metres below the soil surface, varying by less than 0.5 metreseasonally).
2310/R01/FINAL Umwelt (Australia) Pty Limited
June 2009 2.6

IP14 Area Geomorphology & Groundwater Environmental Characteristics
Detailed mapping and analysis of soil, stratigraphy and wetland vegetation relationships is not currently available to test these predictions of wetland character and function in IP14. However, the results of preliminary mapping (e.g. elevation data) and groundwater modelling indicate the following:
• Because of the elevation of much of the IP14 area, maintenance of seasonal surfacewater in the swales of IP14 would require a general water table level or locally perched water table levels of greater than 3 metres during winter.
• If the water table does not intersect the surface, wetland plants could still be maintained ifthe broad water table was less than 1 metre below the swale floor for most of the year, so that it could be reached by plant roots (Froend and McComb 1993). The water table may periodically be as low as 1.9 metres below the soil surface. This is the 'dampland' type ofwetland habitat.
• If the general water table does not rise to less than 1.0 - 1.9 metres below the surface at any time, wetland vegetation could still be maintained if the swale floor is relatively largeand soil forming processes (indurated soil units) supported a locally perched water tablefor part of the year.
2.4 IP14 Wetlands/Damplands
The central southern areas of the IP14 area have been identified as potentially significant habitat areas due to the presence of a threatened ecological community (TEC) within the area. The TEC, Sedge/ands in Holocene dune swales of the Southern Swan Coastal Plain, occurs between Patterson Road and Mandurah Road (refer to Figure 1.2). This community is declared as a TEC (TEC 19) by CALM, and is also listed under the Commonwealth Environmental Protection and Biodiversity Conservation Act 1999 as an Endangered Ecological Community (EEC). Under the CALM (WA) criteria, this community is classified as critically endangered CR B) ii).
The Sedge/ands in Holocene dune swales of the Southern Swan Coastal Plain is a remnant wetland plant community. This community occurs in the swales that exist between the crests of the Holocene dunes on the Becher Plain. The dunes were formed as the beach prograded seaward during the last major sea level rise which commenced approximately 10,000 years ago. TEC 19 occurs in swales where the groundwater table is close to or at the ground surface. The water regime in which the vegetation community occurs has been described by English et al (2002).
According to English (2002), the community typically occurred in a damptand that became waterlogged in winter and retained relatively high moisture near the surface of the soil profile in summer. The water table was typically 0.4 metres - 1.9 metres below the soil surface. Small areas within the community were in sumplands, with shallow (< 20 cm) surface water for up to two months per year. The water table had relatively small seasonal fluctuations (< 0.5 metre). The vegetation composition of the wetlands was thought to be related to the age of the wetland and the proximity of the water table to the soil surface (English et al 2002).
The root depth of the of sedge species of the TEC 19 wetland assemblages is typically up to one metre. Based on the description of the wetland plants provided above, it appears that TEC 19 is most likely to survive in areas where the water table is within 1. 9 metres of the ground surface for most of the year. This is consistent with a root depth of one metre and 0.8 metres to 0.9 metres of capillary rise above ground level.
2310/R01/FINAL Umwelt (Australia) Pty Limited
June 2009 2.7
IP14 Area Geomorphology & Groundwater Environmental Characteristics
Semeniuk et al have argued that the Port Kennedy area, which has both Becher Suite and Peelhurst Suite wetlands is significant, for ecological, scientific (geomorphology) teaching and research reasons. This area is listed in the Register of the National Estate. Semeniuk states in the Register listing that Becher Suite wetlands are found nowhere else on the Swan Coastal Plain. English et al (2002) argue that the sedgeland communities in the Holocene swales of the Swan Coastal Plain have geomorphic significance because of the relatively young age of the wetlands (i.e. associated with landforms dating to only the last 1000 years maximum).
Tingay (1991) argues that the value of the Becher Suite wetlands is not attributed to each individual wetland (which when considered in isolation mostly have quite low ecological values) but to the integrity of the west to east sequence.
Tingay (1991) and Semeniuk (1988) have quite different perspectives on the value of the Peelhurst Suite of wetlands (with an ongoing debate in their publications over nearly 20 years). Semeniuk argues that the small wetlands are scientifically important because of their rarity and research potential .as an example of a dynamic wetland system. Tingay considers that these ephemeral wetlands have a lower value because they are transitory features, liable to sand inundation. Tingay attributes a higher significance to the Cooloongup Suite of wetlands, which are larger and more permanent features, providing more diverse habitat.
Morphologically the wetlands in IP14 appear to be similar to Becher Suite of wetlands (as described by Semeniuk 1988). In addition, some wetland vegetation species have been maintained in the damp swales of the IP14 area, although there is no evidence of a seasonal water table above the surface of the swale floors over the last decade. Consistent with the low water table levels relative to the soil surface in the East Rockingham IP14 area, the vegetation is dominated by shrubland, rather than sedgeland. Froend and McComb (1993) suggest that where groundwater is more than 1.0 metre below the soil surface for more than three or four months each year, most species of emergent macrophytes will not survive.
The Becher Suite wetlands display a complex mosaic of vegetation, apparently related to minor changes in water availability, although soil factors may also play a part. The change from dune vegetation to wetland vegetation is almost always abrupt, creating micro mosaics with pure stands and mixtures of wetland species, including:
• lsolepsis nodosa;
• Cyperus tenuiflorus;
• Juncus pallidus, also Juncus kraussii;
• Baumea articulata; and
• Melaleuca rhaphiophylla.
Where swales are only damp, the vegetation assemblage includes Xanthorroea brunonsis and Lagana vagina/is.
The Becher Suite vegetation assemblage has multiple species in common with the SCP19 community, Sedgelands in Holocene Dune Swales of the Southern Swan Coastal Plain (Gibson et al 1994 ). This community is considered to occur in small or isolated patches and is extremely vulnerable to threatening processes. It is listed as a Threatened Ecological Community (TEC) endorsed by the Minister for the Environment. The recovery plan for these threatened wetlands focuses on protection of the 'older stages' of the wetland sequence from clearing.
2310/R01/FINAL Umwelt (Australial Pty Limited
June 2009 2.8
IP14 Area Geomorphology & Groundwater Environmental Characteristics
Although it is primarily shrubland, the vegetation assemblage of the IP14 area has some species in common with both the Becher Suite wetlands and the TEC community, including Melaleuca rhaphiophyl/a. Xanthorrhoea preissii is present, rather than Xanthorrhoea brunosis.
Analysis of trends in groundwater level in the IP14 area suggests that the water table has been persistently low since approximately 1990. Climate change predictions for south-west Western Australia suggest that this drying trend will intensify. In this case, the vegetation assemblage of the IP14 area is anticipated to move further away from the previously described species mix of the Becher Suite wetlands, with fewer wetland species surviving in the low swale areas. This indicates that the TEC 19 groundwater dependent vegetation assemblage is already limited in extent, is likely to be further threatened by ongoing drying and consequent lowering of the water table.
2.5 Climate
Generally, the Kwinana and Rockingham region is subtropical to temperate, with seasonal climatic variation ranging from hot summers to mild winters. Rainfall is heavily winter dominant, with almost no rainfall in the summer months. As a result groundwater levels rise during winter when rainfall is highest and evapotranspiration rates are lowest and fall during summer months when rainfall is lowest and evapotranspiration is highest.
Rainfall
The nearest meteorological station to the proposed Bio-Refinery site with rainfall data is located at the Kwinana BP Refinery (Station 009064), approximately 3 kilometres north of the IP14 area. The station recorded rainfall data for the period 1955 to 2008.
Based on the rainfall records available for the Kwinana BP Refinery station, the average annual rainfall for the site is 753 mm, and is heavily winter dominant. Average monthly rainfall for the site is shown in Figure 2.7, with June having the highest average monthly rainfall of 159 mm.
Evaporation
The nearest meteorological station to the proposed Bio-Refinery site measuring evaporation is located at Medina Research Centre (Station 009194), approximately 5 kilometres north-west of the IP14 Area. Mean monthly evaporation measured at this location ranges from 54 mm in June, to 259 mm in January for the period of record (1983 to 2008). Mean annual evaporation over the 25 year period of record is approximately 1716 mm. Analysis of evaporation records for the Medina Research Centre indicate a trend of increasing evaporation during the summer months, and decreasing evaporation during the winter months. Mean monthly evaporation data for the Medina Research Centre is presented in Figure 2.7.
As can be seen from Figure 2. 7, average rainfall typically exceeds average evaporation for the period May to August inclusive.
2310/R01/FINAL Umwelt (Australia) Pty Limited
June 2009 2.9

Umwelt ,,,.,,.,.,..,.,,0111"....W.
300.0 - - - - - - - - - - - - - - - - - - - - - - - - - - - - - - - - - - - - - - - - - -
250.0
f 200.0 0E e.s g' 150.0
:c c 100.0
50.0
0.0
f;lo Nome (A,), R0I_Vl/2310_011.dgn
January February March April May June July August September October November December
Month
jcAverage Rainfall (BoM Station 8064) ■Average Evaporation (BoM Station 9194) I
FIGURE 2.7
IP14 Area MonthJy Rainfall and Evaporation
IP14 Area Geomorphology & Groundwater Environmental Characteristics
2.6 Hydrogeology
Groundwater in the superficial formations of the Swan Coastal Plain is contained in a regional unconfined aquifer system known as the superficial aquifer (Davidson, 1995). The superficial aquifer overlies sedimentary rocks of Cretaceous age and in the vicinity of the IP14 area has an average saturated thickness of approximately 20 metres and an average aquifer transmissivity of approximately 600 m2/day (Davidson, 1995). Therefore, according to Davidson (1995) the hydraulic conductivity of the aquifer is approximately 30 m/day. A range of other hydraulic conductivities have been quoted for the aquifer. For example, Nield (1999) reports that the hydraulic conductivity of the superficial aquifer in the Cockburn Sound area ranges from 6 to 3000 m/d.
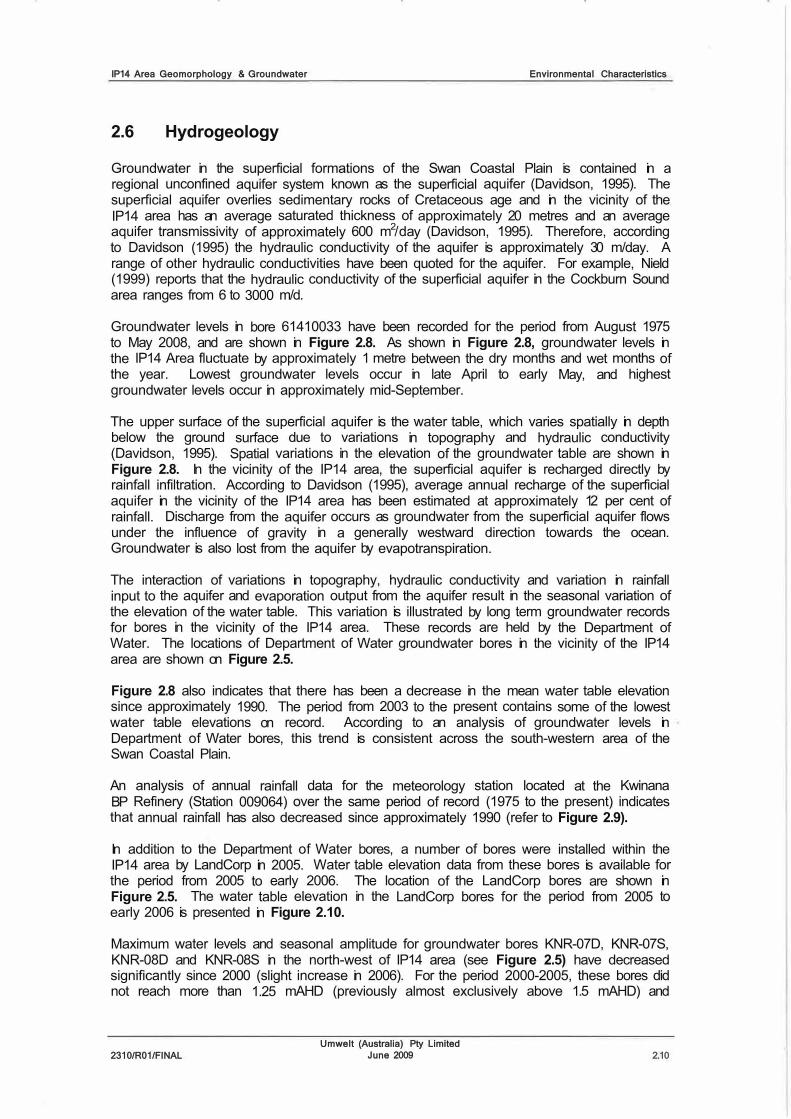
Groundwater levels in bore 61410033 have been recorded for the period from August 1975 to May 2008, and are shown in Figure 2.8. As shown in Figure 2.8, groundwater levels in the IP14 Area fluctuate by approximately 1 metre between the dry months and wet months of the year. Lowest groundwater levels occur in late April to early May, and highest groundwater levels occur in approximately mid-September.
The upper surface of the superficial aquifer is the water table, which varies spatially in depth below the ground surface due to variations in topography and hydraulic conductivity (Davidson, 1995). Spatial variations in the elevation of the groundwater table are shown in Figure 2.8. In the vicinity of the IP14 area, the superficial aquifer is recharged directly by rainfall infiltration. According to Davidson (1995), average annual recharge of the superficial aquifer in the vicinity of the IP14 area has been estimated at approximately 12 per cent of rainfall. Discharge from the aquifer occurs as groundwater from the superficial aquifer flows under the influence of gravity in a generally westward direction towards the ocean. Groundwater is also lost from the aquifer by evapotranspiration.
The interaction of variations in topography, hydraulic conductivity and variation in rainfall input to the aquifer and evaporation output from the aquifer result in the seasonal variation of the elevation of the water table. This variation is illustrated by long term groundwater records for bores in the vicinity of the IP14 area. These records are held by the Department of Water. The locations of Department of Water groundwater bores in the vicinity of the IP14 area are shown on Figure 2.5.
Figure 2.8 also indicates that there has been a decrease in the mean water table elevation since approximately 1990. The period from 2003 to the present contains some of the lowest water table elevations on record. According to an analysis of groundwater levels in Department of Water bores, this trend is consistent across the south-western area of the Swan Coastal Plain.
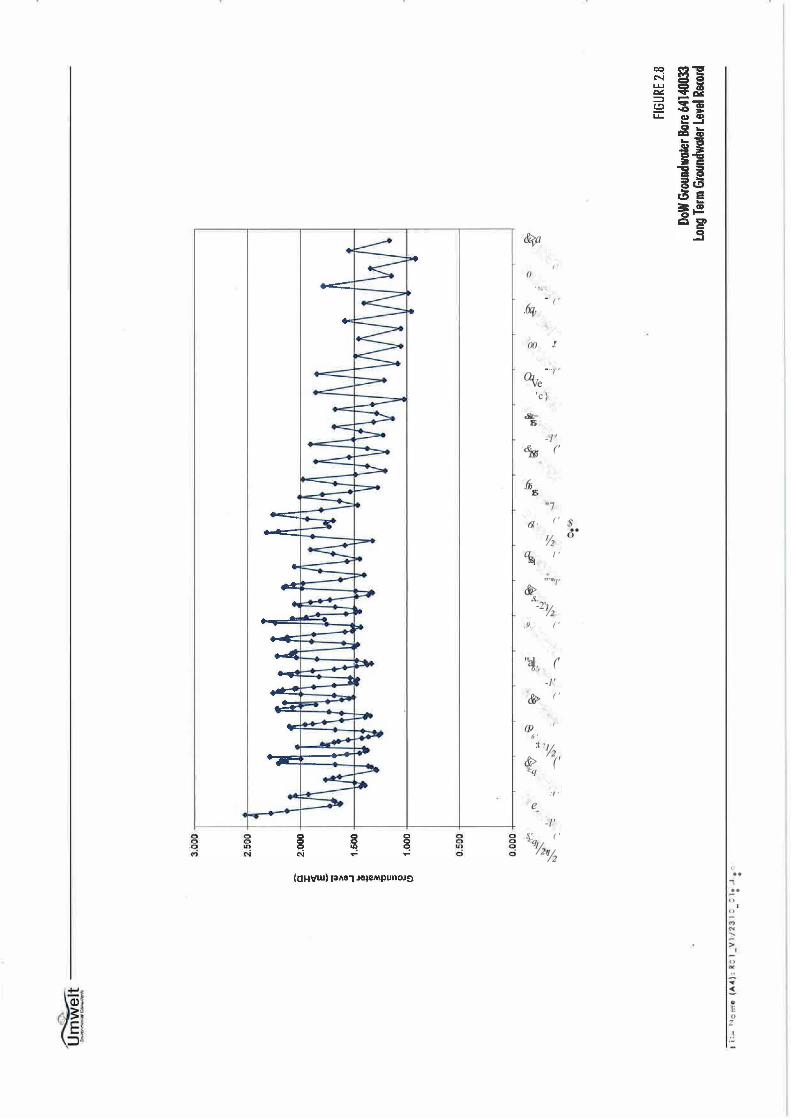
An analysis of annual rainfall data for the meteorology station located at the Kwinana BP Refinery (Station 009064) over the same period of record (1975 to the present) indicates that annual rainfall has also decreased since approximately 1990 (refer to Figure 2.9).
In addition to the Department of Water bores, a number of bores were installed within the IP14 area by LandCorp in 2005. Water table elevation data from these bores is available for the period from 2005 to early 2006. The location of the LandCorp bores are shown in Figure 2.5. The water table elevation in the LandCorp bores for the period from 2005 to early 2006 is presented in Figure 2.10.
Maximum water levels and seasonal amplitude for groundwater bores KNR-07D, KNR-07S, KNR-08D and KNR-08S in the north-west of IP14 area (see Figure 2.5) have decreased significantly since 2000 (slight increase in 2006). For the period 2000-2005, these bores did not reach more than 1.25 mAHD (previously almost exclusively above 1.5 mAHD) and
2310/R01/FINAL Umwelt (Australia) Pty Limited
June 2009 2.10
&>a v ( '
0' % -...
.6a ( '
v
,!' 00
....... Oa ( '
Ve 'c}
&>c5.: IS' ...
-1'& (' 1S'6'
.66.: IS'.,.
"7 ( ' 6'6 '
½ a l '!S'q
,;.., &>,9.
"'l'
,s,.,. -2': ½
,9. ( '
"al (' 6'. r
-1' ( ' &>6'
; (( '0,96 ' :t- ? ½
&> (' '<q
:t( '
e.,. -1'
.$' ( ''<q ½ '½
$ .. 0
C .. ..., .. 0
I 0
0
E 0 z .! ...
� Umwelt--
:e
1200 , - - - - - - - - - - - - - - - - - - - - - - - - - - - - - - - - - - - - - - - - - - - - -
1000 + - - - - - - - - - - - - - - - - - - - - - - - - - - - - - - - - - - - - - - - - - - - - - - - - - - - 1
800
600
400
2 0 0 - - - - - - - - - - - - - - - - - - - - - - - - - - - - - - - - - - - - - - - - - - - - - - - <
0 - - - - - - - - - - - - - - - - - - - - - - - - - - - - - - - - - - - - - - - - - - - - - - - - - < 1950 1960 1970 1980
Year 1990
-+-Annua.l Total (mm) - - 4 • per. Mov. A..g. (Annual Total {mm))
2000 2010
Filo Nomo (A4): 0I_Vl/i310_0l3,dgn
FIGURE 2.9 Annual Rainfall at Kwinana BP Refinery (BoM Station 009064)

Umwelt CAI"-. . .
2.50 . . - - - - - - - - - - - - - - - - - - - - - - - - - - - - - - - - - - - - -
2.00 I ----
Q
.§. 1.50
• { ! 1.00 -,-.. :ii:
0.50
I I0.00 08/04/05 28/05105 17/07/05 05109/05 25110/05 14/12/05 02/02/06
Date
f;1. NQn,c , .... ,, R0l_Vl/2310_02•.don
- - - E R G M 1- - E R G M 2
ERGM3- - E R G M 4- - E R G M 5- - E R G M 6- + - E R G M 7- E R G M B- E R G M 9
EGRM10 EGRM11 EGRM12
I EGRM13 EGRM14
- - E G R M 1 5
FIGURE 2.10 Water Tobie Elevation in
Londcorp Groundwater Bores

IP14 Area Geomorphology & Groundwater Environmental Characteristics
seasonal amplitude dropped to approximately 0.25 metres, rather than the 0.5 metre that had previously been experienced. Low water table levels were recorded briefly in 1996-1998.
KNR-13D shows a similar inflexion point at 2000/2001 and also a low water table level for the period 1996-1999. In the wetter periods, maximum elevation is 1.8 mAHD, with a seasonal amplitude of up to 0.8 metre. Since 2000, the maximum water table elevation has been only 1.2 mAHD, with a seasonal amplitude of 0.2 metre. For this bore, the minimum water table elevation over the last five years has been approximately 0.1 metre lower than the records from 1991 to 1996, but similar to the dry period in the mid 1990s.
KNR-14D, KNR-13S and KNR-14S have persistent minimum water table levels of 0.8 metre, with maximum levels below 1.6 mAHD (below 1.4 mAHD for 13S and 14S). As for the other bores, these show a significant decline in maximum water level and seasonal amplitude since 2000 (but limited records).
When these broad water table levels are compared with the swale elevation information in Figures 2.3 and 2.4, it is apparent that for water to be present above the surface of any of the swales in IP14, the water table elevation would need to be greater than 2.5 mAHD. For most swale floors, the water table level would need to be greater than 2. 75 mAHD. For the western parts of IP14, closer to the modern coastline, minimum groundwater levels for water to be maintained above the surface of the swale are at least 3.25 mAHD.
The bore data on water table levels show that at no time since 1991 has the general water table level in IP14 exceeded 2.0 mAHD, and in general, the maximum groundwater level is 1.6 mAHD. This is more than 1 metre below the prevailing swale level.
Analysis of available groundwater information indicates that the groundwater level at western boundary of IP 14 doesn't drop below approximately 0.7 to 0.8 mAHD even during dry conditions.
2. 7 Surface Water Features
Two major surface water features exist in the vicinity of the IP14 area, being Lake Coolongup, to the south-east of the IP14 area and the intermittent wetlands within the IP14 area itself and within Leda Reserve directly to the east of the IP14 area (refer to Figure 1.2).
2.7.1 Lake Coolongup
Lake Coolongup is located approximately 1 kilometre to the south-east of the IP14 area. It is fed by groundwater due to its low elevation in the landscape (Davidson, 1995). As Lake Coolongup is not seasonally flushed by rainfall, evaporative concentration of dissolved salts has caused the lake water to become highly saline.
2. 7 .2 Wetlands
As discussed, within the IP14 area, a number of swales exist between the dune crests within the remnant Holocene dune system. Many of these swales become waterlogged in the wet months of the year as the water table approaches the ground surface, and dry out in the dry months of the year. According to the classification of wetlands in the Perth Region provided by LeProvost et al (1987) the swales in the IP14 area are 'damplands'.
Wetlands also exist to the east of the IP14 area within Leda Reserve (refer to Figure 1.2). These wetlands are seasonally inundated, most likely as a result of the rising water table in
2310/R01/FINAL Umwelt (Australial Pty Limited
June 2009 2.11

IP14 Area Geomorphology & Groundwater Environmental Characteristics
the wet months, and are classified as 'sumplands'. The water table within these sumplands is governed by groundwater levels.
2310/R01/FINAL Umwelt (Australia) Pty Limited
June 2009 2.12

IP14 Area Geomorphology & Groundwater Groundwater Modelling Methodology
3.0 Groundwater Modelling Methodology A groundwater model of the IP14 area (Figure 1.2) was developed using Visual MODFLOW Pro Version 4.2. Visual MODFLOW is a computer program that simulates three dimensional groundwater flow through a porous medium. The model is capable of simulating groundwater flow under the influence of recharge, evapotranspiration, flow to wells, flow to drains and flow through riverbeds. Visual MODFLOW is a widely used groundwater flow model used for the assessment of the impacts of development on unconfined groundwater systems. In Visual MODFLOW, catchments are broken up into a grid of blocks known as 'cells', the locations of which are described in terms of rows, columns and layers. A number of layers can be defined in Visual MOD FLOW to reflect vertical changes in aquifer properties.
The major aquifer properties required by Visual MODFLOW include:
• surface topography and layer thickness;
• hydraulic conductivity;
• aquifer storage parameters;
• recharge;
• evapotranspiration; and
• flow boundary conditions including no flow boundaries, rivers and areas of constant head.
Two development scenarios were modelled for the IP14 area, being a pre-development scenario characterising the site as it exists at present, and a conceptual post-development scenario characterising the site following development based on a structure plan for the site. The properties of the IP14 area pre-development scenario groundwater model are discussed in Section 3.1. Section 3.2 provides an outline of the methodology used to calibrate the pre-development scenario model to measured groundwater levels in the area. The use of the calibrated pre-development scenario model as a predictive tool for the areas in which TEC 19 species are most likely to survive is discussed in Section 3.3. The properties of the conceptual post-development scenario model are set out in Section 3.4.
3.1 Pre-development Scenario Model Properties
The IP14 area groundwater model developed for this project covered an area of 64.6 km2
extending from Lake Coolongup in the south east, to the BP Oil Refinery in the north (refer to Figure 3.1). The grid size of the model was 100 metres by 100 metres, reducing to a 10 metre by 10 metre grid over the undeveloped area in the east of the IP14 area. The superficial aquifer was modelled as a one layer system with an average thickness of 30 metres. Ground surface elevation in the model was entered using a digital terrain model of the area developed using topographic data supplied by the Department of Land Information. The model used three constant head boundaries to simulate the influence of Cockburn Sound, Lake Coolongup and the Leda reserve wetlands on groundwater levels. The location of the constant head boundaries is shown in Figure 3.1.
The IP14 area groundwater model was run as a transient model over the period from January 2003 to December 2007. This time period was chosen as data is available for groundwater bores within the IP14 area during this time, and this period also contains some of the lowest water table elevations on record. Predictions from this dry period will therefore be useful in determining the area which is likely to sustain TEC 19 during dry periods.
2310/R01/FINAL Umwelt (Australia) Pty Limited
June 2009 3.1

Umwelt----
Source: Aerial Photo: Landga1e, 2008, Cadaslre; Department of land Information, 2006 Groundwaler Bores: Jim Davis & Associales Pty Ltd, 2006
Legend r : : : J I Pl 4 Boundory
• londcorp Groundwoter Bore locationsll i l l i l i Constant Head Boundary - Inactive Flow Area
f i l e Nome (A4), R0l_Vl/2310_018.dgn
Q_ l ,50 000
-$-
2 2.5km -FIGURE 3.1
I P l 4 Area Groundwater Model Domain and Boundaries

IP14 Area Geomorphology & Groundwater Groundwater Modelling Methodology
The major properties of the model are summarised in Table 3.1.
Table 3.1 - IP14 Area Groundwater Model Properties
Property Value Model area 64.6 km2
Grid size 100 m x 100 m Averaqe layer thickness 30 m Topography Adapted from topographic data supplied by the
Department of Land Information Constant Head boundaries:
Sea level 0.8 mAHD Lake Coolonqup Water elevation from bore 61410051 Leda Reserve Wetland area Water elevation from bore 61410051
Model period 01/01/2003 to 31/12/2007 Hvdraulic conductivity (K)* 30 m/dav to 75 m/dav Specific Yield (Sy)* 5% to 20% Effective Porosity 15% Total Porositv 30% Recharne* 10% to 25% of rainfall ( data from Station 009064) Evapotranspiration 85% of pan evaporation (data from Station 009194) Extinction Depth* 1.0 m to 2.5 m • Note: table provides the range of values explored in calibration of the model
Recharge, evapotranspiration and constant head input data used in the pre-development scenario model is provided in Appendix 1.
3.2 Pre-development Scenario Model Calibration
The pre-development scenario groundwater model was calibrated for the period from January 2003 to December 2007 using water table elevation measurements from groundwater bores within the IP14 area. The location of the groundwater monitoring bores is shown in Figure 2.4. The calibration involved changing the following four parameters to provide calculated groundwater levels which approached the observed water table elevations over the same time period:
• hydraulic conductivity;
• specific yield;
• recharge as a percentage of rainfall; and
• extinction depth (i.e. the depth below the ground surface at which evaporation ceases to have an effect).
The range over which these parameters were investigated is shown in Table 3.1. A summary of the results of the calibration is provided in Section 4.1.
2310/R01/FINAL Umwelt (Australia) Pty Limited
June 2009 3.2

IP14 Area Geomorphology & Groundwater Groundwater Modelling Methodology
3.3 Groundwater Influence on Damplands within the IP14 Area
Taking into account groundwater observations, root depth and capillary rise characteristics it appears that TEC 19 is most likely to survive in areas where the water table is within at least 1.8 to 1.9 metres of the ground surface for most of the year. In order to determine areas where TEC 19 is most likely to survive, the calibrated model was used to determine the zones within the IP14 area in which the water table is predicted to be within 1.8 metres of the ground surface during the dry months of the year.
Based on the groundwater elevation data for Department of Water Bore 61410033 (Figure 2.5), the lowest groundwater elevation on record occurred in May 2004. Consequently, depth to groundwater at this time was investigated to provide a prediction of the area that is likely to continue to sustain TEC 19 in dry years.
In addition, the zone within the IP14 area in which the water table is predicted to be within 1.8 metres of the ground surface for six months of 2004 was also determined. This extent is considered to be a conservative upper bound estimate of the area of land that is likely to continue to sustain TEC 19 in dry years.
The results of the analysis are provided in Section 4.2.
3.4 Conceptual Post-development Scenario Modelling Methodology
The conceptual post-development model was prepared using the calibrated pre-development model. The model was prepared assuming:
• the IP14 area will be developed generally as set out in the East Rockingham IndustrialPark IP-14 (1998) Structure Plan (Allerding & Associates, November 2008), reproducedin Appendix 2 of this report;
• development precincts will be made up of 90 per cent impervious areas;
• impervious areas will have no recharge to and evapotranspiration from the groundwatertable;
• pervious areas within the development precincts will maintain pre-development infiltrationand evapotranspiration rates;
• runoff from the impervious areas will be captured and made available for groundwaterrecharge via a number of infiltration trenches/swales to maintain groundwater levels in the IP14 area; and
• parkland buffers, including the proposed TEC19 conservation area will maintain pre-development infiltration and evapotranspiration rates.
It was assumed that approximately 22 per cent of runoff from the impervious areas of the development precincts would be utilised for groundwater recharge. On average this equates to a recharge rate of approximately 950 ML/year across the IP14 area. It is noted that this figure does not include transmission losses due to evaporation at the surface or from the unsaturated zone above the groundwater table. Further investigation is required to determine the magnitude of likely transmission losses to determine the amount of water which should be allocated for groundwater recharge.
2310/R01/FINAL Umwelt (Australia) Pty limited
June 2009 3.3
IP14 Area Geomorphology & Groundwater Groundwater Modelling Methodology
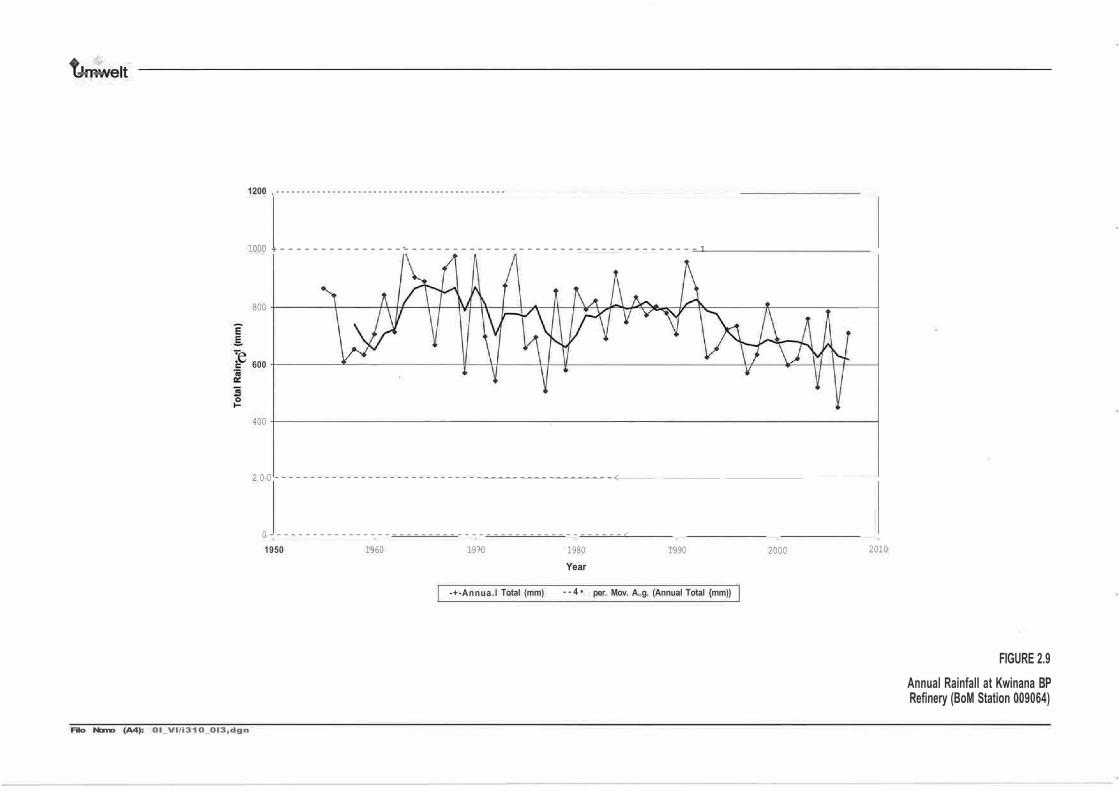
The conceptual post-development model was run using monthly rainfall and evaporation data from Bureau of Meteorology Stations 9064 (Kwinana BP Refinery) and 9194 (Medina Research Centre) for the period from 01/01/2003 to 31/12/2007. Full details of the conceptual post-development model properties are provided in Table 3.2.
Table 3.2 - IP14 Area Conceptual Post-development Groundwater Model Properties
Property Value Model area 64.6 km2
Grid size 100 m x 100 m Averaae layer thickness 30 m Topography Adapted from topographic data supplied by the
Department of Land Information Constant Head boundaries:
Sea level 0.8 mAHD Lake Coolonaup Water elevation from bore 61410051 Leda Reserve Wetland area Water elevation from bore 61410051
Model period 01/01/2003 to 31/12/2007 Hydraulic conductivity (K) 50 m/day Specific Yield (Sy) 10% Effective Porosity 15% Total Porosity 30% Recharge (undeveloped areas) 22% of rainfall (data from Station 009064) Recharae (developed areas - 90% impervious) 2.2% of rainfall (data from Station 009064) Recharae (infiltration trenches) 950 ML/year on average Evapotranspiration (undeveloped areas) 85% of pan evaporation (data from Station
009194) Evapotranspiration (developed areas - 90% 8.5% of pan evaporation (data from Station impervious) 009194) Extinction Depth 1.8 m
As discussed in Section 3.3, the lowest groundwater elevation on record in the IP14 Area occurred in May 2004. This has been identified as representative of the critical period for TEC19 species in terms of water availability. Consequently, groundwater elevation at this time was investigated to provide a prediction of the performance of the conceptual post-development water management controls in dry years. The results of the conceptual post-development scenario groundwater modelling are provided in Section 4.3.
3.5 Comments on Assumptions in Modelling
The following assumptions were made in the groundwater modelling described in this report:
• Average infiltration and evapotranspiration conditions were assumed over the entiremodel domain for the pre-development scenario. In reality recharge and evapotranspiration rates are likely to be higher locally in the undeveloped IP14 area than the surrounding existing developed areas. Further investigation of the significance ofvarying recharge rates throughout the model domain should be undertaken if the groundwater modelling is to be used as a tool in managing groundwater levels in the IP14 area.
2310/R01/FINAL Umwelt (Australia) Pty Limited
June 2009 3.4

IP14 Area Geomorphology & Groundwater Groundwater Modelling Methodology
• An 0.8 mAHD constant head boundary has been assumed at the coast to replicate the effect of the seawater/freshwater interface.
• It was assumed that 22 per cent of runoff from the impervious areas will be made available as recharge. In the preparation of final details of the development, including methods for groundwater recharge, transmission losses should be considered to ensure recharge rates are in the order of 22 per cent of runoff from the impervious area.
2310/R01/FINAL Umwelt (Australia) Pty Limited
June 2009 3.6
IP14 Area Geomorphology & Groundwater Groundwater Modelling Results
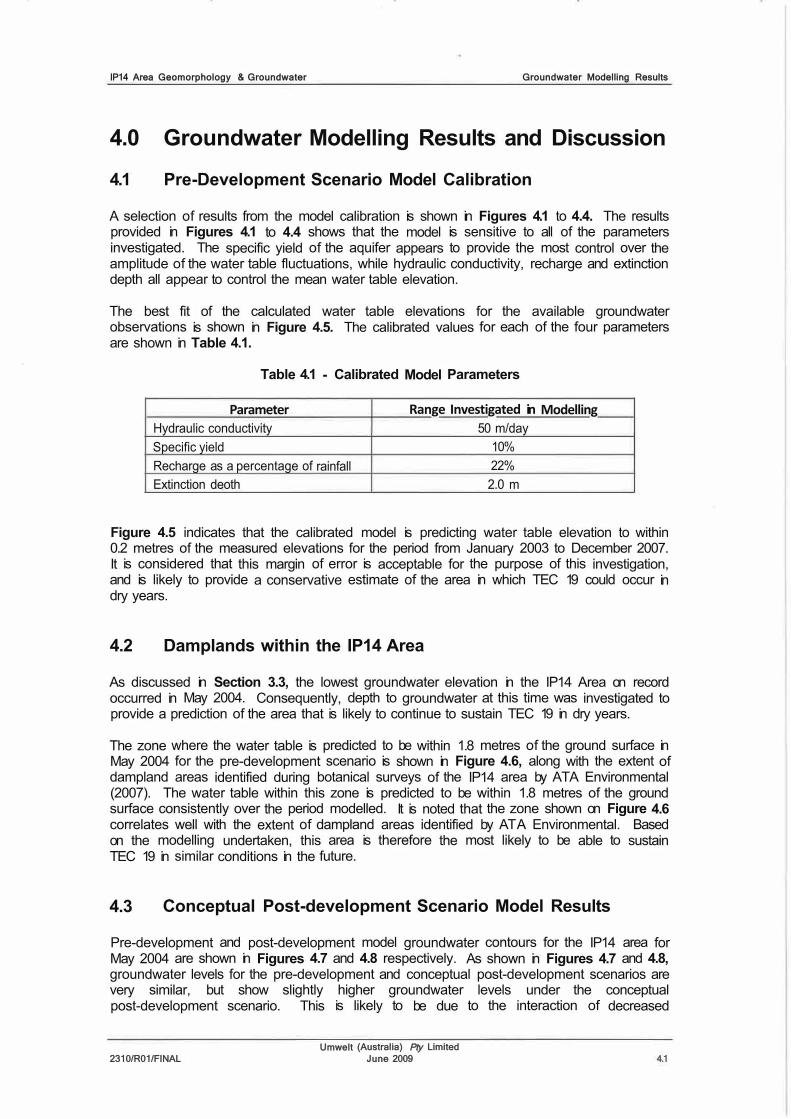
4.0 Groundwater Modelling Results and Discussion 4.1 Pre-Development Scenario Model Calibration
A selection of results from the model calibration is shown in Figures 4.1 to 4.4. The results provided in Figures 4.1 to 4.4 shows that the model is sensitive to all of the parameters investigated. The specific yield of the aquifer appears to provide the most control over the amplitude of the water table fluctuations, while hydraulic conductivity, recharge and extinction depth all appear to control the mean water table elevation.
The best fit of the calculated water table elevations for the available groundwater observations is shown in Figure 4.5. The calibrated values for each of the four parameters are shown in Table 4.1.
Table 4.1 - Calibrated Model Parameters
Parameter Range Investigated in Modelling Hydraulic conductivity 50 m/day Specific yield 10% Recharge as a percentage of rainfall 22% Extinction deoth 2.0 m
Figure 4.5 indicates that the calibrated model is predicting water table elevation to within 0.2 metres of the measured elevations for the period from January 2003 to December 2007. It is considered that this margin of error is acceptable for the purpose of this investigation, and is likely to provide a conservative estimate of the area in which TEC 19 could occur in dry years.
4.2 Damplands within the IP14 Area
As discussed in Section 3.3, the lowest groundwater elevation in the IP14 Area on record occurred in May 2004. Consequently, depth to groundwater at this time was investigated to provide a prediction of the area that is likely to continue to sustain TEC 19 in dry years.
The zone where the water table is predicted to be within 1.8 metres of the ground surface in May 2004 for the pre-development scenario is shown in Figure 4.6, along with the extent of dampland areas identified during botanical surveys of the IP14 area by ATA Environmental (2007). The water table within this zone is predicted to be within 1.8 metres of the ground surface consistently over the period modelled. It is noted that the zone shown on Figure 4.6 correlates well with the extent of dampland areas identified by AT A Environmental. Based on the modelling undertaken, this area is therefore the most likely to be able to sustain TEC 19 in similar conditions in the future.
4.3 Conceptual Post-development Scenario Model Results
Pre-development and post-development model groundwater contours for the IP14 area for May 2004 are shown in Figures 4.7 and 4.8 respectively. As shown in Figures 4.7 and 4.8, groundwater levels for the pre-development and conceptual post-development scenarios are very similar, but show slightly higher groundwater levels under the conceptual post-development scenario. This is likely to be due to the interaction of decreased
2310/R01/FINAL Umwelt (Australia) Pty Limited
June 2009 4.1

U m w e l t - - - - - - - - - - - - - - - - - - - - - - - - - - - - - - - -,-. "
k•70m/day Sy=0.10 Rechl!lrgP0.20,c rain.fall Extinction Depth=Um
2,5 � - - - - - - - - - - - - - - - - - - - - - - - - - - - - �
2
•
1.5
0 , 5 + - - - - - - - - - - - - - - - - - - - - - - - - - - - - - - - t
0 + - - - - , - - - - , - - - - , - - - - , - - - - , - - - - , - - - . . - - - - . . - - - - . - - - - t 0 200 400 600 1000
Tim• (days)
1 2 0 0 1400 1 6 0 0 1800
kii30m/day sy=0:10 Rechargaa0.20 • ralnfall lxtlnctlon Depth■1.5m
2000
2 , 5 , - - - - - - - - - - - - - - - - - - - - - - - - - - - - - - - - - ,
2 1 - - - - - - - - - - - - - - - - - - - - - - - - - - - - - - - - t
0.5 1 - - - - - - - - - - - - - - - - - - - - - - - - - - - - - - - - t
0 + - - - � - - . . . - - - - , - - - . . - - - - . . - - - - , - - - . . - - - - , - - - . . - - - � 200 400 600 800 1000
Time (days)
1200 1400 1600 1 8 0 0 2000
Filo Noma IA,): ROI_Vl/2310_025 don
- + - EGRM9/ A(CaicUlaleo} • EGRM9/A(Obs8N!d)
--eGRM9/A(Calcutated) -a-EGRM9/A(Obsll!'\Ed)
FIGURE 4.1 Bore EGRM9/A Hydraulic
Condudivity Calibration Graphs

Umwe l t - - - - - - - - - - - - - - - - - - - - - - - - - - - - - - -. ,
g
:c g :c
k Om/day Sy=0.2O Recharge=0.2O x ralnfaU Extinction Depth•1.5m
2 5 . . - - - - - - - - - - - - - - - - - - - - - - - - - - - - - - - - - ,
2
•
1.5
0.5 + - - - - - - - - - - - - - - - - - - - - - - - - - - - - - - - - - - !
0 + - - - - - - - - - - - - - - - - - - - - - - - - - - - - - - - - 1 0 200 400 eoo 600 1000
Tlmo (days) 1ZOO 1400 1600 ' 1800
k-,Om/day Sy=0.15 Rer;harge=0.20 x ral.nfall lxtinctlon Depth■1.5m
2000
Z S . . - - - - - - - - - - - - - - - - - - - - - - - - - - - - - - - - - ,
2
•
1,5
0,5 1 - - - - - - - - - - - - - - - - - - - - - - - - - - - - - - - t
0 1 - - - - - - - - - - - - - - - - - - - - - - . - - - , - - - , - - - - - - 1 0 200 400 600 800 1000
Time (dtya) 1200 1400 1600 ,aoo 2000
filo Nonu (A,): R0I_Vl/1310_026.dgn
- - + - EGRMSIA(Calculaled)
- - - - EGRM9/A(O!>sllr\EO)
-+-EGRM9/A(Calculated)
- - - EGRM91A(Obsen.ed)
FIGURE 4.2 Bora EGRM9/A Specific Yield
Calibration Graphs

U m w e l t - - - - - - - - - - - - - - - - - - - - - - - - - - - - - - - -, ,.
0 200
k:saom/day Sy-0. 1 O RechargaoiCUO x rainfall Extinction Depth=1.5m
600 800 1000 Tim• (days)
1 2 0 0 1600 1800
k-SOm/day Sy=0.10 Recharge:ii0.25x ralnfall lxtlnctlon Dtpth•1.5m
0 200 400 600 800
Filo Nomo (A4): R0I_Vl/2310_027.dg•
1000 Time (days)
1200 1400 1600 1000
2000
2 0 0 0
--+-EGRMSrA(CalolAated]
- - EGRM9iA(Obser.ed)
- - + - EGRM9/A(Calculated) EGRMSrA(ObseMd)
FIGURE 4.3
Bore EGRM9/A Recharge Colihrotion Graphs

� Umwe l t - - - - - - - - - - - - - - - - - - - - - - - - - - - - - - - -,
0 200 400
0 200 400
k=50m/day Sy=D.10 R.charge=0.22 x ralnfall Extinction Depth•1.6m
600 800 1000 Tim• (day,)
1200 1 4 0 0 1600 1800
k-SOm/day Sy-0.10 Recharg.-0.22 x ralnfall lxtlnctlon Depth•2.0m
800 1000 Tim• (days)
1200 1400 1600 1800
FIio Nomo [A4): R0I_Vl/2310_028.dgn
2000
-+-EGRM9/A(Calcufaled) ......._ EGRM9/A{ObseMd)
- + - EGRM91 A(Calculated) -a-EGRM9/A(Obse<'led)
FIGURE 4.4 Bore EGRM9/A Extindion Depth Calibration Graphs

- - - - - - - - - - - - - - - - - - - - - - - - - - - - - - - - - - - - - - - - - - - - - -Umwelt --
k=SOm/day Sy=0.10 Recharge=0.22 x rainfaU Extinction Depth=1.8m
2 5 - - - - - - - - - - - - - - - - - - - - - - - - - - - - - - - - - - -
2 + - - - - - - - - - - - - - - - - - - - - - - - - - - - - - - - - - - - - - - - - - - - 1
1.5 + - - - - f - - - - - - - - f - - ' - - - - - - - - , 1 , - - - - - - - - - - - - - - - - - - + - - - - - - - l
0.5 + - - - - - - - - - - - - - - - - - - - - - - - - - - - - - - - - - - - - - - - l
0 + - - - - - - . - - - - , - - - - - , - - - - . . - - - - - - . - - - - , - - - - - , - - - - . . - - - - - , - - - - - - - - !0 200 400 600 800 1000
Time (days) 1200 1400 1600 1800 2000
file Nome (A4): R0l_Vl/2310_029.dgn
- + - EGRM9/A(Calculaled) - - EGRM9/A(Obser.ed)
FIGURE 4.5 Bore EGRM9/A fmal Parameters
Calibration Graph

Aeriol Photo: Londgo1e 1 2008. Codostr&: Depo.rtmenl of Land Information, ,006 We11onds: ATA Envitonmen1al, 2006
Note: BGS ., Below Ground Surloc;e
Legend c : = J IPI 4 Boundary
Conservolion Category Wetland - J.Bm 86S Woter Tobie Contour (high polentiol for TEC 19 survival) - 2.0m 86S Water Tobie Contour (potential for TEC 19 survival) - 2.5m BGS Woter Tobie Contour (low potentiol 101 TEC 19 survival)
File Name (A.(J: R01_Vl/23r0_020.dgn
I :25 000
FIGURE 4.6
IP14 Area with Water Table within 2.5m of the Ground Surface in Moy 2004

- - - - - - - - - - - - - - - - - - - - - - - - - - - - - -·---
Aerial Photo: Loodgate, 2008, Cadostre: Wetlonds: ATA Eovlronmentol, 2006
Note: Groundwater Contour Interval "" 0.05m
legend c:::::J I Pl 4 Boundary
Con1ervation Category Wotlond - - Groundwoter Contours
File Name (A4): R0I_Vl/2310_035.dgn
I :25 000
FIGURE 4.7
Modelled I Pl 4 Area Pre-development Scenario Groundwater Contours May 2004

. U m w e l t - - - - - - - - - - - - - - - - - - - - - - - - - - - - - - -t - • • 9'--, • .,-r,.
Source: Aeriol Photo: londgote, 2008, Cadostro: Wellonds: ATA Environmonlol, 2006
Nota: Groundwater Contour Interval re. 0.05m
Legend c::::=J IP14 Boundiiry
Conservotion Category Wetlond - - Groundwote, Contours
File Name (A4J: ROl_Vl/2310_034.dgn
1:25000
FIGURE 4.8 Modelled IP14 Area C onceptuol Post-development
Scenario Groundwater Contour Moy 2004

IP14 Area Geomorphology & Groundwater Groundwater Modelling Results
evapotranspiration due to an increase in impervious areas and the inclusion of infiltration trenches within the industrial development to maintain pre-development rates of infiltration. These results indicate that the capture of runoff from impervious areas for recharge to groundwater using infiltration trenches could provide an effective tool in the management of groundwater levels across the IP14 area in the future.
2310/R01/FINAL Umwelt (Australia) Pty Limited
June 2009 4.2

IP14 Area Geomorphology & Groundwater Conclusion
5.0 Conclusion Analysis of the geomorphology and groundwater characteristics of the IP14 area has demonstrated that the observed location of TEC 19 wetland species is confined to landforms within IP 14 that have an elevation of less than 3.25 mAHD and that are typically no greater than approximately 1.8 metres to 1.9 metres above the water table during dry periods. Literature review indicates that wetland species such as those comprising TEC 19 have a root depth of up to 1 metre and need to be within approximately 1.9 metres of the water table during the dry period to survive.
Groundwater monitoring information indicates that since 1990 groundwater levels across the whole area have dropped by approximately 1 metre. Groundwater and meteorological data indicates that this drop corresponds to a reduction in annual rainfall over the same period. The correlation between groundwater level and rainfall indicates that this observed decrease in groundwater level is likely to be predominantly driven by reduced rainfall.
Detailed groundwater monitoring across the site indicates that water levels in the vicinity of the wetland areas are consistent with those of adjacent areas indicating that localised perched water tables are unlikely to be the reason for the existence of the TEC 19 communities.
Groundwater monitoring also indicates that the groundwater profile in the central southern section of the IP14 area where TEC 19 exists, fluctuates seasonally by up to approximately 1.0 metre and is relatively flat across the area during the dry season with an elevation of approximately 0.9 mAHD to 1.0 mAHD.
Recorded groundwater levels of approximately 0.8 metres in the north-western corner of the IP14 area and across the western part of the site are higher than would be expected during dry conditions given the close proximity to Cockburn Sound. These elevated levels appear to control the groundwater levels during the dry period and extend the area where the water table remains within 1.8 to 1.9 metres of the land surface.
A detailed groundwater model has been developed for the IP14 area to explore groundwater levels and trends. Extensive calibration using site specific groundwater level data and sensitivity analysis has been undertaken in dE;iveloping this model. The model has been calibrated to within approximately 0.2 metres of observed groundwater levels in dry periods with predicted levels being up to 0.2 metres higher than observed levels across the area when TEC 19 has been observed.
The model has been used to explore the zones within the IP 14 area where the water table is within 1.8 metres to 1.9 metres of the ground surface during the dry months of the year. These zones are predicted to be the areas where TEC 19 species could be sustained within the IP14 area into the future. This zone correlates closely with the areas within the IP14 area which have a surface elevation of 3.0 mAHD or less. Water table elevations of 2.0 metres and 2.5 metres below the ground surface have also been plotted to provide an indication of the variation in groundwater levels around TEC 19 areas. These areas are shown on Figure 4.6 and have been used to delineate areas where TEC 19 species are likely to survive and areas where the chance of long term survival is marginal.
Based on this analysis, it is considered that the area where the water table is within 1.8 metres of the ground surface (refer to Figure 4.6) is likely to be able to sustain TEC 19 species into the future. As key TEC species need to be located in areas where the water table is within 1.9 metres of the ground surface, it is considered that mapped wetland areas in the north of the IP14 area where the water table is 2.5 metres below the surface are not likely to be sustainable into the future.
2310/R01/FINAL Umwelt (Australia) Pty Limited
June 2009 5.1

IP14 Area Geomorphology & Groundwater Conclusion
Groundwater modelling of a conceptual IP14 area post-development scenario incorporating WSUD features has also been undertaken to determine the potential impact of development generally as set out in the IP14 area structure plan shown in Appendix 2 on groundwater levels. The results of the modelling show similar groundwater levels for the pre-development and post-development scenarios and indicate that the capture of runoff from impervious areas for recharge to groundwater using infiltration trenches could provide an effective tool in the management of groundwater levels across the IP14 area in the future.
2310/R01/FINAL Umwelt (Australia) Pty Limited
June 2009 5.2
IP14 Area Geomorphology & Groundwater References
6.0 References Alan Tingay & Associates 1991. The Rockingham-Becher Plain. Report prepared for
Department of Planning and Environment, Western Australia.
ATA Environmental (in preparation), East Rockingham Industrial Park (IP14 Area) Strategic Environmental Assessment.
ATA Environmental, 2002, East Rockingham Industrial Park (IP14)-Flora and Vegetation Survey Version 3. Prepared for Department of Mineral and Petroleum Resources, August 2002.
Bowman, Bishaw and Associates 1988. Terrestrial environmental investigations for the Port Kennedy Regional Recreation Centre Stage 1. Report prepared for Binnie & Partners, Perth.
Davidson, W A 1995, Hydrogeo/ogy and Groundwater Resources of the Perth Region Western Australia, Western Australia Geological Survey Bulletin 142.
English V and Blyth J 1997. Identifying and Conserving Threatened Ecological Communities in the South West Botanical Province. ANCA National Reserves System Cooperative Program: Project N702. Environment Australia and Western Australia Department of Conservation and Land Management.
English, V, Blyth, J, Gibson, N, Pember, D, Davis, J, Tucker, J, Jennings, P and Walker, B 2002. Sedge/ands in Holocene Dune Swales Interim Recovery Plan No. 110, 2002-2007. Department of Conservation and Land Management, Western Australia.
Froend R and McComb A J 1993. Wetlands of the Swan Coastal Plain Volume 4: The effects of altered water levels on wetland plants. Water Authority and Environmental Protection Authority (S Balla Editor).
Gibson, N, Keighery, BJ, Keighery, G J, Burbidge, AH, and Lyons, M N, 1994. A Floristic Survey of the Southern Swan Coastal Plain, Unpublished Report for the Australian Heritage Commission prepared by the Department of Conservation and Land Management and Conservation Council of Western Australia (Inc.)
Jim Davies and Associates (JOA) 2005. East Rockingham Industrial Estate, Hydrological Investigation. Letter Report and Drill Logs, to AT A Environmental.
LeProvost I, Semeniuk, V, and Chalmer, P, 1987. Environmental Significance of Wetlands in the Perth to Bunbury Region, Western Australian Water Resources Council Report no. R164.
Semeniuk, C A 1988. Consanguineous wetlands and their distribution in the Darling System, South Western Australia. Journey of the Royal Society of Western Australia, 70, 69-87.
Semeniuk, C 2006. The Royal Society of Western Australia Excursion: The Wetlands of the Rockingham Area. WA Science (Proceedings of the Royal Society of Western Australia) April 2006, 1-3.
2310/R01/FINAL Umwelt (Australia) Pty Limited
June 2009 6.1
IP14 Area Geomorphology & Groundwater References
Semeniuk, V 1985. The age structure of a Holocene Barrier dune system and its implications for Sea Level history reconstructions in South Western Australia. Marine Geology, 67, 197-212.
Semeniuk, V and Meagher, T D 1981. Calcrete Quaternary coastal dunes in south Western Australia: A Capillary Rise Phenomenon associated with Plants. Sedimentary Petrology, 51, 47-68.
Semeniuk, V and Searle, D J 1985. The Becher Sand, A New Stratigraphic Unit for the Holocene of the Perth Basin. Journal of the Royal Society of Western Australia, 67, 109-115.
Semeniuk, V, Searle, D J and Woods, P J 1988. The Sedimentology and Stratigraphy of a Cuspate Foreland, South Western Australia. Journal of Coastal Research, 4, 551-564.
Semeniuk, V, Cresswell, I D and Wurm, P A S, 1989. The Quindalup Dunes: the Regional System, Physical Framework and Vegetation Habitats. Journal of the Royal Society of Western Australia, 71, 23-4 7.
V & C Semeniuk Research Group 1991. Ecological Study of the Rockingham Wetlands: t h
Progress Report, Report to the City of Rockingham.
Sloss C R, Jones B G, Murray Wallace C V and McClennen C E 2005. Holocene Sea Level Fluctuations and the sedimentary evolution of a Barrier Estuary: Lake lllawarra, NSW Australia. Journal of Coastal Research 21(5), pp943-959.
Smith A J, Turner J V, Herne D E and Hick W P (CSIRO) 2003. Quantifying submarine groundwater discharge and nutrient discharge into Cockburn Sound, Western Australia. Coast and Clean Seas Project WA9911. CSIRO Land and Water Perth, Technical Report 1/03, June 2003.
Thom B, Shepherd M, Ly CK, Bowman G and Hesp P A 1992. Coastal Geomorphology and Quaternary Geology of the Port Stephens Myall Lakes Area. Australian National University Press, Canberra; pp 1-407.
2310/R01/FINAL Umwelt (Australia) Pty Limited
June 2009 6.2