appendix c in situ production of utah oil...
TRANSCRIPT

C-1
APPENDIX C
In-situ Production of Utah Oil Sands
Final Project Report
Reporting period: June 21, 2006 to October 21, 2009
Milind Deo, Royhan Gani C. K. Huang, and Pete Rose
Department of Chemical Engineering
University of Utah
October 2009
DOE Award Number: DE-FC26-06NT15569
Submitted by:
Institute for Clean & Secure Energy
155 South 1452 East Room 380
Salt Lake City, UT 84112

C-2
Project Objectives
The objective of this project is to evaluate and rank a variety of in-situ heavy oil production
method for the production of bitumen from a representative Utah oil sand formation within the
Uinta Basin. Tools to be employed include a thorough survey of the geology of oil-sand
intervals, a survey of various approaches described in the literature, and a numerical simulation
study to test the most promising oil-extraction approaches applied to a Utah resource.
Summary of Project Outcomes
Two oil sand reservoirs located in Utah’s Uinta Basin were considered for analysis: Whiterocks,
a small, steeply dipping, contained reservoir containing about 100 million barrels, and
Sunnyside, a giant reservoir containing over four billion barrels of oil in place. Cyclic steam
stimulation, steam assisted gravity drainage, and in-situ combustion processes were considered
for the production of oil from these reservoirs. Different well configurations and patterns were
examined. It was found that the application of steam-based in-situ processes would be feasible
but challenging for Utah oil sands. For most configurations, the steam to oil ratios were higher
than five, indicating marginal economic viability. Additionally, the water production rates were
high. The in-situ combustion process was simulated with and without the presence of a hydraulic
fracture for a homogeneous reservoir. The nature of the combustion front was radial without the
fracture and linear with the fracture. Even though the process appears feasible, rigorous
evaluation with an appropriate geologic model will be necessary to determine technical and
economic viability.
Presentations and Papers
Deo, M., “Western U.S. Oil Sands and In Situ Processes,” 2006, Western U.S. Oil Sands
Conference, Salt Lake City, UT, September 21, 2006,
http://repository.icse.utah.edu/dspace/handle/123456789/9886
Huang, C., Gani, R. and Deo, M., 2007, “In-situ Production of Oil from Utah Oil Sands,” AIChE
Annual Meeting, Salt Lake City, Utah, November 5-9, 2007.
Huang, C. K., Yang, Y. K. and Deo, M. D., 2007, “A New Thermal Compositional Simulator
with a Novel ‘Equation Lineup’ Method”, SPE 110219, Proceedings - SPE Annual Technical
Conference and Exhibition 2007, Anaheim, CA, November 11-14, 2007, pp. 2348-2362.
Deo, M., “Oil Sands Production Technologies,” 2008, Western U.S. Oil Sands Technology
Transfer Meeting, Salt Lake City, UT, February 22, 2008,
http://repository.icse.utah.edu/dspace/handle/123456789/9899

C-3
Deo, M. “In Situ Production of Utah Oil Sands,” 2009, Western U.S. Oil Sands Conference, Salt
Lake City, UT, February 27, 2009,
http://repository.icse.utah.edu/dspace/handle/123456789/5228
Characterization of Oil Sands
Bitumen is the principal organic material found in oil sands. While the world’s largest oil sands
resources are found in the province of Alberta, Canada, major oil sands resources are also found
in Utah. The characteristics of bitumen in comparison to other feedstocks are shown in Table 1.
While bitumen does have high densities and low heating values compared with crude oil, its
hydrogen to carbon ratio is reasonably favorable when compared with other unconventional
fuels.
Table 1: General characteristics of oil sand bitumen in comparison to other feedstocks.
The Utah oil sand reservoirs containing significant quantities of oil are listed in Table 2 along
with a few other characteristics about the deposits.
Table 2: Some characteristics of Utah oil sand reservoirs (adapted from [1]).
Reservoir Areal Extent (Square
Miles)
Range of Gross
Thickness
Oil in place (in millions
of barrels)
Asphalt Ridge 20 to 25 10 to 135 800 - 1000
PR Spring 240 to 270 10 to 80 4000 - 5000
Sunnyside 35 to 90 15 to 550 3500 - 4000
Whiterocks 0.6 to 0.75 1000+ 65-125

C-4
Studies in this report focus primarily on the Whiterocks and Sunnyside oil sand reservoirs.
Locations of these resources can be seen in Figure 1. The Whiterocks reservoir is located in the
northern section of the Uinta Basin while the Sunnyside reservoir is located on the Basin’s
southwest flank. The Whiterocks formation, a small, contained deposit, consists of relatively
homogeneous sandstone with high viscosity bitumen [2,3]. The Sunnyside formation, one of the
largest oil sands deposits in the state, is characterized by rugged terrain, uneven quality,
consolidated oil sands, and very high viscosities [2,3].
Figure 1: Locations of the prominent oil sand deposits in the State of Utah (from [2]).
General formation properties of significant Utah deposits, including the White Rocks and
Sunnyside formations, are also shown in Table 2 [2]. The biggest difference between the Utah
and the Canadian bitumen is that the viscosity of Utah bitumen at reservoir conditions is 30,000
to 300,000 cp, about one or two orders of magnitude larger than the Canadian bitumen. The

C-5
Sunnyside formation is characterized by ultra-high viscosity bitumen while the Whiterocks
deposit contains a relatively “lighter” bitumen. Other major distinguishing features between
Utah and Canadian oil sands include the higher level of sand consolidation, the lower resource
quality (weight percent bitumen in the oil sand mixture) and the significant reservoir
heterogeneity exhibited by Utah oils sands.
Survey of In-situ Oil Sand Production Approaches
Most large-scale oil sands production strategies involve ex-situ processes, e.g. strip mining
followed by bitumen extraction [1,2]. In-situ production of oil sands bitumen offers an excellent
alternative to the ex-situ processes. In addition to leaving the landscape relatively undisturbed, in
situ processes allow for partial upgrading of oil sands, leaving heavier, less profitable
components of the bitumen in the subsurface. Some in-situ methods use much less water and
generate less CO2 than ex-situ methods. In addition, in-situ approaches allow for the exploitation
of much deeper oil sand formations—where the cost of removing the overburden is prohibitively
expensive.
In-situ oil sands production is increasing in Canada. In 2007, in-situ production accounted for
41% of the 1.3 million barrels produced each day [4]. In-situ technologies might be particularly
attractive for the State of Utah because of its arid climate and because of the proximity of some
oil sands deposits to environmentally sensitive areas.
Steam processes, including cyclic steaming, steamdrives, and Steam-Assisted Gravity
Drainage (SAGD) are the most common in-situ production processes being used globally for oil
sands production. Likewise, in-situ combustion is an emerging in-situ process that has achieved
some early success in Canada’s vast oil sand deposits. A recently created process called Toe-to-
Heel Air Injection (THAI) takes advantage of the best qualities of the SAGD and in situ
combustion approaches and uses a horizontal well both to direct the combustion process and to
collect the mobilized bitumen [5]. Even though these concepts are relatively simple and have
been used successfully in other countries, significant challenges exist in adapting these
technologies to Utah’s lenticular oil sands deposits.
Cyclic steam stimulation, SAGD, and in-situ combustion are the in-situ processes considered in
this report. A survey of other in-situ processes for the production of oil sands can be found in
[6].
Cyclic Steam Stimulation (CSS)
Perhaps the simplest, most reliable, and most commonly practiced form of in-situ production is
cyclic steam injection, also known as ‘huff-and-puff’ [7,8]. With this approach, steam is injected
at high pressures and temperatures (550°F or higher) and is then allowed to soak. The pressure
dilates or fractures the formation and the heat reduces the viscosity of the bitumen. The heated

C-6
bitumen is then pumped to the surface using downhole pumps in the injection well (Figure 2).
The process is repeated in a cyclical fashion until saturations become non-productive [9].
Although the cyclic steam process is simple and reliable, recoveries are relatively low (~25%)
and large amounts of water are required to generate steam. Likewise, the energy to generate the
required steam is expensive.
Figure 2: Schematic of the cyclic steam stimulation process showing the injection phase, the
soak period and production from a single well (from [6]).
Steam Assisted Gravity Drainage (SAGD)
SAGD has become the dominant technology employed in a variety of heavy oil and bitumen
recovery processes, with Canadian development leading the way. A number of oil companies
are currently involved in pilot and commercial applications of the SAGD process. In SAGD,
two horizontal wells are placed near the bottom of a formation as shown in Figure 3. Steam is
injected through the upper well, which, due to buoyant forces, rises through the formation to
create a steam chamber near the top of the formation. Steam mobilizes the bitumen by lowering
its viscosity, and the bitumen then flows downward. The production well, placed about 5 m
below the injection well, is used to collect the resulting condensate and the released oil, which is
then pumped to the surface. Long horizontal well segments have the potential for higher oil
recovery rates. SAGD is the dominant in situ technology because it utilizes the natural tendency

C-7
of oil to drain by gravity into production wells and it is a relatively simple process to implement
[10,11].
While the SAGD process can lead to high recoveries (up to 60 % of the oil in place) and is
Economically viable, it has several disadvantages. It requires large amounts of water and the
energy that is required to generate the required steam is expensive and leads to the production of
large quantities of the greenhouse gas CO2. Also, since it relies on gravity drainage, it requires
comparatively thick and homogeneous reservoirs.
Figure 3: Schematic showing the operation of SAGD (from [6]).
In-situ Combustion
In-situ combustion is an enhanced oil recovery (EOR) technique that has been widely studied
and used in the production of heavy oils since its inception in the mid-1930’s [12-14]. It is a
process in which air, oxygen, or oxygen-enriched air is injected into a bitumen reservoir. The
air/bitumen mixture is ignited to produce a combustion zone that creates heat and causes the flow
of the remaining bitumen to a collector.

C-8
In situ combustion offers the advantages of high recovery (60% or more of original oil in
place), high efficiency due to self-heating of the reservoir, low cost [15] and low water use, the
latter being especially attractive in arid settings such as those in Utah. The injection of pure
oxygen in the place of air [16] or the injection of water to produce in situ steam [17] can both
significantly improve sweep efficiencies and recoveries. However, the combustion front is
difficult to control and some of the resource in place is lost to combustion. Classical in-situ
combustion not expected to work well in oil sands unless some scheme is used to provide initial
interwell communication and mobility to the bitumen [18].
Numerical Simulation of In-situ Production of Utah Oil Sands
Numerical simulation of these processes can give insight into the potential of the resources of
interest. First, both SAGD and cyclic steam processes, loosely based on the Whiterocks resource
characteristics, were modeled. Second, SAGD and a process involving steam injection with
vertical wells were modeled for the Sunnyside resource. In-situ combustion was simulated with
a homogeneous hypothetical resource due to complexities associated with modeling this process.
Steam Assisted Gravity Drainage (SAGD) and Cyclic Steam Processes
Whiterocks Deposit
Initial numerical simulation models of the SAGD and cyclic steam production processes based
upon the Whiterocks reservoir model were constructed and run using STARS, the thermal
compositional simulator developed by Computer Modeling Group, Calgary, Canada [19]. The
reservoir was divided into 25 layers of varying thicknesses. These layers were categorized as:
rich (r), lean (l), very lean (v), and barren (b). Properties of the various layers used in the
simulation are shown in Figure 4. For example, the rich layers were assumed to have the
following characteristics: vertical and horizontal permeability of 125 md, porosity of 0.3, and oil
saturation of 0.6. The thickness of the 25 layers can be seen in Figure 5, which is a visualization
of the permeability of the grid blocks. Red grid blocks represent rich layers, green grid blocks
represent lean layers, light blue grid blocks represent very lean layers, and dark blue blocks
represent barren layers. Layer 1 in Figure 4 is the layer furthest to the left in Figure 5
progressing to layer 25 as the final layer furthest to the right in Figure 5.

C-9
Figure 4: The 25 layers used in the simulation of cyclic and SAGD processes. The categories are
rich, lean, very lean and barren.
Figure 5: Model of the Whiterocks reservoir constructed in STARS.

C-10
Whiterocks is a steeply dipping reservoir (750). The model constructed in STARS is shown in
Figure 5. It should be noted that if horizontal wells were used, they would cut across the bedding
planes in almost a perpendicular manner.
The geometry and the well configurations used are shown in Figure 6. The wells were placed so
that the steam chambers would be able to effectively drain oil from the reservoir. For the SAGD
process, three pairs of horizontal wells, the SAGD injector and producer, were simulated. The
pairs of wells alternated between a location near the bottom of the reservoir and a location and in
the middle of the reservoir (290 ft. higher) as seen in Figure 6. This pattern allows for efficient
heat and fluid transfer throughout the reservoir. The lower pairs of wells lie on the boundary of
the simulation, so only half of each well is calculated. This boundary condition can be repeated
to represent more wells in the same pattern. In the cyclic steam simulation, the same geometry
and well configurations were used. However, a single vertical well was used as both the injection
well and the producer. Bitumen was assumed to be highly viscous dead oil. Fluid properties for
this dead oil were assumed. Three components were represented in appropriate phases: water,
dead oil, and solution gas. Both types of simulations were performed on a PC. After adjustment
of numerical parameters, SAGD simulations required approximately 4 hours while the cyclic
steam simulations required over 46 hours.
Figure 6: Geometry and well configuration used.
SAGD oil production is shown in Figure 7 and the cyclic oil production is shown in Figure 8. In
both cases, substantial amounts of oil can be produced from the reservoir. Since the initial water
saturation in the reservoir is significant, large amounts of water are also produced. It should be
noted that the uncertainty in these simulations can be significant. The simulation results are very
sensitive to the rock-fluid properties (relative permeability curves) employed in the simulation.
Relative permeabilities at conditions of interest for these formations have not been measured and

C-11
“typical” values were used in the simulations. Additionally, the geologic information is
assembled using data from one log, so lateral variability is not accounted for. The flow
properties are also approximate as they are based on limited laboratory testing.
Figure 7: Oil production in Whiterocks SAGD simulations.

C-12
Figure 8: Oil production in Whiterocks cyclic simulations.
Steam-oil ratios (SOR) in most SAGD simulations averaged about 5-10. Initially, water was
assumed to fill the remaining pore space not filled by oil in the simulations (e.g. no gas was
present). This initial water saturation, in addition to the injected steam, accounts for the high
water cuts. For comparison, the SOR in economic SAGD operations in Canada is about 3. With
the geologic conditions employed and the assumed water saturations, it appears that the
computed SORs are not very favorable for in-situ oil production in Utah.
Sunnyside Deposit Modeling
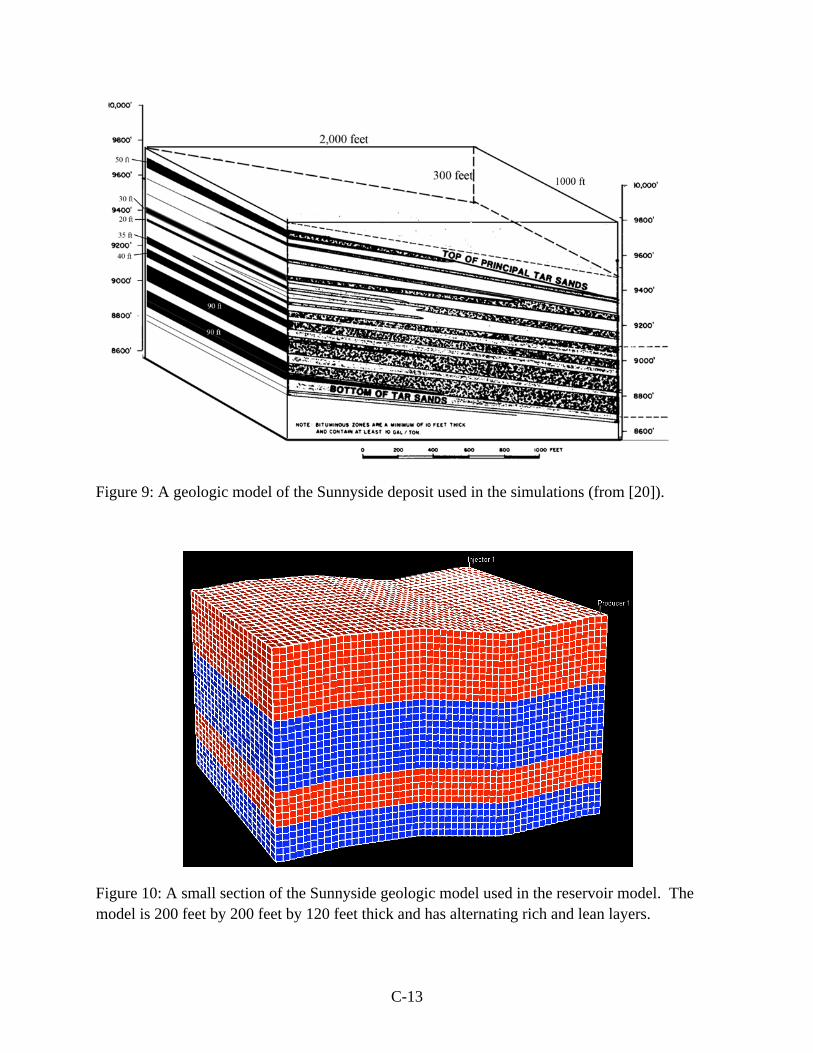
The conceptual geologic model of the Sunnyside deposit provided by Gwynn [20] and shown in
Figure 9 was adapted for reservoir simulations. The thickest zones are about 90 feet in thickness,
but these are interspersed with numerous thin and sometimes lean layers. This layered
heterogeneous reality represents the most significant challenge to exploiting Utah oil sands
resources. For the simulations, the layered geologic model was simplified by using alternating
lean and rich zones as shown in Figure 10
C-13
Figure 9: A geologic model of the Sunnyside deposit used in the simulations (from [20]).
Figure 10: A small section of the Sunnyside geologic model used in the reservoir model. The
model is 200 feet by 200 feet by 120 feet thick and has alternating rich and lean layers.

C-14
The well configurations used in steam injection and production are shown in Figure 8.
Conditions were the same for both simulations in order to compare the performance of a SAGD
process to a simpler steam flood with vertical wells. In Figure 11, the panel on the left shows a
classic SAGD configuration with a horizontal well pair. The panel on the right shows a vertical
injector and vertical producer configuration. The injector has been completed in only half of the
formation to allow for the steam override. This injector configuration allows for more steam
contact in the reservoir than if the vertical injector were completed over the entire formation. In
addition to well placement, Figure 11 shows a 2D side view of the domain described in Figure
10. This geologic model is conceptual and approximate. Layers with different richness are
represented with different properties but cells within layers have uniform properties. Oil
saturation averages about 0.65 for the entire model. This reservoir realization represents a thick
tongue in the Sunnyside formation that is sufficiently deep (500+ feet) to contain the steam
chamber. A detailed characterization program (with a number of core holes over the entire
deposit) will be necessary to obtain a better reservoir model and a better reservoir representation.
Figure 11: The horizontal and vertical well configurations used for steam injection in Sunnyside.
The horizontal well configuration consists of an injection production pair with the injector above
the producer at the bottom of the reservoir. The injector in this simulation was 20 feet above the
producer. The separation between these horizontal wells is partially determined by horizontal
drilling capabilities. Also, it is possible to produce the injected steam before it transfers heat to
the reservoir if the wells are too close to each other. In the vertical well configuration, steam is
injected at the bottom half of the reservoir as illustrated by the yellow dots in Figure 11 while oil
is produced from the entire cross section. These simulations required a few hours of
computational time on a fast PC.
Results from the SAGD simulation, including horizontal well production and other parameters,
are shown in Figure 12. Because of the high initial water saturation (0.35 average), water

C-15
production was consistently high throughout the production period. Once again, SOR ranged
from 5-10 throughout the simulated period.
Figure 12: Production rates, cumulative production, etc. for SAGD production from Sunnyside.
The vertical well pair production is shown in Figure 13. The rates and cumulative oil production
are much lower in the vertical well case than for SAGD. Heat transfer is likely insufficient from
the vertical well, and the distance is too large between the injector and producer wells for
economic utilization of steam. These results further demonstrate that production rates may be
uneconomically low due to high oil viscosities and limited steam injectivities.

C-16
Figure 13: Oil production rates, water cut etc. for the vertical well system.
In-situ Combustion
In-situ combustion is considered a highly complicated EOR process from both a practical and a
modeling standpoint. In practice, the interplay between the geological heterogeneity of the
reservoir and the distribution of the hydrocarbons increases the difficulty of controlling the
process. In performing simulations, chemical reaction rates, phase equilibrium calculations, and
complicated rock-fluid interactions make numerical stability a challenge. The addition of
fracture considerations increases the numerical difficulty since multi-scale flow regions exist in
the problem. We examined the use of in-situ combustion in homogeneous media without the
additional consideration of complex geology reported for the steam injection simulations in the
previous section.
Injecting air in oil sand reservoirs for in-situ combustion requires reasonable permeability.
Hydraulic fracturing is a logical method of creating this permeability. To study the impact of
fractures and faults, an in-situ combustion simulator for complex fractured media was developed
at the University of Utah. The simulator is a discrete-fracture, finite-element model for
multiphase reservoir simulation that is based on models described in the late 1970s [21]. The

C-17
simulator was developed using a modularization concept that divides the development of the
simulator into two major modules: physical method module (PM) and the discretization module
(DM). The first module provides the property data required in the reservoir model and performs
the solution of the governing equations that describe the nature of the reservoir performance. The
second module provides the spatial information related to the chosen discretization method.
The in-situ combustion algorithms were first tested with dry (no-water) combustion and then
with wet combustion where different amounts of water were co-injected with air. Additional
simulation details, including boundary conditions, inlet conditions, and reservoir characteristics,
can be found in [22].
The temperature profiles along the injection path (dimensionless) are shown in Figure 14. With
wet combustion. the high-temperature plateau is wider due to the effect of water evaporation and
re-condensation at the front. This plateau results in better heat utilization and distribution, an
additional benefit (combustion besides permeability creation) to hydraulic fracturing with in-situ
Figure 14: Comparison of temperatures profiles with dry and wet combustion.
While hydraulic fracturing is necessary to improve the air injectivity (or sometimes productivity)
and sweep efficiency, the actual effect of the hydraulic fracture depends on its dimension,
orientation and system of complexity. Therefore, the near-well displacement in a hydraulically-
C-18
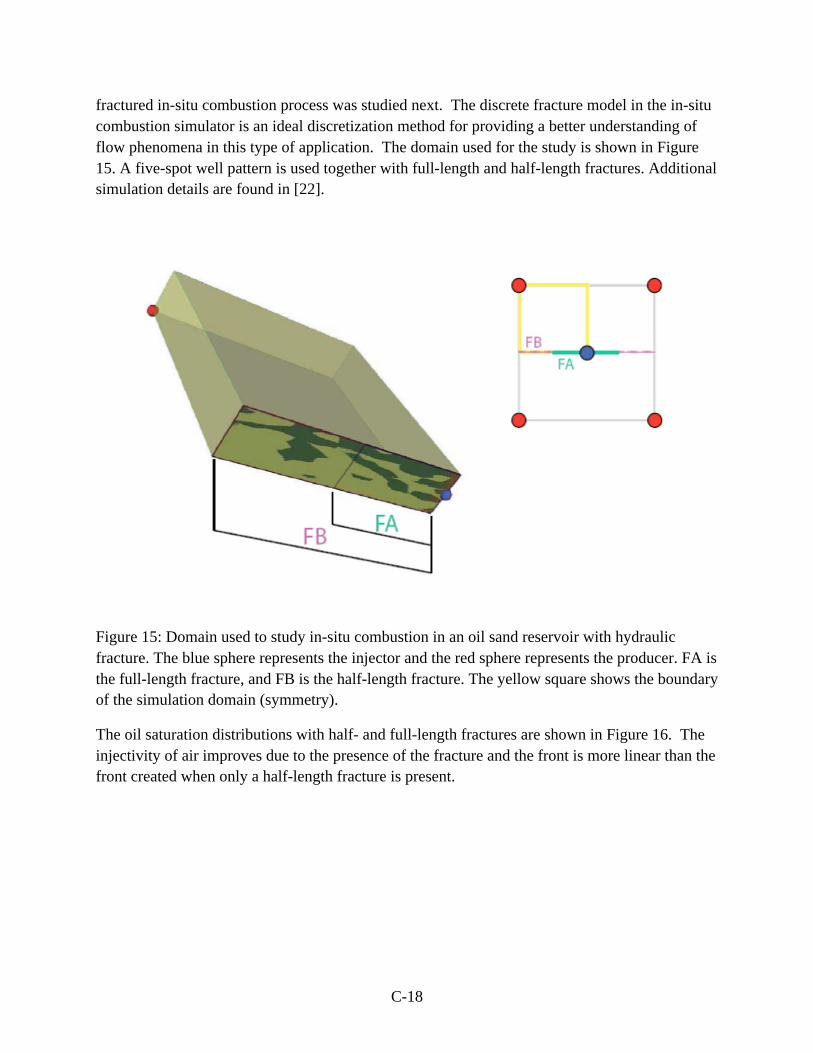
fractured in-situ combustion process was studied next. The discrete fracture model in the in-situ
combustion simulator is an ideal discretization method for providing a better understanding of
flow phenomena in this type of application. The domain used for the study is shown in Figure
15. A five-spot well pattern is used together with full-length and half-length fractures. Additional
simulation details are found in [22].
Figure 15: Domain used to study in-situ combustion in an oil sand reservoir with hydraulic
fracture. The blue sphere represents the injector and the red sphere represents the producer. FA is
the full-length fracture, and FB is the half-length fracture. The yellow square shows the boundary
of the simulation domain (symmetry).
The oil saturation distributions with half- and full-length fractures are shown in Figure 16. The
injectivity of air improves due to the presence of the fracture and the front is more linear than the
front created when only a half-length fracture is present.

C-19
.
Figure 16: In-situ combustion with hydraulic fracture – comparison of half length and full-length
fractures. It is seen that the full-length fracture creates a linear front compared to the radial front

C-20
Conclusions
The efficacy of a variety of thermally-enhanced oil recovery methods was examined for the
production of oil from Utah oil sands reservoirs. Specific geologic models were used for the
evaluation of steamfloods in Whiterocks and in Sunnyside. Cyclic and SAGD processes were
found feasible, resulting in significant oil production. However, the water rates were high and
the SOR was in the 5-10 range, making economic operation of these processes challenging. A
thermal enhanced oil recovery reservoir simulator developed for fractured reservoirs was used to
examine the use of in-situ combustion in the presence of hydraulic fractures. The front
development and front geometry were observed to be different with hydraulic fractures.
Acknowledgements
The authors would like to acknowledge financial support for the project from the U.S.
Department of Energy through the Utah Heavy Oil Program at the University of Utah under
grant #00056-55800308. The steam treatment simulations were performed using STARS from
the Computer Modeling Group, Calgary, Canada. The authors would like to thank CMG for
granting the Academic Licenses for their suite of reservoir simulators.
References
[1] Gwynn, J. W. Utah oil sands resources; presented at Western U.S. Oil Sands Conference, Salt
Lake City, UT, September 21, 2006, http://ds.heavyoil.utah.edu/dspace/handle/123456789/9892.
[2] Oblad, A. G.; Bunger, J. W.; Hanson, F. V.; Miller J. D.; Ritzma, H. R ; Seader J. D. Annual
Reviews in Energy 1987, 12, 283-356.
[3] Bichard, J. A. Oil Sands Composition and Behavior Research: The Research Papers of John
A. Bichard, 1957-1965; AOSTRA Technical Publication Series 4; Alberta Oil Sands Technology
and Research Authority: Edmonton, Alberta, 1987.
[4] Energy Resources Conservation Board, ST98-2008: Alberta’s energy reserves 2007 and
supply/demand outlook 2008-2017 (June 2008), http://www.ercb.ca/docs/products/sts/st98-
2008.pdf.
[5] Xia, X. T.; Greaves, M.; Upgrading Athabasca tar sand using toe-to-heel air injection;
SPE/CIM International Conference on Horizontal Well Technology, Calgary, Alberta, November
6-8, 2000; Society of Petroleum Engineers: Richardson, TX, 2000; SPE 65524.
[6] Allen, R.; Deo, M. D.; Isaacson, A. E.; Keiter, R. B.; Kessler, C.; Levey, R.; Oh, K. S.;
Smith, P. J.; Spinti, J. P.; Uchitel, K. A.; A technical, economic, and legal assessment of North
American heavy oil, oil sands, and oil shale resources: In response to Energy Policy Act of 2005

C-21
Section 369(p); Institute for Clean and Secure Energy, The University of Utah, September 2007,
http://ds.heavyoil.utah.edu/dspace/handle/123456789/4921.
[7] Settari, A.; Raisbeck, J.M.; Journal of Petroleum Technology 1981, 2201-2212.
[8] Deitrich, J.K.; SPE Reservoir Engineering 1986, 217-229.
[9] Meldau, R.F.; Shipley, R.G.; Coats, K.H.; Journal of Petroleum Technology 1981, 33(10)
1990-1998.
[10] Sandler, K.; Davis, P.; In situ bitumen overview and activity update in the Province of
Alberta; SPE/PS-CIM/CHOA International Thermal Operations and Heavy Oil Symposium,
Novermber 1-3, 2005, Calgary, Alberta; Society of Petroleum Engineers: Richardson, TX, 2005;
SPE 97800.
[11] Devon Canada Corporation. Dover SAGD progress review – Thermal heavy oil (April 28,
2005),
http://www.ercb.ca/docs/products/osprogressreports/2005/2005AthabascaDevonDoverSAGD905
.pdf (accessed January 11, 2010).
[12] Chu,.C.; Journal of Petroleum Technology 1982, 19-36.
[13] White, P.D.; Journal of Petroleum Technology 1985, 1943-1949.
[14] Kumar, M.; SPE Reservoir Engineering 1991, 46-54.
[15] Nodwell. J.; Moore, R.G.; Ursenbach, M.G.; Laureshsen, C.J.; Mehta, S.A.;
J. Cdn. Pet. Tech. 2000, 39, 34-41.
[16] Hansel, J.G.; Benning, M.A.; and Fernbacher, J.M.; Journal of Petroleum Technology,
1984,1139-44.
[17] Joseph, C; Pusch, W.H.; Journal of Petroleum Technology 1980, 1523-28.
[18] Garon, A.M.; Geisbrecht, R.A.; Lowry, W.E.; Journal of Petroleum Technology 1982,
2158-2166.
[19] STARS User’s Guide, 2006.10 ed., CMG, 2006.
[20] Gwynn W.; personal communication, 2007.
[21] Fu, Yang; Deo, M.; SPE 93292; Proc. Int. Oil Reservoir Symp., 2005; Society of Petroleum
Engineers, Dallas, Texas.
[22] Huang, C. K., “ Development of a General Thermal Oil Reservoir Simulator Under a
Modularized Framework”, Ph.D. thesis, University of Utah, Salt Lake City, UT, 2009.