appendix c. fastener characterization...
TRANSCRIPT
C-1
APPENDIX C. FASTENER CHARACTERIZATION
An integral component of the gusset plate testing program was the finite element analysis predictions. The methodology of constructing the finite element models relies predominately on the use of shell elements. However, to be computational efficient, the holes and fasteners between the members and gusset plate were not exclusively modeled. Instead, the fastener element capabilities built-in to Abaqus were used to represent the real fasteners. These elements assume each fastener is a line element with a tie constraint at each end having a radius of influence linking the line element to nodes on the plate within the radius of influence. These elements have the capability to model nonlinear behavior with slip by entering shear force versus shear displacement behavior into the element behavior.
As the overall NCHRP 12-84 project progressed, it became clear that additional testing of fasteners would be required to fully validate the fastener element behavior in the finite element models. The behavior data reported in the open literature for A490 and A325 bolts as well as A502 rivets was questionable for the purposes of NCHRP 12-84. Since the experimental gusset plate specimens used both A490 and A307 bolts, the following three facts of the legacy fastener tests highlight the questionability of that data:
1. No data for A307 bolts could be found.
2. All legacy fastener tests were performed in double shear. The fasteners in the gusset plate testing were in single shear.
3. Legacy fastener tests tended to use high strength plate to shear the experimental fasteners. Since holes are not being modeled for the gusset plate analysis, the force/deformation behavior of the fastener model needs to includes the effects of the hole deformation.
In addition, testing was performed to address concerns that the A307 bolts would serve as good surrogates for hot-driven rivets. Therefore, modern rivets were acquired and hot-driven at Turner-Fairbank. Legacy rivets were also acquired from various bridge rehabilitation projects to sample older rivet material. Both were tested in the same single shear mode as the A307 and A490 bolts to validate the assumption that A307 bolts could replicate hot-driven rivets.

C-2
MATERIALS
Bolts were ordered from LeJeune Bolt Company (Burnsville, MN). The first order contained enough bolts for use in the first six gusset plate specimens, and only those fasteners were tested. Table C1 outlines the type, quantity, and origin of the purchased bolts. F2280 bolts were purchased in lieu of A490 bolts, though they are equivalent, and will herein be referred to as A490 in this appendix.
The 3/8 and ½ inch thick sacrificial steel plates used in the experiments were attained from Potomac Steel in Virginia. The steel was specified as A36. Figure C1 shows the engineering stress/engineering strain curves for the four tensile coupons tested from this batch of steel taken longitudinal to the rolling direction. As seen in the figure, the steel had a yield strength of approximately 44.0 ksi, and tensile strength of 67.5 ksi. True stress versus true strain input decks for Abaqus based on these coupon tests can be found later in this appendix.
FHWA solicited owners for rivets being removed from decommissioned or rehabilitated bridges for testing purposes. Three sets of rivets were attained from Louisiana, Kansas, and New York. The Louisiana Department of Transportation and Development (LA DOTD) took rivets from the rehabilitation of the Huey P Long Bridge (here fourth referred to as HPL) in New Orleans, LA. The HPL opened to traffic in December, 1935. The rivets provided by New York came off an I-87 bridge built in 1959. The Kansas rivets were from an unknown bridge built in 1947. Based on the ages of these three bridges, the rivets should fall under the ASTM A141 specification.
TESTING MATRIX
The testing matrix was meant to explore the possible variations that could occur with the full-scale connections tests. In the full-scale joint tests, four of the five members (chords and diagonals) had 1.0 inch thick sideplates or flanges and the gusset plates were either 0.500 or 0.375 inch thick. Therefore, these plate sizes were used in the single shear fastener tests.
The testing matrix explored the effect of fastener grade, manufacturing lot, gusset plate thickness, edge distance, and fastener pattern.
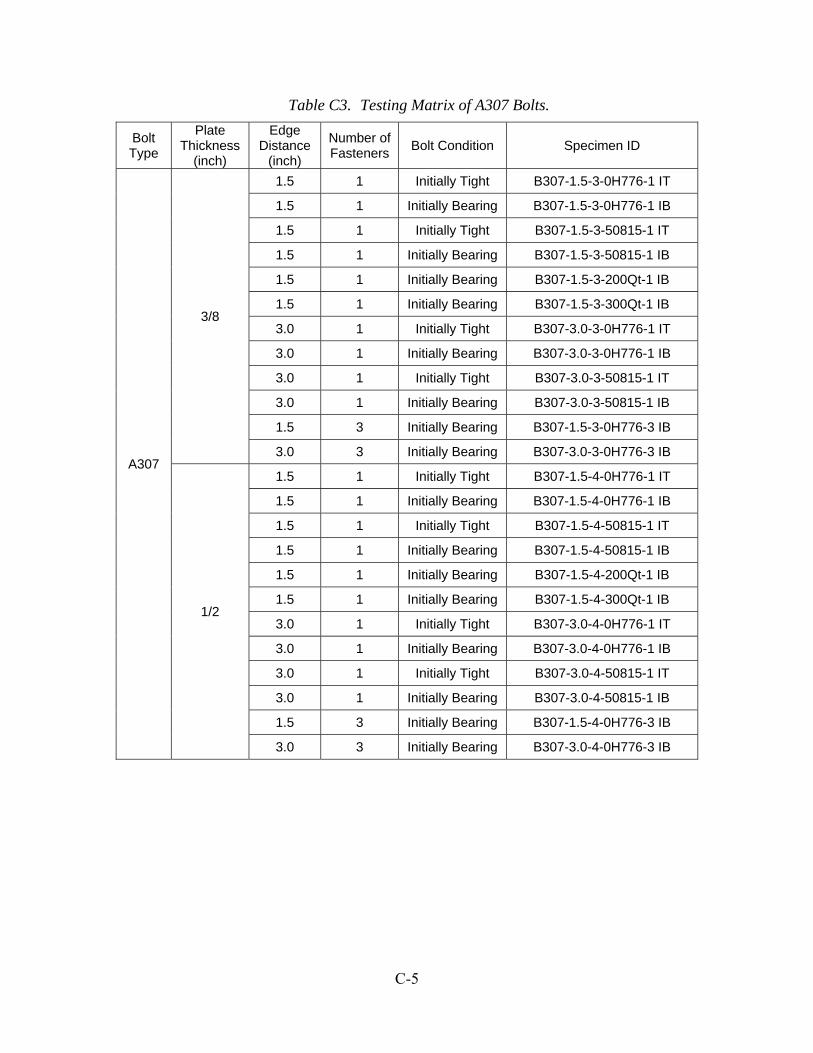
Tables C2 and C3 outline all the possible bolt arrangements that were tested. The tests are labeled as Bwww-x-y-zzzzz-p, where www is the bolt type, x refers to the edge distance (either 1.5 or 3.0 inch), y is the plate thickness in eighths of an inch (either 3 or 4 for ⅜” and ½” plate), zzzzz represents the last five characters in the alphanumeric lot designation from the bolt manufacturer, and p represents the number fasteners. Thus, the test with one A307 bolt from lot B0810H776 and a ⅜ inch plate with 3.0 inch edge distance will be B307-3.0-3-0H776-1. In addition, the fasteners were tested in two pre-test conditions; either initially tensioned (IT) or initially in bearing (IB) that will be described in more depth in the following sections.

C-3
Table C4 outlines the tests performed on the various rivet material. A similar naming designation was used to identify the specimens, but did not include lot number designations and bearing condition (all rivets were tested in a bearing condition).
Table C1. Quantities of Various Fasteners
Type Length Manufactures Lot # Quantity
A307 2-3/4” B0810H776 (Porteous Fastener)
810
A307 2-3/4” B08050815 (Porteous Fastener)
90
A307 2-3/4” Unknown (keg 1)
200
A307 2-3/4” Unknown (keg 2)
300
A307 2-1/4” Unknown 350
A307 3” Unknown 225
A490 2-1/4” MV711 (Unytite Inc.)
300
A490 2-3/4” ND031 (Unytite Inc.)
1500
A490 3” ND041 (Unytite Inc.)
275
A490 3-1/4” 47561C 200
A490 3-1/2” 31451A 350
Note: Shaded cells refer to those tested as part of this report

C-4
Figure C1. Mechanical data for Potomac Steel A36 steel.
Table C2. Testing Matrix of A490 Bolts.
Bolt Type
Plate Thickness
(inch)
Edge Distance
(inch)
Number of Fasteners
Bolt Condition Specimen ID
A490
3/8
1.5 1 Initially Tight B490-1.5-3-ND031-1 IT
1.5 1 Initially Bearing B490-1.5-3-ND031-1 IB
3.0 1 Initially Tight B490-3.0-3-ND031-1 IT
3.0 1 Initially Bearing B490-3.0-3-ND031-1 IB
1/2
1.5 1 Initially Tight B490-1.5-4-ND031-1 IT
1.5 1 Initially Bearing B490-1.5-4-ND031-1 IB
3.0 1 Initially Tight B490-3.0-4-ND031-1 IT
3.0 1 Initially Bearing B490-3.0-4-ND031-1 IB
Engineering Strain
0.00 0.05 0.10 0.15 0.20 0.25
En
gine
erin
g S
tres
s (k
si)
0
10
20
30
40
50
60
70
80
3/8" thick1/2" thick
C-5
Table C3. Testing Matrix of A307 Bolts.
Bolt Type
Plate Thickness
(inch)
Edge Distance
(inch)
Number of Fasteners
Bolt Condition Specimen ID
A307
3/8
1.5 1 Initially Tight B307-1.5-3-0H776-1 IT
1.5 1 Initially Bearing B307-1.5-3-0H776-1 IB
1.5 1 Initially Tight B307-1.5-3-50815-1 IT
1.5 1 Initially Bearing B307-1.5-3-50815-1 IB
1.5 1 Initially Bearing B307-1.5-3-200Qt-1 IB
1.5 1 Initially Bearing B307-1.5-3-300Qt-1 IB
3.0 1 Initially Tight B307-3.0-3-0H776-1 IT
3.0 1 Initially Bearing B307-3.0-3-0H776-1 IB
3.0 1 Initially Tight B307-3.0-3-50815-1 IT
3.0 1 Initially Bearing B307-3.0-3-50815-1 IB
1.5 3 Initially Bearing B307-1.5-3-0H776-3 IB
3.0 3 Initially Bearing B307-3.0-3-0H776-3 IB
1/2
1.5 1 Initially Tight B307-1.5-4-0H776-1 IT
1.5 1 Initially Bearing B307-1.5-4-0H776-1 IB
1.5 1 Initially Tight B307-1.5-4-50815-1 IT
1.5 1 Initially Bearing B307-1.5-4-50815-1 IB
1.5 1 Initially Bearing B307-1.5-4-200Qt-1 IB
1.5 1 Initially Bearing B307-1.5-4-300Qt-1 IB
3.0 1 Initially Tight B307-3.0-4-0H776-1 IT
3.0 1 Initially Bearing B307-3.0-4-0H776-1 IB
3.0 1 Initially Tight B307-3.0-4-50815-1 IT
3.0 1 Initially Bearing B307-3.0-4-50815-1 IB
1.5 3 Initially Bearing B307-1.5-4-0H776-3 IB
3.0 3 Initially Bearing B307-3.0-4-0H776-3 IB

C-6
Table C4. Testing Matrix of Hot-Driven Rivets.
Rivet Type Plate
Thickness (inch)
Edge Distance
(inch)
Number of Fasteners
Condition Finished Diameter (inch)
Specimen ID
Modern A502 Gr. 3
3/8 1.5 1 Hot driven 15/16 HD-1.5-3-1
3.0 1 Hot driven 15/16 HD-3.0-3-1
1/2 1.5 1 Hot driven 15/16 HD-1.5-4-1
3.0 1 Hot driven 0.937 HD-3.0-4-1
Louisiana (Huey P Long)
3/8 1.5 1 Machined 0.937 HPL-1.5-3-1 Ea
3.0 1 Machined 0.937 HPL-3.0-3-1 Ea
1/2 1.5 1 Machined 0.937 HPL-1.5-4-1 Ea
3.0 1 Machined 0.937 HPL-3.0-4-1 Ea
New York (I-87)
3/8
1.5 1 Machined 0.748 NY-1.5-3-1 Ea
1.5 1 Machined 0.748 NY -1.5-3-1
3.0 1 Machined 0.748 NY -3.0-3-1 Ea
3.0 1 Machined 0.748 NY -3.0-3-1
1/2
1.5 1 Machined 0.748 NY-1.5-4-1 Ea
1.5 1 Machined 0.748 NY -1.5-4-1
3.0 1 Machined 0.748 NY -3.0-4-1 Ea
3.0 1 Machined 0.748 NY -3.0-4-1
Kansas
3/8 1.5 1 Machined 0.748 KS-1.5-3-1
3.0 1 Machined 0.748 KS -3.0-3-1
1/2 1.5 1 Machined 0.748 KS -1.5-4-1
3.0 1 Machined 0.748 KS -3.0-4-1
a- “E” at end of label designates external threading

C-7
EXPERIMENTAL METHODS
The specimen configuration used is shown in Figure C2. This specimen can be gripped with the hydraulic grips in an Instron 110 kip universal testing machine. The specimen has two pieces, an upper and lower plate. The lower plate was reused through all the testing. To increase the robustness of the lower plate, it was machined from HPS70W steel, and the holes were lined with press-fit, case-hardened steel bushings. This plate is also 1 inch thick to coincide with four of the five connection members that had 1 inch thick side plates or flanges. The upper plate was meant to represent the gusset plates and all the test variations were explored with this plate. The upper plate was considered sacrificial and each fastener test used a new upper plate.
Once the bolts were tightened, the specimens were monotonically loaded in displacement control at a rate of 0.03 inches/minute. This generally caused failure of the fastener in about 15 minutes.
Two LVDTs were mounted to the lower pull plate 3.5 inches above the hydraulic grip. These LVDT’s were referenced to an aluminum bar clamped to the upper pull plate. The aluminum bar was clamped 3.5 inched below the upper hydraulic grip. In this configuration, the LVDTs measured the deformation of the fastener, hole deformation, and elastic elongation of the two pull plates. The two LVDTs and load were collected at 2 Hz using an Optim MegaDac data collection system.
A307 and A490 Bolts
The A307 and A490 bolts were tested in two different bearing conditions. One condition was to test the bolt in the initially tight condition. This was done by aligning the two holes in each of the plates with the testing machine in displacement control. The bolt was inserted and tightened with approximately 300 ft-lbs of torque for the A307 bolts or fully tensioned in the case of the A490 bolts. The second configuration placed the bolt initially in bearing. This was done by aligning the holes in the two plates and installing the bolt to a finger tight condition. Then in load control the testing machine applied 200 lbs of load and then the bolt was tightened (approximately 300 ft-lbs of torque for A307 bolts, and fully tensioned for the A490 bolts). The A490 bolts were tensioned by means of twisting the ends of the bolts off with a special shear wrench.
Modern Hot-Driven and Legacy Rivets
Three approaches were used to test rivets. First, modern undriven rivets were acquired to be hot-driven in the machine shop at Turner-Fairbank. The attained rivets were not graded, but hardness testing was performed on two undriven rivets. Hardness was sampled at nine positions distributed throughout the rivet cross-section. The average hardness between the two rivets was 86.2 HRB. According to the ASTM A502 specification, this hardness falls just outside the Grade 2 specification (HRB between 76 and 85), but is within the Grade 3 specification (HRB between 76 to 93). The rivets were heated to 1850 °F in a furnace and allowed to soak for 21 minutes before forming. The rivets were formed using a hydraulic press with a pressure relief

C-8
valve set to limit the force to 45 tons, verified with a NIST traceable load cell. The hot-driven rivets were driven through 15/16 inch nominal holes in the upper and lower pull plates.
The legacy rivets removed from real bridges were tested in one of two configurations shown in Figure C3. Configuration 1 was longer allowing for 3/4 inch external threading at each end of the specimen of a similar diameter to the test region. Rivet stock not long enough to produce the first configuration were machined into Configuration 2. The second configuration used a smaller diameter 5/16 inch internal thread. The disadvantage of the Configuration 2 is the decreased amount of pretension that could be applied through the rivet due to the smaller diameter thread pattern. Four rivets each from the Louisiana and New York bridges were machined in Configuration 1 and four rivets from Kansas and New York were machined into Configuration 2. The diameters of the machined rivet were either a nominal 3/4 or 15/16 inch depending upon the size and condition of the original rivet. In the case of the nominal 3/4 inch machined rivet, the drill bushing also had an inside diameter of 3/4 inch and the upper plate was drilled with a nominal 3/4 inch hole.
In either configuration, the rivets fit tightly into the holes of the test plates. The specimens with external threads were tightened with approximately 300 ft-lbs of torque. Those with internal threading had a much smaller torque of approximately 30 ft-lbs.

C-9
1 x 1 x 18 thkaluminum angle
RDP DCTH400AG(0.8" range LVDT)
Front View Back ViewSide View1.
5" o
r 3.
0" e
dge
dis
tanc
e
2 S
pa
. @ 2
.50
"
Figure C2. Testing configuration.

C-10
Configuration 2
Configuration 1
34" min. length
either 3 4"-16 threadingor 15
16"-14 threading
34" min. length
either 3 4"-16 threadingor 15
16"-14 threading
Slip-fit into drill bushing(~0.748" diameter)
Drill 1" deep andtap for 516"-24 thread
Drill 1" deep andtap for 516"-24 thread
Slip-fit into drill bushing(either ~0.748" or ~0.937" diameter)
Figure C3. Schematic of machined rivet specimen.

C-11
EXPERIMENTAL RESULTS
The results will be presented through load versus displacement plots. The load measured by the testing machine is the same as the shear force across the fastener. The reported displacement values are the average reading between the two LVDTs on each side of the specimen and accounts for the elastic elongation of the plate, hole deformation, and fastener deformation. The end of this appendix outlines a table for each test conducted. Within each table is a single load/displacement plot, a post-test picture outlining the yielding patterns (if any), peak load, and displacement at peak load.
A307 Bolts
Figure C4 shows the data for the A307 bolts tested in the initially tight configuration. The colors distinguish the different lots of bolts. The four curves in each color represent the full-factorial matrix of the edge distance and plate thickness variables. The differences within the factorial are very minor indicating the plate thickness and edge distance variables are insignificant in terms of the joint behavior. The initial and post-yielding stiffnesses have little variation too. However, major differences do exist between different lots of bolts. For this particular data, Lot 50815 has on average 3.6 kips more shear resistance than Lot 0H776. Since the bolts were initially tight, the slip between the two plates occurs at constant force because A307 cannot be tensioned like other bolt types.
Figure C5 shows the data for A307 bolts tested in the initial bearing condition. The same trends in the data appear as with bolts tested in the initially tight condition. That is, little differences arise in stiffnesses or displacement behavior through the matrix of plate thicknesses and edge distances. But the same variation of peak loads exists through the different lots of fasteners. In this case, more data is shown for two additional lots of bolts, but they fall within the bounds of the first two lots, outlining the possible strength variations with A307 bolts.
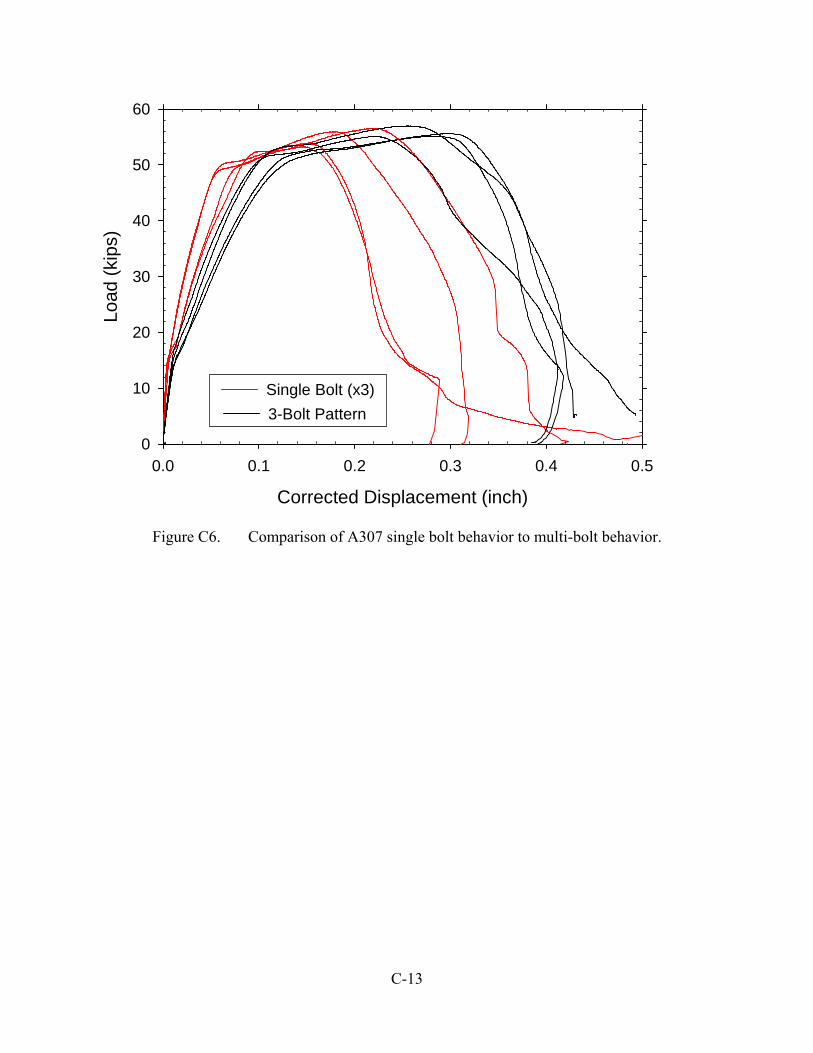
Figure C6 shows the effect of multiple fastener patterns. In this plot, the black lines represent the data from the 3-bolt patterns and the red lines are single bolts where the load data was multiplied by three. The peak loads between the two data sets show little coupling between multiple fasteners meaning single fastener results can be multiplied by the number of fasteners to determine total resistance. However, there were slight differences in the stiffnesses, with the multiple fastener patterns having less initial stiffness.
A summary of peak load, peak stress, and displacement at peak load are summarized in Table C5. An additional four specimens are reflected in this table than in the previous four figures representing the test performed on the unmarked lots of bolts received. For each lot of bolt and initial condition, an average and coefficient of variation (COV) is presented for load, stress, and displacement. Since the results are independent of the plate thickness and edge distance, the overall average of stress and displacement presented at the bottom of the table would be telling for a random A307 bolt with an unknown bearing condition. In this case, a random A307 bolt would be expected to fail with 44.1 ksi of shear stress at a shear displacement of 0.19 inches.

C-12
Figure C4. Behavior of A307 bolts initially tight.
Figure C5. Behavior of A307 bolts initially bearing.
Displacement (inch)
0.0 0.1 0.2 0.3 0.4 0.5
Load
(ki
ps)
0
5
10
15
20
25
30
Lot 0H776
Lot 50815
Displacement (inch)
0.0 0.1 0.2 0.3 0.4 0.5
Load
(ki
ps)
0
5
10
15
20
25
30
Lot 0H776
Lot 50815
Lot 300Qt
Lot 200Qt
C-13
Figure C6. Comparison of A307 single bolt behavior to multi-bolt behavior.
Corrected Displacement (inch)
0.0 0.1 0.2 0.3 0.4 0.5
Load
(ki
ps)
0
10
20
30
40
50
60
Single Bolt (x3)
3-Bolt Pattern

C-14
Table C5. Select Results From A307 Bolts
Bolt Type Edge
Distance (inch)
Plate Thickness
(inch)
Peak Load (kips)
Peak Stress (ksi)
Displacement at Peak Load
(inch)
Initially Bearing
(Lot 0H776)
1.5 3/8 18.9 40.9 0.182
1.5 1/2 17.9 38.7 0.151
3.0 3/8 18.9 40.9 0.180
3.0 1/2 17.8 38.5 0.149
Average 18.4 39.8 0.166
Coefficient of Variation 0.03 0.11
Initially Tight (Lot 0H776)
1.5 3/8 19.2 41.6 0.294
1.5 1/2 18.3 39.6 0.243
3.0 3/8 18.6 40.3 0.231
3.0 1/2 19.0 41.1 0.254
Average 18.8 40.6 0.256
Coefficient of Variation 0.02 0.11
Initially Bearing
(Lot 50815)
1.5 3/8 22.1 47.8 0.167
1.5 1/2 21.5 46.5 0.131
3.0 3/8 22.4 48.5 0.143
3.0 1/2 22.4 48.5 0.143
Average 22.1 47.8 0.146
Coefficient of Variation 0.02 0.10
Initially Tight (Lot 50815)
1.5 3/8 22.8 49.4 0.246
1.5 1/2 22.1 47.8 0.235
3.0 3/8 21.7 47.0 0.218
3.0 1/2 22.9 49.6 0.219
Average 22.4 48.4 0.230
Coefficient of Variation 0.03 0.06
Initially Bearing
(Unknown Lots)
1.5 3/8 19.3 41.8 0.158
1.5 3/8 20.62 44.6 0.186
1.5 1/2 19.9 43.1 0.165
1.5 1/2 21.2 45.9 0.164
Average 20.3 43.8 0.168
Coefficient of Variation 0.04 0.07
Overall Average 20.4 44.1 0.19
Overall Coefficient of Variation
0.09 0.24

C-15
A490
Only eight tests were conducted using A490 bolts, all were the same length from the same lot. The data from the tests with the bolt initially tight are shown in Figure C7 and for the bolt initially in bearing shown in Figure C8. Unlike the testing of the A307 bolts, the behavior was highly dependant upon the plate thickness and hole edge distance. In general, the specimens with 1.5 inch edge distances had the lowest peak loads (though the ½ inch plate showing obvious higher strength than the 3/8 inch plate). In these cases, the majority of the deformation was in the steel plate as the hole ovalized and eventually failure was tearing of the steel plate.
Higher peak loads were attained in specimens with 3.0 inch hole edge distances. Each of these specimens still showed a lot of hole ovalization and distributed yielding, however the larger edge distance constrained the material against a tearing failure of the plate. In these specimens, ultimate failure was shear of the fastener.
Table C6 outlines the peak load, peak stress, and displacement at peak load data for all the A490 bolt tests. The failure of the two tests with 1.5 inch edge distance and 3/8 inch thick plates was tearing of the plate rather than shearing of the bolts. This biases the overall statistics presented at the bottom of the table because the remaining six tests resulted in shearing of the fastener. Ignoring the two specimens with plate tearing mode, the A490 bolts failed at an average peak stress of 94.6 ksi and a shear displacement of 0.59 inches. For the tearing mode, the system on average failed at a fastener stress of 66.7 ksi and a shear displacement of 0.63

C-16
Figure C7. Behavior of A490 bolts initially tight.
Displacement (inch)
0.0 0.1 0.2 0.3 0.4 0.5 0.6 0.7 0.8
Load
(ki
ps)
0
10
20
30
40
50
60
A490_1.5_3A490_1.5_4A490_3.0_3A490_3.0_4

C-17
Figure C8. Behavior of A490 bolts initially bearing.
Table C6. Select Result From A490 Bolts.
Bolt Type Edge
Distance (inch)
Plate Thickness
(inch)
Peak Load (kips)
Peak Stress (ksi)
Displacement at Peak Load
(inch)
Initially Bearing
1.5 3/8 40.0 66.5 0.584
1.5 1/2 53.6 89.1 0.746
3.0 3/8 58.3 97.0 0.639
3.0 1/2 58.8 97.8 0.325
Average 52.7 87.6 0.574
Coefficient of Variation 0.17 0.31
Initially Tight
1.5 3/8 40.2 66.9 0.681
1.5 1/2 55.1 91.6 0.728
3.0 3/8 57.1 95.0 0.696
3.0 1/2 58.5 97.3 0.399
Average 52.7 87.7 0.626
Coefficient of Variation 0.16 0.24
Displacement (inch)
0.0 0.1 0.2 0.3 0.4 0.5 0.6 0.7 0.8
Load
(ki
ps)
0
10
20
30
40
50
60
B490_1.5_3B490_1.5_4B490_3.0_3B490_3.0_4

C-18
Modern and Legacy Rivets
The load-displacement plots for the modern A502 hot-driven rivets are shown in Figure C9 and in Figure C10 for the machined Louisiana rivets. For these eight specimens, there are no trends in the peak load and ductility behavior, indicating that the deformation is concentrated in the fastener and independent of the plate thickness and edge distance. The only exception is the two Louisiana specimens tested with 3/8 inch thick plate showed a little more ductility than their 1/2 inch counterparts.
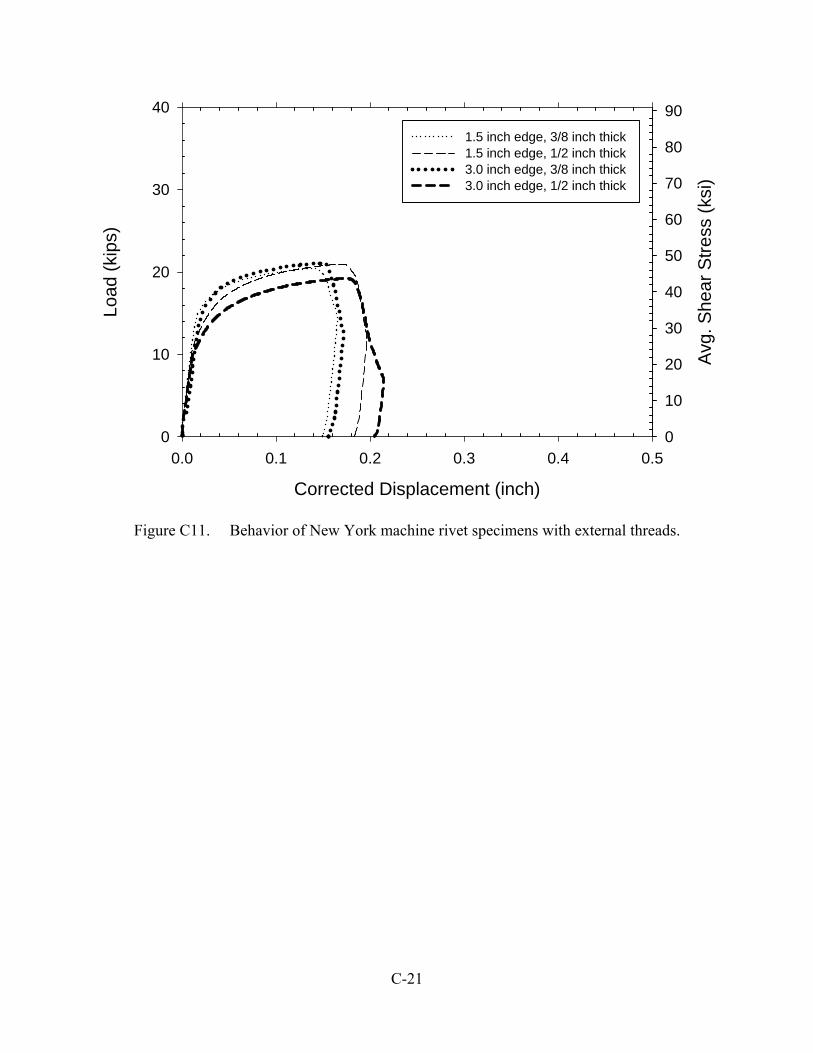
The load-displacement plots for the eight New York machined rivets are shown in Figures C11 and C12 respectively for those machined into Configuration 1 and 2. Inspecting the tables at the end of this appendix it can be seen that the holes still remained round at the conclusion of the test, indicating there was little to no yielding in the upper plate, hence the independence of behavior from plate thickness and edge distance. However, there was a notable post-test difference in the rivets machined into Configuration 1 and 2. The external threading with Configuration 1 allowed significantly more pretension to clamp the two plates together, thus forcing a more pure shear failure along a single plane. Compare this to pictures of the Configuration 2 specimens that developed a small gap between two shear planes allowing some bending to occur through the fastener instead of pure shear. This phenomenon arises because the internal threaded fasteners (Configuration 2) cannot apply much preload to the rivet and prevent the two plates from prying apart.
One outlier was the Configuration 2 specimen tested with 1.5 inch edge distance and a 1/2 inch this plate. This was the first Configuration 2 specimen tested and used standard washers. Ultimately, the washers were very compliant and the two plates pried apart excessively for this specimen and could explain the unusually high strength of this specimen. All Configuration 2 specimens tested after this used a thick plate washer and did not pry as much as the first. Excluding this one specimen, the NY Configuration 1 specimens have an average strength and COV of 46.5 ksi (4%) where the Configuration 2 specimens had an average and COV of 43.4 ksi (3%). Therefore, specimens machined into Configuration 2 exhibit a 3.1 ksi reduction in strength.
The load-displacement plots for the Kansas machined rivets are shown in Figure C13. These specimens did show a small trend that the 1/2 inch thick pull plates showed slightly more strength. On average, these rivets showed and average strength of 45.0 ksi.
Table C7 outlines the peak load, peak stress, and displacement at peak load data for all the rivets tested. Overall averages are presented at the bottom of that table, showing all the rivet specimens had and average peak shear stress of 46.9 ksi at a displacement of 0.22 inches. Recall, the overall averages for the A307 bolts was 44.1 ksi at 0.19 inches of displacement, indicating in an average sense that A307 bolts are good substitutes for hot-driven rivets. Figure C14 plots all the A307 bolts initially in bearing along with all the rivet specimens. Despite a

C-19
similitude of peak shear stresses and displacements, the A307 bolts exhibit a distinct bilinear behavior whereas the rivet show a much more gradual softening behavior.
Figure C9. Behavior of modern A502 hot-driven rivets.
Corrected Displacement (inch)
0.0 0.1 0.2 0.3 0.4 0.5
Load
(ki
ps)
0
10
20
30
40
Avg
. Sh
ear
Str
ess
(ksi
)
0
10
20
30
40
50
1.5 inch edge, 3/8 inch thick1.5 inch edge, 1/2 inch thick 3.0 inch edge, 3/8 inch thick 3.0 inch edge, 1/2 inch thick

C-20
Figure C10. Behavior of Louisiana machined rivet specimens.
Corrected Displacement (inch)
0.0 0.1 0.2 0.3 0.4 0.5
Load
(ki
ps)
0
10
20
30
40
Avg
. She
ar S
tres
s (k
si)
0
10
20
30
40
50
1.5 inch edge, 3/8 inch thick1.5 inch edge, 1/2 inch thick3.0 inch edge, 3/8 inch thick3.0 inch edge, 1/2 inch thick
C-21
Figure C11. Behavior of New York machine rivet specimens with external threads.
Corrected Displacement (inch)
0.0 0.1 0.2 0.3 0.4 0.5
Load
(ki
ps)
0
10
20
30
40
Avg
. Sh
ear
Str
ess
(ks
i)
0
10
20
30
40
50
60
70
80
90
1.5 inch edge, 3/8 inch thick 1.5 inch edge, 1/2 inch thick3.0 inch edge, 3/8 inch thick 3.0 inch edge, 1/2 inch thick

C-22
Figure C12. Behavior of New York machined rivets with internal threads.
Corrected Displacement (inch)
0.0 0.1 0.2 0.3 0.4 0.5
Load
(ki
ps)
0
10
20
30
40
Avg
. She
ar S
tres
s (k
si)
0
10
20
30
40
50
60
70
80
90
1.5 inch edge, 3/8 inch thick 1.5 inch edge, 1/2 inch thick 3.0 inch edge, 3/8 inch thick 3.0 inch edge, 1/2 inch thick

C-23
Figure C13. Behavior of Kansas machined rivets with internal threads.
Corrected Displacement (inch)
0.0 0.1 0.2 0.3 0.4 0.5
Load
(ki
ps)
0
10
20
30
40
Avg
. She
ar S
tres
s (k
si)
0
10
20
30
40
50
60
70
80
90
1.5 inch edge, 3/8 inch thick1.5 inch edge, 1/2 inch thick3.0 inch edge, 3/8 inch thick 3.0 inch edge, 1/2 inch thick

C-24
Table C7. Select Results From Tested Rivets
Bolt Type Edge
Distance (inch)
Plate Thickness
(inch)
Peak Load (kips)
Peak Stress (ksi)
Displacement at Peak Load
(inch)
Hot Driven Rivets (A502)
1.5 3/8 35.3 51.1 0.283
1.5 1/2 36.2 52.4 0.279
3.0 3/8 35.0 50.7 0.250
3.0 1/2 36.0 52.2 0.222
Average 35.6 51.6 0.259
Coefficient of Variation 0.02 0.11
Louisiana Configuration
1 (A141)
1.5 3/8 32.3 46.8 0.391
1.5 1/2 30.3 43.9 0.268
3.0 3/8 33.5 48.6 0.290
3.0 1/2 30.9 44.8 0.262
Average 31.8 46.0 0.303
Coefficient of Variation 0.05 0.20
New York Configuration
1 (A141)
1.5 3/8 20.5 46.6 0.139
1.5 1/2 21.1 47.9 0.172
3.0 3/8 21.0 47.7 0.144
3.0 1/2 19.2 43.7 0.169
Average 20.5 46.5 0.156
Coefficient of Variation 0.04 0.11
New York Configuration
2 (A141)
1.5 3/8 19.8 45.1 0.203
1.5 1/2 22.8 51.9 0.232
3.0 3/8 18.8 42.8 0.190
3.0 1/2 18.6 42.3 0.167
Average 20.0 45.5 0.198
Coefficient of Variation 0.10 0.14
Kansas Configuration
2 (A141)
1.5 3/8 18.6 42.3 0.232
1.5 3/8 20.6 46.9 0.213
1.5 1/2 18.9 43.0 0.158
1.5 1/2 21.0 47.8 0.212
Average 19.8 45.0 0.212
Coefficient of Variation 0.06 0.16
Overall Average N/A 46.9 0.22
Overall Coefficient of Variation
N/A 0.07 0.27

C-25
Figure C14. Comparison of rivet behavior to A307 bolts.
Corrected Displacement (inch)
0.0 0.1 0.2 0.3 0.4 0.5
Ave
rage
She
ar S
tres
s (k
si)
0
10
20
30
40
50
60
LA (1939, A141, 15/16"dia.)Modern A502 Rivet (15/16" dia.)NY (1959, A141, 3/4" dia.)KS (1947, A141, 3/4" dia.)A307 bolts

C-26
CALIBRATION OF FASTENER MODELS
The major outcome of this study was to determine the inputs needed to define the single shear behavior for a fastener model to be used in the modeling of the experimental connection. Finite element modeling was performed with the Abaqus software. When full-scale gusset plate tests are modeled, it is computationally desirable to use only shell elements and not model the individual holes, instead modeling the bolts with just Abaqus fastener elements. These are single elements meant to join two different surfaces. The fasteners can attach to either nodes or multiple nodes through surface based tie constraints.
The fastener element calibration was performed by creating a finite element model of the single shear test frame. Only Abaqus S4R shell elements were used to represent the two plates. Holes were not modeled in either of the two plates. Boundary conditions were applied to the areas of the plate that were clamped with the hydraulic grips, assuming the upper grip was rigid and the lower grip was a guided support. A fastener element was added between two rigid points placed at the center point of the holes. Four additional rigid points were added to the model representing the points the LVDTs attached to during the experimental tests, for the purposes of extracting displacement output from the model. The lower plate was modeled with elastic properties, the upper plate was modeled with nonlinear material properties using the *PLASTIC command and the tensile coupon data shown in Figure C1.
The final Abaqus input parameters for the fastener models can be found in the sections to follow. The complete fastener model is actually a hybrid CARTESIAN and ALIGN connector element, meaning the element only has three available translation degrees of freedom, the three rotations are locked together. Fastener interactions are also used to define a linearly distributed radius of influence of 0.75 inches. This describes the surface based tie constraint Abaqus assigns to the two surfaces around the point defining the fastener element end. In this case, a surface constraint forces the nodes within the radius of influence on the surface to deform together, though weighted linearly with nodes closer to the fastener being more influential. This is meant to represent the extra stiffness of the bolt head or nut on the two surfaces.
The experimental results for the A307 bolts showed little influence of plate thickness and edge distance, but a considerable scatter associated with the bolt lot. To capture this, it was best to define upper and lower bound models encompassing all the A307 results, rather than for the individual tests. The fit of the two fastener models is shown against the experimental data in Figure C15.
The A490 bolts tested were all from the same lot, and unlike the A307 bolts, were highly dependent upon the edge distance and plate thickness. For this reason, four separate fastener models were created to represent the A490 fasteners. The fastener models were fit to the initially tight datasets assuming that this would be the condition tested in the full-scale gusset plate tests. Figure C16 shows the four model fits against a backdrop of the real data.

C-27
Figure C15. Comparison to A307 experimental data to fastener model.
Displacement (inch)
0.00 0.05 0.10 0.15 0.20 0.25
Load
(ki
ps)
0
5
10
15
20
25
30
All A307 Experimental DataLower Bound Fastener ModelUpper Bound Fastener Model
C-28
Figure C16. Comparison to A490 experimental data to fastener models.
Displacement (inch)
0.0 0.1 0.2 0.3 0.4 0.5 0.6 0.7 0.8
Load
(ki
ps)
0
10
20
30
40
50
60
A490_1.5_3A490_1.5_4 A490_3.0_3 A490_3.0_4

C-29
ABAQUS INPUTS
The following sections outline the input decks used in the Abaqus input files for the calibration of the fastener element models.
Nonlinear Material Models
**3/8” thick material from Potomac Steel used to make pull plates for bolt testing. Data **based on testing of two tension coupons *MATERIAL, NAME="0.5 inch A36" *ELASTIC 29000., 0.3 *PLASTIC 45., 0. 45.77, 0.0141 51.31, 0.0213 57.38, 0.0317 62.85, 0.0468 67.64, 0.0644 70.86, 0.0803 73.93, 0.0996 77.23, 0.1283 79.25, 0.1596 ** **1/2” thick material from Potomac Steel used to make pull plates for bolt testing. Data **based on testing two tension coupons *MATERIAL, NAME="0.375 inch A36" *ELASTIC 29000., 0.3 *PLASTIC 44., 0. 45.02, 0.0181 48.99, 0.0228 54.31, 0.031 59.48, 0.0435 65.24, 0.0618 70.34, 0.0857 74.76, 0.1151 77.15, 0.1363 79.7, 0.172

C-30
Fastener Models
**the parameters below are the same for all fasteners ** ** POINT-BASED FASTENER: Fasteners-1 *FASTENER PROPERTY, NAME=Fasteners-1 0.4375 *CONNECTOR SECTION, ELSET=_Fasteners-1_pf_, BEHAVIOR=(see following) Cartesian, Align, *FASTENER, INTERACTION NAME=Fasteners-1, PROPERTY=Fasteners-1, REFERENCE NODE SET="Fastener Points", ELSET=_Fasteners-1_pf_, COUPLING=STRUCTURAL, ATTACHMENT METHOD=FACETOFACE, WEIGHTING METHOD=LINEAR, ADJUST ORIENTATION=YES, RADIUS OF INFLUENCE=0.75 A490 bolt through 3/8” plate and 1.5” edge distance
*CONNECTOR BEHAVIOR, NAME=B490_1.5_3 *CONNECTOR ELASTICITY, COMPONENT=1 3000., * CONNECTOR ELASTICITY, COMPONENT =2 3000., * CONNECTOR ELASTICITY, COMPONENT =3 9744., *CONNECTOR PLASTICITY, COMPONENT=1 *CONNECTOR HARDENING, DEFINITION=TABULAR 15, 0, 0 32.5, 0.15, 0 39, 0.35, 0 40, 0.69, 0 *CONNECTOR PLASTICITY, COMPONENT=2 *CONNECTOR HARDENING, DEFINITION=TABULAR 15, 0, 0 32.5, 0.15, 0 39, 0.35, 0 40, 0.69, 0 *CONNECTOR DAMAGE INITIATION, COMPONENT=1, CRITERION=MOTION -0.7, 0.7 * CONNECTOR DAMAGE EVOLUTION, TYPE=MOTION, AFFECTED COMPONENTS 1, 2 0., *CONNECTOR DAMAGE INITIATION, COMPONENT=2, CRITERION=MOTION -0.7, 0.7 * CONNECTOR DAMAGE EVOLUTION, TYPE=MOTION, AFFECTED COMPONENTS 1, 2 0.,

C-31
A490 bolt through 1/2” plate and 1.5” edge distance
*CONNECTOR BEHAVIOR, NAME=B490_1.5_4 *CONNECTOR ELASTICITY, COMPONENT=1 3000., * CONNECTOR ELASTICITY, COMPONENT =2 3000., * CONNECTOR ELASTICITY, COMPONENT =3 9744., *CONNECTOR PLASTICITY, COMPONENT=1 *CONNECTOR HARDENING, DEFINITION=TABULAR 15, 0, 0 42.25, 0.15, 0 52, 0.35, 0 55, 0.7, 0 *CONNECTOR PLASTICITY, COMPONENT=2 *CONNECTOR HARDENING, DEFINITION=TABULAR 15, 0, 0 42.25, 0.15, 0 52, 0.35, 0 55, 0.7, 0 *CONNECTOR DAMAGE INITIATION, COMPONENT=1, CRITERION=MOTION -0.7, 0.7 * CONNECTOR DAMAGE EVOLUTION, TYPE=MOTION, AFFECTED COMPONENTS 1, 2 0., *CONNECTOR DAMAGE INITIATION, COMPONENT=2, CRITERION=MOTION -0.7, 0.7 * CONNECTOR DAMAGE EVOLUTION, TYPE=MOTION, AFFECTED COMPONENTS 1, 2 0.,

C-32
A490 bolt through 3/8” plate and 3.0” edge distance
*CONNECTOR BEHAVIOR, NAME=B490_3.0_3 *CONNECTOR ELASTICITY, COMPONENT=1 3000., * CONNECTOR ELASTICITY, COMPONENT =2 3000., * CONNECTOR ELASTICITY, COMPONENT =3 9744., *CONNECTOR PLASTICITY, COMPONENT=1 *CONNECTOR HARDENING, DEFINITION=TABULAR 15, 0, 0 45, 0.15, 0 53, 0.35, 0 57, 0.7, 0 *CONNECTOR PLASTICITY, COMPONENT=2 *CONNECTOR HARDENING, DEFINITION=TABULAR 15, 0, 0 45, 0.15, 0 53, 0.35, 0 57, 0.7, 0 *CONNECTOR DAMAGE INITIATION, COMPONENT=1, CRITERION=MOTION -0.7, 0.7 * CONNECTOR DAMAGE EVOLUTION, TYPE=MOTION, AFFECTED COMPONENTS 1, 2 0., *CONNECTOR DAMAGE INITIATION, COMPONENT=2, CRITERION=MOTION -0.7, 0.7 * CONNECTOR DAMAGE EVOLUTION, TYPE=MOTION, AFFECTED COMPONENTS 1, 2 0.,

C-33
A490 bolt through 1/2” plate and 3.0” edge distance
*CONNECTOR BEHAVIOR, NAME=B490_3.0_4 *CONNECTOR ELASTICITY, COMPONENT=1 3000., * CONNECTOR ELASTICITY, COMPONENT =2 3000., * CONNECTOR ELASTICITY, COMPONENT =3 9744., *CONNECTOR PLASTICITY, COMPONENT=1 *CONNECTOR HARDENING, DEFINITION=TABULAR 15, 0, 0 49, 0.15, 0 57.5, 0.25, 0 58, 0.37, 0 *CONNECTOR PLASTICITY, COMPONENT=2 *CONNECTOR HARDENING, DEFINITION=TABULAR 15, 0, 0 49, 0.15, 0 57.5, 0.25, 0 58, 0.37, 0 *CONNECTOR DAMAGE INITIATION, COMPONENT=1, CRITERION=MOTION -0.37, 0.37 * CONNECTOR DAMAGE EVOLUTION, TYPE=MOTION, AFFECTED COMPONENTS 1, 2 0., *CONNECTOR DAMAGE INITIATION, COMPONENT=2, CRITERION=MOTION -0.37, 0.37 * CONNECTOR DAMAGE EVOLUTION, TYPE=MOTION, AFFECTED COMPONENTS 1, 2 0.,

C-34
A307 bolt upper bound model
*CONNECTOR BEHAVIOR, NAME=A307 Upper Bound *CONNECTOR ELASTICITY, COMPONENT=1 3000., * CONNECTOR ELASTICITY, COMPONENT =2 3000., * CONNECTOR ELASTICITY, COMPONENT =3 9744., *CONNECTOR PLASTICITY, COMPONENT=1 *CONNECTOR HARDENING, DEFINITION=TABULAR 5.5, 0, 0 21.5, 0.053, 0 23.5, 0.1572, 0 *CONNECTOR PLASTICITY, COMPONENT=2 *CONNECTOR HARDENING, DEFINITION=TABULAR 5.5, 0, 0 21.5, 0.053, 0 23.5, 0.1572, 0 *CONNECTOR DAMAGE INITIATION, COMPONENT=1, CRITERION=MOTION -0.1572, 0.1572 * CONNECTOR DAMAGE EVOLUTION, TYPE=MOTION, AFFECTED COMPONENTS 1, 2 0., *CONNECTOR DAMAGE INITIATION, COMPONENT=2, CRITERION=MOTION -0.1572, 0.1572 * CONNECTOR DAMAGE EVOLUTION, TYPE=MOTION, AFFECTED COMPONENTS 1, 2 0.,

C-35
A307 bolt lower bound model
*CONNECTOR BEHAVIOR, NAME=A307 Lower Bound *CONNECTOR ELASTICITY, COMPONENT=1 3000., * CONNECTOR ELASTICITY, COMPONENT =2 3000., * CONNECTOR ELASTICITY, COMPONENT =3 9744., *CONNECTOR PLASTICITY, COMPONENT=1 *CONNECTOR HARDENING, DEFINITION=TABULAR 4.5, 0, 0 16, 0.058, 0 18, 0.1603, 0 *CONNECTOR PLASTICITY, COMPONENT=2 *CONNECTOR HARDENING, DEFINITION=TABULAR 4.5, 0, 0 16, 0.058, 0 18, 0.1603, 0 *CONNECTOR DAMAGE INITIATION, COMPONENT=1, CRITERION=MOTION -0.1603, 0.1603 * CONNECTOR DAMAGE EVOLUTION, TYPE=MOTION, AFFECTED COMPONENTS 1, 2 0., *CONNECTOR DAMAGE INITIATION, COMPONENT=2, CRITERION=MOTION -0.1603, 0.1603 * CONNECTOR DAMAGE EVOLUTION, TYPE=MOTION, AFFECTED COMPONENTS 1, 2 0.,

C-36
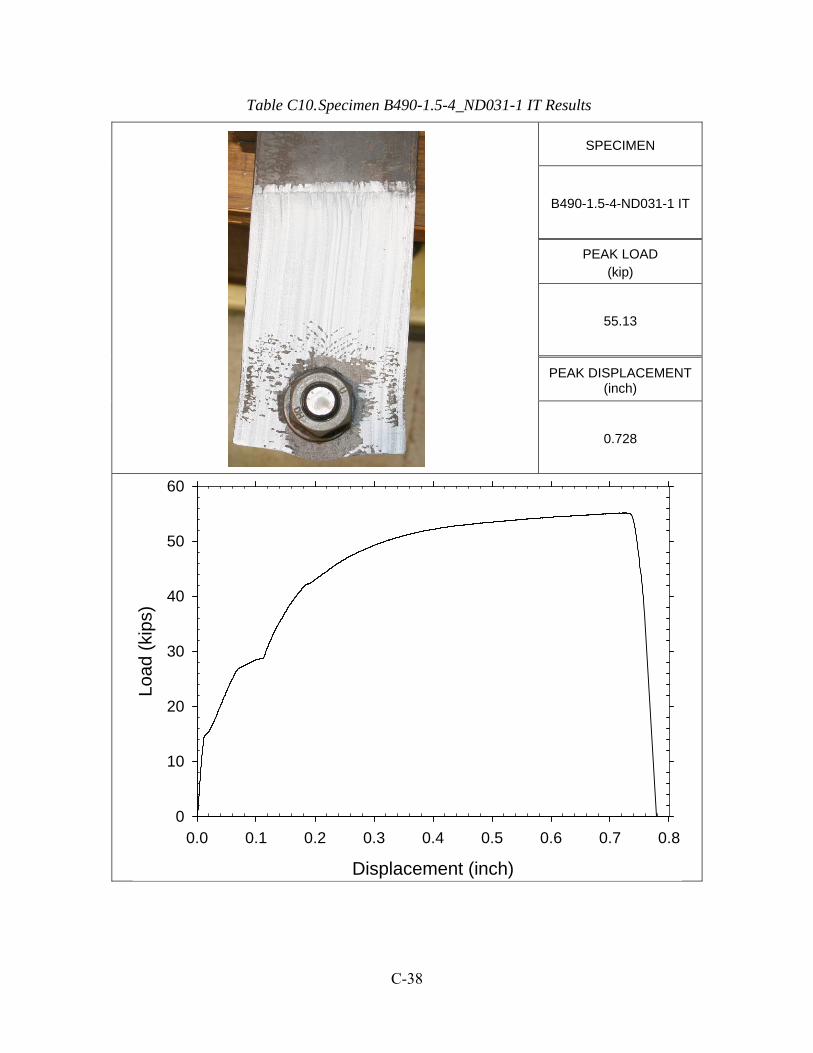
Table C8. Specimen B490-1.5-3-ND031-1 IT Results
SPECIMEN
B490-1.5-3-ND031-1 IT
PEAK LOAD (kip)
40.24
PEAK DISPLACEMENT (inch)
0.681
Displacement (inch)
0.0 0.1 0.2 0.3 0.4 0.5 0.6 0.7 0.8
Load
(ki
ps)
0
10
20
30
40
50
60

C-37
Table C9. Specimen B490-1.5-3-ND031-1 IB Results
SPECIMEN
B490-1.5-3-ND031-1 IB
PEAK LOAD (kip)
39.96
PEAK DISPLACEMENT (inch)
0.584
Displacement (inch)
0.0 0.1 0.2 0.3 0.4 0.5 0.6 0.7 0.8
Load
(ki
ps)
0
10
20
30
40
50
60
C-38
Table C10. Specimen B490-1.5-4_ND031-1 IT Results
SPECIMEN
B490-1.5-4-ND031-1 IT
PEAK LOAD (kip)
55.13
PEAK DISPLACEMENT (inch)
0.728
Displacement (inch)
0.0 0.1 0.2 0.3 0.4 0.5 0.6 0.7 0.8
Load
(ki
ps)
0
10
20
30
40
50
60

C-39
Table C11. Specimen B490-1.5-4_ND031-1 IB Results
SPECIMEN
B490-1.5-4-ND031-1 IB
PEAK LOAD (kip)
53.64
PEAK DISPLACEMENT (inch)
0.746
Displacement (inch)
0.0 0.1 0.2 0.3 0.4 0.5 0.6 0.7 0.8
Load
(ki
ps)
0
10
20
30
40
50
60

C-40
Table C12. Specimen B490-3.0-3_ND031-1 IT Results
SPECIMEN
B490-3.0-3-ND031-1 IT
PEAK LOAD (kip)
57.08
PEAK DISPLACEMENT (inch)
0.696
Displacement (inch)
0.0 0.1 0.2 0.3 0.4 0.5 0.6 0.7 0.8
Load
(ki
ps)
0
10
20
30
40
50
60

C-41
Table C13. Specimen B490-3.0-3_ND031-1 IB Results
SPECIMEN
B490-3.0-3-ND031-1 IB
PEAK LOAD (kip)
58.27
PEAK DISPLACEMENT (inch)
0.639
Displacement (inch)
0.0 0.1 0.2 0.3 0.4 0.5 0.6 0.7 0.8
Load
(ki
ps)
0
10
20
30
40
50
60
C-42
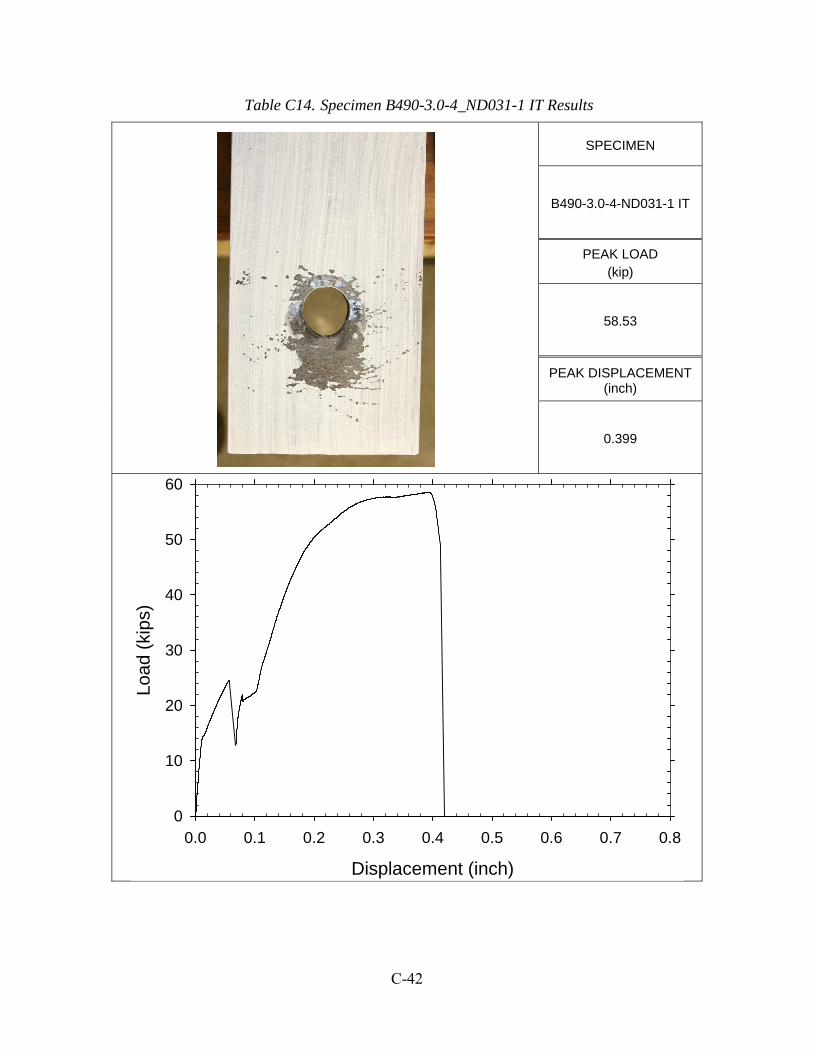
Table C14. Specimen B490-3.0-4_ND031-1 IT Results
SPECIMEN
B490-3.0-4-ND031-1 IT
PEAK LOAD (kip)
58.53
PEAK DISPLACEMENT (inch)
0.399
Displacement (inch)
0.0 0.1 0.2 0.3 0.4 0.5 0.6 0.7 0.8
Load
(ki
ps)
0
10
20
30
40
50
60
C-43
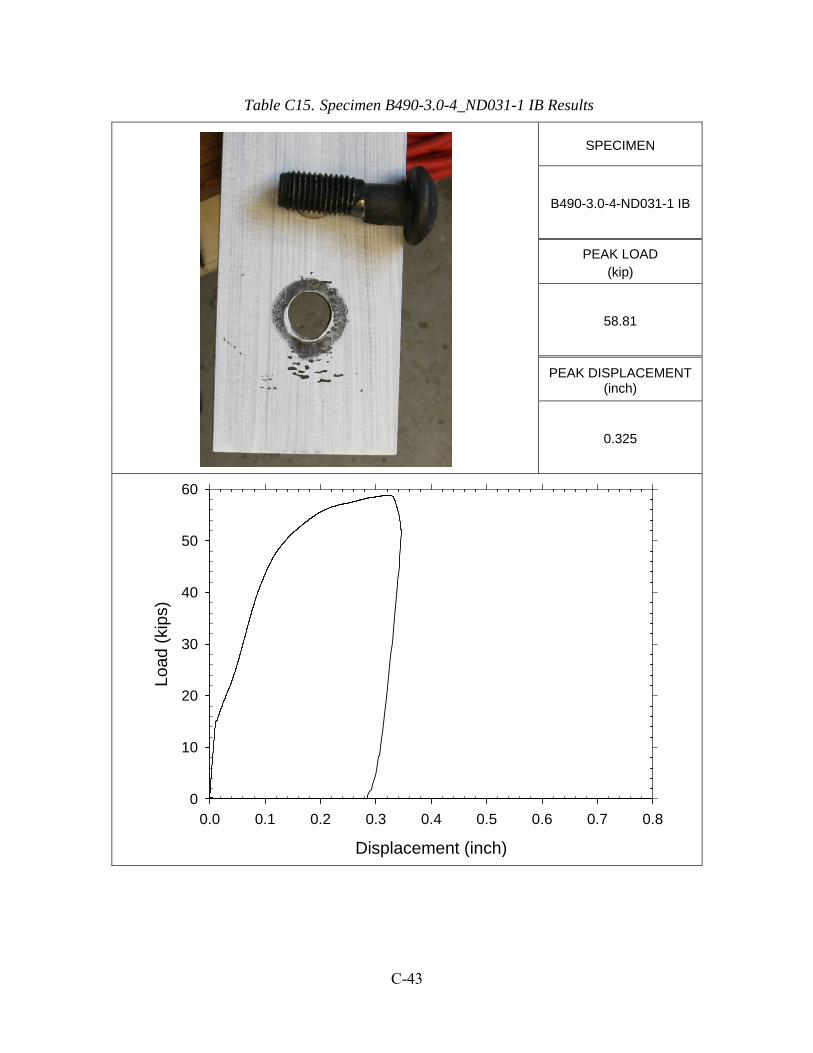
Table C15. Specimen B490-3.0-4_ND031-1 IB Results
SPECIMEN
B490-3.0-4-ND031-1 IB
PEAK LOAD (kip)
58.81
PEAK DISPLACEMENT (inch)
0.325
Displacement (inch)
0.0 0.1 0.2 0.3 0.4 0.5 0.6 0.7 0.8
Load
(ki
ps)
0
10
20
30
40
50
60

C-44
Table C16. Specimen B307-1.5-3_0H776-1 IT Results
SPECIMEN
B307-1.5-3-0H776-1 IT
PEAK LOAD (kip)
19.22
PEAK DISPLACEMENT (inch)
0.294
Displacement (inch)
0.0 0.1 0.2 0.3 0.4 0.5 0.6 0.7 0.8
Load
(ki
ps)
0
10
20
30
40
50
60

C-45
Table C17. Specimen B307-1.5-3_0H776-1 IB Results
SPECIMEN
B307-1.5-3-0H776-1 IB
PEAK LOAD (kip)
18.87
PEAK DISPLACEMENT (inch)
0.182
Displacement (inch)
0.0 0.1 0.2 0.3 0.4 0.5 0.6 0.7 0.8
Load
(ki
ps)
0
10
20
30
40
50
60

C-46
Table C18. Specimen B307-1.5-3_50815-1 IT Results
SPECIMEN
B307-1.5-3-50815-1 IT
PEAK LOAD (kip)
22.77
PEAK DISPLACEMENT (inch)
0.246
Displacement (inch)
0.0 0.1 0.2 0.3 0.4 0.5 0.6 0.7 0.8
Load
(ki
ps)
0
10
20
30
40
50
60

C-1
Table C19. Specimen B307-1.5-3_50815-1 IB Results
SPECIMEN
B307-1.5-3-50815-1 IB
PEAK LOAD (kip)
22.09
PEAK DISPLACEMENT (inch)
0.167
Displacement (inch)
0.0 0.1 0.2 0.3 0.4 0.5 0.6 0.7 0.8
Load
(ki
ps)
0
10
20
30
40
50
60

C-2
Table C20. Specimen B307-1.5-3_200Qty-1 IB Results
SPECIMEN
B307-1.5-3-200Qty-1 IB
PEAK LOAD (kip)
19.26
PEAK DISPLACEMENT (inch)
0.158
Displacement (inch)
0.0 0.1 0.2 0.3 0.4 0.5 0.6 0.7 0.8
Load
(ki
ps)
0
10
20
30
40
50
60

C-3
Table C21. Specimen B307-1.5-3_300Qty-1 IB Results
SPECIMEN
B307-1.5-3-300Qty-1 IB
PEAK LOAD (kip)
20.62
PEAK DISPLACEMENT (inch)
0.186
Displacement (inch)
0.0 0.1 0.2 0.3 0.4 0.5 0.6 0.7 0.8
Load
(ki
ps)
0
10
20
30
40
50
60

C-4
Table C22. Specimen B307-3.0-3_0H776-1 IT Results
SPECIMEN
B307-3.0-3-0H776-1 IT
PEAK LOAD (kip)
18.64
PEAK DISPLACEMENT (inch)
0.231
Displacement (inch)
0.0 0.1 0.2 0.3 0.4 0.5 0.6 0.7 0.8
Load
(ki
ps)
0
10
20
30
40
50
60

C-5
Table C23. Specimen B307-3.0-3_0H776-1 IB Results
SPECIMEN
B307-3.0-3-0H776-1 IB
PEAK LOAD (kip)
18.66
PEAK DISPLACEMENT (inch)
0.180
Displacement (inch)
0.0 0.1 0.2 0.3 0.4 0.5 0.6 0.7 0.8
Load
(ki
ps)
0
10
20
30
40
50
60

C-6
Table C24. Specimen B307-3.0-3_50815-1 IT Results
SPECIMEN
B307-3.0-3-50815-1 IT
PEAK LOAD (kip)
21.70
PEAK DISPLACEMENT (inch)
0.218
Displacement (inch)
0.0 0.1 0.2 0.3 0.4 0.5 0.6 0.7 0.8
Load
(ki
ps)
0
10
20
30
40
50
60

C-7
Table C25. Specimen B307-3.0-3_50815-1 IB Results
SPECIMEN
B307-3.0-3-50815-1 IB
PEAK LOAD (kip)
22.41
PEAK DISPLACEMENT (inch)
0.143
Displacement (inch)
0.0 0.1 0.2 0.3 0.4 0.5 0.6 0.7 0.8
Load
(ki
ps)
0
10
20
30
40
50
60

C-8
Table C26. Specimen B307-1.5-3_0H776-3 IB Results
SPECIMEN
B307-1.5-3-0H776-3 IB
PEAK LOAD (kip)
55.16
PEAK DISPLACEMENT (inch)
0.224
Displacement (inch)
0.0 0.1 0.2 0.3 0.4 0.5 0.6 0.7 0.8
Load
(ki
ps)
0
10
20
30
40
50
60

C-9
Table C27. Specimen B307-3.0-3_0H776-3 IB Results
SPECIMEN
B307-3.0-3-0H776-3 IB
PEAK LOAD (kip)
55.59
PEAK DISPLACEMENT (inch)
0.237
Displacement (inch)
0.0 0.1 0.2 0.3 0.4 0.5 0.6 0.7 0.8
Load
(ki
ps)
0
10
20
30
40
50
60

C-10
Table C28. Specimen B307-1.5-4_0H776-1 IT Results
SPECIMEN
B307-1.5-4-0H776-1 IT
PEAK LOAD (kip)
18.28
PEAK DISPLACEMENT (inch)
0.243
Displacement (inch)
0.0 0.1 0.2 0.3 0.4 0.5 0.6 0.7 0.8
Load
(ki
ps)
0
10
20
30
40
50
60
C-11
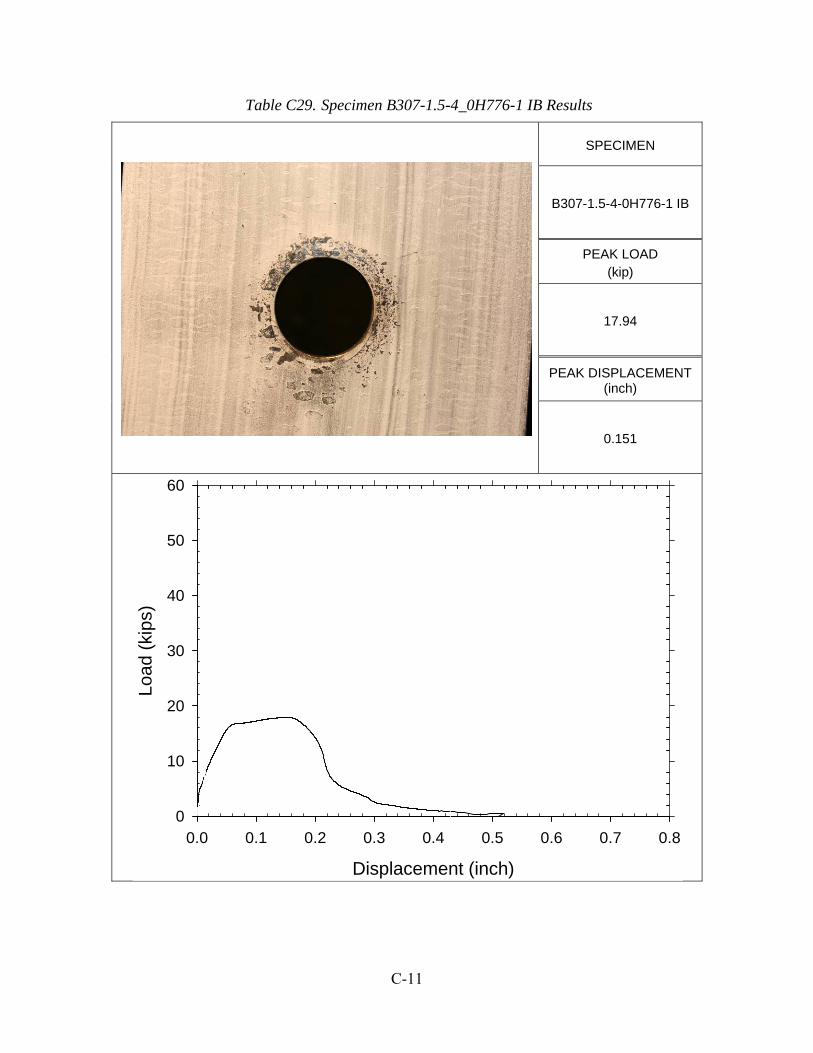
Table C29. Specimen B307-1.5-4_0H776-1 IB Results
SPECIMEN
B307-1.5-4-0H776-1 IB
PEAK LOAD (kip)
17.94
PEAK DISPLACEMENT (inch)
0.151
Displacement (inch)
0.0 0.1 0.2 0.3 0.4 0.5 0.6 0.7 0.8
Load
(ki
ps)
0
10
20
30
40
50
60

C-12
Table C30. Specimen B307-1.5-4_50815-1 IT Results
SPECIMEN
B307-1.5-4-50815-1 IT
PEAK LOAD (kip)
22.07
PEAK DISPLACEMENT (inch)
0.235
Displacement (inch)
0.0 0.1 0.2 0.3 0.4 0.5 0.6 0.7 0.8
Load
(ki
ps)
0
10
20
30
40
50
60

C-13
Table C31. Specimen B307-1.5-4_50815-1 IB Results
SPECIMEN
B307-1.5-4-50815-1 IB
PEAK LOAD (kip)
21.54
PEAK DISPLACEMENT (inch)
0.131
Displacement (inch)
0.0 0.1 0.2 0.3 0.4 0.5 0.6 0.7 0.8
Load
(ki
ps)
0
10
20
30
40
50
60

C-14
Table C32. Specimen B307-1.5-4_200Qty-1 IB Results
SPECIMEN
B307-1.5-4-200Qty-1 IB
PEAK LOAD (kip)
19.91
PEAK DISPLACEMENT (inch)
0.165
Displacement (inch)
0.0 0.1 0.2 0.3 0.4 0.5 0.6 0.7 0.8
Load
(ki
ps)
0
10
20
30
40
50
60

C-15
Table C33. Specimen B307-1.5-4_300Qty-1 IB Results
SPECIMEN
B307-1.5-4-300Qty-1 IB
PEAK LOAD (kip)
21.17
PEAK DISPLACEMENT (inch)
0.164
Displacement (inch)
0.0 0.1 0.2 0.3 0.4 0.5 0.6 0.7 0.8
Load
(ki
ps)
0
10
20
30
40
50
60
C-16
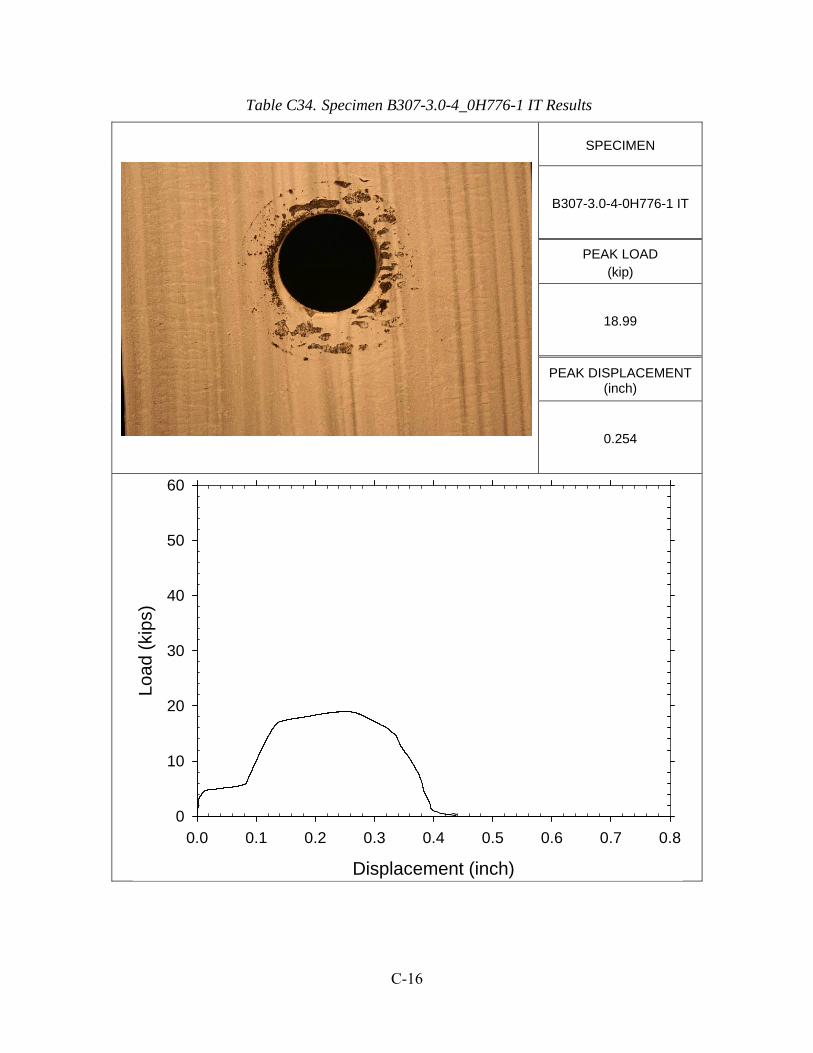
Table C34. Specimen B307-3.0-4_0H776-1 IT Results
SPECIMEN
B307-3.0-4-0H776-1 IT
PEAK LOAD (kip)
18.99
PEAK DISPLACEMENT (inch)
0.254
Displacement (inch)
0.0 0.1 0.2 0.3 0.4 0.5 0.6 0.7 0.8
Load
(ki
ps)
0
10
20
30
40
50
60

C-17
Table C35. Specimen B307-3.0-4_0H776-1 IB Results
SPECIMEN
B307-3.0-4-0H776-1 IB
PEAK LOAD (kip)
17.75
PEAK DISPLACEMENT (inch)
0.149
Displacement (inch)
0.0 0.1 0.2 0.3 0.4 0.5 0.6 0.7 0.8
Load
(ki
ps)
0
10
20
30
40
50
60

C-18
Table C36. Specimen B307-3.0-4_50815-1 IT Results
SPECIMEN
B307-3.0-4-50815-1 IT
PEAK LOAD (kip)
22.89
PEAK DISPLACEMENT (inch)
0.219
Displacement (inch)
0.0 0.1 0.2 0.3 0.4 0.5 0.6 0.7 0.8
Load
(ki
ps)
0
10
20
30
40
50
60

C-19
Table C37. Specimen B307-3.0-4_50815-1 IB Results
SPECIMEN
B307-3.0-4-50815-1 IB
PEAK LOAD (kip)
22.42
PEAK DISPLACEMENT (inch)
0.143
Displacement (inch)
0.0 0.1 0.2 0.3 0.4 0.5 0.6 0.7 0.8
Load
(ki
ps)
0
10
20
30
40
50
60

C-20
Table C38. Specimen B307-1.5-4_0H776-3 IB Results
SPECIMEN
B307-1.5-4-0H776-3 IB
PEAK LOAD (kip)
56.99
PEAK DISPLACEMENT (inch)
0.205
Displacement (inch)
0.0 0.1 0.2 0.3 0.4 0.5 0.6 0.7 0.8
Load
(ki
ps)
0
10
20
30
40
50
60
C-21
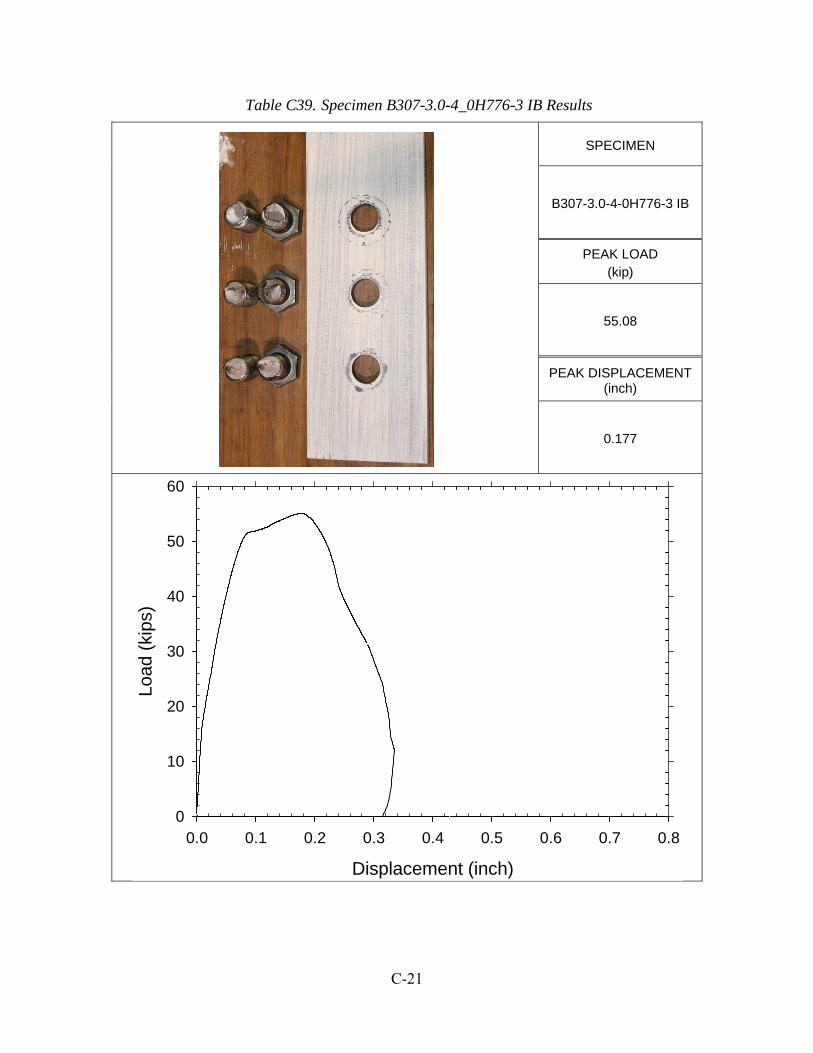
Table C39. Specimen B307-3.0-4_0H776-3 IB Results
SPECIMEN
B307-3.0-4-0H776-3 IB
PEAK LOAD (kip)
55.08
PEAK DISPLACEMENT (inch)
0.177
Displacement (inch)
0.0 0.1 0.2 0.3 0.4 0.5 0.6 0.7 0.8
Load
(ki
ps)
0
10
20
30
40
50
60

C-22
Table C40. Specimen HD-1.5-3-1 Results
SPECIMEN
HD-1.5-3-1
PEAK LOAD (kip)
35.32
PEAK DISPLACEMENT (inch)
0.283
Displacement (inch)
0.0 0.1 0.2 0.3 0.4 0.5 0.6 0.7 0.8
Load
(ki
ps)
0
10
20
30
40
50
60

C-23
Table C41. Specimen HD-3.0-3-1 Results
SPECIMEN
HD-3.0-3-1
PEAK LOAD (kip)
34.96
PEAK DISPLACEMENT (inch)
0.250
Displacement (inch)
0.0 0.1 0.2 0.3 0.4 0.5 0.6 0.7 0.8
Load
(ki
ps)
0
10
20
30
40
50
60
C-24
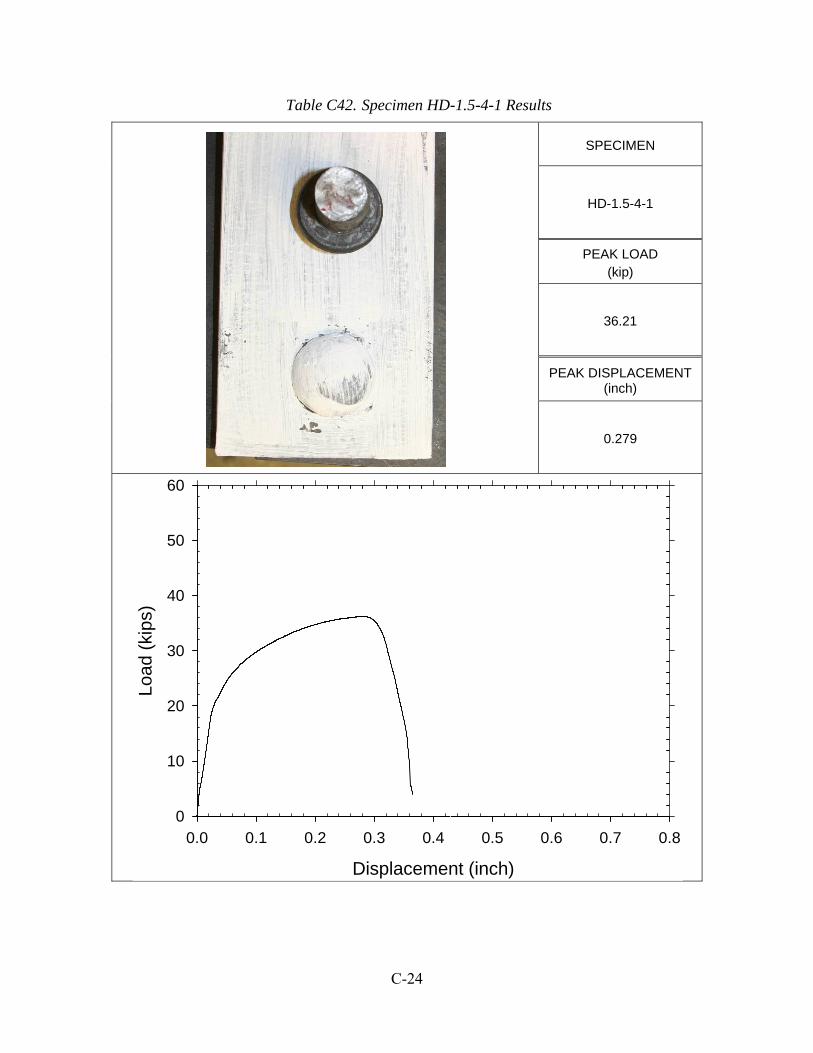
Table C42. Specimen HD-1.5-4-1 Results
SPECIMEN
HD-1.5-4-1
PEAK LOAD (kip)
36.21
PEAK DISPLACEMENT (inch)
0.279
Displacement (inch)
0.0 0.1 0.2 0.3 0.4 0.5 0.6 0.7 0.8
Load
(ki
ps)
0
10
20
30
40
50
60

C-25
Table C43. Specimen HD-3.0-4-1 Results
SPECIMEN
HD-3.0-4-1
PEAK LOAD (kip)
35.98
PEAK DISPLACEMENT (inch)
0.222
Displacement (inch)
0.0 0.1 0.2 0.3 0.4 0.5 0.6 0.7 0.8
Load
(ki
ps)
0
10
20
30
40
50
60

C-26
Table C44. Specimen HPL-1.5-3-1 Results
SPECIMEN
HPL-1.5-3-1
PEAK LOAD (kip)
32.32
PEAK DISPLACEMENT (inch)
0.391
Displacement (inch)
0.0 0.1 0.2 0.3 0.4 0.5 0.6 0.7 0.8
Load
(ki
ps)
0
10
20
30
40
50
60

C-27
Table C45. Specimen HPL-3.0-3-1 Results
SPECIMEN
HPL-3.0-3-1
PEAK LOAD (kip)
33.50
PEAK DISPLACEMENT (inch)
0.290
Displacement (inch)
0.0 0.1 0.2 0.3 0.4 0.5 0.6 0.7 0.8
Load
(ki
ps)
0
10
20
30
40
50
60

C-28
Table C46. Specimen HPL-1.5-4-1 Results
SPECIMEN
HPL-1.5-4-1
PEAK LOAD (kip)
30.29
PEAK DISPLACEMENT (inch)
0.268
Displacement (inch)
0.0 0.1 0.2 0.3 0.4 0.5 0.6 0.7 0.8
Load
(ki
ps)
0
10
20
30
40
50
60

C-29
Table C47. Specimen HPL-3.0-4-1 Results
SPECIMEN
HPL-3.0-4-1
PEAK LOAD (kip)
30.85
PEAK DISPLACEMENT (inch)
0.262
Displacement (inch)
0.0 0.1 0.2 0.3 0.4 0.5 0.6 0.7 0.8
Load
(ki
ps)
0
10
20
30
40
50
60
C-30
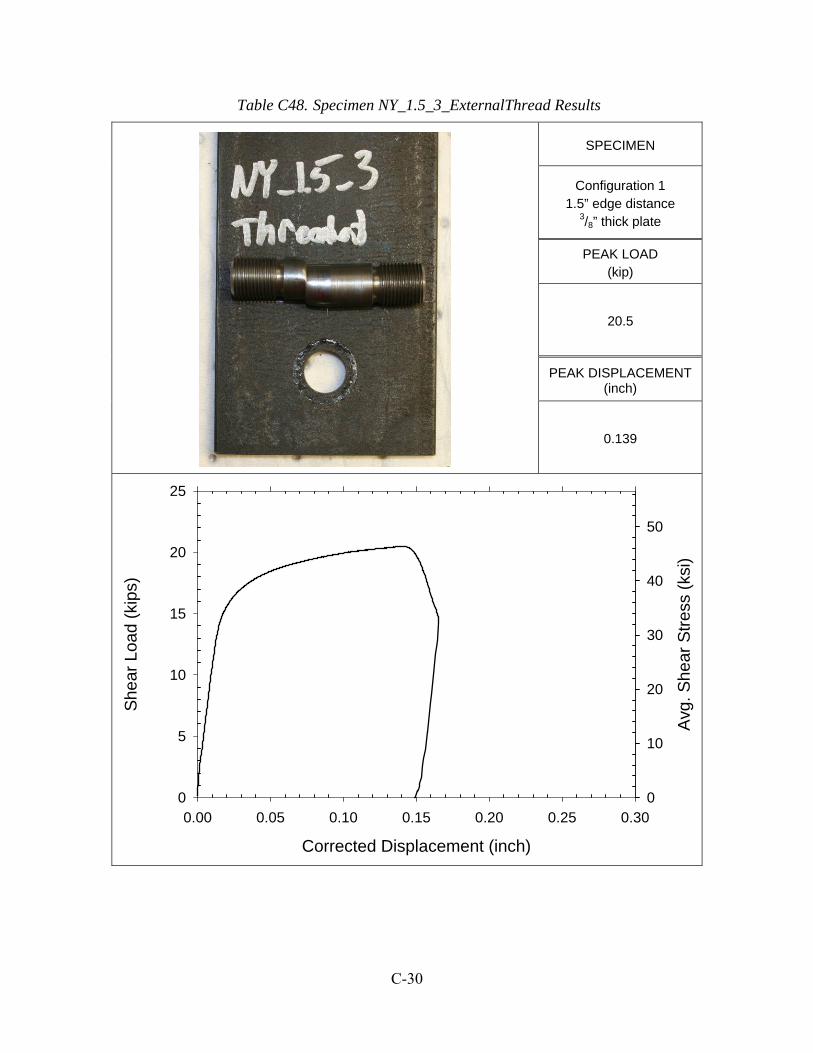
Table C48. Specimen NY_1.5_3_ExternalThread Results
SPECIMEN
Configuration 1 1.5” edge distance
3/8” thick plate
PEAK LOAD (kip)
20.5
PEAK DISPLACEMENT (inch)
0.139
Corrected Displacement (inch)
0.00 0.05 0.10 0.15 0.20 0.25 0.30
Sh
ear
Load
(ki
ps)
0
5
10
15
20
25
Avg
. Sh
ear
Str
ess
(ksi
)
0
10
20
30
40
50

C-31
Table C49. Specimen NY_1.5_4_ExternalThread Results
SPECIMEN
Configuration 1 1.5” edge distance
1/2” thick plate
PEAK LOAD (kip)
21.0
PEAK DISPLACEMENT (inch)
0.172
Corrected Displacement (inch)
0.00 0.05 0.10 0.15 0.20 0.25 0.30
She
ar L
oad
(kip
s)
0
5
10
15
20
25
Avg
. She
ar
Str
ess
(ks
i)
0
10
20
30
40
50

C-32
Table C50. Specimen NY_3.0_3_ExternalThread Results
SPECIMEN
Configuration 1 3.0” edge distance
3/8” thick plate
PEAK LOAD (kip)
21.1
PEAK DISPLACEMENT (inch)
0.144
Corrected Displacement (inch)
0.00 0.05 0.10 0.15 0.20 0.25 0.30
Sh
ear
Load
(ki
ps)
0
5
10
15
20
25
Avg
. Sh
ear
Str
ess
(ksi
)
0
10
20
30
40
50

C-33
Table C51. Specimen NY_3.0_4_ExternalThread Results
SPECIMEN
Configuration 1 3.0” edge distance
1/2” thick plate
PEAK LOAD (kip)
19.2
PEAK DISPLACEMENT (inch)
0.169
Corrected Displacement (inch)
0.00 0.05 0.10 0.15 0.20 0.25 0.30
She
ar L
oad
(kip
s)
0
5
10
15
20
25
Avg
. She
ar
Str
ess
(ks
i)
0
10
20
30
40
50

C-34
Table C52. Specimen NY_1.5_3_InternalThread Results
SPECIMEN
Configuration 2 1.5” edge distance
3/8” thick plate
PEAK LOAD (kip)
19.8
PEAK DISPLACEMENT (inch)
0.203
Corrected Displacement (inch)
0.00 0.05 0.10 0.15 0.20 0.25 0.30
She
ar L
oad
(kip
s)
0
5
10
15
20
25
Avg
. She
ar
Str
ess
(ks
i)
0
10
20
30
40
50

C-35
Table C53. Specimen NY_1.5_4_InternalThread Results
SPECIMEN
Configuration 2 1.5” edge distance
1/2” thick plate
PEAK LOAD (kip)
22.8
PEAK DISPLACEMENT (inch)
0.232
Corrected Displacement (inch)
0.00 0.05 0.10 0.15 0.20 0.25 0.30
She
ar L
oad
(kip
s)
0
5
10
15
20
25
Avg
. She
ar S
tres
s (k
si)
0
10
20
30
40
50

C-36
Table C54. Specimen NY_3.0_3_InternalThread Results
SPECIMEN
Configuration 2 3.0” edge distance
3/8” thick plate
PEAK LOAD (kip)
18.8
PEAK DISPLACEMENT (inch)
0.190
Corrected Displacement (inch)
0.00 0.05 0.10 0.15 0.20 0.25 0.30
She
ar
Lo
ad
(ki
ps)
0
5
10
15
20
25
Avg
. She
ar
Str
ess
(ks
i)
0
10
20
30
40
50

C-37
Table C55. Specimen NY_3.0_4_InternalThread Results
SPECIMEN
Configuration 2 3.0” edge distance
1/2” thick plate
PEAK LOAD (kip)
18.6
PEAK DISPLACEMENT (inch)
0.167
Corrected Displacement (inch)
0.00 0.05 0.10 0.15 0.20 0.25 0.30
Sh
ear
Load
(ki
ps)
0
5
10
15
20
25
Avg
. Sh
ear
Str
ess
(ksi
)
0
10
20
30
40
50

C-38
Table C56. Specimen KS_1.5_3_InternalThread Results
SPECIMEN
Configuration 2 3.0” edge distance
1/2” thick plate
PEAK LOAD (kip)
PEAK DISPLACEMENT (inch)
Corrected Displacement (inch)
0.0 0.1 0.2 0.3
Load
(ki
ps)
0
5
10
15
20
25
Avg
. She
ar
Str
ess
(ks
i)
0
10
20
30
40
50

C-39
Table C57. Specimen KS_1.5_4_InternalThread Results
SPECIMEN
Configuration 2 3.0” edge distance
1/2” thick plate
PEAK LOAD (kip)
PEAK DISPLACEMENT (inch)
Corrected Displacement (inch)
0.0 0.1 0.2 0.3
Load
(ki
ps)
0
5
10
15
20
25
Avg
. She
ar S
tres
s (k
si)
0
10
20
30
40
50

C-40
Table C58. Specimen KS_3.0_3_InternalThread Results
SPECIMEN
Configuration 2 3.0” edge distance
1/2” thick plate
PEAK LOAD (kip)
PEAK DISPLACEMENT (inch)
Corrected Displacement (inch)
0.0 0.1 0.2 0.3
Load
(ki
ps)
0
5
10
15
20
25
Avg
. Sh
ear
Str
ess
(ksi
)
0
10
20
30
40
50

C-41
Table C59. Specimen KS_3.0_4_InternalThread Results
SPECIMEN
Configuration 2 3.0” edge distance
1/2” thick plate
PEAK LOAD (kip)
PEAK DISPLACEMENT (inch)
Corrected Displacement (inch)
0.0 0.1 0.2 0.3
Load
(ki
ps)
0
5
10
15
20
25
Avg
. Sh
ear
Str
ess
(ksi
)
0
10
20
30
40
50