appendix b - mde.state.md.us b analytical methods ... each two foot interval was screened with a pid...
TRANSCRIPT

SITE ASSESSMENT FOR PROPOSED COKE
POINT DREDGED MATERIAL CONTAINMENT
FACILITY AT SPARROWS POINT
BALTIMORE COUNTY, MARYLAND
APPENDIX B
Analytical Methods
Prepared for:
Maryland Port Administration
2310 Broening Highway
Baltimore, Maryland 21224
Under Contract to:
Maryland Environmental Service
259 Najoles Road
Millersville, MD 21108
Prepared by:
EA Engineering, Science, and Technology, Inc.
15 Loveton Circle
Sparks, Maryland 21152
Maryland
Environmental
Service
Site Assessment – Coke Point DMCF at Sparrows Point November 2009 B-1
APPENDIX B. SAMPLE MANAGEMENT
Soil, sediment, and site water were collected during the field sampling for the Sparrows Point
Site Assessment. This appendix discusses the sample management during sample collection and
analytical processing.
B.1 IN-SITU WATER QUALITY MEASUREMENTS
Water quality measurements were recorded in situ at sampling locations using a YSI water
quality probe. Measurements were recorded at the surface, mid-depth, and bottom (one foot
from the sediment / water interface) of the water column for the site water, surface sediment, and
subsurface sediment phases. The following parameters were recorded in the field log book:
Sampling location number
Sampling date and time
Water depth
Water temperature (degrees Celsius)
Salinity (parts per thousand)
pH
Dissolved oxygen (milligrams per liter)
Turbidity (nephalometric turbidity units [NTUs])
The water quality measurements for the site water sampling are presented in Table B-1. Water
quality measurement taken during surface and subsurface sediment sampling are presented in
Table B-2 and B-3, respectively. A copy of the project logbook with the raw data is located in
Appendix A.
B.2 SITE WATER COLLECTION
Site water for chemical analysis was collected at the surface, mid-depth, and bottom (one foot
from the sediment / water interface) of the water column at 18 sampling locations. Water was
collected using an ISCO pump with dedicated Tygon tubing from EA’s 28-ft work vessel. Water
for analytical testing was stored in certified cleaned, laboratory-prepared containers with
appropriate preservatives. Water samples were shipped via overnight delivery to
TestAmerica Pittsburgh on the day of collection.
Water samples were analyzed for VOCs and PAHs. Holding times for the site water began when
the samples were collected and placed into the appropriate sample containers. Sample
containers, preservation techniques, and holding time requirements for site water and equipment
blanks are provided in Table B-4.
B.3 SURFACE SEDIMENT COLLECTION
Surface sediment samples were collected at 19 sampling locations to approximately 1-ft below
the sediment surface using a stainless steel Van Veen grab sampler. Surface sediment samples
were analyzed for metals (including mercury), VOCs, PAHs, cyanide, total organic carbon
Site Assessment – Coke Point DMCF at Sparrows Point November 2009 B-2
(TOC), total solids, grain size, and moisture content. VOC samples were collected using Terra
Cores. VOC samples were collected from the grab sample immediately after collection, prior to
sample homogenization.
After VOC samples were collected, the remaining sediment was thoroughly homogenized,
placed into appropriate laboratory-cleaned containers using stainless steel spoons, and shipped
via overnight delivery to TestAmerica Pittsburgh on the day of collection. At one location (BH-
SED-03A) an additional sediment sample was collected for PAH fingerprinting analysis.
Sediment samples collected during each workday were stored in cooled, insulated containers
onboard the work boat.
The sample containers, preservation techniques, and holding time requirements for sediment
samples are provided in Table B-4. Because the surface sediment was not collected in a core
liner, the holding time was initiated at sample collection.
B.4 SUBSURFACE SEDIMENT AND SOIL COLLECTION
Subsurface sediment samples were initially collected at a total of 24 locations around the
Peninsula. Subsurface sediment samples were collected with a hollow stem auger (HSA). A
SPT split spoon device was used to collect samples and rigid plastic core liners were placed
inside the SPT to obtain sediment samples. Target depths for the subsurface samples were 30 ft
below the sediment/water interface or to native material.
Three soil samples were collected from each of the 10 initial boreholes drilled within the Benzol
Processing Area and Coal Tar Storage Area. One to three soil samples were collected in the six
additional boreholes drilled in the Benzol Processing Area for LNAPL delineation. Soil samples
were also collected with a HSA.
Soils and sediments were divided into two-foot intervals during the boring and boring logs were
recorded. Each two foot interval was screened with a PID and select samples were tested for the
presence of NAPL with the Sudan IV shaker test. Based on the results of the field screening and
visual observation, soil and sediment samples from impacted intervals were chosen for analytical
testing.
Sediment and soil samples chosen were analyzed for metals (including mercury), VOCs, PAHs,
and cyanide. Sediment samples were also tested for TOC, total solids, grain size, and moisture
content. Cores were sampled for VOC analysis using the Terra Core sampling method. VOC
samples were collected from the core sample as soon as possible after collection, prior to sample
homogenization. Samples were than thoroughly homogenized, placed into appropriate
laboratory-cleaned containers, and shipped via overnight delivery to TestAmerica Pittsburgh on
the day of collection. Samples for PAH and MAH fingerprinting were also shipped on the day of
collection via overnight delivery to META Environmental, Inc. (META). The sample
containers, preservation techniques, and holding time requirements for soil and sediment samples
are provided in Table B-4. Because the subsurface sediment and the soil were processed in the
field, the holding time was initiated at sample collection.

Site Assessment – Coke Point DMCF at Sparrows Point November 2009 B-3
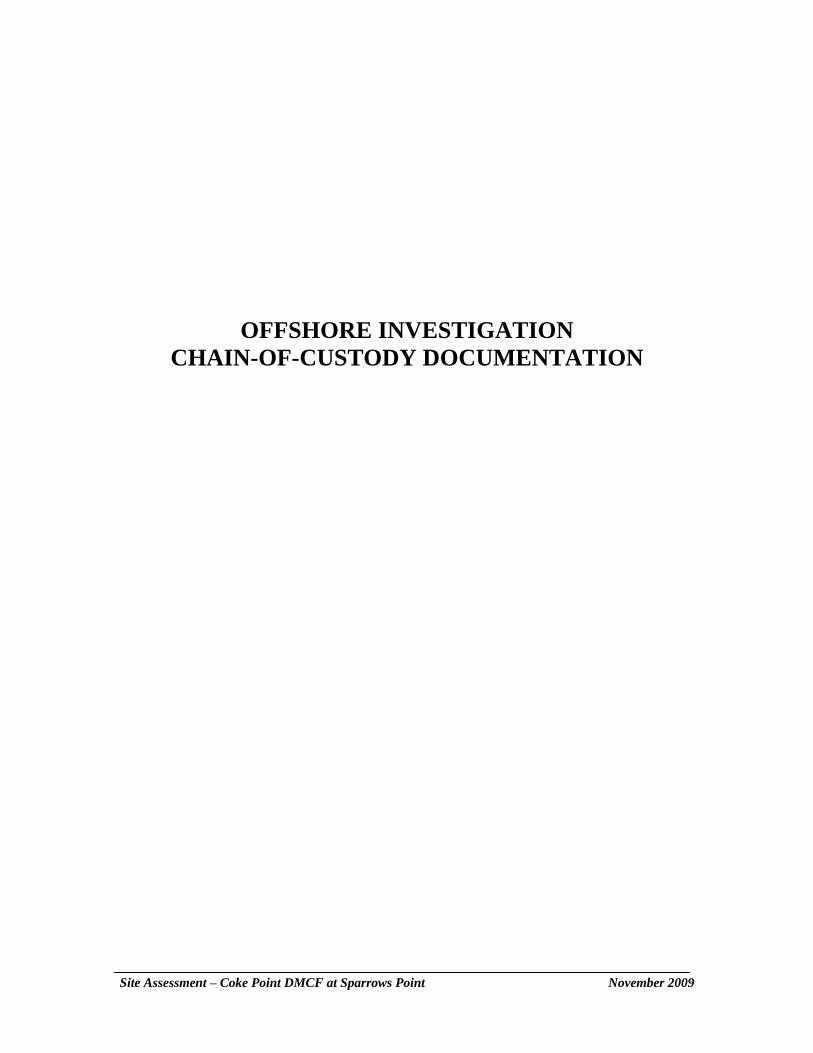
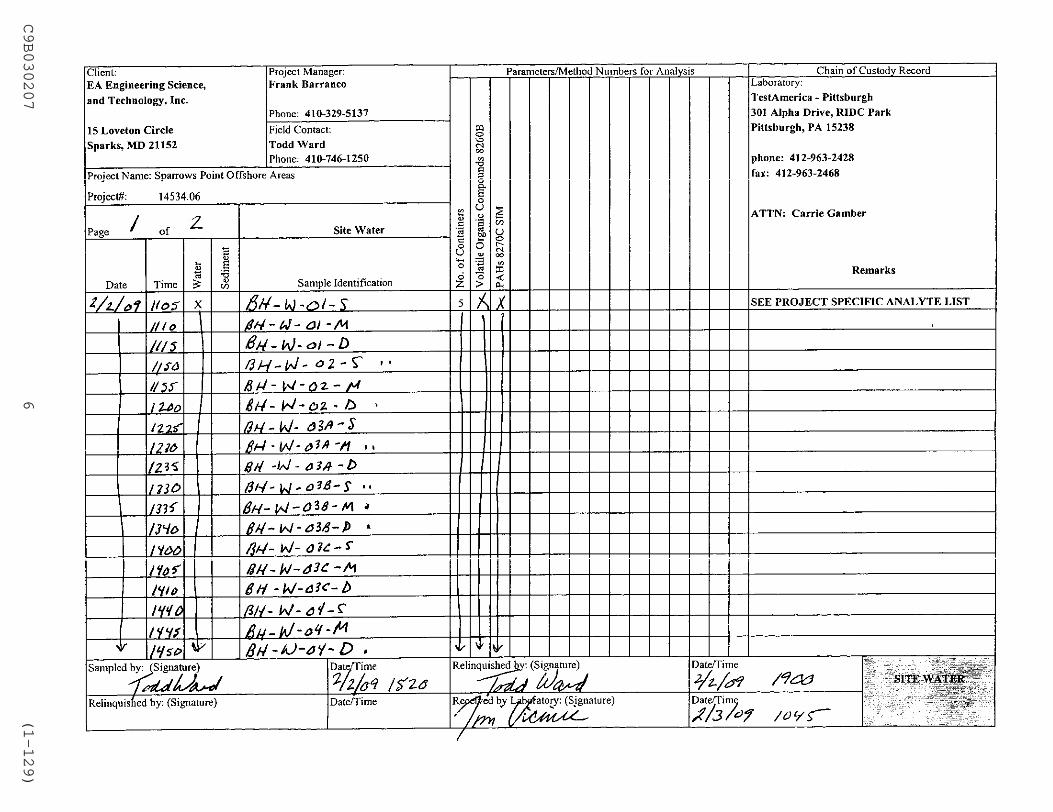
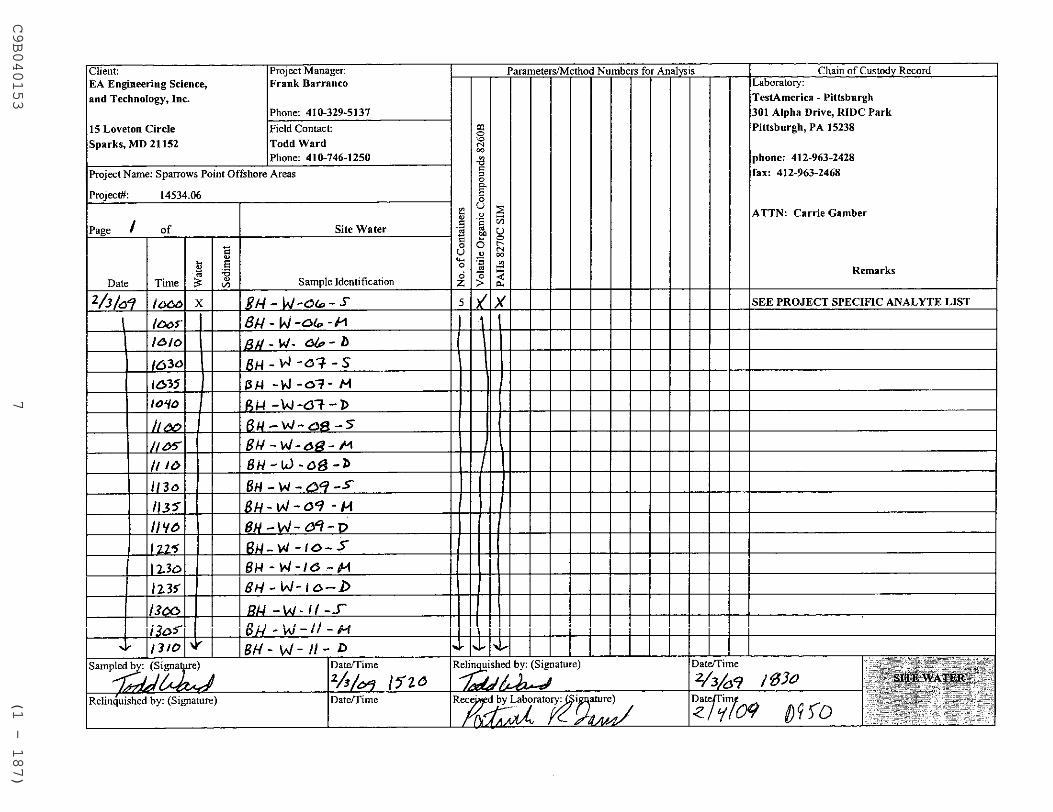
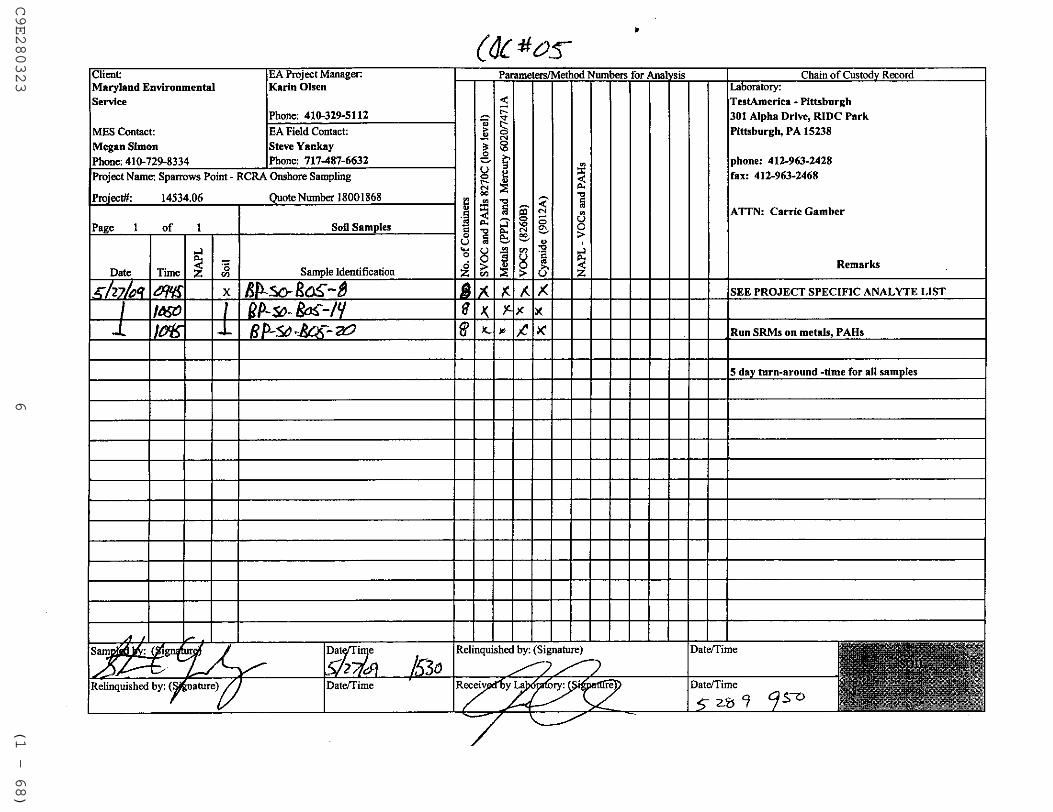
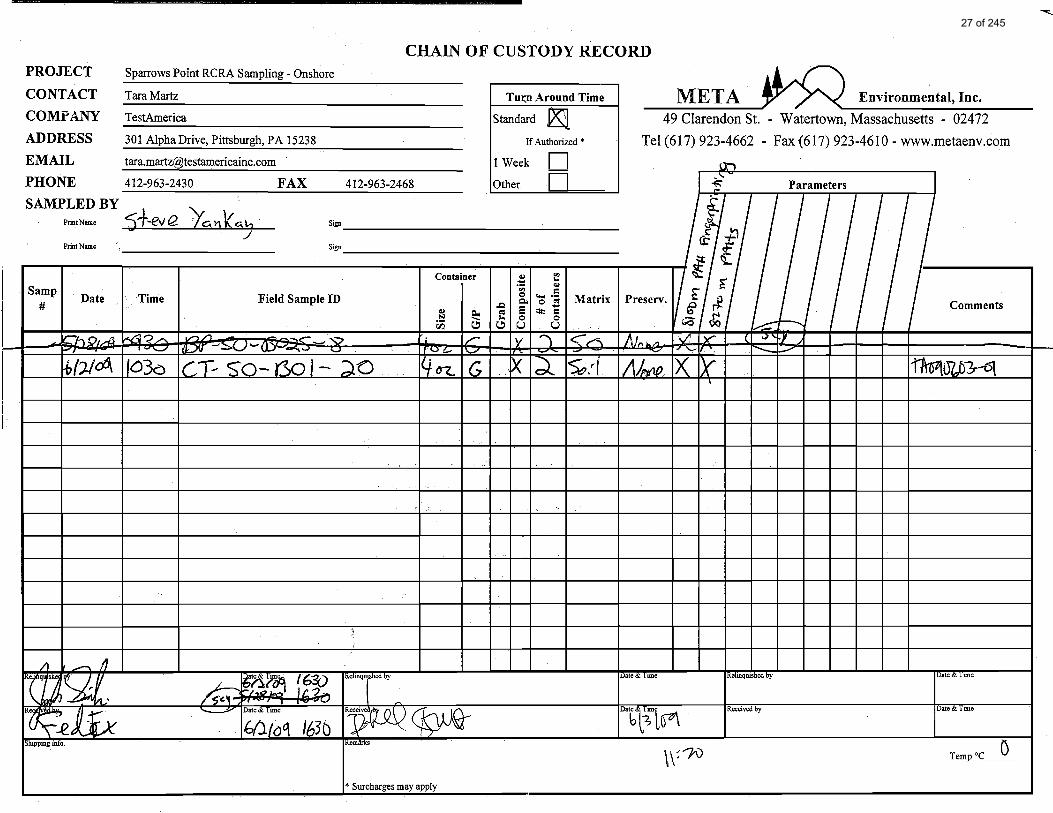
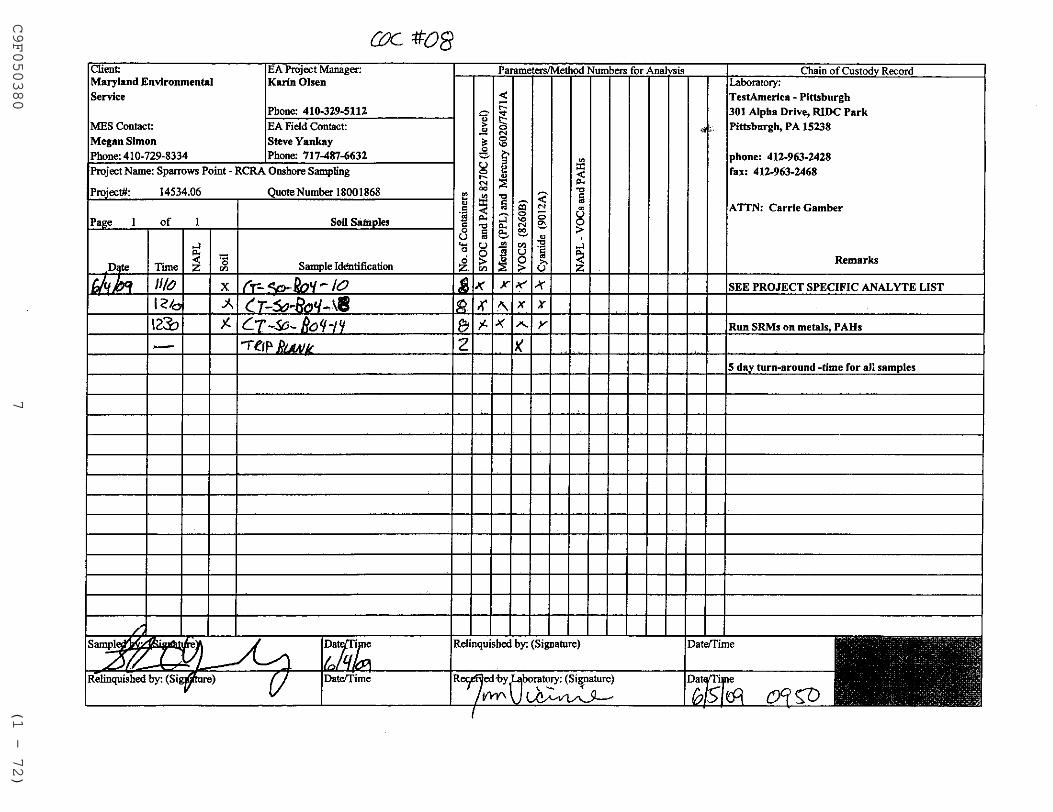
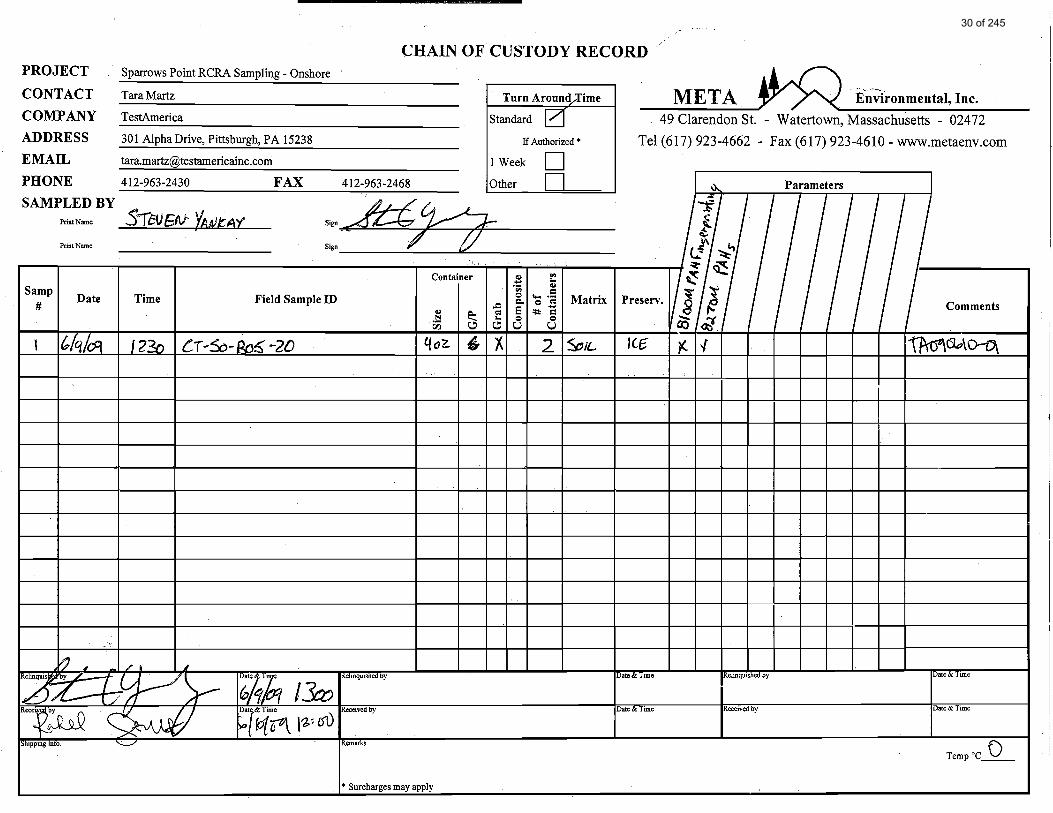
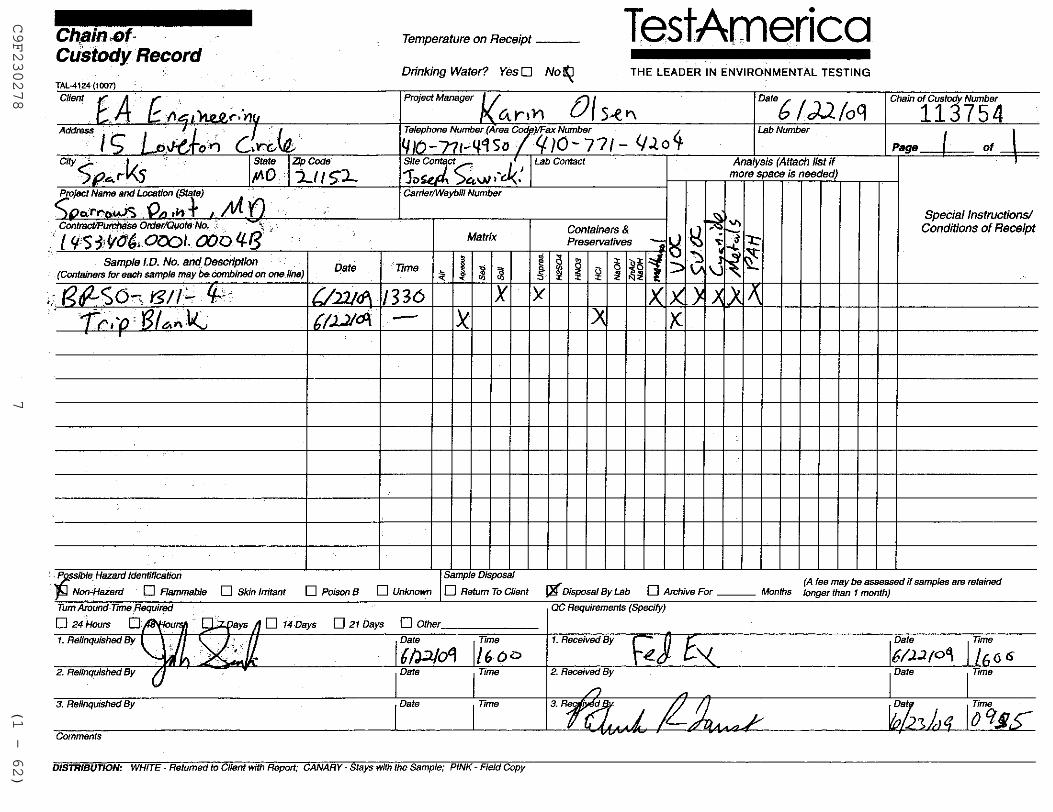
B.5 CHAIN-OF-CUSTODY RECORDS
Samples collected in the field were documented on a COC sheet that included the date and time
the sample was collected, the analyses requested, and the signatures of the personnel who
collected and relinquished the samples. This COC accompanied all samples shipped for sample
analyses. Copies of COCs for the onshore and offshore phases of the Sparrows Point Site
Assessment are located in Appendix B.
B.6 ANALYTICAL TESTING PROGRAM
Analytical testing of soil, sediment, site water, and NAPL was conducted by three laboratories:
META Environmental, Inc. (META), PTS Laboratories, Inc. (PTS), and TestAmerica. META
Environmental performed polycyclic aromatic hydrocarbon (PAH) and monocyclic aromatic
hydrocarbon (MAH) fingerprinting and compound-specific stable carbon isotope ratios (CSIR)
with support from Oklahoma University. PTS performed the physical NAPL analyses to
determine potential mobility of the NAPL. TestAmerica-Pittsburgh performed the metals,
VOCs, PAHs, cyanide, TOC and toxicity characteristic leaching procedure (TCLP), with support
from TestAmerica-Burlington (grain size).
Soils and sediments were tested for the following target compounds:
volatile organic compounds (VOCs),
polycyclic aromatic hydrocarbons (PAHs),
metals,
cyanide,
total organic carbon (TOC) (sediment only),
grain size (sediment only),
moisture content (sediment only),
PAH and MAH fingerprinting (sediment only), and
Compound-specific stable carbon isotope ratios (CSIR) (sediment only).
Water samples and NAPL samples were tested for the following target compounds:
VOCs and
PAHs.
NAPL samples were also tested for the following physical characteristics:
specific gravity,
interfacial tension,
surface tension, and
wettability index (only selected NAPL samples).
TCLP analysis was performed on investigation derived wastes (IDW) which were contained in
drums both onshore and offshore on the barge where soil and sediment processing occurred.
TCLP analysis determines how a drum with IDW can be disposed and the results of the TCLP

Site Assessment – Coke Point DMCF at Sparrows Point November 2009 B-4
analysis are available in Attachment I. As part of the TCLP, the concentrations of eight metals,
nine pesticides and herbicides, eleven SVOCs, and ten VOCs were determined.
Target analytes, target detection limits, analytical methodologies, and sample holding times were
derived from the following guidance documents:
USEPA/USACE, 1998 (EPA-823-B-98-004). Evaluation of Dredged Material
Proposed for Discharge in Waters of the U.S.-Testing Manual (Inland Testing
Manual).
USACE, 2003. (ERDC/EL TR-03-1). Evaluation of Dredged Material Proposed for
Disposal at Island, Nearshore, or Upland Confined Disposal Facilities – Testing
Manual. (Upland Testing Manual).
USEPA/USACE, 1995 (EPA-823-B-95-001). QA/QC Guidance for Sampling and
Analysis of Sediments, Water, and Tissues for Dredged Material Evaluations.
USEPA, 2001. Methods for Collection, Storage, and Manipulation of Sediments for
Chemical and Toxicological Analyses: Technical Manual.
USEPA, 1997. Test Methods for Evaluating Solid Waste. Physical/Chemical
Methods. EPA SW 846, 3rd edition, including Final Update III. USEPA,
Washington, D.C. June.
The analytical program for this project is described in detail in the work plan (EA 2008). The
work plan was reviewed and approved by MES and the Maryland Port Administration (MPA)
prior to initiation of the analytical testing program. The analytical methods, detection limits, and
laboratory quality control programs are presented below for META Environmental, PTS and
TestAmerica laboratories (where available). Sediment sample weights were adjusted for percent
moisture (up to 50 percent moisture) prior to analysis to achieve the lowest possible detection
limits. Analytical results are reported on a dry weight basis. Definitions of inorganic and
organic data qualifiers are presented in Tables B-5 and B-6, respectively.
Following analysis the data from TestAmerica and META were validated according to the
guidance document: USEPA, 1995. Innovative Approaches to Data Validation. USEPA-Region
III. June. Any data that did not meet the validation requirements (“R” qualified) was not
presented in this report. The data validation qualifiers for inorganic, organic, and metals are
presented in Tables B-7 to B-9, respectively.
B.7 META ENVIRONMENTAL
Seven sediment samples and five soil samples were submitted to META for characterization.
Seven of the sediment samples were collected in the vicinity of Sparrows Point and one sediment
sample was a reference sample to represent offsite background conditions. Of the soil samples
submitted to META for characterization, three were in the Benzol Processing Area and two were

Site Assessment – Coke Point DMCF at Sparrows Point November 2009 B-5
in the Coal Tar Storage Area. The following samples were submitted for PAH fingerprint
analysis:
Samples Submitted for PAH Fingerprint Analysis
Location Sample ID
Benzol Processing Area
BP-SO-B03-18
BP-SO-05-6
BP-SO-02S
Coal Tar Storage Area CT-SO-B01-20
CT-SO-B05-20
Offshore
BH-SED-03A-00
BH-SED-03A-12
BH-SED-03E-2
BH-SED-05-4
BH-SED-10-2
BH-SED-13C-6
REFERENCE
B.7.1 Analytical Methods
Two analyses were performed by META, PAH and MAH fingerprinting and CSIR. The
analyses were performed following the methods below.
PAH and MAH Fingerprinting
For PAH and MAH fingerprinting, the sediment samples were prepared by solvent extraction
(USEPA 3570) using dichloromethane (DCM). The extracts were spiked with internal standards
and analyzed by gas chromatography / flame ionization detection (GC/FID) (USEPA 8100M) for
fingerprinting and GC / Mass Spectrometry (MS) / Selected Ion Monitoring (SIM) (USEPA
8270M) for PAHs and MAHs, alkyl PAH homologues and other selected compounds. Once the
chromatograms are produced using the GC/MS the chemist might go “peak-by-peak” looking for
similarities and differences, comparing peak ratios, and looking for indicator compounds [as
described in American Society for Testing and Materials (ASTM) Method D 5739-95].
Compound-Specific Stable Carbon Isotope Ratios (CSIR)
CSIR was performed at Oklahoma University where samples were analyzed by GC / isotope
ratio mass spectrometer (IRMS) for stable carbon isotope ratios of PAHs and other semivolatile
compounds. Samples were prepared by an appropriate extraction and concentration technique,
such as USEPA Methods 3510, 3540C and 3545. The extracts were analyzed using a GC
coupled with an IRMS via a combustion furnace heated at 1,050°C and a water trap. A similar
capillary GC column is used to imitate standard GC/MS conditions. There are no standard
methods for GC/IRMS.
Site Assessment – Coke Point DMCF at Sparrows Point November 2009 B-6
The isotopic composition of carbon is expressed relative to a references standard that can be
traced to the Peedee belemnite (PDB) standard of the University of Chicago. The results are
expressed in parts per thousand (‰).
B.7.2 Detection Limits
The detection limit is a statistical concept that corresponds to the minimum concentration of an
analyte above which the net analyte signal can be distinguished with a specified probability from
the signal because of the noise inherent in the analytical system. The method detection limit
(MDL) was developed by USEPA, and is defined as “the minimum concentration of a substance
that can be measured and reported with 99% confidence that the analyte concentration is greater
than zero” (40 CFR 136, Appendix B). Method detection limits for PAH and MAH
fingerprinting are listed in Table B-10.
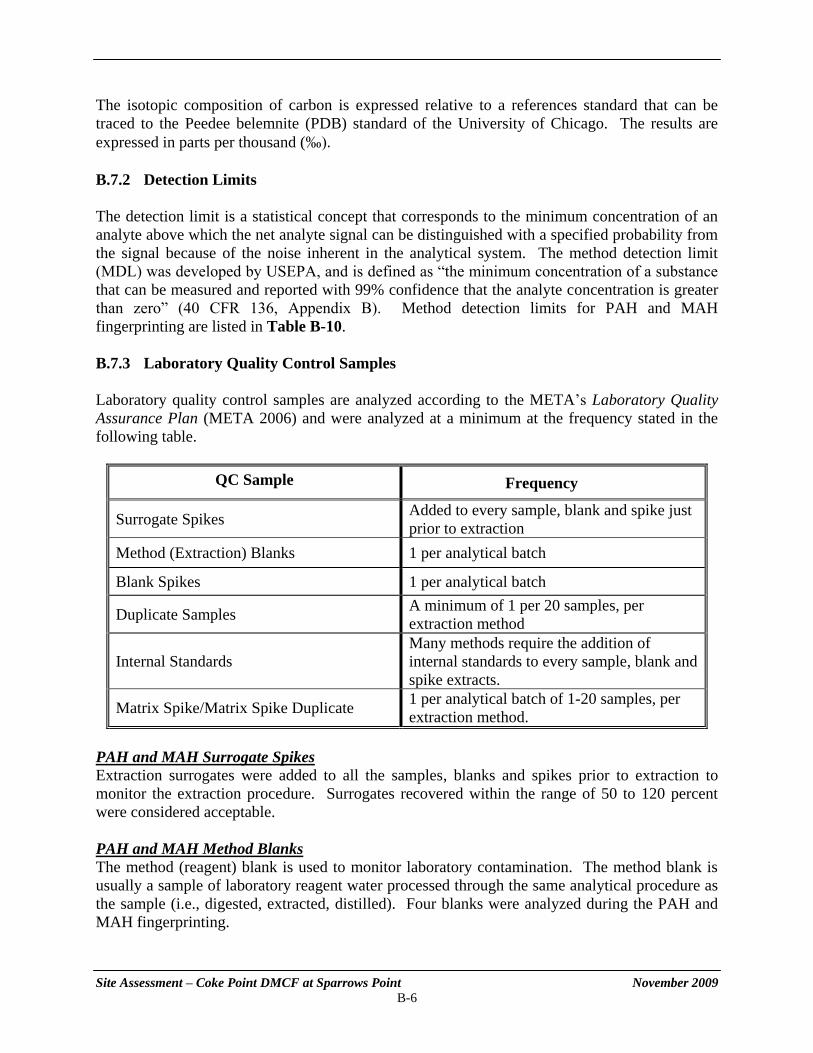
B.7.3 Laboratory Quality Control Samples
Laboratory quality control samples are analyzed according to the META’s Laboratory Quality
Assurance Plan (META 2006) and were analyzed at a minimum at the frequency stated in the
following table.
QC Sample Frequency
Surrogate Spikes Added to every sample, blank and spike just
prior to extraction
Method (Extraction) Blanks 1 per analytical batch
Blank Spikes 1 per analytical batch
Duplicate Samples A minimum of 1 per 20 samples, per
extraction method
Internal Standards
Many methods require the addition of
internal standards to every sample, blank and
spike extracts.
Matrix Spike/Matrix Spike Duplicate 1 per analytical batch of 1-20 samples, per
extraction method.
PAH and MAH Surrogate Spikes
Extraction surrogates were added to all the samples, blanks and spikes prior to extraction to
monitor the extraction procedure. Surrogates recovered within the range of 50 to 120 percent
were considered acceptable.
PAH and MAH Method Blanks
The method (reagent) blank is used to monitor laboratory contamination. The method blank is
usually a sample of laboratory reagent water processed through the same analytical procedure as
the sample (i.e., digested, extracted, distilled). Four blanks were analyzed during the PAH and
MAH fingerprinting.

Site Assessment – Coke Point DMCF at Sparrows Point November 2009 B-7
PAH and MAH Blank Spikes
A blank spike sample is a method blank spiked with a known concentration of various
compounds added to it and then processed through the same analytical procedure as the samples.
Blank spikes were analyzed to ensure that each of the spiked compounds was recovered within
the criteria. Spiked compound recovery criteria are specific to each method, but are
approximately 60 to 120 percent. Four blank spikes were run during the PAH and MAH
fingerprinting.
PAH and MAH Duplicate Samples
A duplicate sample is a second aliquot of a field sample that is analyzed to monitor analytical
precision associated with that particular sample. Four of the eight samples were analyzed in
duplicate.
PAH and MAH Internal Standards
Internal standards are required for most methods and are added to every sample, spike and blank
after extraction. Internal standard recovery criteria are specific to each method, but generally for
GC/MS analysis the internal standard area must be 50 to 200 percent of the most recent, previous
internal standard area and must be within 15 percent of the most recent previous continuing
calibration internal standard area.
Isotope Standards
Standard mixtures at known concentrations and with known isotope ratios were analyzed prior to
sample analysis and periodically after to demonstrate the performance and the stability of the
IRMS. If samples analysis occurs over several days, the precision of the isotope values in the
standard mix was used to estimate the variability in the analysis due to instrumental parameters.
Isotope Spikes
The accuracy of the data was monitored with a set of standard compounds of known isotopic
composition (fully denatured n-alkanes C9, C10, C16, C19, C24, and C32) which were added to
the SVOC samples. Each sample was analyzed at least two times and the standard deviations of
the replicates were calculated for each internal spike and each PAH compound to estimate
reproducibility. Analytes that showed unexpectedly high standard deviations (greater than 0.5)
were examined for coelutions and their isotopic values determined from a portion of the peak
with minimum interference.
B.8 PTS LABORATORIES
The physical properties of NAPL including specific gravity, interfacial tension, and surface
tension were analyzed according to the following methods: ASTM D445, ASTM D1481 and
ASTM D971. The wettability index of selected NAPL samples was analyzed using the United
States Bureau of Mines (USBM) method.

Site Assessment – Coke Point DMCF at Sparrows Point November 2009 B-8
B.9 TESTAMERICA
B.9.1 Analytical Methods
All inorganic and organic compounds analyzed for this project by TestAmerica were determined
using the methods listed in Table B-11, as described in the laboratory’s analytical standard
operating procedures (SOPs). To meet program-specific regulatory requirements for chemicals
of concern, all TestAmerica methods/SOPs were followed as stated with some specific
requirements noted below:
Total Organic Carbon (TOC)
TOC in sediments was determined using the 1988 USEPA-Region II combustion oxidation
procedure (the Lloyd Kahn procedure).
Polycyclic Aromatic Hydrocarbons (PAHs)
To achieve the target detection limits (TDLs) referenced in QA/QC Guidance for Sampling and
Analysis of Sediments, Water, and Tissues for Dredged Material Evaluations - Chemical
Evaluations (EPA 823-B-95-001, April 1995), the PAHs were determined utilizing SW846
Method 8270C using Selective Ion Monitoring (SIM).
Metals
Because of potential matrix interferences, metals were determined utilizing Inductively Coupled
Plasma/ Mass Spectrometry (ICP/MS) according to the methodology specified, except for
mercury. For mercury, samples were analyzed by Cold Vapor Atomic Absorption (CVAA)
method (SW846 7471A).
Cyanide
Total cyanide was determined by method SW846 9012A. The laboratory reporting limit (RL)
using this method is higher than the requested target detection limit, however, this method
represents the best available technology for total cyanide determination and, therefore, the lowest
possible reporting limit.
Toxicity Characteristic Leaching Procedure (TCLP)
The sediment composites were extracted following the TCLP methods specified in SW846
Method 1311. The resultant leachates were analyzed for metals, VOCs, SVOCs, chlorinated
pesticides and herbicides.
B.9.2 Detection Limits
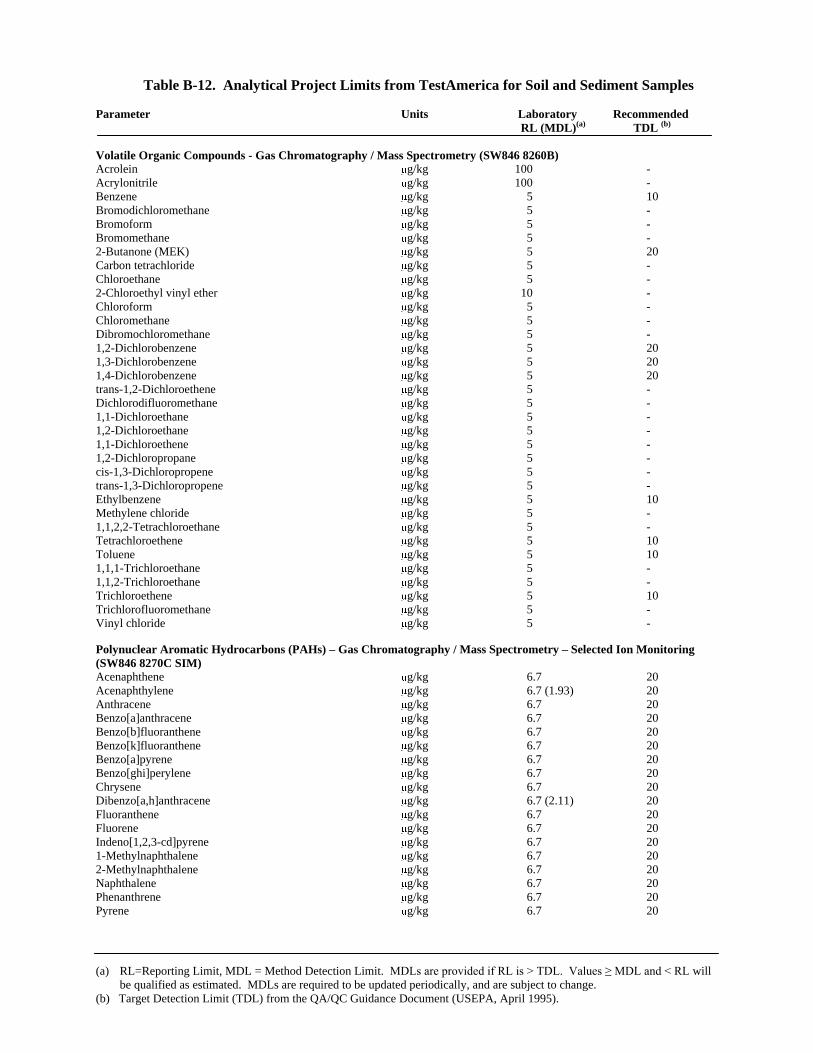
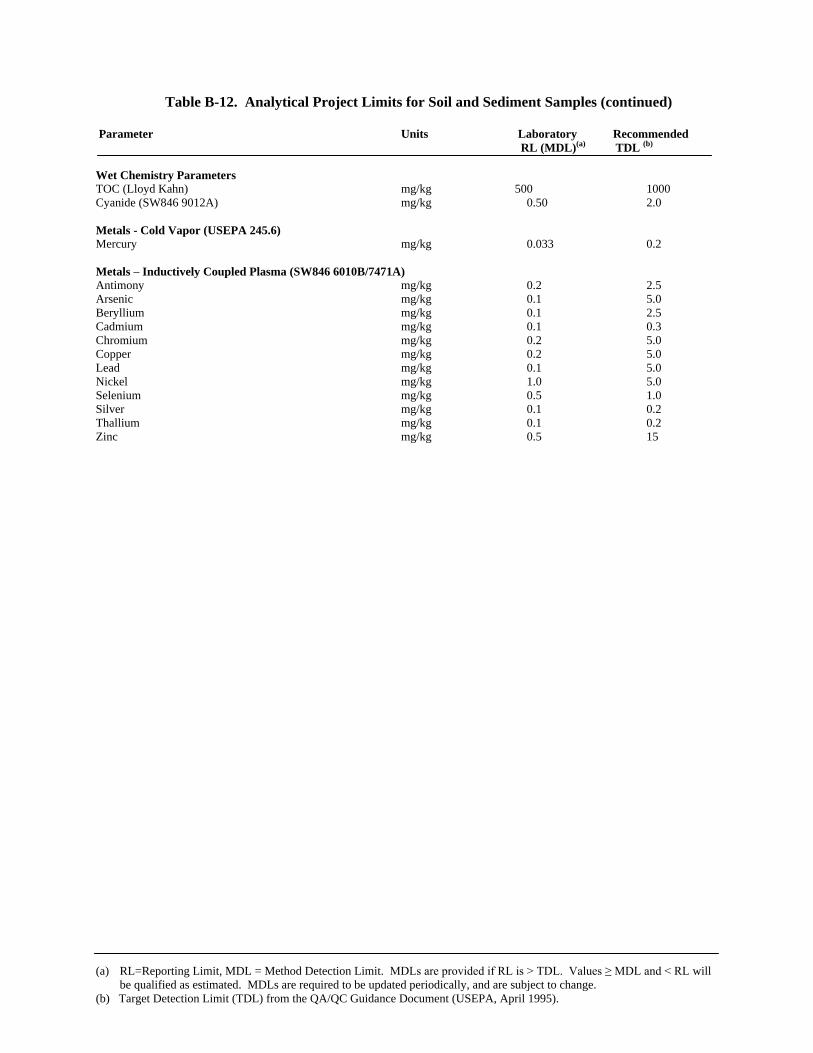
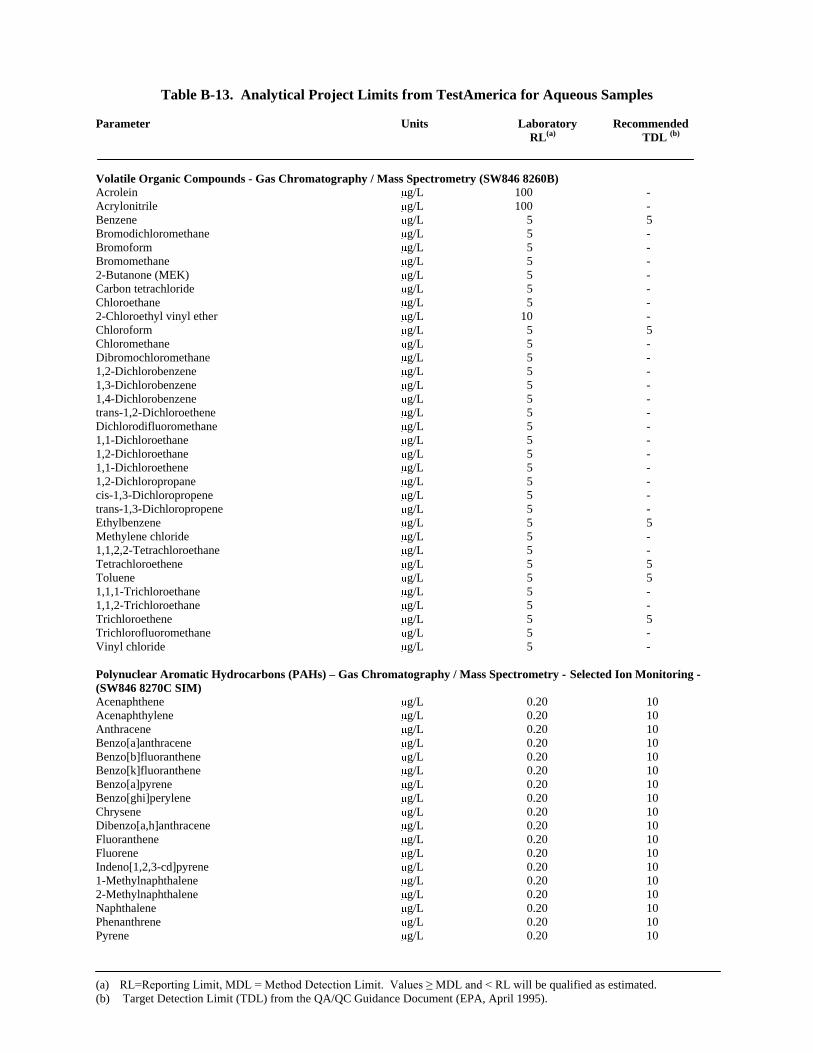
Quantitation limits applicable to this project are listed in Tables B-12 through B-14 for
soil/sediment, aqueous, and TCLP samples, respectively. These tables include the Target
Detection Limits (TDLs) referenced in the QA/QC Guidance for Sampling and Analysis of
Sediments, Water, and Tissues for Dredged Material Evaluations - Chemical Evaluations (EPA
823-B-95-001, April 1995). All analytical parameters, except grain size analyses and wet
chemistry parameters were quantified to the MDL. All detected values greater than or equal to
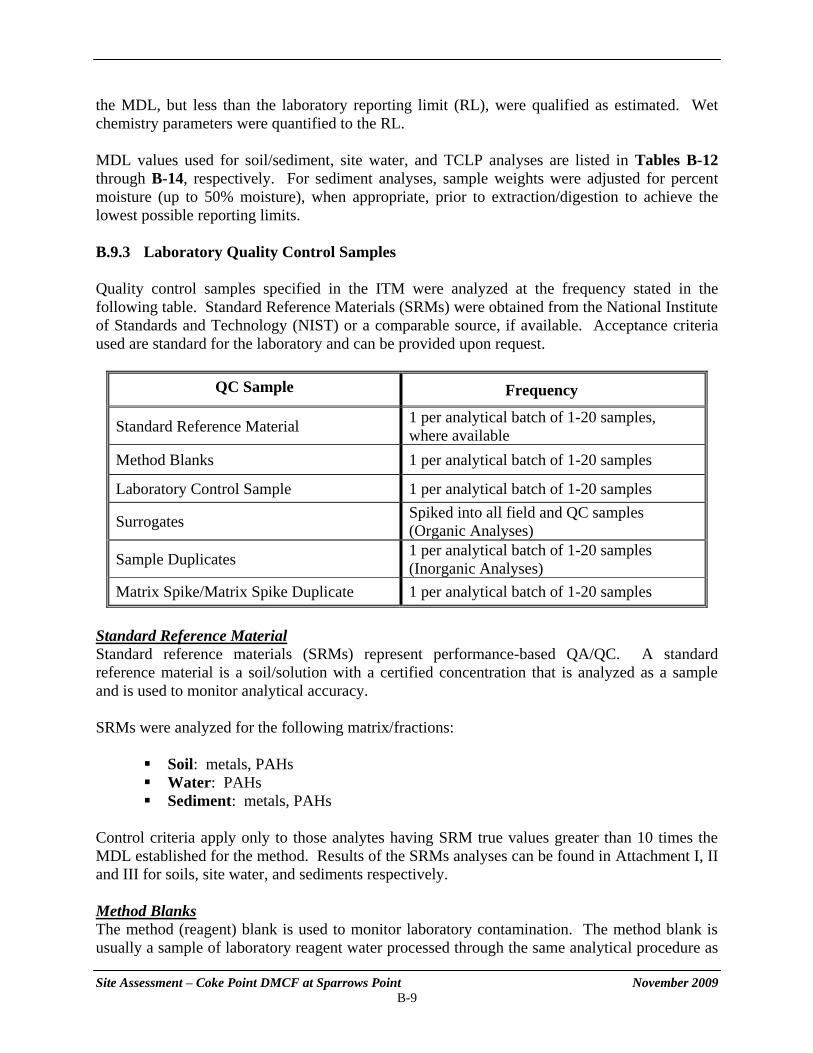
Site Assessment – Coke Point DMCF at Sparrows Point November 2009 B-9
the MDL, but less than the laboratory reporting limit (RL), were qualified as estimated. Wet
chemistry parameters were quantified to the RL.
MDL values used for soil/sediment, site water, and TCLP analyses are listed in Tables B-12
through B-14, respectively. For sediment analyses, sample weights were adjusted for percent
moisture (up to 50% moisture), when appropriate, prior to extraction/digestion to achieve the
lowest possible reporting limits.
B.9.3 Laboratory Quality Control Samples
Quality control samples specified in the ITM were analyzed at the frequency stated in the
following table. Standard Reference Materials (SRMs) were obtained from the National Institute
of Standards and Technology (NIST) or a comparable source, if available. Acceptance criteria
used are standard for the laboratory and can be provided upon request.
QC Sample Frequency
Standard Reference Material 1 per analytical batch of 1-20 samples,
where available
Method Blanks 1 per analytical batch of 1-20 samples
Laboratory Control Sample 1 per analytical batch of 1-20 samples
Surrogates Spiked into all field and QC samples
(Organic Analyses)
Sample Duplicates 1 per analytical batch of 1-20 samples
(Inorganic Analyses)
Matrix Spike/Matrix Spike Duplicate 1 per analytical batch of 1-20 samples
Standard Reference Material
Standard reference materials (SRMs) represent performance-based QA/QC. A standard
reference material is a soil/solution with a certified concentration that is analyzed as a sample
and is used to monitor analytical accuracy.
SRMs were analyzed for the following matrix/fractions:
Soil: metals, PAHs
Water: PAHs
Sediment: metals, PAHs
Control criteria apply only to those analytes having SRM true values greater than 10 times the
MDL established for the method. Results of the SRMs analyses can be found in Attachment I, II
and III for soils, site water, and sediments respectively.
Method Blanks
The method (reagent) blank is used to monitor laboratory contamination. The method blank is
usually a sample of laboratory reagent water processed through the same analytical procedure as

Site Assessment – Coke Point DMCF at Sparrows Point November 2009 B-10
the sample (i.e., digested, extracted, distilled). One method blank was analyzed at a frequency of
one per every analytical preparation batch of 20 or fewer samples.
Laboratory Control Sample
The Laboratory Control Sample (LCS) is a fortified method blank consisting of reagent water or
solid fortified with the analytes of interest for single-analyte methods and selected analytes for
multi-analyte methods according to the appropriate analytical method. LCS’s were prepared and
analyzed with each analytical batch, and analyte recoveries were used to monitor analytical
accuracy and precision.
Matrix Spike (MS) / Matrix Spike Duplicate (MSD)
A fortified sample (matrix spike) is an aliquot of a field sample that is fortified with the
analyte(s) of interest and analyzed to monitor matrix effects associated with a particular sample.
Samples to be spiked were chosen at random. The final spiked concentration of each analyte in
the sample was at least 10 times the calculated MDL. A duplicate-fortified sample (matrix spike
duplicate) was analyzed for every batch of 20 or fewer samples.
Sample Duplicates
A sample duplicate is a second aliquot of a field sample that is analyzed to monitor analytical
precision associated with that particular sample. Sample duplicates were performed for every
batch of 20 or fewer samples for those analytes that did not have MS/MSD analyses.
Surrogates
Surrogates are organic compounds that are similar to analytes of interest in chemical
composition, extraction, and chromatography, but are not normally found in environmental
samples. These compounds were spiked into all blank, standards, samples, and spiked samples
prior to analysis for organic parameters. Generally, surrogates are not used for inorganic
analyses. Percent recoveries were calculated for each surrogate. Surrogates were spiked into
samples according to the requirements of the reference analytical method. Surrogate spike
recoveries were evaluated against standard limits used by the laboratory, and were used to assess
method performance and sample measurement bias. If sample dilution caused the surrogate
concentration to fall below the quantitation limit, surrogate recoveries were not calculated.

Table B-1. In-Situ Water Quality Measurements at Site Water Sampling LocationsSparrows Point Site Assessment (2009)
Location Depth (ft MLW) Date Time Depth
IntervalTemperature
(°C)Salinity
(ppt)
Dissolved Oxygen (mg/L)
pH Turbidity (NTU)
Surface 3.58 9.71 12.1 8.44 6.6Mid-Depth 1.84 13.0 12.2 8.36 5.3
Bottom 2.10 13.3 12.0 7.95 4.8Surface 3.07 9.53 14.0 8.38 5.3
Mid-Depth 2.67 9.75 14.1 8.41 6.7Bottom 2.41 11.4 14.0 8.38 7.5Surface 3.26 9.53 14.4 8.4 8.0
Mid-Depth 3.00 9.65 14.5 8.38 6.7Bottom 2.46 10.0 14.8 8.44 4.0Surface 2.65 9.28 14.3 8.43 4.3
Mid-Depth 2.62 9.41 14.3 8.47 3.8Bottom 2.14 11.0 14.1 8.37 7.9Surface 2.66 9.35 13.9 8.52 5.0
Mid-Depth 2.28 10.5 13.9 8.47 4.5Bottom 1.91 11.3 13.8 8.41 5.0Surface 2.78 9.34 14.0 8.43 4.5
Mid-Depth 2.60 9.45 13.7 8.56 4.8Bottom 2.18 10.3 13.6 8.60 8.0Surface 2.8 9.39 14.3 8.57 7.1
Mid-Depth 2.82 9.38 13.8 8.61 7.1Bottom 2.74 9.44 13.8 8.61 6.9Surface 2.11 10.9 12.8 8.39 5.8
Mid-Depth 2.10 11.0 12.8 8.45 5.9Bottom 2.21 13.2 12.4 8.26 7.5Surface 2.09 10.9 13.2 8.41 6.0
Mid-Depth 2.08 11.0 13.1 8.44 6.5Bottom 2.11 11.3 12.9 8.39 7.3Surface 2.18 10.8 13.1 8.43 6.2
Mid-Depth 2.19 11.0 13.0 8.43 8.6Bottom 2.18 11.1 13.2 8.44 9.1Surface 2.2 11.1 12.9 8.39 7.2
Mid-Depth 2.2 11.1 12.9 8.44 7.1Bottom 2.19 11.3 12.8 8.46 9.0Surface 2.12 10.4 13.1 8.41 5.5
Mid-Depth 2.11 10.5 13.1 8.5 5.4Bottom 2.13 10.7 13.0 8.5 6.0Surface 2.17 10.5 13.8 8.41 5.0
Mid-Depth 2.22 10.8 13.7 8.44 5.5Bottom 2.28 11.3 13.5 8.41 6.3Surface 2.21 10.8 13.6 8.37 11.1
Mid-Depth 2.17 11.0 13.6 8.48 7.0Bottom 2.18 13.1 13.1 8.23 6.3Surface 2.25 10.9 13.8 8.31 10
Mid-Depth 2.19 10.9 13.7 8.52 6.8Bottom 2.17 10.9 13.7 8.55 8.8
12322/3/20097.1BH-W-10
BH-W-09 9.1 2/3/2009 1141
13252/3/200918.1BH-W-12
BH-W-11 12.6 2/3/2009 1300
BH-W-13A 6.0 2/3/2009 1349
BH-W-06 13.1 2/3/2009 1007
15552/2/20093.7BH-W-05
2/3/200912.5BH-W-08 1108
BH-W-07
1203
11262/2/200921.2
BH-W-03A
BH-W-02 7.2 2/2/2009
BH-W-01
BH-W-03C
BH-W-03B
BH-W-04 9.6 2/2/2009 1443
10352/3/200912.4
2/2/20092.2
14052/2/200913.4
10.8 2/2/2009 1336
1236

Table B-1. (continued)
Location Depth (ft MLW) Date Time Depth
IntervalTemperature
(°C)Salinity
(ppt)
Dissolved Oxygen (mg/L)
pH Turbidity (NTU)
Surface 2.17 10.9 13.7 8.41 5.7Mid-Depth 2.14 11.5 13.4 8.32 5.6
Bottom 2.19 13.1 12.6 8.08 5.7Surface 2.18 11.0 13.1 8.53 14.2
Mid-Depth 2.10 13.6 12.9 8.24 5.4Bottom 2.62 15.1 10.5 7.73 8.1Surface 2.26 11.0 13.4 8.55 6.4
Mid-Depth 2.15 11.7 13.2 8.34 5.8Bottom 2.27 14.0 12.8 8.01 6.9
14192/3/200919.2BH-W-13B
15152/3/200923.9BH-W-14
BH-W-13C 31.8 2/3/2009 1446

Table B-2. In-Situ Water Quality Measurements at Surface Sediment Sampling LocationsSparrows Point Site Assessment (2009)
Location Depth (ft MLW) Date Time Depth
IntervalTemperature
(°C)Salinity
(ppt)
Dissolved Oxygen (mg/L)
pH Turbidity (NTU)
Surface 3.07 12.5 13.9 8.03 7.3Mid-Depth 2.08 14.9 13.3 7.88 9.2
Bottom 2.21 15.6 11.8 7.74 42.8Surface 1.86 13.7 13.1 7.90 6.0
Mid-Depth 1.66 14.7 12.9 8.04 7.1Bottom 1.66 14.9 12.9 8.03 7.1Surface 1.55 14.6 13.4 7.99 6.3
Mid-Depth 1.49 14.6 13.3 8.06 6.9Bottom 1.41 14.5 13.2 8.07 6.9Surface 1.60 14.6 13.6 8.21 6.7
Mid-Depth 1.49 14.7 13.6 8.21 7.0Bottom 1.44 14.9 13.5 8.13 7.3Surface 1.75 14.8 13.9 8.3 6.7
Mid-Depth 1.58 14.6 13.8 8.19 7.3Bottom 1.57 14.6 13.4 8.19 7.2Surface 1.85 14.8 14.2 8.27 7.3
Mid-Depth 1.82 14.6 14.1 8.26 8.5Bottom 1.72 14.9 13.8 8.14 9.7Surface 1.65 14.7 14.3 8.28 8.9
Mid-Depth 1.59 14.7 14.1 8.32 8.5Bottom 1.48 14.7 14.1 8.32 8.5Surface 2.00 9.7 14.2 8.42 5.2
Mid-Depth 2.00 11.2 14.6 8.41 5.4Bottom 2.04 11.4 14.2 8.41 7.5Surface 2.17 9.57 14.2 8.42 5.3
Mid-Depth 2.09 10.3 14.2 8.50 5.4Bottom 2.19 13.3 14.0 8.33 8.1Surface 2.08 9.00 14.2 8.56 4.7
Mid-Depth 2.03 9.56 14.2 8.81 5.4Bottom 2.08 11.0 14.1 8.74 7.5Surface 2.26 8.88 14.5 8.60 4.5
Mid-Depth 2.08 9.97 14.7 8.55 6.3Bottom 2.01 10.6 14.8 8.54 7.3Surface 2.45 9.14 14.4 8.76 5.0
Mid-Depth 2.06 9.86 14.4 8.60 5.4Bottom 2.02 10.1 14.4 8.58 6.6Surface 2.27 8.80 14.4 8.59 4.4
Mid-Depth 2.13 9.12 14.4 8.59 4.9Bottom 2.04 14.2 14.0 8.17 10.5Surface 2.33 8.74 14.4 8.55 4.5
Mid-Depth 1.98 11.0 14.4 8.56 5.9Bottom 1.94 14.1 13.5 8.19 9.1Surface 2.95 8.87 14.6 8.62 4.3
Mid-Depth 2.67 9.01 14.8 8.57 4.5Bottom 1.93 11.6 14.7 8.51 8.2
BH-SED-04 8.7 2/6/2009 1402
13342/6/200914.4BH-SED-03C
BH-SED-03B 13.4 2/6/2009 1258
12262/6/200910.0BH-SED-03A
BH-SED-02 8.3 2/6/2009 1123
10502/6/200923.5BH-SED-01
1023
14342/6/20094.8BH-SED-05
BH-SED-13A 10.6
BH-SED-06 12.7 2/9/2009
16.4BH-SED-12
BH-SED-09 9.9 2/9/2009
10492/9/200911.0BH-SED-07
2/9/2009 1421
13052/9/2009
BH-SED-11 12.8 2/9/2009 1243
12172/9/20098.1BH-SED-10
1153
11122/9/200912.6BH-SED-08

Table B-2. (continued)
Location Depth (ft MLW) Date Time Depth
IntervalTemperature
(°C)Salinity
(ppt)
Dissolved Oxygen (mg/L)
pH Turbidity (NTU)
Surface 2.71 8.84 14.6 8.60 4.5Mid-Depth 1.91 13.9 14.3 8.36 6.2
Bottom 2.07 15.3 13.0 7.89 9.0Surface 2.81 8.84 14.6 8.58 4.5
Mid-Depth 2.03 14.4 13.6 8.05 9.6Bottom 2.38 16.1 10.3 7.60 14.5Surface 2.85 9.03 14.5 8.58 4.9
Mid-Depth 2.38 10.9 14.5 8.43 7.4Bottom 2.07 14.8 12.3 8.02 10.6Surface 3.11 10.9 14.3 8.51 3.7
Mid-Depth 2.88 13.4 14.6 8.45 4.9Bottom 2.47 14.8 13.7 7.06 16.2
29.2 2/9/2009 1503
2/9/2009
REFERENCE 17.1 2/9/2009 1602
15302/9/200924.6BH-SED-14
BH-SED-13C
143822.4BH-SED-13B

Table B-3. In-Situ Water Quality Measurements at Subsurface Sediment LocationsSparrows Point Site Assessment (2009)
Location Depth (MLW ft) Date Time Depth
IntervalTemperature
(°C)Salinity
(ppt)
Dissolved Oxygen (mg/L)
pH Turbidity (NTU)
Surface 10.2 12.1 12.7 8.37 7.0Mid-Depth 4.58 13.3 13.7 8.27 5.9
Bottom 4.26 13.3 13.5 8.11 15.0Surface - - - - -
Mid-Depth - - - - -Bottom - - - - -Surface 2.60 9.91 15.6 8.58 6.2
Mid-Depth - - - - -Bottom 2.75 11.4 15.7 8.59 9.8Surface 6.20 13.0 13.4 8.41 6.0
Mid-Depth 4.34 13.3 13.9 8.40 8.7Bottom 4.22 13.2 13.9 8.38 7.9Surface 4.72 12.9 14.1 8.44 6.6
Mid-Depth 4.13 13.2 14.2 8.45 7.3Bottom 4.13 13.5 14.0 8.37 8.1Surface 5.93 7.25 9.5 8.65 4.9
Mid-Depth 5.72 7.73 9.3 8.58 4.7Bottom 5.26 8.54 7.7 8.26 6.7Surface 5.46 6.45 9.9 8.73 4.8
Mid-Depth 4.99 7.02 10.1 8.71 4.5Bottom 4.56 8.76 9.3 8.47 5.0Surface 3.48 11.3 12.8 8.59 6.7
Mid-Depth 2.57 11.4 12.9 8.59 10.2Bottom 2.39 11.5 12.1 8.41 9.5Surface 2.95 11.2 13.9 8.32 14.4
Mid-Depth 2.42 11.6 13.4 8.20 8.6Bottom 2.41 11.5 13.0 8.16 8.3Surface 5.24 9.93 14.6 8.62 3.4
Mid-Depth 5.18 10.0 14.7 8.60 3.3Bottom 4.56 13.0 14.7 8.49 5.1Surface 2.10 7.6 14.5 8.46 6.3
Mid-Depth 2.57 10.2 13.7 8.40 6.5Bottom 2.56 10.6 13.5 8.39 7.5Surface - - - - -
Mid-Depth - - - - -Bottom - - - - -Surface 3.59 5.59 15.7 8.82 7.0
Mid-Depth 3.65 5.61 15.7 8.83 7.4Bottom 3.05 8.61 15.3 8.59 10.9Surface 2.97 13.7 15.6 8.67 11.1
Mid-Depth 2.94 14.2 15.7 8.68 11.7Bottom 2.90 13.8 15.7 8.65 10.9Surface 2.97 13.4 15.6 8.53 13.2
Mid-Depth 2.92 13.8 15.6 8.48 22.8Bottom 2.68 13.8 15.3 8.33 15.4
*No data were collected because of weather conditions
13152/16/200921.9BH-SED-01
14.8BH-SED-03C
BH-SED-03B 10.9 2/17/2009
5.5BH-SED-03A
BH-SED-02* 8.4 - -
11202/25/2009
13543/4/2009
10503/9/200917.6BH-SED-03E
1230
BH-SED-05
BH-SED-04 12 3/4/2009 1605
6.9
BH-SED-03D 15.8 3/11/2009 1305
10152/17/2009
BH-SED-06 14.6 2/17/2009 1458
-BH-SED-08*
BH-SED-07 13.4 3/5/2009 1035
-9.7
15552/24/200913.1BH-SED-11
BH-SED-10 9.1 2/24/2009 1324
15552/26/200910.8BH-SED-09
Table B-3. (continued)
Location Depth (MLW ft) Date Time Depth
IntervalTemperature
(°C)Salinity
(ppt)
Dissolved Oxygen (mg/L)
pH Turbidity (NTU)
Surface 4.26 12.3 13.4 8.35 7.6Mid-Depth 4.10 12.4 13.5 8.34 7.0
Bottom 3.88 12.6 13.3 8.24 7.2Surface 2.96 5.82 15.5 8.83 8.7
Mid-Depth 2.47 6.32 15.3 8.78 7.9Bottom 2.66 13.5 15.0 8.54 9.4Surface 2.59 5.81 17.4 8.77 8.4
Mid-Depth 2.75 13.3 16.6 8.44 8.6Bottom 2.97 13.8 13.5 8.00 9.6Surface 2.72 13.5 - 8.36 10.0
Mid-Depth 2.20 11.5 - 8.37 13.1Bottom 2.45 11.7 - 8.35 10.6Surface 3.12 5.74 15.7 8.75 6.6
Mid-Depth 3.15 13.4 15.2 8.32 5.9Bottom 3.00 13.5 13.8 7.87 10.7Surface 5.75 6.42 9.1 8.76 7.3
Mid-Depth 5.38 7.58 9.0 8.72 6.9Bottom 3.40 13.1 5.9 7.80 15.0Surface 5.68 8.33 8.1 8.53 18.1
Mid-Depth 5.24 9.22 7.9 8.32 14.5Bottom 4.93 9.82 7.1 8.07 13.0Surface 5.42 8.28 9.0 8.54 5.9
Mid-Depth 5.05 8.60 8.8 8.47 5.6Bottom 4.39 9.76 7.9 8.22 7.6Surface 5.34 8.02 9.8 8.63 5.5
Mid-Depth 5.26 8.22 9.5 8.61 5.5Bottom 4.26 10.2 8.3 8.22 8.5
*No data were collected due to weather conditions
BH-SED-13B 17.9 2/26/2009 1111
14152/25/20099.4BH-SED-13A
BH-SED-12 14.1 2/13/2009 1337
12333/10/200918.2BH-SED-18
BH-SED-15 20.1 3/11/2009 1056
16.6 3/10/2009 1045
10203/12/200915.9BH-SED-16
11133/4/200912.6BH-SED-13C
BH-SED-17
BH-SED-14 24.5 2/26/2009 1318

Table B-4. Sample Containers, Preservation Techniques, and Holding Times Sparrows Point Site Assessment (2009)
Parameter Analytical
Method Container Preservation Holding Time
ONSHORE SOILS AND OFFSHORE SEDIMENTS
Volatile Organic
Compounds
SW846
5035A/8260B 2 – Terra Cores 4 2 C
48 hours (prep)
14 days (analysis)
PAHs SW846 8270C
SIM
8 oz. wide-mouth glass,
Teflon-lined cap 4 2 C
14 days (extraction)
40 days (analysis)
Metals SW846 6010B
and 7471A
8 oz. wide-mouth glass,
Teflon-lined cap 4 2 C
180 days
28 days (Hg)
Cyanide SW846 9012A 8 oz. wide-mouth glass,
Teflon-lined cap
4 2 C
14 days
ONSHORE NAPL
Volatile Organic
Compounds
SW846
5035A/8260B 2 – 40 ml glass vials 4 2 C 14 days
PAHs SW846 8270C
SIM 2 – 40 ml glass vials 4 2 C
14 days (extraction)
40 days (analysis)
OFFSHORE SEDIMENTS ONLY
Grain Size ASTM D422 32 oz. glass 4 2 C 6 months
Moisture D2216-90 4 oz. wide-mouth glass,
Teflon-lined cap 4 2 C NA
Total Organic Carbon Lloyd Kahn Same as 32 oz. Jar for
grain size 4 2 C 14 days
PAH and Monocyclic
Aromatic Hydrocarbon
(MAH) Fingerprinting
EPA 8100M, EPA
8270M, ASTM D
5739-95
4 oz. wide-mouth glass,
Teflon-lined cap 4 2 C
14 days (extraction)
40 days (analysis)
OFFSHORE SITE WATER
Volatile Organic
Compounds SW846 8260B 3 – 40 ml glass vials
4 2 C
HCl pH <2 14 days
PAHs SW846 8270C
SIM 2 – 1 liter amber glass 4 2 C
7 days (extraction)
40 days (analysis)
TOXICITY CHARACTERISTIC LEACHING PROCEDURE (TCLP)
Metals (including
mercury)
SW846 1311,
6010B and 7470A
2 – 4 oz. wide-mouth
glass,
Teflon-lined cap 4 C
180 days (metals extraction)
28 days (mercury extraction)
28 days (analysis)
Volatile Organic
Compounds
SW846 1311,
8260B
4 oz. wide-mouth glass,
Teflon-lined cap 4 C
(no headspace)
14 days (extraction)
14 days (analysis)
Semivolatiles, Pesticides,
Herbicides
SW846 1311,
8270C/8081A/
8151A
32 oz. wide-mouth glass,
Teflon-lined cap 4 C
14 days (extraction)
7 days (preparative
extraction)
40 days (analysis)
NA – Not Applicable

Table B-5. Inorganic Data Qualifiers
C (Concentration) qualifiers:
B Estimated result; reported value is less than the project-specified Reporting Limit
(RL), but greater than the method-specified Instrument Detection Limit (IDL) or
Method Detection Limit (MDL).
U Analyte analyzed for but not detected (concentration is less than the method-
specified Instrument Detection Limit (IDL) or MDL.
Q (Quality control) qualifiers:
E Matrix interference; the serial dilution was outside of the percent difference
control limits.
J Method blank contamination. This qualifier is used when the analyte is found in
the associated method blank as well as in the sample. It indicates
possible/probable blank contamination. For Gas Chromatography/ Mass
Spectrophotometry (GC/MS) analyses, this qualifier is used for a Tentatively
Identified Compound (TIC), as well as, for a positively identified target
compound.
M Duplicate injection precision not met.
N Spiked sample recovery is not within control limits.
S Reported value is determined by the method of standard additions (MSA).
W Postdigestion spike for furnace Atomic Absorption Spectrophotometric (AAS)
AAS analysis is out of control limits (85-115%) and sample absorbance is less
than 50% of spike absorbance.
* Duplicate analyses and/or relative percent difference (RPD) is not within control
limits.
+ Correlation coefficient for MSA is less than 0.995.

Table B-6. Organic Data Qualifiers
C (Concentration) qualifiers:
COL There was more than 40% difference between initial and confirmation results. The
lower result was reported. (PCBs only)
EST PCB congeners flagged with “EST” indicate that the value is estimated because of
coelution with another PCB congener
G Elevated reporting limit, reporting limit elevated because of matrix interference.
I Matrix interference
J Estimated result; reported value is less than the project-specified Reporting Limit
(RL), but greater than the method-specified Instrument Detection Limit (IDL) or
Method Detection Limit (MDL).
PG Compound was detected, but the percent difference between the original and
confirmation analyses between the two GC columns is greater than 40%. The
highest value is presented
Q Compound was detected, but as an estimated maximum possible concentration
(EMPC).
U Analyte analyzed but not detected (concentration is less than the method-specified
Instrument Detection Limit (IDL) or MDL.
Q (Quality control) qualifiers:
A Tentatively identified compound is a suspected aldol condensation
B Method blank contamination. This qualifier is used when the analyte is found in
the associated method blank as well as in the sample. It indicates
possible/probable blank contamination
D Compound analyzed at a secondary dilution factor
E Compound was over the calibration range
M Duplicate injection precision not met.
N Identification of tentatively identified compound is based on a mass spectral
library search
* Duplicate analysis is not within control limits.
+ Correlation coefficient for MSA is less than 0.995.
Table B-7. Inorganic Validation Qualifiers
(NO CODE) Confirmed identification
B Not detected substantially above the level reported in laboratory or field blanks.
J The analyte is present. The reported value may not be accurate or precise.
K The analyte is present. The reported value may be biased high. The actual value
is expected to be lower than reported.
L The analyte is present. The reported value may be biased low. The actual value is
expected to be higher than reported.
R Unreliable result. Analyte may or may not be present in the samples. Supporting
data are necessary to confirm result.
U The analyte was analyzed for, but was not detected. The associated number
indicates the approximate sample concentration necessary to be detected.
UJ The analyte was analyzed for, but was not detected. The associated quantitation
limit is an estimate and may be inaccurate or imprecise.
UL The analyte was not detected, and the reported quantitation limit is probably
higher than reported.

Table B-8. Organic Validation Qualifiers
(NO CODE) Confirmed identification
B Not detected substantially above the level reported in laboratory or field blanks.
J The analyte is present. The reported value may not be accurate or precise.
K The analyte is present. The reported value may be biased high. The actual value
is expected to be lower than reported.
L The analyte is present. The reported value may be biased low. The actual value is
expected to be higher than reported.
N Tentative identification. Consider present. Special methods may be needed to
confirm its presence or absence in future sampling efforts.
NJ Quantitative identification questionable due to poor resolution. Presumptively
present at approximate quantity.
Q No analytical result.
R Unreliable result. Analyte may or may not be present in the samples. Supporting
data are necessary to confirm result.
U The analyte was analyzed for, but was not detected. The associated number
indicates the approximate sample concentration necessary to be detected.
UJ The analyte was analyzed for, but was not detected. The associated quantitation
limit is an estimate and may be inaccurate or imprecise.
UL The analyte was not detected, and the reported quantitation limit is probably
higher than reported.

Table B-9. Metals Validation Qualifiers
J The associated value is an estimated quantity.
K The analyte is present. The reported value may be biased high. The actual value
is expected to be lower than reported.
L The analyte is present. The reported value may be biased low. The actual value is
expected to be higher than reported.
R The data are unusable. (Note: The analyte may or may not be present.)
U The analyte was analyzed for, but was not detected above the level of the
associated value. The associated value is either the sample quantitation limit or
the sample detection limit.
UJ The analyte was analyzed for, but was not detected. The associated detection
limit is an estimate and may be inaccurate or imprecise.
UL The analyte was not detected, and the reported quantitation limit is probably
higher than reported.
Table B-10. Analytical Method Detection Limits From META
Environmental For Soil and Sediment Samples
Parameter Units Laboratory MDL
Acenaphthene g/kg 0.543
Acenaphthylene g/kg 0.52
Anthracene g/kg 0.471
Benzene g/kg 0.832
Benzo[a]anthracene g/kg 0.803
Benzo[a]pyrene g/kg 1.21
Benzo[b]fluoranthene g/kg 0.908
Benzo[e]pyrene g/kg 0.606
Benzo[ghi]perylene g/kg 0.774
Benzo[k]fluoranthene g/kg 1.13
n-Butylbenzene g/kg 1.57
sec-Butylbenzene g/kg 0.517
Chrysene g/kg 0.638
Dibenzo[a,h]anthracene g/kg 1.36
Dibenzofuran g/kg 0.797
Dibenzothiophene g/kg 0.41
Ethylbenzene g/kg 0.65
Fluoranthene g/kg 0.702
Fluorene g/kg 0.715
Indeno[1,2,3‑cd]pyrene g/kg 1.16
Isopropylbenzene g/kg 0.34
p-Isopropyltoluene g/kg 0.874
1‑Methylnaphthalene g/kg 0.524
2‑Methylnaphthalene g/kg 1.42
Naphthalene g/kg 1.48
Phenanthrene g/kg 0.546
n-Propylbenzene g/kg 0.625
Pyrene g/kg 0.66
Styrene g/kg 0.906
Toluene g/kg 0.796
1,2,4-Trimethylbenzene g/kg 0.767
1,3,5-Trimethylbenzene g/kg 0.422
m/p-Xylenes g/kg 2.74
o-Xylene g/kg 0.722
ECD = Electron Capture Detector FPD = Flame Photometric Detector ICP = Inductively Coupled Plasma MS = Mass Spectrometry SIM = Selected Ion Monitoring Matrix Codes: S=Soil/Sediment; W=Water; L=TCLP Leachate; N=NAPL
Table B-11. Analytical Methods
PARAMETER METHOD METHOD # MATRIX REFERENCEORGANICS – EXTRACTION CLEANUP Sulfuric Acid Cleanup Liquid-liquid Partitioning 3665A S USEPA 1997 Sulfur Cleanup Treatment with copper or mercury or TBA 3660A/B S USEPA 1997 ORGANICS Volatile Organic Compounds (VOC) Gas Chromatography/Mass Spectrometry 8260B S,W,N,L USEPA 1997 Semivolatile Organic Compounds (SVOC) Gas Chromatography/Mass Spectrometry 8270C L USEPA 1997 Polycyclic Aromatic Hydrocarbons (PAH) Gas Chromatography/Mass Spectrometry-SIM 8270C SIM S,W,N USEPA 1997 Organochlorine Pesticides Gas Chromatography – ECD 8081A L USEPA 1997 Herbicides Gas Chromatography – ECD 8151A L USEPA 1997 METALS Antimony Atomic Emission – ICP/MS 6020 S USEPA 1997 Arsenic Atomic Emission – ICP/MS 6020 S,L USEPA 1997 Barium Atomic Emission – ICP/MS 6020 L USEPA 1997 Beryllium Atomic Emission – ICP/MS 6020 S USEPA 1997 Cadmium Atomic Emission – ICP/MS 6020 S,L USEPA 1997 Chromium Atomic Emission – ICP/MS 6020 S,L USEPA 1997 Copper Atomic Emission – ICP/MS 6020 S USEPA 1997 Lead Atomic Emission – ICP/MS 6020 S,L USEPA 1997 Mercury Atomic Absorption - Cold Vapor 7471A S,L USEPA 1997 Nickel Atomic Emission – ICP/MS 6020 S USEPA 1997 Selenium Atomic Emission – ICP/MS 6020 S,L USEPA 1997 Silver Atomic Emission – ICP/MS 6020 S,L USEPA 1997 Thallium Atomic Emission – ICP/MS 6020 S USEPA 1997 Zinc Atomic Emission – ICP/MS 6020 S USEPA 1997 INORGANIC NONMETALS Cyanide, Total Colorimetric - Automated 9012A S USEPA 1997 Total Organic Carbon Combustion Oxidation Lloyd Kahn S USEPA 1988 PHYSICAL PROPERTIES Grain Size (Sieve and Hydrometer) ---------- D422 S ASTM 1995 Moisture Content ---------- D2216-90 S ASTM 1990 TCLP TCLP Sample Creation Leaching Procedure 1311 S USEPA 1997
References:
American Society for Testing and Materials (ASTM). 1995. Annual Book of ASTM Standards. Volume 4.08. ASTM, Philadelphia, PA.
American Society for Testing and Materials (ASTM), 1990. Standard method for laboratory determination of water
(moisture) content of soil and rock. Annual Book of ASTM Standards, D 2216-90 (revision of 2216-63, 2216-80).
United States Environmental Protection Agency (USEPA). 1997. Test Methods for Evaluating Solid Waste.
Physical/Chemical Methods. EPA SW-846, 3rd Edition, including Final Update III. U.S. EPA, Washington, D.C. June.
United States Environmental Protection Agency (USEPA). 1988. Determination of Total Organic Carbon in
Sediment. USEPA Region II. Edison, N.J.
(a) RL=Reporting Limit, MDL = Method Detection Limit. MDLs are provided if RL is > TDL. Values ≥ MDL and < RL will
be qualified as estimated. MDLs are required to be updated periodically, and are subject to change.
(b) Target Detection Limit (TDL) from the QA/QC Guidance Document (USEPA, April 1995).
Table B-12. Analytical Project Limits from TestAmerica for Soil and Sediment Samples
Parameter Units Laboratory Recommended
RL (MDL)(a)
TDL (b)
Volatile Organic Compounds - Gas Chromatography / Mass Spectrometry (SW846 8260B)
Acrolein g/kg 100 -
Acrylonitrile g/kg 100 -
Benzene g/kg 5 10
Bromodichloromethane g/kg 5 -
Bromoform g/kg 5 -
Bromomethane g/kg 5 -
2-Butanone (MEK) g/kg 5 20
Carbon tetrachloride g/kg 5 -
Chloroethane g/kg 5 -
2-Chloroethyl vinyl ether g/kg 10 -
Chloroform g/kg 5 -
Chloromethane g/kg 5 -
Dibromochloromethane g/kg 5 -
1,2-Dichlorobenzene g/kg 5 20
1,3-Dichlorobenzene g/kg 5 20
1,4-Dichlorobenzene g/kg 5 20
trans-1,2-Dichloroethene g/kg 5 -
Dichlorodifluoromethane g/kg 5 -
1,1-Dichloroethane g/kg 5 -
1,2-Dichloroethane g/kg 5 -
1,1-Dichloroethene g/kg 5 -
1,2-Dichloropropane g/kg 5 -
cis-1,3-Dichloropropene g/kg 5 -
trans-1,3-Dichloropropene g/kg 5 -
Ethylbenzene g/kg 5 10
Methylene chloride g/kg 5 -
1,1,2,2-Tetrachloroethane g/kg 5 -
Tetrachloroethene g/kg 5 10
Toluene g/kg 5 10
1,1,1-Trichloroethane g/kg 5 -
1,1,2-Trichloroethane g/kg 5 -
Trichloroethene g/kg 5 10
Trichlorofluoromethane g/kg 5 -
Vinyl chloride g/kg 5 -
Polynuclear Aromatic Hydrocarbons (PAHs) – Gas Chromatography / Mass Spectrometry – Selected Ion Monitoring
(SW846 8270C SIM) Acenaphthene g/kg 6.7 20
Acenaphthylene g/kg 6.7 (1.93) 20
Anthracene g/kg 6.7 20
Benzo[a]anthracene g/kg 6.7 20
Benzo[b]fluoranthene g/kg 6.7 20
Benzo[k]fluoranthene g/kg 6.7 20
Benzo[a]pyrene g/kg 6.7 20
Benzo[ghi]perylene g/kg 6.7 20
Chrysene g/kg 6.7 20
Dibenzo[a,h]anthracene g/kg 6.7 (2.11) 20
Fluoranthene g/kg 6.7 20
Fluorene g/kg 6.7 20
Indeno[1,2,3-cd]pyrene g/kg 6.7 20
1-Methylnaphthalene g/kg 6.7 20
2-Methylnaphthalene g/kg 6.7 20
Naphthalene g/kg 6.7 20
Phenanthrene g/kg 6.7 20
Pyrene g/kg 6.7 20
(a) RL=Reporting Limit, MDL = Method Detection Limit. MDLs are provided if RL is > TDL. Values ≥ MDL and < RL will
be qualified as estimated. MDLs are required to be updated periodically, and are subject to change.
(b) Target Detection Limit (TDL) from the QA/QC Guidance Document (USEPA, April 1995).
Table B-12. Analytical Project Limits for Soil and Sediment Samples (continued)
Parameter Units Laboratory Recommended
RL (MDL)(a)
TDL (b)
Wet Chemistry Parameters
TOC (Lloyd Kahn) mg/kg 500 1000
Cyanide (SW846 9012A) mg/kg 0.50 2.0
Metals - Cold Vapor (USEPA 245.6) Mercury mg/kg 0.033 0.2
Metals – Inductively Coupled Plasma (SW846 6010B/7471A) Antimony mg/kg 0.2 2.5
Arsenic mg/kg 0.1 5.0
Beryllium mg/kg 0.1 2.5
Cadmium mg/kg 0.1 0.3
Chromium mg/kg 0.2 5.0
Copper mg/kg 0.2 5.0
Lead mg/kg 0.1 5.0
Nickel mg/kg 1.0 5.0
Selenium mg/kg 0.5 1.0
Silver mg/kg 0.1 0.2
Thallium mg/kg 0.1 0.2
Zinc mg/kg 0.5 15
(a) RL=Reporting Limit, MDL = Method Detection Limit. Values ≥ MDL and < RL will be qualified as estimated.
(b) Target Detection Limit (TDL) from the QA/QC Guidance Document (EPA, April 1995).
Table B-13. Analytical Project Limits from TestAmerica for Aqueous Samples
Parameter Units Laboratory Recommended
RL(a)
TDL (b)
Volatile Organic Compounds - Gas Chromatography / Mass Spectrometry (SW846 8260B)
Acrolein g/L 100 -
Acrylonitrile g/L 100 -
Benzene g/L 5 5
Bromodichloromethane g/L 5 -
Bromoform g/L 5 -
Bromomethane g/L 5 -
2-Butanone (MEK) g/L 5 -
Carbon tetrachloride g/L 5 -
Chloroethane g/L 5 -
2-Chloroethyl vinyl ether g/L 10 -
Chloroform g/L 5 5
Chloromethane g/L 5 -
Dibromochloromethane g/L 5 -
1,2-Dichlorobenzene g/L 5 -
1,3-Dichlorobenzene g/L 5 -
1,4-Dichlorobenzene g/L 5 -
trans-1,2-Dichloroethene g/L 5 -
Dichlorodifluoromethane g/L 5 -
1,1-Dichloroethane g/L 5 -
1,2-Dichloroethane g/L 5 -
1,1-Dichloroethene g/L 5 -
1,2-Dichloropropane g/L 5 -
cis-1,3-Dichloropropene g/L 5 -
trans-1,3-Dichloropropene g/L 5 -
Ethylbenzene g/L 5 5
Methylene chloride g/L 5 -
1,1,2,2-Tetrachloroethane g/L 5 -
Tetrachloroethene g/L 5 5
Toluene g/L 5 5
1,1,1-Trichloroethane g/L 5 -
1,1,2-Trichloroethane g/L 5 -
Trichloroethene g/L 5 5
Trichlorofluoromethane g/L 5 -
Vinyl chloride g/L 5 -
Polynuclear Aromatic Hydrocarbons (PAHs) – Gas Chromatography / Mass Spectrometry - Selected Ion Monitoring -
(SW846 8270C SIM) Acenaphthene g/L 0.20 10
Acenaphthylene g/L 0.20 10
Anthracene g/L 0.20 10
Benzo[a]anthracene g/L 0.20 10
Benzo[b]fluoranthene g/L 0.20 10
Benzo[k]fluoranthene g/L 0.20 10
Benzo[a]pyrene g/L 0.20 10
Benzo[ghi]perylene g/L 0.20 10
Chrysene g/L 0.20 10
Dibenzo[a,h]anthracene g/L 0.20 10
Fluoranthene g/L 0.20 10
Fluorene g/L 0.20 10
Indeno[1,2,3-cd]pyrene g/L 0.20 10
1-Methylnaphthalene g/L 0.20 10
2-Methylnaphthalene g/L 0.20 10
Naphthalene g/L 0.20 10
Phenanthrene g/L 0.20 10
Pyrene g/L 0.20 10
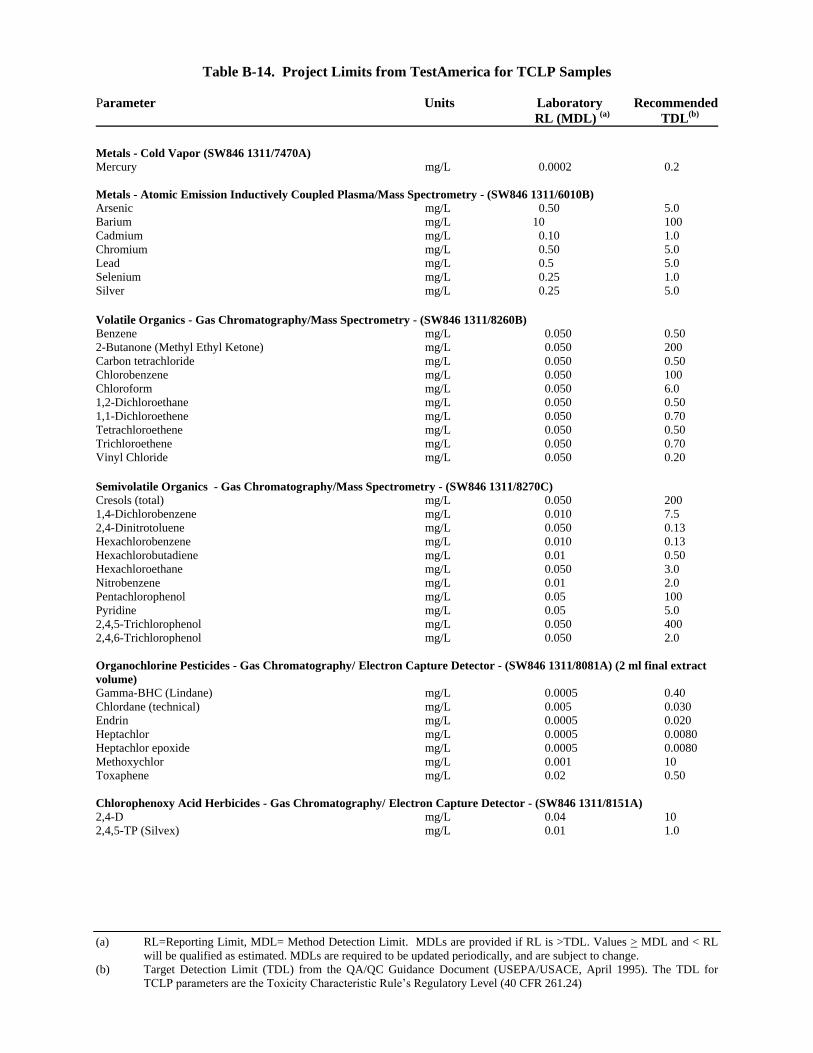
Table B-14. Project Limits from TestAmerica for TCLP Samples
Parameter Units Laboratory Recommended
RL (MDL) (a)
TDL(b)
(a) RL=Reporting Limit, MDL= Method Detection Limit. MDLs are provided if RL is >TDL. Values > MDL and < RL
will be qualified as estimated. MDLs are required to be updated periodically, and are subject to change.
(b) Target Detection Limit (TDL) from the QA/QC Guidance Document (USEPA/USACE, April 1995). The TDL for
TCLP parameters are the Toxicity Characteristic Rule’s Regulatory Level (40 CFR 261.24)
Metals - Cold Vapor (SW846 1311/7470A) Mercury mg/L 0.0002 0.2
Metals - Atomic Emission Inductively Coupled Plasma/Mass Spectrometry - (SW846 1311/6010B) Arsenic mg/L 0.50 5.0
Barium mg/L 10 100
Cadmium mg/L 0.10 1.0
Chromium mg/L 0.50 5.0
Lead mg/L 0.5 5.0
Selenium mg/L 0.25 1.0
Silver mg/L 0.25 5.0
Volatile Organics - Gas Chromatography/Mass Spectrometry - (SW846 1311/8260B)
Benzene mg/L 0.050 0.50
2-Butanone (Methyl Ethyl Ketone) mg/L 0.050 200
Carbon tetrachloride mg/L 0.050 0.50
Chlorobenzene mg/L 0.050 100
Chloroform mg/L 0.050 6.0
1,2-Dichloroethane mg/L 0.050 0.50
1,1-Dichloroethene mg/L 0.050 0.70
Tetrachloroethene mg/L 0.050 0.50
Trichloroethene mg/L 0.050 0.70
Vinyl Chloride mg/L 0.050 0.20
Semivolatile Organics - Gas Chromatography/Mass Spectrometry - (SW846 1311/8270C)
Cresols (total) mg/L 0.050 200
1,4-Dichlorobenzene mg/L 0.010 7.5
2,4-Dinitrotoluene mg/L 0.050 0.13
Hexachlorobenzene mg/L 0.010 0.13
Hexachlorobutadiene mg/L 0.01 0.50
Hexachloroethane mg/L 0.050 3.0
Nitrobenzene mg/L 0.01 2.0
Pentachlorophenol mg/L 0.05 100
Pyridine mg/L 0.05 5.0
2,4,5-Trichlorophenol mg/L 0.050 400
2,4,6-Trichlorophenol mg/L 0.050 2.0
Organochlorine Pesticides - Gas Chromatography/ Electron Capture Detector - (SW846 1311/8081A) (2 ml final extract
volume)
Gamma-BHC (Lindane) mg/L 0.0005 0.40
Chlordane (technical) mg/L 0.005 0.030
Endrin mg/L 0.0005 0.020
Heptachlor mg/L 0.0005 0.0080
Heptachlor epoxide mg/L 0.0005 0.0080
Methoxychlor mg/L 0.001 10
Toxaphene mg/L 0.02 0.50
Chlorophenoxy Acid Herbicides - Gas Chromatography/ Electron Capture Detector - (SW846 1311/8151A)
2,4-D mg/L 0.04 10
2,4,5-TP (Silvex) mg/L 0.01 1.0
Site Assessment – Coke Point DMCF at Sparrows Point November 2009
OFFSHORE INVESTIGATION
CHAIN-OF-CUSTODY DOCUMENTATION
C9B030207
6(1-129)

C9B030207
7(1-129)
C9B040153
7(1 - 187)
C9B040153
8(1 - 187)

C9B070192
8(1 - 135)

C9B100188
7(1 - 150)

4 of 25
C9B120236 6 (1-27)

C9B140124
7(1-67)

C9B170199
7(1 - 68)
C9B180150
7(1 - 88)

C9B200184
7(1 - 68)
C9B250192
7(1 - 72)
C9B260261
3(1-17)

CHAIN OF' CUSTODY RECORD PROJECT $ p , + , q ~ ~ ~ ~ P01N7 R C A ~ TAJEJTIGAT,OA
CONTACT f,hd I< @4 & LAI co COMPANY EA EAJGIIJFFRIAG
ADDRESS L ~ V F - , 16.94 c /&ccd ,J,/,+~KJ N Q . z / / b z
Turn Around Time
Standard
If Authorized *
1 Week
META Environmental, Inc. 49 Clarendon St. - Watertown, Massachusetts - 02472 ~
Tel(617) 923-4662 - Fax (617) 923-4610 - www.metaenv.com
I I* Surcharges may apply I
4 of 25
C9C020106 6 (1 - 27)

C9B270261
7(1 - 66)

C9C050210
7(1-83)

CHAIN OF CUSTODY RECORD
CONTACT FAANK OARaanl c; u
COMPANY EA E/\I,$INEER/R/G
Turn Around Time
Standard
If Authorized *
1 Week
META Environmental, Inc. 49 Clarendon St. - Watertown, Massachusetts - 02472
Tel(617) 923-4662 - Fax (617) 923-4610 - www.metaenv.com
I * Surcharges may apply I
5 of 49
C9D080110 7 (1-51)
C9C060295
3(1-19)

C9C100191
7(1 - 57)

C9C110188
7(1-62)
C9C120252
7(1 - 85)
C9C130178
7(1 - 56)
C9D270163
6(1 - 55)

Site Assessment – Coke Point DMCF at Sparrows Point November 2009
ONSHORE INVESTIGATION
CHAIN-OF-CUSTODY DOCUMENTATION
C9E200178
7(1 - 76)

18 of 245

C9E210170
7(1 - 76)

C9E220334
7(1 - 87)

C9E240103
7(1 - 81)
C9E280323
6(1 - 68)

21 of 245

24 of 245

C9E300194
7(1 - 77)

C9F030296
7(1 - 72)
27 of 245
C9F050380
7(1 - 72)

C9F090183
7(1 - 72)

C9F100297
6(1 - 69)
30 of 245

C9F120311
7(1 - 86)

C9F160238
7(1 - 100)

C9F200206
7(1 - 61)
C9F230278
7(1 - 62)

C9F260330R
7(1 - 58)