appendix a california bearing ratio design methodology · california bearing ratio design...
TRANSCRIPT
FM 5-410
APPENDIX A
California Bearing Ratio
Design Methodology
The CBR is the basis for determining thethickness of soil and aggregate layers used inthe design of roads and airfields in the theaterof operations. A soil’s CBR value is an indexof its resistance to shearing under a standardload compared to the shearing resistance of astandard material (crushed limestone) sub-jected to the same load.
CBR DESIGN METHODOLOGYThe CBR design methodology has four
major parts:Evaluate the soil to determine its en-gineering characteristics (gradation,Atterberg limits, swell potential,Proctor test (CE 55 compaction test)and CBR test). These tests are per-formed by a Materials QualitySpecialist, Military OccupationalSpeciality (MOS) 51G or a soils test-ing laboratory according to standardtesting procedures (see TM 5-530).Evaluate the laboratory data to deter-mine the initial design CBR valueand the compactive effort to be ap-plied during construction.Evaluate all soil data to determinethe final design CBR and construc-tion use of the soil or aggregate.Determine the thickness of the soillayer based on the final design CBRand the road or airfield use category(see TM 5-330).
This appendix focuses on the second and thirdparts of the methodology.
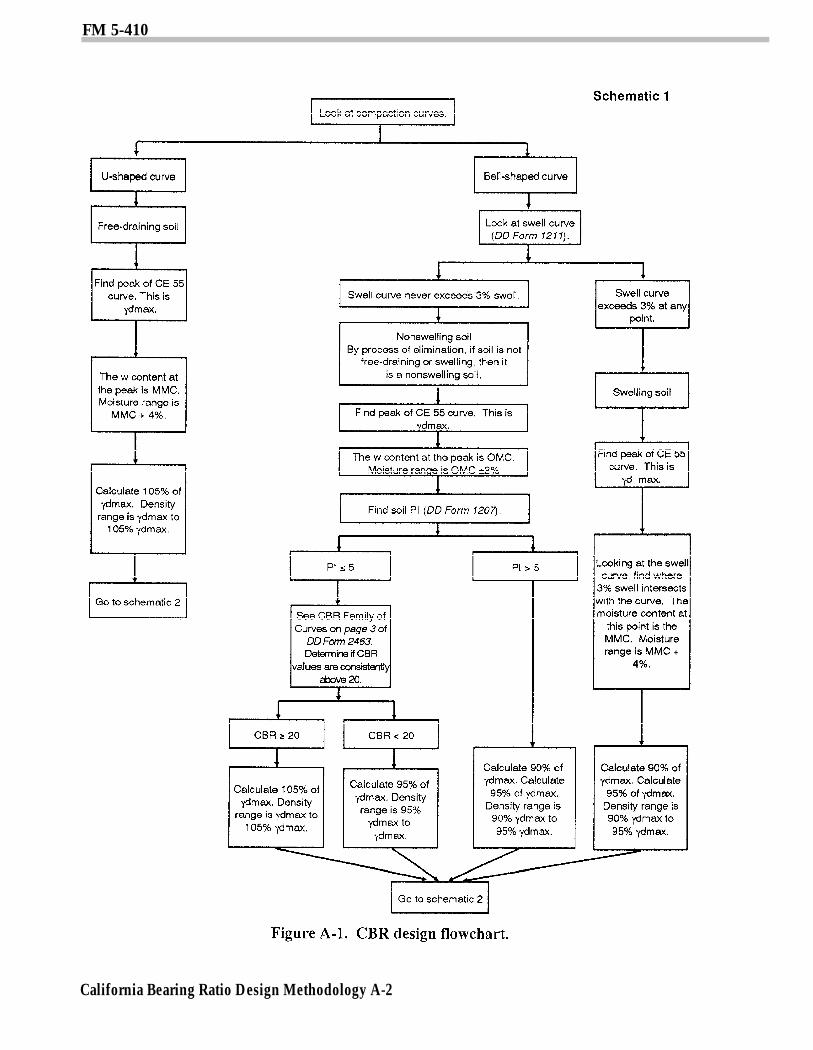
CBR Design FlowchartThe CBR Design Flowchart (see Figure A-1,
pages A-2 and A-3) is a useful tool when deter-mining the initial and final design CBRvalues.
Step 1 - Look at the Compaction Curves.For CBR analysis, soils are classified into oneof three soil groups:
Free-draining.Swelling.Nonswelling.
The compaction curve on page 1 of a Depart-ment of Defense (DD) Form 2463 gives anindication as to the group in which a par-ticular soil falls. A U-shaped compactioncurve indicates a free-draining soil. A bell-shaped compaction curve indicates that thesoil is either a swelling or a nonswelling soil.
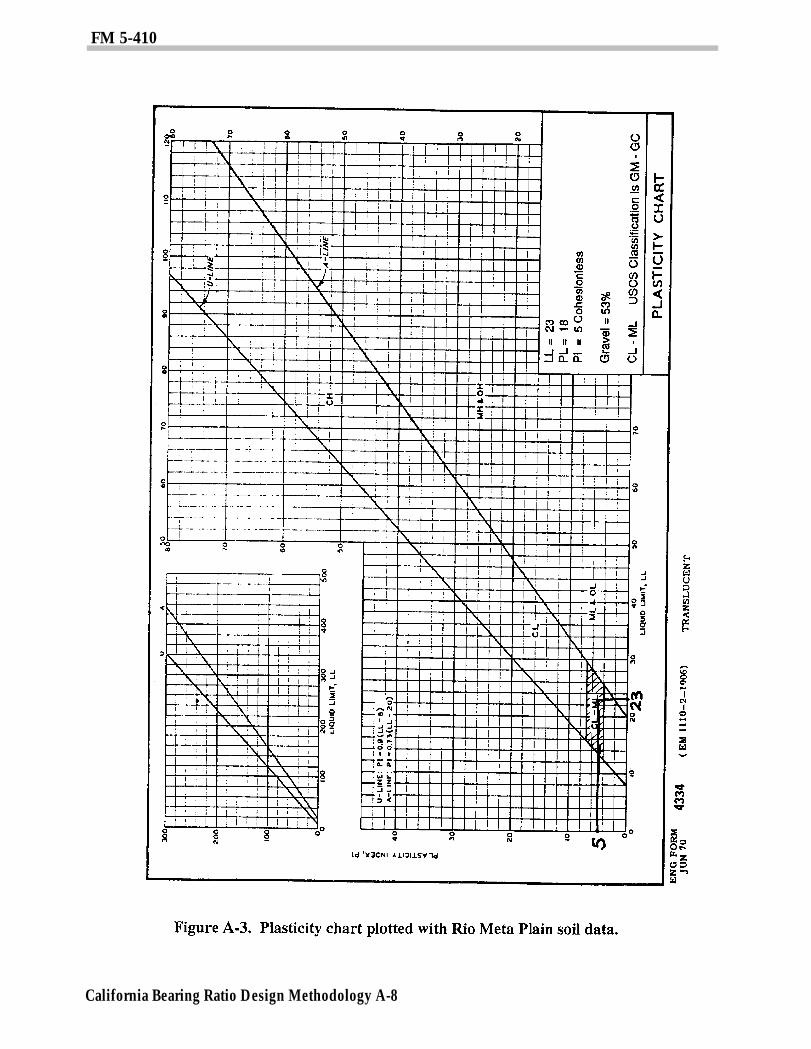
Step 2- Look at the Swell Curve. To distin-guish between a swelling and nonswellingsoil, look at the swell data plotted on a DDForm 1211. If the percent of swell exceeds 3percent for any soil moisture content, the soilis classified as a swelling soil. If the percent ofswell never exceeds 3 percent, the soil is non-swelling.
Step 3- Find the Peak of the CE 55 Curve.The maximum dry density is found at the
California Bearing Ratio Design Methodology A-1
FM 5-410
California Bearing Ratio Design Methodology A-2
FM 5-410
California Bearing Ratio Design Methodology A-3
FM 5-410
peak of the CE 55 curve. For free-drainingsoils, the peak of the curve occurs at the pointof the curve where there is no increase in drydensity with an increase in moisture.
Step 4- Determine the Design MoistureRange. The design moisture range is in-fluenced by the soil group.
Free-draining soils. The moisturecontent that corresponds to the maxi-mum dry density is the MMC. Thedesign moisture range is MMC + 4percent. For example, if the maxi-mum dry density occurred at 13 per-cent soil moisture, the MMC wouldequal 13 percent and the design mois-ture range would be 13 to 17 percentsoil moisture.Swelling soils. Army standards per-mit no more than 3 percent swell tooccur after a soil has been placed andcompacted. Therefore, swelling soilsmust be preswelled to a moisture con-tent that will result in 3 percent orless swell. The moisture content atwhich 3 percent swell occurs is calledthe MMC. The design moisture rangefor a swelling soil is MMC + 4 per-cent. The moisture content cor-responding to the maximum drydensity is not considered for swellingsoils.Nonswelling soils. The moisture con-tent that corresponds to the maxi-mum dry density is the OMC. Thedesign moisture range is OMC ±2percent. For example, if the OMC is12 percent, the design moisture rangewould be 10 to 14 percent.
PI
P I 20. cohesion-
values
Step 5 - Find the Soil Plasticity Index.This step applies to nonswelling soils only.Noncohesive soils (PI to greater densities than cohesive soils (PI5). If the soil is cohesionless, look at the CBRFamily of Curves on page 3 of a DD Form 2463to determine the cornpactive effort.
5)can be compacted
Step 6 - Determine the Density Range.The theater-of-operations, standard compac-tion range is 5 percent, unless otherwise
stated. The maximum dry density is thebasis for determining the density range (com-pactive effort).
Free-draining soils. They are comp-acted to between 100 percent and105 percent maximum dry density.Swelling soils. They are compacted tobetween 90 and 95 percent of maxi-mum dry density.NonsweIling soils.—
—
—
PI > 5. Cohesive nonswelling soilsare compacted to between 90% and95% of maximum dry density.
5 and CBR < 20. cohesionless,nonswelling soils having CBRvalues below 20 are compacted tobetween 95 percent and 100 per-cent maximum dry density.
5 and CBRless, nonswelling soils having CBR
20 are compacted to be-tween 100 percent and 105 percentmaximum dry density.
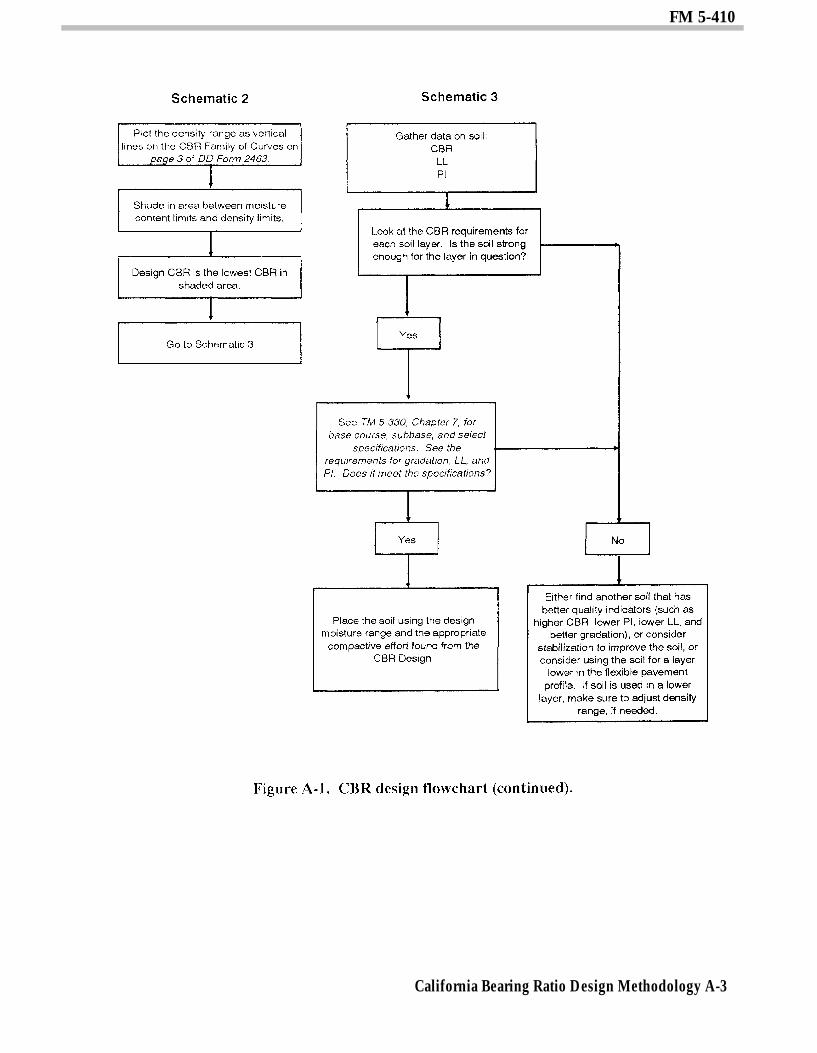
Step 7 - Plot the Density Range. Draw ver-tical lines on the CBR Family of Curves onpage of a DD 2463, corresponding to the den-sity range determined in previous steps.Circle the moisture values that correspond tothe moisture range determined in earlier (fivemoisture values should be circled).
Step 8- Determine the Initial DesignCBR. Using the CBR Family of Curves, findwhere each moisture curve, within the mois-ture range, enters and exits the density-rangelimit lines drawn in previous step. Find theCBR value corresponding to the lowestentrance or exit point of each curve. This isthe initial design CBR.
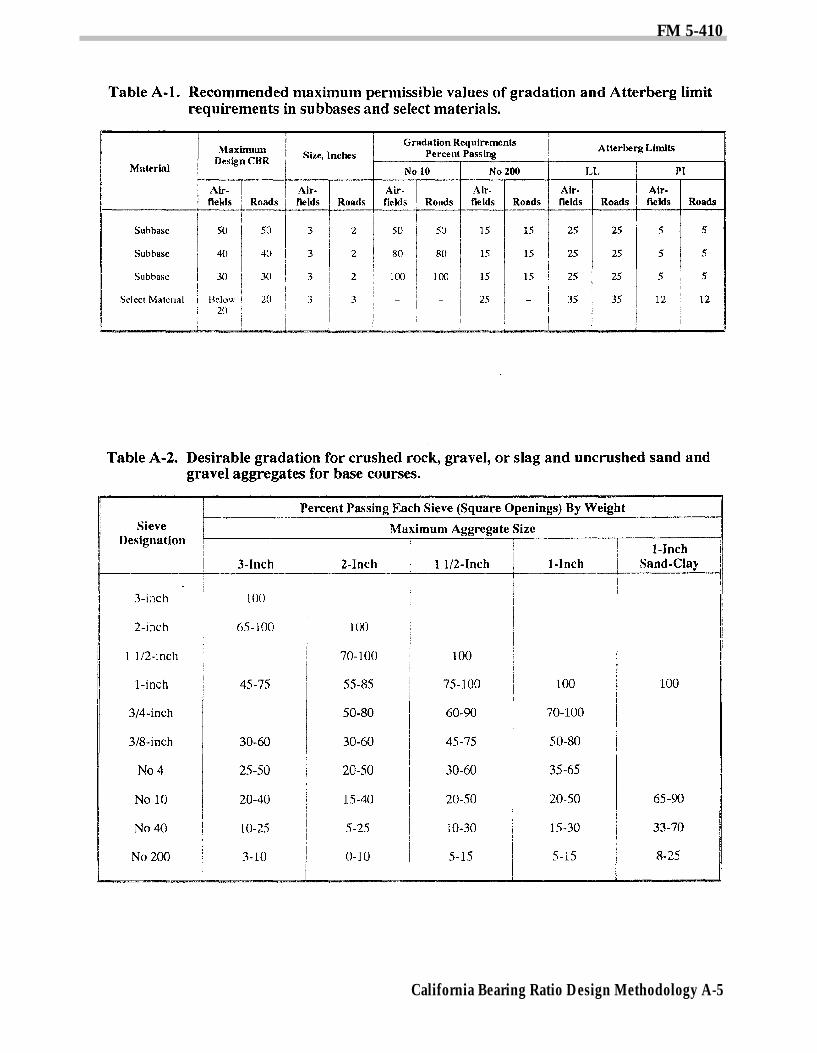
Step 9- Gather the Soil Data. The CBR isnot the only criteria used when determiningwhere to place a soil in the road or airfielddesign. Criteria for the LL, the PI, and thegrain-size distribution must also be satisfied.Subbase and select material criteria arefound in Table A- 1. Base-course gradation re-quirements are found in Table A-2.
Step 10 - Determine the Final DesignCBR. Using the initial design CBR value,
California Bearing Ratio Design Methodology A-4
FM 5-410
California Bearing Ratio Design Methodology A-5
FM 5-410
determine if the soil material is suitable foruse as a base, subbase, select, or subgradelayer material. Next, look at the gradationrequirements for use in that layer. Finally,look at the LL and the PI criteria. If a soilmaterial meets all the criteria for use in a soillayer, then it can be placed in that layer. If itfails to meet all criteria for its intended use,consider using the material in another layer.The final design CBR is determined by thecriteria that the soil material meets. The fol-lowing examples illustrate this point:
A soil material has an initial designCBR value of 65. Based on CBRvalue, this material is suitable for usein a base-course layer for a road. Themaximum aggregate size is 1.5inches. When evaluating the soilagainst the base-course criteria inTable A-2, page A-5, we find that thepercent passing the Number 40 sieveis 6 percent, which is less than theminimum al1owable for use as a basecourse. Therefore, we cannot use thematerial as a base course, butperhaps it can be used as a subbase.By evaluating the soil against theCBR 50 subbase criteria (see TableA-1, page A-5), we find that the soilmaterial meets all criteria. The finaldesign CBR for this soil would beCBR 50. It would be used as a CBR50 subbase.A soil material has an initial designCBR of 37. We are considering theuse of this material as a subbase.There are no criteria for a CBR 37subbase; therefore, we will use thefollowing rule:– If a soil material meets the criteria
of the next higher subbase, thefinal design CBR will be the sameas the initial design CBR.
- If a soil material fails to meet thecriteria of the next higher subbasebut meets the criteria of a lowersubbase or select material, the ini-tial design CBR will be adjusteddownward to the maximum CBRvalue of the layer at which allcriteria were met, which becomesthe final design CBR.
California Bearing Ratio Design Methodology A-6
In our example, if the soil material met theCBR 40 subbase criteria, the final designCBR would be 37 and the road or airfieldwould be designed with a CBR 37 subbaselayer. If the soil failed to meet the CBR 40subbase criteria but did meet the CBR 30 sub-base criteria, the final design CBR would be30 and the road or airfield would be designedwith a CBR 30 subbase. If the soil failed tomeet both the CBR 40 and CBR 30 subbasecriteria, the material would be evaluatedagainst the select material criteria. If it metthe select criteria, the final design CBR wouldbe 20.
CBR DESIGN PRACTICAL EXERCISEIn preparation for an airfield construction
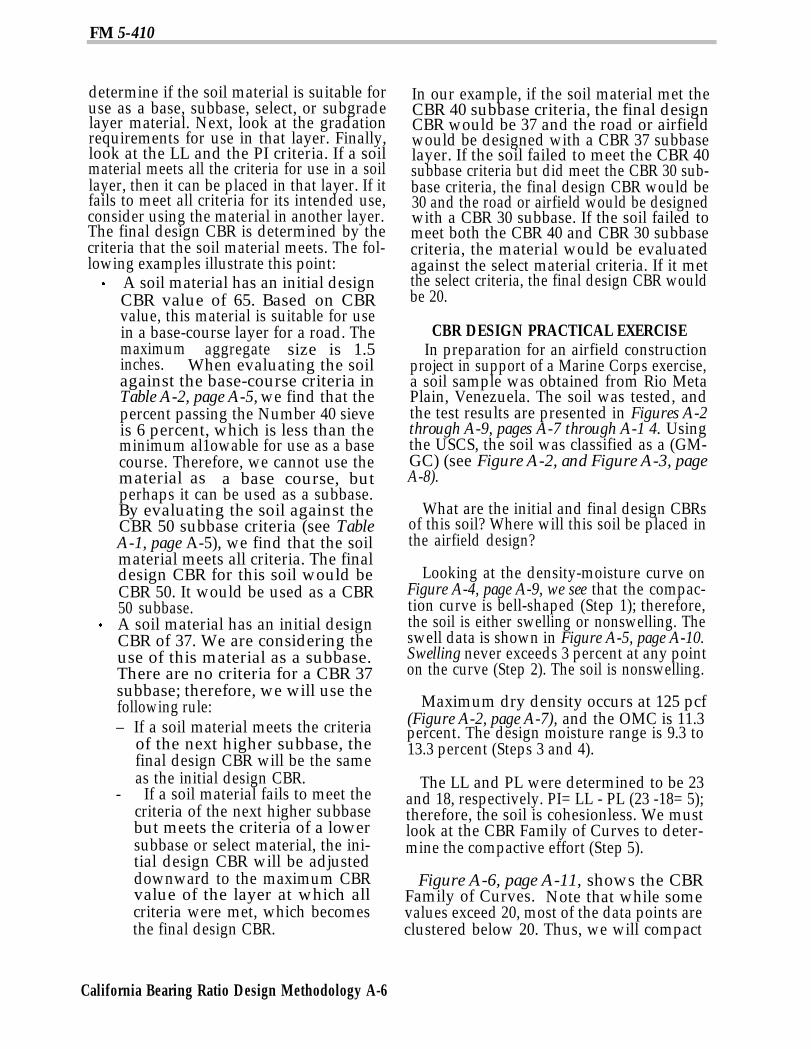
project in support of a Marine Corps exercise,a soil sample was obtained from Rio MetaPlain, Venezuela. The soil was tested, andthe test results are presented in Figures A-2through A-9, pages A-7 through A-1 4. Usingthe USCS, the soil was classified as a (GM-GC) (see Figure A-2, and Figure A-3, pageA-8).
What are the initial and final design CBRsof this soil? Where will this soil be placed inthe airfield design?
Looking at the density-moisture curve onFigure A-4, page A-9, we see that the compac-tion curve is bell-shaped (Step 1); therefore,the soil is either swelling or nonswelling. Theswell data is shown in Figure A-5, page A-10.Swelling never exceeds 3 percent at any pointon the curve (Step 2). The soil is nonswelling.
Maximum dry density occurs at 125 pcf(Figure A-2, page A-7), and the OMC is 11.3percent. The design moisture range is 9.3 to13.3 percent (Steps 3 and 4).
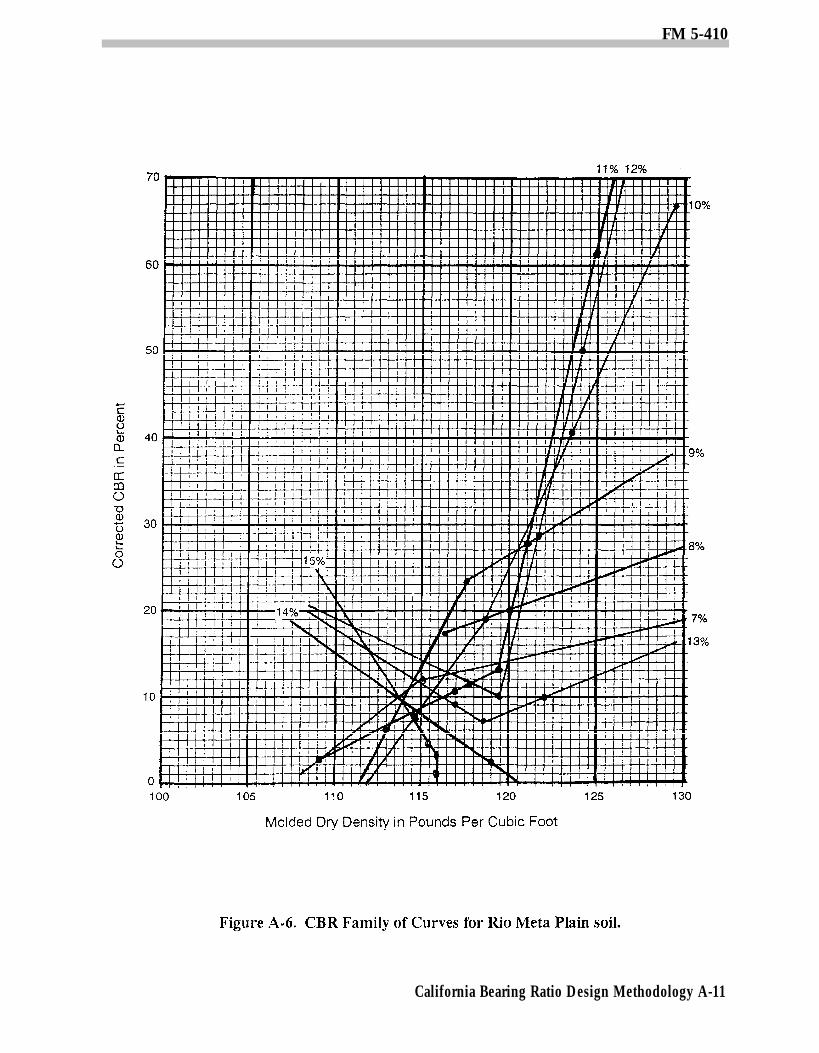
The LL and PL were determined to be 23and 18, respectively. PI= LL - PL (23 -18= 5);therefore, the soil is cohesionless. We mustlook at the CBR Family of Curves to deter-mine the compactive effort (Step 5).
Figure A-6, page A-11, shows the CBRFamily of Curves. Note that while somevalues exceed 20, most of the data points areclustered below 20. Thus, we will compact

FM 5-410
California Bearing Ratio Design Methodology A-7
FM 5-410
California Bearing Ratio Design Methodology A-8

FM 5-410
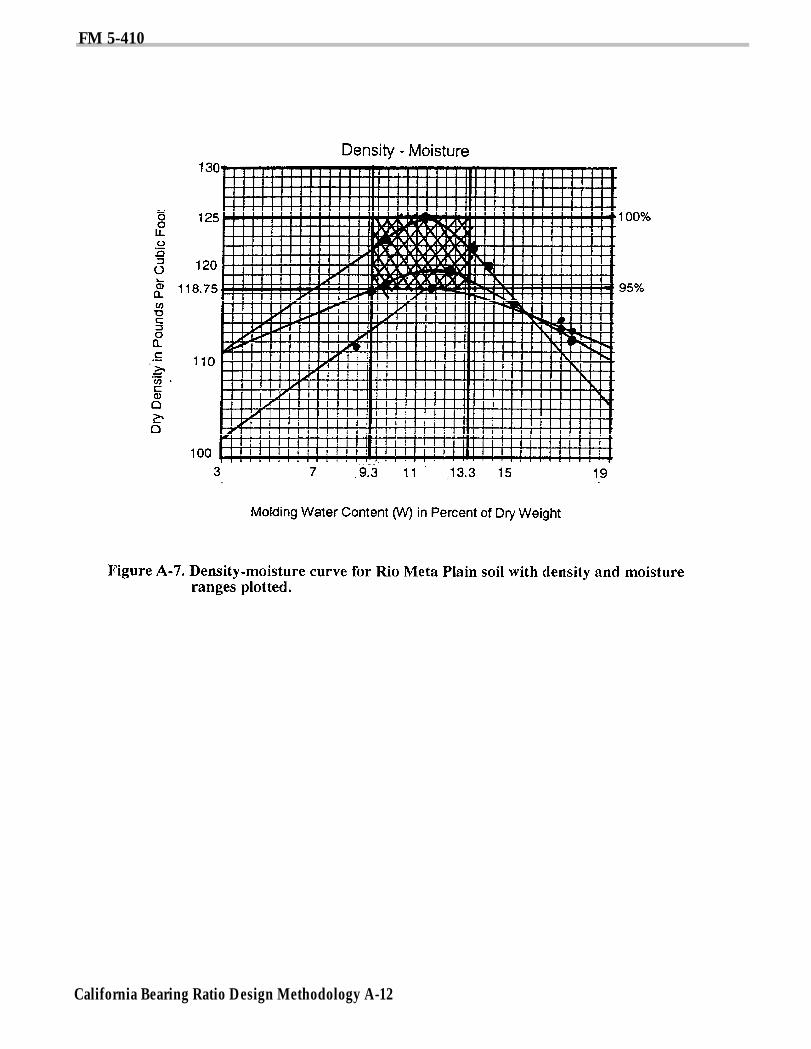
this soil to a density between 95 percent and100 percent maximum dry density or between118.75 and 125 pcf (Step 6). When plotted onthe density-moisture curve with the moisturerange (9.3 to 13.3 percent), the specificationblock is formed (see Figure A-7, page A-12).
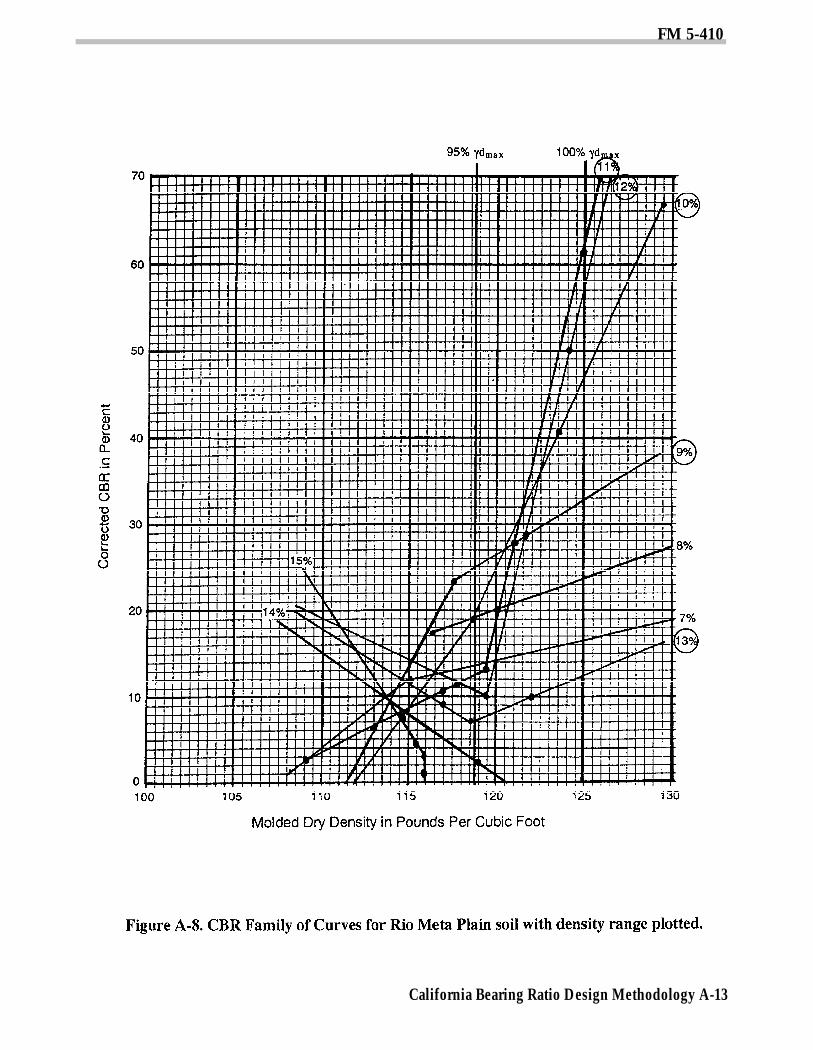
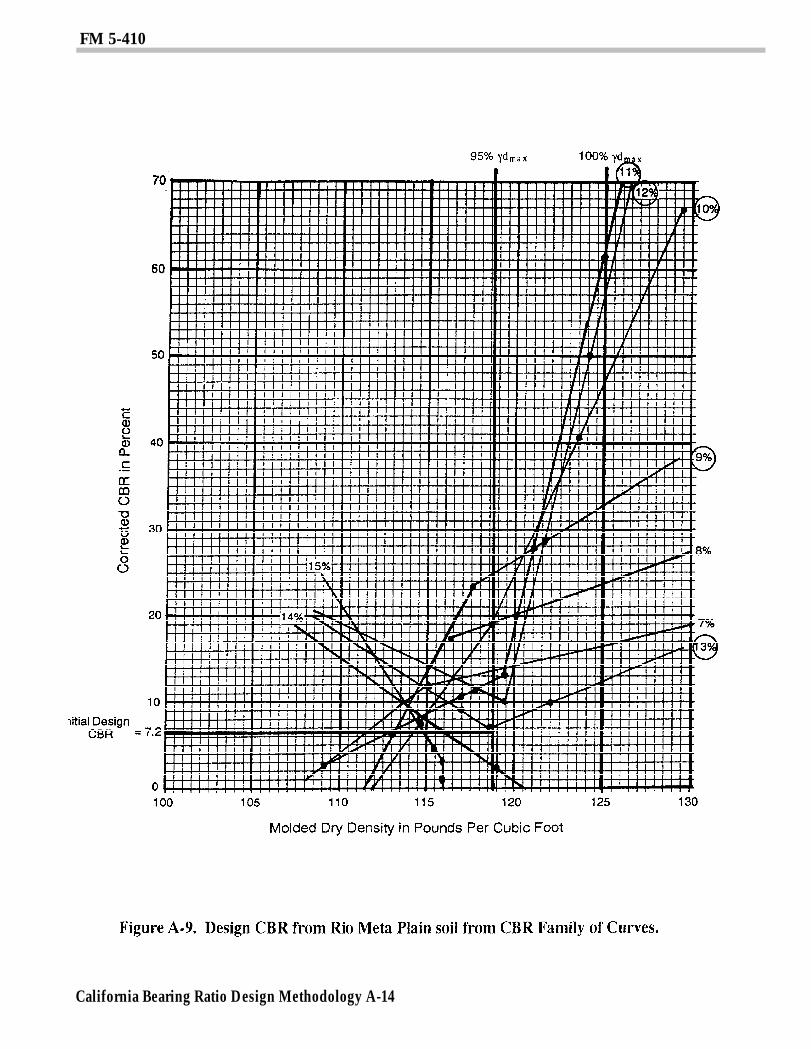
The CBR Family of Curves, Figure A-8,page A-13, shows the density range superim-posed on the curves and the moisture rangevalues circled (in this case we’ve circled themoisture values 9-13) (Step 7). Followingeach moisture curve in our range and mark-ing where it enters and exits the densitylimits, we find that the lowest CBR value oc-curs at the point where the 13 percentmoisture curve exits the 118.75 pcf densitylimit line. Interpolating between the 13 per-cent and 14 percent moisture curves, 13.3percent moisture results in an assured CBR val-ue of 7.5 (see Figure A-9, page A-14) (Step 8).
The initial design CBR of this soil is 7.5.Because of the low CBR, we can consider thissoil material for use as select material if itmeets the criteria of Table A-1, page A-.5.Looking at DD Form 1207 (Figure A-7, page
A-12), we first check the maximum aggregatesize and see that it is 2 inches. The maxi-mum allowable aggregate size (see Table A-1page A-5, for a select material used in the con-struction of an airfield is 3 inches; therefore,our soil meets this criteria. Next, we check forthe percent passing the Number 200 sieveand find that the percent passing the Number200 sieve is 23 percent. From Table A-1, pageA- 5, we find that the select criteria allows upto 25 percent of the material to pass the No200 sieve; therefore, our soil meets thiscriteria. Finally, we must evaluate the LLand PI of our soil against the select criteria inTable A-l, page A-5. When we do this, we findthat our soil’s PI of 23 and LL of 5 meet the re-quirements.
The final design CBR of the soil is 7.5, andit is suitable for use as a select material.
The final portion of the CBR design processis to determine the thickness of the road orairfield structure based on the CBR values ofthe subgrade, select, subbase, and base-course materials available for use in the con-struction effort. This is discussed in detail inTM 5-330.
California Bearing Ratio Design Methodology A-9
FM 5-410
California Bearing Ratio Design Methodology A-10
FM 5-410
California Bearing Ratio Design Methodology A-11
FM 5-410
California Bearing Ratio Design Methodology A-12
FM 5-410
California Bearing Ratio Design Methodology A-13
FM 5-410
California Bearing Ratio Design Methodology A-14