appendix 1: post-construction stormwater design...
TRANSCRIPT
APPENDIX 1: Post-construction Design Examples 1
This appendix uses three hypothetical development sites in order to demonstrate the design of post-construction stormwater practices presented earlier in specifications.
Each practice example utilizes the existing and the proposed developed site and hydrologic characteris-tics to determine the sizing and configuration of each practice. The base requirements are presumed to be Ohio EPA’s Construction General Permit post-construction requirements (detention of the water quality volume) and the detention of the critical storm (see the Critical Storm Method) from the develop-ment in order to prevent increases in downstream flooding and streambank erosion.
Each practice use the following steps to proceed through the design: Step 1 - Calculate Water Quality Volume (WQv) Step 2 - Compute Peak Discharge Requirements Step 3 - Identify Other Local Development Criteria/Requirements Step 4 - Determine if the Site and Soils Are Appropriate for the Practice Step 5 - Determine Practice Location and Preliminary Geometry to Meet Requirements Step 6 - Check Design to Ensure All Requirements Are Met
CONTENTS
Section A: Dry Extended Detention Basin ............................... 3
Section B: Wet Extended Detention Basin ............................ 13
Section C: Wetland Extended Detention Basin ...................... 24
References ........................................................................... 33
Appendix 1: Post-Construction Stormwater Design Examples

2 APPENDIX 1: Post-construction Design Examples
APPENDIX 1: Post-construction Design Examples 3
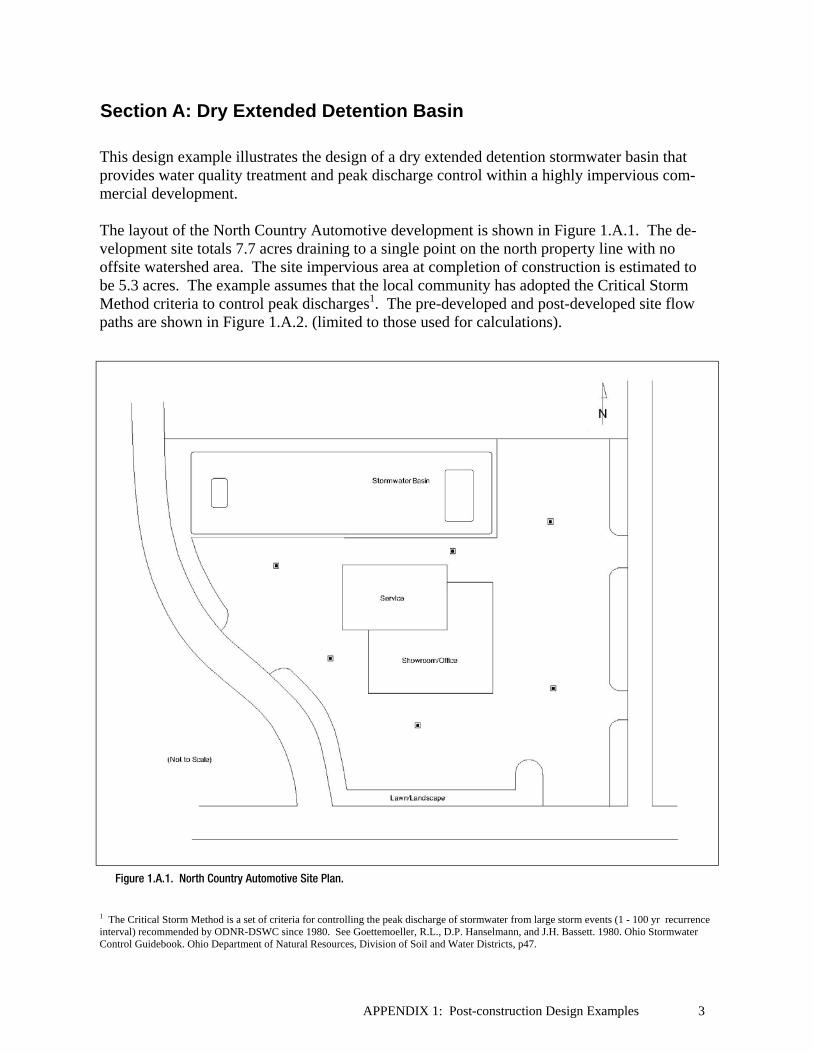
Section A: Dry Extended Detention Basin
Figure 1.A.1. North Country Automotive Site Plan.
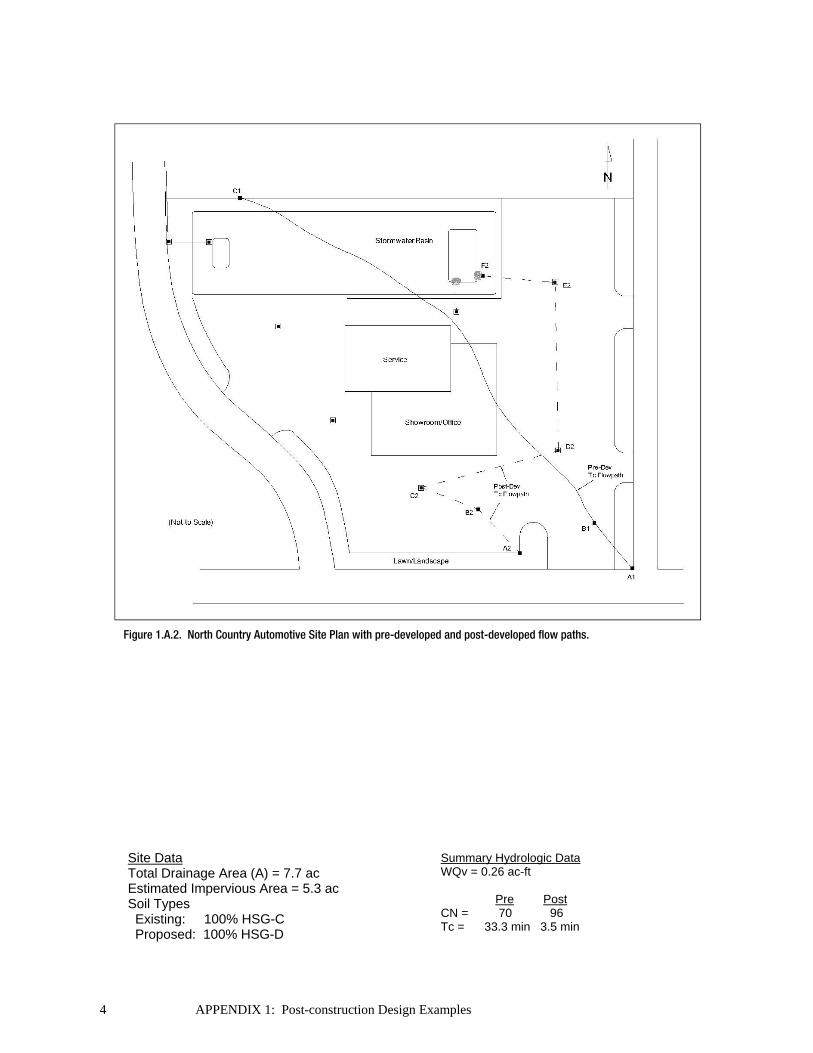
This design example illustrates the design of a dry extended detention stormwater basin that provides water quality treatment and peak discharge control within a highly impervious com-mercial development. The layout of the North Country Automotive development is shown in Figure 1.A.1. The de-velopment site totals 7.7 acres draining to a single point on the north property line with no offsite watershed area. The site impervious area at completion of construction is estimated to be 5.3 acres. The example assumes that the local community has adopted the Critical Storm Method criteria to control peak discharges1. The pre-developed and post-developed site flow paths are shown in Figure 1.A.2. (limited to those used for calculations).
1 The Critical Storm Method is a set of criteria for controlling the peak discharge of stormwater from large storm events (1 - 100 yr recurrence interval) recommended by ODNR-DSWC since 1980. See Goettemoeller, R.L., D.P. Hanselmann, and J.H. Bassett. 1980. Ohio Stormwater Control Guidebook. Ohio Department of Natural Resources, Division of Soil and Water Districts, p47.
4 APPENDIX 1: Post-construction Design Examples
Site Data Total Drainage Area (A) = 7.7 ac Estimated Impervious Area = 5.3 ac Soil Types Existing: 100% HSG-C Proposed: 100% HSG-D
Summary Hydrologic Data WQv = 0.26 ac-ft Pre Post CN = 70 96 Tc = 33.3 min 3.5 min
Figure 1.A.2. North Country Automotive Site Plan with pre-developed and post-developed flow paths.
APPENDIX 1: Post-construction Design Examples 5
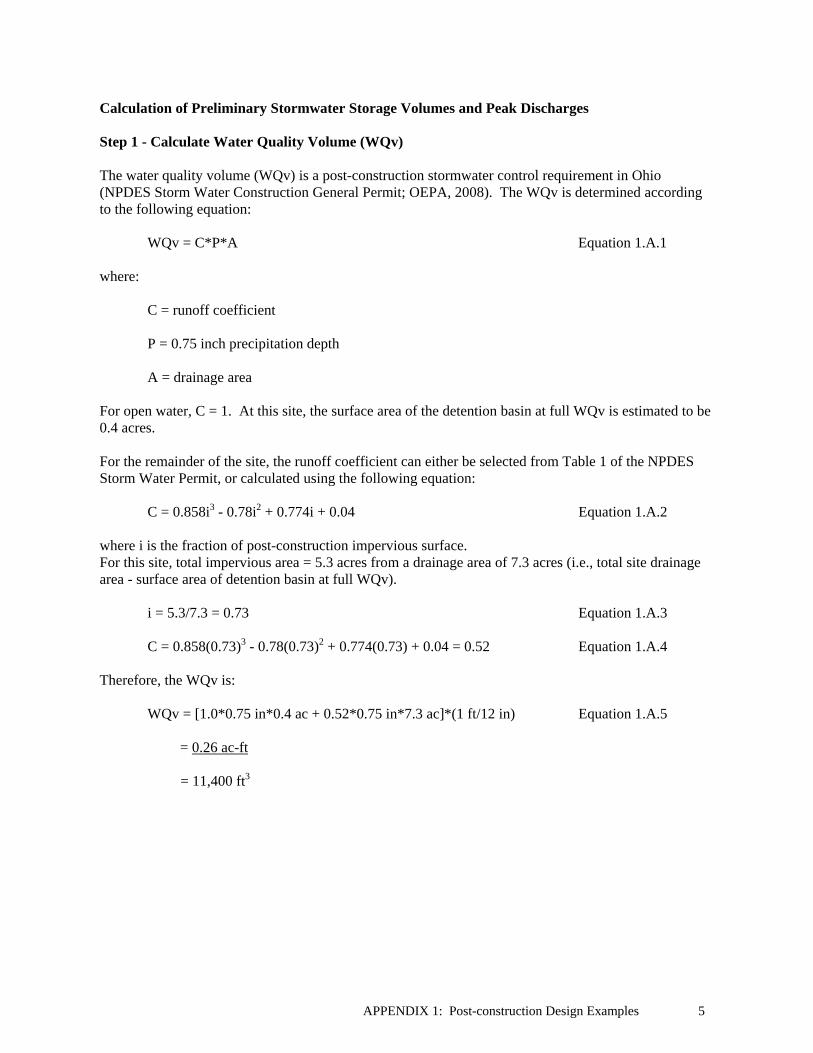
Calculation of Preliminary Stormwater Storage Volumes and Peak Discharges Step 1 - Calculate Water Quality Volume (WQv) The water quality volume (WQv) is a post-construction stormwater control requirement in Ohio (NPDES Storm Water Construction General Permit; OEPA, 2008). The WQv is determined according to the following equation: WQv = C*P*A Equation 1.A.1 where: C = runoff coefficient P = 0.75 inch precipitation depth A = drainage area For open water, C = 1. At this site, the surface area of the detention basin at full WQv is estimated to be 0.4 acres. For the remainder of the site, the runoff coefficient can either be selected from Table 1 of the NPDES Storm Water Permit, or calculated using the following equation: C = 0.858i3 - 0.78i2 + 0.774i + 0.04 Equation 1.A.2 where i is the fraction of post-construction impervious surface. For this site, total impervious area = 5.3 acres from a drainage area of 7.3 acres (i.e., total site drainage area - surface area of detention basin at full WQv). i = 5.3/7.3 = 0.73 Equation 1.A.3 C = 0.858(0.73)3 - 0.78(0.73)2 + 0.774(0.73) + 0.04 = 0.52 Equation 1.A.4 Therefore, the WQv is: WQv = [1.0*0.75 in*0.4 ac + 0.52*0.75 in*7.3 ac]*(1 ft/12 in) Equation 1.A.5
= 0.26 ac-ft = 11,400 ft3
6 APPENDIX 1: Post-construction Design Examples
Segment
Flow Type
Surface Cover
Mannings n
Length ft
Slope %
Veloctiy ft/s
Tt min
A1 to B1 Overland - sheet Woods - Light Underbrush 0.40 100 3 21.0
B1 to C1 Overland - shallow conc Woods - Light Underbrush 0.10 700 3.5 0.95 12.3
Total Existing 800 33.3
Existing Condition
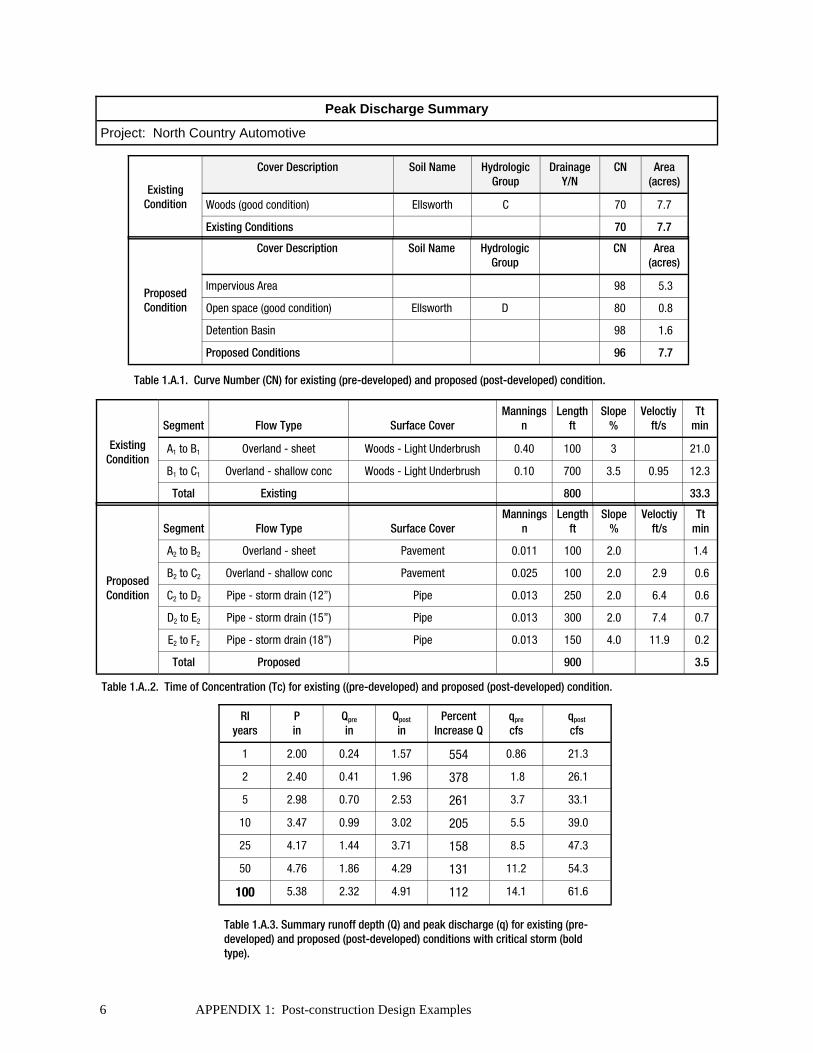
Peak Discharge Summary
Project: North Country Automotive
Cover Description Soil Name Hydrologic Group
Drainage Y/N
CN Area (acres)
Woods (good condition) Ellsworth C 70 7.7
Existing Conditions 70 7.7
Existing Condition
Cover Description Soil Name Hydrologic Group
CN Area (acres)
Impervious Area 98 5.3
Open space (good condition) Ellsworth D 80 0.8
Detention Basin 98 1.6
Proposed Conditions 96 7.7
Proposed Condition
Segment
Flow Type
Surface Cover
Mannings n
Length ft
Slope %
Veloctiy ft/s
Tt min
A2 to B2 Overland - sheet Pavement 0.011 100 2.0 1.4
B2 to C2 Overland - shallow conc Pavement 0.025 100 2.0 2.9 0.6
C2 to D2 Pipe - storm drain (12”) Pipe 0.013 250 2.0 6.4 0.6
D2 to E2 Pipe - storm drain (15”) Pipe 0.013 300 2.0 7.4 0.7
E2 to F2 Pipe - storm drain (18”) Pipe 0.013 150 4.0 11.9 0.2
Total Proposed 900 3.5
Proposed Condition
Table 1.A.1. Curve Number (CN) for existing (pre-developed) and proposed (post-developed) condition.
Table 1.A..2. Time of Concentration (Tc) for existing ((pre-developed) and proposed (post-developed) condition.
RI years
P in
Qpre in
Qpost in
qpre cfs
qpost cfs
1 2.00 0.24 1.57 0.86 21.3
2 2.40 0.41 1.96 1.8 26.1
5 2.98 0.70 2.53 3.7 33.1
10 3.47 0.99 3.02 5.5 39.0
25 4.17 1.44 3.71 8.5 47.3
50 4.76 1.86 4.29 11.2 54.3
100 5.38 2.32 4.91 14.1 61.6
Percent Increase Q
554
378
261
205
158
131
112
Table 1.A.3. Summary runoff depth (Q) and peak discharge (q) for existing (pre-developed) and proposed (post-developed) conditions with critical storm (bold type).

APPENDIX 1: Post-construction Design Examples 7
Step 2 - Compute Peak Discharge Requirements
This example uses the NRCS Curve Number Methodology to perform hydrologic calculations. TR-20, HEC-HMS or other software that uses NRCS procedures should provide similar results. Tables 1-1 and 1-2 summarize the inputs necessary to determine the curve number (CN) and time of concentration (Tc) for the existing (pre-development) and proposed (post-development) conditions. Table 1-3 summarizes the existing and proposed runoff depths and peak discharges for the 1-year, 24-hr through 100-year, 24-hr rainfall events. The critical storm is determined from the percent increase in runoff volume from the 1-year, 24-hr storm for the proposed (post-developed) conditions when compared to the existing (pre-developed) conditions (Goettemoeller et al., 1980):
Equation 1.A.6
From Table 1-3, the percent increase in the 1-year, 24-hr runoff for the proposed development is: Equation 1.A.7
For an increase greater than 500%, the critical storm for peak discharge control is the 100-year, 24-hr event - i.e., the 100-year, 24-hr post-developed peak discharge must be less than the existing (pre-developed) 1-year, 24-hr peak discharge. These values are shown in bold type in Table 1.A.3. Step 3 - Identify Other Local Development Criteria/Requirements Commercial development in this community is subject to a 5% minimum landscaped area requirement - the proposed design meets this requirement. No additional setback or stormwater requirements were identified. Step 4 - Determine if the Development Site and Soils Are Appropriate for the Use of a Dry Ex-tended Detention Basin The site drainage area is 7.7 acres, all of which is mapped as Ellsworth silt loam soil in the county soil survey. Ellsworth silt loam soils are suitable for creation of an extended detention basin with a wet fore-bay and permanent micropool. The subsoil is silty clay loam derived from glacial till and has slow per-meability. Because the soil has slow permeability, there may be extended periods when the basin cannot be mowed. This subsoil is suitable material for construction of the embankment for the stormwater basin.
100xQ
QQIncreasePercent
pre
prepost
%55410024.0
24.057.1
xIncreasePercent
Note: Peak discharge control is typically regulated through local entities (e.g. stormwater district, municipal, township or county governments). The state of Ohio recommends use of the Critical Storm Method1 for peak discharge control, but the requirements will vary by community. Check local stormwater regulations to determine which peak discharge control method you must use.
1 The Critical Storm Method is a set of criteria for controlling the peak discharge of stormwater from large storm events (1 - 100 yr recurrence interval) recommended by ODNR-DSWC since 1980. See Goettemoeller, R.L., D.P. Hanselmann, and J.H. Bassett. 1980. Ohio Stormwater Control Guidebook. Ohio Department of Natural Resources, Division of Soil and Water Districts, p47.
8 APPENDIX 1: Post-construction Design Examples
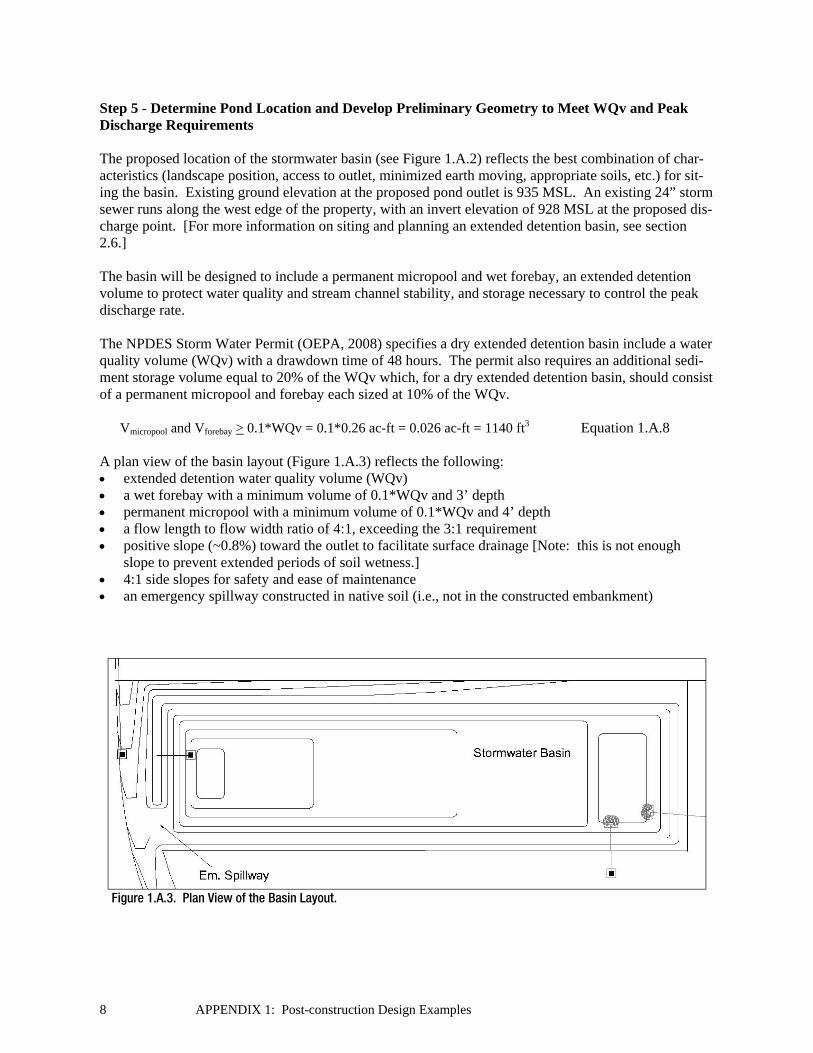
Figure 1.A.3. Plan View of the Basin Layout.
Step 5 - Determine Pond Location and Develop Preliminary Geometry to Meet WQv and Peak Discharge Requirements The proposed location of the stormwater basin (see Figure 1.A.2) reflects the best combination of char-acteristics (landscape position, access to outlet, minimized earth moving, appropriate soils, etc.) for sit-ing the basin. Existing ground elevation at the proposed pond outlet is 935 MSL. An existing 24” storm sewer runs along the west edge of the property, with an invert elevation of 928 MSL at the proposed dis-charge point. [For more information on siting and planning an extended detention basin, see section 2.6.] The basin will be designed to include a permanent micropool and wet forebay, an extended detention volume to protect water quality and stream channel stability, and storage necessary to control the peak discharge rate. The NPDES Storm Water Permit (OEPA, 2008) specifies a dry extended detention basin include a water quality volume (WQv) with a drawdown time of 48 hours. The permit also requires an additional sedi-ment storage volume equal to 20% of the WQv which, for a dry extended detention basin, should consist of a permanent micropool and forebay each sized at 10% of the WQv. Vmicropool and Vforebay > 0.1*WQv = 0.1*0.26 ac-ft = 0.026 ac-ft = 1140 ft3 Equation 1.A.8 A plan view of the basin layout (Figure 1.A.3) reflects the following: extended detention water quality volume (WQv) a wet forebay with a minimum volume of 0.1*WQv and 3’ depth permanent micropool with a minimum volume of 0.1*WQv and 4’ depth a flow length to flow width ratio of 4:1, exceeding the 3:1 requirement positive slope (~0.8%) toward the outlet to facilitate surface drainage [Note: this is not enough
slope to prevent extended periods of soil wetness.] 4:1 side slopes for safety and ease of maintenance an emergency spillway constructed in native soil (i.e., not in the constructed embankment)
APPENDIX 1: Post-construction Design Examples 9
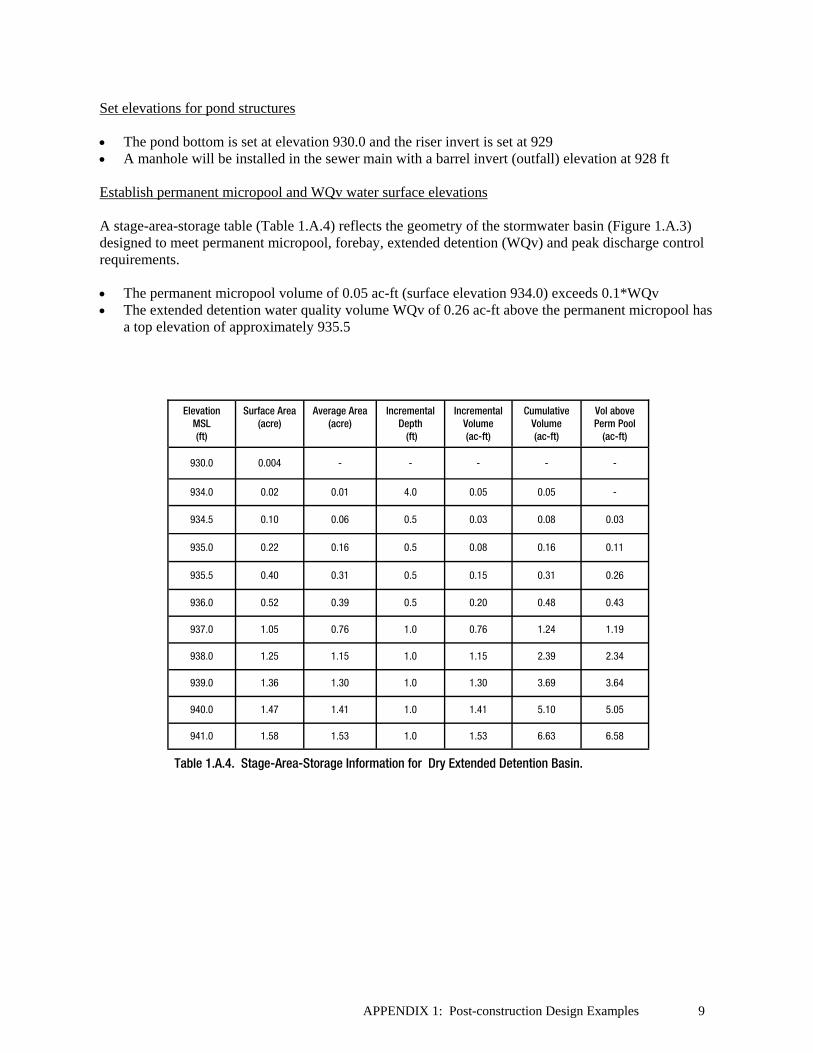
Set elevations for pond structures The pond bottom is set at elevation 930.0 and the riser invert is set at 929 A manhole will be installed in the sewer main with a barrel invert (outfall) elevation at 928 ft Establish permanent micropool and WQv water surface elevations A stage-area-storage table (Table 1.A.4) reflects the geometry of the stormwater basin (Figure 1.A.3) designed to meet permanent micropool, forebay, extended detention (WQv) and peak discharge control requirements. The permanent micropool volume of 0.05 ac-ft (surface elevation 934.0) exceeds 0.1*WQv The extended detention water quality volume WQv of 0.26 ac-ft above the permanent micropool has
a top elevation of approximately 935.5
Elevation MSL (ft)
Surface Area (acre)
Average Area (acre)
Incremental Depth (ft)
Incremental Volume (ac-ft)
Cumulative Volume (ac-ft)
Vol above Perm Pool
(ac-ft)
930.0 0.004 - - - - -
934.0 0.02 0.01 4.0 0.05 0.05 -
935.5 0.40 0.31 0.5 0.15 0.31 0.26
936.0 0.52 0.39 0.5 0.20 0.48 0.43
937.0 1.05 0.76 1.0 0.76 1.24 1.19
938.0 1.25 1.15 1.0 1.15 2.39 2.34
939.0 1.36 1.30 1.0 1.30 3.69 3.64
940.0 1.47 1.41 1.0 1.41 5.10 5.05
941.0 1.58 1.53 1.0 1.53 6.63 6.58
935.0 0.22 0.16 0.5 0.08 0.16 0.11
934.5 0.10 0.06 0.5 0.03 0.08 0.03
Table 1.A.4. Stage-Area-Storage Information for Dry Extended Detention Basin.
10 APPENDIX 1: Post-construction Design Examples
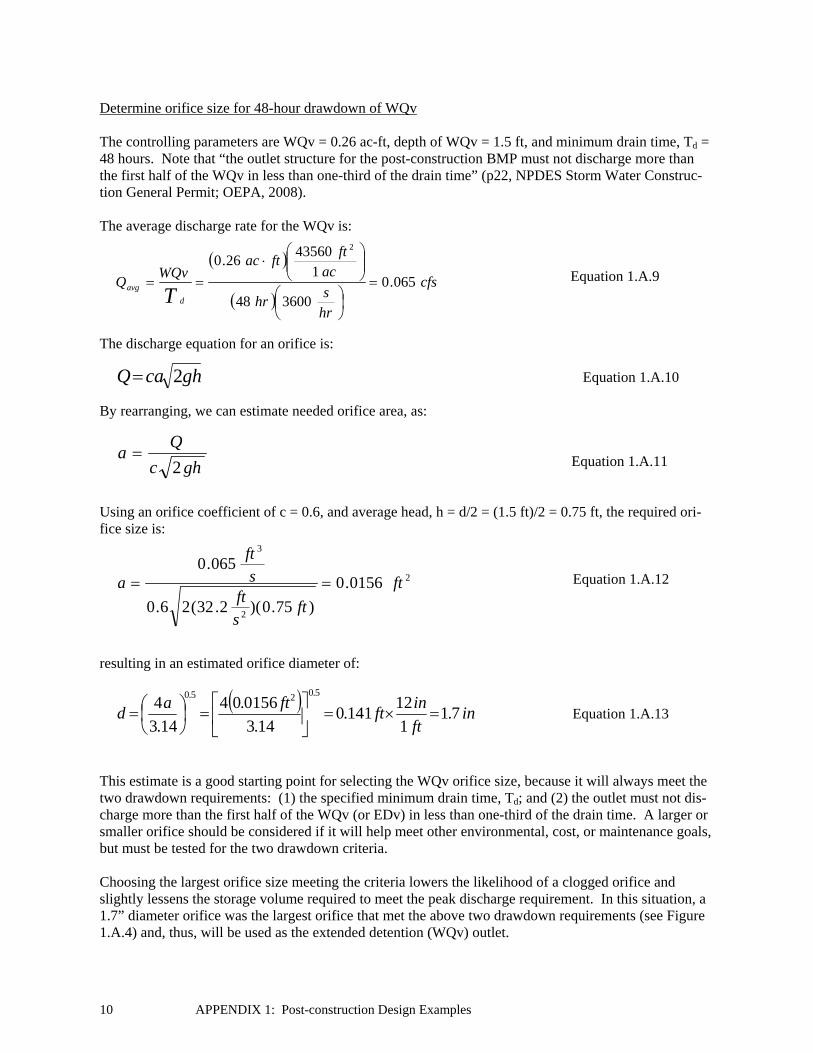
Determine orifice size for 48-hour drawdown of WQv The controlling parameters are WQv = 0.26 ac-ft, depth of WQv = 1.5 ft, and minimum drain time, Td = 48 hours. Note that “the outlet structure for the post-construction BMP must not discharge more than the first half of the WQv in less than one-third of the drain time” (p22, NPDES Storm Water Construc-tion General Permit; OEPA, 2008). The average discharge rate for the WQv is:
Equation 1.A.9
The discharge equation for an orifice is: Equation 1.A.10
By rearranging, we can estimate needed orifice area, as: Equation 1.A.11
Using an orifice coefficient of c = 0.6, and average head, h = d/2 = (1.5 ft)/2 = 0.75 ft, the required ori-fice size is:
Equation 1.A.12
resulting in an estimated orifice diameter of:
Equation 1.A.13
This estimate is a good starting point for selecting the WQv orifice size, because it will always meet the two drawdown requirements: (1) the specified minimum drain time, Td; and (2) the outlet must not dis-charge more than the first half of the WQv (or EDv) in less than one-third of the drain time. A larger or smaller orifice should be considered if it will help meet other environmental, cost, or maintenance goals, but must be tested for the two drawdown criteria. Choosing the largest orifice size meeting the criteria lowers the likelihood of a clogged orifice and slightly lessens the storage volume required to meet the peak discharge requirement. In this situation, a 1.7” diameter orifice was the largest orifice that met the above two drawdown requirements (see Figure 1.A.4) and, thus, will be used as the extended detention (WQv) outlet.
cfs
hrs
hr
acft
ftacWQv
QT d
avg 065.0360048
143560
26.02
ghcaQ 2
2
2
3
0156.0
)75.0)(2.32(26.0
065.0ft
ftsft
sft
a
in
ft
inft
ftad 7.1
1
12141.0
14.3
0156.04
14.3
45.025.0
ghc
Qa
2
APPENDIX 1: Post-construction Design Examples 11
Determine storage and outlet configuration to meet peak discharge requirements
As noted under Step 2, this dry detention basin is designed to meet the Critical Storm Method (CSM) for peak discharge control as well as the WQv requirement. Additional storage volume must be added that, with appropriate outlet design, will allow the basin to meet the following requirement: The peak rate of discharge from the post-construction 100-year, 24-hour event (the critical storm) must
be released at the existing (pre-development) 1-year, 24-hour discharge rate
Proprietary stormwater modeling software was used to try a combination of stage-storage and outlet configu-rations until the critical storm requirement was satisfied while considering the following: use best practices outlined in Section 2.6 of the Rainwater and Land Development manual minimize cut/fill and grading
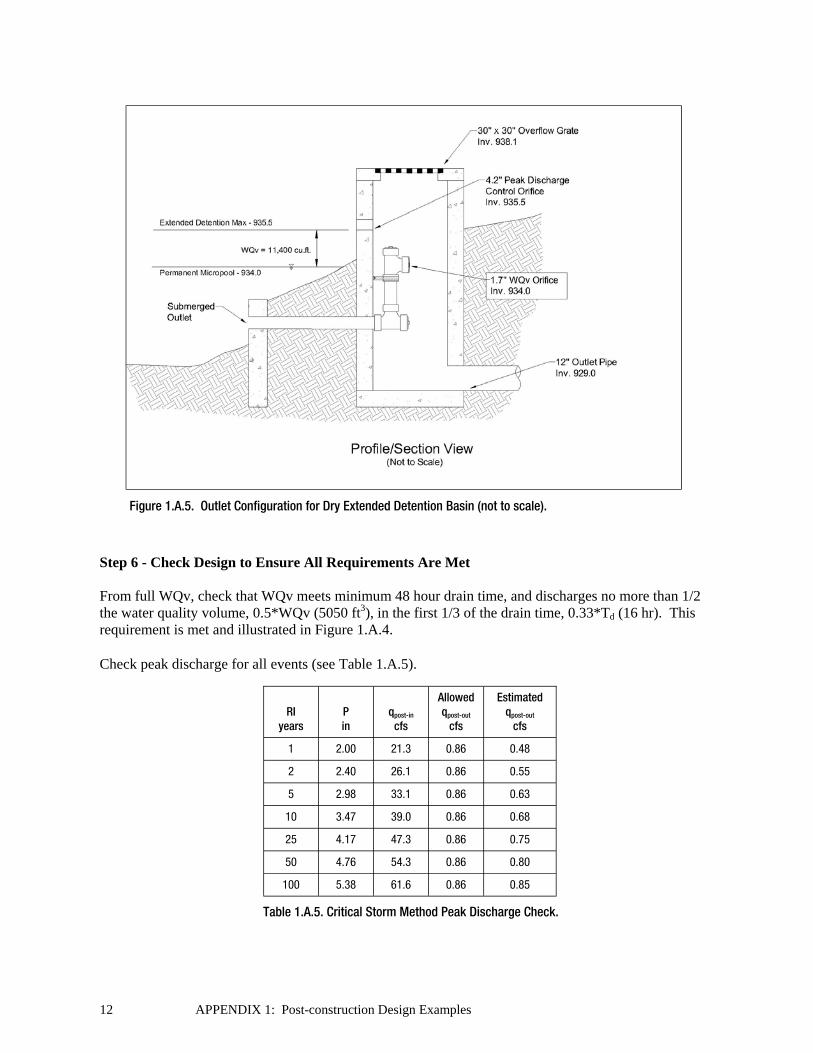
The resulting detention basin geometry is presented in Figure 1.A.3 and Table 1.A.4. The resulting outlet configuration is shown in Figure 1.A.5.
The outlet structure consists of a 3 ft by 3 ft concrete catch basin (e.g., ODOT No. 2-3) with invert at 929 MSL and 2.5’x2.5’ iron grate at 938.1 MSL. The following comprise the outlets: 1.7” diameter extended detention water quality volume (WQv) orifice (invert 934.0 MSL) drilled into 6”
PVC pipe using a non-clogging design 4.2” diameter orifice (invert 935.5 MSL) that controls release of the critical storm (100-year, 24-hour) 2.5’x2.5’ iron grate (invert 938.1 MSL) for emergency overflow and maintenance access
The catch basin will be connected - using a 12” diameter conduit - to the 2’ diameter storm sewer at the road along the west property boundary. A tailwater analysis was performed using the modeling software and the storm sewer’s design elevation (invert at 928 MSL; 25-yr full pipe flow at 930 MSL) and assumed elevation for the 100-yr event (935 MSL).
In addition, this design includes an emergency spillway excavated into native soil with the following charac-teristics: Invert (crest) elevation of 938.5 MSL Level section length of 25 ft, weir length (i.e., crest width) of 25 ft Spillway crest perpendicular to flow With all other outlets blocked and starting from the permanent pool elevation of 934.0 MSL, will safely
convey the 100-yr, 24-hr event with at least 1 ft freeboard below top of embankment
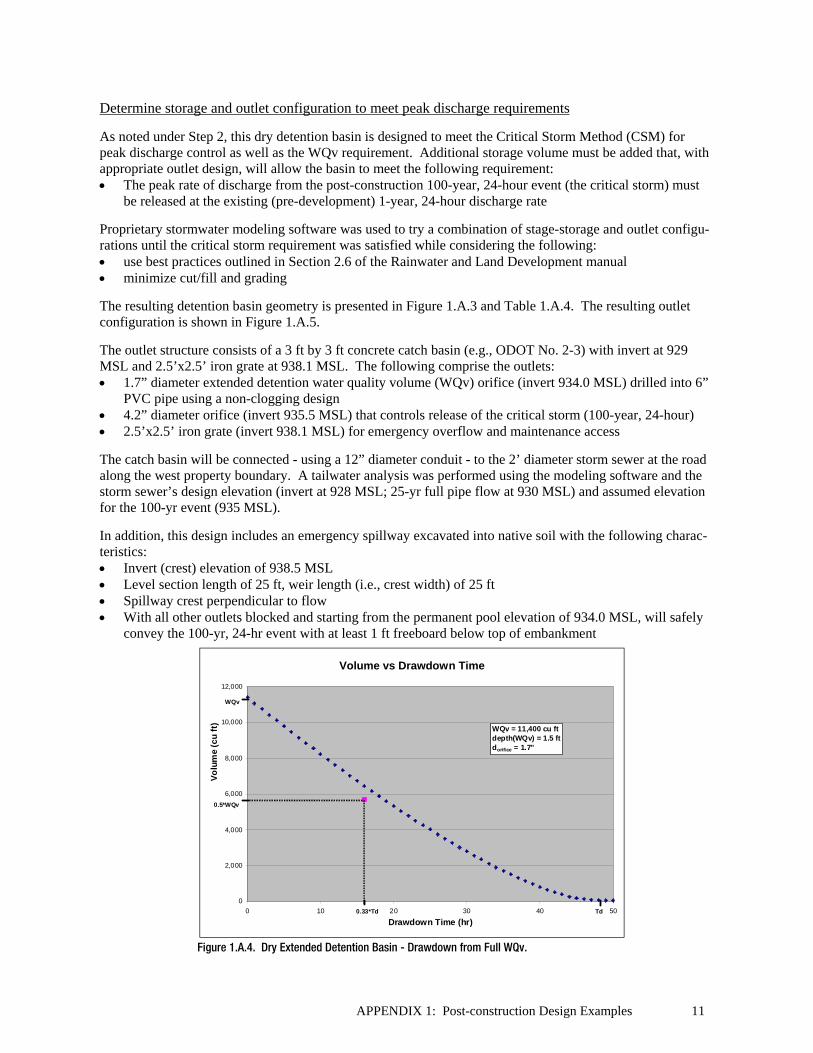
Figure 1.A.4. Dry Extended Detention Basin - Drawdown from Full WQv.
Volume vs Drawdown Time
0
2,000
4,000
6,000
8,000
10,000
12,000
0 10 20 30 40 50
Drawdown Time (hr)
Vo
lum
e (c
u f
t)
WQv
0.5*WQv
0.33*Td Td
WQv = 11,400 cu ftdepth(WQv) = 1.5 ftdorifice = 1.7"
12 APPENDIX 1: Post-construction Design Examples
Step 6 - Check Design to Ensure All Requirements Are Met From full WQv, check that WQv meets minimum 48 hour drain time, and discharges no more than 1/2 the water quality volume, 0.5*WQv (5050 ft3), in the first 1/3 of the drain time, 0.33*Td (16 hr). This requirement is met and illustrated in Figure 1.A.4. Check peak discharge for all events (see Table 1.A.5).
RI
years
P in
qpost-in cfs
Allowed qpost-out
cfs
Estimated qpost-out
cfs
1 2.00 21.3 0.86 0.48
2 2.40 26.1 0.86 0.55
5 2.98 33.1 0.86 0.63
10 3.47 39.0 0.86 0.68
25 4.17 47.3 0.86 0.75
50 4.76 54.3 0.86 0.80
100 5.38 61.6 0.86 0.85
Table 1.A.5. Critical Storm Method Peak Discharge Check.
Figure 1.A.5. Outlet Configuration for Dry Extended Detention Basin (not to scale).
APPENDIX 1: Post-construction Design Examples 13
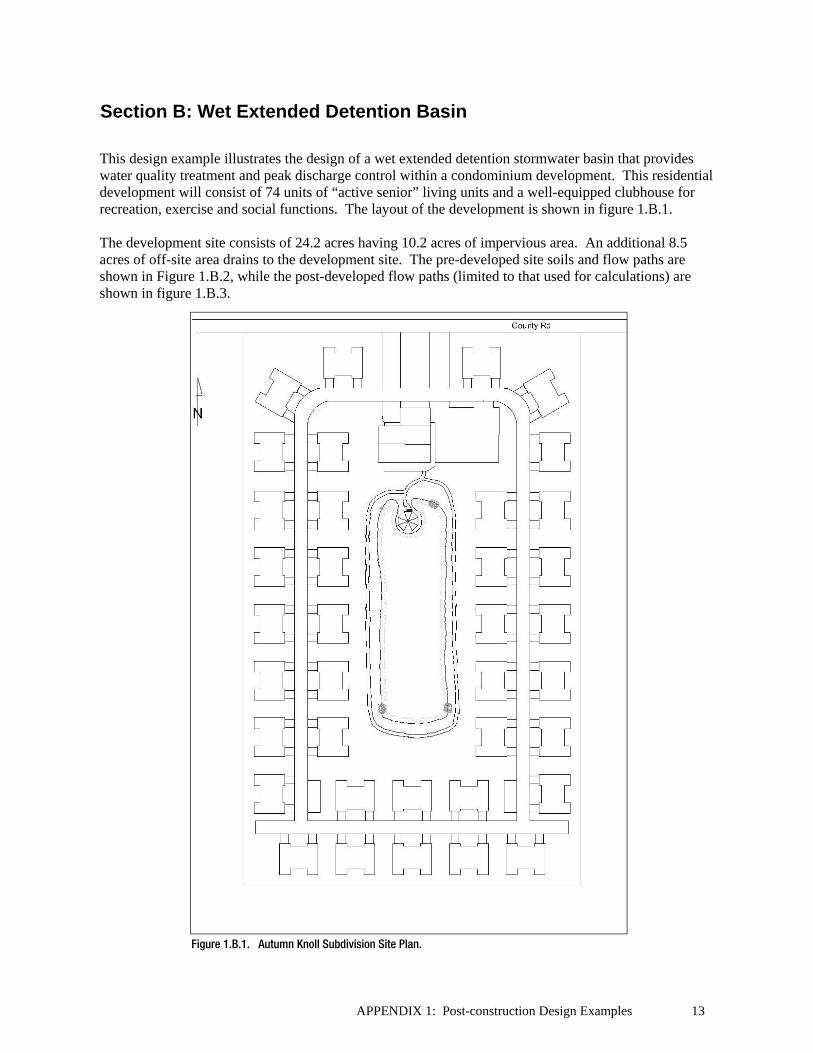
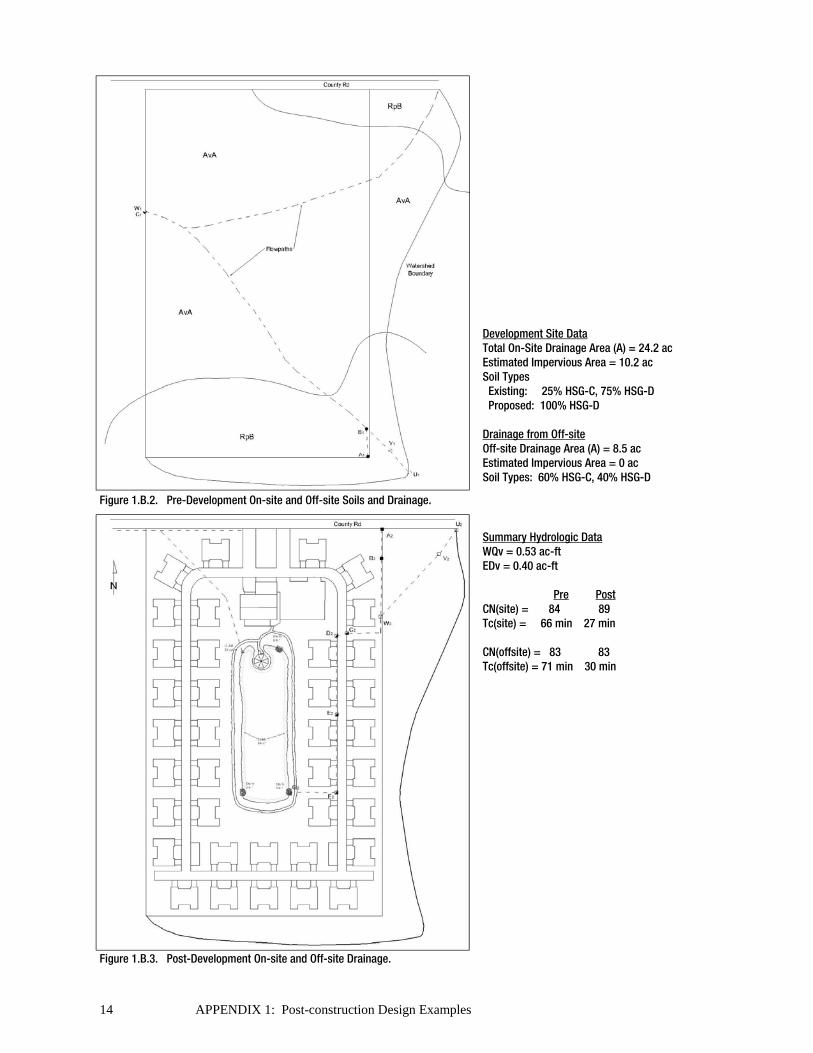
This design example illustrates the design of a wet extended detention stormwater basin that provides water quality treatment and peak discharge control within a condominium development. This residential development will consist of 74 units of “active senior” living units and a well-equipped clubhouse for recreation, exercise and social functions. The layout of the development is shown in figure 1.B.1. The development site consists of 24.2 acres having 10.2 acres of impervious area. An additional 8.5 acres of off-site area drains to the development site. The pre-developed site soils and flow paths are shown in Figure 1.B.2, while the post-developed flow paths (limited to that used for calculations) are shown in figure 1.B.3.
Section B: Wet Extended Detention Basin
Figure 1.B.1. Autumn Knoll Subdivision Site Plan.
14 APPENDIX 1: Post-construction Design Examples
Figure 1.B.3. Post-Development On-site and Off-site Drainage.
Figure 1.B.2. Pre-Development On-site and Off-site Soils and Drainage.
Summary Hydrologic Data WQv = 0.53 ac-ft EDv = 0.40 ac-ft Pre Post CN(site) = 84 89 Tc(site) = 66 min 27 min CN(offsite) = 83 83 Tc(offsite) = 71 min 30 min
Development Site Data Total On-Site Drainage Area (A) = 24.2 ac Estimated Impervious Area = 10.2 ac Soil Types Existing: 25% HSG-C, 75% HSG-D Proposed: 100% HSG-D Drainage from Off-site Off-site Drainage Area (A) = 8.5 ac Estimated Impervious Area = 0 ac Soil Types: 60% HSG-C, 40% HSG-D
APPENDIX 1: Post-construction Design Examples 15
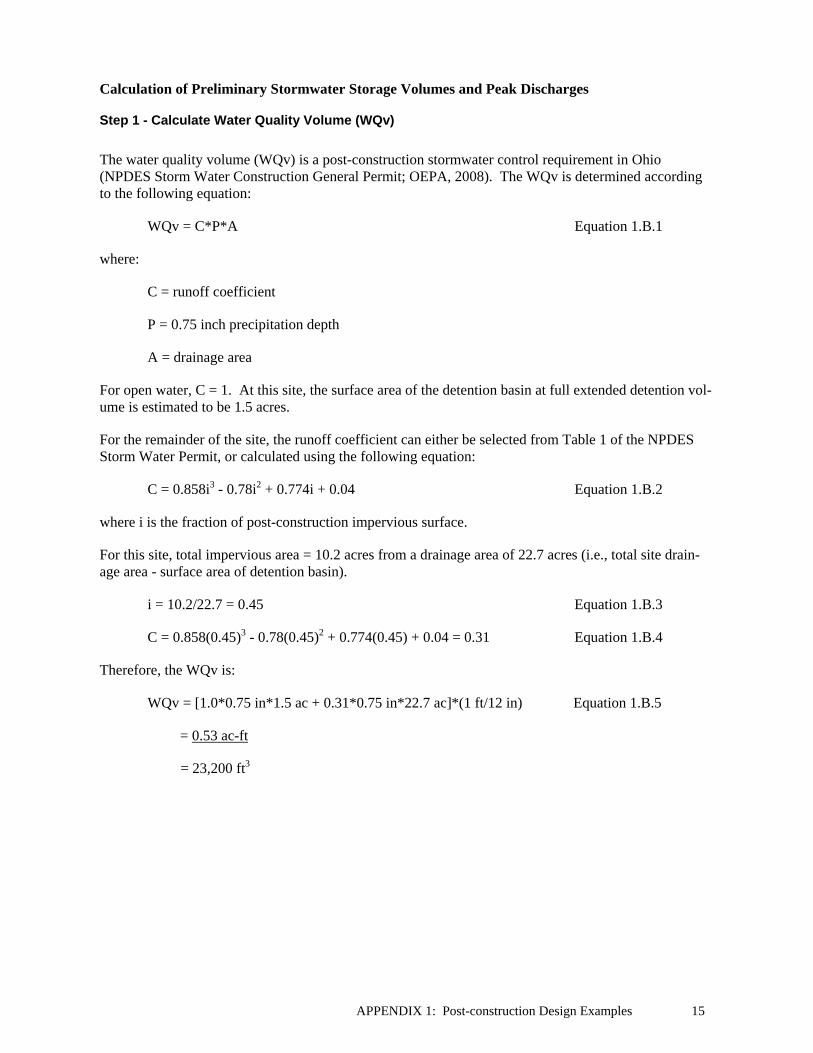
Calculation of Preliminary Stormwater Storage Volumes and Peak Discharges Step 1 - Calculate Water Quality Volume (WQv)
The water quality volume (WQv) is a post-construction stormwater control requirement in Ohio (NPDES Storm Water Construction General Permit; OEPA, 2008). The WQv is determined according to the following equation:
WQv = C*P*A Equation 1.B.1
where:
C = runoff coefficient
P = 0.75 inch precipitation depth
A = drainage area
For open water, C = 1. At this site, the surface area of the detention basin at full extended detention vol-ume is estimated to be 1.5 acres.
For the remainder of the site, the runoff coefficient can either be selected from Table 1 of the NPDES Storm Water Permit, or calculated using the following equation:
C = 0.858i3 - 0.78i2 + 0.774i + 0.04 Equation 1.B.2
where i is the fraction of post-construction impervious surface.
For this site, total impervious area = 10.2 acres from a drainage area of 22.7 acres (i.e., total site drain-age area - surface area of detention basin).
i = 10.2/22.7 = 0.45 Equation 1.B.3
C = 0.858(0.45)3 - 0.78(0.45)2 + 0.774(0.45) + 0.04 = 0.31 Equation 1.B.4
Therefore, the WQv is:
WQv = [1.0*0.75 in*1.5 ac + 0.31*0.75 in*22.7 ac]*(1 ft/12 in) Equation 1.B.5
= 0.53 ac-ft
= 23,200 ft3
16 APPENDIX 1: Post-construction Design Examples
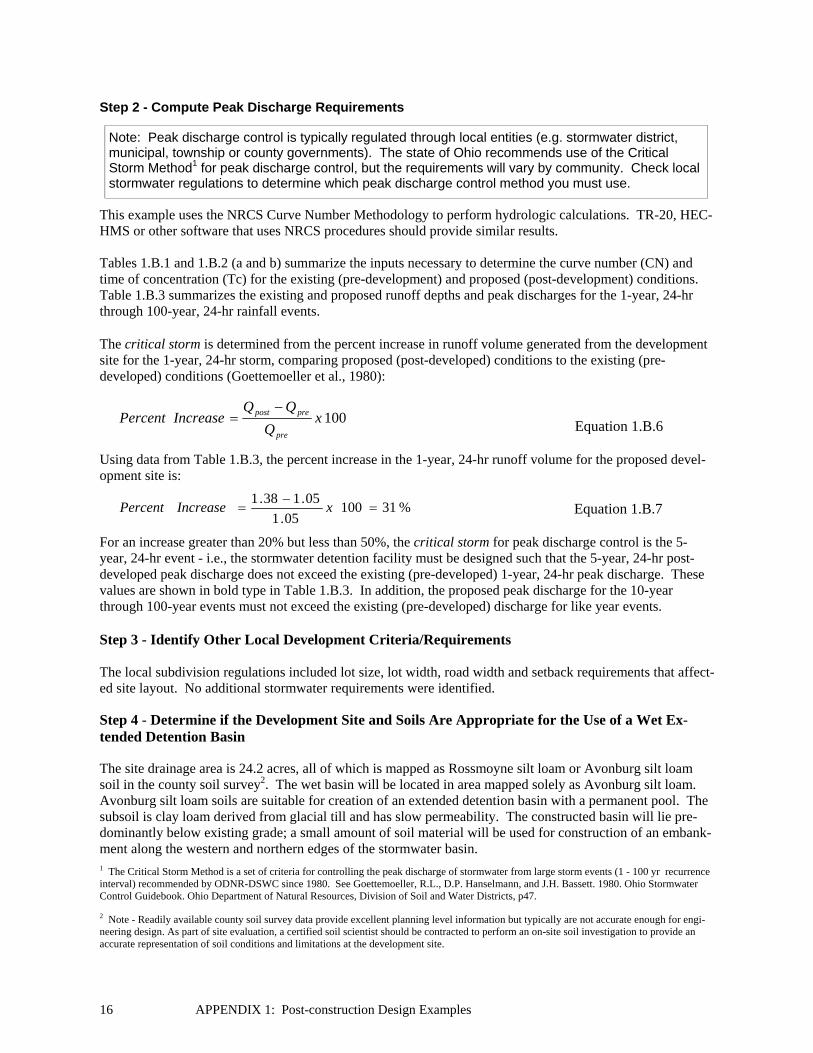
Step 2 - Compute Peak Discharge Requirements
This example uses the NRCS Curve Number Methodology to perform hydrologic calculations. TR-20, HEC-HMS or other software that uses NRCS procedures should provide similar results. Tables 1.B.1 and 1.B.2 (a and b) summarize the inputs necessary to determine the curve number (CN) and time of concentration (Tc) for the existing (pre-development) and proposed (post-development) conditions. Table 1.B.3 summarizes the existing and proposed runoff depths and peak discharges for the 1-year, 24-hr through 100-year, 24-hr rainfall events. The critical storm is determined from the percent increase in runoff volume generated from the development site for the 1-year, 24-hr storm, comparing proposed (post-developed) conditions to the existing (pre-developed) conditions (Goettemoeller et al., 1980):
Equation 1.B.6
Using data from Table 1.B.3, the percent increase in the 1-year, 24-hr runoff volume for the proposed devel-opment site is:
Equation 1.B.7 For an increase greater than 20% but less than 50%, the critical storm for peak discharge control is the 5-year, 24-hr event - i.e., the stormwater detention facility must be designed such that the 5-year, 24-hr post-developed peak discharge does not exceed the existing (pre-developed) 1-year, 24-hr peak discharge. These values are shown in bold type in Table 1.B.3. In addition, the proposed peak discharge for the 10-year through 100-year events must not exceed the existing (pre-developed) discharge for like year events. Step 3 - Identify Other Local Development Criteria/Requirements The local subdivision regulations included lot size, lot width, road width and setback requirements that affect-ed site layout. No additional stormwater requirements were identified. Step 4 - Determine if the Development Site and Soils Are Appropriate for the Use of a Wet Ex-tended Detention Basin The site drainage area is 24.2 acres, all of which is mapped as Rossmoyne silt loam or Avonburg silt loam soil in the county soil survey2. The wet basin will be located in area mapped solely as Avonburg silt loam. Avonburg silt loam soils are suitable for creation of an extended detention basin with a permanent pool. The subsoil is clay loam derived from glacial till and has slow permeability. The constructed basin will lie pre-dominantly below existing grade; a small amount of soil material will be used for construction of an embank-ment along the western and northern edges of the stormwater basin.
%3110005.1
05.138.1
xIncreasePercent
100xQ
QQIncreasePercent
pre
prepost
1 The Critical Storm Method is a set of criteria for controlling the peak discharge of stormwater from large storm events (1 - 100 yr recurrence interval) recommended by ODNR-DSWC since 1980. See Goettemoeller, R.L., D.P. Hanselmann, and J.H. Bassett. 1980. Ohio Stormwater Control Guidebook. Ohio Department of Natural Resources, Division of Soil and Water Districts, p47.
Note: Peak discharge control is typically regulated through local entities (e.g. stormwater district, municipal, township or county governments). The state of Ohio recommends use of the Critical Storm Method1 for peak discharge control, but the requirements will vary by community. Check local stormwater regulations to determine which peak discharge control method you must use.
2 Note - Readily available county soil survey data provide excellent planning level information but typically are not accurate enough for engi-neering design. As part of site evaluation, a certified soil scientist should be contracted to perform an on-site soil investigation to provide an accurate representation of soil conditions and limitations at the development site.
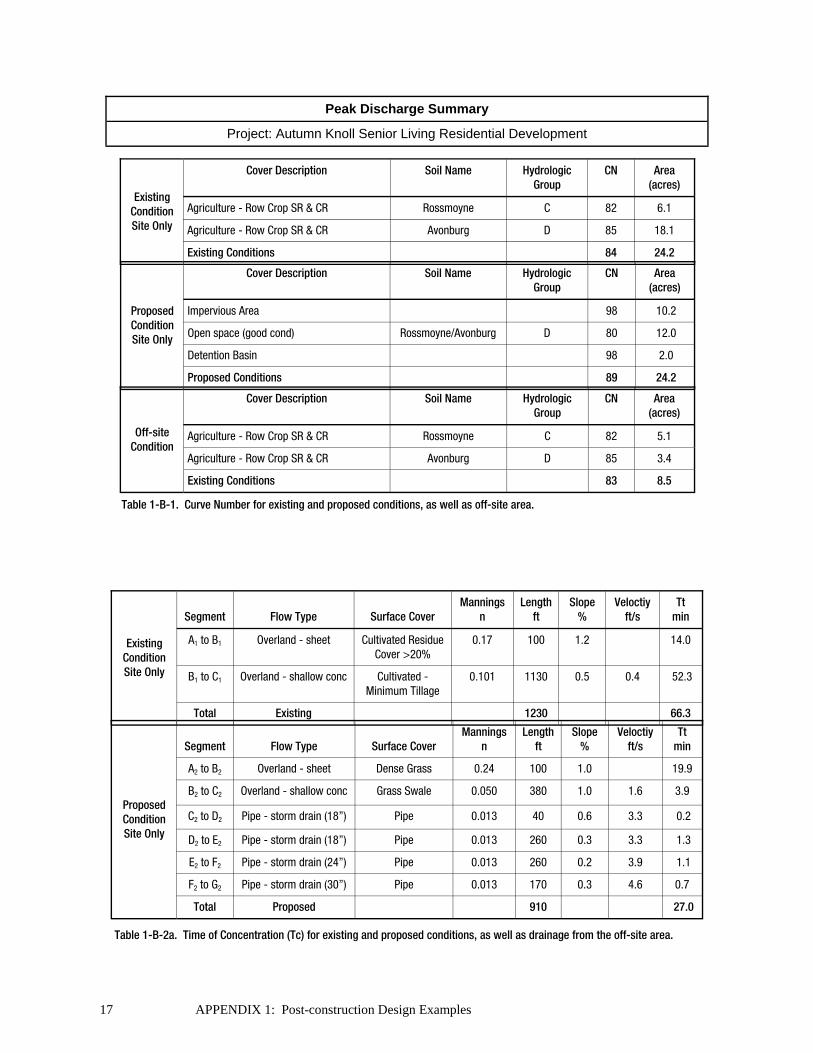
17 APPENDIX 1: Post-construction Design Examples
Segment
Flow Type
Surface Cover
Mannings n
Length ft
Slope %
Veloctiy ft/s
Tt min
A1 to B1 Overland - sheet Cultivated Residue Cover >20%
0.17 100 1.2 14.0
B1 to C1 Overland - shallow conc Cultivated - Minimum Tillage
0.101 1130 0.5 0.4 52.3
Total Existing 1230 66.3
Existing Condition Site Only
Peak Discharge Summary
Project: Autumn Knoll Senior Living Residential Development
Cover Description Soil Name Hydrologic Group
CN Area (acres)
Agriculture - Row Crop SR & CR Rossmoyne C 82 6.1
Agriculture - Row Crop SR & CR Avonburg D 85 18.1
Existing Conditions 84 24.2
Existing Condition Site Only
Cover Description Soil Name Hydrologic Group
CN Area (acres)
Impervious Area 98 10.2
Open space (good cond) Rossmoyne/Avonburg D 80 12.0
Detention Basin 98 2.0
Proposed Conditions 89 24.2
Proposed Condition Site Only
Segment
Flow Type
Surface Cover
Mannings n
Length ft
Slope %
Veloctiy ft/s
Tt min
A2 to B2 Overland - sheet Dense Grass 0.24 100 1.0 19.9
B2 to C2 Overland - shallow conc Grass Swale 0.050 380 1.0 1.6 3.9
C2 to D2 Pipe - storm drain (18”) Pipe 0.013 40 0.6 3.3 0.2
D2 to E2 Pipe - storm drain (18”) Pipe 0.013 260 0.3 3.3 1.3
E2 to F2 Pipe - storm drain (24”) Pipe 0.013 260 0.2 3.9 1.1
F2 to G2 Pipe - storm drain (30”) Pipe 0.013 170 0.3 4.6 0.7
Total Proposed 910 27.0
Proposed Condition Site Only
Cover Description Soil Name Hydrologic Group
CN Area (acres)
Agriculture - Row Crop SR & CR Rossmoyne C 82 5.1
Agriculture - Row Crop SR & CR Avonburg D 85 3.4
Existing Conditions 83 8.5
Off-site Condition
Table 1-B-2a. Time of Concentration (Tc) for existing and proposed conditions, as well as drainage from the off-site area.
Table 1-B-1. Curve Number for existing and proposed conditions, as well as off-site area.
18 APPENDIX 1: Post-construction Design Examples
RI years
P in
Qpre in
Qpost in
Qoff-site in
Qpre Ac-ft
Qpost Ac-ft
qpre cfs
qpost cfs
1 2.42 1.05 1.38 1.00 2.8 3.5 16.1 38.1
2 2.90 1.43 1.81 1.37 3.9 4.6 22.4 50.4
5 3.56 1.99 2.41 1.91 5.4 6.2 31.4 67.7
10 4.07 2.43 2.89 2.35 6.6 7.5 38.6 81.3
25 4.77 3.06 3.55 2.97 8.3 9.3 48.6 100.0
50 5.32 3.56 4.08 3.47 9.6 10.7 56.6 114.7
100 5.89 4.09 4.63 3.99 11.1 12.2 65.0 130.0
Table 1-B-3. Summary runoff depth or volume (Q) and peak discharge (q) for existing (pre-developed) and proposed (post-
Segment
Flow Type
Surface Cover
Mannings n
Length ft
Slope %
Veloctiy ft/s
Tt min
U2 to V2 Overland - sheet Cultivated Residue Cover >20%
0.17 100 1.5 12.8
V2 to W2 Overland - shallow conc Cultivated - Minimum tillage
0.101 300 0.7 0.4 11.9
W2 to C2 Overland - shallow conc Grass Swale 0.050 180 1.0 1.6 1.9
C2 to D2 Pipe - storm drain (18”) Pipe 0.013 40 0.3 3.3 0.2
D2 to E2 Pipe - storm drain (18”) Pipe 0.013 260 0.3 3.3 1.3
E2 to F2 Pipe - storm drain (24”) Pipe 0.013 260 0.3 3.9 1.1
F2 to G2 Pipe - storm drain (30”) Pipe 0.013 170 0.3 4.6 0.6
Total Proposed 1310 29.8
Proposed Condition Off-site
Condition
Table 1-B-2b. Time of Concentration (Tc) for existing and proposed condition for off-site drainage only.
Segment
Flow Type
Surface Cover
Mannings n
Length ft
Slope %
Veloctiy ft/s
Tt min
U1 to V1 Overland - sheet Cultivated Residue Cover >20%
0.17 100 1.5 12.8
V1 to W1 Overland - shallow conc Cultivated - Minimum Tillage
0.101 1250 0.5 0.4 57.9
Total Existing 1350 70.7
Existing Condition Off-site
Condition
Peak Discharge Summary (cont’d)
Project: Autumn Knoll Senior Living Residential Development

APPENDIX 1: Post-construction Design Examples 19
Step 5 - Determine Pond Location and Develop Preliminary Geometry to Meet WQv and Peak Dis-charge Requirements The proposed location of the stormwater basin (see Figure 1.B.1) reflects several goals for this develop-ment project (including appropriate soils). In particular, the wet basin is considered the centerpiece of this development, with “waterfront condos” selling for a premium. The basin will also be over-excavated to provide fill material to raise the elevation of the condo structures. Existing ground elevation at the proposed pond outlet is 829 MSL. As part of this development, a storm sewer will be installed along the county road to convey site runoff to a receiving stream to the west. At the connection point, the storm sewer is 36” and has an invert elevation of 818.5 MSL. [For more information on siting and planning an extended detention basin, see section 2.6.] The stormwater basin includes a permanent pool, an extended detention volume to protect water quality and stream channel stability, and storage necessary to control the peak discharge rate. The NPDES Storm Water Permit (OEPA, 2008) specifies a wet extended detention basin must include both a permanent pool (designated PPv below) and an extended detention volume (EDv) equal to 75% of the water quality volume (WQv), with an EDv drawdown time of 24 hours. The permit also requires that the permanent pool contain an additional sediment storage volume equal to 20% of the WQv. EDv = 0.75* WQv = 0.75*0.53 ac-ft = 0.40 ac-ft = 17,400 ft3 Equation 1-B-8 PPv > (0.75 + 0.2)*WQv = 0.95*0.53 ac-ft = 0.50 ac-ft = 22,000 ft3 Equation 1-B-9 A plan view of the basin layout (Figure 1-B-4) reflects the following: extended detention volume equal to 0.75*WQv permanent pool with a minimum volume of (0.75+0.2)*WQv and 6 foot minimum depth 4:1 sideslopes for safety and ease of maintenance shallow, submerged wetland safety benches around the perimeter an emergency spillway constructed in native soil 3 storm drain outlets draining subareas within the development site (note: the length to width ratio
for each of the two drains at the far end of the basin (draining approximately 90% of the site) ex-ceeds 3:1, whereas the storm drain for the clubhouse/parking lot (drains approximately 10% of the site) was located on the other side of the gazebo peninsula to extend flow pathway to minimize short-cutting.
Set elevations for pond structures The pond bottom and riser invert are set at elevation 820 MSL A pond drain will be included to facilitate drawdown for maintenance or repairs. Establish permanent pool and WQv water surface elevations A stage-area-storage table (Table 1.B.4) reflects the geometry of the stormwater basin (Figure 1.B.4) designed to meet permanent pool, extended detention (EDv) and peak discharge control requirements. The permanent pool volume (PPv) of 4.5 ac-ft (surface elevation 826.0) exceeds 0.95*WQv The extended detention volume (EDv) of 0.40 ac-ft above the permanent pool has a top elevation of
approximately 826.26.
20 APPENDIX 1: Post-construction Design Examples
Figure 1.B.4. Preliminary Plan View of Wet Extended Detention Basin (not to scale).
Elevation MSL (ft)
Surface Area (acre)
Average Area (acre)
Incremental Depth (ft)
Incremental Volume (ac-ft)
Cumulative Volume (ac-ft)
Vol above Perm Pool
(ac-ft)
820.0 0.004 - - - - -
826.0 1.50 0.75 6.0 4.5 4.5 -
826.3 1.53 1.51 0.3 0.4 4.9 0.4
827.0 1.61 1.57 0.7 1.2 6.1 1.6
828.0 1.72 1.66 1.0 1.7 7.8 3.3
829.0 1.83 1.78 1.0 1.8 9.6 5.1
830.0 1.98 1.90 1.0 1.9 11.5 7.0
831.0 2.20 2.09 1.0 2.1 13.6 9.1
Table 1.B.4. Stage-Area-Storage Information for Wet Extended Detention Basin.
APPENDIX 1: Post-construction Design Examples 21
Determine outlet geometry for 24-hour drawdown of EDv The controlling parameters are EDv = 0.40 ac-ft, depth of EDv = 0.26 ft, and minimum drain time, Td = 24 hours. Note that “the outlet structure for the post-construction BMP must not discharge more than the first half of the WQv in less than one-third of the drain time” (p22, NPDES Storm Water Construction General Permit; OEPA, 2008). This same criterion applies to the EDv. When a wet detention basin has a large surface area (and thus the EDv depth is small), the designer has a wide variety of outlet options that will meet the two criteria above3. In this situation, combining a v-notch weir (“V” depth equal to or exceeding the depth of the EDv) with the peak discharge (critical storm) outlet, the designer was able to simplify and optimize the outlet while meeting both EDv criteria (see Fig-ure 1.B.5) and peak discharge criteria (Table 1.B.5).
Determine storage and outlet configuration to meet peak discharge requirements As noted under Step 2, this wet detention basin is designed to meet the Critical Storm Method (CSM) for peak discharge control as well as the WQv requirement. Storage volume must be incorporated that, with appropriate outlet design, will allow the basin to meet the following requirements: The peak rate of discharge from the post-construction 5-year, 24-hour event (the critical storm) must
be less than the existing (pre-development) 1-year, 24-hour discharge peak rate The peak rate of discharge from the post-construction 10-, 25-, 50- and 100-year, 24-hour events
must be no more than the existing (pre-development) discharge peak rate for the corresponding re-currence interval events
Proprietary stormwater modeling software was used to try a combination of stage-storage and outlet 3 The methodology laid out in the Ohio NPDES Post Construction Q&A Document (Guidance Regarding Post-Construction Storm Water Management Requirements of Ohio; Ohio EPA, 2007) item #22.is a good starting point for selecting the EDv orifice size because it will always meet the two drawdown requirements: (1) the specified minimum drain time, Td; and (2) the outlet must not discharge more than the first half of the WQv (or EDv) in less than one-third of the drain time. A larger or smaller orifice should be considered if it will help meet other environ-mental, cost, or maintenance goals but must be tested for the two drawdown criteria.
Storage above Permanent Pool
0
2000
4000
6000
8000
10000
12000
14000
16000
18000
20000
0 5 10 15 20 25 30 35 40
Time (hr)
Vo
lum
e (f
t^3)
EDv = 17400 cu ftdepth (EDv) = 0.26 ft
T0 = 1.9 hr (time at which basin
begins draining from full EDv)
0.33*Td
0.5*EDv
T0 Td
Figure 1.B.5. Wet Extended Detention Basin - Drawdown from Full EDv.
22 APPENDIX 1: Post-construction Design Examples
Figure 1.B.6. Outlet Configuration for Wet Extended Detention Basin (not to scale).
configurations until the critical storm requirement was satisfied while considering the following: use best practices outlined in Section 2.6 of the Rainwater and Land Development manual optimize cut/fill and grading meet safety and aesthetic goals for the “lake” and waterfront properties The resulting detention basin geometry is presented in Figure 1.B.4 and Table 1.B.4. The resulting out-let configuration is shown in Figure 1.B.6. The outlet structure (see Figure 1.B.6) consists of a 3 ft by 3 ft concrete catch basin (e.g., ODOT No. 2-3) with invert at 820 MSL and 2.5’x2.5’ iron grate at 828 MSL. The following comprise the outlets: A 30” wide orifice combined with a V-notch weir (invert 826 MSL) that controls release of both the
extended detention volume (EDv) and the critical storm (5-year, 24-hour) 2.5’x2.5’ iron grate (effective orifice area 490 sq. in.; invert 828 MSL) for maintenance access and to
help manage discharge between the 10-yr and 100-yr, 24-hr events The catch basin will be connected - using a 30” diameter conduit - to the 36” diameter storm sewer at the road along the north property boundary. A tailwater analysis was performed using the modeling soft-ware and the storm sewer’s design elevation (invert at 818.5 MSL; 10-yr full pipe flow at 821.5 MSL) and assumed elevation for the 100-yr event (827.5 MSL). In addition, this design includes an emergency spillway excavated into native soil with the following char-acteristics: Invert (crest) elevation of 829.2 MSL Spillway crest perpendicular to flow Level section length of 25 ft, weir length (i.e., width of crest perpendicular to flow) of 25 ft Exit channel flows to road ditch at elevation 827.5 MSL With all other outlets blocked and starting from the permanent pool elevation of 826 MSL, will safely
convey the 100-yr, 24-hr event

APPENDIX 1: Post-construction Design Examples 23
Step 6 - Check Design to Ensure All Requirements Are Met From full EDv, check that EDv meets minimum 24 hour drain time, and discharges no more than 1/2 the extended detention volume, 0.5*EDv (9150 ft3), in the first 1/3 of the drain time, 0.33*Td (8 hr). This re-quirement is met and illustrated in Figure 1.A.54. Check peak discharge for all events (see Table 1.B.5).
4 Note - Through trial and error, it was determined using a constant intensity 1-hour rainfall event of 0.83” depth in the hydrologic model would raise the water surface elevation of the wet basin to 826.26 providing a just-full EDv of 0.40 ac-ft (17,400 ft3) above permanent pool, allowing evaluation of the drawdown from a full EDv (Figure 1.B.5). The depth of rainfall event necessary to just fill the EDv or WQv for other stormwater basins using CN methodology will vary based on watershed characteristics, pond geometry and outlet configuration, but can be determined through trial and error.
RI
years
P in
qpost-in cfs
Allowed qpost-out
cfs
Estimated qpost-
out cfs
1 2.42 38.1 16.1 7.2
2 2.90 50.4 16.1 11.1
5 3.56 67.7 16.1 15.9
10 4.07 81.3 38.6 24.0
25 4.77 100.0 48.6 32.3
50 5.32 114.7 56.6 37.3
100 5.89 130.0 65.0 41.8
Table 1.B.5. Critical Storm Method Peak Discharge Check.
24 APPENDIX 1: Post-construction Design Examples
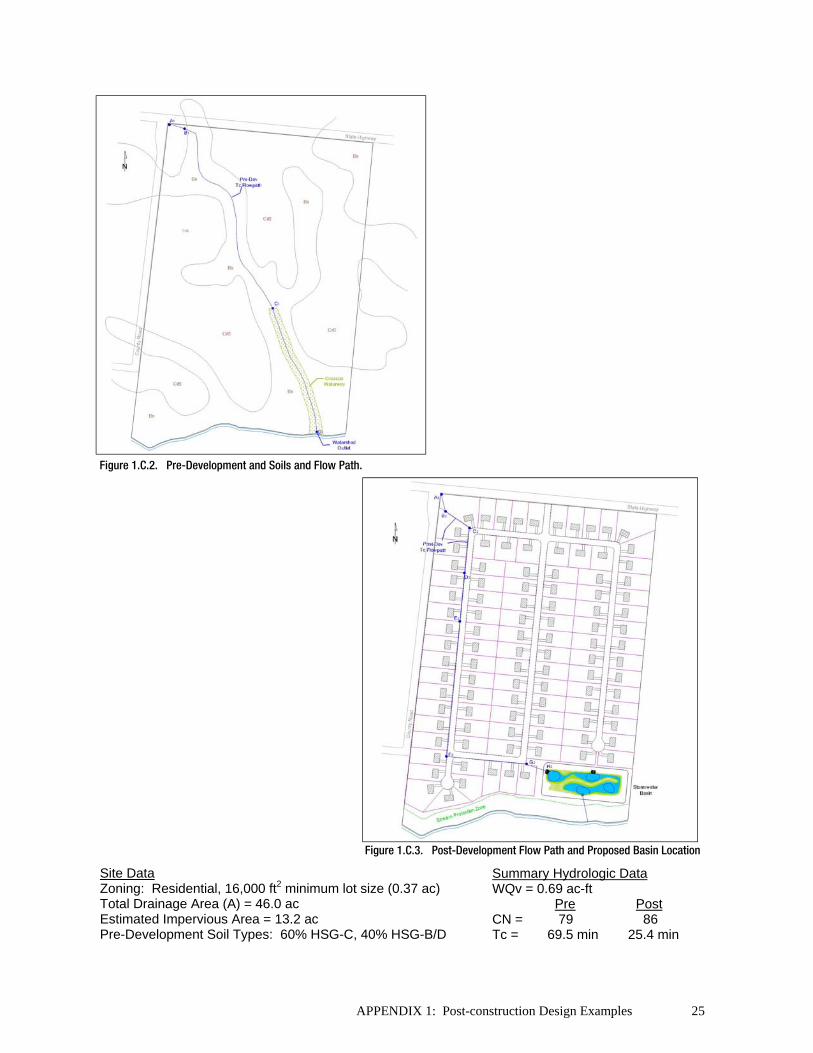
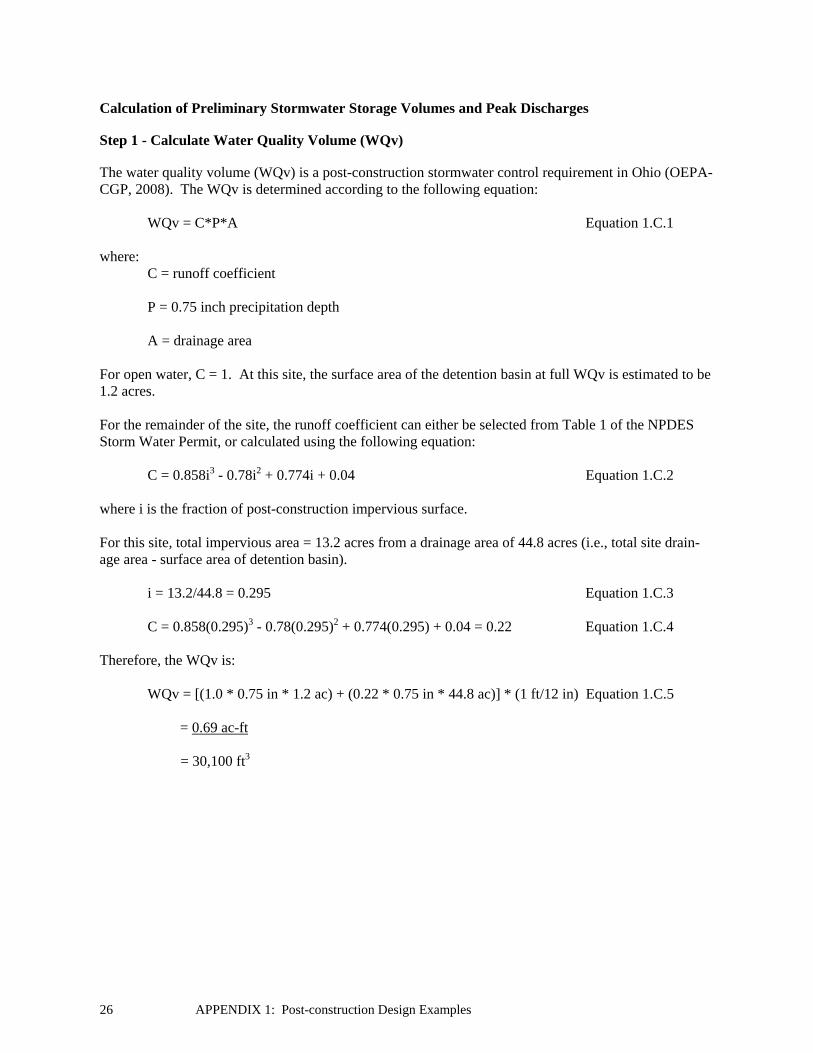
This design example illustrates the design of a extended detention wetland basin that provides water quality treatment and peak discharge control for a single family residential development, consisting of 101 residential lots on 46.0 acres (parcel and drainage area). The layout of the Beech Ridge subdivision is shown below in Figure 1.C.1. The impervious area of the site at completion of construction is estimated to be 13.2 acres. The pre-developed site soils and flow paths are shown in Figure 1.C.2, while the post-developed flow path (limited to that used for calculations) is shown in Figure 1.C.3. This example assumes that the local community has adopted the Critical Storm Method criteria to control peak discharges.
Section C: Extended Detention Wetland Basin
Figure 1.C.1. Beech Ridge Subdivision Site Plan.
APPENDIX 1: Post-construction Design Examples 25
Figure 1.C.3. Post-Development Flow Path and Proposed Basin Location
Figure 1.C.2. Pre-Development and Soils and Flow Path.
Site Data Zoning: Residential, 16,000 ft2 minimum lot size (0.37 ac) Total Drainage Area (A) = 46.0 ac Estimated Impervious Area = 13.2 ac Pre-Development Soil Types: 60% HSG-C, 40% HSG-B/D
Summary Hydrologic Data WQv = 0.69 ac-ft Pre Post CN = 79 86 Tc = 69.5 min 25.4 min
26 APPENDIX 1: Post-construction Design Examples
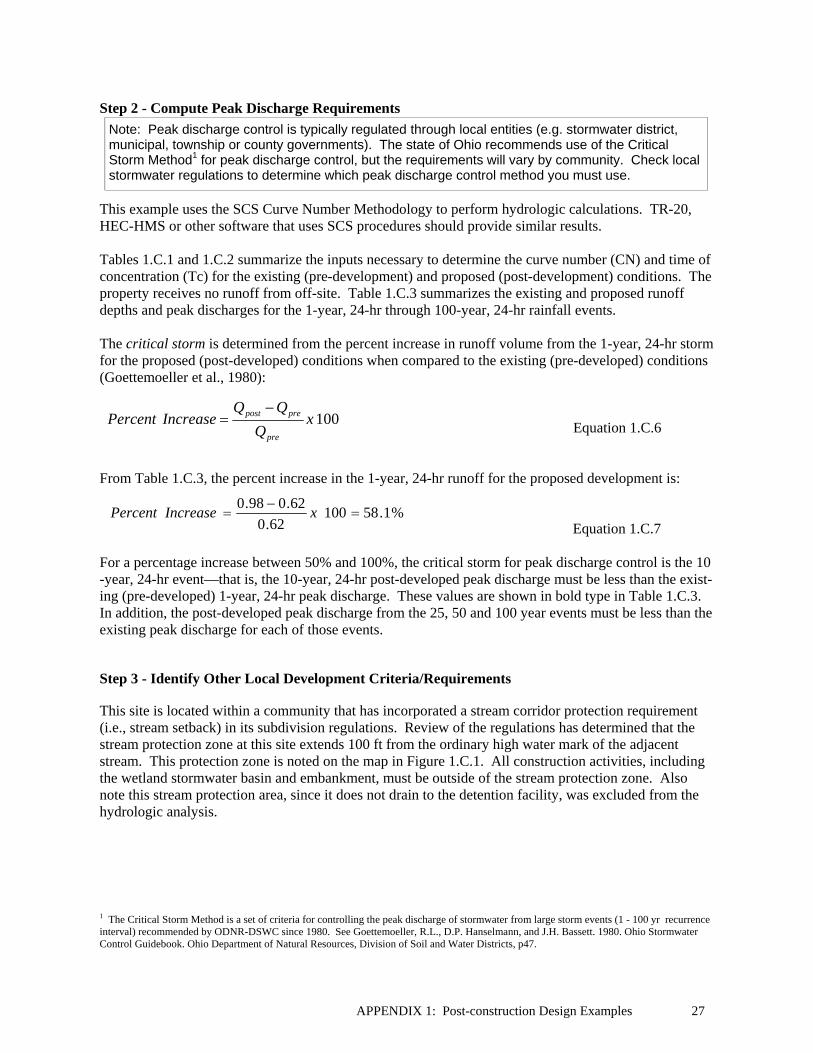
Calculation of Preliminary Stormwater Storage Volumes and Peak Discharges Step 1 - Calculate Water Quality Volume (WQv) The water quality volume (WQv) is a post-construction stormwater control requirement in Ohio (OEPA-CGP, 2008). The WQv is determined according to the following equation: WQv = C*P*A Equation 1.C.1 where: C = runoff coefficient P = 0.75 inch precipitation depth A = drainage area For open water, C = 1. At this site, the surface area of the detention basin at full WQv is estimated to be 1.2 acres. For the remainder of the site, the runoff coefficient can either be selected from Table 1 of the NPDES Storm Water Permit, or calculated using the following equation: C = 0.858i3 - 0.78i2 + 0.774i + 0.04 Equation 1.C.2 where i is the fraction of post-construction impervious surface. For this site, total impervious area = 13.2 acres from a drainage area of 44.8 acres (i.e., total site drain-age area - surface area of detention basin). i = 13.2/44.8 = 0.295 Equation 1.C.3 C = 0.858(0.295)3 - 0.78(0.295)2 + 0.774(0.295) + 0.04 = 0.22 Equation 1.C.4 Therefore, the WQv is: WQv = [(1.0 * 0.75 in * 1.2 ac) + (0.22 * 0.75 in * 44.8 ac)] * (1 ft/12 in) Equation 1.C.5
= 0.69 ac-ft = 30,100 ft3
APPENDIX 1: Post-construction Design Examples 27
Step 2 - Compute Peak Discharge Requirements
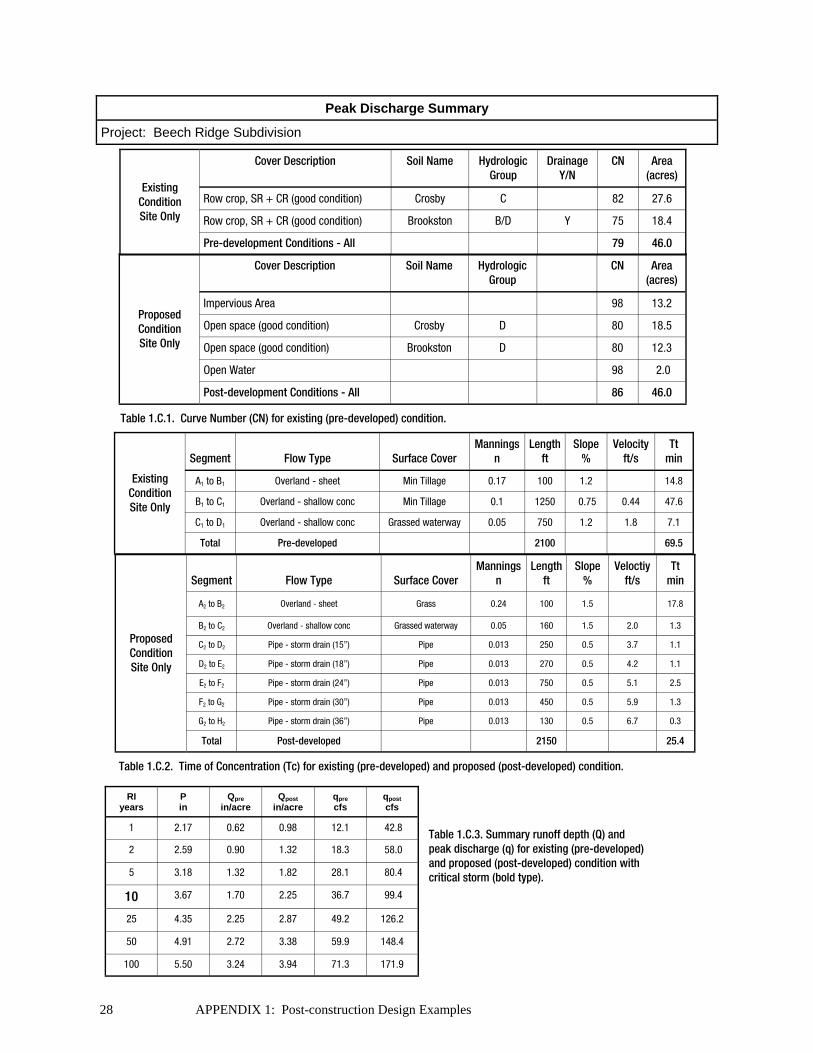
This example uses the SCS Curve Number Methodology to perform hydrologic calculations. TR-20, HEC-HMS or other software that uses SCS procedures should provide similar results. Tables 1.C.1 and 1.C.2 summarize the inputs necessary to determine the curve number (CN) and time of concentration (Tc) for the existing (pre-development) and proposed (post-development) conditions. The property receives no runoff from off-site. Table 1.C.3 summarizes the existing and proposed runoff depths and peak discharges for the 1-year, 24-hr through 100-year, 24-hr rainfall events. The critical storm is determined from the percent increase in runoff volume from the 1-year, 24-hr storm for the proposed (post-developed) conditions when compared to the existing (pre-developed) conditions (Goettemoeller et al., 1980):
Equation 1.C.6
From Table 1.C.3, the percent increase in the 1-year, 24-hr runoff for the proposed development is:
Equation 1.C.7
For a percentage increase between 50% and 100%, the critical storm for peak discharge control is the 10-year, 24-hr event—that is, the 10-year, 24-hr post-developed peak discharge must be less than the exist-ing (pre-developed) 1-year, 24-hr peak discharge. These values are shown in bold type in Table 1.C.3. In addition, the post-developed peak discharge from the 25, 50 and 100 year events must be less than the existing peak discharge for each of those events. Step 3 - Identify Other Local Development Criteria/Requirements This site is located within a community that has incorporated a stream corridor protection requirement (i.e., stream setback) in its subdivision regulations. Review of the regulations has determined that the stream protection zone at this site extends 100 ft from the ordinary high water mark of the adjacent stream. This protection zone is noted on the map in Figure 1.C.1. All construction activities, including the wetland stormwater basin and embankment, must be outside of the stream protection zone. Also note this stream protection area, since it does not drain to the detention facility, was excluded from the hydrologic analysis.
1 The Critical Storm Method is a set of criteria for controlling the peak discharge of stormwater from large storm events (1 - 100 yr recurrence interval) recommended by ODNR-DSWC since 1980. See Goettemoeller, R.L., D.P. Hanselmann, and J.H. Bassett. 1980. Ohio Stormwater Control Guidebook. Ohio Department of Natural Resources, Division of Soil and Water Districts, p47.
100xQ
QQIncreasePercent
pre
prepost
%1.5810062.0
62.098.0
xIncreasePercent
Note: Peak discharge control is typically regulated through local entities (e.g. stormwater district, municipal, township or county governments). The state of Ohio recommends use of the Critical Storm Method1 for peak discharge control, but the requirements will vary by community. Check local stormwater regulations to determine which peak discharge control method you must use.
28 APPENDIX 1: Post-construction Design Examples
Segment
Flow Type
Surface Cover
Mannings n
Length ft
Slope %
Velocity ft/s
Tt min
A1 to B1 Overland - sheet Min Tillage 0.17 100 1.2 14.8
B1 to C1 Overland - shallow conc Min Tillage 0.1 1250 0.75 0.44 47.6
C1 to D1 Overland - shallow conc Grassed waterway 0.05 750 1.2 1.8 7.1
Total Pre-developed 2100 69.5
Existing Condition Site Only
RI years
P in
Qpre in/acre
Qpost in/acre
qpre cfs
qpost cfs
1 2.17 0.62 0.98 12.1 42.8
2 2.59 0.90 1.32 18.3 58.0
5 3.18 1.32 1.82 28.1 80.4
10 3.67 1.70 2.25 36.7 99.4
25 4.35 2.25 2.87 49.2 126.2
50 4.91 2.72 3.38 59.9 148.4
100 5.50 3.24 3.94 71.3 171.9
Peak Discharge Summary
Project: Beech Ridge Subdivision
Cover Description Soil Name Hydrologic Group
Drainage Y/N
CN Area (acres)
Row crop, SR + CR (good condition) Crosby C 82 27.6
Row crop, SR + CR (good condition) Brookston B/D Y 75 18.4
Pre-development Conditions - All 79 46.0
Existing Condition Site Only
Cover Description Soil Name Hydrologic Group
CN Area (acres)
Impervious Area 98 13.2
Open space (good condition) Crosby D 80 18.5
Open space (good condition) Brookston D 80 12.3
Open Water 98 2.0
Post-development Conditions - All 86 46.0
Proposed Condition Site Only
Table 1.C.1. Curve Number (CN) for existing (pre-developed) condition.
Table 1.C.2. Time of Concentration (Tc) for existing (pre-developed) and proposed (post-developed) condition.
Table 1.C.3. Summary runoff depth (Q) and peak discharge (q) for existing (pre-developed) and proposed (post-developed) condition with critical storm (bold type).
Segment
Flow Type
Surface Cover
Mannings n
Length ft
Slope %
Veloctiy ft/s
Tt min
A2 to B2 Overland - sheet Grass 0.24 100 1.5 17.8
B2 to C2 Overland - shallow conc Grassed waterway 0.05 160 1.5 2.0 1.3
C2 to D2 Pipe - storm drain (15”) Pipe 0.013 250 0.5 3.7 1.1
D2 to E2 Pipe - storm drain (18”) Pipe 0.013 270 0.5 4.2 1.1
E2 to F2 Pipe - storm drain (24”) Pipe 0.013 750 0.5 5.1 2.5
F2 to G2 Pipe - storm drain (30”) Pipe 0.013 450 0.5 5.9 1.3
G2 to H2 Pipe - storm drain (36”) Pipe 0.013 130 0.5 6.7 0.3
Total Post-developed 2150 25.4
Proposed Condition Site Only
APPENDIX 1: Post-construction Design Examples 29
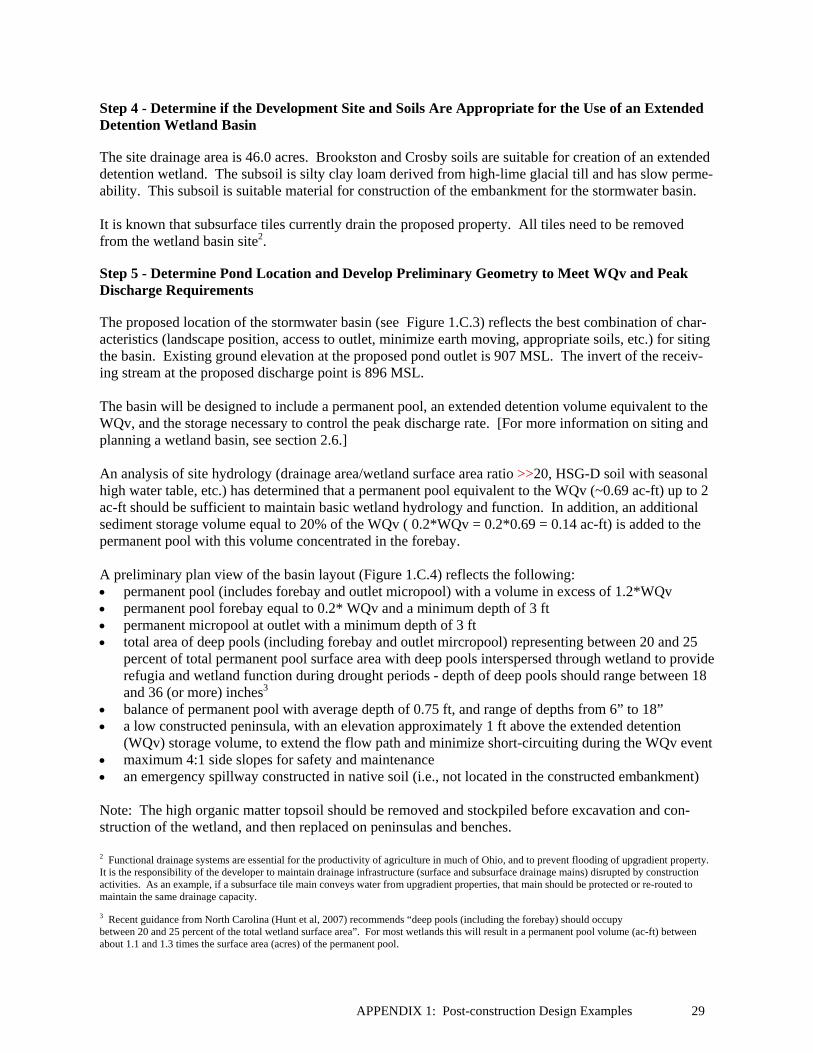
Step 4 - Determine if the Development Site and Soils Are Appropriate for the Use of an Extended Detention Wetland Basin The site drainage area is 46.0 acres. Brookston and Crosby soils are suitable for creation of an extended detention wetland. The subsoil is silty clay loam derived from high-lime glacial till and has slow perme-ability. This subsoil is suitable material for construction of the embankment for the stormwater basin. It is known that subsurface tiles currently drain the proposed property. All tiles need to be removed from the wetland basin site2. Step 5 - Determine Pond Location and Develop Preliminary Geometry to Meet WQv and Peak Discharge Requirements The proposed location of the stormwater basin (see Figure 1.C.3) reflects the best combination of char-acteristics (landscape position, access to outlet, minimize earth moving, appropriate soils, etc.) for siting the basin. Existing ground elevation at the proposed pond outlet is 907 MSL. The invert of the receiv-ing stream at the proposed discharge point is 896 MSL. The basin will be designed to include a permanent pool, an extended detention volume equivalent to the WQv, and the storage necessary to control the peak discharge rate. [For more information on siting and planning a wetland basin, see section 2.6.] An analysis of site hydrology (drainage area/wetland surface area ratio >>20, HSG-D soil with seasonal high water table, etc.) has determined that a permanent pool equivalent to the WQv (~0.69 ac-ft) up to 2 ac-ft should be sufficient to maintain basic wetland hydrology and function. In addition, an additional sediment storage volume equal to 20% of the WQv ( 0.2*WQv = 0.2*0.69 = 0.14 ac-ft) is added to the permanent pool with this volume concentrated in the forebay. A preliminary plan view of the basin layout (Figure 1.C.4) reflects the following: permanent pool (includes forebay and outlet micropool) with a volume in excess of 1.2*WQv permanent pool forebay equal to 0.2* WQv and a minimum depth of 3 ft permanent micropool at outlet with a minimum depth of 3 ft total area of deep pools (including forebay and outlet mircropool) representing between 20 and 25
percent of total permanent pool surface area with deep pools interspersed through wetland to provide refugia and wetland function during drought periods - depth of deep pools should range between 18 and 36 (or more) inches3
balance of permanent pool with average depth of 0.75 ft, and range of depths from 6” to 18” a low constructed peninsula, with an elevation approximately 1 ft above the extended detention
(WQv) storage volume, to extend the flow path and minimize short-circuiting during the WQv event maximum 4:1 side slopes for safety and maintenance an emergency spillway constructed in native soil (i.e., not located in the constructed embankment) Note: The high organic matter topsoil should be removed and stockpiled before excavation and con-struction of the wetland, and then replaced on peninsulas and benches.
3 Recent guidance from North Carolina (Hunt et al, 2007) recommends “deep pools (including the forebay) should occupy between 20 and 25 percent of the total wetland surface area”. For most wetlands this will result in a permanent pool volume (ac-ft) between about 1.1 and 1.3 times the surface area (acres) of the permanent pool.
2 Functional drainage systems are essential for the productivity of agriculture in much of Ohio, and to prevent flooding of upgradient property. It is the responsibility of the developer to maintain drainage infrastructure (surface and subsurface drainage mains) disrupted by construction activities. As an example, if a subsurface tile main conveys water from upgradient properties, that main should be protected or re-routed to maintain the same drainage capacity.
30 APPENDIX 1: Post-construction Design Examples
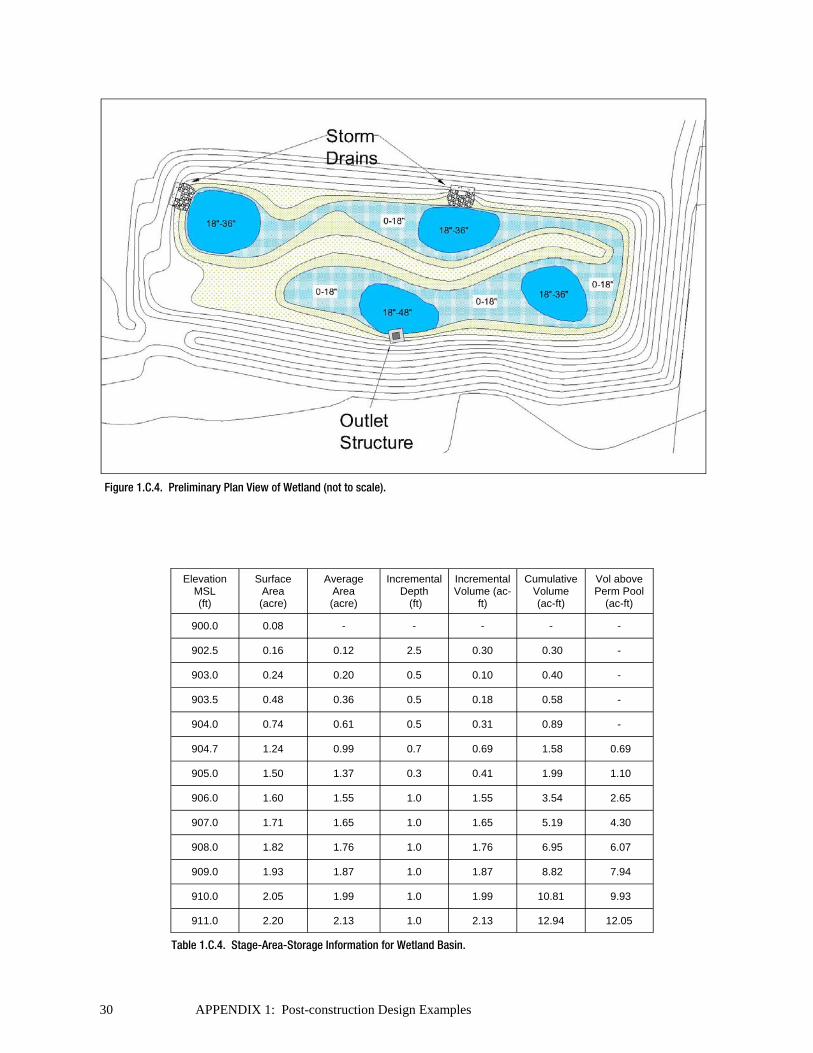
Figure 1.C.4. Preliminary Plan View of Wetland (not to scale).
Elevation MSL (ft)
Surface Area (acre)
Average Area (acre)
Incremental Depth
(ft)
Incremental Volume (ac-
ft)
Cumulative Volume (ac-ft)
Vol above Perm Pool
(ac-ft)
900.0 0.08 - - - - -
902.5 0.16 0.12 2.5 0.30 0.30 -
903.0 0.24 0.20 0.5 0.10 0.40 -
903.5 0.48 0.36 0.5 0.18 0.58 -
904.0 0.74 0.61 0.5 0.31 0.89 -
904.7 1.24 0.99 0.7 0.69 1.58 0.69
905.0 1.50 1.37 0.3 0.41 1.99 1.10
906.0 1.60 1.55 1.0 1.55 3.54 2.65
907.0 1.71 1.65 1.0 1.65 5.19 4.30
908.0 1.82 1.76 1.0 1.76 6.95 6.07
909.0 1.93 1.87 1.0 1.87 8.82 7.94
910.0 2.05 1.99 1.0 1.99 10.81 9.93
911.0 2.20 2.13 1.0 2.13 12.94 12.05
Table 1.C.4. Stage-Area-Storage Information for Wetland Basin.
APPENDIX 1: Post-construction Design Examples 31
Set elevations for pond structures
The basin bottom is set at elevation 900.0 To allow gravity flow for the pond drain, set the riser invert at 898.0 The outfall at the receiving stream has invert elevation 896.5
Set permanent pool and WQv water surface elevations
A stage-area-storage table (Table 1-4) reflects geometry of the stormwater wetland basin (Figure 1-3) designed to meet permanent pool, extended detention WQv and peak discharge control requirements.
To meet NPDES Construction Stormwater Permit minimums, the permanent pool, surface elevation 904.0, is sized to exceed 1.2*WQv = 1.2*0.69 ac-ft = 0.83 ac-ft (see footnote below)
The extended detention WQv of 0.69 ac-ft above permanent pool has a top elevation of approximately 904.7
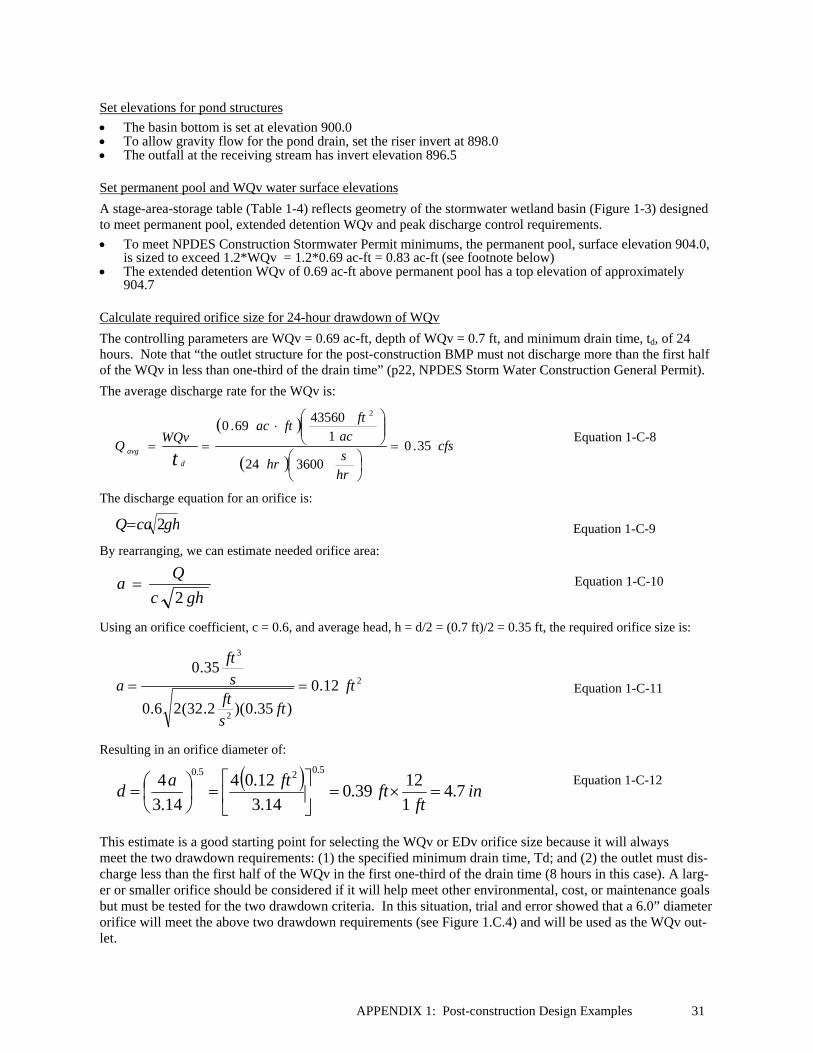
Calculate required orifice size for 24-hour drawdown of WQv
The controlling parameters are WQv = 0.69 ac-ft, depth of WQv = 0.7 ft, and minimum drain time, td, of 24 hours. Note that “the outlet structure for the post-construction BMP must not discharge more than the first half of the WQv in less than one-third of the drain time” (p22, NPDES Storm Water Construction General Permit).
The average discharge rate for the WQv is: Equation 1-C-8
The discharge equation for an orifice is: Equation 1-C-9
By rearranging, we can estimate needed orifice area:
Equation 1-C-10
Using an orifice coefficient, c = 0.6, and average head, h = d/2 = (0.7 ft)/2 = 0.35 ft, the required orifice size is: Equation 1-C-11
Resulting in an orifice diameter of: Equation 1-C-12
This estimate is a good starting point for selecting the WQv or EDv orifice size because it will always meet the two drawdown requirements: (1) the specified minimum drain time, Td; and (2) the outlet must dis-charge less than the first half of the WQv in the first one-third of the drain time (8 hours in this case). A larg-er or smaller orifice should be considered if it will help meet other environmental, cost, or maintenance goals but must be tested for the two drawdown criteria. In this situation, trial and error showed that a 6.0” diameter orifice will meet the above two drawdown requirements (see Figure 1.C.4) and will be used as the WQv out-let.
cfs
hrs
hr
acft
ftacWQv
Qt d
avg 35.0360024
143560
69.02
ghcaQ 2
in
ftft
ftad 7.4
1
1239.0
14.3
12.04
14.3
45.025.0
2
2
3
12.0
)35.0)(2.32(26.0
35.0ft
ftsftsft
a
ghc
Qa
2

APPENDIX 1: Post-construction Design Examples 32
Determine storage and outlet configuration to meet peak discharge requirements As noted under Step 2, this wetland basin is designed to meet the Critical Storm Method (CSM) for peak discharge control as well as the WQv requirement. Additional storage volume must be added that, with appropriate outlet design, will allow the basin to meet the following requirements: The peak rate of discharge from the post-construction 10-year, 24-hour event (the critical storm) must be re-
leased at the existing (pre-development) 1-year, 24-hour discharge rate The peak rate of discharge from the post-construction 25-, 50- and 100-year, 24-hour events must be released
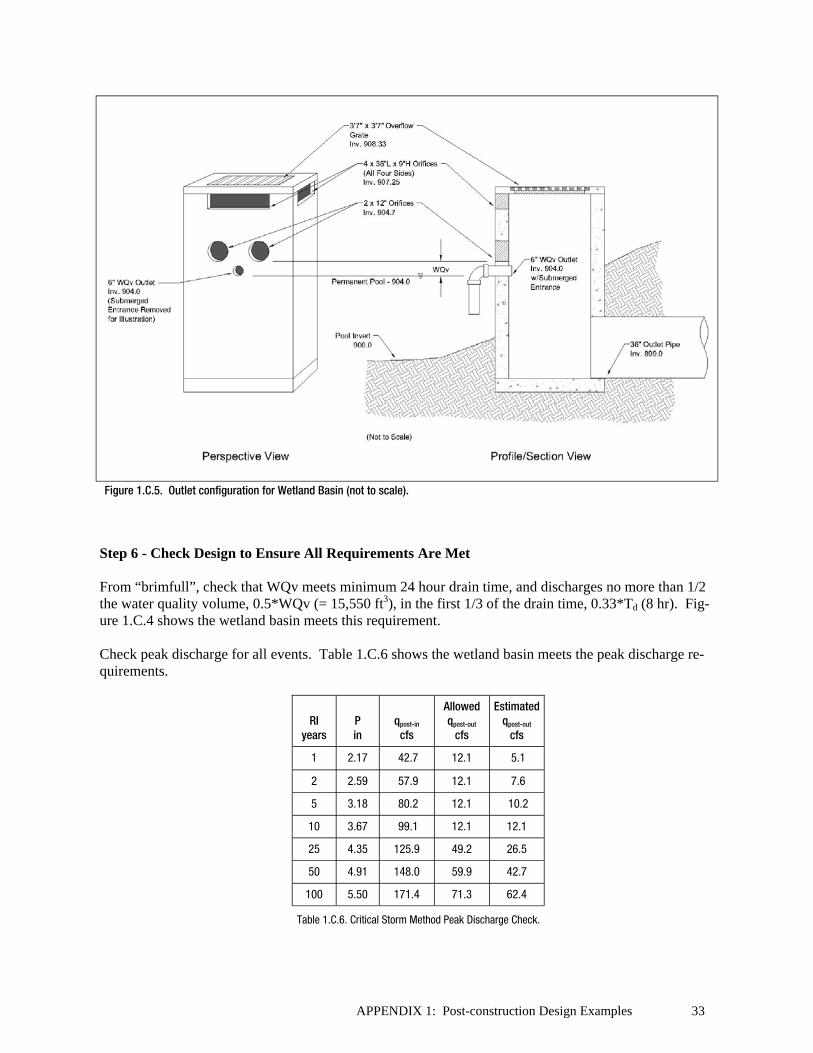
at the existing (pre-development) discharge rate for the corresponding recurrence interval events Proprietary stormwater modeling software was used to try a combination of stage-storage and outlet configurations until the Table 1.C.5 requirements were satisfied while considering the following: maximize wetland function minimize the “footprint” of the basin optimize cut/fill The resulting wetland basin geometry is presented in Figure 1.C.3 and Table 1.C.4. The resulting outlet configuration is shown in Figure 1.C.5. The outlet structure consists of a 4 ft by 4 ft concrete catch basin (e.g., ODOT No 2-4) with invert at 899 MSL and 3.7’x3.7’ iron grate at 908.33 MSL. The following comprise the outlets: 36” barrel outlet with invert at 899 MSL 6.0” extended detention (WQv) orifice (invert 904 MSL) with sub-
merged entrance Two (2) 12” diameter orifices (invert 904.7 MSL) that control re-
lease of the critical storm (10-year, 24-hour) Four 36” L x 9” H rectangular orifices (invert 907.25 MSL) and 3.7’x3.7’ iron grate (invert 908.33) with 868
in2 of clear opening area that control release of the 25- through 100-year, 24-hour events In addition, this design includes an emergency spillway excavated into native soil that has the following character-istics: Invert (crest) elevation of 909.3 MSL Level section length of 25 ft, weir length (i.e., crest width) of 30 ft Spillway crest perpendicular to flow Exit channel aligned with level section well beyond downstream toe of dam, and a 4 percent slope With all other outlets blocked and starting from the permanent pool elevation of 904 MSL, will safely convey
the 100-yr, 24-hr event with 1 ft freeboard from top of embankment
Table 1.C.5. Critical Storm Method Peak Discharge Requirements.
RI
years
P in
qpost-in
cfs
Allowed qpost-out
cfs
1 2.17 42.7 12.1
2 2.59 57.9 12.1
5 3.18 80.2 12.1
10 3.67 99.1 12.1
25 4.35 125.9 49.2
50 4.91 148.0 59.9
100 5.50 171.4 71.3
APPENDIX 1: Post-construction Design Examples 33
Figure 1.C.5. Outlet configuration for Wetland Basin (not to scale). Step 6 - Check Design to Ensure All Requirements Are Met From “brimfull”, check that WQv meets minimum 24 hour drain time, and discharges no more than 1/2 the water quality volume, 0.5*WQv (= 15,550 ft3), in the first 1/3 of the drain time, 0.33*Td (8 hr). Fig-ure 1.C.4 shows the wetland basin meets this requirement. Check peak discharge for all events. Table 1.C.6 shows the wetland basin meets the peak discharge re-quirements.
RI
years
P in
qpost-in cfs
Allowed qpost-out
cfs
Estimated qpost-out
cfs
1 2.17 42.7 12.1 5.1
2 2.59 57.9 12.1 7.6
5 3.18 80.2 12.1 10.2
10 3.67 99.1 12.1 12.1
25 4.35 125.9 49.2 26.5
50 4.91 148.0 59.9 42.7
100 5.50 171.4 71.3 62.4
Table 1.C.6. Critical Storm Method Peak Discharge Check.
34 APPENDIX 1: Post-construction Design Examples
References: Goettemoeller, R.L., D.P. Hanselmann, and J.H. Bassett. 1980. Ohio Stormwater Control Guidebook. Ohio Department of Natural Resources, Division of Soil and Water Districts, Columbus. http://www.dnr.state.oh.us/soilandwater/water/urbanstormwater/default/tabid/9190/Default.aspx Hunt, W. F., M. R. Burchell, J. D. Wright, and K. L. Bass. 2007. Stormwater Wetland Design Update (AGW- 588-12). Online: http://www.bae.ncsu.edu/stormwater/PublicationFiles/WetlandDesignUpdate2007.pdf NWS-NOAA. 2004. Precipitation-Frequency Atlas of the United States, NOAA Atlas 14, Vol 2, Ver-sion 3, NOAA, National Weather Service, Silver Spring, MD. [This data can be accessed through the internet Precipitation Frequency Data Server (PFDS): http://hdsc.nws.noaa.gov/hdsc/pfds/ Ohio EPA. 2008. NPDES Storm Water Construction General Permit, April 2008. Ohio Environmental Protection Agency, Columbus. http://www.epa.ohio.gov/dsw/permits/GP_ConstructionSiteStormWater.aspx U.S. Department of Agriculture, Natural Resources Conservation Service. 1980. Soil Survey of Cuya-hoga County, Ohio. U.S. Department of Natural Resources, Natural Resources Conservation Service. U.S. Department of Agriculture, Natural Resources Conservation Service. 1986. Urban Hydrology for Small Watersheds. Technical Release 55 (TR-55), U.S. Dept. of Agriculture, Natural Resources Conser-vation Service, Washington, DC. U.S. Department of Agriculture, Natural Resources Conservation Service. 1997. Earth Spillway Design. National Engineering Handbook 628.50. U.S. Department of Natural Resources, Natural Resources Conservation Service. U.S. Department of Agriculture, Natural Resources Conservation Service. 2000. Ponds — Planning, De-sign, Construction. Agriculture Handbook 590. U.S. Department of Natural Resources, Natural Re-sources Conservation Service. U.S. Department of Agriculture, Natural Resources Conservation Service. 2003. Pond Standard 378. Ohio Field Office Technical Guide. U.S. Department of Natural Resources, Natural Resources Conser-vation Service. U.S. Department of Agriculture, Natural Resources Conservation Service. Various dates. National Engi-neering Handbook, Part 630 Hydrology. U.S. Department of Natural Resources, Natural Resources Con-servation Service. U.S. Department of Agriculture, Soil Conservation Service. 1975. Soil Survey of Clermont County, Ohio. U.S. Department of Natural Resources, Soil Conservation Service. U.S. Department of Agriculture, Soil Conservation Service. 1975. Soil Survey of Union County, Ohio. U.S. Department of Natural Resources, Natural Resources Conservation Service.