app marketing - resebok
TRANSCRIPT


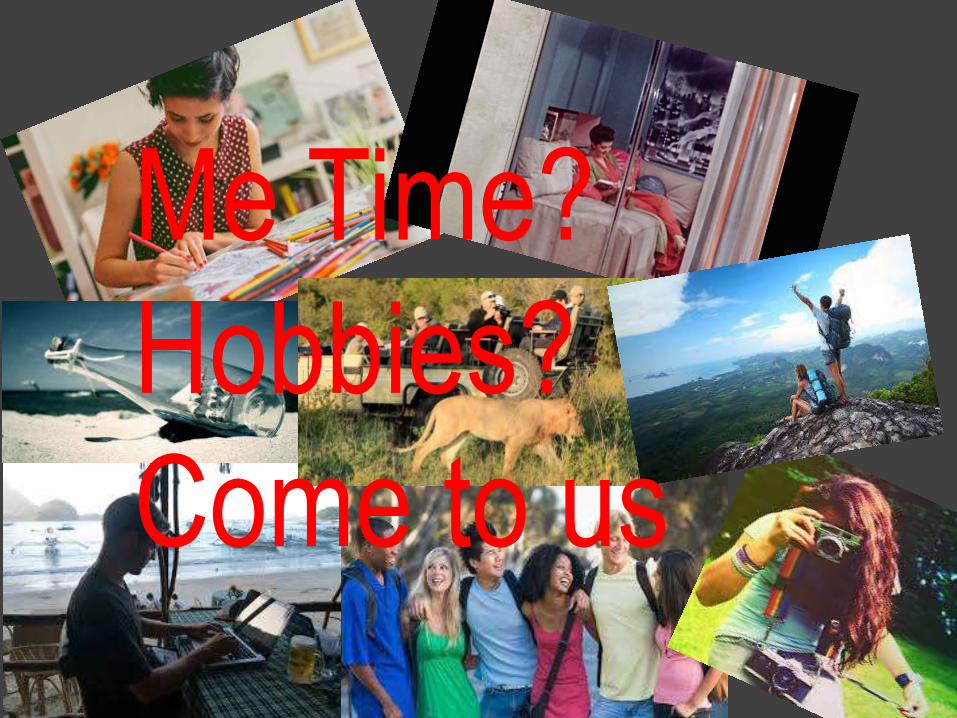
Me Time?
Hobbies?
Come to us
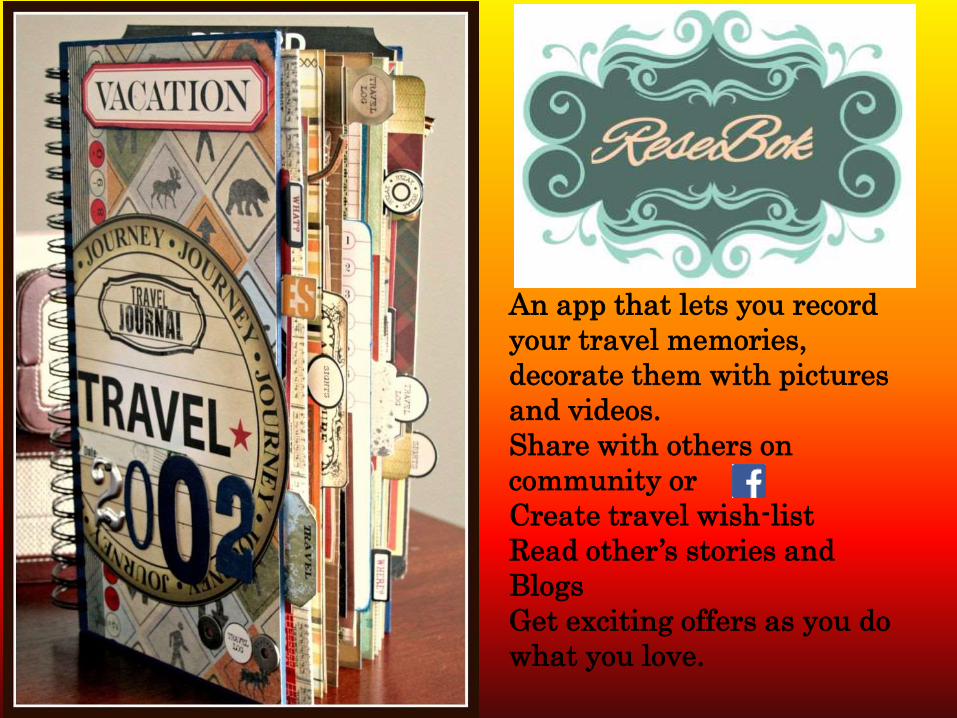
An app that lets you record
your travel memories,
decorate them with pictures
and videos.
Share with others on
community or
Create travel wish-list
Read other’s stories and
Blogs
Get exciting offers as you do
what you love.

Situation Analysis
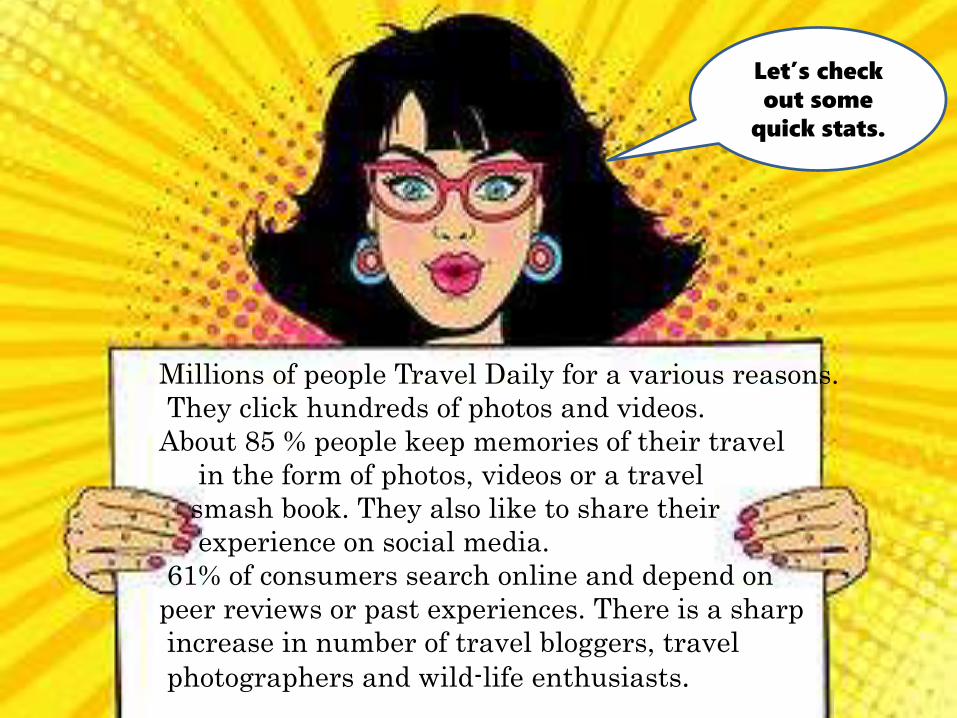
Let’s check
out some
quick stats.
Millions of people Travel Daily for a various reasons.
They click hundreds of photos and videos.
About 85 % people keep memories of their travel
in the form of photos, videos or a travel
smash book. They also like to share their
experience on social media.
61% of consumers search online and depend on
peer reviews or past experiences. There is a sharp
increase in number of travel bloggers, travel
photographers and wild-life enthusiasts.
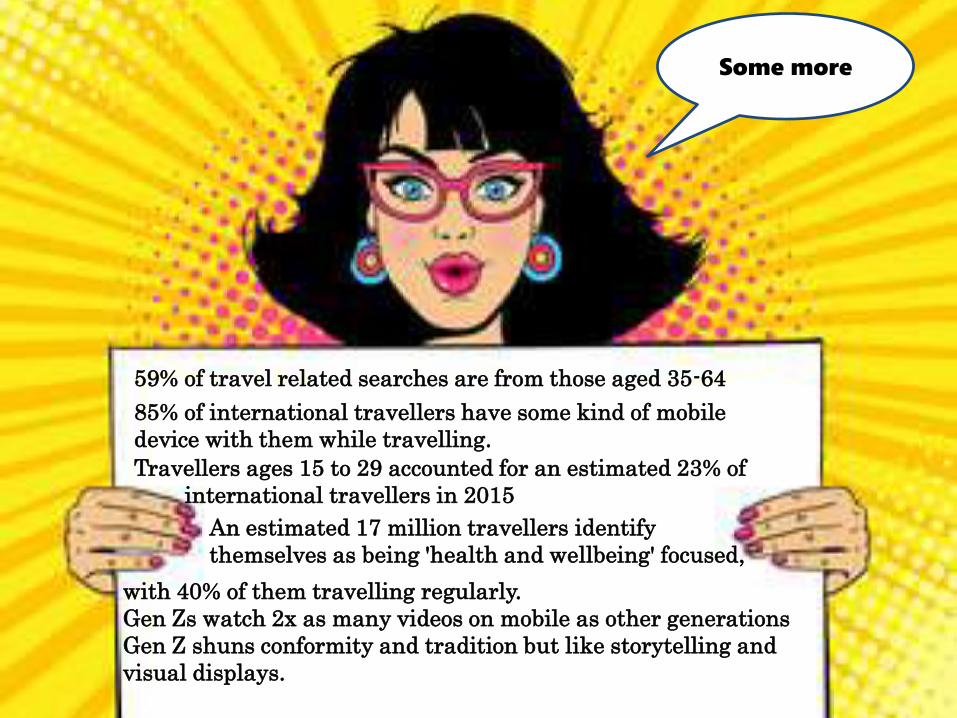
85% of international travellers have some kind of mobile
device with them while travelling.
Travellers ages 15 to 29 accounted for an estimated 23% of
international travellers in 2015
An estimated 17 million travellers identify
themselves as being 'health and wellbeing' focused,
with 40% of them travelling regularly.
Gen Zs watch 2x as many videos on mobile as other generations
Gen Z shuns conformity and tradition but like storytelling and
visual displays.
59% of travel related searches are from those aged 35-64
Some more
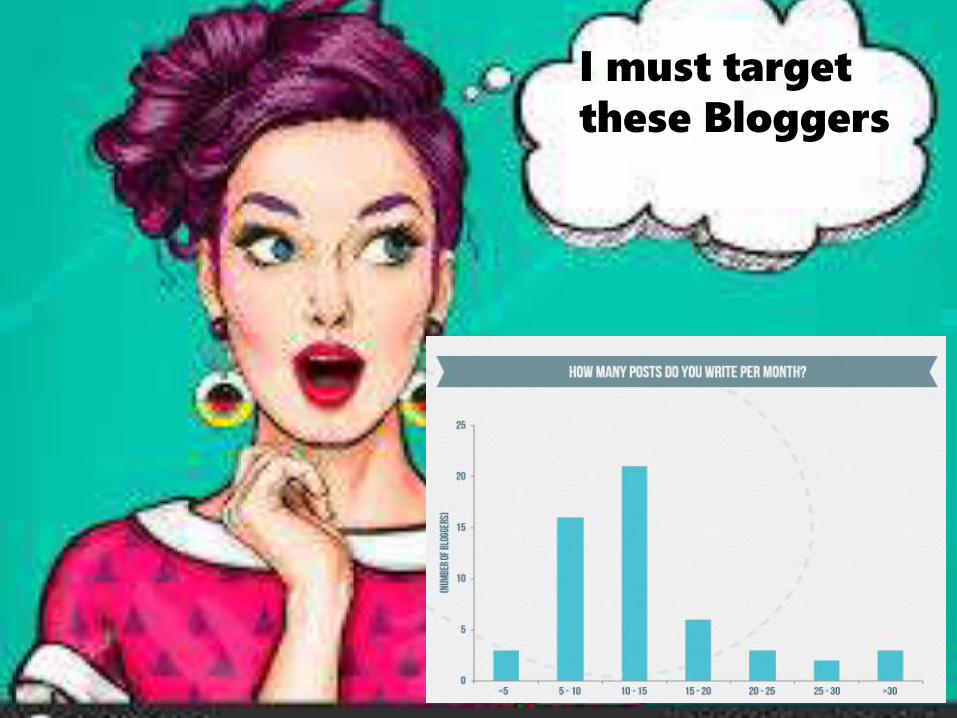
I must target
these Bloggers

Let’s
target
everyone
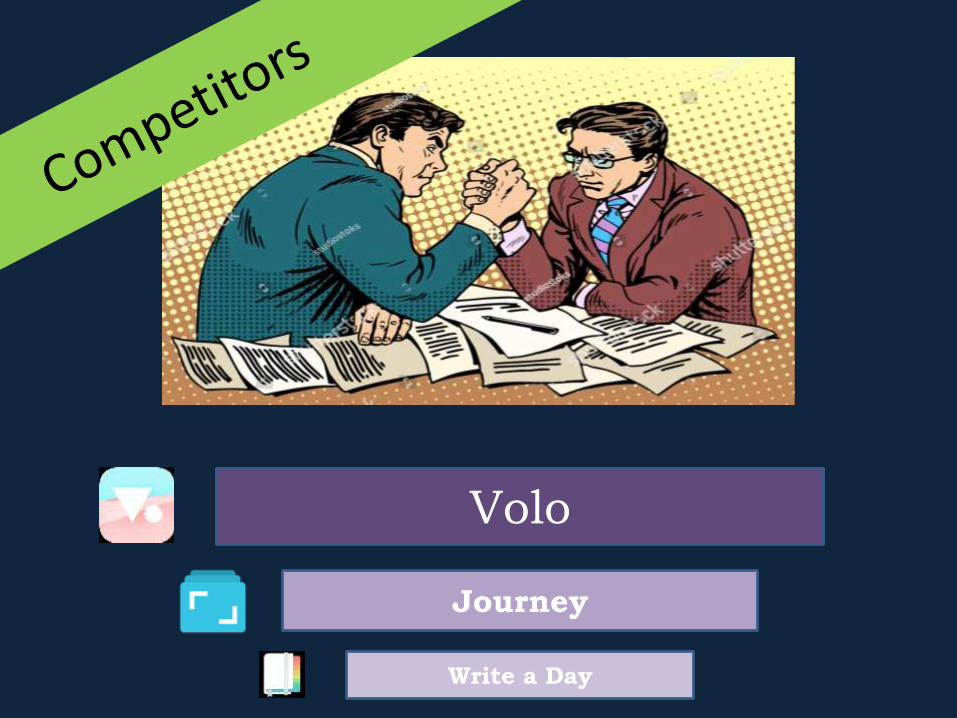
Journey
Write a Day
Volo
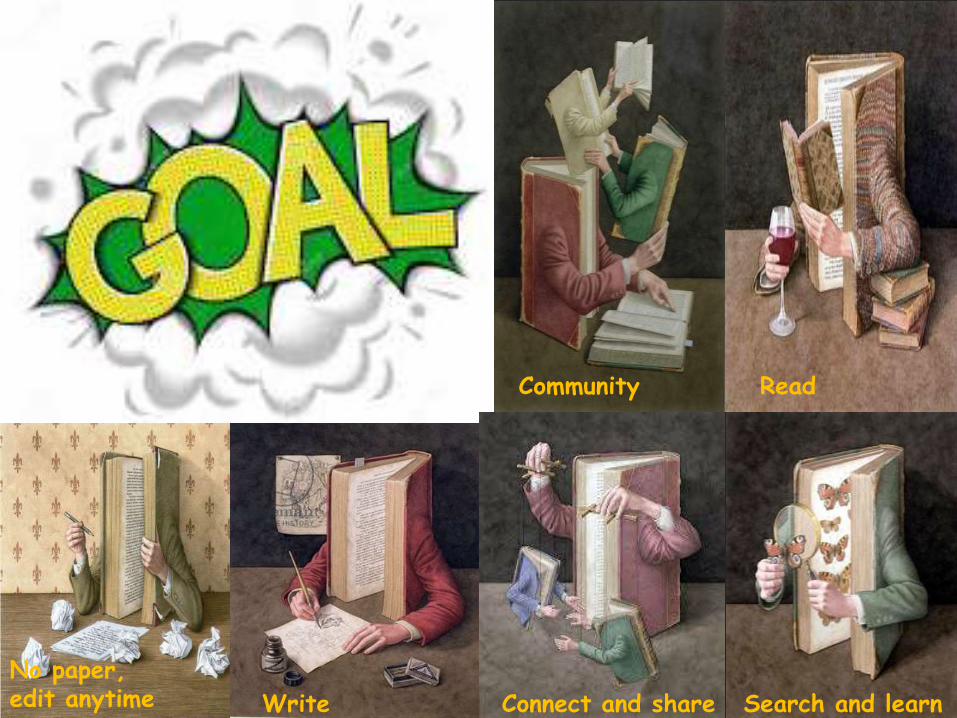
Community Read
No paper, edit anytime Write Connect and share Search and learn

Market GoalsInstant Goal – 30,000 users in 6 months
Intermediate Goal – Rapid customer acquisition and adding new feature within
6 months. Reach to a customer
base 200,000 in 1 year.
Ultimate Goal – More than 6 million
users.

Target
Market
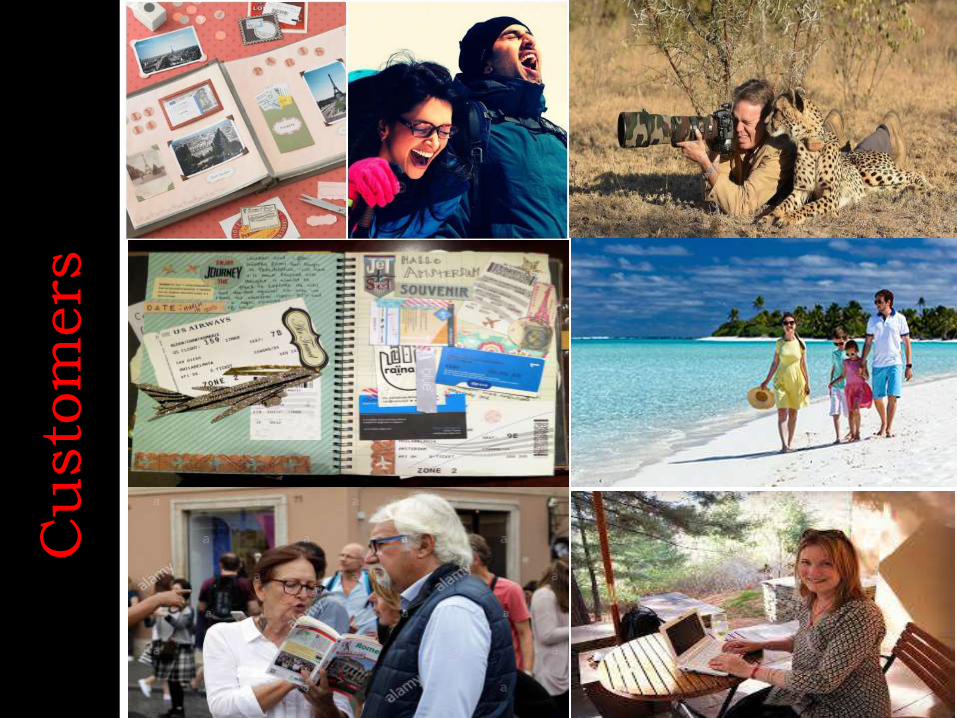
Cu
sto
mers
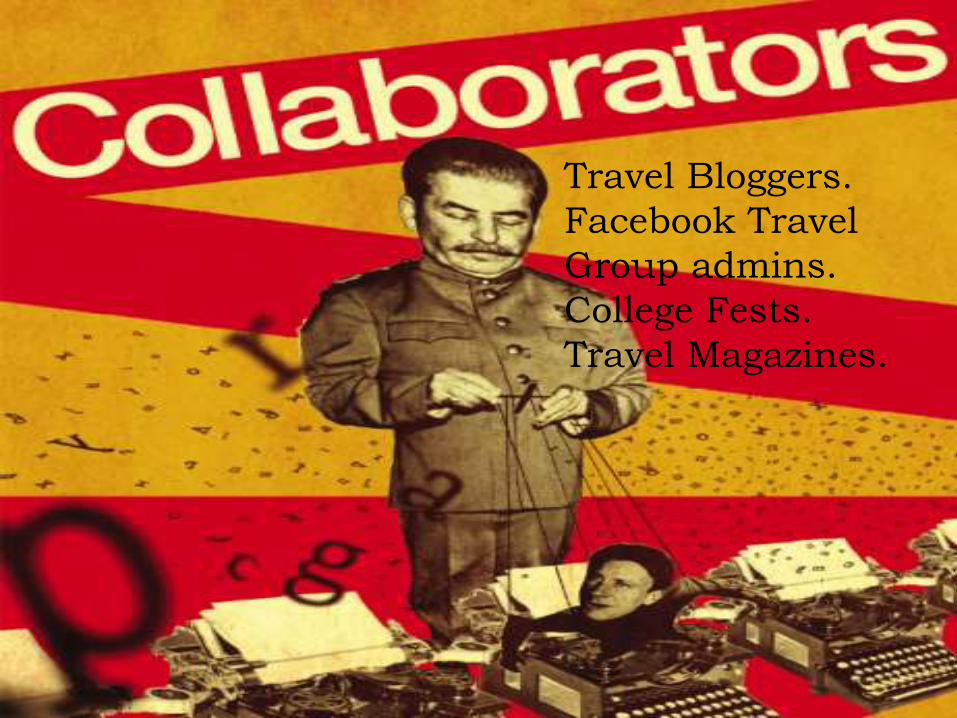
Travel Bloggers.
Facebook Travel
Group admins.
College Fests.
Travel Magazines.

P O P
Journal feel , add photos,
videos, reminder, location,
weather and activity.
Export stories in different
Formats.
Easy Edit.
Throwback
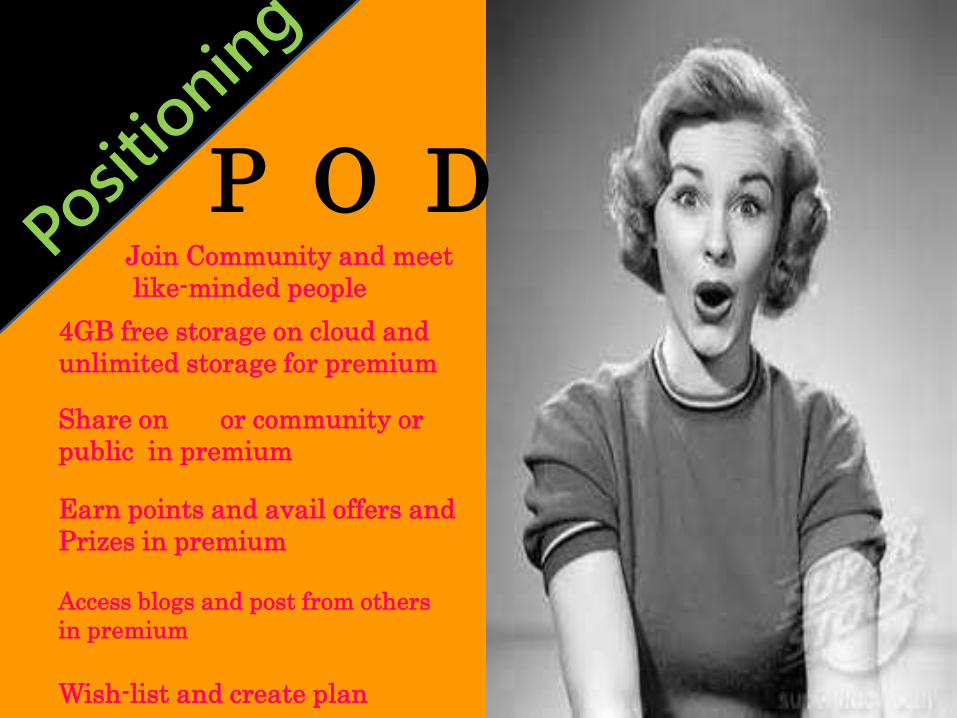
P O DJoin Community and meet
like-minded people
4GB free storage on cloud and
unlimited storage for premium
Share on or community or
public in premium
Access blogs and post from others
in premium
Earn points and avail offers and
Prizes in premium
Wish-list and create plan

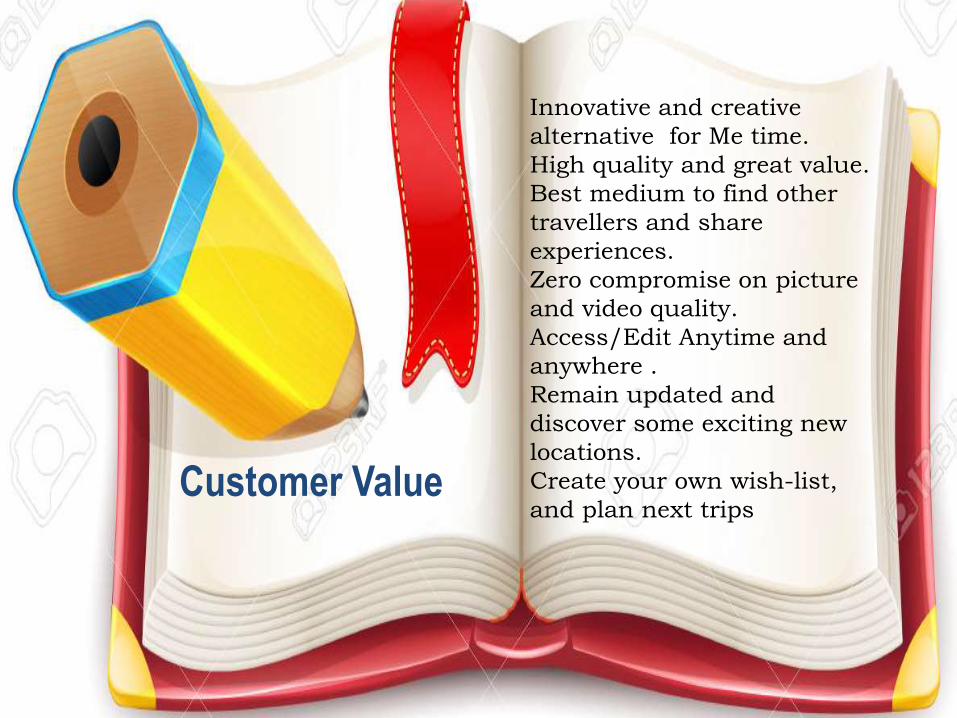
Innovative and creative
alternative for Me time.
High quality and great value.
Best medium to find other
travellers and share
experiences.
Zero compromise on picture
and video quality.
Access/Edit Anytime and
anywhere .
Remain updated and
discover some exciting new
locations.
Create your own wish-list,
and plan next tripsCustomer Value
Collaborator
Value
Opportunity to be
engaged with
like-minded organizations
/communities.
New perspectives on any
issue, idea generation
space and support any
initiatives.
Special blogs.
Offers and discounts.
New Updates.

Company Value
Innovation and creativity
Constant engagement with
customers leading to better
understanding of needs.
Effective CRM tools.
Flat hierarchy to get as
many ideas from the
whole team .
Excellent relationship
between company and
employees, employee and
customer, and company
and customers.
Achieving the targets set and
pushing the benchmark with
constant efforts to deliver the
best.

Tactics
Logo
Tagline:Let’s Travel
with Words
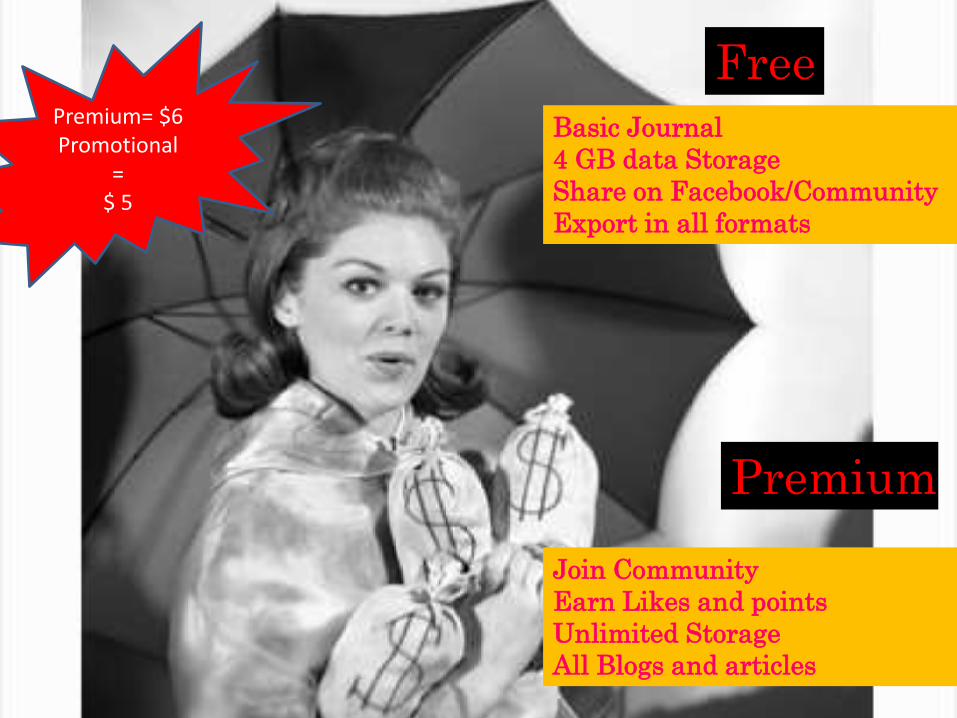
Free
Basic Journal
4 GB data Storage
Share on Facebook/Community
Export in all formats
Join Community
Earn Likes and points
Unlimited Storage
All Blogs and articles
Premium
Premium= $6Promotional
=$ 5

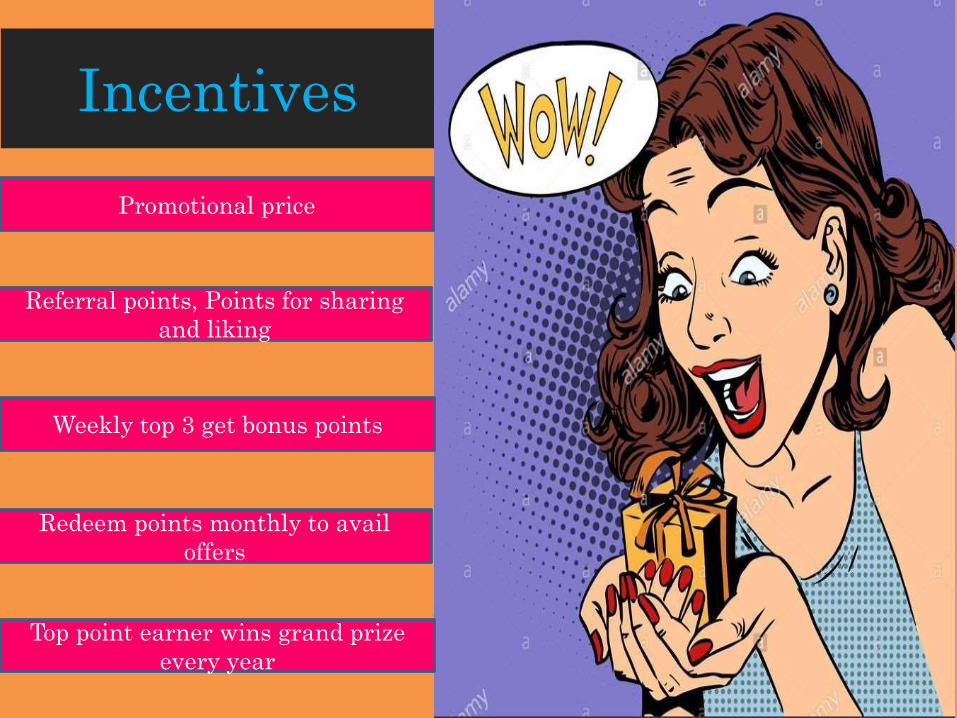
Incentives
Promotional price
Referral points, Points for sharing
and liking
Weekly top 3 get bonus points
Redeem points monthly to avail
offers
Top point earner wins grand prize
every year

Incentives for Collaborators
Special Blogs
Offers
Market information
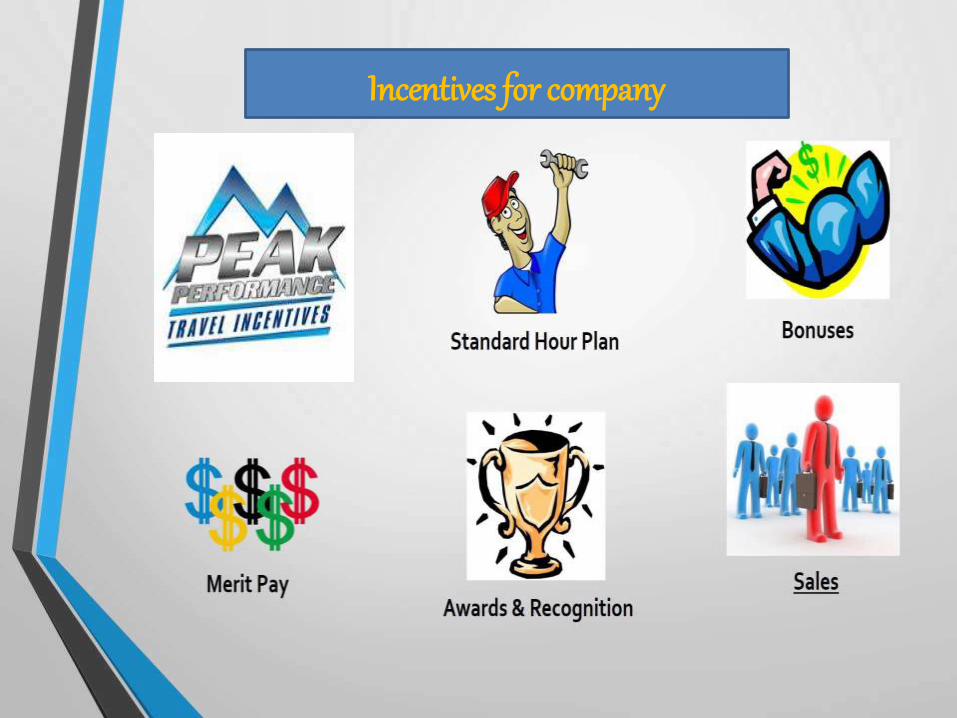
Incentives for company


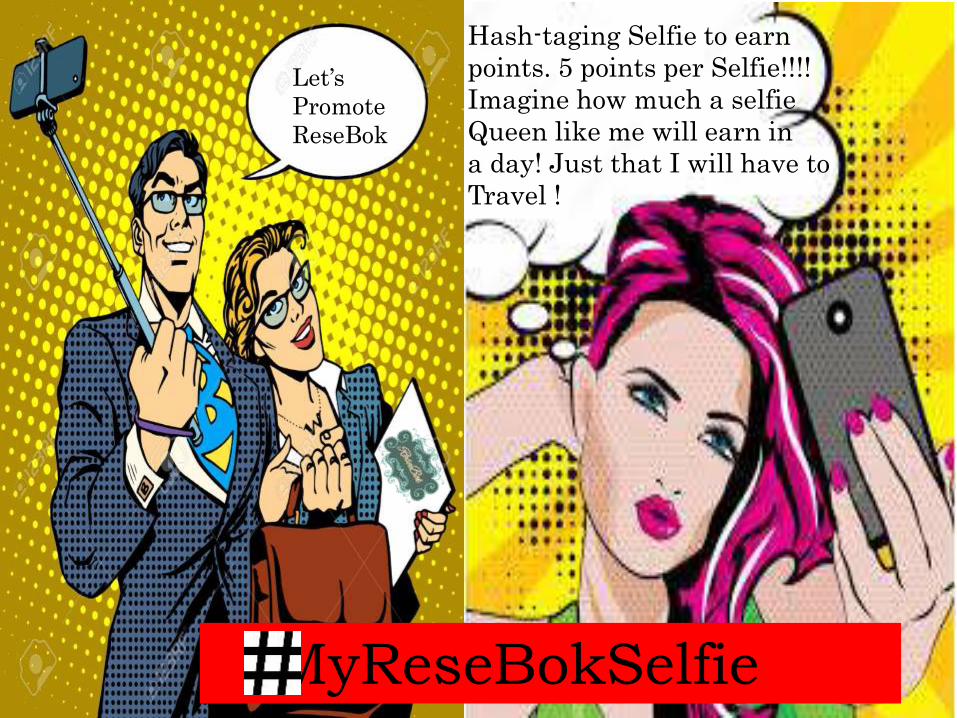
Let’s
Promote
ReseBok
Hash-taging Selfie to earn
points. 5 points per Selfie!!!!
Imagine how much a selfie
Queen like me will earn in
a day! Just that I will have to
Travel !
MyReseBokSelfie

More
Promotion
Technique
s
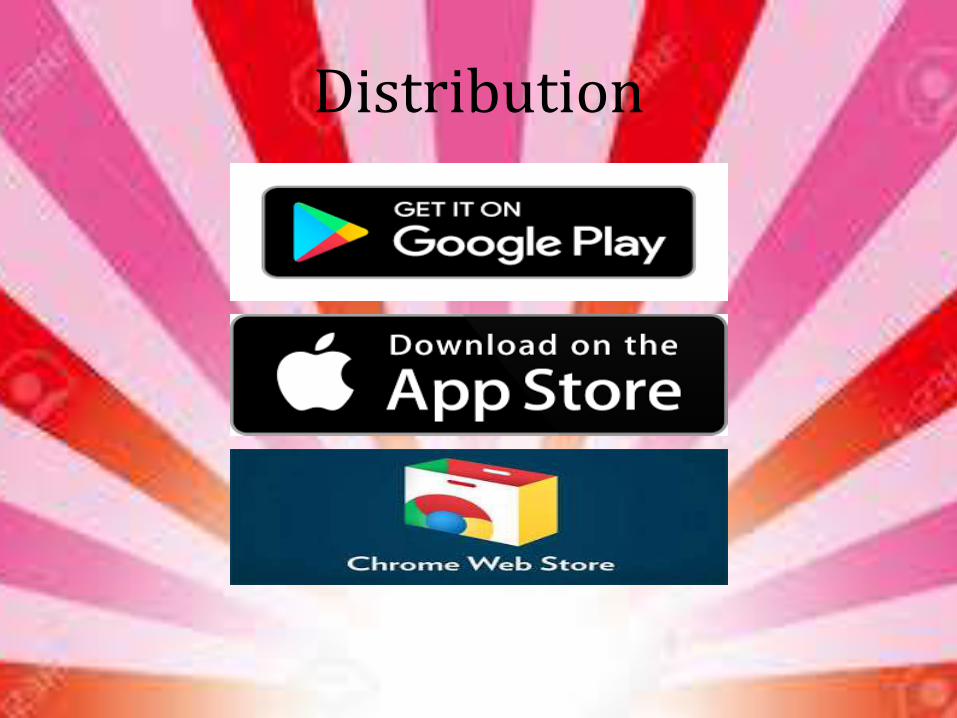
Distribution
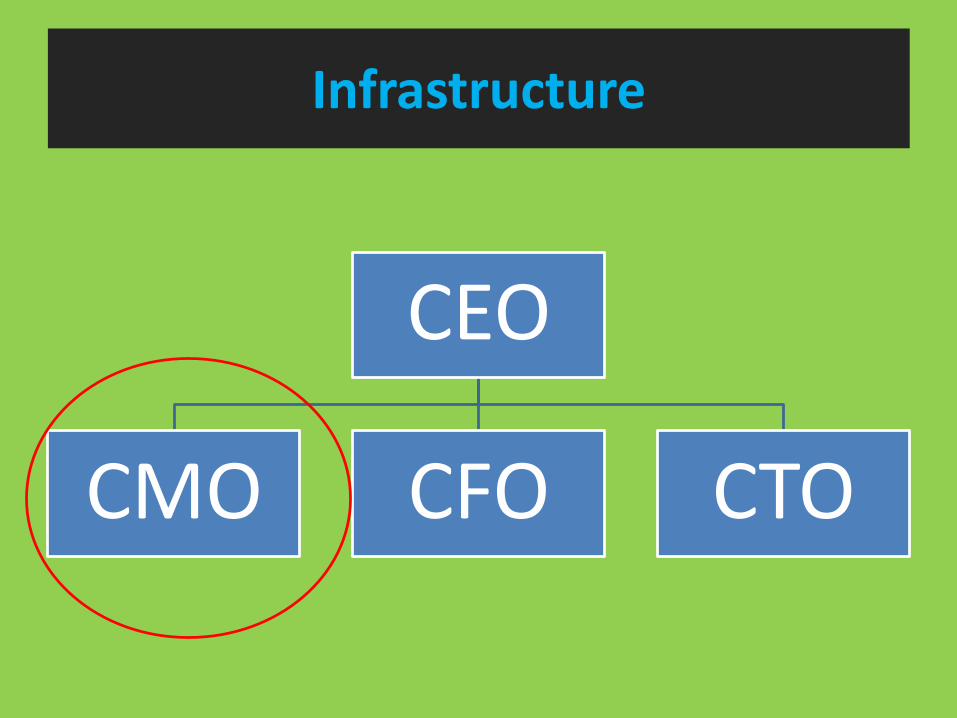
Infrastructure
CEO
CMO CFO CTO
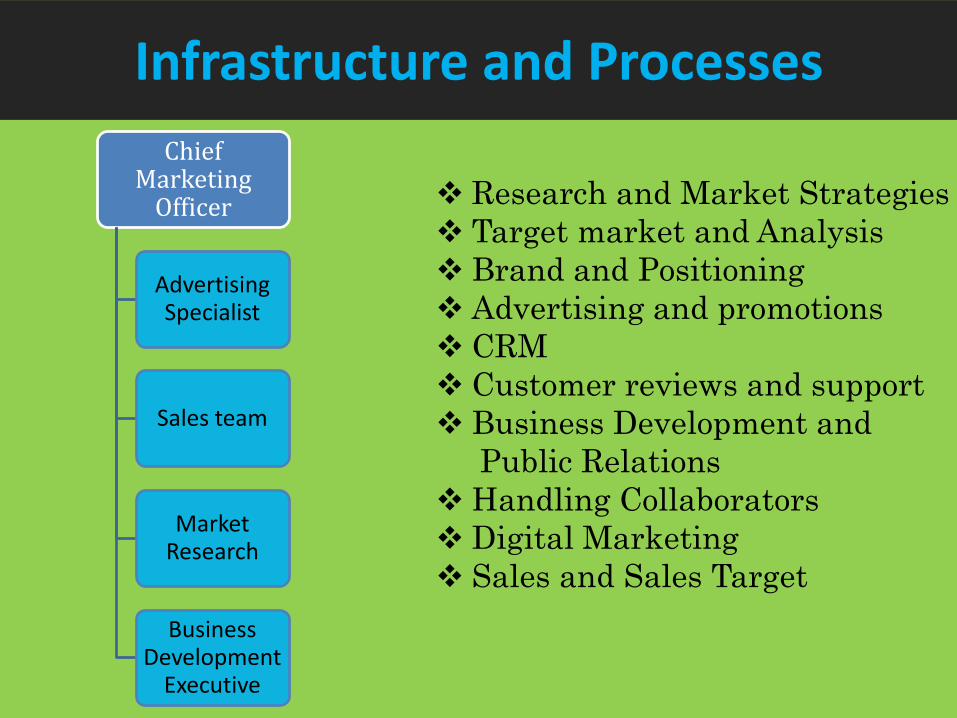
Chief Marketing
Officer
Advertising Specialist
Sales team
Market Research
Business Development
Executive
Infrastructure and Processes
Research and Market Strategies
Target market and Analysis
Brand and Positioning
Advertising and promotions
CRM
Customer reviews and support
Business Development and
Public Relations
Handling Collaborators
Digital Marketing
Sales and Sales Target
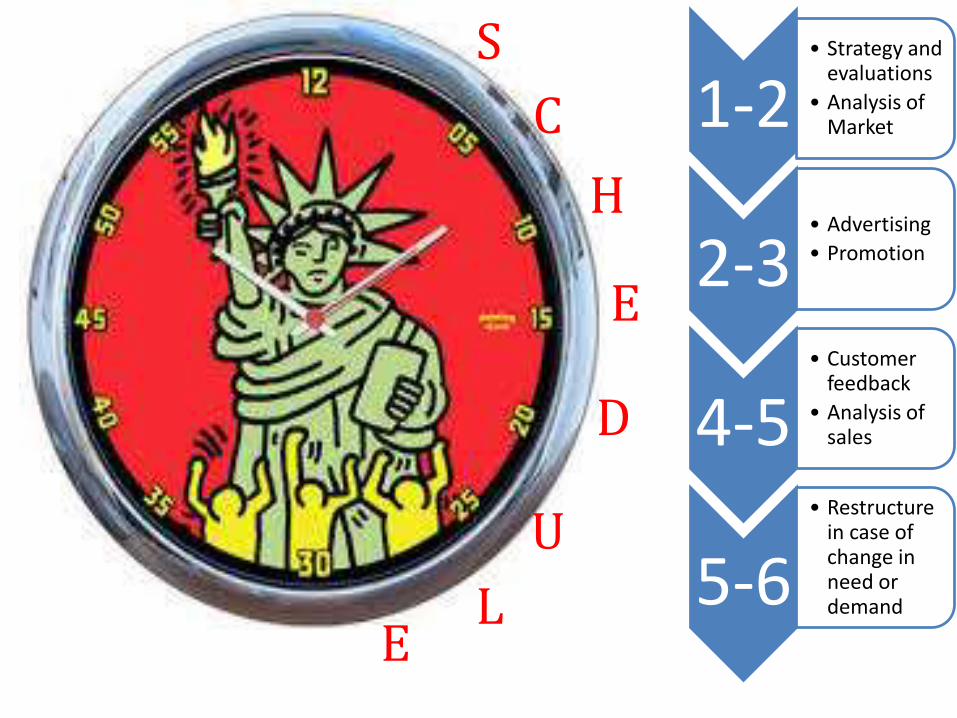
S
H
E
D
C
U
LE
1-2• Strategy and
evaluations
• Analysis of Market
2-3• Advertising
• Promotion
4-5• Customer
feedback
• Analysis of sales
5-6• Restructure
in case of change in need or demand


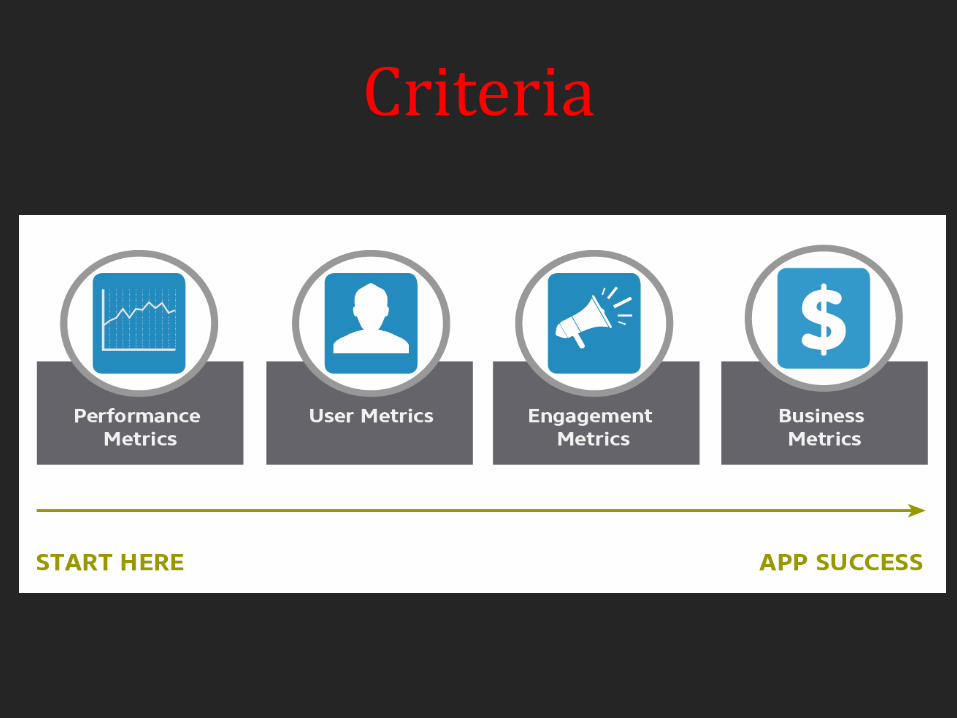
Criteria

Performance metrics
App crashes
API Latency
End-to-End Application Latency
App load per period
Network errors
App load per period
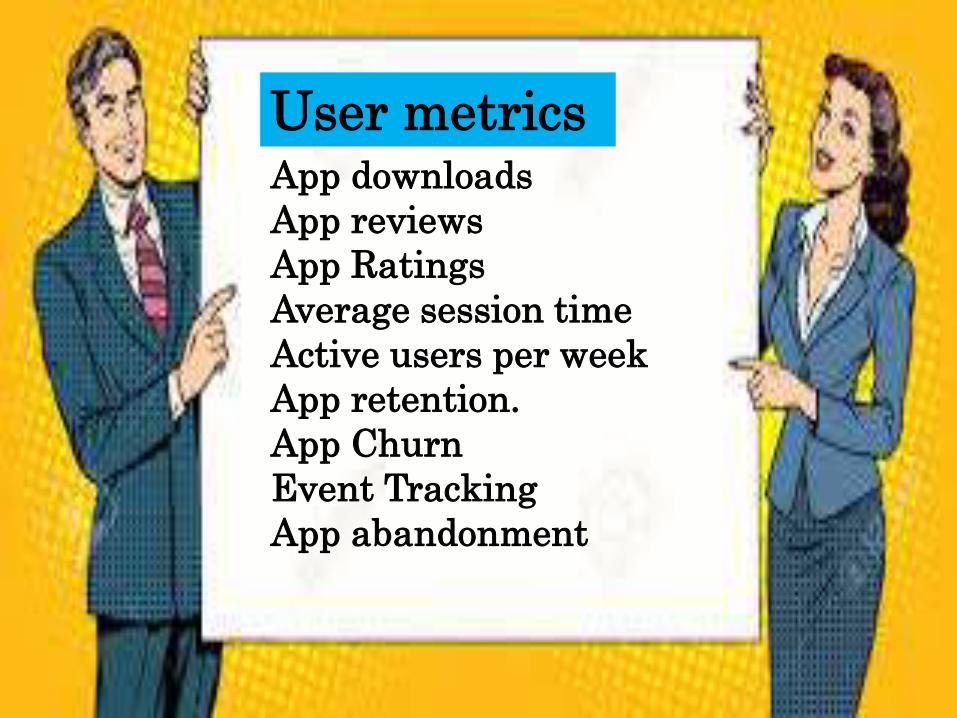
User metricsApp downloads
App reviews
App Ratings
Average session time
Active users per week
App retention.
App Churn
Event Tracking
App abandonment
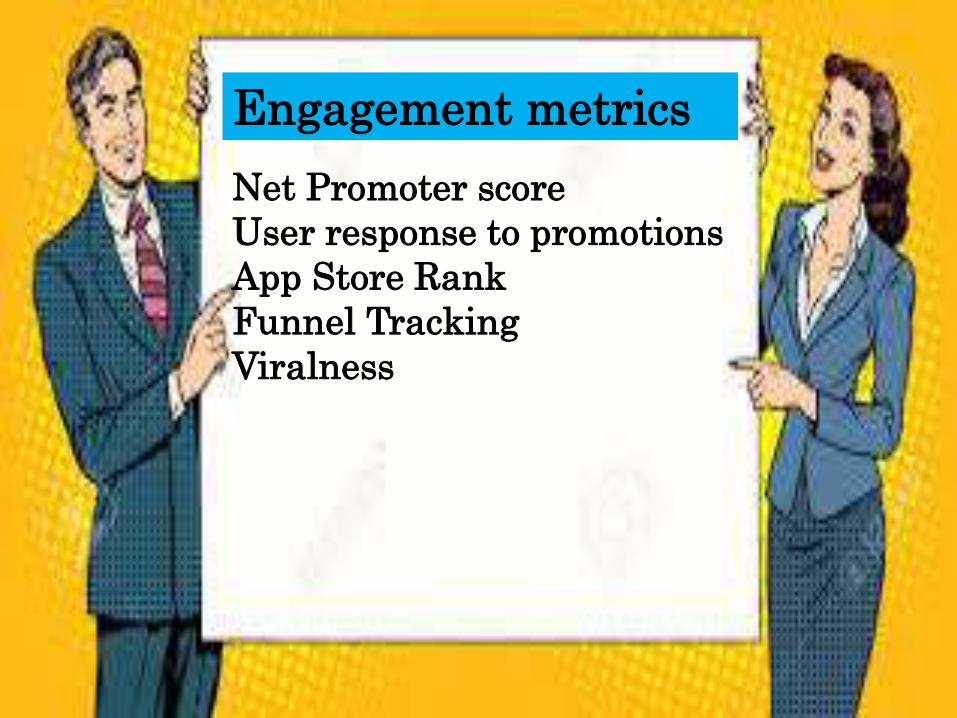
Engagement metrics
Net Promoter score
User response to promotions
App Store Rank
Funnel Tracking
Viralness
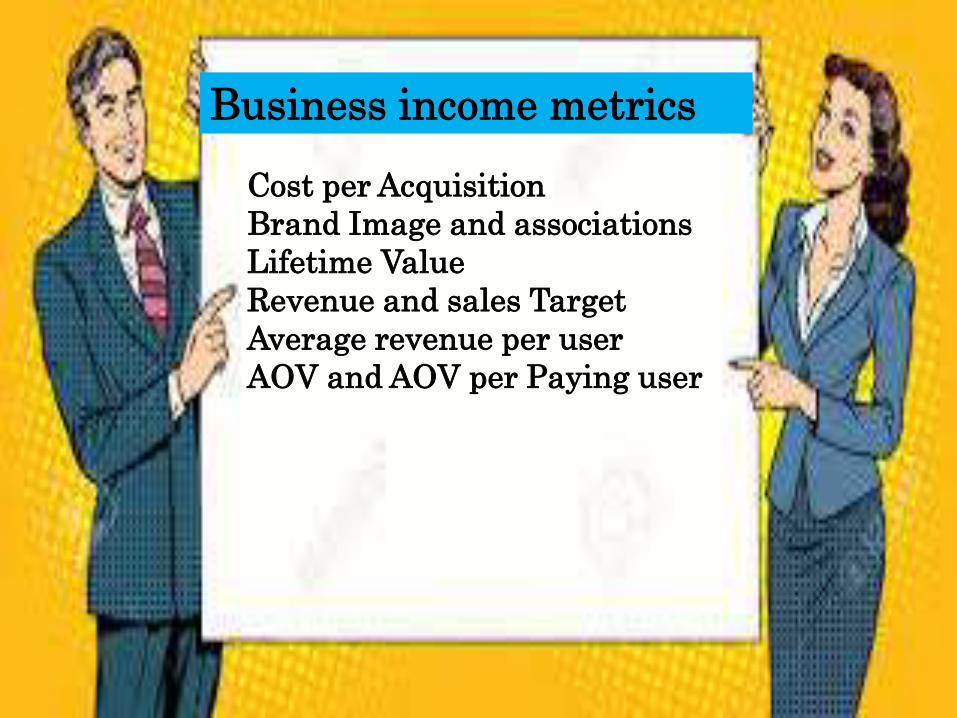
Business income metrics
Cost per Acquisition
Brand Image and associations
Lifetime Value
Revenue and sales Target
Average revenue per user
AOV and AOV per Paying user

To be explained with Exibits
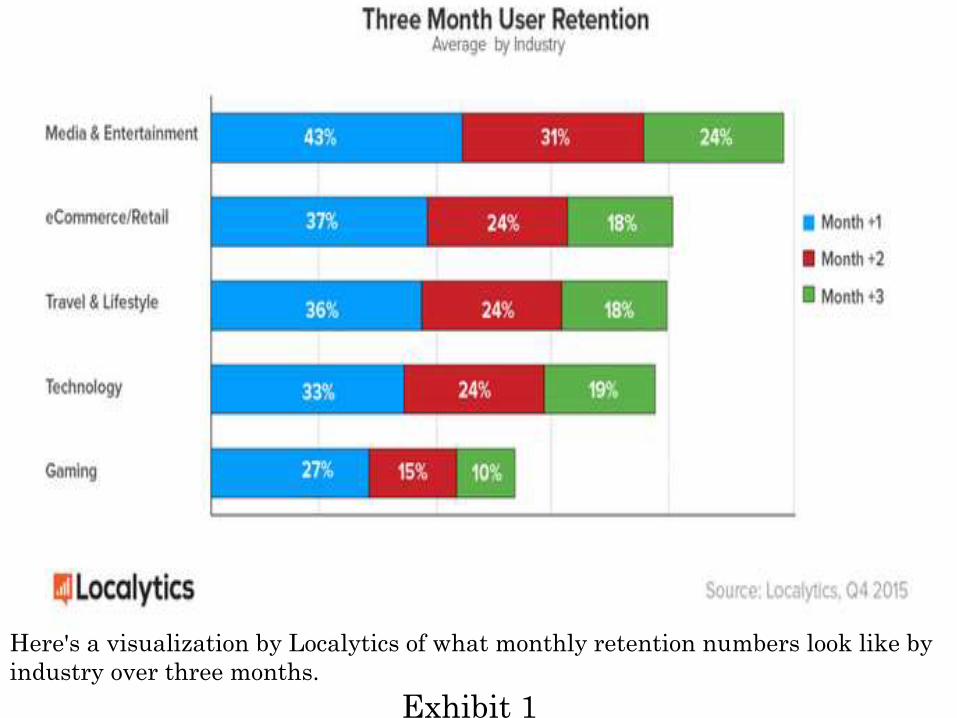
Exhibit 1
Here's a visualization by Localytics of what monthly retention numbers look like by
industry over three months.
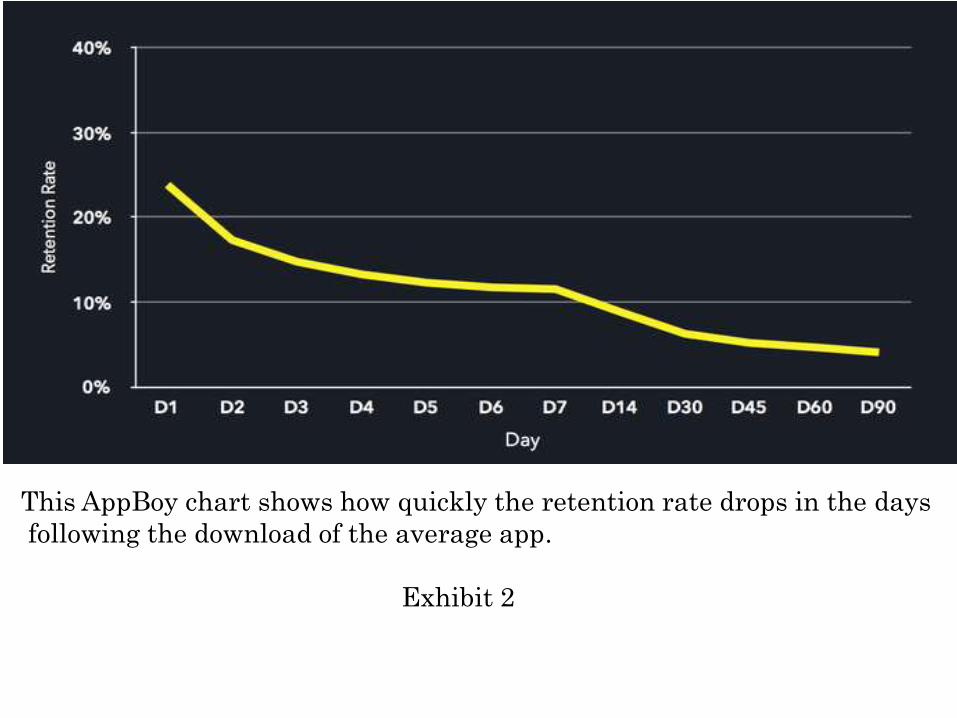
This AppBoy chart shows how quickly the retention rate drops in the days
following the download of the average app.
Exhibit 2
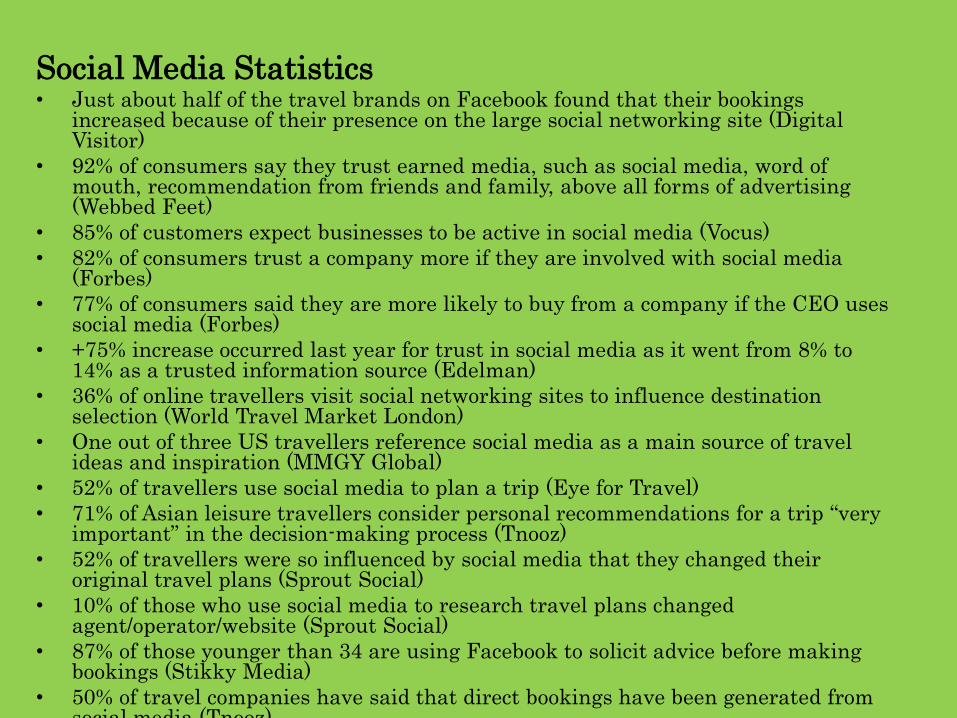
Social Media Statistics• Just about half of the travel brands on Facebook found that their bookings
increased because of their presence on the large social networking site (Digital Visitor)
• 92% of consumers say they trust earned media, such as social media, word of mouth, recommendation from friends and family, above all forms of advertising (Webbed Feet)
• 85% of customers expect businesses to be active in social media (Vocus)
• 82% of consumers trust a company more if they are involved with social media (Forbes)
• 77% of consumers said they are more likely to buy from a company if the CEO uses social media (Forbes)
• +75% increase occurred last year for trust in social media as it went from 8% to 14% as a trusted information source (Edelman)
• 36% of online travellers visit social networking sites to influence destination selection (World Travel Market London)
• One out of three US travellers reference social media as a main source of travel ideas and inspiration (MMGY Global)
• 52% of travellers use social media to plan a trip (Eye for Travel)
• 71% of Asian leisure travellers consider personal recommendations for a trip “very important” in the decision-making process (Tnooz)
• 52% of travellers were so influenced by social media that they changed their original travel plans (Sprout Social)
• 10% of those who use social media to research travel plans changed agent/operator/website (Sprout Social)
• 87% of those younger than 34 are using Facebook to solicit advice before making bookings (Stikky Media)
• 50% of travel companies have said that direct bookings have been generated from social media (Tnooz)
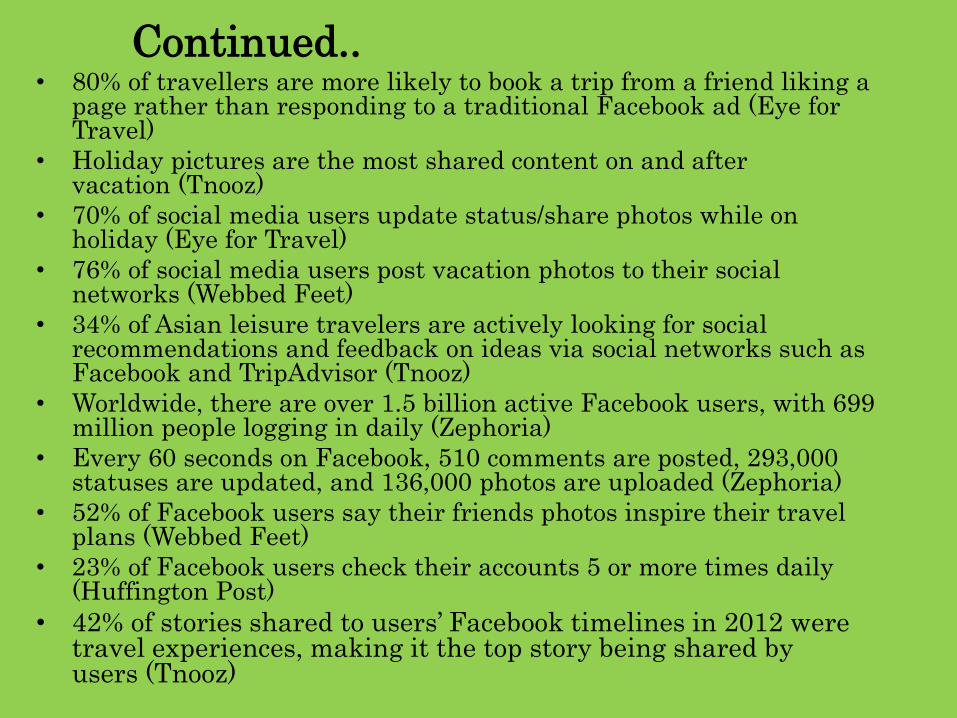
Continued..• 80% of travellers are more likely to book a trip from a friend liking a
page rather than responding to a traditional Facebook ad (Eye for Travel)
• Holiday pictures are the most shared content on and after vacation (Tnooz)
• 70% of social media users update status/share photos while on holiday (Eye for Travel)
• 76% of social media users post vacation photos to their social networks (Webbed Feet)
• 34% of Asian leisure travelers are actively looking for social recommendations and feedback on ideas via social networks such as Facebook and TripAdvisor (Tnooz)
• Worldwide, there are over 1.5 billion active Facebook users, with 699 million people logging in daily (Zephoria)
• Every 60 seconds on Facebook, 510 comments are posted, 293,000 statuses are updated, and 136,000 photos are uploaded (Zephoria)
• 52% of Facebook users say their friends photos inspire their travel plans (Webbed Feet)
• 23% of Facebook users check their accounts 5 or more times daily (Huffington Post)
• 42% of stories shared to users’ Facebook timelines in 2012 were travel experiences, making it the top story being shared by users (Tnooz)
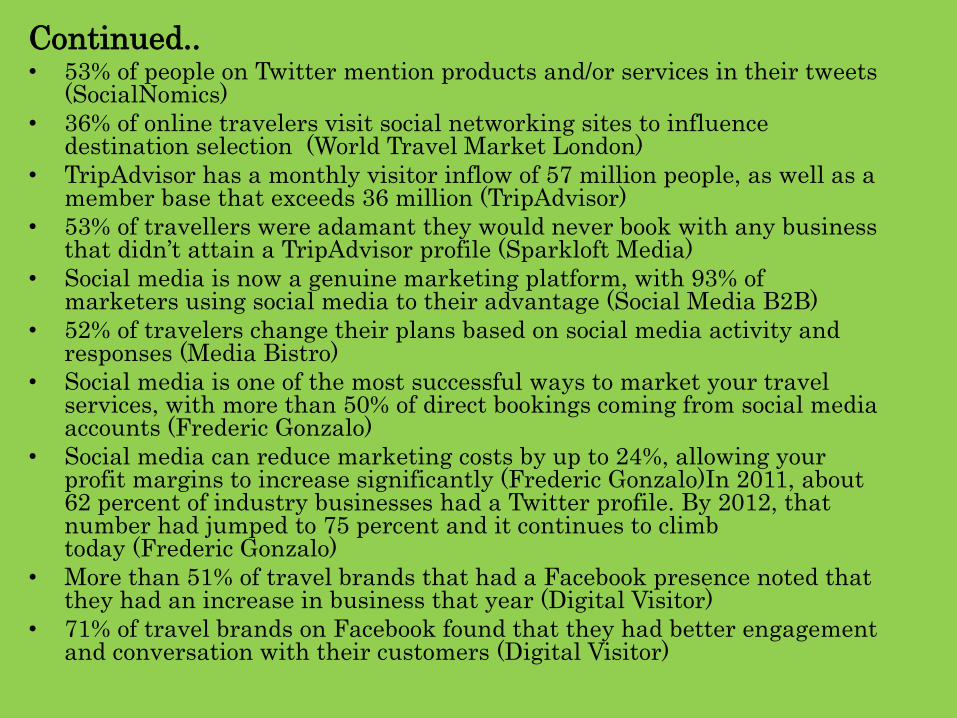
Continued..• 53% of people on Twitter mention products and/or services in their tweets
(SocialNomics)
• 36% of online travelers visit social networking sites to influence destination selection (World Travel Market London)
• TripAdvisor has a monthly visitor inflow of 57 million people, as well as a member base that exceeds 36 million (TripAdvisor)
• 53% of travellers were adamant they would never book with any business that didn’t attain a TripAdvisor profile (Sparkloft Media)
• Social media is now a genuine marketing platform, with 93% of marketers using social media to their advantage (Social Media B2B)
• 52% of travelers change their plans based on social media activity and responses (Media Bistro)
• Social media is one of the most successful ways to market your travel services, with more than 50% of direct bookings coming from social media accounts (Frederic Gonzalo)
• Social media can reduce marketing costs by up to 24%, allowing your profit margins to increase significantly (Frederic Gonzalo)In 2011, about 62 percent of industry businesses had a Twitter profile. By 2012, that number had jumped to 75 percent and it continues to climb today (Frederic Gonzalo)
• More than 51% of travel brands that had a Facebook presence noted that they had an increase in business that year (Digital Visitor)
• 71% of travel brands on Facebook found that they had better engagement and conversation with their customers (Digital Visitor)
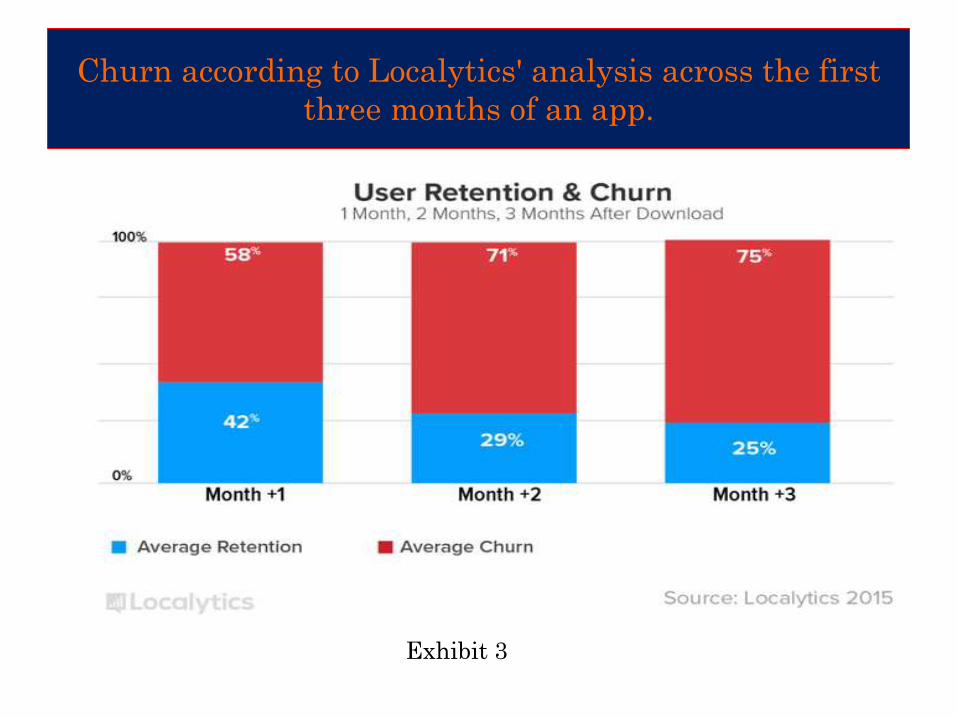
Churn according to Localytics' analysis across the first
three months of an app.
Exhibit 3
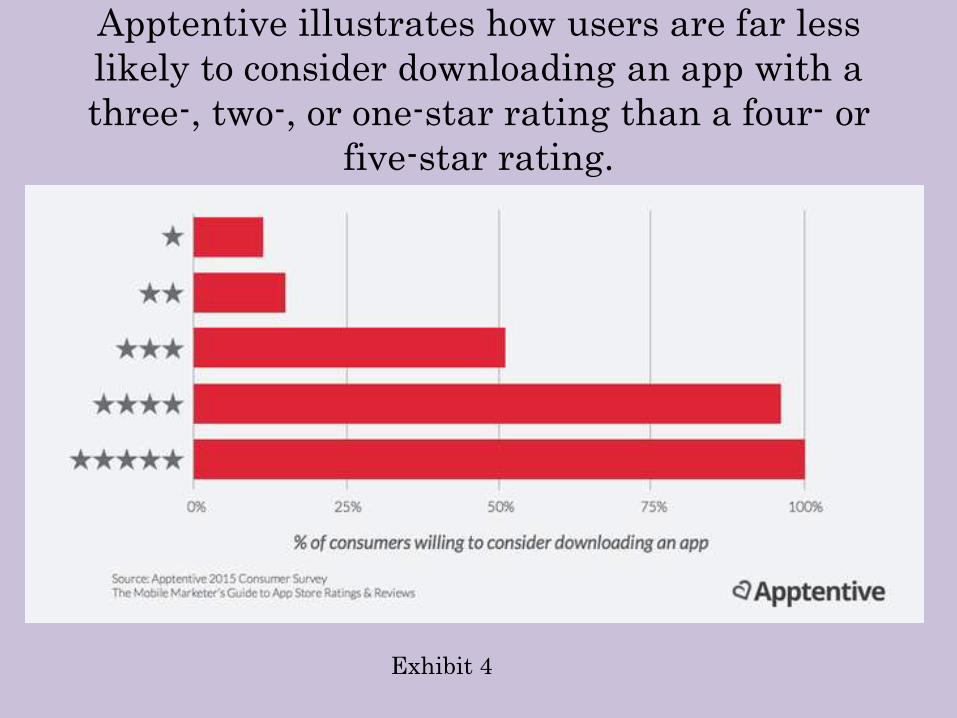
Apptentive illustrates how users are far less
likely to consider downloading an app with a
three-, two-, or one-star rating than a four- or
five-star rating.
Exhibit 4
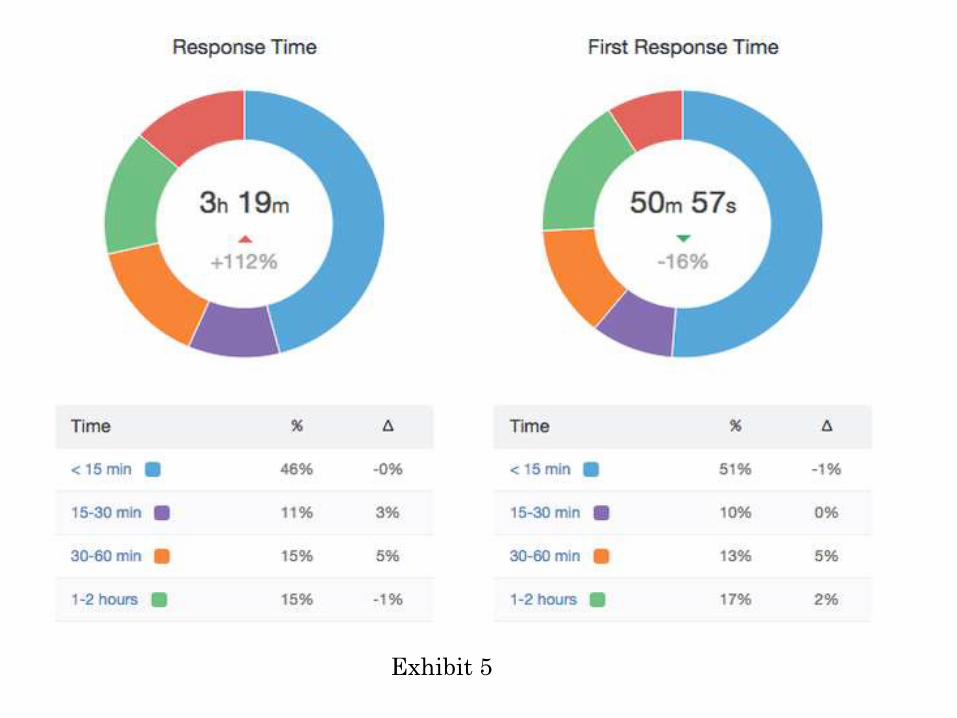
Exhibit 5
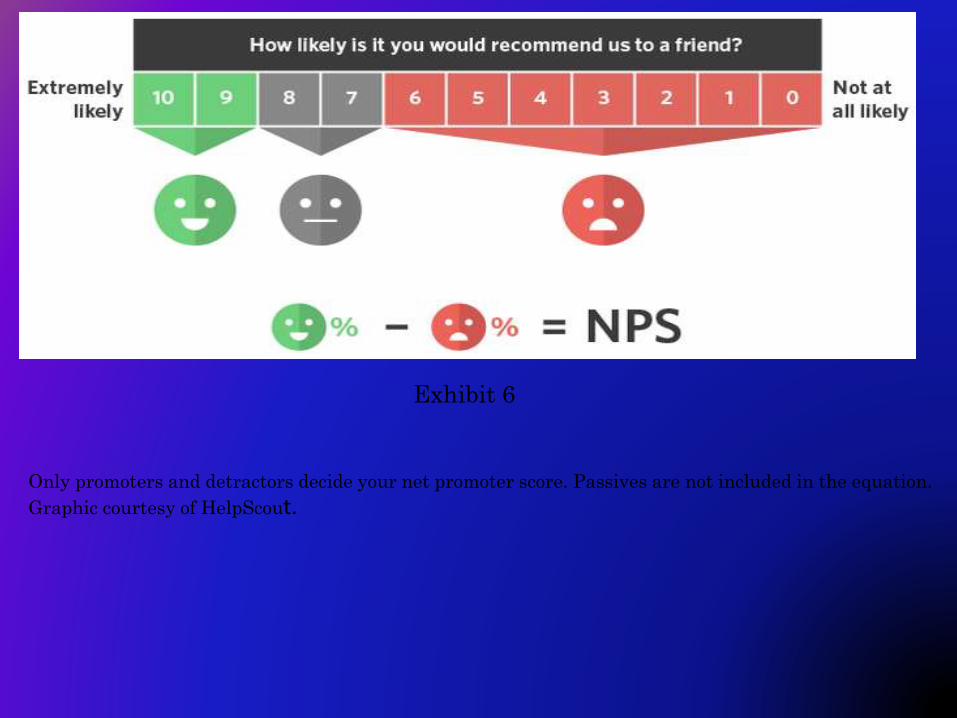
Exhibit 6
Only promoters and detractors decide your net promoter score. Passives are not included in the equation.
Graphic courtesy of HelpScout.
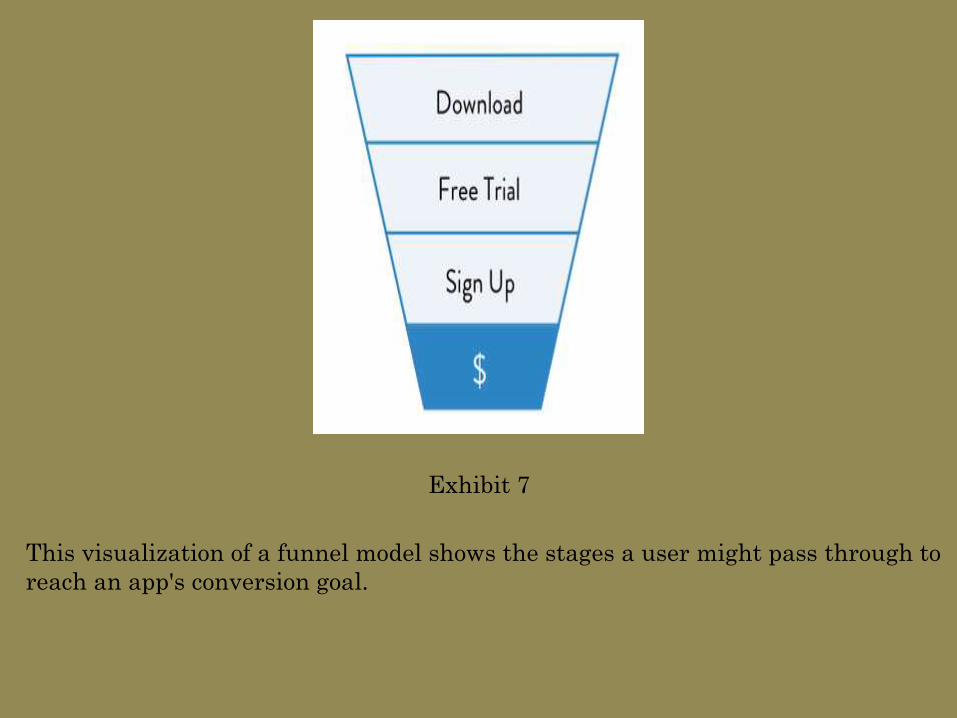
This visualization of a funnel model shows the stages a user might pass through to
reach an app's conversion goal.
Exhibit 7
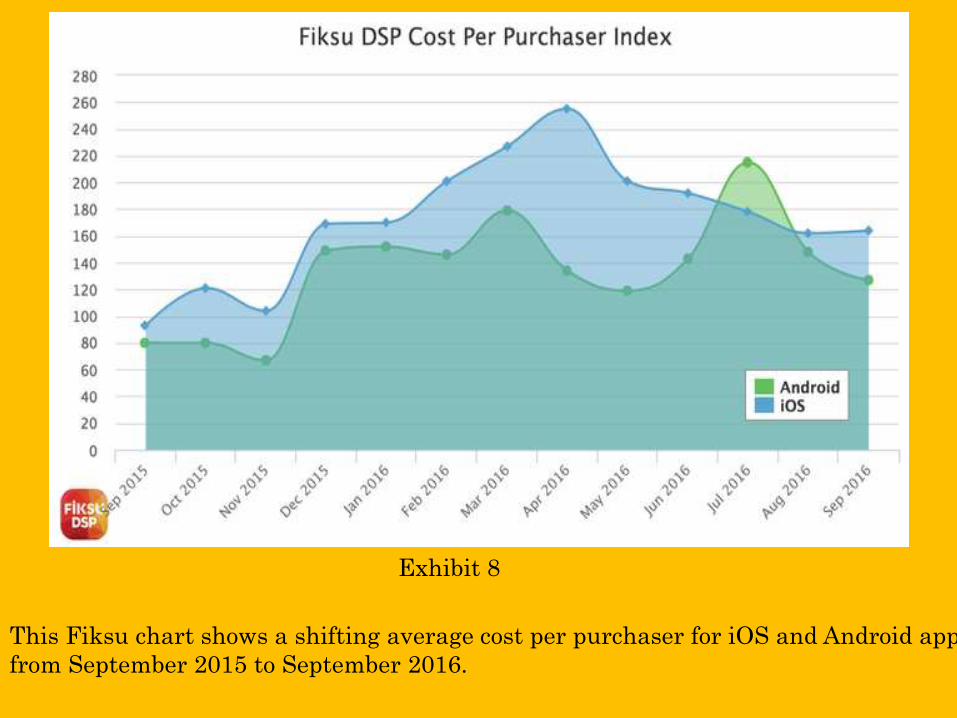
Exhibit 8
This Fiksu chart shows a shifting average cost per purchaser for iOS and Android apps
from September 2015 to September 2016.
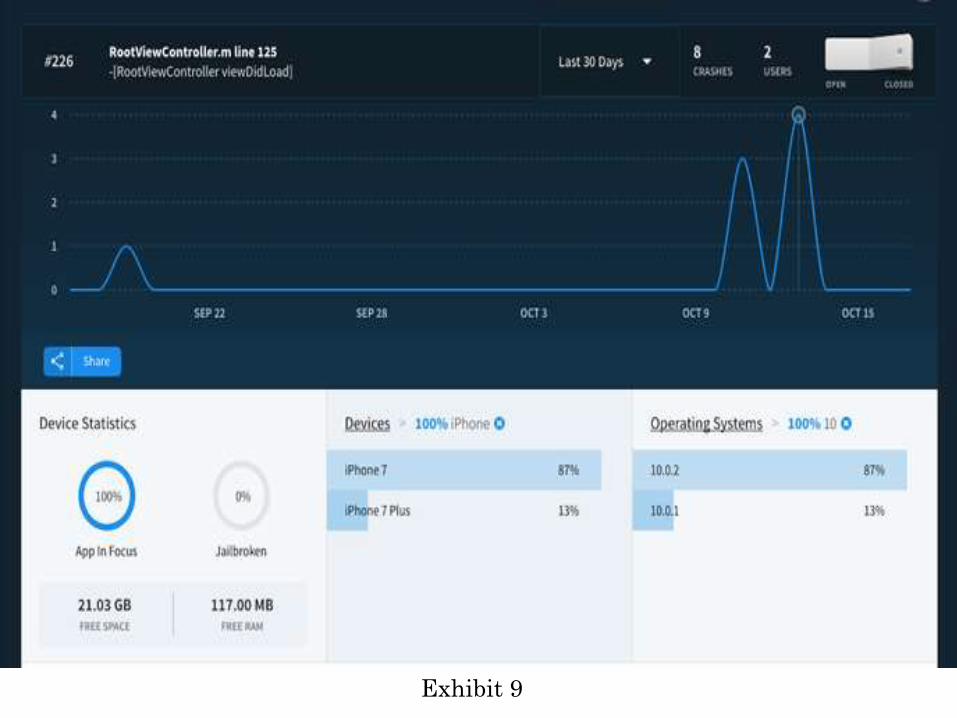
Exhibit 9
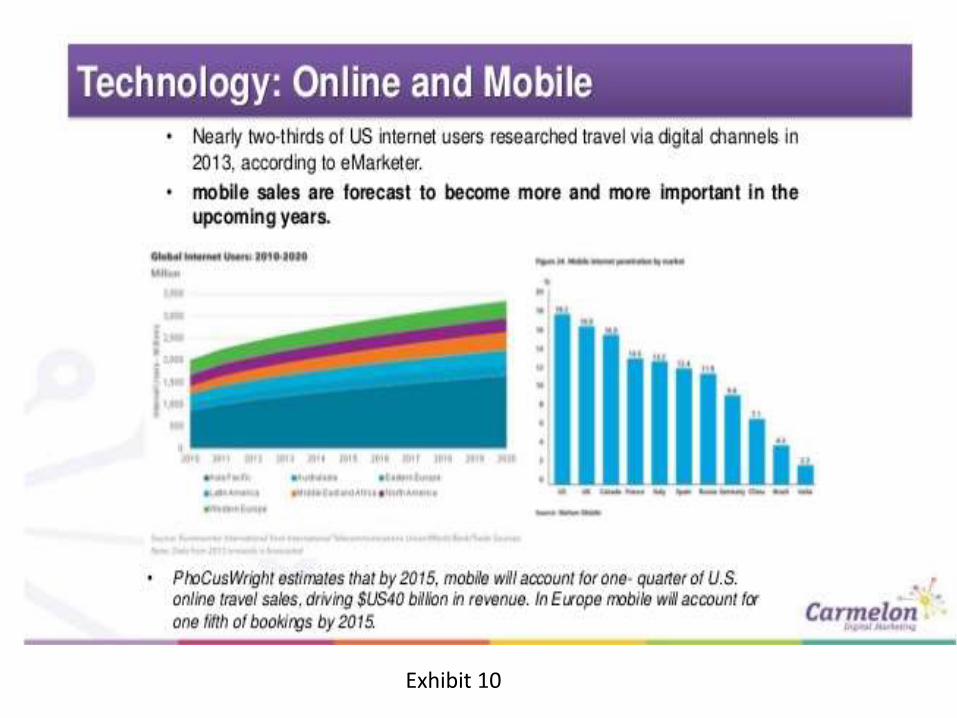
Exhibit 10
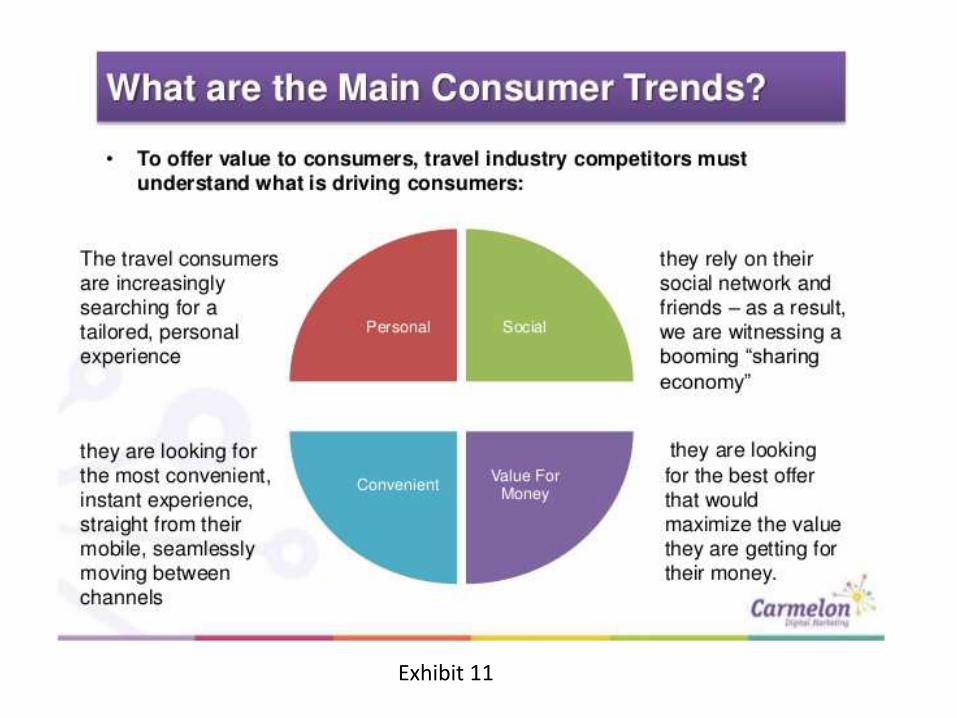
Exhibit 11
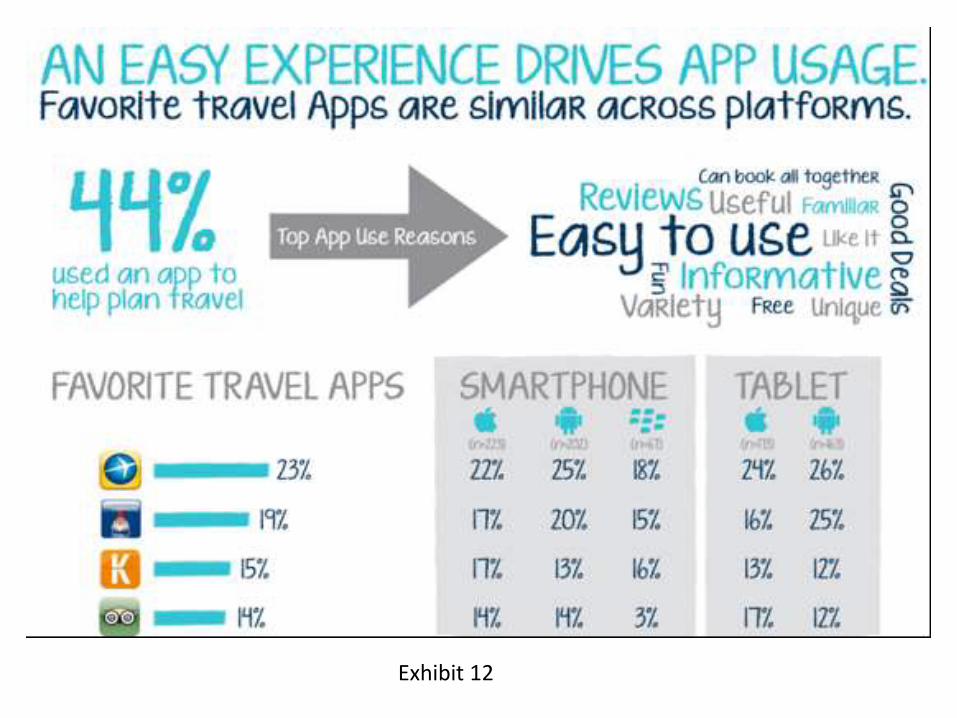
Exhibit 12
Exhibit 13
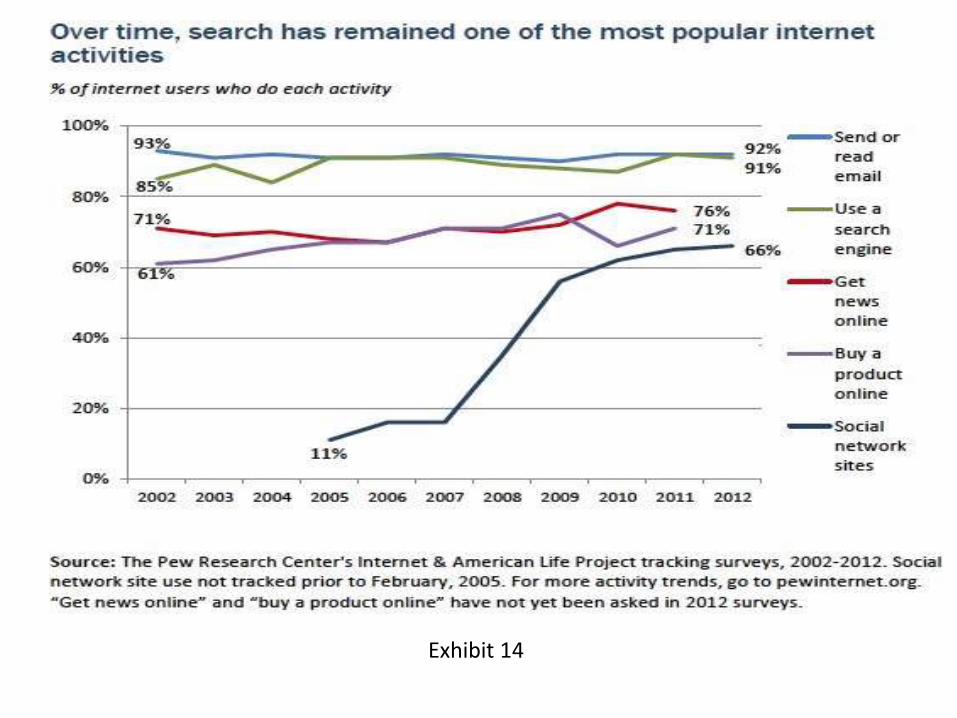
Exhibit 14
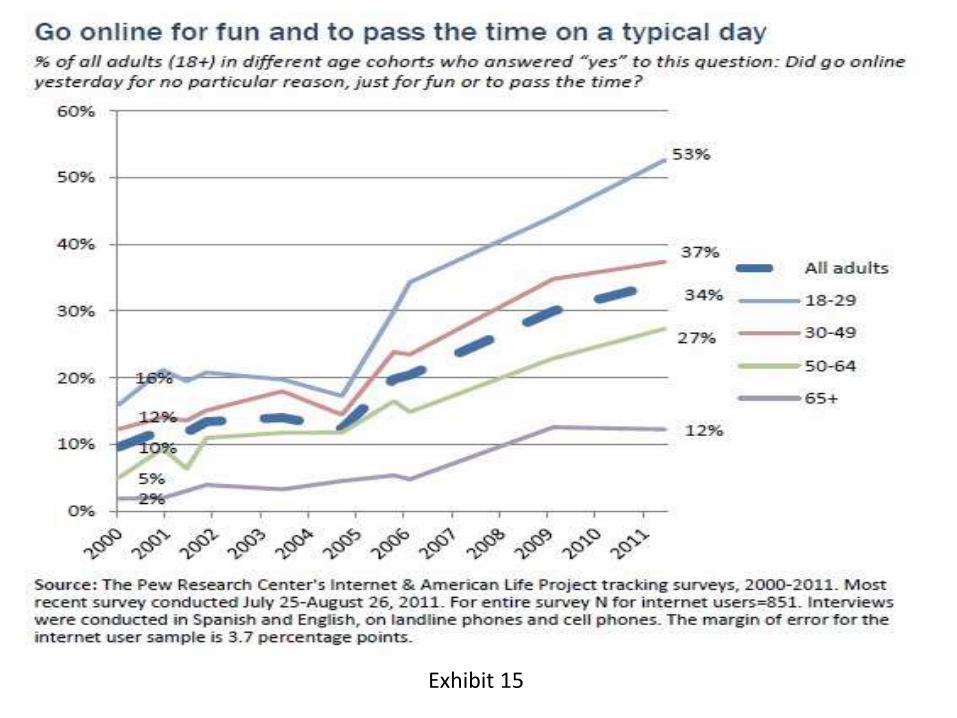
Exhibit 15
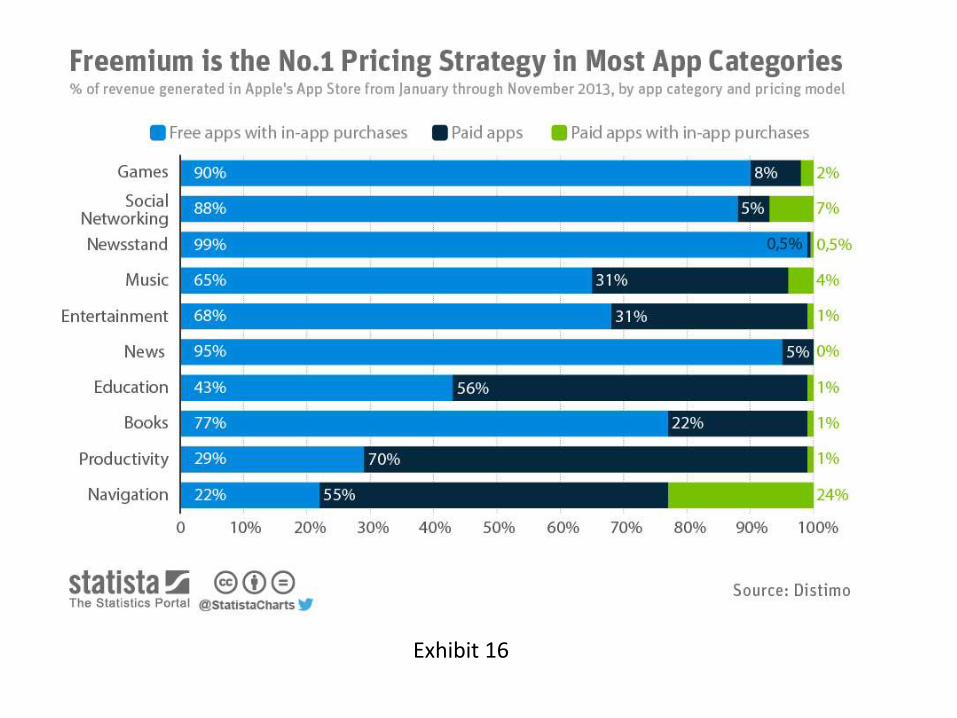
Exhibit 16
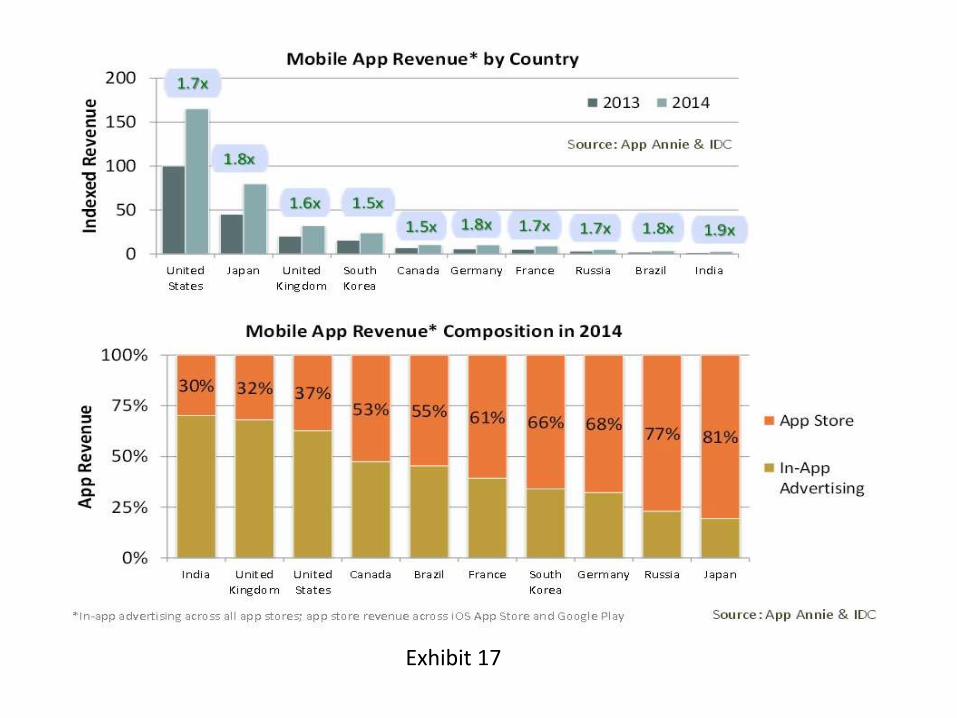
Exhibit 17

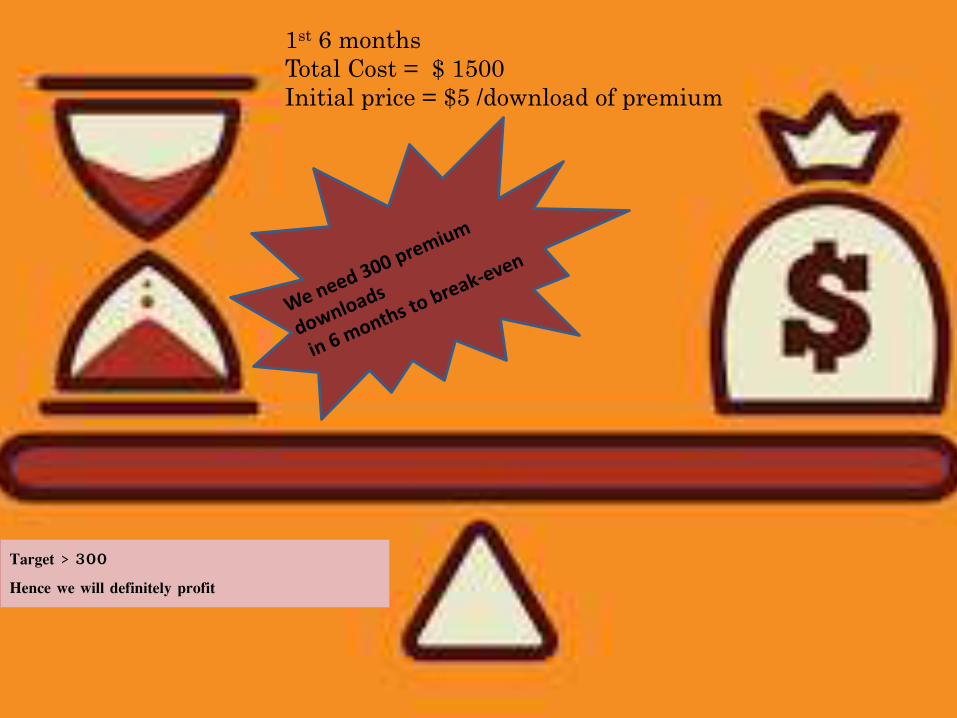
1st 6 months
Total Cost = $ 1500
Initial price = $5 /download of premium
Target > 300
Hence we will definitely profit
Credits
• https://www.marketingbinder.com/developing-the-optimal-value-proposition-that-drives-market-success/
• https://www.trekksoft.com/en/blog/travel-tourism-stats-2016
• https://www.gartner.com/doc/483308/define-collaboration-strategy-drives-business
• https://blog.appdynamics.com/product/16-metrics-to-ensure-mobile-app-success-part-1-performance-metrics/
• https://savvyapps.com/blog/mobile-app-analytics• https://www.rezdy.com/resource/travel-statistics-for-
tour-operators/
Recap
• Executive Summary
• Situation Analysis
• Goal
• Strategy
• Tactics
• Implementation
• Control
• Exhibits

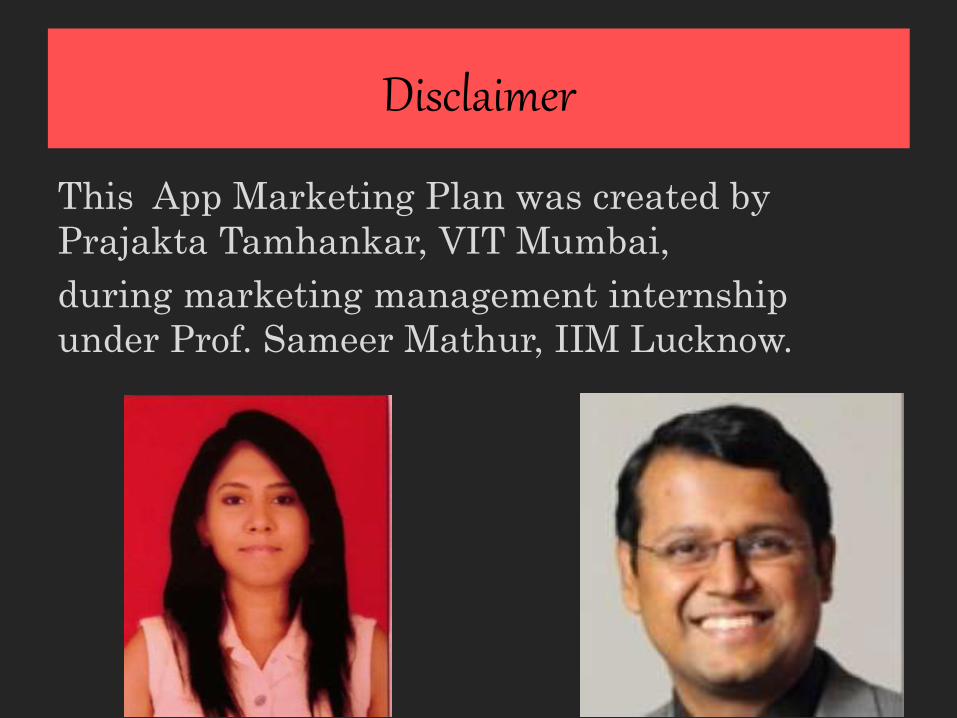
Disclaimer
This App Marketing Plan was created by
Prajakta Tamhankar, VIT Mumbai,
during marketing management internship
under Prof. Sameer Mathur, IIM Lucknow.