apollo global management - wordpress.com
TRANSCRIPT

APOLLOGlobal Management
Jonathan Dybka
Recommendation: BUY
Current Price: $48.05
Target Price: $67.55
Upside: 40%
Downside: 21%

Notes: Information as of January 21, 2021.
Source: Wikipedia, Yahoo Finance, Annual Report
SHARE PRICE PERFORMANCE
BUSINESS MIX FY2019
COMPANY OVERVIEW
0
10
20
30
40
50
60
20
18
-10
-01
20
18
-11
-01
20
18
-12
-01
20
19
-01
-01
20
19
-02
-01
20
19
-03
-01
20
19
-04
-01
20
19
-05
-01
20
19
-06
-01
20
19
-07
-01
20
19
-08
-01
20
19
-09
-01
20
19
-10
-01
20
19
-11
-01
20
19
-12
-01
20
20
-01
-01
20
20
-02
-01
20
20
-03
-01
20
20
-04
-01
20
20
-05
-01
20
20
-06
-01
20
20
-07
-01
20
20
-08
-01
20
20
-09
-01
20
20
-10
-01
20
20
-11
-01
20
20
-12
-01
Share Price in USD
2
AB
C
D
COVID-19
F
E
H
G
A Oct-Dec: S&P market correction; down 19.6%. Apollo's PE holdings decline 29.1% in value . $400M loss in carried interest income.
E Mar 26: U.S. Senate approves $2 Trillion stimulus packages in response to COVID-19 pandemic
B Apr 16: Smart & Final agrees to be aquired by Apollo. All outstanding shares will be purchased for $6.50/share representing a 25% premium
F Jun 18: Apollo announces plans to expand U.S insurance business. Athene holdings made a $500M equity investment for an 11% stake in Jackson National Life Insurance
C Aug 29: Apollo & Athene announced plans to acquire PK AirFinance from GE's Air-Finance unit. Estimated to be a $4B deal
G Oct 12: NY Times publishes article accusing Leon Black of having closer ties to Epstein than originally claimed
D Feb 17: Second confirmed death in U.S from COVID-19 H Nov 3: Market rallies on U.S. Election news
47%
44%
9%
Private Equity Credit Real Assets
AUM by Segment Revenues by sector
▪ $331M in AUM with a net IRR of 24% since inception
▪ Investment strategy
▪ Pursue investments that competitors avoid
▪ Seek complex structures
▪ Invest during uncertainty
▪ Operating Segments:
▪ Credit: Managing a leveraged, high-yield bond portfolio with
$173B in fee generating AUM
▪ Private Equity: $44B fee generating AUM
▪ Real Assets: Acquiring and recapitalizing assets in a distressed-
for-control context. $30B in fee generating AUM.
APOLLO
65%
23%
12%
Credit Private Equity Real Assets

Notes: Information as of January 21, 2021.
Source: Wikipedia, Yahoo Finance, Annual Report
DIVERSIFICATION ACROSS KEY ATTRIBUTES
3
INVESTOR BASE BY GEOGRAPHY
▪ Firm is becoming more geographically diversified since 2015
▪ Europe, and Middle Eastern regions showing strong growth
▪ Public pensions, Insurance, and Sovereign governments make
up 64% of Apollo’s investor base
25%
20%
19%
10%
9%
8%
7% 2%
Public Pension Finance/ Insurance
Sovereign Government Other
HNW / Retail Corporate Pensiond
Fund of Fund Endowment or Foundation
LP PROFILE
65%
12%15%
7%1%
60%
17%11% 11%
1%0%
10%
20%
30%
40%
50%
60%
70%
North America Europe Asia &Australia
Middle East Latin America
2015 2019
Apollo is diversified across geographies, vintage years, and institutions.
17,400
12,723
21,135
32,506
23,183
6,163
0
5,000
10,000
15,000
20,000
25,000
30,000
35,000
Fund I,II,III,IV, and MIA
Fund V Fund VI Fund VII Fund VIII Fund IX
<2001 2001 2006 2008 2013 2018
Tota
l Val
ue
($ T
ho
usa
nd
s)
VINTAGE YEAR
APOLLO
77
216
39
Private Equity Credit Real Assets
BY SEGMENT ($B)

Notes: Information as of January 21, 2021.
Source: 1.IBIS World. 2.Institutional Investor. 3. FRED St Louis
MACRO OVERVIEW
4
-6.86%
4.84% 4.60%
7.55%
3.55% 3.63%
-8.00%
-6.00%
-4.00%
-2.00%
0.00%
2.00%
4.00%
6.00%
8.00%
10.00%
2020 2021 2021E 2022E 2023E 2024E
GROWING DEMAND FROM PENSION FUNDS
0.0
50.0
100.0
150.0
200.0
250.0
300.0
20
03
20
04
20
05
20
06
20
07
20
08
20
09
20
10
20
11
20
12
20
13
20
14
20
15
20
16
20
17
20
18
20
19
20
20
20
21
E
20
22
E
20
23
E
20
24
E
20
25
E
20
26
E
INDUSTRY REVENUES – PRIVATE EQUITY ($B)
The private equity industry is expected to continue growing as institutions seek higher returns in a low interest rate environment.
▪ Institutional investors are expected to increase their
allocation in PE to achieve higher returns and diversification
▪ Industry profitability is expected to increase from 26% in
2020 to 36% in 2025
APOLLO

Notes: Information as of January 21, 2021.
Source: 1.IBIS World. 2.Institutional Investor. 3. FRED St Louis
MACRO OVERVIEW
5
-0.77
-1.34
0.28 0.31
0.170.13 0.13
-1.5
-1.3
-1.1
-0.9
-0.7
-0.5
-0.3
-0.1
0.1
0.3
YIELD ON 10 YR TREASURY NOTE
1100
1150
1200
1250
1300
1350
1400
1450
1500
1550
▪ Interest rates in the US are expected to remain close to 0% until
2023
BOFA HIGH YIELD TOTAL RETURN INDEX3
Apollo’s credit segment is affected on the high-yield bond market and interest rates.
▪ Low interest rates are good for PE firms as investors have
fewer alternative investment options2
▪ BofA Index is a good proxy for the performance of the high
yield bond market
APOLLO

Notes: Information as of January 21, 2021.
Source:Factset, Annual Report
FINANCIAL OVERVIEW
6
1,087
2,011
2,660
1,164
2,834
1,874
2,340
85%
32%
-56%
143%
-34%
25%
-100%
-50%
0%
50%
100%
150%
200%
0
500
1,000
1,500
2,000
2,500
3,000
2015 2016 2017 2018 2019 2020E 2021E
Revenue ($mm) % Growth
REVENUE FEE GENERATING VS TOTAL AUM
▪ During times of increased volatility and market dislocation, carried interest will be several impacted. The result of this can be seen in 2015, 2018 and 2020 as each year had a market correction
▪ Fee generating AUM makes up 77% of Total AUM on average
138 151169
214246
342372
170192
249
280
331
411
476
81%79%
68%
76% 74%83%
78%
0%
10%
20%
30%
40%
50%
60%
70%
80%
90%
0
100
200
300
400
500
600
2015 2016 2017 2018 2019 2020E 2021E
Fee AUM ($B) Total AUM ($B) Fee AUM as % of total
Most of Apollo’s revenues come from management fees.
APOLLO

Notes: Information as of January 21, 2021.
Source:1.Investor Presentation. 2,Factset
FINANCIAL OVERVIEW
7
FRE MARGIN ($MM) MANAGEMENT FEES VS CARRIED INTEREST ($MM)
▪ Fee Related Earnings (FRE) margins are a key industry metric. Apollo’s FRE margin has been rising over the past five years by keeping costs consistent but growing revenues.
▪ 90% of Fee Related Earnings come from management fees.1
• Management fees are a more stable source of revenues. Carried interest is highly affected by market conditions.
FRE represents a stable and predictable revenue stream for Apollo.
APOLLO
960
1,1251,200
1,394
1,6141700
2125
422530
624
771
902 865
1081
44%
47%
52%55% 56% 56% 56%
0%
10%
20%
30%
40%
50%
60%
0
500
1,000
1,500
2,000
2,500
2015 2016 2017 2018 2019 2020E 2021E
Fee Related Revenue ($mm) Fee Related Earnings ($mm) FRE Margin
9301,044
1,155
1,345
1,576
1,240
97
780
1,338
(400)
1,057
(350)
-500
0
500
1,000
1,500
2015 2016 2017A 2018A 2019A Q3/2020
Management fee Carried int

Notes: Information as of January 21, 2021.
Source:1.Yahoo Finance
INVESTMENT THESIS
8
GROWING AUM
SHORT TERM: TRADING AT A DISCOUNT TO PEERS1:
45
65
85
105
125
145
APO KKR Ares Hamilton Lane
0
50
100
150
200
250
300
350
400
2015 2016 2017 2018 2019 2020E 2021E
LONG TERM:
GEOGRAPHIC EXPANSION
MARKET VOLATILITY DUE TO COVID-19
CREATING BUYING OPPORTUNITIES
Apollo is an attractive investment because of its AUM growth, buying opportunities, all while trading at a discount.
APOLLO

Notes: Information as of January 21, 2021.
Source:1.Cambridge Associates. 2.Annual Presentation
INVESTMENT THESIS – LONG TERM
9
YEARLY AUM GROWTH
0%
5%
10%
15%
20%
25%
30%
35%
2016 2017 2018 2019 Q3 2020
APO Ares KKR Hamilton
APO: 20.6%
HLNE: 15.8%
KKR: 14.3%
ARES: 13.8%
CAGR:
▪ Apollo grew its AUM at 26.6% CAGR in 5 years, higher than
any of its peers
INDUSTRY LEADING RETURNS1
13.8% 12.8%
18.34%
12.6%
39%
24%
0%
5%
10%
15%
20%
25%
30%
35%
40%
45%
10 years 25 years 10 years 25 years PE Gross IRR PE Net IRR
US Private Equity Index
Top Quartile
Apollo IRR since inception
▪ This can be attributed to its industry leading returns, with a
net IRR of 24% since inception2
Fastest growing AUM in the industry due to a history of exceptional returns.
APOLLO

Notes: Information as of January 21, 2021.
Source:1.Annual Presentation. 2.Annaul Report 2019
INVESTMENT THESIS – SHORT TERM
10
DRY POWDER1 ($B)
Used the COVID induced stress to make strategic acquisitions and leveraged their advantage in credit to drive growth
▪ $45.8B in dry powder
▪ $50B in purchases during pandemic
▪ 14% of Fund IX committed to distressed opportunities
APOLLO
14.5
27.6
3.7
Credit Private Equity Real Assets
INDUSTRY LEADER IN CREDIT2
Credit Type Growth 1yr Net Returns 2019
Corporate Credit 13% 9.50%
Structured Credit 24% 10.00%
Direct Origination 45% 8.20%
▪ $300B in AUM. The largest alternative credit platform in the
industry
▪ Utilizing their scale to offer uncorrelated investment
opportunities
▪ Their success can be seen in the growth of the direct
origination segment
▪ 52% of management fees come from credit, therefore growth
in this segment is key

Notes: Information as of January 21, 2021.
Source: Factset. Annual Reports of each firm (2019)
VALUATION – COMPARABLE FIRMS
11
▪ Apollo had the highest growth in AUM at 34%
▪ Management fee margin is bellow industry average of 63%
▪ Apollo is valued at a discount compared to peers based on the P/FRE at 20.6x vs
industry average of 31.5x
▪ Trading at a discount compared to its historical 3 year average of 22.3x
Apollo is trading at a relative discount in P/FRE multiple to its peers. This is due to its low management fee ratio, despite having the highest AUM growth in the industry.
APOLLO
Company Market CapEnterprise
Value
Div
Yield
Fee AUM
($mm)
P/
Fee-AUMP/FRE
Management Fee to
Carried Interest RatioAUM Growth LTM EV/EBITDA NTM
Hamilton Lane 4,271 4,342 1.53% 38,700 11.2% 42.8x 7.48 8% 27.4x
Blackstone Group 73,602 84,480 3.02% 408,000 18.8% 39.5x 5.24 5% 19.7x
Carlyle Group 11,520 17,938 2.97% 161,000 6.4% 31.8x 3.38 4% 13.2x
Ares Management Corp 24,160 35,129 3.54% 96,900 6.7% 30.3x 1.57 24% 31.3x
KKR & Co 23,098 72,326 1.33% 152,997 14.1% 12.9x 0.40 11% 10.8x
Average 27,330 42,843 2.48% 171,519 11.4% 31.5x 3.62 10% 20.5x
Median 23,098 35,129 2.97% 152,997 11.2% 31.8x 3.38 8% 19.7x
Apollo Global 19,159 31,750 4.82% 246,446 8.0% 20.6x 1.49 34% 18.4x
Firm P/AUM AUM growth LTM
Brookfield 25% 6%
EQT 44% -1%
Partners Group 32% 2%
Intermediate Partners11% 14%
Average 28% 5%
Median 29% 4%
Apollo 8% 34%
COMPARED TO CNID CHALLENGE

12
INVESTMENT THESIS – DISCOUNT TO PEERS
▪ A linear relationship between Management Fee ratio and the multiple the firm
trades at
▪ A higher management fee relative to carried interest fee indicates the firm has a
more stable cash flow
MANAGEMENT FEE : CARRIED INTEREST RATIO
APOLLO
0.0
5.0
10.0
15.0
20.0
25.0
30.0
35.0
40.0
45.0
2017 2018 2019 2020
APO Blackstone Carlyle Hamilton Ares
PRICE / FRE MULTIPLE
APO: 20.6x
BX: 39.5x
HLNE: 42.5x
CG: 31.8x
ARES: 30.3x
▪ The discount is due to the media’s accusations that CEO Leon Black had closer
ties to Jeffrey Epstein
▪ The company will continue trading at a discount until the independent committee
releases its decision
Apollo is trading at a discount to its peers due to a relatively lower management fee ratio and the current Epstein scandal.
Notes: Information as of January 21, 2021.
Source: Factset
7.5
5.2
3.4
1.6
0.4
1.5 1.5
-1.0
0.0
1.0
2.0
3.0
4.0
5.0
6.0
7.0
8.0
10.0 15.0 20.0 25.0 30.0 35.0 40.0 45.0
Man
agm
ent
Fee
to C
arri
ed In
tere
st R
atio
P / FRE
APO (20x)
2020
KKR
HLNE
CG
ARES
BX
APO (25x)
2018

VALUATION – REVENUE FORECAST
13
REVENUE FORECAST
AUM Forecasts
2013 2014 2015 2016 2017 2018 2019 Q3 2020 2021E 2022E 2023E 2024E
Fee Rev ($B) 0.67 0.85 0.93 1.04 1.15 1.35 1.58 1.70 2.12 2.66 3.19 3.82
AUM ($B) 161 160 170 192 249 280 331 433 430 537 655 786
AUM Growth-0.62% 6.25% 12.94% 29.69% 12.45% 18.21% 30.82% -0.77% 25.00% 21.96% 20.00%
Fee Revenue as % of AUM
0.42% 0.53% 0.55% 0.54% 0.46% 0.48% 0.48% 0.39% 0.49% 0.49% 0.49% 0.49%
▪ Fee revenue remains constant at 0.5% of total
AUM.
▪ Based on the AUM growth of Q3/2020 of 30.8%,
AUM growth will slow over the next four years
▪ Having AUM forecasts, we can derive fee
revenues, assuming they remain at a constant %
of AUM
▪ Total revenues are expected to grow at 11.3%
CAGR until 2024
▪ 2020 will see a contraction due to COVID and the
resulting economic slowdown
▪ Economic activity is expected to return to normal
by 2021 and revenue growth will continue at
historical levels
1.58 1.702.12
2.663.19
3.82
-7.7%
17.5% 17.9%
15.1%15.9%
-10%
-5%
0%
5%
10%
15%
20%
-1
1
2
3
4
5
6
7
2019A 2020E 2021E 2022E 2023E 2024E
Management fees from affiliates Advisory and transaction fees from affiliates, net
Carried interest income from related parties Principal investment income / loss
Growth
APOLLONotes: Information as of January 21, 2021.
Source:

VALUATION – DISCOUNTED CASH FLOW MODEL
14
Fiscal Year 2017A 2018A 2019A Q1A Q2A Q3A Q4E 2020E 2021E 2022E 2023E 2024E
Fiscal Year End Date 12-31-17 12-31-18 12-31-19 3-31-20 6-30-20 9-30-20 12-31-20 12-31-20 12-31-21 12-31-22 12-31-23 12-31-24
Revenue 2,610,173 1,093,065 2,931,849 (1,469,086) 1,508,335 1,018,274 802,018 2,705,120 3,179,643 3,749,226 4,316,739 5,003,416
Revenue Growth % -58.1% 168.2% -32.5% -21.2% -7.7% 17.5% 17.9% 15.1% 15.9%
EBIT 1,412,014 80,406 1,537,955 (2,354,938) 1,123,098 686,953 749,455 1,724,046 2,071,550 2,410,008 2,747,236 3,155,273
EBIT Margin % 7.4% 52.5% 74.5% 67.5% 93.4% 63.7% 65.2% 64.3% 63.6% 63.1%
EBITDA 1,339,094 (77,589) 1,364,065 (2,402,582) 1,067,749 650,285 714,293 1,549,223 1,894,190 2,200,877 2,506,449 2,876,184
EBITDA Margin % -96.5% 88.7% 102.0% 95.1% 94.7% 95.3% 89.9% 91.4% 91.3% 91.2% 91.2%
Tax Rate % 18.4% 81.7% -9.2% 11.5% 12.3% 11.7% 11.8% 11.8% 11.8% 11.8% 11.8% 11.8%
EBIAT 660,875 1,520,608 1,827,107 2,125,627 2,423,062 2,782,951
(+) D&A 3,335 24,942 29,317 34,569 39,801 46,133
(-) CAPEX (16,028) (64,112) (64,112) (64,112) (64,112) (64,112)
(-) Change in NWC (1,089,270) (127,002) 126,917 (15,907) (15,958) (13,034)
Unlevered Free Cash Flows 1,737,452 1,608,440 1,665,395 2,111,991 2,414,709 2,778,005
Discount Factor 1% 101% 201% 301% 401%
Present Value of UFCFs 1,737,452 1,607,428 1,486,115 1,682,812 1,717,975 1,764,792
ASSUMPTIONS:
▪ Revenue will grow at a 9.2% CAGR for the next 4
years
▪ D&A will remain constant at 0.9% of revenues
▪ CAPEX will remain constant
▪ WACC of 11.99%
APOLLO
PERPETUITY: 75%
EXIT EBITDA: 25%
WEIGHTED AVERAGE
VALUE PER SHARE: $67.55
UPSIDE: 40% (from current $48.29)
Notes: Information as of January 21, 2021.
Source:

MANAGEMENT FEE REVENUE 2020
COST OF CAPITAL
COMPENSATION EXPENSE 2020
BETA
SENSITIVITY ANALYSIS
15
54.00
56.00
58.00
60.00
62.00
64.00
1,599,711 1,649,711 1,699,711 1,749,711 1,799,711
40.00
60.00
80.00
100.00
120.00
16% 14% 11.99% 10% 8%
50.00
55.00
60.00
65.00
70.00
1.9 1.8 1.7 1.6 1.5
Stock
Price ($)
58.00
59.00
60.00
61.00
(1,457,706) (1,157,706) (857,706) (557,706) (257,706)
55.00
94.55
48.87
19.46
64.64
102.76
74.97
55.38
0.00
20.00
40.00
60.00
80.00
100.00
120.00
DCF value at 0.7-2.7%perpetuity range
DCF value at 19.5-21.5x exitEBITDA range
DCF value at 10-14% WACCrange
52 week market high/low
FOOTBALL FIELD
How does the model react to different parameters?
APOLLONotes: Information as of January 21, 2021.
Source:

WORST CASE SCENARIO
SCENARIO ANALYSIS
16
Fiscal Year 2021E 2022E 2023E 2024E
Base Case
Total Revenue Forescast ($ Thousands) 3,179,643 3,749,226 4,316,739 5,003,416
EBIT 2,071,550 2,410,008 2,747,236 3,155,273
Bear Case:
Management fees from affiliates 2,124,639 2,655,799 3,186,959 3,824,350
EBIT 1,016,546 1,316,581 1,617,456 1,976,208
Unlevered FCF 734,882 1,147,588 1,418,243 1,738,070
Undistributed Performance Fees ($mm)1
Potential Clawback($mm)
Credit 359.7 381.2
Private Equity 610.3 1,294.6
Real Assets 145.7 338.8
Total 1,115.7 2,014.6
▪ Represents the maximum fees that could be returned if the
remaining funds were to become worthless
The worst case scenario, going forward Apollo does not do make any new deals and its only source of revenue are existing management fees. This would result in a 21% decline in their stock price.
Base Case:$67.55
40% Upside
Bear Case:$39.98
21% Downside
APOLLO
Extreme Bear Case:$30.30
38% Downside
Assumes growth in AUM and multiple
sources of revenue
▪ If the firm only generated management fees
▪ This represents a 28% drop in revenues and a 43% decline in
EBIT
Firm loses all future deals, and its only
source of revenue comes from existing
management fees
Only source of revenue comes from
management fees and firm must repay
the maximum clawback
Notes: Information as of January 21, 2021.
Source:1.Annual Report 2019

REGULATION INCREASED MARKET VOLATILITYLOSS OF KEY PERSONNEL
RISKS
17
VIX APO S&P
August 2011 43 -42% -17%
December 2018 30 -34% -18%
March 2020 66 -47% -32%
36
38
40
42
44
46
48
20
20
-10
-01
20
20
-10
-03
20
20
-10
-05
20
20
-10
-07
20
20
-10
-09
20
20
-10
-11
20
20
-10
-13
20
20
-10
-15
20
20
-10
-17
20
20
-10
-19
20
20
-10
-21
20
20
-10
-23
20
20
-10
-25
20
20
-10
-27
20
20
-10
-29
20
20
-10
-31
20
20
-11
-02
-22%
▪ October 12: NY Times accuses Leon Black
accused of having deeper times to Epstein
than originally claimed. Apollo stock falls 22%
on the news
▪ If the company were to lose at least two MP’s,
certain funds will be terminated, this would
severely impact revenues from the loss of fees
Sector Impact
Technology -9.20%
Health care -8.40%
Communication -8.2
Consumer discretionary -7.50%
Financials -6.50%
▪ Biden proposal: raise corporate tax rate from
21% to 28%
EXPECTED EARNINGS HIT FROM TAXES
Notes: Information as of January 21, 2021.
Source: 1. Annual Report, 2. CNBC, 3. Investopedia, 4.Bloomberg
▪ Increased market volatility could impact the
value of Apollo’s private equity, and credit
holdings
APOLLO SHARE PRICE ADVERSELY AFFECTED
WITH INCREASED VOLATILITY2
▪ Clawback:
▪ Performance fees that may need to be
repaid
▪ Future losses can result in unjustified
performance fees
The greatest risks to the firm are the Epstein scandal, and the potential for increased taxes on carried interest.
APOLLO
Price per share

Notes: Information as of January 21, 2021.
Source:1.Annual Report. 2. Factset.
EXECUTIVE COMPENSATION 2019GOVERNANCE
18
57%
43%
Independent Insider
Insider Ownership
Management: 10.16%
Board: 7.4%
INDEPENDENT DIRECTORS2
▪ Class B & C shares1:
▪ 100% owned by managing partners
▪ Used to limit influence of class A shareholders
▪ Sole authority to remove and replace directors
▪ Anti-Takeover Provisions:
▪ Limited voting rights for class A shareholders
▪ “BRH” directors have more votes
▪ Supermajority required for amendments
Stock compensation keeps management’s interests aligned with class A shareholders.
APOLLO
Name Insider HoldingsStock
CompensationTotal Annual
Compensation ($)
Leon Black 4.48% 80,000,000 260,175
Joshua Harris - 45,832,643 -
Marc Rowan 3.80% 32,481,402 -
James Zelter 1.20% - -
Scott Kleinman 0.80% - 18,615,204
Martin Kelly 0.13% 2,597,962 5,507,979
John Suydam 0.30% 577,539 4,181,695
17%
83%
Women Men
BOARD GENDER DISTRIBUTION

INVESTING SUSTAINABLY
Notes: Information as of January 21, 2021.
Source:1.Apollo. 2.Lumileds, Verallia, Hexion, Change For Kids
ENVIRONMENT & SOCIAL
19
INVESTING IN THE NEXT GENERATION
Through its investments and donations, Apollo is taking a proactive approach to corporate responsibility.
Capitalizing on the widespread adoption
of LEDs. They are more energy efficient,
have longer lifespans and contain fewer
toxic materials1
Manufactures glass products. Glass can
be recycled infinitely thus reducing the
carbon footprint of glass products
Developed a low temperature curing
powder, reducing its customers’ energy
consumption by 20%
Apollo Women Empower
(AWE) was established to
help facilitate networking and
mentorship opportunities and
advance talented women to
leadership roles
Providing school supplies,
reading lessons, and field
trips to underprivileged kids
in New York
APOLLO

DIVERSIFIED ACROSS
KEY ATTRIBUTES
Notes: Information as of January 21, 2021.
Source:
SUMMARY
20APOLLO
GROWING AUM
DISCOUNT TO PEERS
▪ Providing an attractive return to investors since inception
▪ Using size to their advantage, economies of scale will help keep
costs down and maintain high returns going forward
▪ Industry leader in alternative credit, with a diverse array of
uncorrelated products
▪ Demand from different countries and institutions will ensure stable
growth in a wide variety of market conditions
▪ Trading at a discount to peers and their historical valuation
▪ If the independent committee clears Leon Black, Apollo will go
back to trading at its historical valuation of 25x P/FRE
▪ This provides an excellent buying opportunity in the short term

21
Thank you
Questions?

References:
Intro:https://oneunpark.com/teamhttps://www.genium360.ca/en-us/job/financial-analsyt-2257/
Macrohttps://www.institutionalinvestor.com/article/b1nf5v5h2h97jd/Ultra-Low-Interest-Rates-Are-Driving-Insurers-Into-the-Arms-of-Private-Equityhttps://my-ibisworld-com.lib-ezproxy.concordia.ca/us/en/industry/52599/industry-performancehttps://fred.stlouisfed.org/series/BAMLHYH0A0HYM2TRIV
Limited Partners:https://www.apollo.com/~/media/Files/A/Apollo-V2/documents/events/2015/apollo-investor-presentation-november-2015.pdfhttps://www.apollo.com/~/media/Files/A/Apollo-V2/reports-and-presentations/apollo-global-management-november-2020-investor-presentation-vfinal.pdf
Financial Overview:https://www.apollo.com/~/media/Files/A/Apollo-V2/reports-and-presentations/apollo-global-management-august-2020-investor-presentation.pdf
Investment thesis – Long Termhttps://www.ey.com/en_in/private-equity/how-india-is-emerging-as-one-of-the-leading-destinations-for-global-pe-vc-capitalhttps://www.cambridgeassociates.com/wp-content/uploads/2020/11/WEB-2020-Q2-USPE-legacy-Benchmark-Book.pdfhttps://my-ibisworld-com.lib-ezproxy.concordia.ca/us/en/industry/52599/industry-performanceCyprus, Michael. Kaloostian, Peter. (November 6, 2020). Compelling Value; Upgrade to Overweight. Morgan Stanley Research. Retrieved from ThomsonONE
Risks:https://www.cnbc.com/2021/01/08/how-joe-bidebsproposals-also-have-the-potential-to-affect-holders-of-stocks-and-bonds.htmlhttps://www.investopedia.com/terms/1/3c7.asphttps://www.subpng.com/png-9nyhi5/download.htmlhttps://www.bloomberg.com/news/articles/2020-05-01/apollo-takes-hit-with-asset-values-sinking-in-global-rout
Environment & Social:https://www.france-quintessence.fr/event/exhibitors/veralliahttps://www.avnet.com/wps/portal/silica/manufacturers/m/lumileds/https://www.hexion.com/https://www.vhv.rs/viewpic/ihTwoii_diversity-hands-hd-png-download/https://secure.givelively.org/donate/change-for-kids-inc/cfk-penguin-party-2020/courtney-seamon
Graphs generated using data from FactSet, Yahoo finance and Yearly Presentations
Appendix:https://en.wikipedia.org/wiki/Cox_Media_Grouphttps://en.wikipedia.org/wiki/ADT_Inc.https://en.wikipedia.org/wiki/Qdobahttps://financialpost.com/news/fp-street/apollo-casino-deal-is-approved-after-bid-lifted-to-1-9-billionhttps://ca.finance.yahoo.com/news/apollo-advanced-talks-buy-orbia-021512181.htmlhttps://www.travelpulse.com/suppliers/airlines/united-airlines.htmlhttps://www.archyde.com/apollo-buys-some-of-the-united-airlines-credit-banks-that-are-to-be-dropped/https://www.ft.com/content/1504dda4-ff2e-11e4-8dd4-00144feabdc0https://en.wikipedia.org/wiki/The_Blackstone_Grouphttps://www.aresmgmt.com/https://www.crunchbase.com/organization/kkrhttps://www.acpm.com/ACPM/files/4d/4de27d9d-2a43-4289-a3b6-1105bc845b1b.pdfhttps://en.wikipedia.org/wiki/Kohlberg_Kravis_Robertshttps://en.wikipedia.org/wiki/Apollo_Global_Management#Ares_Managementhttps://en.wikipedia.org/wiki/The_Carlyle_Grouphttp://ir.hamiltonlane.com/investors/financial-information/default.aspx
22

Appendix

24
APPENDIX - SEGMENTSCredit Private Equity Real AssetsCredit AUM($mm)
• Real Estate:
• $22.9B fee generating AUM
• Investing in asset classes such as: hospitality, office
space, industrial, retail healthcare, and residential
• Apollo Commercial Real Estate Finance Inc (ARI) publicly
traded commercial real estate trust
• Debt activities: first mortgage, mezzanine financing,
preferred equity, loans and mortgage-backed securities
• European Principal Finance (EPF) Funds:
• $5.1B fee generating AUM
• European residential, commercial, nonperforming loans,
unsecured loans, and distressed assets
• Moat: capital intensive and illiquid nature of investment
results in low competition in this sector
• Infrastructure:
• $1.7B fee generating AUM
• Midstream energy, renewables, and transportation
• Long lived assets, consistent cash flows, and limited
downside protection
• Focus on investments’ position in capital structure and
current yield
• Distressed buyouts, Debt, and Other Investments:
• Exploit market mispricing and volatility to build up a
position in distressed debt.
• Focus on high quality operating companies with poor
balance sheets
• Downside protection by staying high in the capital
structure
• Distressed for control strategy: take control through
distressed debt, work with management in restructuring,
equitize debt positions and hold for 3-5 years
• Non-control distressed investment strategy: not able to
take control of the company, sell debt investments over
time, results in higher short-term IRR
• Corporate Carve-outs:
• Carving out a business from a larger corporate parent
• Business is typically poorly managed or overlooked,
leading to attractive purchase prices
• Transactions are labour intensive and requires deep
industry knowledge
• Hybrid Capital
• Help companies fund organic growth, acquisitions, or
build ups with customized capital solutions
• Senior unsecured debt, preferred equity securities,
typically linked with equity-linked upside
APOLLO
110.7
52.7
24.2
27.9
Corporate Credit Structured Credit
Direct Origination Advisory and Other
• Corporate credit & fixed income
• $92.6B fee generating AUM
• Investment grade corporate bonds, emerging markets,
and private placements
• Less liquid
• Collagenized Loan Obligations (CLOs):
• Seeking competitive yields, diversified assets with history
of low default rates
• Structured Credit & Funds
• Targets tranches of less liquid securities with protective
lending terms, predictable payments, diversified
portfolios, and low default fates
• Direct Origination:
• Advises clients investing in loans
• First-lien senior secured/unsecured loans, mezzanine
loans, private high-yield debt, asset backed loans etc
• MidCap:
• Middle market subsidy of Apollo, providing senior debt
solutions
• AINV:
• Closed end investment company
• Private financing for companies that don’t have access to
traditional sources of capital
• Advisory:
• ISGI subsidy provides asset allocation & risk management
services to financial institutions acquired by Apollo
FundVintage
YearCapital Raised
($B)Strategy
IX 2018 24.7 Buyout/Distressed
VIII 2013 18.4 Buyout/Distressed
VII 2008 14.7 Buyout/Distressed
VI 2006 10.1 Buyout/Distressed
V 2001 3.7 Buyout/Distressed
ANRP 2018 -- Energy Buyout
ANRP II 2016 3.5 Energy BuyoutSource: Credit Suisse
29.4
7.2
2.2
Real Estate Principal Finance Infrastructure
Notes: Information as of January 21, 2021.
Source: Annual Report 2019

APPENDIX - CREDIT
25
PERFORMANCE FEES ($MM) CREDIT AUM BY SEGMENT ($B)
556642
779
572
30
9
44
1418
28
21
16
0
100
200
300
400
500
600
700
800
900
2017 2018 2019 Q3/2020
Management fees Advisory and transaction fees Performance fees
▪ Corporate credit and direct origination drove growth
in the credit segment over the past three years
Segment Fee %
Management fees 9.6%
Advisory and transaction fees 0.5%
Performance fees 0.3%
Total 10.4%
Appreciation Required to
Achieve Performance Fees
Corporate Credit 3%
Structured Credit 17%
Direct Origination 5%
35 33
98
57
16
36
1825
58
0
20
40
60
80
100
2017 2018 2019
Corporate Credit Structured Credit Direct Origination
Notes: Information as of January 21, 2021.
Source: Annual Report 2019
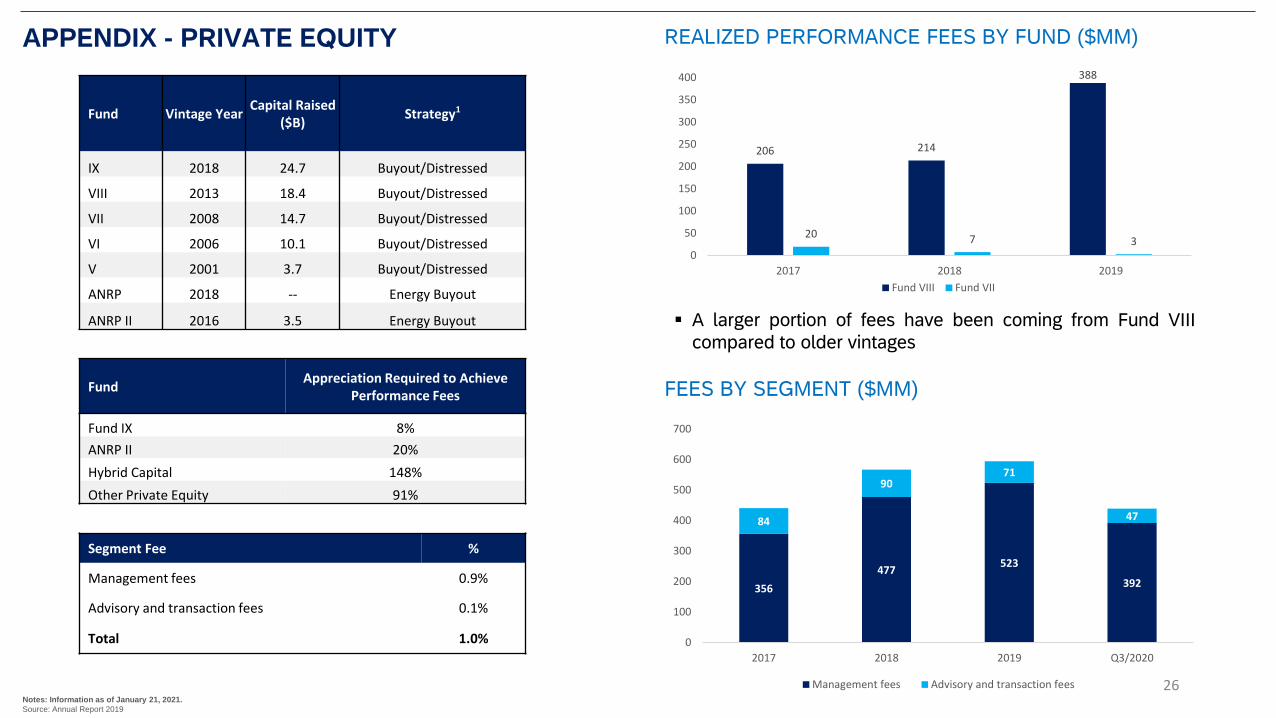
REALIZED PERFORMANCE FEES BY FUND ($MM)APPENDIX - PRIVATE EQUITY
26
206 214
388
20 7 30
50
100
150
200
250
300
350
400
2017 2018 2019
Fund VIII Fund VII
Fund Vintage YearCapital Raised
($B)Strategy1
IX 2018 24.7 Buyout/Distressed
VIII 2013 18.4 Buyout/Distressed
VII 2008 14.7 Buyout/Distressed
VI 2006 10.1 Buyout/Distressed
V 2001 3.7 Buyout/Distressed
ANRP 2018 -- Energy Buyout
ANRP II 2016 3.5 Energy Buyout
Fund Appreciation Required to Achieve
Performance Fees
Fund IX 8%
ANRP II 20%
Hybrid Capital 148%
Other Private Equity 91%
Segment Fee %
Management fees 0.9%
Advisory and transaction fees 0.1%
Total 1.0%
356
477523
392
84
9071
47
0
100
200
300
400
500
600
700
2017 2018 2019 Q3/2020
Management fees Advisory and transaction fees
FEES BY SEGMENT ($MM)
▪ A larger portion of fees have been coming from Fund VIII
compared to older vintages
Notes: Information as of January 21, 2021.
Source: Annual Report 2019

REAL ASSETS AUM ($B)
APPENDIX - REAL ASSETS
27
29.4
7.2
2.2
Real Estate Principal Finance Infrastructure
REAL ASSETS FEE RELATED REVENUES ($MM)
171163
189
140
3 13
7
6
0
50
100
150
200
250
2017 2018 2019 Q3/2020
Management fees Advisory and transation feesSegment Fee %
Management fees 1.86%
Advisory and transaction fees 0.07%
Total 1.93% ▪ Minimum appreciation required to achieve performance fees: 250
bps
Notes: Information as of January 21, 2021.
Source: Annual Report 2019

APPENDIX – DISCOUNTED CASH FLOW MODEL
28
Perpetuity approach
Normalized FCF in last forecast period 3,180,935
Normalized FCFt+1 3,234,056
Long term growth rate (g) 1.67%
Terminal value 31,328,130
Present value of terminal value 19,901,922
Present value of stage 1 CF 8,259,124
Enterprise value 28,161,046
Implied TV exit EBITDA multiple 10.9x
Enterprise value 28,161,046
Less: net debt (1,727,329)
Less: trapped cash (17,694)
Equity value 26,416,022
Diluted shares (000) 445,188
Equity value per share $ 59.34
Market premium/ (discount) to fair value (18.6)%
Exit EBITDA multiple approach
Terminal year EBITDA 2,876,184
Terminal value EBITDA multiple 20.47x
Terminal value 58,875,484
Present value of terminal value 37,402,019
Present value of stage 1 CF 8,259,124
Enterprise value 45,661,143
Implied TV perpetual growth rate 6.6%
Enterprise value 45,661,143
Less: net debt (1,727,329)
Less: trapped cash (17,694)
Equity value 43,916,119
Diluted shares (000) 445,188
Equity value per share $ 98.65
Market premium/ (discount) to fair value (51.0)%
WACC = 11.99%
▪ Using a WACC of 11.99% and long term growth rate of
1.67% an equity value of $59.32 was derived
▪ At this valuation, we can imply an exit multiple of 10.9x
EV/EBITDA
▪ Using the industry average EV/EBITDA exit multiple of
20.47x, we can derive an equity value of $98.65
▪ This method implies a higher value per share because
the industry average is higher than Apollo current
multiple of 18.4x
APOLLO

APPENDIX – GENERAL COMPS
Company EV/EBITP/E
NTM
P/B
NTM
P/CF
NTM
Hamilton Lane 29.1x 36.0x 11.4x 22.2x
Blackstone Group 15.9x 20.8x 8.1x 19.5x
Carlyle Group 15.0x 15.0x 5.3x 32.1x
Ares Management Corp 31.8x 21.6x 7.7x 20.5x
KKR & Co 11.8x 18.7x 1.7x 10.9x
Average 20.7x 22.4x 6.8x 21.1x
Median 15.9x 20.8x 7.7x 20.5x
Apollo Global 19.9x 18.4x 8.6x 19.0x
Notes: Information as of January 21, 2021.
Source: Factset

APPENDIX – PEER GROUP
Notes: Information as of January 21, 2021.
Source: Wikipedia, Archyde, Orbia. Wikipedia. Hamilton Lane Investor Relations. FactSet
One of the largest investors in leveraged buyouts and heavily involved in commercial
real estate. It is the largest of the whole cohort in terms of market cap. Operates in:
Private Equity, Real Estate, Hedge Fund Solutions and Credit.
Operates in private equity, energy, infrastructure, real estate, credit, and strategic
hedge funds. Trades at a lower multiple because its primary source of revenues are
not management fees but investment income which is riskier.
Initially established as a segment of Apollo’s collateralized debt obligations. In 2002 it
was spun out from Apollo and has operated as an independent business development
company.
Operates in corporate private equity, real assets, and private credit. It is the second
largest private equity firms in terms of capital raised.
Designs customized portfolios, design and invest in specialized funds, provide advisory
services in asset allocation and strategic plan creation. Because they have a more
service-based offering, they get a higher % of revenues from management fees.

APPENDIX - STRATEGIES
Strategy Description
ADIP Apollo/Athene Dedicated Investment Program. $10M unfunded.
Infrastructure EquityPart of real assets. Acquisition and recapitalization of realestate and infrastructure assets, portfolios, platforms and operating companies.
Aircraft Lending Acquired PK AirFinance in December 2019. PK AirFinance, a aircraft lending business, acquired the PK AirFinance aircraft lending platform and Athene acquired PK AirFinance’s existing portfolio of loans.
Hybrid Value
Launched in 2018. Pursues the provision to companies of: rescue financing or customized capital solutions, including senior secured and unsecured debt or preferred equity securities, often with equity-linked or equity-like upside. Typically, in these scenarios, companies are looking for an equity partner to fund initiatives such as organic growth, acquisitions, deleveraging or build-ups.
CLOsEmploys structured credit and performing credit strategies with the goal of providing investors with competitive yields achieved through highly diversified pools of historically low defaulting assets
Asia real estate equity funds
Primary focus on investing in China, India and Southeast Asia, while executing Apollo’s strategy of opportunistic value investing.
Notes: Information as of January 21, 2021.
Source: Annual Report 2019

APPENDIX – HOLDINGS
American media
conglomerate. Owned by
Apollo and Cox Enterprises.
Operates radio and TV
stations serving the pacific,
south, Eastern Midwest and
North East of the US.
Acquired in December 2019
for $3.1B
Provides residential and
business security solutions.
Fire alarms and other
monitoring services. Acquired
by Apollo in February 2016
for $6.9B in a leveraged
buyout. It was purchased at a
premium of 56% above ADT’s
share price.
Notes: Information as of January 21, 2021.
Source: Wikipedia
Fast casual chain of restaurants
operating in the US and
Canada. Offering Mexican style
dishes. In 2018 they operated
over 700 locations. Acquired by
Apollo in March 2018 for
$305M.

APPENDIX – RECENT & ONGOING DEALS
Operates 25 properties of
casinos, horse tracks and
gaming centers. Also runs
hotels and restaurants. Apollo
acquired the Canadian
company in December of
2020 for $1.9B of 45$ per
share. Apollo plans to bolster
growth through loyalty
programs. This complements
Apollo’s existing gaming
holdings such as Caesars
Entertainment.
Headquartered in Mexico city.
Orbia operates five brands
focusing on food security,
water scarcity, and health &
wellness through materials.
Apollo is currently in talks to
purchase Orbia’s vinyl
business. The business unit is
estimated to be worth $2B.
Apollo has existing operations
in companies with its holdings
of Lyondell.
The COVID -19 pandemic put
airlines in a strained position
to maintain liquidity. Apollo
sensed this opportunity and in
March 2020, they purchased
part a $2B bank loan. This fits
in with their investment
strategy of buying during
times of uncertainty.
Notes: Information as of January 21, 2021.
Source: Wikipedia, Archyde, Orbia

Notes: Information as of November 30, 2020.
Source:1.EY
34
67%
80%
59%
52%
83%
58%
0%
10%
20%
30%
40%
50%
60%
70%
80%
90%
2014 2015 2016 2017 2018 2019
Expense margin
Expense Margin
55%
89%
53%44%
123%
54%
0%
20%
40%
60%
80%
100%
120%
140%
2014 2015 2016 2017 2018 2019
Management Fee margin
EXPANSION TO INDIA
0.72 2
4.1
11.6
2.2
1.91
6.3
4.6
0
2
4
6
8
10
12
14
16
18
2015 2016 2017 2018 2019
Real Estate & Infrastructure Buyouts Traditional PE buyouts
▪ PE/VC investments in India have grown at a CAGR of
44%1
▪ Apollo is establishing a foothold in this fast growing
market through its ARCION Revitalization Private Limited
and AION India Opportunities Trust
BUYOUT ACTIVITY IN INDIA
APPENDIX - MISCELANIOUS

REGULATION INCREASED MARKET VOLATILITYLOSS OF KEY PERSONNEL
APPENDIX - RISKS
35
VIX APO S&P
August 2011 43 -42% -17%
December 2018 30 -34% -18%
March 2020 66 -47% -32%
36
38
40
42
44
46
48
20
20
-10
-01
20
20
-10
-03
20
20
-10
-05
20
20
-10
-07
20
20
-10
-09
20
20
-10
-11
20
20
-10
-13
20
20
-10
-15
20
20
-10
-17
20
20
-10
-19
20
20
-10
-21
20
20
-10
-23
20
20
-10
-25
20
20
-10
-27
20
20
-10
-29
20
20
-10
-31
20
20
-11
-02
-22%
▪ October 12: NY Times accuses Leon Black accused of having
deeper times to Epstein than originally claimed. Apollo stock
falls 22% on the news
▪ This shows simple accusations can have a severe impact on
the stock price in the short term
▪ Three managing partners at Apollo1:
▪ Leon Black
▪ Joshua Harris
▪ Marc Rowan
▪ Company does not carry “key man” insurance in the case of
death or disability for any MP
▪ If the company were to lose at least two MP’s, certain funds
will be terminated, this would severely impact revenues from
the loss of fees
▪ This is true for example of Fund VIII and Fund IX
Sector Impact
Technology -9.20%
Health care -8.40%
Communication -8.2
Consumer discretionary -7.50%
Financials -6.50%
▪ With Democrats controlling the white house and congress,
there are concerns of increased regulation and taxes2
▪ Biden proposal: raise corporate tax rate from 21% to 28%
EXPECTED EARNINGS HIT FROM TAXES
▪ Investment Company Act: as a private equity firm, Apollo
qualifies for the 3C7 exemption:
▪ Allows them more freedom to take on leverage
▪ If they were to lose this exemption status, the
increased restrictions could impact revenues3
Notes: Information as of November 30, 2020.
Source:
1. Annual Report, 2. CNBC, 3. Investopedia, 4.Bloomberg
▪ Increased market volatility could impact the value of Apollo’s
private equity, and credit holdings
▪ During COVID-19 pandemic4:
▪ Private equity holdings declined 22%
▪ Athene holdings declined 47%
APOLLO SHARE PRICE ADVERSELY AFFECTED
WITH INCREASED VOLATILITY2
▪ Clawback:
▪ Performance fees that may need to be repaid
▪ Future losses can result in unjustified performance
fees

APPENDIX – GOVERNANCE
Leon BlackFounder
CEO
Josh HarrisCo-Founder
Marc RowanCo-Founder
Managing Director
James ZelterCo-President
CIO, Credit
Experience as an
entrepreneur, running
seven different
companies. Former
employee of Drexel
Durham. Leader at
Apollo for 31 years.
Founded five different
companies. Sits on the
board of 11 other
companies. Member of
Apollo’s board for 31
years.
Co-founder of Apollo
and held a seat on the
board of directors for 31
years. Board member of
16 other companies.
Also holds a leadership
role in the Youth
Renewal Fund.
Held a leadership
position at Apollo for
15 years. Prior CIO to
Citigroup Alternative
Investments and a
trader at Goldman
Sachs.
Notes: Information as of November 30, 2020.
Source: FactSet, Apollo Website