apollo global management, llc reports first quarter 2018...
TRANSCRIPT

Apollo Global Management, LLC Reports First Quarter 2018 Results
New York, May 3, 2018 — Apollo Global Management, LLC (NYSE:APO) (together with its consolidated subsidiaries, “Apollo”) today reported results for the firstquarter ended March 31, 2018.
“Despite some volatility in Apollo’s first quarter results, primarily driven by unrealized losses in our private equity business, we believe Apollo is exceptionally well-positionedfor continued long-term growth and profitability across our integrated global investment platform,” said Leon Black, Chairman and Chief Executive Officer. “Over thepast twelve months, we generated nearly $30 billion of net inflows in the fee-generating assets we manage, led by the recent commencement of the investment period forour latest flagship private equity fund, Apollo Investment Fund IX, the largest dedicated private equity fund ever raised.”
Apollo issued a full detailed presentation of its first quarter ended March 31, 2018 results, which can be viewed through the Shareholders section of Apollo’s website athttp://www.apollo.com/shareholders.
Distributions
Apollo has declared a cash distribution of $0.38 per Class A share for the first quarter ended March 31, 2018. This distribution will be paid on May 31, 2018 to holders ofrecord at the close of business on May 18, 2018. Apollo intends to distribute to its shareholders on a quarterly basis substantially all of its distributable earnings after taxesand related payables in excess of amounts determined by its manager to be necessary or appropriate to provide for the conduct of its business.
On March 19, 2018, Apollo issued 12,000,000 6.375% Series B Preferred shares at $25.00 per share. Distributions on the Series B Preferred shares, when and if declaredby the manager of Apollo, will be payable quarterly on March 15, June 15, September 15 and December 15 of each year, beginning on June 15, 2018. Distributions on theSeries B Preferred shares are non-cumulative.
Apollo has declared a cash distribution of $0.398438 and $0.380729 per Series A and Series B Preferred share, respectively, which will be paid on June 15, 2018 to holdersof record at the close of business on June 1, 2018. The first distribution on Series B Preferred shares is calculated based on the date of the original issuance.
The declaration and payment of distributions on Class A shares, Series A Preferred or Series B Preferred shares are at the sole discretion of Apollo’s manager. Apollocannot assure its shareholders that they will receive any distributions in the future.
Revenue Recognition: New U.S. GAAP Guidance
Effective January 1, 2018, Apollo adopted new U.S. GAAP revenue recognition guidance and implemented a change in accounting principle related to performance allocations(commonly known as “carried interest income” or “performance fees”). The new guidance resulted in immaterial changes to the recognition of incentive fees on a GAAPand Non-GAAP basis and resulted in incentive fees being presented separately in the results. Apollo adopted the new revenue guidance on a modified retrospective basis.In connection with the change in accounting principle, Apollo now accounts for performance allocations under the U.S. GAAP guidance for equity method investments,and presents performance allocations as a component of investment income along with the related principal investment income (loss). All prior periods have been conformedfor this change in accounting principle.
Conference Call
Apollo will host a conference call on Thursday, May 3, 2018 at 10:00 a.m. Eastern Time. During the call, members of Apollo’s senior management team will review Apollo’sfinancial results for the first quarter ended March 31, 2018. The conference call may be accessed by dialing (888) 868-4188 (U.S. domestic) or +1 (615) 800-6914 (international),and providing conference call ID 8483879 when prompted by the operator. The number should be dialed at least ten minutes prior to the start of the call. A simultaneouswebcast of the conference call will be available to the public on a listen-only basis and can be accessed through the Shareholders section of Apollo’s website at http://www.apollo.com/shareholders.

Following the call, a replay of the event may be accessed either telephonically or via audio webcast. A telephonic replay of the live broadcast will be available approximatelytwo hours after the live broadcast by dialing (800) 585-8367 (U.S. callers) or +1 (404) 537-3406 (non-U.S. callers), passcode 8483879. To access the audio webcast, pleasevisit Events in the Shareholders section of Apollo’s website at http://www.apollo.com/shareholders.
About Apollo
Apollo is a leading global alternative investment manager with offices in New York, Los Angeles, Houston, Chicago, St. Louis, Bethesda, Toronto, London, Frankfurt,Madrid, Luxembourg, Mumbai, Delhi, Singapore, Hong Kong and Shanghai. Apollo had assets under management of approximately $247 billion as of March 31, 2018 inprivate equity, credit and real assets funds invested across a core group of nine industries where Apollo has considerable knowledge and resources. For more informationabout Apollo, please visit www.apollo.com.
Forward-Looking Statements
In this press release, references to “Apollo,” “we,” “us,” “our” and the “Company” refer collectively to Apollo Global Management, LLC, together with its consolidatedsubsidiaries. This press release may contain forward looking statements that are within the meaning of Section 27A of the Securities Act of 1933, as amended, and Section21E of the Securities Exchange Act of 1934, as amended. These statements include, but are not limited to, discussions related to Apollo’s expectations regarding theperformance of its business, its liquidity and capital resources and the other non-historical statements in the discussion and analysis. These forward-looking statements arebased on management’s beliefs, as well as assumptions made by, and information currently available to, management. When used in this press release, the words “believe,”“anticipate,” “estimate,” “expect,” “intend” and similar expressions are intended to identify forward-looking statements. Although management believes that the expectationsreflected in these forward looking statements are reasonable, it can give no assurance that these expectations will prove to have been correct. These statements are subjectto certain risks, uncertainties and assumptions, including risks relating to our dependence on certain key personnel, our ability to raise new private equity, credit or real assetsfunds, market conditions, generally, our ability to manage our growth, fund performance, changes in our regulatory environment and tax status, the variability of ourrevenues, net income and cash flow, our use of leverage to finance our businesses and investments by our funds and litigation risks, among others. We believe these factorsinclude but are not limited to those described under the section entitled “Risk Factors” in Apollo’s annual report on Form 10-K filed with the Securities and ExchangeCommission (the “SEC”) on February 12, 2018, as such factors may be updated from time to time in our periodic filings with the SEC, which are accessible on the SEC’swebsite at www.sec.gov. These factors should not be construed as exhaustive and should be read in conjunction with the other cautionary statements that are included inthis press release and in other filings. We undertake no obligation to publicly update or review any forward-looking statements, whether as a result of new information,future developments or otherwise, except as required by applicable law. This press release does not constitute an offer of any Apollo fund.
Investor and Media Relations Contacts
Gary M. SteinHead of Corporate CommunicationsApollo Global Management, [email protected]
Noah GunnInvestor Relations ManagerApollo Global Management, [email protected]
Charles ZehrenRubenstein Associates, Inc. forApollo Global Management, [email protected]
2

A P O L L O G L O B A L M A N A G E M E N T
Apollo Global Management, LLCFirst Quarter 2018 Earnings
Exhibit 99.2
May 3, 2018

($ in millions, except per share data) 1Q’18 Per Share LTM1 Per Share• Economic Net Income (Loss) (“ENI”) ($121.0) ($0.30) $984.5 $2.44• Fee Related Earnings (“FRE”) $132.9 $0.32 $622.8 $1.51• Distributable Earnings (“DE”) After Taxes and Related Payables $191.2 $0.46 $928.0 $2.25•
Assets UnderManagement
Apollo 1Q'18 Financial Results Highlights
BusinessDrivers
• Total Assets Under Management (“AUM”) of $247.4 billion
• Fee-Generating AUM (“FGAUM”) of $182.5 billion
• Performance Fee-Eligible AUM (“PFEAUM”) of $118.4 billion and Performance Fee-Generating AUM(“PFGAUM”) of $56.6 billion
• Dry Powder of $46.5 billion available for investment
• Inflows: $4.9 billion of capital inflows ($56.1 billion LTM)
• Deployment: $3.0 billion invested ($14.4 billion LTM)
• Realizations: $4.1 billion of capital returned to investors ($13.1 billion LTM)
• Performance: Credit Gross Return2 +1.3% (+7.7% LTM)
Private Equity Fund Depreciation 2.7% (+16.1% LTM)
Note: This presentation contains non-GAAP financial information and defined terms which are described on pages 34 to 37. The non-GAAP financial information contained herein is reconciled to GAAP financial information on pages 5, 21and 26.1) “LTM” refers to the last twelve months ended March 31, 2018. 2) Represents total Credit gross return, excluding assets managed by Athene Asset Management, LLC (“AAM”) that are not directly invested in Apollo funds or sub-advised by Apollo. Total Credit net return was 1.1% for 1Q'18 and 6.5% for
LTM.
1
Non-GAAPMeasures
& Distribution
GAAPResults
• Net Loss of $109.3 million
• Net Loss Attributable to Apollo Global Management, LLC of $62.6 million ($0.34/share)
Declared 1Q'18 distribution of $0.38 per Class A share and equivalent (payout ratio of 83%), bringing LTMdistributions to $1.95 per Class A share (payout ratio of 87%)

($ in thousands, except share data) 1Q'17 4Q'17 1Q'18Revenues:
Management fees $269,543 $302,634 $286,726Advisory and transaction fees, net 15,067 62,719 13,551Investment income (loss):
Performance allocations 352,593 496,297 (124,165)Principal investment income (loss) 38,553 58,753 (12,994)
Total Investment Income (Loss) 391,146 555,050 (137,159)Incentive fees 6,348 7,868 3,785
Total Revenues 682,104 928,271 166,903Expenses:
Compensation and benefits:Salary, bonus and benefits 101,613 112,871 115,826Equity-based compensation 23,107 21,118 35,525Profit sharing expense 144,324 175,394 (12,277)
Total Compensation and Benefits 269,044 309,383 139,074Interest expense 12,999 13,376 13,797General, administrative and other 62,040 67,940 61,677Placement fees 1,905 1,353 327
Total Expenses 345,988 392,052 214,875Other Income (Loss):
Net gains (losses) from investment activities 34,517 (7,832) (67,133)Net gains (losses) from investment activities of consolidated variable interest entities 4,108 (420) 6,532Interest income 803 3,492 3,559Other income, net 18,647 200,864 4,246
Total Other Income (Loss) 58,075 196,104 (52,796)Income (loss) before income tax provision 394,191 732,323 (100,768)Income tax provision (39,161) (271,019) (8,580)
Net Income (Loss) 355,030 461,304 (109,348)Net (income) loss attributable to Non-Controlling Interests (209,834) (272,028) 51,086
Net Income (Loss) Attributable to Apollo Global Management, LLC 145,196 189,276 (58,262)Net income attributable to Series A Preferred Shareholders — (4,383) (4,383)
Net Income (Loss) Attributable to Apollo Global Management, LLC Class A Shareholders $145,196 $184,893 ($62,645)Distributions Declared and Paid per Class A Share $0.45 $0.39 $0.66
Net Income Per Class A Share:Net Income (Loss) Available to Class A Share – Basic $0.75 $0.92 ($0.34)Net Income (Loss) Available to Class A Share – Diluted $0.75 $0.92 ($0.34)Weighted Average Number of Class A Shares Outstanding – Basic 186,537,367 193,609,614 198,432,603Weighted Average Number of Class A Shares Outstanding – Diluted 186,537,367 193,609,614 198,432,603
GAAP Consolidated Statements of Operations (Unaudited)
2
• Net Loss was $109.3 million for the quarter ended March 31, 2018; Net Loss Attributable to Apollo GlobalManagement, LLC (Class A shares) was $62.6 million for the quarter

($ in thousands, except share data) As of March 31, 2018
As of December 31, 2017
Assets:Cash and cash equivalents $988,284 $751,252Cash and cash equivalents held at consolidated funds 3 21Restricted cash 3,902 3,875U.S. Treasury securities, at fair value 225,510 364,649Investments (includes performance allocations of $1,396,075 and $1,828,930 as of March 31, 2018 and December 31, 2017, respectively) 3,198,685 3,559,834Assets of consolidated variable interest entities 1,499,872 1,328,586Incentive fees receivable 7,891 43,176Due from related parties 328,902 262,588Deferred tax assets 380,565 337,638Other assets 208,170 231,757Goodwill 88,852 88,852Intangible assets, net 17,861 18,842
Total Assets $6,948,497 $6,991,070Liabilities and Shareholders’ EquityLiabilities:
Accounts payable and accrued expenses $81,548 $68,873Accrued compensation and benefits 60,489 62,474Deferred revenue 145,282 128,146Due to related parties 481,484 428,013Profit sharing payable 644,883 752,276Debt 1,361,711 1,362,402Liabilities of consolidated variable interest entities 1,126,147 1,117,721Other liabilities 140,197 173,369
Total Liabilities 4,041,741 4,093,274Shareholders’ Equity:
Apollo Global Management, LLC shareholders’ equity:Series A Preferred shares, 11,000,000 and 11,000,000 shares issued and outstanding as of March 31, 2018 and December 31, 2017,respectively 264,398 264,398
Series B Preferred shares, 12,000,000 and 0 shares issued and outstanding as of March 31, 2018 and December 31, 2017, respectively 289,815 —Class A shares, no par value, unlimited shares authorized, 201,550,654 and 195,267,669 shares issued and outstanding at March 31,2018 and December 31, 2017, respectively — —
Class B shares, no par value, unlimited shares authorized, 1 share issued and outstanding at March 31, 2018 and December 31, 2017 — —Additional paid in capital 1,483,244 1,579,797Accumulated deficit (481,772) (379,460)Accumulated other comprehensive loss (815) (1,809)
Total Apollo Global Management, LLC shareholders’ equity 1,554,870 1,462,926Non-Controlling Interests in consolidated entities 290,857 140,086Non-Controlling Interests in Apollo Operating Group 1,061,029 1,294,784Total Shareholders’ Equity 2,906,756 2,897,796
Total Liabilities and Shareholders’ Equity $6,948,497 $6,991,070
GAAP Consolidated Statements of Financial Condition (Unaudited)
3

($ in thousands, except per share data) 1Q'17 4Q'17 1Q'18 1Q’17 LTM 1Q’18 LTMManagement Fees $252,053 $280,920 $272,203 $998,769 $1,102,465Advisory and Transaction Fees, Net 15,067 62,719 12,994 154,183 115,551Performance Fees1 359,006 503,744 (122,964) 1,265,860 855,620Principal Investment Income (Loss)1 39,214 58,504 (12,604) 145,654 111,133
Total Segment Revenues 665,340 905,887 149,629 2,564,466 2,184,769Salary, Bonus and Benefits 94,721 99,867 106,531 369,241 405,965Equity-Based Compensation 16,745 16,505 17,358 64,493 68,487Profit Sharing Expense 148,275 171,496 1,900 498,418 362,842Other Expenses 55,836 61,398 54,702 244,697 241,358
Total Segment Expenses 315,577 349,266 180,491 1,176,849 1,078,652Segment Other Income (Loss) Net of Non-Controlling Interests 40,232 (17,755) (74,033) 196,535 (23,058)Economic Income (Loss)2 $389,995 $538,866 ($104,895) $1,584,152 $1,083,059
Taxes (58,372) (44,155) (11,736) (232,820) (80,644)Preferred Distributions — (4,383) (4,383) — (17,921)
Economic Net Income (Loss) $331,623 $490,328 ($121,014) $1,351,332 $984,494Per Share $0.82 $1.22 ($0.30) $3.36 $2.44
Fee Related Earnings $134,475 $187,285 $132,899 $565,545 $622,837Per Share3 $0.33 $0.46 $0.32 $1.38 $1.51
Distributable Earnings $239,605 $327,560 $206,753 $782,782 $977,150Taxes and Related Payables4 (6,348) (5,993) (11,198) (13,710) (31,187)Preferred Distributions — (4,383) (4,383) — (17,921)Distributable Earnings After Taxes and Related Payables $233,257 $317,184 $191,172 $769,072 $928,042Per Share of Common & Equivalent3 $0.57 $0.77 $0.46 $1.88 $2.25Net Distribution per Share of Common & Equivalent3 $0.49 $0.66 $0.38 $1.66 $1.95Payout Ratio 86% 86% 83% 88% 87%
Summary of Non-GAAP Measures
4
1) Performance fees includes performance allocations and incentive fees. Principal investment income (loss) was formerly referred to as income (loss) from equity method investments within Other income (loss).2) 1Q’18 LTM includes $19.0 million in proceeds received in connection with the Company’s early termination of a lease. 1Q’17 and 1Q’17 LTM includes $17.5 million in insurance proceeds received in connection with fees and expenses
relating to a legal proceeding. The lease termination and insurance proceeds were recorded in Other income (loss).3) Per share calculations are based on end of period Distributable Earnings Shares Outstanding, which consist of total Class A shares outstanding, Apollo Operating Group Units and RSUs that participate in distributions (collectively
referred to as “common & equivalents”). See page 28 for details regarding the shareholder distribution and page 29 for the share reconciliation.4) Represents the estimated current corporate, local and non-U.S. taxes as well as the payable under Apollo’s tax receivable agreement. DE After Taxes and Related Payables is calculated after current taxes and the impact of the tax
receivable agreement (“TRA”). The TRA component of taxes used in calculating DE After Taxes was previously estimated based on the tax asset used to reduce the prior year’s tax liability. In 2018, the DE effective tax rate, using thisestimation methodology, results in an increase in the tax rate despite the significantly reduced federal tax rate under tax reform. We believe it is more meaningful to estimate the current year impact of the TRA component of taxeswhen calculating DE After Taxes. The impact of this change is not significant to DE After Taxes and Related Payables as previously reported. DE After Taxes and Related Payables would have been $225.2 million, $308.8 million, $747.6million and $903.7 million in 1Q'17, 4Q'17, LTM’17 and LTM’18, respectively.

($ in thousands) 1Q'17 2Q'17 3Q'17 4Q'17 1Q'18 1Q’17 LTM 1Q’18 LTMGAAP Net Income (Loss) Attributable to Apollo Global Management, LLC Class AShareholders $145,196 $86,908 $198,569 $184,893 ($62,645) $580,874 $407,725
Preferred distributions — 4,772 4,383 4,383 4,383 — 17,921Net income (loss) attributable to Non-Controlling Interests in consolidated entities 3,384 4,535 1,048 (76) 5,979 7,138 11,486Net income (loss) attributable to Non-Controlling Interests in the Apollo Operating Group 206,450 96,727 230,363 272,104 (57,065) 811,886 542,129
GAAP Net Income (Loss) $355,030 $192,942 $434,363 $461,304 ($109,348) $1,399,898 $979,261
Income tax provision (benefit) 39,161 (777) 16,542 271,019 8,580 135,015 295,364
GAAP Income (Loss) Before Income Tax Provision (Benefit) $394,191 $192,165 $450,905 $732,323 ($100,768) $1,534,913 $1,274,625
Transaction related charges and equity-based compensation1 (812) 3,087 8,514 6,707 1,852 56,377 20,160Gain from remeasurement of tax receivable agreement liability — — — (200,240) — — (200,240)Net (income) loss attributable to Non-Controlling Interests in consolidated entities (3,384) (4,535) (1,048) 76 (5,979) (7,138) (11,486)
Economic Income (Loss) $389,995 $190,717 $458,371 $538,866 ($104,895) $1,584,152 $1,083,059
Income tax provision on Economic Income (Loss) (58,372) (2,397) (22,356) (44,155) (11,736) (232,820) (80,644)Preferred distributions — (4,772) (4,383) (4,383) (4,383) — (17,921)
Economic Net Income (Loss) $331,623 $183,548 $431,632 $490,328 ($121,014) $1,351,332 $984,494
Preferred distributions — 4,772 4,383 4,383 4,383 — 17,921Income tax provision on Economic Income (Loss) 58,372 2,397 22,356 44,155 11,736 232,820 80,644Performance fees2 (358,280) (122,529) (340,401) (498,714) 128,239 (1,251,110) (833,405)Profit sharing expense 148,275 58,001 131,445 171,496 1,900 498,418 362,842Equity-based compensation 16,745 17,566 17,058 16,505 17,358 64,493 68,487Principal investment (income) loss (39,214) (17,219) (48,014) (58,504) 12,604 (145,654) (111,133)Net (gains) losses from investment activities (34,490) 399 (68,529) 7,846 67,137 (229,597) 6,853Net interest loss 11,988 12,067 11,509 9,420 9,941 44,116 42,937Other (544) 1,462 750 370 615 727 3,197
Fee Related Earnings $134,475 $140,464 $162,189 $187,285 $132,899 $565,545 $622,837
Realized performance fees3 185,735 193,054 54,802 197,768 122,302 396,675 567,926Realized profit sharing expense3 (88,723) (79,083) (35,673) (75,359) (63,647) (191,327) (253,762)Non-cash management fees (843) (842) (842) (842) (842) (3,370) (3,368)Realized principal investment income 18,436 13,658 10,339 25,809 23,393 51,267 73,199Net interest loss (11,988) (12,067) (11,509) (9,420) (9,941) (44,116) (42,937)Depreciation and amortization 2,513 2,522 5,825 2,319 2,589 9,860 13,255
Distributable Earnings $239,605 $257,706 $185,131 $327,560 $206,753 $782,782 $977,150
Taxes and related payables (6,348) (6,724) (7,272) (5,993) (11,198) (13,710) (31,187)Preferred distributions — (4,772) (4,383) (4,383) (4,383) — (17,921)
Distributable Earnings After Taxes and Related Payables $233,257 $246,210 $173,476 $317,184 $191,172 $769,072 $928,042
1) Transaction-related charges include equity-based compensation charges, the amortization of intangible assets, contingent consideration and certain other charges associated with acquisitions. Equity-based compensation adjustmentrepresents non-cash revenues and expenses related to equity awards granted by unconsolidated related parties to employees of Apollo.
2) Excludes performance fees from a publicly traded business development company we manage.3) 1Q’18 and 1Q’18 LTM excludes realized performance fees and realized profit sharing expense settled in the form of Athene shares, as well as profit sharing expense settled in the form of equity-based awards.
Reconciliation of GAAP to Non-GAAP Measures
5
1Q’18 Subtotal LTM 1Q’18 Subtotal
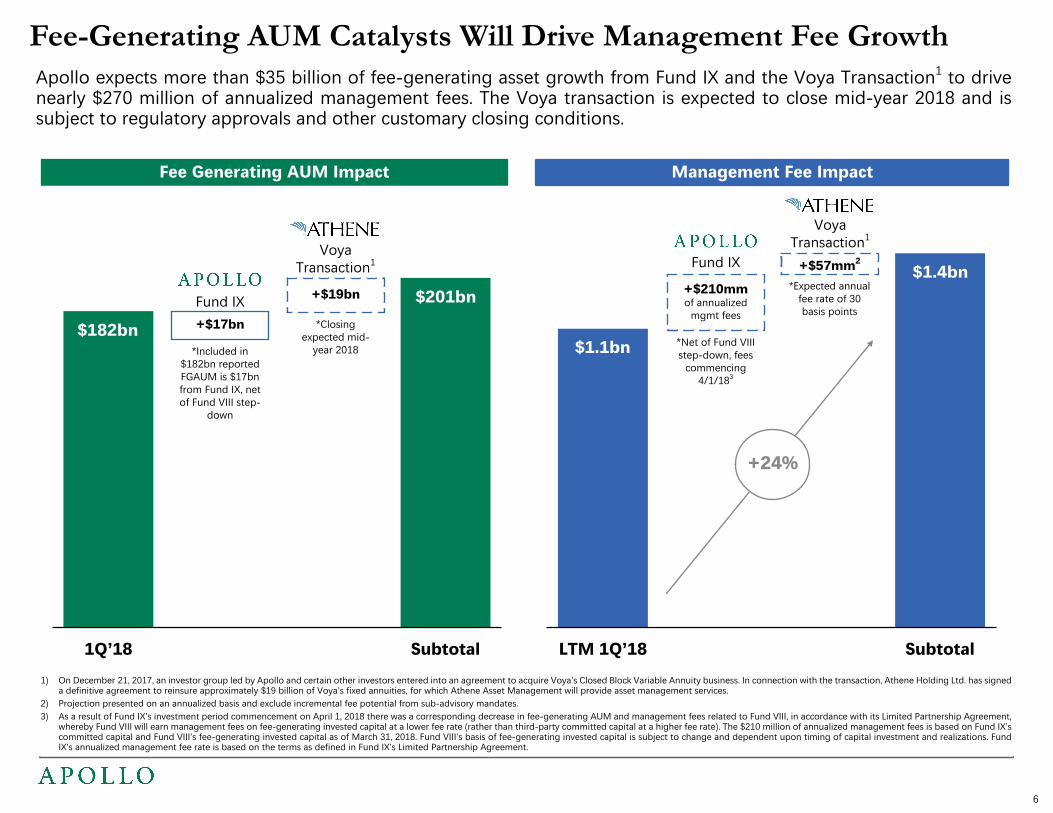
Fee-Generating AUM Catalysts Will Drive Management Fee Growth
Fee Generating AUM Impact Management Fee Impact
Apollo expects more than $35 billion of fee-generating asset growth from Fund IX and the Voya Transaction1 to drivenearly $270 million of annualized management fees. The Voya transaction is expected to close mid-year 2018 and issubject to regulatory approvals and other customary closing conditions.
1) On December 21, 2017, an investor group led by Apollo and certain other investors entered into an agreement to acquire Voya’s Closed Block Variable Annuity business. In connection with the transaction, Athene Holding Ltd. has signeda definitive agreement to reinsure approximately $19 billion of Voya’s fixed annuities, for which Athene Asset Management will provide asset management services.
2) Projection presented on an annualized basis and exclude incremental fee potential from sub-advisory mandates.3) As a result of Fund IX’s investment period commencement on April 1, 2018 there was a corresponding decrease in fee-generating AUM and management fees related to Fund VIII, in accordance with its Limited Partnership Agreement,
whereby Fund VIII will earn management fees on fee-generating invested capital at a lower fee rate (rather than third-party committed capital at a higher fee rate). The $210 million of annualized management fees is based on Fund IX’scommitted capital and Fund VIII’s fee-generating invested capital as of March 31, 2018. Fund VIII’s basis of fee-generating invested capital is subject to change and dependent upon timing of capital investment and realizations. FundIX’s annualized management fee rate is based on the terms as defined in Fund IX’s Limited Partnership Agreement.
$182bn
$201bn+$17bn
+$19bnFund IX
VoyaTransaction1
$1.1bn
$1.4bn
*Included in$182bn reportedFGAUM is $17bnfrom Fund IX, netof Fund VIII step-
down
*Closingexpected mid-
year 2018*Net of Fund VIIIstep-down, fees
commencing4/1/183
+$210mmof annualized
mgmt fees
+$57mm2Fund IX*Expected annual
fee rate of 30basis points
VoyaTransaction1
6
+24%

$187.3($8.7)
($49.7)
($6.7) $10.7
$132.9
Fee Related Earnings Growth Trajectory Expected To Continue In 2018
Fund IX Impact21Q'18 FRE RollforwardTrailing Fee Related Earnings
1) FRE margin is calculated from Fee Related Earnings divided by fee-related revenues (which includes management fees, transaction and advisory fees, carried interest from a publicly traded business development company management byApollo, as well as other income attributable to FRE).
2) As a result of Fund IX’s investment period commencement on April 1, 2018 there was a corresponding decrease in fee-generating AUM and management fees related to Fund VIII, in accordance with its Limited Partnership Agreement, wherebyFund VIII will earn management fees on fee-generating invested capital at a lower fee rate (rather than third-party committed capital at a higher fee rate). Fund IX impact of $50-$55 million is based on Fund IX’s committed capital and FundVIII’s fee-generating invested capital as of March 31, 2018. Fund VIII’s basis of fee-generating invested capital is subject to change and dependent upon timing of capital investment and realizations. Fund IX’s quarterly FRE impact is based onthe terms as defined in Fund IX’s Limited Partnership Agreement.
($ in millions)
The decline in FRE during 1Q'18 was driven by lower transaction and advisory fees, but the commencement of Fund IX’sinvestment period alone will drive growth in FRE beginning in 2Q’18
QuarterlyAverage
QuarterlyAverage
1Q'18
PerShare $0.26 $0.33 $0.33 $0.34 $0.40 $0.46 ($0.02) ($0.12) ($0.02) $0.03 $0.32 ~$0.13 ~$0.45
MgmtFees Transaction
Fees
Comp
Non-Compand Other
FRE Margin1
45%
7
$183-188
$50-55
Subtotal
•
2015 2016 1Q’17 2Q’17 3Q’17 4Q’17
$105.5
$132.5 $134.5$140.5
$162.2
42%
46% 47% 47% 49%54%

Commentary• Economic Income driven by Fee Related Earnings and performance fees, partially offset
by investment losses resulting from the depreciation of Athene (NYSE:ATH)
• Credit gross returns2 of 1.3% and 7.7% for the quarter and LTM, respectively, resultingfrom positive returns across fund categories, with particular strength in Drawdownfunds and Permanent Capital Vehicles
• Total Credit AUM rose 17% year-over-year to $165 billion and includes approximately$100 billion in Permanent Capital Vehicles
• In December 2017, Athene Holding (NYSE:ATH) announced the acquisition of the fixedannuity business of Voya Financial (NYSE:VOYA), which will add approximately $19billion of assets to Apollo’s Credit business upon closing, which is expected in mid-2018
• In April 2018, Athora announced the completion of the Aegon Ireland acquisition, andsubsequently, the sale of its offshore bond portfolio. Athora also announced theacquisition of Generali Belgium. The net effect of these transactions will addapproximately $6.5 billion of assets to Apollo’s Credit business upon closing, whichare expected in the second half of 2018
Business Drivers
Supplemental Information
1Q'18 LTM
Inflows $3.3bn $27.2bn
Deployment1 $909mm $6.2bn
Realizations $2.1bn $5.8bn
Performance2 1.3% 7.7%
Credit
($ in billions) $165 billion AUM
1) Reflects capital deployment activity from Drawdown fund strategies and SIAs that have a defined maturity date and excludes deployment from Liquid/Performing funds, Permanent Capital Vehicles and Advisory. 2) Represents gross returnas defined in the non-GAAP financial information and definitions section of this presentation with the exception of CLO assets in Liquid/Performing which are calculated based on gross return on invested assets, which excludes cash. The1Q'18 net returns for Liquid/Performing, Drawdown, MidCap, AINV, AFT, AIF combined and total Credit excluding Athene Non-Sub-Advised were 0.7%, 1.8%, 2.2%, and 1.1%, respectively. The LTM net returns for Liquid/Performing, Drawdown,MidCap, AINV, AFT, AIF combined and total Credit excluding Athene Non-Sub-Advised were 4.7%, 11.5%, 7.7% and 6.5%, respectively. 3) As of March 31, 2018, $7.7 billion of the performance-fee generating AUM is currently above its hurdlerate or preferred return, but in accordance with the adoption of the revenue recognition standard effective January 1, 2018, recognition of performance fees associated with such performance-fee generating AUM has been deferred to futureperiods when the fees are probable to not be significantly reversed. 4) Significant Drawdown funds and strategic investment accounts (“SIAs”) had inception-to-date (“ITD”) gross and net IRRs of 16.0% and 12.1%, respectively, as of March 31,2018. Significant Drawdown funds and SIAs include funds and SIAs with AUM greater than $200 million that did not predominantly invest in other Apollo funds or SIAs. 5) Athene Non-Sub-Advised and Athora Non Sub-Advised reflects totalcombined AUM of $86.6 billion less $19.5 billion of assets that were either sub-advised by Apollo or invested in funds and investment vehicles managed by Apollo included within other asset categories.
Category AUM FGAUM
PFEAUM
PFGAUM3
Gross Return2
1Q'18 LTM
Liquid/Performing $45 $37 $22 $13 0.8% 5.2%
Drawdown4 $28 $16 $22 $9 2.4% 14.0%
Permanent Capital Vehicles
MidCap, AINV, AFT, AIF $14 $12 $11 $9 3.2% 11.8%
Athene Non-Sub-Advised5 $60 $60 — —
Athora Non-Sub-Advised5 $7 $4 $2 —
Advisory $11 — — —
Total Credit $165 $129 $57 $31 1.3% 7.7%
Financial Results Summary($ in thousands) 1Q'17 4Q'17 1Q'18Management fees $158,342 $186,108 $183,070Advisory and transaction fees 2,556 20,249 2,348Performance fees 37,258 90,590 42,768Principal Investment Income 6,483 7,157 5,409
Segment Revenues 204,639 304,104 233,595Compensation and benefits 79,931 95,619 94,907Other expenses 33,860 41,117 33,411
Segment Expenses 113,791 136,736 128,318Other Income (Loss) 25,383 (10,812) (56,292)Non-Controlling Interest (934) (1,135) (1,215)Economic Income $115,297 $155,421 $47,770Fee Related Earnings $72,212 $111,211 $99,551
8

Commentary
Supplemental Information
Traditional PE FundsInception-to-date Gross / Net IRR
PE Portfolio Composition:
Public Equity Holdings Fund Shares Held (mm)
Caesars Entertainment (CZR)(5)
Fund VI 45.5
EP Energy (EPE) Fund VII & ANRP I 62.6
Exela Technologies (XELA) Fund VII 28.6
Norwegian (NCLH)(5) Fund VI & VII 25.5
Parsley Energy (PE) ANRP I & ANRP II 10.9
Presidio (PSDO) Fund VIII 57.8
Vistra Energy (VST) Fund VII & ANRP II 30.0
Warrior Met Coal (HCC) Fund VIII & ANRP I 5.3
Welspun Corp (WLCO IN) Fund VII & ANRP I 42.2
Business Drivers
Financial Results Summary($ in thousands) 1Q'17 4Q'17 1Q'18Management fees $77,398 $75,982 $71,160Advisory and transaction fees 11,772 42,417 10,598Performance fees 319,080 410,456 (166,193)Principal Investment Income (Loss) 31,728 50,425 (17,531)
Segment Revenues 439,978 579,280 (101,966)Compensation and benefits 168,832 177,898 18,843Other expenses 17,494 14,879 15,149
Segment Expenses 186,326 192,777 33,992Other Income (Loss) 16,944 (4,864) (15,553)Economic Income (Loss) $270,596 $381,639 ($151,511)
Fee Related Earnings $58,001 $74,043 $31,840
80% Private / 20% Public(6)(7)
InvestedAUM$32bn
DryPowder$34bn
Private Equity
$69 billion AUM
Committed $3bn2
1Q'18 LTM
Inflows $461mm $25.3bn
Deployment $1.3bn $4.8bn
Realizations $1.5bn $5.0bn
Performance1 (2.7%) 16.1%
39% / 25%
• Economic Loss driven by the reversal of unrealized performance feesresulting from depreciation in the fair value of the Private Equity portfolio,partially offset by positive Fee Related Earnings
• Private equity fund depreciation during the quarter of 2.7%1 was primarilydriven by publicly traded portfolio company holdings in Fund VIII
• Realization activity primarily driven by the partial sale of Vectra as well asshare sales of Norwegian Cruise Lines and Parsley Energy
• Deployed $1.3 billion and committed to invest an additional $1.9 billionduring the quarter; total committed but not yet deployed capital2 at quarterend was $3.1 billion (excluding co-investments) of which $2.0 billion relatedto energy asset build-ups expected to be deployed over time
• Fund IX commenced its investment period and began generatingmanagement fees on April 1, 2018
1) Represents private equity fund appreciation (depreciation) as defined in the non-GAAP financial information and definitions section of this presentation. 2) Represents capital committed to investments as of March 31, 2018 by Apollo’sprivate equity funds. These investments have not yet closed and may be subject to a variety of closing conditions or other contractual provisions, which could result in such capital not ultimately being invested. 3) Other represents approximately$3 billion of uncalled commitments which can be called for fund fees and expenses only and are not available for investment or reinvestment subject to the provisions of the applicable fund limited partnership agreements or other governingagreements. 4) Represents AUM related to co-investment vehicles.
Co-Investments$6bn4
Other $3bn3
9
PublicInvestments
28%
Private Investments72%
$16.2 billion Unrealized Value
by Investment Year
2013-14$1.7bn
2015$4.7bn
2016$5.9bn
2017-18$3.9bn
Unrealized Value by Sector
RealizedValue$0.7bn
UnrealizedValue$1.6bn
DryPowder$1.8bn
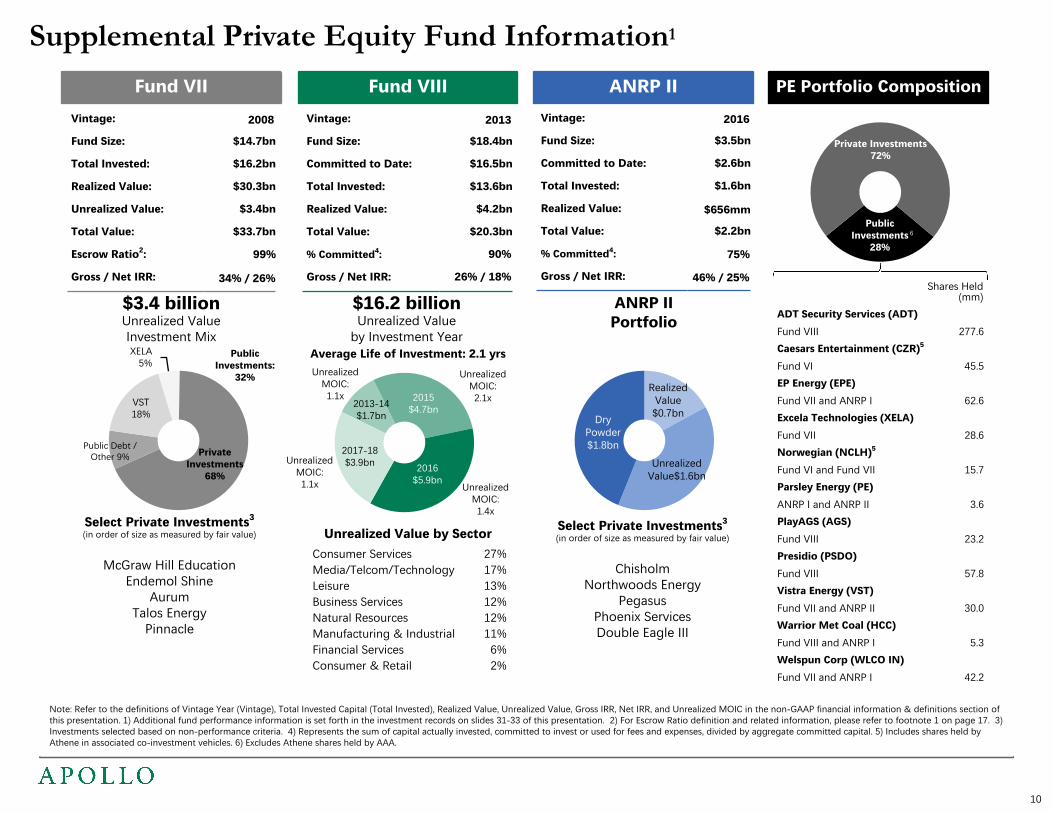
Supplemental Private Equity Fund Information1
Note: Refer to the definitions of Vintage Year (Vintage), Total Invested Capital (Total Invested), Realized Value, Unrealized Value, Gross IRR, Net IRR, and Unrealized MOIC in the non-GAAP financial information & definitions section ofthis presentation. 1) Additional fund performance information is set forth in the investment records on slides 31-33 of this presentation. 2) For Escrow Ratio definition and related information, please refer to footnote 1 on page 17. 3)Investments selected based on non-performance criteria. 4) Represents the sum of capital actually invested, committed to invest or used for fees and expenses, divided by aggregate committed capital. 5) Includes shares held byAthene in associated co-investment vehicles. 6) Excludes Athene shares held by AAA.
Fund VII
Select Private Investments3
(in order of size as measured by fair value)
McGraw Hill EducationEndemol Shine
AurumTalos Energy
Pinnacle
Vintage:
Fund Size: $14.7bn
Total Invested: $16.2bn
Realized Value: $30.3bn
Unrealized Value: $3.4bn
Total Value: $33.7bn
Escrow Ratio2:
Gross / Net IRR:
Fund VIIIVintage:
Fund Size: $18.4bn
Committed to Date: $16.5bn
Total Invested: $13.6bn
Realized Value: $4.2bn
Total Value: $20.3bn
% Committed4:
Gross / Net IRR:
ANRP II
Select Private Investments3
(in order of size as measured by fair value)
ChisholmNorthwoods Energy
PegasusPhoenix ServicesDouble Eagle III
Vintage:
Fund Size: $3.5bn
Committed to Date: $2.6bn
Total Invested: $1.6bn
Realized Value:
Total Value: $2.2bn
% Committed4:
Gross / Net IRR:
$3.4 billion Unrealized Value Investment Mix
ANRP IIPortfolio
Consumer Services 27%Media/Telcom/Technology 17%Leisure 13%Business Services 12%Natural Resources 12%Manufacturing & Industrial 11%Financial Services 6%Consumer & Retail 2%
XELA5%
PrivateInvestments
68%
Public Debt /Other 9%
VST18%
UnrealizedMOIC:2.1x
UnrealizedMOIC:1.1x
UnrealizedMOIC:1.4x
Average Life of Investment: 2.1 yrsPublicInvestments:
32%
UnrealizedMOIC:1.1x
2008
34% / 26%
2013
26% / 18%
2016
$656mm
46% / 25%
75%
10
PE Portfolio Composition
Shares Held(mm)
ADT Security Services (ADT)Fund VIII 277.6Caesars Entertainment (CZR)5
Fund VI 45.5EP Energy (EPE)Fund VII and ANRP I 62.6Excela Technologies (XELA)Fund VII 28.6Norwegian (NCLH)5
Fund VI and Fund VII 15.7Parsley Energy (PE)ANRP I and ANRP II 3.6PlayAGS (AGS)Fund VIII 23.2Presidio (PSDO)Fund VIII 57.8Vistra Energy (VST)Fund VII and ANRP II 30.0Warrior Met Coal (HCC)Fund VIII and ANRP I 5.3Welspun Corp (WLCO IN)Fund VII and ANRP I 42.2
6
90%99%

Commentary Business Drivers
Supplemental Information
1Q'18 LTM
Inflows $1.1bn $3.6bn
Deployment $835mm $3.5bn
Realizations $412mm $2.2bn
Performance1 1.9% 12.0%
$13 billion AUM
Equity$2.8bn
Debt$10.4bn
Real Assets
• Modest Economic Loss driven by lower performance fees and FeeRelated Earnings quarter-over-quarter
• U.S. real estate equity funds combined gross return1 of 1.9% in thefirst quarter, contributing to a strong LTM gross return of 12.0% drivenby appreciation in office and industrial assets
• Inflows driven by capital raised by the commercial mortgage REIT(NYSE:ARI), a strategic account allocation to the segment and the realestate debt managed accounts
• Deployment for the quarter driven by an increase in capitalinvestment for the real estate debt managed accounts and ARI
• Realization activity for the quarter driven by the debt managedaccounts
1) Represents combined gross return for U.S. Real Estate Fund I and U.S. Real Estate Fund II including co-investment capital. The 1Q'18 and LTM combined net returns for U.S. Real Estate Fund I and U.S. Real Estate Fund II were 1.6% and9.8%, respectively. U.S. Real Estate Fund I and U.S. Real Estate Fund II’s combined inception-to-date gross and net IRRs were 16.3% and 12.8%, respectively, as of March 31, 2018.
11
Financial Results Summary($ in thousands) 1Q'17 4Q'17 1Q'18Management fees $16,313 $18,830 $17,973Advisory and transaction fees 739 53 48Performance fees 2,668 2,698 461Principal Investment Income (Loss) 1,003 922 (482)
Segment Revenues 20,723 22,503 18,000Compensation and benefits 10,978 14,351 12,039Other expenses 4,482 5,402 6,142
Segment Expenses 15,460 19,753 18,181Other Loss (1,161) (944) (973)Economic Income (Loss) $4,102 $1,806 ($1,154)Fee Related Earnings $4,262 $2,031 $1,508

LTM Fee-Generating AUM Rollforward1LTM Total AUM Rollforward1
($ in millions) Credit Private Equity Real Assets Total1Q'17 $114,914 $30,774 $8,466 $154,154 Inflows 22,894 23,914 2,142 48,950 Outflows2 (8,579) (10,150) (417) (19,146)Net Flows 14,315 13,764 1,725 29,804 Realizations (2,966) (874) (1,178) (5,018) Market Activity 3,221 94 212 3,5271Q'18 $129,484 $43,758 $9,225 $182,467YoY Change 13% 42% 9% 18%
($ in millions) Credit Private Equity Real Assets Total1Q'17 $140,932 $44,573 $11,961 $197,466
Inflows 27,151 25,344 3,586 56,081Outflows2 (4,601) (193) (489) (5,283)
Net Flows 22,550 25,151 3,097 50,798Realizations (5,826) (5,032) (2,222) (13,080)Market Activity 7,609 4,257 366 12,232
1Q'18 $165,265 $68,949 $13,202 $247,416YoY Change 17% 55% 10% 25%
1) Inflows at the individual segment level represent subscriptions, commitments, and other increases in available capital, such as acquisitions or leverage, net of inter-segment transfers. Outflows represent redemptions and other decreasesin available capital. Realizations represent fund distributions of realized proceeds. Market activity represents gains (losses), the impact of foreign exchange rate fluctuations and other income.
2) Included in the 1Q'18 outflows for Total AUM and FGAUM are $184.2 million and $172.1 million of redemptions, respectively. Included in the LTM outflows for Total AUM and FGAUM are $942.3 million and $734.7 million of redemptions,respectively.
f
Total AUM & Fee-Generating AUM
Total AUM Highlights Fee-Generating AUM Highlights
1Q'18 Fee-Generating AUM Rollforward11Q'18 Total AUM Rollforward1
Inflows: Capital raised for co-investment ($111 million) Realizations: Fund VIII($718 million); and Fund VI ($480 million) Market Activity: Depreciation drivenby co-investment vehicles ($1.5 billion); and Fund VIII ($913 million)
Inflows: Athene ($1.7 billion); Liquid/Performing funds ($1.1 billion); andDrawdown funds ($320 million) Outflows: Advisory ($1.3 billion) Realizations:COF III ($434 million); FCI III ($270 million); Liquid/Performing funds ($855 million);and other Drawdown funds ($505 million) Market activity: Drawdown funds($566 million); Liquid/Performing funds ($398 million); and Advisory ($333 million)
Inflows: Real estate equity ($350 million); Real estate debt ($276 million); Netleverage increase ($321 million); and net segment transfers ($171 million)Realizations: AGRE Debt Fund I ($337 million)
PrivateEquity
Credit
Real Assets
Inflows: Fund IX investment period commencement ($23.5 billion), withassociated management fees accruing as of April 1, 2018 Outflows: Fee basisadjustment in Fund VIII from committed capital to fee-generating invested capitalrelated to Fund IX commencement ($6.7 billion); and Fund VI fee termination($2.8 billion)
Inflows: Athene ($1.7 billion); fee-generating deployment ($594 million); andLiquid/Performing funds ($555 million) Outflows: Net leverage decrease ($1.4billion); and net change in fee basis ($1.3 billion) Realizations: EPF II ($351million); and Liquid/Performing funds ($847 million) Market activity: Liquid/Performing funds ($340 million)
Inflows: Real estate debt ($222 million) Realizations: Real estate debt ($64million) Market Activity: Real estate debt ($52 million)
12
PrivateEquity
Credit
Real Assets
($ in millions) Credit Private Equity Real Assets Total
4Q'17 $164,113 $72,432 $12,383 $248,928Inflows 3,295 461 1,118 4,874Outflows2 (1,569) (180) — (1,749)
Net Flows 1,726 281 1,118 3,125Realizations (2,144) (1,513) (412) (4,069)Market Activity 1,570 (2,251) 113 (568)
1Q'18 $165,265 $68,949 $13,202 $247,416QoQ Change 1% (5%) 7% (1%)
($ in millions) Credit Private Equity Real Assets Total
4Q'17 $130,150 $29,792 $9,023 $168,965Inflows 3,027 23,518 239 26,784Outflows2 (3,100) (9,560) — (12,660)
Net Flows (73) 13,958 239 14,124Realizations (1,256) — (94) (1,350)Market Activity 663 8 57 728
1Q'18 $129,484 $43,758 $9,225 $182,467QoQ Change (1%) 47% 2% 8%

$46.6bn
$56.6bn
$15.2bn
($ in billions)
Category / FundInvested AUMNot Currently Generating
Performance Fees
InvestmentPeriod Active>24 Months2
Appreciation Required to
Achieve PerformanceFees3,4
Drawdown $3.6 $3.2 40%
Liquid/Performing3.3 < 250bps
8.3 0.1 250-500bps0.4 > 500bps
MidCap, AINV, AFT,AIF 1.2 0.8 < 250bps
Credit 13.1 7.8 18%
ANRP I 0.7 0.7 2%Other PE 0.9 0.9 11%Private Equity 1.6 1.6 7%
Real Assets 0.5 0.3 > 250bps Total $15.2 $9.7
Performance Fee-Eligible & Performance Fee-Generating AUM
($ in millions)
Segment 1Q'17 4Q'17 1Q'18
Credit $51,425 $55,322 $57,244
Private Equity 36,134 60,681 58,720
Real Assets 2,282 2,054 2,421
Total $89,841 $118,057 $118,385
($ in millions)
Segment 1Q'17 4Q'17 1Q'18
Credit1 $27,752 $25,814 $31,237
Private Equity 23,964 26,775 24,707
Real Assets 837 694 645
Total $52,553 $53,283 $56,589
1Q'18 Performance Fee-Generating to Performance Fee-Eligible AUM Reconciliation
Performance Fee-Eligible AUM
Performance Fee-Generating AUM
1) As of March 31, 2018, $7.7 billion of the performance-fee generating AUM is currently above its hurdle rate or preferred return, but in accordance with the adoption of the revenue recognition standard effective January 1, 2018, recognitionof performance fees associated with such performance-fee generating AUM has been deferred to future periods when the fees are probable to not be significantly reversed. 2) Represents invested AUM not currently generating performancefees for funds that have been investing capital for more than 24 months as of March 31, 2018. 3) Represents the percentage of additional appreciation required to reach the preferred return or high watermark and generate performancefees for funds with an investment period greater than 24 months. 4) All investors in a given fund are considered in aggregate when calculating the appreciation required to achieve performance fees presented above. Appreciation requiredto achieve performance fees may vary by individual investor.
13
UninvestedPerformanceFee-Eligible
AUM
CurrentlyGenerating
PerformanceFees
Not CurrentlyGenerating
Performance Fees
$118 billion Performance Fee-Eligible AUM
($ in millions)
Credit Private Equity Real Assets TotalPerformance Fee-Generating AUM $31,237 $24,707 $645 $56,589
+ Uninvested PFE AUM 12,910 32,461 1,271 46,642+ Invested AUM Not
Currently GeneratingPerformance Fees
13,097 1,552 505 15,154
Performance Fee-Eligible AUM $57,244 $58,720 $2,421 $118,385

Capital Deployment Dry Powder Composition
Fund IX$24.7
Other PE$3.7
Drawdown$10.4
Capital Deployment & Dry Powder
($ in billions)($ in millions)
Segment 1Q'18 LTMCredit1 $909 $6,194
Private Equity 1,294 4,759
Real Assets 835 3,474
Total $3,038 $14,427
RealAssets$1.3
PrivateEquity$33.6
Credit$11.6
Liquid/Performing
$1.0
• Capital deployed in drawdown style funds and accounts across Apollo’s global integrated investmentplatform totaled $3.0 billion for the quarter and $14.4 billion over the twelve months ended March 31, 2018
• Dry Powder of $46.5 billion at the end of the quarter, including $17.7 billion of AUM with futuremanagement fee potential
PermanentCapital
Vehicles $0.2
14
Fund VIII$5.2
1) Reflects capital deployment activity from Drawdown fund strategies and SIAs that have a defined maturity date and excludes deployment from Liquid/Performing funds, Permanent Capital Vehicles and Advisory.
CreditDriven by investments in structured credit, longevity assets,European non-performing loans and opportunisticinvestments in the healthcare, financials, and energy sectors
Private Equity Driven by an investment in Northwoods Energy andacquisitions of Phoenix Services and Qdoba
Real Assets Driven by commercial mortgage lending activity acrossseveral strategies
$47billion1Q'18 Highlights

Segment Balance Sheet Highlights
Summary BalanceSheet
1) Unfunded general partner commitments related to Fund IX are subject to future syndication to Apollo employees. 2) Amounts are presented on an unconsolidated basis. 3) Profit sharing payable excludes profit sharing expected to besettled in the form of equity-based awards. 4) Represents Apollo’s general partner investments in the funds it manages (excluding AAA) and other balance sheet investments. 5) Investment in Athene/AAA primarily comprises Apollo’s directinvestment of 19.2 million shares (subject to a discount due to a lack of marketability, as applicable) of Athene valued at a weighted average of $46.08 per share and 1.6 million shares of AAA valued at NAV. 6) Represents a reduction in ClassA shares to be issued to employees to satisfy associated tax obligations in connection with the settlement of equity-based awards granted under the Company’s 2007 Omnibus Equity Incentive Plan (the “Plan”), which the Company refers toas “net share settlement.” 7) In February 2016, the Company announced a plan to repurchase up to $250 million in the aggregate of its Class A shares, which includes up to $150 million through a share repurchase program and up to $100million through net share settlement of equity-based awards granted under the Plan. The Company intends to continue the net share settlement program in excess of the $100 million pursuant to the repurchase plan adopted in February2016. 8) Average price paid per share reflects total capital used for share repurchases to date divided by the number of shares purchased.
• At March 31, 2018, Apollo had $1.2 billion in cash and cash equivalents and U.S. Treasury securities, at fair value,$756 million of net performance fees receivable, $1.0 billion of GP & other investments and an $884 millioninvestment in Athene and AAA, for a total net value of $3.9 billion
• Long-term debt of $1.4 billion (with maturities in 2024, 2026 and 2048) and an undrawn $500 million revolvingcredit facility (expiring in 2021)
• Unfunded general partner commitments totaled $1.6 billion at March 31, 2018, of which $823 million relatedto Fund IX1
• Apollo received 2.6 million shares of Athene (NYSE: ATH) from AAA as part of the 15 month Athene share unlockrelease, resulting in net realized performance fees of $123.3 million during the quarter
15
($ in millions) 1Q'18
Cash and cash equivalents $988
U.S. Treasury securities, atfair value 226
Investments(2) 1,401
Net Carried InterestReceivable(2) (645)
Total Net Value $1,007
Debt $884
Unfunded FutureCommitments $1,594
Share Repurchase Activity - 1Q'16 through 1Q'18
($ and share amounts in millions) Inception toDate
Open Market Share Repurchases 2.0
Reduction of Shares Issued to Employees6 4.9
Total Shares Purchased 6.9
Total Capital Used for Share Purchases $150
Share Repurchase Plan Authorization7 $250
Average Price Paid Per Share8 $21.71
Summary Balance Sheet2
($ in millions) 1Q'18
Cash and cash equivalents $988
U.S. Treasury securities, at fair value 226
Performance fees receivable 1,401
Profit sharing payable3 (645)
GP & Other Investments4 1,007
Athene/AAA5 884
Total Net Value $3,861
Debt ($1,362)
Unfunded Future Commitments $1,594
($0.30)
($0.16) $1.83$0.16
$1.99
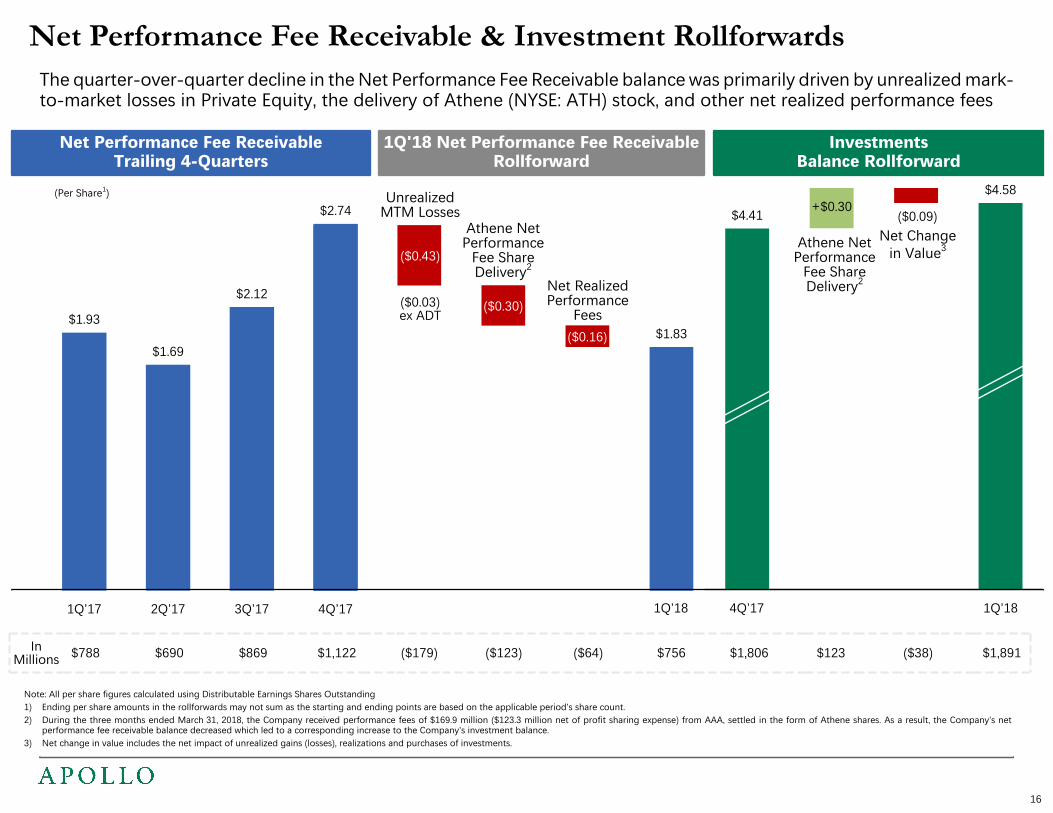
Net Performance Fee Receivable & Investment RollforwardsThe quarter-over-quarter decline in the Net Performance Fee Receivable balance was primarily driven by unrealized mark-to-market losses in Private Equity, the delivery of Athene (NYSE: ATH) stock, and other net realized performance fees
Note: All per share figures calculated using Distributable Earnings Shares Outstanding 1) Ending per share amounts in the rollforwards may not sum as the starting and ending points are based on the applicable period’s share count. 2) During the three months ended March 31, 2018, the Company received performance fees of $169.9 million ($123.3 million net of profit sharing expense) from AAA, settled in the form of Athene shares. As a result, the Company’s net
performance fee receivable balance decreased which led to a corresponding increase to the Company’s investment balance. 3) Net change in value includes the net impact of unrealized gains (losses), realizations and purchases of investments.
1Q’17 2Q’17 3Q’17 4Q’17
$1.93
$1.69
$2.12
$2.74 Company Price Return
ADT Security Services (ADT) +18 %
Caesars Entertainment (CZR) +4 %
EP Energy (EPE) +30 %
Excela Technologies (XELA) (17)%
Norwegian (NCLH) +4 %
Parsley Energy (PE) +5 %
PlayAGS (AGS) (3)%
Presidio (PSDO) +3 %
Vistra Energy (VST) +6 %
Warrior Met Coal (HCC) (14)%
Welspun Corp (WLCO LN) +13 %
Total +8 %
InMillions $788 $690 $869 $1,122 ($179) ($123) ($64) $756 $1,806 $123 ($38) $1,891
Net Performance Fee Receivable Trailing 4-Quarters
1Q'18 Net Performance Fee ReceivableRollforward Pro-Forma 2QTD Public PE Marks
1Q’18
(Per Share1) UnrealizedMTM Losses
Athene NetPerformance
Fee ShareDelivery2
2QTDUnrealizedMTM Gains
*Public PEInvestments
Only
2QTDPro-Forma
($0.03)ex ADT
Investments Balance Rollforward
$4.41 +$0.30$4.58
16
Athene NetPerformance
Fee ShareDelivery2Net Realized
PerformanceFees
1Q’184Q’17
($0.09)
($0.43)Net Change
in Value3

1) As of March 31, 2018, the remaining investments and escrow cash of Fund VII, Fund VI, and ANRP II were valued at 99%, 92%, and 108% of the fund’s unreturned capital, respectively, which were below the required escrow ratio of 115%.As a result, these funds are required to place in escrow current and future performance fees distributions to the general partner until the specified return ratio of 115% is met (at the time of a future distribution) or upon liquidation. Asof March 31, 2018, Fund VII had $114.5 million of gross performance fees, or $65.2 million net of profit sharing, in escrow. As of March 31, 2018, Fund VI had $167.6 million of gross performance fees, or $112.4 million net of profit sharing,in escrow. As of March 31, 2018, ANRP II had $10.7 million of gross performance fees, or $6.5 million net of profit sharing, in escrow. With respect to Fund VII, Fund VI, and ANRP II, realized performance fees currently distributed to thegeneral partner is limited to potential tax distributions per the fund’s partnership agreement.
2) Includes realized performance fees of $169.9 million ($123.3 million net of profit sharing expense) from AAA, settled in the form of Athene shares. Other includes certain SIAs.3) As of March 31, 2018, certain credit funds and certain private equity funds had $55.8 million and $41.5 million, respectively, in general partner obligations to return previously distributed performance fees. The fair value gain on investments
and income at the fund level needed to reverse the general partner obligations for certain credit funds and certain private equity funds was $296.9 million and $183.6 million, respectively, as of March 31, 2018. 4) There was a corresponding profit sharing payable of $644.9 million as of March 31, 2018, including profit sharing payable related to amounts in escrow and contingent consideration obligations of $90.5 million.
Performance Fees Receivable & Performance Fees Detail As of
March 31, 2018 1Q'18
($ in thousands)
Performance FeesReceivable on an
Unconsolidated Basis Unrealized Performance
Fees Realized Performance
Fees Total Performance Fees
Private EquityFund VIII $749,229 ($267,771) $99,186 ($168,585)Fund VII 89,077 1 18,579 5,213 23,792Fund VI 34,821 1 (3,937) — (3,937)Fund IV and V — 3 718 — 718ANRP I and II 30,395 3 (12,276) — (12,276)AAA / Other2 63,029 (180,781) 174,876 (5,905)
Total Private Equity $966,551 ($445,468) $279,275 ($166,193) Total Private Equity, net of profit sharing expense 594,486 (307,835) 177,194 (130,641)
Credit Drawdown $334,087 3 $15,684 $9,762 $25,446 Liquid/Performing 4,071 2,481 21 2,502 Permanent Capital Vehicles 71,329 9,546 5,275 14,821
Total Credit $409,487 $27,711 $15,058 $42,769 Total Credit, net of profit sharing expense 147,349 11,998 8,455 20,453
Real Assets U.S. RE Fund I and II 16,364 (931) 735 (196) Other 8,765 (1,734) 2,391 657
Total Real Assets $25,129 ($2,665) $3,126 $461 Total Real Assets, net of profit sharing expense 14,449 (1,574) 1,540 (34)
Total $1,401,167 ($420,422) $297,459 ($122,963) Total, net of profit sharing expense $756,284 4 ($297,411) $187,189 ($110,222)
17

Permanent Capital AUM Supplemental Information
Permanent Capital Vehicles
2010 2012 2014 2016 1Q'18Period Ending
$7
$25
$72
$87
$105
10%
22%
45% 47%43%
($ in millions, except where noted) 1Q'18
Athene1 $78,382
MidCap 8,346
Athora1 8,247
Apollo Investment Corp (AINV)2 4,472
Apollo Commercial Real Estate Finance (ARI)3 4,305
Apollo Senior Floating Rate Fund (AFT) 429
Apollo Tactical Income Fund (AIF) 391
Total AUM in Permanent Capital Vehicles $104,572
LTMFee Related Revenue from Permanent CapitalVehicles ($ in thousands) $504,747
% of Total Fee Related Revenue 41%
1) See page 19 for additional information regarding assets for which Apollo manages or provides investment advisory services through accounts owned by or related to Athene and Athora as of March 31, 2018.2) Amounts are as of December 31, 2017. Refer to www.apolloic.com for the most recent financial information on AINV. The information contained on AINV’s website is not part of this presentation. Includes $1.8 billion of AUM related
to a non-traded business development company.3) Amounts are as of December 31, 2017. Refer to www.apolloreit.com for the most recent financial information on ARI. The information contained on ARI’s website is not part of this presentation.
• As of March 31, 2018, Apollo had $104.6 billion of AUM across seven Permanent Capital Vehicles
• Apollo generated $504.7 million of fee related revenue from Permanent Capital Vehicles during thetwelve months ended March 31, 2018, representing 41% of total fee related revenue
• The compound annualized growth rate (“CAGR”) of permanent capital AUM since 2010 was 45% asof March 31, 2018
($ in billions)
18
Permanent Capital AUM % of Total AUM

Athene and Athora AUM
2010 2012 2014 2016 2018
$5
$8
Sub-Advised AUM by Asset Category
Athene and Athora
($ in billions) 1Q'18
Credit $13.4
Liquid/Performing 12.1
Drawdown 1.3
Private Equity $0.9
Real Assets $5.2
Real Estate Debt 4.7
Real Estate Equity 0.5
Total $19.5
• Through its subsidiaries, Apollo managed or advised $86.6 billion of combined AUM in accounts ownedby or related to Athene and Athora as of March 31, 2018
• Of the total Athene and Athora AUM, $19.5 billion, or 23%, was either sub-advised by Apollo or investedin funds and investment vehicles managed by Apollo
• During the quarter, $1.5 billion of Athene and Athora AUM moved from non-sub-advised to sub-advisedby Apollo, bringing the total amount of new sub-advised AUM for the last twelve months endedMarch 31, 2018 to $5.0 billion
• Apollo will continue to seek attractive investment opportunities that are consistent with Athene’s andAthora’s investment objectives
($ in billions)
19
Athene AUM
$78 $66
$60
$16 $2
Athora AUM

Appendix

($ in thousands) 1Q'17 2Q'17 3Q'17 4Q'17 1Q'18
Total Revenues (GAAP) $682,104 $449,708 $711,720 $928,271 $166,903
Equity awards granted by unconsolidated related parties, reimbursable expenses and other (18,223) (15,179) (19,832) (22,706) (18,913)
Adjustments related to consolidated funds and VIEs 1,459 1,493 1,343 322 1,639
Total Segment Revenues1 $665,340 $436,022 $693,231 $905,887 $149,629
Total Expenses (GAAP) $345,988 $264,526 $357,483 $392,052 $214,875
Equity awards granted by unconsolidated related parties, reimbursable expenses and other (18,223) (15,179) (19,832) (22,706) (18,735)
Transaction-related compensation charges 2,683 (1,549) (7,543) (5,760) (892)
Reclassification of interest expense1 (12,999) (13,195) (13,302) (13,377) (13,797)
Amortization of transaction-related intangibles (1,872) (1,543) (971) (943) (960)
Total Segment Expenses1 $315,577 $233,060 $315,835 $349,266 $180,491
Total Other Income (Loss), net (GAAP) $58,075 $6,983 $96,668 $196,104 ($52,796)
Reclassification of interest expense2 (12,999) (13,195) (13,302) (13,377) (13,797)
Adjustments related to consolidated funds and VIEs (3,910) (5,474) (640) 893 (6,225)
Gain from remeasurement of tax receivable agreement liability — — — (200,240) —
Total Segment Other Income (Loss)1 $41,166 ($11,686) $82,726 ($16,620) ($72,818)
1) For details of Total Segment Revenues, Total Segment Expenses and Total Segment Other Income (Loss), refer to slide 22.2) For EI presentation purposes, interest income is presented net of interest expense as a component of other income
Reconciliation of GAAP to Non-GAAP Measures
21

($ in thousands) 1Q'17 2Q'17 3Q'17 4Q'17 1Q'18 1Q’17 LTM 1Q’18 LTMTotal Segment Revenues:
Management fees $252,053 $266,908 $282,434 $280,920 $272,203 $998,769 $1,102,465Advisory and transaction fees, net 15,067 23,629 16,209 62,719 12,994 154,183 115,551Performance fees:
Unrealized 172,545 (70,525) 285,599 300,946 (420,422) 854,435 95,598Realized 186,461 198,791 60,975 202,798 297,458 411,425 760,022
Total performance fees 359,006 128,266 346,574 503,744 (122,964) 1,265,860 855,620Principal investment income (loss) 39,214 17,219 48,014 58,504 (12,604) 145,654 111,133
Total Segment Revenues $665,340 $436,022 $693,231 $905,887 $149,629 $2,564,466 $2,184,769
• The following table sets forth Apollo’s total segment other income for the combined segments
• The following table sets forth Apollo’s total segment revenues for the combined segments
• The following table sets forth Apollo’s total segment expenses for the combined segments
($ in thousands) 1Q'17 2Q'17 3Q'17 4Q'17 1Q'18 1Q’17 LTM 1Q’18 LTMTotal Segment Other Income (Loss):
Net gains (losses) from investment activities $34,490 ($399) $68,529 ($7,846) ($67,137) $229,597 ($6,853)Net interest loss (11,988) (12,067) (11,509) (9,420) (9,941) (44,116) (42,937)Other income, net 18,664 780 25,706 646 4,260 17,067 31,392
Total Segment Other Income (Loss) $41,166 ($11,686) $82,726 ($16,620) ($72,818) $202,548 ($18,398)
($ in thousands) 1Q'17 2Q'17 3Q'17 4Q'17 1Q'18 1Q’17 LTM 1Q’18 LTMTotal Segment Expenses:
Salary, bonus and benefits $94,721 $98,560 $101,007 $99,867 $106,531 $369,241 $405,965Equity-based compensation 16,745 17,566 17,058 16,505 17,358 64,493 68,487Profit sharing expense:
Unrealized 59,265 (22,126) 94,446 94,734 (123,011) 306,804 44,043Realized 88,723 79,083 35,673 75,359 110,270 191,327 300,385Equity-based1 287 1,044 1,326 1,403 14,641 287 18,414
Total Profit Sharing Expense 148,275 58,001 131,445 171,496 1,900 498,418 362,842Non-compensation expenses:
General, administrative and other 53,932 53,674 60,928 60,045 54,375 220,061 229,022Placement fees 1,904 5,259 5,397 1,353 327 24,636 12,336
Total Non-Compensation Expenses 55,836 58,933 66,325 61,398 54,702 244,697 241,358Total Segment Expenses $315,577 $233,060 $315,835 $349,266 $180,491 $1,176,849 $1,078,652
Non-GAAP Measures
22
1) Includes amortization related to a grant of equity-based awards to certain executives during the first quarter of 2018.

($ in thousands, except where noted) 1Q'17 2Q'17 3Q'17 4Q'17 1Q'18 1Q’17 LTM 1Q’18 LTMManagement fees $158,342 $169,856 $187,885 $186,108 $183,070 $612,540 $726,919Advisory and transaction fees, net 2,556 3,709 4,219 20,249 2,348 10,679 30,525Performance fees:
Unrealized 6,322 26,921 4,179 13,803 27,711 164,775 72,614Realized 30,936 57,119 32,131 76,787 15,057 165,813 181,094
Total performance fees 37,258 84,040 36,310 90,590 42,768 330,588 253,708Principal investment income 6,483 5,856 8,222 7,157 5,409 38,925 26,644
Total Revenues 204,639 263,461 236,636 304,104 233,595 992,732 1,037,796Salary, bonus and benefits 54,882 59,244 59,027 58,439 61,074 212,526 237,784Equity-based compensation 9,102 9,228 9,925 9,198 9,727 34,727 38,078Profit sharing expense:
Unrealized 2,215 12,927 2,266 860 15,713 74,364 31,766Realized 13,445 23,080 14,643 26,633 6,602 67,599 70,958Equity-based 287 582 518 489 1,791 287 3,380
Total Profit Sharing Expense 15,947 36,589 17,427 27,982 24,106 142,250 106,104Non-compensation expenses:
General, administrative and other 32,090 31,760 35,709 39,815 33,135 127,243 140,419Placement fees 1,770 3,918 3,140 1,302 276 23,110 8,636
Total Non-Compensation Expenses 33,860 35,678 38,849 41,117 33,411 150,353 149,055Total Expenses 113,791 140,739 125,228 136,736 128,318 539,856 531,021
Net gains (losses) from investment activities 31,094 (299) 60,570 (6,230) (55,267) 210,716 (1,226)Net interest loss (6,522) (6,484) (5,972) (4,731) (4,971) (23,536) (22,158)Other income (loss), net 811 (241) 16,318 149 3,946 (3,281) 20,172
Other Income (Loss) 25,383 (7,024) 70,916 (10,812) (56,292) 183,899 (3,212)Non-Controlling Interest (934) (559) (1,751) (1,135) (1,215) (6,013) (4,660)
Economic Income $115,297 $115,139 $180,573 $155,421 $47,770 $630,762 $498,903Fee Related Earnings $72,212 $85,052 $115,716 $111,211 $99,551 $267,979 $411,530AUM ($ in millions) 140,932 151,033 157,925 164,113 165,265 140,932 165,265Fee-Generating AUM ($ in millions) 114,914 121,271 126,907 130,150 129,484 114,914 129,484
Credit
23

($ in thousands, except where noted) 1Q'17 2Q'17 3Q'17 4Q'17 1Q'18 1Q’17 LTM 1Q’18 LTMManagement fees $77,398 $77,275 $76,079 $75,982 $71,160 $324,475 $300,496Advisory and transaction fees, net 11,772 19,302 10,572 42,417 10,598 137,734 82,889Performance fees:
Unrealized 163,619 (98,372) 286,589 290,290 (445,468) 678,761 33,039Realized 155,461 136,497 21,859 120,166 279,275 237,753 557,797
Total performance fees 319,080 38,125 308,448 410,456 (166,193) 916,514 590,836Principal investment income (loss) 31,728 10,348 39,875 50,425 (17,531) 103,492 83,117
Total Revenues 439,978 145,050 434,974 579,280 (101,966) 1,482,215 1,057,338Salary, bonus and benefits 31,469 30,294 31,467 29,865 35,021 123,858 126,647Equity-based compensation 7,095 7,704 6,335 6,382 6,772 27,259 27,193Profit sharing expense:
Unrealized 55,016 (34,983) 96,992 94,951 (137,633) 227,033 19,327Realized 75,252 53,137 17,394 45,786 102,082 119,145 218,399Equity-based — 462 808 914 12,601 — 14,785
Total Profit Sharing Expense 130,268 18,616 115,194 141,651 (22,950) 346,178 252,511Non-compensation expenses:
General, administrative and other 17,360 16,617 19,699 14,828 15,098 72,952 66,242Placement fees 134 1,341 2,257 51 51 1,437 3,700
Total Non-Compensation Expenses 17,494 17,958 21,956 14,879 15,149 74,389 69,942Total Expenses 186,326 74,572 174,952 192,777 33,992 571,684 476,293
Net gains (losses) from investment activities 3,396 (100) 7,959 (1,603) (11,877) 18,881 (5,621)Net interest loss (4,242) (4,336) (4,374) (3,645) (3,927) (16,001) (16,282)Other income, net 17,790 781 7,344 384 251 19,564 8,760
Other Income (Loss) 16,944 (3,655) 10,929 (4,864) (15,553) 22,444 (13,143)Economic Income (Loss)1 $270,596 $66,823 $270,951 $381,639 ($151,511) $932,975 $567,902Fee Related Earnings $58,001 $49,095 $40,574 $74,043 $31,840 $282,391 $195,552AUM ($ in millions) 44,573 67,798 70,469 72,432 68,949 44,573 68,949Fee-Generating AUM ($ in millions) 30,774 30,011 30,067 29,792 43,758 30,774 43,758
Private Equity
1) 1Q’18 LTM includes $19.0 million in proceeds received in connection with the Company’s early termination of a lease. 1Q’17 and 1Q’17 LTM includes $17.5 million in insurance proceeds received in connection with fees and expensesrelating to a legal proceeding. The lease termination and insurance proceeds were recorded in Other income (loss).
24

($ in thousands, except where noted) 1Q'17 2Q'17 3Q'17 4Q'17 1Q'18 1Q’17 LTM 1Q’18 LTMManagement fees $16,313 $19,777 $18,470 $18,830 $17,973 $61,754 $75,050Advisory and transaction fees, net 739 618 1,418 53 48 5,770 2,137Performance fees:
Unrealized 2,604 926 (5,169) (3,147) (2,665) 10,899 (10,055)Realized 64 5,175 6,985 5,845 3,126 7,859 21,131
Total performance fees 2,668 6,101 1,816 2,698 461 18,758 11,076Principal investment income (loss) 1,003 1,015 (83) 922 (482) 3,237 1,372
Total Revenues 20,723 27,511 21,621 22,503 18,000 89,519 89,635Salary, bonus and benefits 8,370 9,022 10,513 11,563 10,436 32,857 41,534Equity-based compensation 548 634 798 925 859 2,507 3,216Profit sharing expense:
Unrealized 2,034 (70) (4,812) (1,077) (1,091) 5,407 (7,050)Realized 26 2,866 3,636 2,940 1,586 4,583 11,028Equity-based — — — — 249 — 249
Total Profit Sharing Expense 2,060 2,796 (1,176) 1,863 744 9,990 4,227Non-compensation expenses:
General, administrative and other 4,482 5,297 5,520 5,402 6,142 19,866 22,361Placement fees — — — — — 89 —
Total Non-Compensation Expenses 4,482 5,297 5,520 5,402 6,142 19,955 22,361Total Expenses 15,460 17,749 15,655 19,753 18,181 65,309 71,338
Net gains (losses) from investment activities — — — (13) 7 — (6)Net interest loss (1,224) (1,247) (1,163) (1,044) (1,043) (4,579) (4,497)Other income, net 63 240 2,044 113 63 784 2,460
Other Income (Loss) (1,161) (1,007) 881 (944) (973) (3,795) (2,043)Economic Income (Loss) $4,102 $8,755 $6,847 $1,806 ($1,154) $20,415 $16,254Fee Related Earnings $4,262 $6,317 $5,899 $2,031 $1,508 $15,175 $15,755
AUM ($ in millions) 11,961 13,009 13,171 12,383 13,202 11,961 13,202Fee-Generating AUM ($ in millions) 8,466 9,672 9,284 9,023 9,225 8,466 9,225
Real Assets
25

($ in thousands, except share data) 1Q'17 2Q'17 3Q'17 4Q'17 1Q'18Net Income (Loss) Attributable to Apollo Global Management, LLC Class A Shareholders $145,196 $86,908 $198,569 $184,893 ($62,645)
Distributions declared on Class A shares (84,215) (94,451) (100,641) (75,571) (133,023)Distribution on participating securities (2,859) (3,295) (3,265) (2,403) (5,384)Earnings allocable to participating securities (2,264) — (3,218) (3,599) —Undistributed income (loss) attributable to Class A shareholders: Basic $55,858 ($10,838) $91,445 $103,320 ($201,052)GAAP weighted average number of Class A shares outstanding: Basic 186,537,367 190,591,756 192,882,082 193,609,614 198,432,603
GAAP Net Income (Loss) per Class A Share under the Two-Class Method: Basic $0.75 $0.44 $1.00 $0.92 ($0.34)Distributed Income $0.45 $0.49 $0.52 $0.39 $0.66Undistributed Income (Loss) $0.30 ($0.05) $0.48 $0.53 ($1.00)Net Income (Loss) Attributable to Apollo Global Management, LLC Class A Shareholders $145,196 $86,908 $198,569 $184,893 ($62,645)
Net Income (Loss) Attributable to Apollo Global Management, LLC Class A Shareholders toIncome Before Income Tax Provision Differences1 248,995 105,257 252,336 547,430 (38,123)
Income (Loss) Before Income Tax Provision $394,191 $192,165 $450,905 $732,323 ($100,768)Income (Loss) Before Income Tax Provision to Economic Income (Loss) Differences1 (4,196) (1,448) 7,466 (193,457) (4,127)
Economic Income (Loss) $389,995 $190,717 $458,371 $538,866 ($104,895)Income tax provision on Economic Income (Loss) (58,372) (2,397) (22,356) (44,155) (11,736)Preferred distributions — (4,772) (4,383) (4,383) (4,383)
Economic Net Income (Loss) $331,623 $183,548 $431,632 $490,328 ($121,014)Weighted Average Economic Net Income Shares Outstanding2 403,132,323 402,955,548 403,015,923 403,097,024 404,854,447
Economic Net Income (Loss) per Share $0.82 $0.46 $1.07 $1.22 ($0.30)Economic Net Income (Loss) to Fee Related Earnings Differences1 (197,148) (43,084) (269,443) (303,043) 253,913
Fee Related Earnings $134,475 $140,464 $162,189 $187,285 $132,899Distributable Earnings Shares Outstanding 409,150,111 409,441,046 409,232,208 409,373,371 412,456,787
Fee Related Earnings per Share $0.33 $0.34 $0.40 $0.46 $0.32Fee Related Earnings to Distributable Earnings Differences1 105,130 117,242 22,942 140,275 73,854
Distributable Earnings $239,605 $257,706 $185,131 $327,560 $206,753Taxes and Related Payables (6,348) (6,724) (7,272) (5,993) (11,198)Preferred distributions — (4,772) (4,383) (4,383) (4,383)
Distributable Earnings After Taxes and Related Payables $233,257 $246,210 $173,476 $317,184 $191,172Distributable Earnings Shares Outstanding2 409,150,111 409,441,046 409,232,208 409,373,371 412,456,787
Distributable Earnings per Share of Common & Equivalent $0.57 $0.60 $0.42 $0.77 $0.46
1) See page 5 for reconciliation of Net Income (Loss) Attributable to Apollo Global Management, LLC Class A Shareholders, Income (Loss) Before Income Tax (Provision) Benefit, Economic Net Income (Loss), Fee RelatedEarnings and Distributable Earnings.
2) See page 29 for reconciliation of GAAP Class A shares outstanding to non-GAAP shares outstanding.
Reconciliation of GAAP Net Income Per Class A Share to Non-GAAP Per Share Measures
26

1) Represents performance fees from a publicly traded business development company we manage.2) 1Q’18 LTM includes $19.0 million in proceeds received in connection with the Company’s early termination of a lease and $17.5 million in insurance proceeds received in connection with fees and expenses relating to a legal
proceeding. The lease termination and insurance proceeds were recorded in Other income (loss).3) Excludes realized performance fees and realized profit sharing expense settled in the form of Athene shares.4) Includes amortization related to a grant of equity-based awards to certain executives during the first quarter of 2018.
Walkdown of Non-GAAP Measures1Q'18 1Q’18 LTM
Results Per Share Results Per Share
Econ
omic
Net
Inco
me
Dis
trib
utab
le E
arni
ngs
Aft
er T
axes
and
Rel
ated
Paya
bles
Fee
Rela
ted
Earn
ings
Management fees $272,203 $1,102,465Advisory and transaction fees, net 12,994 115,551Performance fees1 5,275 22,215Salary, bonus and benefits (106,531) (405,965)Non-compensation expenses (54,702) (241,358)Other income attributable to Fee Related Earnings2 4,875 34,589Non-Controlling Interest (1,215) (4,660)Fee Related Earnings $132,899 $0.32 $622,837 $1.51Realized performance fees3 122,302 567,926Realized profit sharing expense3 (63,647) (253,762)Non-cash management fees (842) (3,368)Realized principal investment income 23,393 73,199Net interest loss (9,941) (42,937)Depreciation and amortization 2,589 13,255Taxes and related payables (11,198) (31,187)Preferred distributions (4,383) (17,921)Distributable Earnings After Taxes and Related Payables $191,172 $0.46 $928,042 $2.25Taxes and related payables 11,198 31,187Unrealized performance fees (420,422) 95,598Unrealized profit sharing expense 123,011 (44,043)Non-cash management fees 842 3,368Non-cash realized performance fees 169,881 169,881Non-cash realized profit sharing expense (46,623) (46,623)Unrealized principal investment income (loss) (35,997) 37,934Unrealized losses from investment activities (67,137) (6,853)Equity-based compensation (17,358) (68,487)Profit sharing expense: Equity-based4 (14,641) (18,414)Depreciation and amortization and other (3,204) (16,452)Income tax provision on Economic Income (11,736) (80,644)Economic Net Income (Loss) ($121,014) ($0.30) $984,494 $2.44
27

($ in thousands, except per share data) 1Q'17 4Q'17 1Q'18 LTM’17 LTM’18
Distributable Earnings $239,605 $327,560 $206,753 $782,782 $977,150
Taxes and Related Payables1 (6,348) (5,993) (11,198) (13,710) (31,187)
Preferred Distributions — (4,383) (4,383) — (17,921)
DE After Taxes and Related Payables $233,257 $317,184 $191,172 $769,072 $928,042
Add Back: Taxes & Related Payables Attributable to Common & Equivalents 4,560 4,122 9,167 4,668 22,820
DE Before Certain Payables2 237,817 321,306 200,339 773,740 950,862
Percent to Common & Equivalents 47% 49% 51% 47% 51%
DE Before Other Payables Attributable to Common & Equivalents 112,874 158,257 101,952 367,236 483,890
Less: Taxes & Related Payables Attributable to Common & Equivalents (4,560) (4,122) (9,167) (4,668) (22,820)
DE Attributable to Common & Equivalents $108,314 $154,135 $92,785 $362,568 $461,070
Per Share of Common & Equivalent3 $0.57 $0.77 $0.46 $1.88 $2.25
Retained Capital per Share of Common & Equivalent3,4 (0.08) (0.11) (0.08) (0.22) (0.30)
Net Distribution per Share of Common & Equivalent3 $0.49 $0.66 $0.38 $1.66 $1.95
Payout Ratio 86% 86% 83% 88% 87%
Shareholder Distribution• Generated $0.46 of Distributable Earnings After Taxes and Related Payables per Share of Common & Equivalent
during the quarter
• Apollo declared a quarterly distribution of $0.38 per Class A share to holders of record as of May 18, 2018,which is payable on May 31, 2018
1) Represents the estimated current corporate, local and non-U.S. taxes as well as the payable under Apollo’s tax receivable agreement. DE After Taxes and Related Payables is calculated after current taxes and the impact of the taxreceivable agreement (“TRA”). The TRA component of taxes used in calculating DE After Taxes was previously estimated based on the tax asset used to reduce the prior year’s tax liability. In 2018, the DE effective tax rate, using thisestimation methodology, results in an increase in the tax rate despite the significantly reduced federal tax rate under tax reform. We believe it is more meaningful to estimate the current year impact of the TRA component of taxeswhen calculating DE After Taxes. The impact of this change is not significant to DE After Taxes and Related Payables as previously reported. DE After Taxes and Related Payables would have been $225.2 million, $308.8 million, $747.6million and $903.7 million in 1Q'17, 4Q'17, LTM’17 and LTM’18, respectively.
2) DE Before Certain Payables represents Distributable Earnings before the deduction for estimated current corporate taxes and the amounts payable under Apollo’s tax receivable agreement.3) Per share calculations are based on end of period Distributable Earnings Shares Outstanding, which consist of total Class A shares outstanding, Apollo Operating Group Units and RSUs that participate in distributions (collectively
referred to as “common & equivalents”). See page 29 for the share reconciliation.4) Retained capital is withheld pro-rata from common and equivalent holders and Apollo Operating Group (“AOG”) unitholders.
28

1Q'17 2Q'17 3Q'17 4Q'17 1Q'18
Total GAAP Weighted-Average Class A Shares Outstanding: Basic 186,537,367 190,591,756 192,882,082 193,609,614 198,432,603
Non-GAAP Adjustments:
Apollo Operating Group Units 215,286,909 211,895,190 209,522,593 208,827,733 204,576,722
RSUs 1,233,685 224,100 210,642 180,636 1,176,450
Restricted shares 74,362 244,502 400,606 479,041 668,672
Weighted-Average Economic Net Income Shares Outstanding 403,132,323 402,955,548 403,015,923 403,097,024 404,854,447
1Q'17 2Q'17 3Q'17 4Q'17 1Q'18
Total GAAP Class A Shares Outstanding 187,644,092 192,756,044 193,540,853 195,267,669 201,550,654
Non-GAAP Adjustments:
Apollo Operating Group Units 214,957,239 210,024,821 209,239,821 207,739,821 202,559,221
Vested RSUs 425,736 415,218 326,344 2,802,277 253,700
Economic Net Income Shares Outstanding 403,027,067 403,196,083 403,107,018 405,809,767 404,363,575
Unvested RSUs Eligible for Distribution Equivalents 6,123,044 6,244,963 6,125,190 3,563,604 8,093,212
Distributable Earnings Shares Outstanding 409,150,111 409,441,046 409,232,208 409,373,371 412,456,787
Share Reconciliation
29
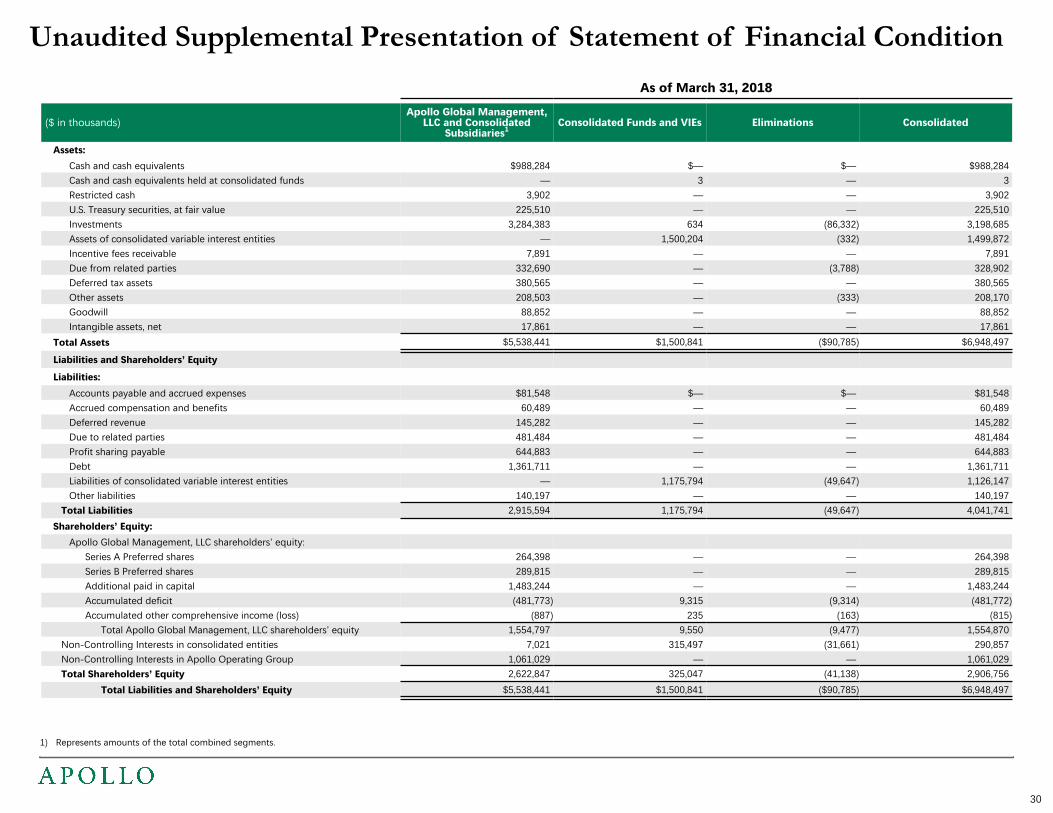
Unaudited Supplemental Presentation of Statement of Financial ConditionAs of March 31, 2018
($ in thousands)Apollo Global Management,
LLC and ConsolidatedSubsidiaries1
Consolidated Funds and VIEs Eliminations Consolidated
Assets:Cash and cash equivalents $988,284 $— $— $988,284Cash and cash equivalents held at consolidated funds — 3 — 3Restricted cash 3,902 — — 3,902U.S. Treasury securities, at fair value 225,510 — — 225,510Investments 3,284,383 634 (86,332) 3,198,685Assets of consolidated variable interest entities — 1,500,204 (332) 1,499,872Incentive fees receivable 7,891 — — 7,891Due from related parties 332,690 — (3,788) 328,902Deferred tax assets 380,565 — — 380,565Other assets 208,503 — (333) 208,170Goodwill 88,852 — — 88,852Intangible assets, net 17,861 — — 17,861
Total Assets $5,538,441 $1,500,841 ($90,785) $6,948,497
Liabilities and Shareholders’ EquityLiabilities:
Accounts payable and accrued expenses $81,548 $— $— $81,548Accrued compensation and benefits 60,489 — — 60,489Deferred revenue 145,282 — — 145,282Due to related parties 481,484 — — 481,484Profit sharing payable 644,883 — — 644,883Debt 1,361,711 — — 1,361,711Liabilities of consolidated variable interest entities — 1,175,794 (49,647) 1,126,147Other liabilities 140,197 — — 140,197
Total Liabilities 2,915,594 1,175,794 (49,647) 4,041,741Shareholders’ Equity:
Apollo Global Management, LLC shareholders’ equity:Series A Preferred shares 264,398 — — 264,398Series B Preferred shares 289,815 — — 289,815Additional paid in capital 1,483,244 — — 1,483,244Accumulated deficit (481,773) 9,315 (9,314) (481,772)Accumulated other comprehensive income (loss) (887) 235 (163) (815)
Total Apollo Global Management, LLC shareholders’ equity 1,554,797 9,550 (9,477) 1,554,870Non-Controlling Interests in consolidated entities 7,021 315,497 (31,661) 290,857Non-Controlling Interests in Apollo Operating Group 1,061,029 — — 1,061,029Total Shareholders’ Equity 2,622,847 325,047 (41,138) 2,906,756
Total Liabilities and Shareholders’ Equity $5,538,441 $1,500,841 ($90,785) $6,948,497
1) Represents amounts of the total combined segments.
30

Investment Records as of March 31, 2018
31
Drawdown($ in millions) Vintage Year1 Total AUM Committed
CapitalTotal Invested
Capital1RealizedValue1
RemainingCost1
UnrealizedValue1
TotalValue1 Gross IRR1 Net IRR1
Private Equity:Fund IX 2018 $24,729 $24,729 $— $— $— $— $— —% —%Fund VIII 2013 21,554 18,377 13,599 4,162 11,328 16,159 20,321 26 18Fund VII 2008 5,731 14,677 16,198 30,328 3,341 3,396 33,724 34 26Fund VI 2006 2,724 10,136 12,457 19,118 2,389 2,108 21,226 12 9Fund V 2001 296 3,742 5,192 12,711 124 40 12,751 61 44Funds I, II, III, IV & MIA3 Various 14 7,320 8,753 17,400 — — 17,400 39 26
Traditional Private Equity Funds4 $55,048 $78,981 $56,199 $83,719 $17,182 $21,703 $105,422 39% 25%ANRP II 2016 3,414 3,454 1,638 656 1,343 1,554 2,210 46 25ANRP I 2012 1,035 1,323 1,112 765 705 781 1,546 12 8AION 2013 713 826 407 251 225 308 559 18 8
Total Private Equity9 $60,210 $84,584 $59,356 $85,391 $19,455 $24,346 $109,737
Credit:Credit Opportunity Funds
COF III 2014 $2,646 $3,426 $5,016 $3,555 $1,739 $1,608 $5,163 1% —%COF II 2008 55 1,583 2,176 3,136 39 44 3,180 14 11COF I 2008 324 1,485 1,611 4,336 38 54 4,390 30 27
European Principal Finance FundsEPF III5 2017 4,542 4,652 511 — 511 512 512 NM2 NM2
EPF II5 2012 3,063 3,536 3,726 3,169 1,529 2,223 5,392 19 11EPF I5 2007 271 1,593 2,093 3,505 — 14 3,519 23 17
Structured Credit FundsFCI III 2017 2,728 1,906 1,608 366 1,367 1,666 2,032 NM2 NM2
FCI II 2013 2,476 1,555 2,299 1,065 1,759 1,823 2,888 12 8FCI I 2012 975 559 1,410 1,087 852 815 1,902 14 11SCRF IV12 2017 1,416 1,709 823 74 598 741 815 NM2 NM2
SCRF III 2015 — 1,238 2,110 2,428 — — 2,428 18 14SCRF II 2012 — 104 467 528 — — 528 15 12SCRF I 2008 — 118 240 357 — — 357 33 26
Other Drawdown Funds & SIAs6 Various 6,868 9,572 9,672 9,502 2,374 2,341 11,843 9 7Total Credit10 $25,364 $33,036 $33,762 $33,108 $10,806 $11,841 $44,949
Real Assets:U.S. RE Fund II7 2016 $921 $862 $560 $222 $448 $537 $759 20% 17%U.S. RE Fund I7 2012 446 658 640 659 244 285 944 15 12AGRE Debt Fund I13 2011 866 2,091 2,089 1,457 879 853 2,310 9 7CPI Funds8 Various 410 5,106 2,620 2,681 259 68 2,749 14 11Asia RE Fund7 2017 615 588 244 40 216 250 290 NM2 NM2
Total Real Assets11 $3,258 $9,305 $6,153 $5,059 $2,046 $1,993 $7,052

Investment Records – Notes Note: The Drawdown funds included in the investment record table on page 31 have greater than $500 million of AUM and/or form part of a flagship series of funds. The SIAs includedin the investment record table on page 31 have greater than $200 million of AUM and do not predominantly invest in other Apollo funds or SIAs.
1) Refer to the definitions of Vintage Year, Total Invested Capital, Realized Value, Remaining Cost, Unrealized Value, Total Value, Gross IRR and Net IRR in the non-GAAP financialinformation & definitions section of this presentation.
2) Returns have not been presented as the fund commenced investing capital less than 24 months prior to the period indicated and therefore such return information was deemed notmeaningful.
3) The general partners and managers of Funds I, II and MIA, as well as the general partner of Fund III, were excluded assets in connection with the 2007 Reorganization. As a result,Apollo did not receive the economics associated with these entities. The investment performance of these funds, combined with Fund IV, is presented to illustrate fund performanceassociated with Apollo’s Managing Partners and other investment professionals.
4) Total IRR is calculated based on total cash flows for all funds presented.
5) Funds are denominated in Euros and historical figures are translated into U.S. dollars at an exchange rate of €1.00 to $1.23 as of March 31, 2018.
6) Amounts presented have been aggregated for (i) Drawdown funds with AUM greater than $500 million that do not form part of a flagship series of funds and (ii) SIAs with AUM greaterthan $200 million that do not predominantly invest in other Apollo funds or SIAs. Certain SIAs’ historical figures are denominated in Euros and translated into U.S. dollars at an exchangerate of €1.00 to $1.23 as of March 31, 2018. Additionally, certain SIAs totaling $1.7 billion of AUM have been excluded from Total Invested Capital, Realized Value, Remaining Cost,Unrealized Value and Total Value. These SIAs have an open ended life and a significant turnover in their portfolio assets due to the ability to recycle capital. These SIAs had $10.4billion of Total Invested Capital through March 31, 2018.
7) U.S. RE Fund I, U.S. RE Fund II and Asia RE Fund had $162 million, $390 million and $245 million of co-investment commitments raised as of March 31, 2018, respectively, which areincluded in the figures in the table. A co-invest entity within U.S. RE Fund I is denominated in GBP and translated into U.S. dollars at an exchange rate of £1.00 to $1.40 as of March 31,2018.
8) As part of the acquisition of Citi Property Investors (“CPI”), Apollo acquired general partner interests in fully invested funds. CPI Funds refers to CPI Capital Partners North America,CPI Capital Partners Asia Pacific, CPI Capital Partners Europe and other CPI funds or individual investments of which Apollo is not the general partner or manager and only receivesfees pursuant to either a sub-advisory agreement or an investment management and administrative agreement. For CPI Capital Partners North America, CPI Capital Partners AsiaPacific and CPI Capital Partners Europe, the gross and net IRRs are presented in the investment record table since acquisition on November 12, 2010. The aggregate net IRR for thesefunds from their inception to March 31, 2018 was (2%). This net IRR was primarily achieved during a period in which Apollo did not make the initial investment decisions and Apolloonly became the general partner or manager of these funds upon completing the acquisition on November 12, 2010.
9) Private equity co-investment vehicles, and funds with AUM less than $500 million have been excluded. These co-investment vehicles and funds had $8.7 billion of aggregate AUM asof March 31, 2018.
10) Certain credit funds and SIAs with AUM less than $500 million and $200 million, respectively, have been excluded. These funds and SIAs had $2.8 billion of aggregate AUM as ofMarch 31, 2018.
11) Certain accounts owned by or related to Athene, certain co-investment vehicles and certain funds with AUM less than $500 million have been excluded. These accounts, co-investmentvehicles and funds had $5.1 billion of aggregate AUM as of March 31, 2018.
12) Remaining cost for certain of our credit funds may include physical cash called, invested or reserved for certain levered investments.
13) The investor in this U.S. Dollar denominated fund has chosen to make contributions and receive distributions in the local currency of each underlying investment. As a result, Apollohas not entered into foreign currency hedges for this fund and the returns presented include the impact of foreign currency gains or losses. The investor’s gross and net IRR, beforethe impact of foreign currency gains or losses, from the fund’s inception to March 31, 2018 was 10% and 9%, respectively.
32

Investment Records as of March 31, 2018Liquid/Performing
Net Returns($ in millions) Vintage Year Total AUM 1Q'18 1Q'17 FY’17Credit:
Hedge Funds1 Various $6,775 1% 1% 5%CLOs2 Various 12,336 1 1 4SIAs / Other Various 26,171 — 2 7
Total $45,282
Note: The above tables summarize the investment record for our Liquid/Performing and Permanent Capital Vehicles as defined in the non-GAAP financial information & definitions section of this presentation(excluding Athene Non-Sub-Advised, which refers to that portion of Athene’s assets which are managed or advised by Apollo but not sub-advised by Apollo or invested in funds and or investment vehiclesmanaged by Apollo, and Athora Non-Sub-Advised, which refers to that portion of Athora’s assets which are managed or advised by Apollo but not sub-advised by Apollo or invested in funds and orinvestment vehicles managed by Apollo). All amounts are as of March 31, 2018, unless otherwise noted. 1) Hedge funds primarily includes Apollo Credit Strategies Master Fund Ltd. and Apollo Credit Master Fund Ltd. 2) CLO returns are calculated based on gross return on invested assets, which excludes cash. Included within Total AUM of CLOs is $2.8 billion of AUM related to a standalone, self-managed asset
management business established in connection with risk-retention rules, from which Apollo earns investment-related service fees, but for which Apollo does not provide management or advisoryservices. CLO returns exclude performance related to this AUM.
3) Total returns are based on the change in closing trading prices during the respective periods presented taking into account dividends and distributions, if any, as if they were reinvested without regard tocommission.
4) An initial public offering (“IPO”) year represents the year in which the vehicle commenced trading on a national securities exchange. 5) MidCap is not a publicly traded vehicle and therefore IPO year is not applicable. The returns presented are a gross return based on NAV. The net returns based on NAV were 3%, 2% and 8% for 1Q'18,
1Q'17, and FY’17, respectively. Gross and net return are defined in the non-GAAP financial information and definitions section of this presentation.6) All amounts are as of December 31, 2017 except for total returns. Refer to www.apolloic.com for the most recent financial information on AINV. The information contained on AINV’s website is not part of
this presentation. Included within Total AUM of AINV is $1.8 billion of AUM related to a non-traded business development company from which Apollo earns investment-related service fees, but for whichApollo does not provide management or advisory services. Net returns exclude performance related to this AUM.
7) Amounts are as of December 31, 2017. Refer to www.apolloreit.com for the most recent financial information on ARI. The information contained on ARI’s website is not part of this presentation.
33
Permanent Capital VehiclesTotal Returns3
($ in millions) IPO Year4 Total AUM 1Q'18 1Q'17 FY’17Credit:
MidCap5 N/A $8,346 4 % 4% 12%AIF 2013 391 2 9 10AFT 2011 429 6 2 —AINV6 2004 4,472 (5) 14 6
Real Assets:ARI7 2009 4,305 — % 16% 22%
Total $17,943

Non-GAAP Financial Information & DefinitionsApollo discloses the following financial measures that are calculated and presented on the basis of methodologies other than in accordance with generally accepted accountingprinciples in the United States of America (“Non-GAAP”):
• “Economic Income”, or “EI”, as well as “Economic Net Income”, or “ENI”, are key performance measures used by management in evaluating the performance of Apollo’scredit, private equity and real assets segments. Management uses these performance measures in making key operating decisions such as the following:
• Decisions related to the allocation of resources such as staffing decisions including hiring and locations for deployment of the new hires;• Decisions related to capital deployment such as providing capital to facilitate growth for the business and/or to facilitate expansion into new businesses; and• Decisions related to expenses, such as determining annual discretionary bonuses and equity-based compensation awards to its employees. With respect to compensation,
management seeks to align the interests of certain professionals and selected other individuals with those of the investors in the funds and those of Apollo’s shareholdersby providing such individuals a profit sharing interest in the performance fees earned in relation to the funds. To achieve that objective, a certain amount of compensationis based on Apollo’s performance and growth for the year.
• “EI” represents segment income (loss) before income tax provision excluding transaction-related charges arising from the 2007 private placement, and any acquisitions.Transaction-related charges includes equity-based compensation charges, the amortization of intangible assets, contingent consideration and certain other charges associatedwith acquisitions. In addition, EI excludes non-cash revenue and expense related to equity awards granted by unconsolidated related parties to employees of the Company,compensation and administrative related expense reimbursements, as well as the assets, liabilities and operating results of the funds and VIEs that are included in theconsolidated financial statements. We believe the exclusion of the non-cash charges related to the 2007 Reorganization for equity-based compensation provides investorswith a meaningful indication of our performance because these charges relate to the equity portion of our capital structure and not our core operating performance.
EI also excludes impacts of the remeasurement of the tax receivable agreement which arises from changes in the associated deferred tax balance, including the impactsrelated to the Tax Cuts & Jobs Act enacted on December 22, 2017 (the “TCJA”).
• “ENI” represents EI adjusted to reflect income tax provision on EI that has been calculated assuming that all income is allocated to Apollo Global Management, LLC, whichwould occur following an exchange of all AOG Units for Class A shares of Apollo Global Management, LLC. ENI excludes the impacts of the remeasurement of deferred taxassets and liabilities which arises from changes in estimated future tax rates, including impacts related to the TCJA. The economic assumptions and methodologies that impactthe implied income tax provision are similar to those methodologies and certain assumptions used in calculating the income tax provision for Apollo’s consolidated statementsof operations under U.S. GAAP. ENI is net of preferred distributions, if any, to Series A and Series B Preferred shareholders.
Management believes that excluding the remeasurement of the tax receivable agreement and deferred taxes from EI and ENI, respectively, is meaningful as it increasescomparability between periods. Remeasurement of the tax receivable agreement and deferred taxes are estimates and may change due to changes in interpretations andassumptions based on additional guidance that may be issued pertaining to the TCJA.
• “Fee Related Earnings”, or “FRE”, is derived from our segment reported results and refers to a component of EI that is used as a supplemental performance measure toassess whether revenues that we believe are generally more stable and predictable in nature, primarily consisting of management fees, are sufficient to cover associatedoperating expenses and generate profits. FRE is the sum across all segments of (i) management fees, (ii) advisory and transaction fees, (iii) performance fees earned from apublicly traded business development company we manage and (iv) other income, net, less (y) salary, bonus and benefits, excluding equity-based compensation and (z) otherassociated operating expenses.
• “Distributable Earnings”, or “DE”, as well as “DE After Taxes and Related Payables” are derived from Apollo’s segment reported results, and are supplemental measuresto assess performance and the amount of earnings available for distribution to Class A shareholders, holders of RSUs that participate in distributions and holders of AOGUnits. DE represents the amount of net realized earnings without the effects of the consolidation of any of the related funds. DE, which is a component of EI, is the sum acrossall segments of (i) total management fees and advisory and transaction fees, (ii) other income (loss), (iii) realized performance fees, excluding realizations received in the formof shares and (iv) realized investment income, less (x) compensation expense, excluding the expense related to equity-based awards, (y) realized profit sharing expense, and(z) non-compensation expenses, excluding depreciation and amortization expense. DE After Taxes and Related Payables represents DE less estimated current corporate, localand non-U.S. taxes as well as the payable under Apollo’s tax receivable agreement. DE After Taxes and Related Payables is net of preferred distributions, if any, to Series Aand Series B Preferred shareholders.
34

Non-GAAP Financial Information & Definitions Cont’d• “Assets Under Management”, or “AUM”, refers to the assets of the funds, partnerships and accounts to which we provide investment management, advisory, or certain other investment-
related services, including, without limitation, capital that such funds, partnerships and accounts have the right to call from investors pursuant to capital commitments. Our AUM equalsthe sum of:
i) the fair value of the investments of the private equity funds, partnerships and accounts we manage or advise plus the capital that such funds, partnerships and accounts are entitledto call from investors pursuant to capital commitments;
ii) the net asset value, or “NAV,” of the credit funds, partnerships and accounts for which we provide investment management or advisory services, other than certain collateralized loanobligations (“CLOs”) and collateralized debt obligations (“CDOs”), which have a fee-generating basis other than the mark-to-market value of the underlying assets, plus used oravailable leverage and/or capital commitments;
iii) the gross asset value or net asset value of the real assets funds, partnerships and accounts we manage, and the structured portfolio company investments of the funds, partnershipsand accounts we manage or advise, which includes the leverage used by such structured portfolio company investments;
iv) the incremental value associated with the reinsurance investments of the portfolio company assets we manage or advise; and
v) the fair value of any other assets that we manage or advise for the funds, partnerships and accounts to which we provide investment management, advisory, or certain other investment-related services, plus unused credit facilities, including capital commitments to such funds, partnerships and accounts for investments that may require pre-qualification or otherconditions before investment plus any other capital commitments to such funds, partnerships and accounts available for investment that are not otherwise included in the clausesabove.
Our AUM measure includes Assets Under Management for which we charge either nominal or zero fees. Our AUM measure also includes assets for which we do not have investmentdiscretion, including certain assets for which we earn only investment-related service fees, rather than management or advisory fees. Our definition of AUM is not based on any definitionof Assets Under Management contained in our operating agreement or in any of our Apollo fund management agreements. We consider multiple factors for determining what shouldbe included in our definition of AUM. Such factors include but are not limited to (1) our ability to influence the investment decisions for existing and available assets; (2) our ability togenerate income from the underlying assets in our funds; and (3) the AUM measures that we use internally or believe are used by other investment managers. Given the differences inthe investment strategies and structures among other alternative investment managers, our calculation of AUM may differ from the calculations employed by other investment managersand, as a result, this measure may not be directly comparable to similar measures presented by other investment managers. Our calculation also differs from the manner in which ouraffiliates registered with the SEC report “Regulatory Assets Under Management” on Form ADV and Form PF in various ways.
We use AUM, Capital Deployed and Dry Powder as performance measurements of our investment activities, as well as to monitor fund size in relation to professional resource andinfrastructure needs.
• “AUM with Future Management Fee Potential” refers to the committed uninvested capital portion of total AUM not currently earning management fees. The amount depends onthe specific terms and conditions of each fund.
• “Fee-Generating AUM” consists of assets of the funds, partnerships and accounts to which we provide investment management, advisory, or certain other investment-related servicesand on which we earn management fees, monitoring fees or other investment-related fees pursuant to management or other fee agreements on a basis that varies among the Apollofunds, partnerships and accounts. Management fees are normally based on “net asset value,” “gross assets,” “adjusted par asset value,” “adjusted cost of all unrealized portfolioinvestments,” “capital commitments,” “adjusted assets,” “stockholders’ equity,” “invested capital” or “capital contributions,” each as defined in the applicable management agreement.Monitoring fees, also referred to as advisory fees, with respect to the structured portfolio company investments of the funds, partnerships and accounts we manage or advise, aregenerally based on the total value of such structured portfolio company investments, which normally includes leverage, less any portion of such total value that is already consideredin Fee-Generating AUM.
• “Performance Fee-Eligible AUM” refers to the AUM that may eventually produce performance fees. All funds for which we are entitled to receive a performance fee allocation orincentive fee are included in Performance Fee-Eligible AUM, which consists of the following:
• “Performance Fee-Generating AUM”, which refers to invested capital of the funds, partnerships and accounts we manage, advise, or to which we provide certain other investment-related services, that is currently above its hurdle rate or preferred return, and profit of such funds, partnerships and accounts is being allocated to, or earned by, the general partnerin accordance with the applicable limited partnership agreements or other governing agreements;
• “AUM Not Currently Generating Performance Fees”, which refers to invested capital of the funds, partnerships and accounts we manage, advise, or to which we provide certainother investment-related services that is currently below its hurdle rate or preferred return; and
• “Uninvested Performance Fee-Eligible AUM”, which refers to capital of the funds, partnerships and accounts we manage, advise, or to which we provide certain other investment-related services that is available for investment or reinvestment subject to the provisions of applicable limited partnership agreements or other governing agreements, which capitalis not currently part of the NAV or fair value of investments that may eventually produce performance fees allocable to, or earned by, the general partner.
35

Non-GAAP Financial Information & Definitions Cont’d• “Advisory” refers to certain assets advised by Apollo Asset Management Europe PC LLP, a wholly-owned subsidiary of Apollo Asset Management Europe LLP (collectively, “AAME”). The AAME
entities are subsidiaries of Apollo. Until AAME receives full authorization by the U.K. Financial Conduct Authority (“FCA”), references to AAME mean AAME and Apollo Management InternationalLLP, an existing FCA authorized and regulated subsidiary of Apollo in the United Kingdom.
• “Capital deployed” or “Deployment” is the aggregate amount of capital that has been invested during a given period (which may, in certain cases, include leverage) by (i) our drawdown funds(ii) SIAs that have a defined maturity date and (iii) funds and SIAs in our real estate debt strategy.
• “Drawdown” refers to commitment-based funds and certain SIAs in which investors make a commitment to provide capital at the formation of such funds and SIAs and deliver capital when calledas investment opportunities become available. It includes assets of Athene Holding Ltd. (“Athene Holding”) and its subsidiaries (collectively “Athene”) managed by Athene Asset Management, LLC(“Athene Asset Management” or “AAM”) that are invested in commitment-based funds.
• “Distributable Earnings Shares Outstanding” or “DE Shares Outstanding” represents Non-GAAP Diluted Shares Outstanding and unvested RSUs that participate in distributions. Managementuses this measure in determining DE per share, FRE per share, as well as DE After Taxes and Related Payables per share described below.
• “Dry Powder” represents the amount of capital available for investment or reinvestment subject to the provisions of the applicable limited partnership agreements or other governing agreementsof the funds, partnerships and accounts we manage. Dry powder excludes uncalled commitments which can only be called for fund fees and expenses.
• “Gross IRR” of a private equity fund represents the cumulative investment-related cash flows (i) for a given investment for the fund or funds which made such investment, and (ii) for a given fund,in the relevant fund itself (and not any one investor in the fund), in each case, on the basis of the actual timing of investment inflows and outflows (for unrealized investments assuming dispositionon March 31, 2018 or other date specified) aggregated on a gross basis quarterly, and the return is annualized and compounded before management fees, performance fees and certain otherexpenses (including interest incurred by the fund itself) and measures the returns on the fund’s investments as a whole without regard to whether all of the returns would, if distributed, be payableto the fund’s investors. In addition, gross IRRs at the fund level will differ from those at the individual investor level as a result of, among other factors, timing of investor-level inflows andoutflows. Gross IRR does not represent the return to any fund investor.
• “Gross IRR” of a credit fund represents the annualized return of a fund based on the actual timing of all cumulative fund cash flows before management fees, performance fees allocated to thegeneral partner and certain other expenses. Calculations may include certain investors that do not pay fees. The terminal value is the net asset value as of the reporting date. Non- U.S. dollardenominated (“USD”) fund cash flows and residual values are converted to USD using the spot rate as of the reporting date. In addition, gross IRRs at the fund level will differ from those at theindividual investor level as a result of, among other factors, timing of investor-level inflows and outflows. Gross IRR does not represent the return to any fund investor.
• “Gross IRR” of a real assets fund represents the cumulative investment-related cash flows in the fund itself (and not any one investor in the fund), on the basis of the actual timing of cash inflowsand outflows (for unrealized investments assuming disposition on March 31, 2018 or other date specified) starting on the date that each investment closes, and the return is annualized andcompounded before management fees, performance fees, and certain other expenses (including interest incurred by the fund itself) and measures the returns on the fund’s investments as a wholewithout regard to whether all of the returns would, if distributed, be payable to the fund’s investors. Non-USD fund cash flows and residual values are converted to USD using the spot rate as ofthe reporting date. In addition, gross IRRs at the fund level will differ from those at the individual investor level as a result of, among other factors, timing of investor-level inflows and outflows. GrossIRR does not represent the return to any fund investor.
• “Gross Return” of a credit or real assets fund is the monthly or quarterly time-weighted return that is equal to the percentage change in the value of a fund’s portfolio, adjusted for all contributionsand withdrawals (cash flows) before the effects of management fees, incentive fees allocated to the general partner, or other fees and expenses. Returns of Athene sub-advised portfolios andCLOs represent the gross returns on invested assets, which exclude cash. Returns over multiple periods are calculated by geometrically linking each period’s return over time.
• “Inflows” represents (i) at the individual segment level, subscriptions, commitments, and other increases in available capital, such as acquisitions or leverage, net of inter-segment transfers, and(ii) on an aggregate basis, the sum of inflows across the private equity, credit and real assets segments.
• “Liquid/Performing” includes CLOs and other performing credit vehicles, hedge fund style credit funds, structured credit funds and SIAs, as well as sub-advised managed accounts owned by orrelated to Athene. Certain commitment-based SIAs are included as the underlying assets are liquid.
• “Net IRR” of a private equity fund means the gross IRR applicable to a fund, including returns for related parties which may not pay fees or performance fees, net of management fees, certainexpenses (including interest incurred or earned by the fund itself) and realized performance fees all offset to the extent of interest income, and measures returns at the fund level on amounts that,if distributed, would be paid to investors of the fund. To the extent that a fund exceeds all requirements detailed within the applicable fund agreement, the estimated unrealized value is adjustedsuch that a percentage of up to 20.0% of the unrealized gain is allocated to the general partner of such fund, thereby reducing the balance attributable to fund investors. In addition, net IRR atthe fund level will differ from that at the individual investor level as a result of, among other factors, timing of investor-level inflows and outflows. Net IRR does not represent the return to anyfund investor.
• “Net IRR” of a credit fund represents the annualized return of a fund after management fees, performance fees allocated to the general partner and certain other expenses, calculated on investorsthat pay such fees. The terminal value is the net asset value as of the reporting date. Non-USD fund cash flows and residual values are converted to USD using the spot rate as of the reportingdate. In addition, net IRR at the fund level will differ from that at the individual investor level as a result of, among other factors, timing of investor-level inflows and outflows. Net IRR does notrepresent the return to any fund investor.
36

Non-GAAP Financial Information & Definitions Cont’d• “Net IRR” of a real assets fund represents the cumulative cash flows in the fund (and not any one investor in the fund), on the basis of the actual timing of cash inflows received from and outflows
paid to investors of the fund (assuming the ending net asset value as of March 31, 2018 or other date specified is paid to investors), excluding certain non-fee and non-performance fee bearingparties, and the return is annualized and compounded after management fees, performance fees, and certain other expenses (including interest incurred by the fund itself) and measures thereturns to investors of the fund as a whole. Non-USD fund cash flows and residual values are converted to USD using the spot rate as of the reporting date. In addition, net IRR at the fund levelwill differ from that at the individual investor level as a result of, among other factors, timing of investor-level inflows and outflows. Net IRR does not represent the return to any fund investor.
• “Net Return” of a credit or real assets fund represents the Gross Return after management fees, incentive fees allocated to the general partner, or other fees and expenses. Returns of Athenesub-advised portfolios and CLOs represent the gross or net returns on invested assets, which exclude cash. Returns over multiple periods are calculated by geometrically linking each period’sreturn over time.
• “Non-GAAP Diluted Shares Outstanding” is calculated using the GAAP outstanding Class A shares plus non-GAAP adjustments assuming (i) the exchange of all of the AOG Units for Class Ashares and (ii) the settlement of the vested RSUs in the form of Class A shares during the period. Management uses this measure, taking into account the unvested RSUs that participate indistributions, in determining our Class A shares eligible for cash distributions.
• “Non-GAAP Weighted Average Diluted Shares Outstanding” is calculated using the GAAP weighted average outstanding Class A shares plus non-GAAP adjustments assuming (i) the exchangeof all of the AOG Units for Class A shares and (ii) the settlement of the weighted average vested RSUs in the form of Class A shares during the period. Management uses this measure in determiningEI and ENI per share.
• “Permanent Capital Vehicles” refers to (a) assets that are owned by or related to Athene (“ATH”) or Athora Holding Ltd. (“Athora”), (b) assets that are owned by or related to MidCap FinCoDesignated Activity Company (“MidCap”) and managed by Apollo, (c) assets of publicly traded vehicles managed by Apollo such as Apollo Investment Corporation (“AINV”), Apollo CommercialReal Estate Finance, Inc. (“ARI”), Apollo Tactical Income Fund Inc. (“AIF”), and Apollo Senior Floating Rate Fund Inc. (“AFT”), in each case that do not have redemption provisions or a requirementto return capital to investors upon exiting the investments made with such capital, except as required by applicable law and (d) a non-traded business development company from which Apolloearns certain investment-related service fees. The investment management agreements of AINV, AIF and AFT have one year terms, are reviewed annually and remain in effect only if approved bythe boards of directors of such companies or by the affirmative vote of the holders of a majority of the outstanding voting shares of such companies, including in either case, approval by a majorityof the directors who are not “interested persons” as defined in the Investment Company Act of 1940. In addition, the investment management agreements of AINV, AIF and AFT may be terminatedin certain circumstances upon 60 days’ written notice. The investment management agreement of ARI has a one year term and is reviewed annually by ARI’s board of directors and may beterminated under certain circumstances by an affirmative vote of at least two-thirds of ARI’s independent directors. The investment management or advisory arrangements between MidCap andApollo and Athene and Apollo, may also be terminated under certain circumstances.
• “Private Equity fund appreciation (depreciation)” refers to gain (loss) and income for the traditional private equity funds (i.e., Funds I-VIII), ANRP I & II, Apollo Special Situations Fund, L.P. andAION Capital Partners Limited (“AION”) for the periods presented on a total return basis before giving effect to fees and expenses. The performance percentage is determined by dividing (a) thechange in the fair value of investments over the period presented, minus the change in invested capital over the period presented, plus the realized value for the period presented, by (b) thebeginning unrealized value for the period presented plus the change in invested capital for the period presented. Returns over multiple periods are calculated by geometrically linking each period’sreturn over time;
• “Realized Value” refers to all cash investment proceeds received by the relevant Apollo fund, including interest and dividends, but does not give effect to management fees, expenses, incentivecompensation or performance fees to be paid by such Apollo fund.
• “Remaining Cost” represents the initial investment of the fund in a portfolio investment, reduced for any return of capital distributed to date on such portfolio investment.
• “Total Invested Capital” refers to the aggregate cash invested by the relevant Apollo fund and includes capitalized costs relating to investment activities, if any, but does not give effect to cashpending investment or available for reserves.
• “Total Value” represents the sum of the total Realized Value and Unrealized Value of investments.
• “Traditional Private Equity fund appreciation (depreciation)” refers to gain (loss) and income for the traditional private equity funds (i.e., Funds I-VIII) for the periods presented on a totalreturn basis before giving effect to fees and expenses. The performance percentage is determined by dividing (a) the change in the fair value of investments over the period presented, minus thechange in invested capital over the period presented, plus the realized value for the period presented, by (b) the beginning unrealized value for the period presented plus the change in investedcapital for the period presented. Returns over multiple periods are calculated by geometrically linking each period’s return over time;
• “Unrealized MOIC” or “Unrealized Multiple of Invested Capital” is calculated as Unrealized Value divided by Remaining Cost;
• “Unrealized Value” refers to the fair value consistent with valuations determined in accordance with GAAP, for investments not yet realized and may include pay in kind, accrued interest anddividends receivable, if any, and before the effect of certain taxes. In addition, amounts include committed and funded amounts for certain investments; and
• “Vintage Year” refers to the year in which a fund’s final capital raise occurred, or, for certain funds, the year in which a fund’s investment period commences as per its governing agreements.
37

Forward Looking Statements
In this presentation, references to “Apollo,” “we,” “us,” “our” and the “Company” refer collectively to Apollo Global Management, LLC, together with its consolidatedsubsidiaries. This presentation may contain forward-looking statements that are within the meaning of Section 27A of the Securities Act of 1933, as amended, and Section 21Eof the Securities Exchange Act of 1934, as amended. These statements include, but are not limited to, discussions related to Apollo’s expectations regarding the performanceof its business, its liquidity and capital resources and the other non-historical statements in the discussion and analysis. These forward-looking statements are based onmanagement’s beliefs, as well as assumptions made by, and information currently available to, management. When used in this presentation, the words “believe,” “anticipate,”“estimate,” “expect,” “intend” and similar expressions are intended to identify forward-looking statements. Although management believes that the expectations reflectedin these forward-looking statements are reasonable, it can give no assurance that these expectations will prove to have been correct. These statements are subject to certainrisks, uncertainties and assumptions, including risks relating to our dependence on certain key personnel, our ability to raise new private equity, credit or real assets funds,market conditions, generally, our ability to manage our growth, fund performance, changes in our regulatory environment and tax status, the variability of our revenues,net income and cash flow, our use of leverage to finance our businesses and investments by our funds and litigation risks, among others. We believe these factors includebut are not limited to those described under the section entitled “Risk Factors” in Apollo’s annual report on Form 10-K filed with the Securities and Exchange Commission(“SEC”) on February 12, 2018, as such factors may be updated from time to time in our periodic filings with the SEC, which are accessible on the SEC’s website at www.sec.gov.These factors should not be construed as exhaustive and should be read in conjunction with the other cautionary statements that are included in this presentation and inother filings. We undertake no obligation to publicly update or review any forward-looking statements, whether as a result of new information, future developments orotherwise, except as required by applicable law. This presentation does not constitute an offer of any Apollo fund.
38