apes-area2b-energy flow
TRANSCRIPT

8/4/2019 APES-Area2b-Energy Flow
http://slidepdf.com/reader/full/apes-area2b-energy-flow 1/50
Area IIB: The Living World
Energy Flow

8/4/2019 APES-Area2b-Energy Flow
http://slidepdf.com/reader/full/apes-area2b-energy-flow 2/50
Ecosystem Components
Ecosystems are composed of two
main components abiotic factors include all of the non-living
components
biotic factors include all of the biologicalcomponents of the ecosystem autotrophs (or producers) require only
inorganic nutrients and an external energy
source to produce food organic nutrients photoautotrophs use light for energy chemoautotrophs use chemicals for energy 6CO
2+ 6H
2O C
6H
12O
6+ 6O
2

8/4/2019 APES-Area2b-Energy Flow
http://slidepdf.com/reader/full/apes-area2b-energy-flow 3/50
Ecosystem Components
biotic factors, continued
heterotrophs (or consumers) require asource of organic nutrients C6H12O6 + 6O2 6CO2 + 6H2O herbivores are animals that eat plants carnivores feed on other animals omnivores eat plants or animals detritivores convert waste into food
decomposers (mostly bacteria and
fungi) recycle organic matter by breakingdown dead organic material
detritus feeders primarily eat detritus(decomposing organic matter) (termites,many beetles, etc.)

8/4/2019 APES-Area2b-Energy Flow
http://slidepdf.com/reader/full/apes-area2b-energy-flow 4/50
MushroomWoodreduced
to powder
Long-hornedbeetle holes
Bark beetleengraving
Carpenterant
galleries
Termite andcarpenter
antwork
Dry rot fungus
Detritus feeders Decomposers
Time progression
Powder broken down by decomposers
into plant nutrients in soil
Fig. 4-16 The work of detritivores

8/4/2019 APES-Area2b-Energy Flow
http://slidepdf.com/reader/full/apes-area2b-energy-flow 5/50
Ecosystem Components
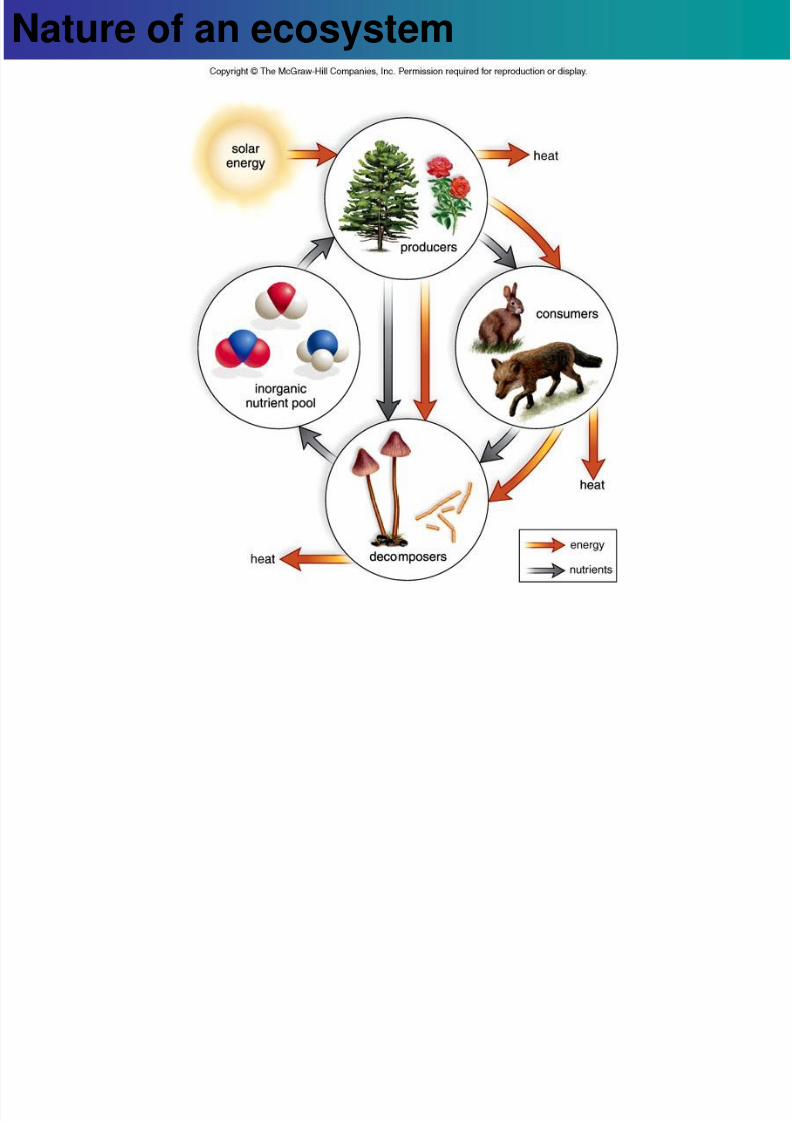
Energy flows through the populations
of an ecosystem, while chemicalscycle within and between ecosystems life is sustained by the sun, chemical
cycles, and gravity matter is cycled through the biosphere to be
reused gravity holds the atmosphere and causes
downward movement of matter

8/4/2019 APES-Area2b-Energy Flow
http://slidepdf.com/reader/full/apes-area2b-energy-flow 6/50
Ecosystem Components
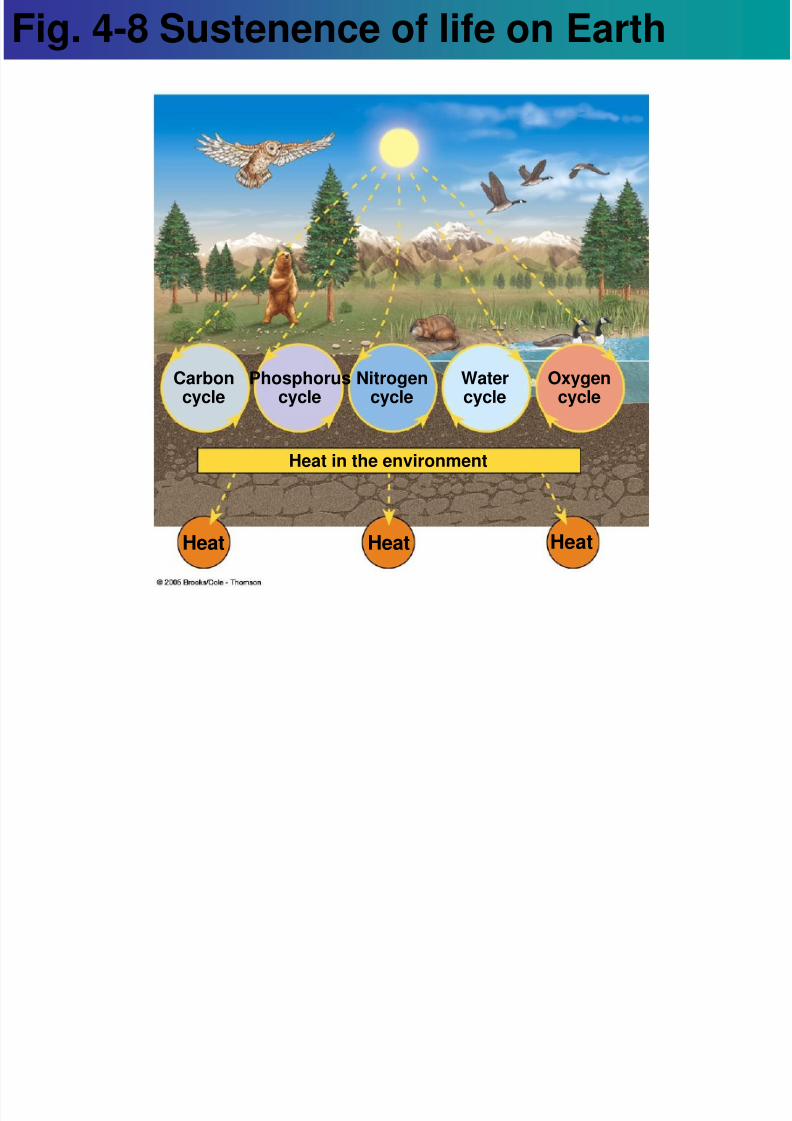
sustenance of life, continued
sunlight: there is one-way flow of high-quality energy
from the sun which eventually becomes low-quality energy and dissipated into space as
heat lights and warms the planet drives winds, ocean currents, and
precipitation powers cycling of matter the amount of energy reaching the Earth
through sunlight equals the amount ofenergy radiated by the Earth energy in = energy out
8/4/2019 APES-Area2b-Energy Flow
http://slidepdf.com/reader/full/apes-area2b-energy-flow 7/50
Carboncycle
Phosphoruscycle
Nitrogencycle
Watercycle
Oxygencycle
Heat in the environment
Heat Heat Heat
Fig. 4-8 Sustenence of life on Earth

8/4/2019 APES-Area2b-Energy Flow
http://slidepdf.com/reader/full/apes-area2b-energy-flow 8/50
Ecosystem Components
sustenance of life, continued
sunlight, continued 34% of energy from the sun is reflected by
the atmosphere 66% makes it into atmosphere of the energy that gets through:
80% warms the troposphere andevaporates and cycles water
1% generates winds 0.1% is used by plants, algae, and
bacteria for photosynthesis

8/4/2019 APES-Area2b-Energy Flow
http://slidepdf.com/reader/full/apes-area2b-energy-flow 9/50
Solarradiation
Energy in = Energy out
Reflected byatmosphere (34%)
UV radiation
Absorbedby ozone
Absorbedby the earth
Visiblelight
Lower stratosphere(ozone layer)
Troposphere
Heat
Greenhouseeffect
Radiated by
atmosphereas heat (66%)
Earth
Heat radiatedby the earth
Fig. 4-9 Flow of energy to, from Earth

8/4/2019 APES-Area2b-Energy Flow
http://slidepdf.com/reader/full/apes-area2b-energy-flow 10/50
Ecosystem Components
sustenance of life, continued
sunlight, continued the greenhouse effect helps Earth retain
heat infrared light is absorbed and re-radiated
by greenhouse gases (water vapor,carbon dioxide, methane, nitrous oxide,and ozone)
this causes the air to warm
8/4/2019 APES-Area2b-Energy Flow
http://slidepdf.com/reader/full/apes-area2b-energy-flow 11/50
Nature of an ecosystem

8/4/2019 APES-Area2b-Energy Flow
http://slidepdf.com/reader/full/apes-area2b-energy-flow 12/50
Fig. 4-15 Feeding relationships
Soil and
waternutrients
Producers(plants and
phytoplankton)
ConsumersFeeding on
Living Organisms
PrimaryConsumers
Feeding onProducers(rabbits, zooplankton)
Secondary & HigherConsumers Feeding on
Other Consumers(foxes, turtles, hawks)
Break downorganic matterfor recycling
Decomposers
(bacteria, fungi)
ConsumersFeeding on
Dead Organismsor the Organic Wastes of
Living Organisms
Detritus Feeders(crabs, termites)
Scavengers(vultures, hyenas)

8/4/2019 APES-Area2b-Energy Flow
http://slidepdf.com/reader/full/apes-area2b-energy-flow 13/50
Heat
Heat Heat
Heat
Heat
Abiotic chemicals(carbon dioxide,
oxygen, nitrogen,minerals)
Producers(plants)
Decomposers(bacteria, fungus)
Consumers(herbivores,carnivores)
Solarenergy
Fig. 4-17 Energy, chemicals, organisms
8/4/2019 APES-Area2b-Energy Flow
http://slidepdf.com/reader/full/apes-area2b-energy-flow 14/50
Matter cycling in ecosystems

8/4/2019 APES-Area2b-Energy Flow
http://slidepdf.com/reader/full/apes-area2b-energy-flow 15/50
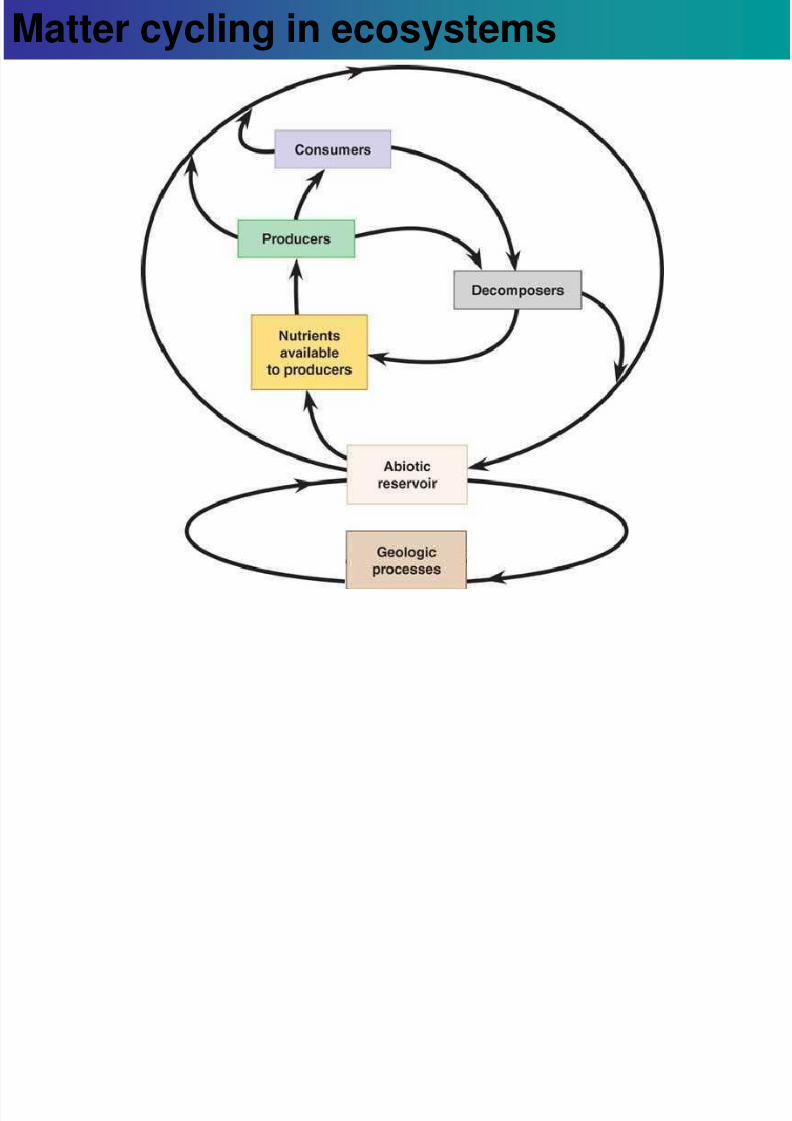
Matter cycling in ecosystems

8/4/2019 APES-Area2b-Energy Flow
http://slidepdf.com/reader/full/apes-area2b-energy-flow 16/50
Energy and Nutrient Flow

8/4/2019 APES-Area2b-Energy Flow
http://slidepdf.com/reader/full/apes-area2b-energy-flow 17/50
Energy Flow in Ecosystems
Food chains and food webs show
how energy moves in an ecosystem food chain: pathway (through a sequence
of organisms) along which food and energy
are transferred from level to level arrows show direction of energy transfer
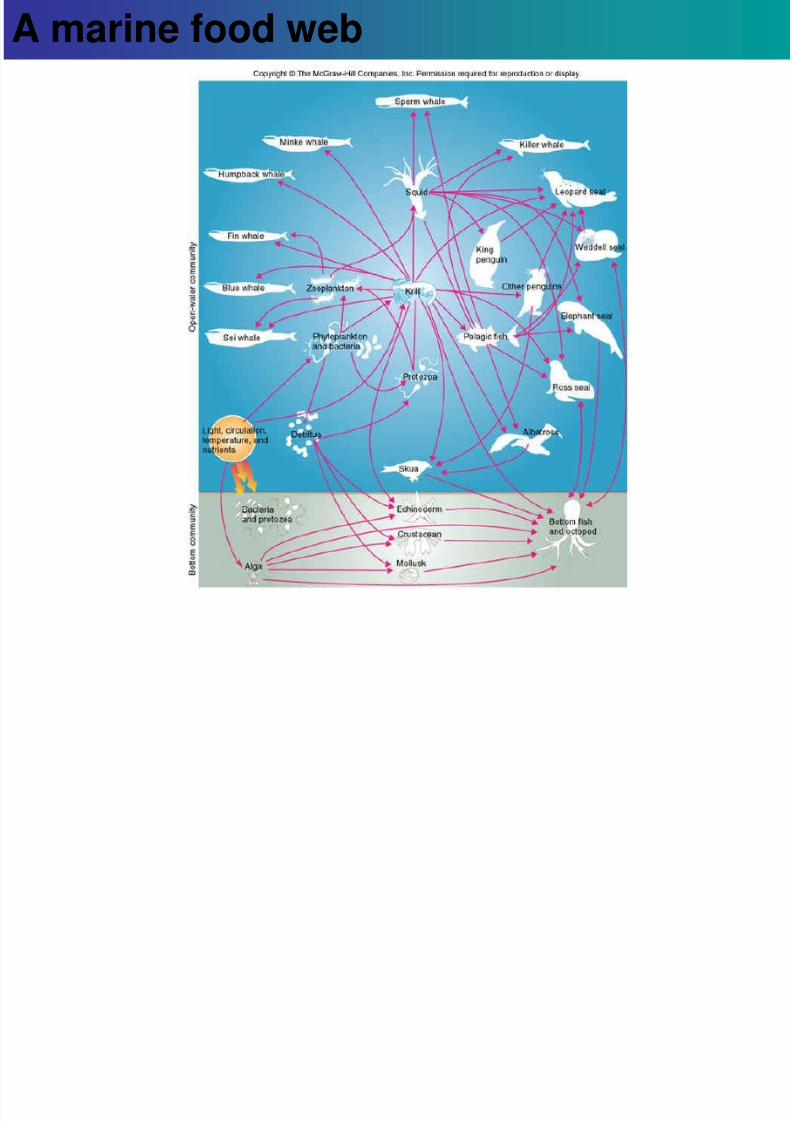
food web: complex network ofinterconnected food chains
trophic level: feeding level of an organismin a food chain
8/4/2019 APES-Area2b-Energy Flow
http://slidepdf.com/reader/full/apes-area2b-energy-flow 18/50
Energy Flow in Ecosystems
trophic levels, continued
first, some basic ecosystem processes: 1. production: rate of incorporation of
energy and materials into the bodies oforganisms
2. consumption: metabolic use of organicmaterials
3. decomposition: breakdown of organicmaterials into inorganic ones usable by
autotrophs carried out by prokaryotes and fungi links all trophic levels
8/4/2019 APES-Area2b-Energy Flow
http://slidepdf.com/reader/full/apes-area2b-energy-flow 19/50
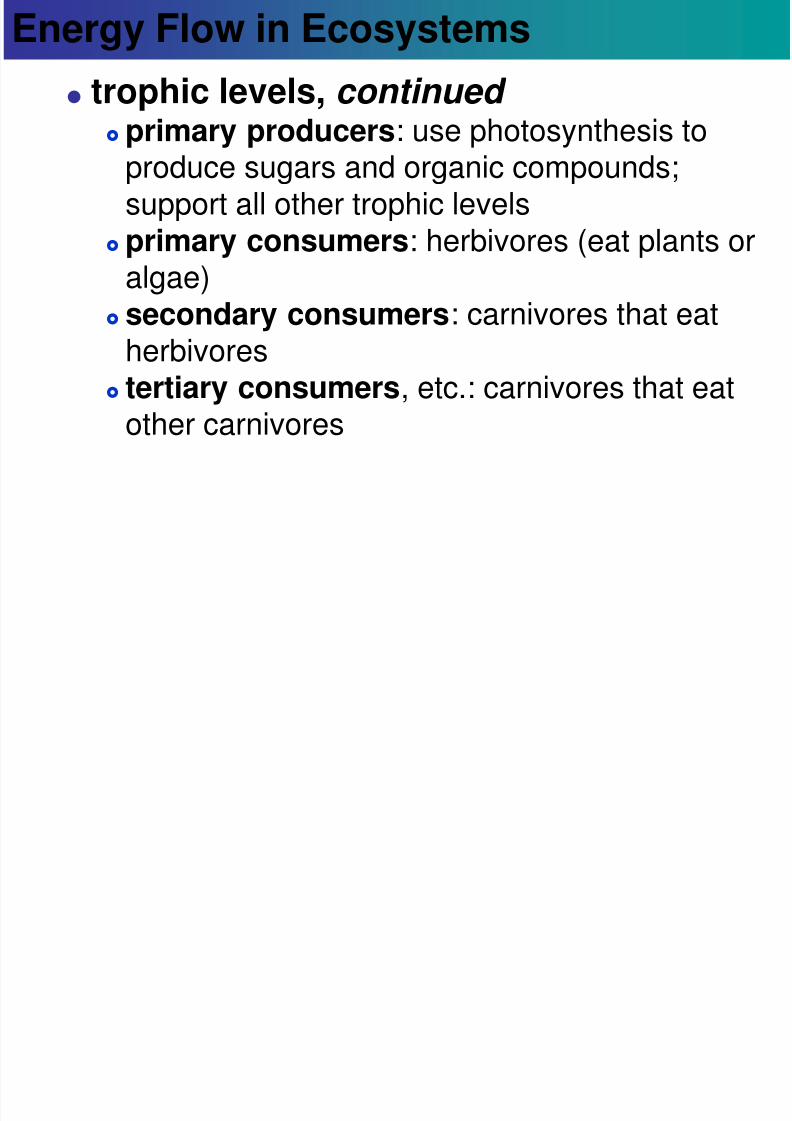
Energy Flow in Ecosystems
trophic levels, continued
primary producers: use photosynthesis toproduce sugars and organic compounds;support all other trophic levels
primary consumers: herbivores (eat plants or
algae) secondary consumers: carnivores that eat
herbivores tertiary consumers, etc.: carnivores that eat
other carnivores
8/4/2019 APES-Area2b-Energy Flow
http://slidepdf.com/reader/full/apes-area2b-energy-flow 20/50
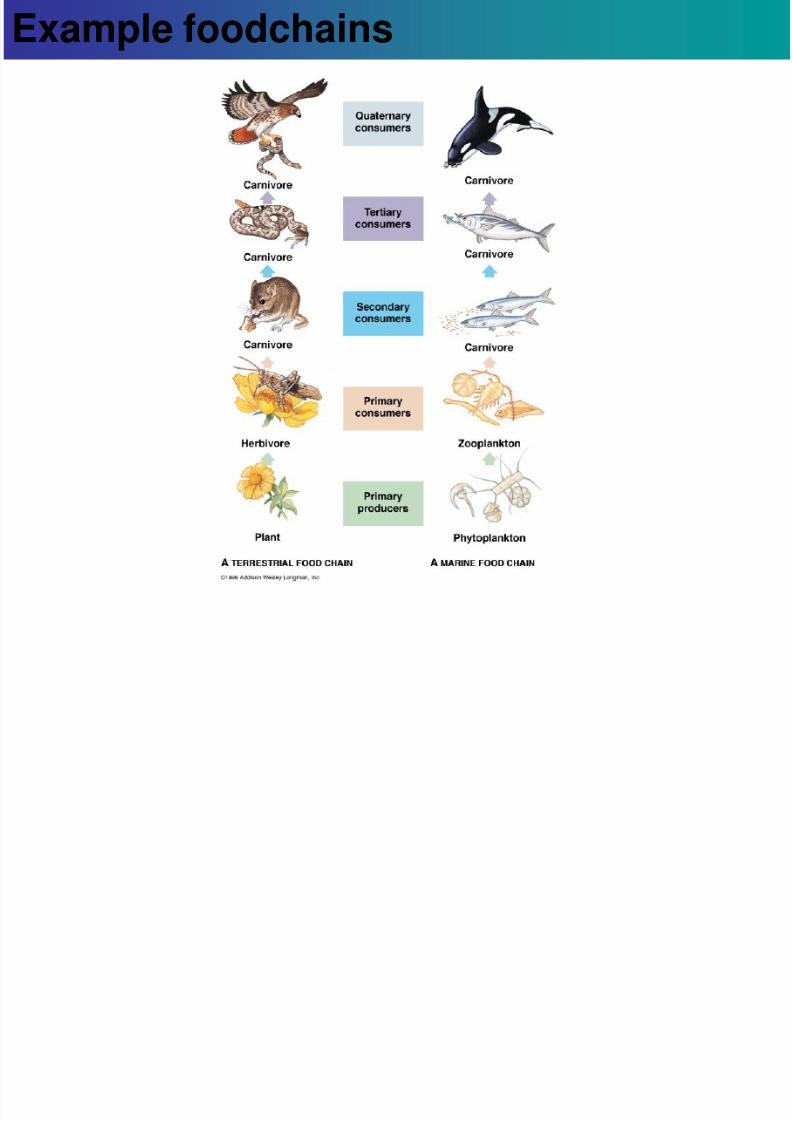
Example foodchains
Fi F d h i
8/4/2019 APES-Area2b-Energy Flow
http://slidepdf.com/reader/full/apes-area2b-energy-flow 21/50
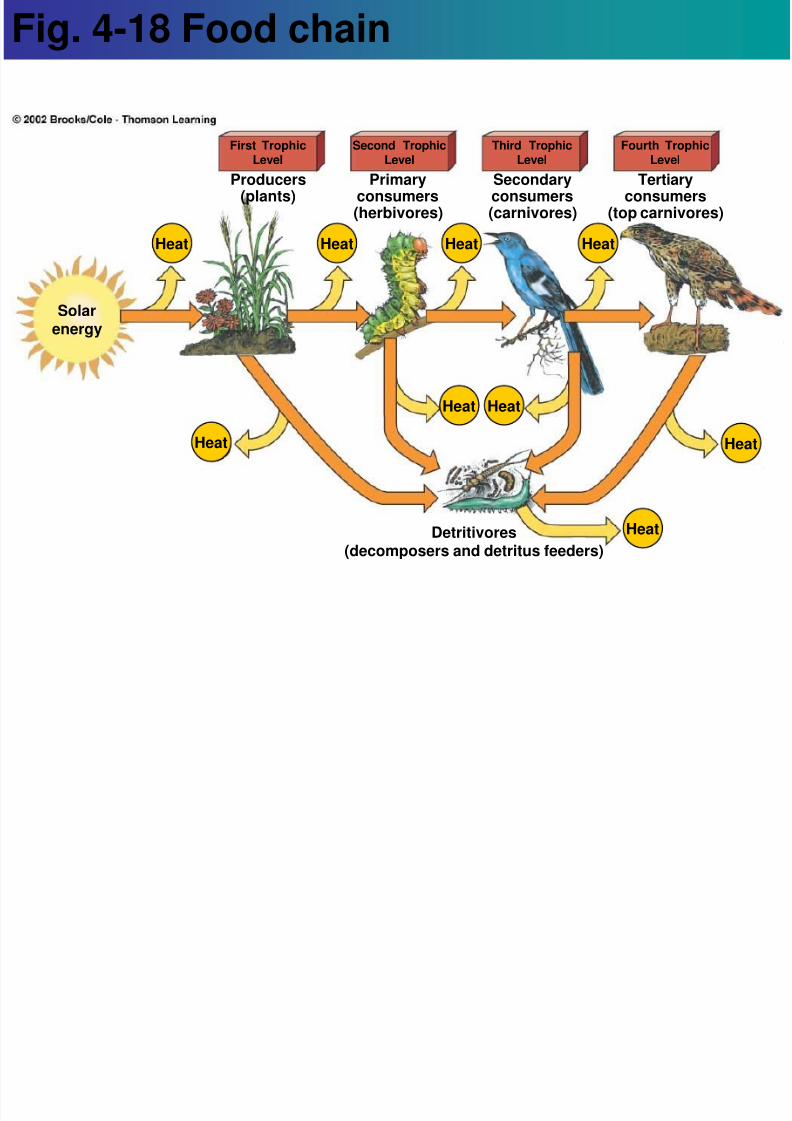
Heat Heat Heat Heat
Heat
Heat
Heat
First TrophicLevel
Second TrophicLevel
Third TrophicLevel
Fourth TrophicLevel
Solarenergy
Producers(plants)
Primaryconsumers(herbivores)
Tertiaryconsumers
(top carnivores)
Secondaryconsumers(carnivores)
Detritivores
(decomposers and detritus feeders)
Heat Heat
Fig. 4-18 Food chain
A i f d b
8/4/2019 APES-Area2b-Energy Flow
http://slidepdf.com/reader/full/apes-area2b-energy-flow 22/50
A marine food web
Fi 4 19 A i f d b

8/4/2019 APES-Area2b-Energy Flow
http://slidepdf.com/reader/full/apes-area2b-energy-flow 23/50
Humans
Blue whale Sperm whale
Crabeater seal
Killerwhale Elephant
seal
Leopardseal
Adéliepenguins Petrel
Fish
Squid
Carnivorous plankton
Krill
Phytoplankton
Herbivorouszooplankton
Emperorpenguin
Fig. 4-19 Antarctic food web
E Fl i E t

8/4/2019 APES-Area2b-Energy Flow
http://slidepdf.com/reader/full/apes-area2b-energy-flow 24/50
Energy Flow in Ecosystems
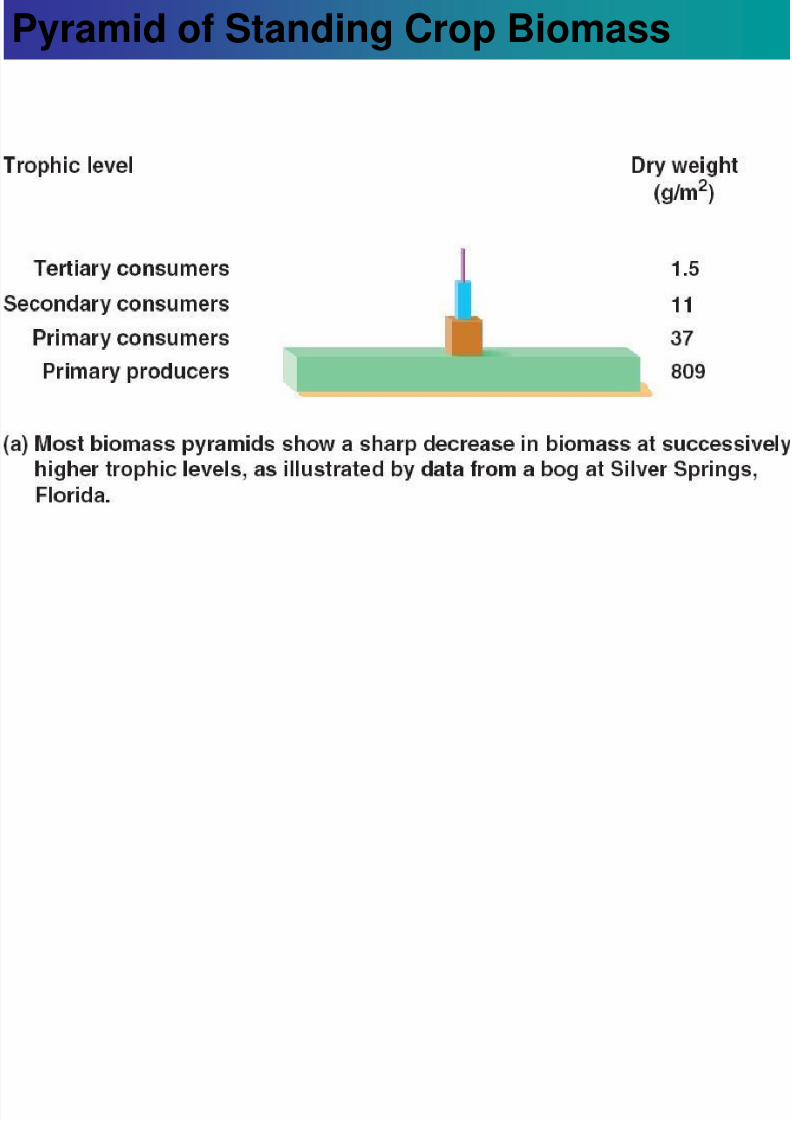
Pyramids are used to represent
energy available to each trophic level biomass: dry weight of all organic matter
contained in organisms
you eat biomass, and you contain biomass energy transfer through biomass is
inefficient percent usable energy from one trophic level is
called ecological efficiency ranges from 2% to 40% (usually 10%) explains why top carnivores are few
Fi 4 20 P id f fl

8/4/2019 APES-Area2b-Energy Flow
http://slidepdf.com/reader/full/apes-area2b-energy-flow 25/50
Heat
Heat
Heat
Heat
Heat
10
100
1,000
10,000Usable energy
available ateach tropic level(in kilocalories)
Producers(phytoplankton)
Primaryconsumers
(zooplankton)
Secondaryconsumers
(perch)
Tertiaryconsumers
(human)
Decomposers
Fig. 4-20 Pyramid of energy flow
Fi 4 21 A l fl

8/4/2019 APES-Area2b-Energy Flow
http://slidepdf.com/reader/full/apes-area2b-energy-flow 26/50
Top carnivores
Carnivores
Herbivores
Producers
5,060
Decomposers/detritivores
20,810
3,368
383
21
Fig. 4-21 Annual energy flow
P id f N t P d ti it

8/4/2019 APES-Area2b-Energy Flow
http://slidepdf.com/reader/full/apes-area2b-energy-flow 27/50
Pyramid of Net Productivity
P id f N b

8/4/2019 APES-Area2b-Energy Flow
http://slidepdf.com/reader/full/apes-area2b-energy-flow 28/50
Pyramid of Numbers
P id f St di C Bi
8/4/2019 APES-Area2b-Energy Flow
http://slidepdf.com/reader/full/apes-area2b-energy-flow 29/50
Pyramid of Standing Crop Biomass
P id f St di C Bi

8/4/2019 APES-Area2b-Energy Flow
http://slidepdf.com/reader/full/apes-area2b-energy-flow 30/50
Pyramid of Standing Crop Biomass
Energy Flow in Ecosystems

8/4/2019 APES-Area2b-Energy Flow
http://slidepdf.com/reader/full/apes-area2b-energy-flow 31/50
Energy Flow in Ecosystems
Producers produce biomass at
different rates in differentecosystems energy budget depends on primary
productivity primary productivity: amount of light
energy converted to chemical energy by
autotrophs in a given time period can be measured as biomass added/area/time(g/m2 /yr)
Energy Flow in Ecosystems

8/4/2019 APES-Area2b-Energy Flow
http://slidepdf.com/reader/full/apes-area2b-energy-flow 32/50
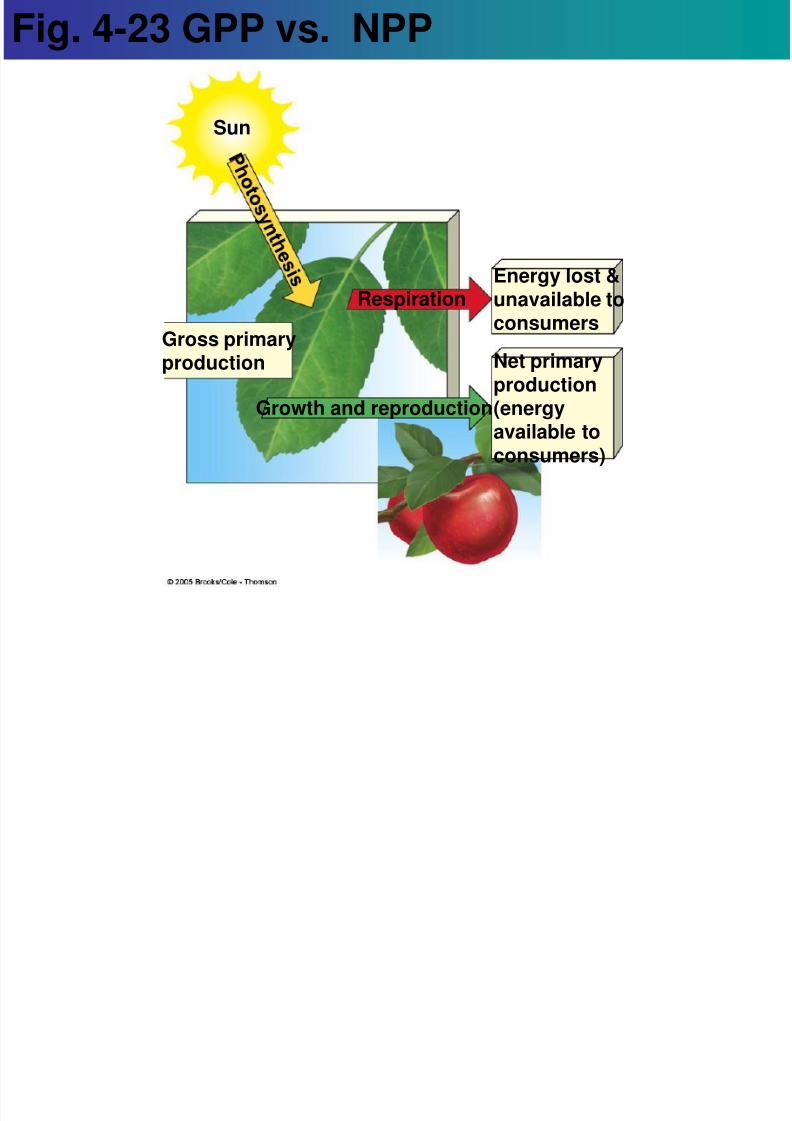
Energy Flow in Ecosystems
primary productivity, continued
gross primary productivity (GPP) is totalproduction of chemical energy produced byautotrophs producers use some of the biomass they
produce to stay alive, grow, etc., so not allof it is available to higher trophic levels
the amount available to higher levels is callednet primary productivity (NPP) NPP = GPP – R (where R means
respiration: plant’s own energy needs)
Fig 4 23 GPP vs NPP
8/4/2019 APES-Area2b-Energy Flow
http://slidepdf.com/reader/full/apes-area2b-energy-flow 33/50
Fig. 4-23 GPP vs. NPP
Sun
Gross primaryproduction
Respiration Energy lost &unavailable toconsumers
Growth and reproduction
Net primaryproduction(energyavailable toconsumers)
Fig 4 24 NPP by zone

8/4/2019 APES-Area2b-Energy Flow
http://slidepdf.com/reader/full/apes-area2b-energy-flow 34/50
Fig. 4-24 NPP by zone
Swamps and marshes
Tropical rain forest
Temperate forest
Northern coniferous forest (taiga)
Savanna
Agricultural land
Woodland and shrubland
Temperate grassland
Tundra (arctic and alpine)
Desert scrub
Extreme desert
Estuaries
Lakes and streams
Continental shelf
Terrestrial Ecosystems
Open ocean
Aquatic Ecosystems
800 1,600 2,400 3,200 4,000 4,800 5,600 6,400 7,200 8,000 8,800 9,600
Average net primary productivity (kcal/m2/yr)
Productivity of Ecosystems

8/4/2019 APES-Area2b-Energy Flow
http://slidepdf.com/reader/full/apes-area2b-energy-flow 35/50
Productivity of Ecosystems
Energy Flow in Ecosystems

8/4/2019 APES-Area2b-Energy Flow
http://slidepdf.com/reader/full/apes-area2b-energy-flow 36/50
Energy Flow in Ecosystems
primary productivity, continued
most productive communities (per unit area) algae beds and reefs, swamps/marshes tropical forests
estuaries least productive communities (per unit area)
desert alpine/tundra open ocean
Energy Flow in Ecosystems
8/4/2019 APES-Area2b-Energy Flow
http://slidepdf.com/reader/full/apes-area2b-energy-flow 37/50
Energy Flow in Ecosystems
NPP limits the number of consumers
on the planet only the biomass represented by NPP is
available as food to consumers, and
producers are limited in how fast they canproduce biomass Are humans using biomass faster than it
can be regenerated? If yes, bad things willprobably happen.
think sustainability
4 3 Ecosystem Components

8/4/2019 APES-Area2b-Energy Flow
http://slidepdf.com/reader/full/apes-area2b-energy-flow 38/50
4-3 Ecosystem Components
Biodiversity is a renewable resource
found in the Earth’s variety of genes,species, ecosystems, and ecosystemprocesses genetic diversity: variety of genetic material
within a species or population species diversity: number of different
species in different habitats ecological: variety of ecosystems in area functional: biological and chemical
processes needed for survival
Fig 4 11 Freshwater ecosystem
8/4/2019 APES-Area2b-Energy Flow
http://slidepdf.com/reader/full/apes-area2b-energy-flow 39/50
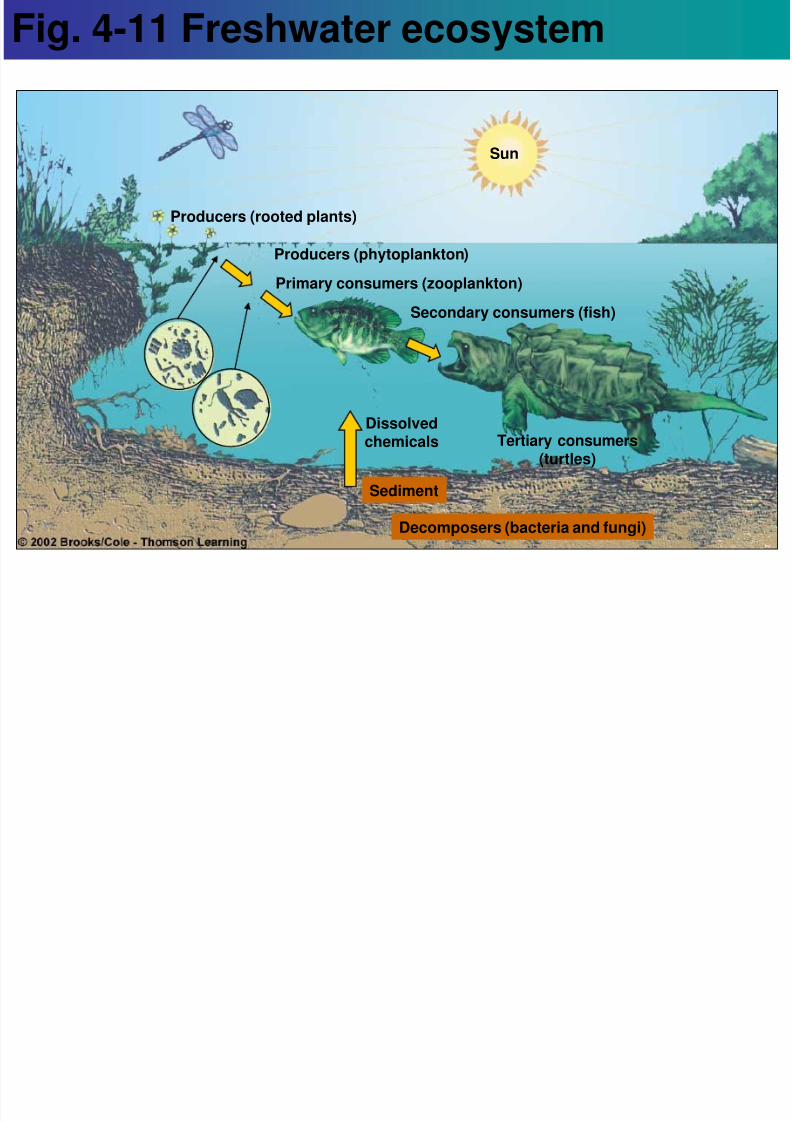
Sun
Producers (rooted plants)
Producers (phytoplankton)
Primary consumers (zooplankton)
Secondary consumers (fish)
Dissolvedchemicals Tertiary consumers
(turtles)
Sediment
Decomposers (bacteria and fungi)
Fig. 4-11 Freshwater ecosystem
Fig 7 8
8/4/2019 APES-Area2b-Energy Flow
http://slidepdf.com/reader/full/apes-area2b-energy-flow 40/50
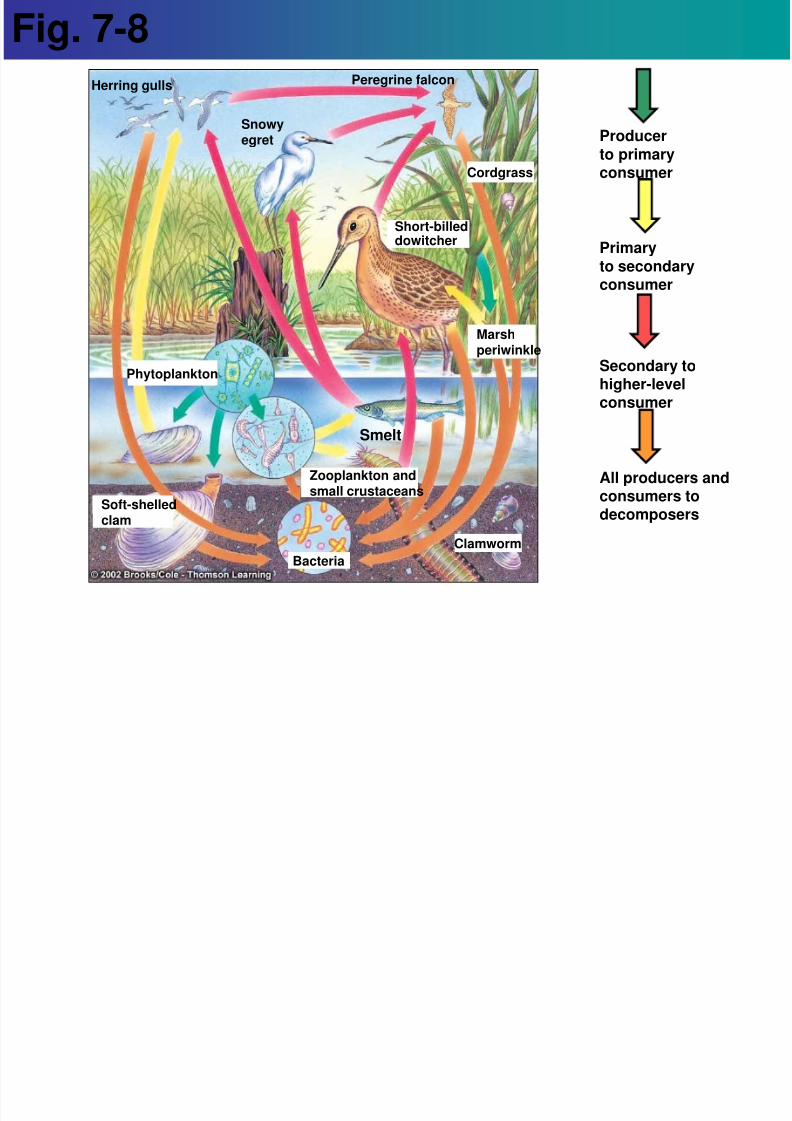
Herring gulls
Snowy
egret
Peregrine falcon
Cordgrass
Short-billeddowitcher
Marshperiwinkle
Bacteria
Clamworm
Soft-shelledclam
Zooplankton andsmall crustaceans
Phytoplankton
Smelt
Producerto primaryconsumer
Primaryto secondary
consumer
Secondary tohigher-levelconsumer
All producers andconsumers todecomposers
Fig. 7-8
Fig 7 12 Reef trophic levels

8/4/2019 APES-Area2b-Energy Flow
http://slidepdf.com/reader/full/apes-area2b-energy-flow 41/50
Gray reef shark
Green seaturtle
Sea
nettle
Fairybasslet
Bluetangs
Brittlestar
Bandedcoral
shrimp
Sergeantmajor
Parrot
fish
Hardcorals
Algae
Phytoplankton
Symbiotic
algae
Zooplankton
Sponges
Bacteria
Morayeel
Blackcap
basslet
Coney
Producerto primaryconsumer
Primary
to secondaryconsumer
Secondary tohigher-levelconsumer
All consumers andproducers todecomposers
Fig. 7-12 Reef trophic levels
Fig 4-12 Terrestrial ecosystem

8/4/2019 APES-Area2b-Energy Flow
http://slidepdf.com/reader/full/apes-area2b-energy-flow 42/50
Fig. 4-12 Terrestrial ecosystem
Sun
Producer
Precipitation
Falling leaves
and twigs
Producers
Primary consumer(rabbit)
Secondary consumer(fox)
Carbon dioxide (CO2)
Oxygen (O2)
Water
Soil decomposers
Fig 6-20 Temperate desert ecosystem

8/4/2019 APES-Area2b-Energy Flow
http://slidepdf.com/reader/full/apes-area2b-energy-flow 43/50
Producer
to primaryconsumer
Primaryto secondaryconsumer
Secondary tohigher-levelconsumer
All producers andconsumers todecomposers
Fungi
Gambel'squail
Red-tailed hawk
Collaredlizard
Jackrabbit
Yucca
Kangaroo ratKangaroo rat
AgaveAgave
RoadrunnerRoadrunner
Diamondback rattlesnakeDiamondback rattlesnakeDarklingbeetle
Darklingbeetle
BacteriaBacteria
Pricklypearcactus
Pricklypearcactus
Fig. 6-20 Temperate desert ecosystem
Fig 6-24 Tall-grass prairie ecosystem

8/4/2019 APES-Area2b-Energy Flow
http://slidepdf.com/reader/full/apes-area2b-energy-flow 44/50
Producerto primaryconsumer
Primaryto secondaryconsumer
Secondary tohigher-levelconsumer
All producers andconsumers to
decomposers
Fungi
Bacteria
Golden eagle
Prairiedog
Blue stem
grass
Blue stem
grass
CoyoteCoyote
GrasshopperGrasshopper
Grasshoppersparrow
Grasshoppersparrow
Pronghorn antelopePronghorn antelope
Prairie
coneflower
Prairie
coneflower
Fig. 6-24 Tall-grass prairie ecosystem
Fig 6-26 Arctic tundra ecosystem
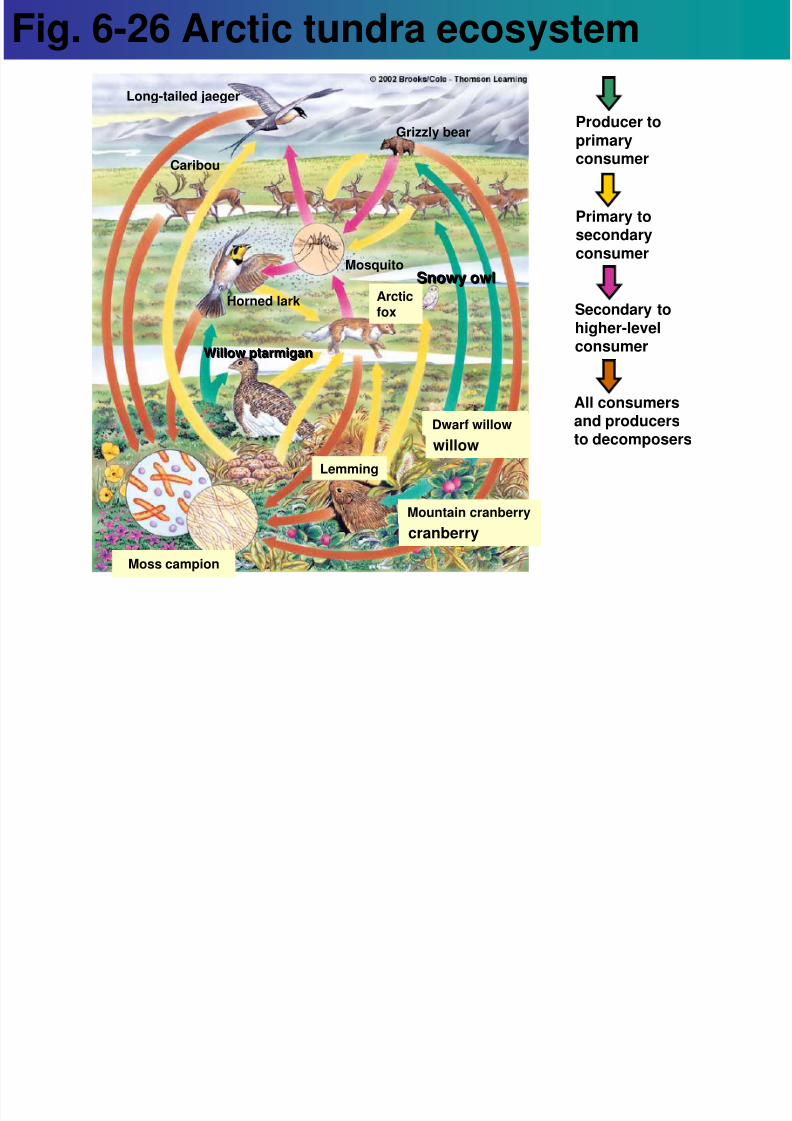
8/4/2019 APES-Area2b-Energy Flow
http://slidepdf.com/reader/full/apes-area2b-energy-flow 45/50
Producer to
primaryconsumer
Primary tosecondaryconsumer
Secondary tohigher-levelconsumer
All consumers
and producersto decomposers
Lemming
Arcticfox
Horned lark
Mosquito
Grizzly bear
Long-tailed jaeger
Caribou
Willow ptarmiganWillow ptarmigan
Snowy owlSnowy owl
Dwarfwillow
Dwarf willow
Mountaincranberry
Mountain cranberry
Moss campionMoss campion
Fig. 6-26 Arctic tundra ecosystem
Fig 6-29 Tropical rain forest ecosystem

8/4/2019 APES-Area2b-Energy Flow
http://slidepdf.com/reader/full/apes-area2b-energy-flow 46/50
Producer
to primaryconsumer
Primaryto secondaryconsumer
Secondary tohigher-levelconsumer
All producers andconsumers todecomposers
Fungi
Bacteria
Bromeliad
Ants
Tree frog
Green tree snake
Katydid
Climbingmonstera palm
Squirrelmonkeys
Blue andgold
macaw
Harpyeagle
Ocelot
Slaty-tailedtrogon
Slaty-tailedtrogon
Fig. 6-29 Tropical rain forest ecosystem
Fig 6-31 Temperate deciduous forest

8/4/2019 APES-Area2b-Energy Flow
http://slidepdf.com/reader/full/apes-area2b-energy-flow 47/50
Producer
to primaryconsumer
Primaryto secondaryconsumer
Secondary tohigher-levelconsumer
All producers and
consumers todecomposers
Bacteria
Fungi
Wood frog
Racer
Shagbark hickory
White-taileddeer
White-footedmouse
White oak
Graysquirrel
Hairywoodpecker
Broad-wingedhawk
Long-tailedweasel
Long-tailedweasel
May beetleMay beetle
Mountainwinterberry
Mountainwinterberry
Metallicwood-boringbeetle and
Metallic wood-boring beetleand larvae
Fig. 6-31 Temperate deciduous forest
Fig 6-32 Taiga forest ecosystem

8/4/2019 APES-Area2b-Energy Flow
http://slidepdf.com/reader/full/apes-area2b-energy-flow 48/50
Producer
to primaryconsumer
Primaryto secondaryconsumer
Secondary tohigher-levelconsumer
All producers and
consumers todecomposers
Bacteria Bunchberry
Starflower
Fungi
Snowshoehare
Bebbwillow
Moose
Wolf
Balsam fir
Blue jay Greathornedowl
Greathornedowl
WhitespruceWhitespruce
Pine sawyerbeetle and
larvae
Pine sawyerbeetle and
larvae
MartenMarten
Fig. 6-32 Taiga forest ecosystem
Biomagnification

8/4/2019 APES-Area2b-Energy Flow
http://slidepdf.com/reader/full/apes-area2b-energy-flow 49/50
Biomagnification
many types of poisons in environment
some stored in fatty tissue: DDT get concentrated in upper trophic levels of concern to humans since we are in an
upper trophic level
Biomagnification

8/4/2019 APES-Area2b-Energy Flow
http://slidepdf.com/reader/full/apes-area2b-energy-flow 50/50
Biomagnification