ap pli ca tion of elec tri cal re sis tiv … tri c al re sis tiv ity im ag ing the m ost pop u lar...
TRANSCRIPT

Studia Quaternaria, vol. 33, no. 2 (2016): 83–90.
DOI: 10.1515/squa-2016-0008
AP PLI CA TION OF ELEC TRI CAL RE SIS TIV ITY IM AG INGAND LAND SUR VEY ING IN THE ANAL Y SIS OF UN DER GROUND
CON STRUC TION IM PACT ON THE WAR SAW SCARP
£ukasz Kaczmarek1, Rados³aw Mieszkowski1, Marek WoŸniak2, Tomasz Dybciak2
1Uni ver sity of War saw, Fac ulty of Ge ol ogy, Al. ¯wirki i Wigury 93, 02-089 Warszawa, Po land, e-mails: [email protected], [email protected] War saw Uni ver sity of Tech nol ogy, Fac ulty of Ge od esy and Car tog ra phy, Pl. Politechniki 1,00-661 Warszawa, Po land, e-mails: [email protected], [email protected]
Ab stractThe pa per pres ents the anal y sis of the II Un der ground Line con struc tion’s im pact on the War saw Scarp with the use ofthe elec tri cal re sis tiv ity im ag ing (ERI, also known as the elec tri cal re sis tiv ity to mog ra phy) and fur ther to tal sta tion po -si tion mea sure ments. The un der ground passes un der the scarp per pen dic u lar in the area of Dynasy Street 6, in Down -town dis trict. The elec tri cal re sis tiv ity im ag ing was per formed for rec og ni tion of the geo log i cal struc ture and a poten-tial land slide sur face or zone. The gra di ent sys tem was used dur ing the prospection. In these anal y ses, the lon gi tu di nalsec tion was 40 m long, and the depth of sur vey amounted to 6 m. In the case of the 200 m long trans verse sec tion, there sulted depth of sur vey was 30 m. The geo phys i cal im age of the lon gi tu di nal sec tion, does not con tain loos en ing soilzones, which could in di cate slip sur face. Next, to tal sta tion mea sure ments, which were tied to the ar chi val geo detic ob -ser va tions’ re sults, were car ried out. The aim of the mea sure ments was to ver ify the ac tiv ity of the hor i zon tal and ver -ti cal dis place ments. The TBM ex ca va tion pro cess led to sum mary ver ti cal dis place ments up to approx. 24 mm andhor i zon tal dis place ments amount ing to approx. 13 mm. To sum up, the cur rent land sur veys re veals mi nor un der groundline’s con struc tion im pact on the scarp dis place ment. Nev er the less, the sen si tive ur ban en vi ron ment re quires fur thermon i tor ing, es pe cially that the op er a tion loads can re sult in dis place ment rate change.
Key words: elec tri cal re sis tiv ity im ag ing, po si tion mea sure ments, un der ground, War saw Scarp, dis place ments
Manu script re ceived 27 April 2016, ac cepted 26 October 2016
IN TRO DUC TION
The scarp sta bil ity as a state of forces equi lib rium ischang ing over time (Duncan and Wright, 2005). The changes are de ter mined by in fra struc ture, as well as, nat u ral vari abil -ity of soil and wa ter-re lated con di tions. One of the placeswhere the mag ni tude of destabilizing forces and op po site tothem forces has changed is the War saw Scarp in Powiœle dis -trict, due to the con struc tion pro cess of the 2nd un der groundline us ing Tun nel Bor ing Ma chines (TBM). The above men -tioned lo ca tion is a place of in ter sec tion of a com mu ni ca tionline with Qua ter nary and Mio-Plio cene sed i ments. The con -struc tion of the un der ground in War saw is an ex am ple of acom plex and large in vest ment in ter fer ing in an ur ban izedarea. In the past, such con struc tions caused risk to hu manlives and fi nan cial loss, e.g. the con struc tion of W-Z roadfrom which the dis place ment of the War saw Scarp orig i -nated. In that case, the ru ins of the Royal Cas tle and theChurch of Saint Anna were en dan gered. An other ex am pleworth not ing is an ar chi val case study of the Wis³ostrada road dam age, caused by the TBM work.
The City Cen ter part of the War saw Scarp in the neigh -bor hood of Powisle dis trict is a very at trac tive place for in -vest ment, due to its land scape val ues. The geo log i cal condi-tion of this area can be found in nu mer ous pa pers (e.g.Wysokiñski,1999; Sarnacka, 1992). The in vest ment pro cesswhich is the con struc tion of the un der ground II line with thede scrip tion of geo detic and geotechnical mon i tor ing waspre sented in the ex ec u tive pro ject (ILF, 2010). The task ofmon i tor ing the move ments has been de vel oped on the ba sisof ear lier sci en tific stud ies car ried out on the be half of Metroby WoŸniak (2007). De tails of the re sults of ob ser va tionscon ducted dur ing the un der ground con struc tion were col -lected in the in for ma tion sys tem, which in ter face for dataman age ment and com mu ni ca tion with the user was avail ablein the form of a website (http://www.ddsmonitoring.com/in -dex.php).
This pa per pres ents rec og ni tion of the un der ground IIline con struc tion im pact on the War saw Scarp by means ofgeo phys i cal elec tri cal re sis tance to mog ra phy, and use of sur -veys to sup port the cor rect in ter pre ta tion of the fi nal re sults.

RE GIONAL SET TINGS
The study area is lo cated in the cen ter of War saw, eastpart of Powiœle bor ough in Down town dis trict and cov ered apart of the War saw Scarp, un der which passes the War sawUn der ground Line II (Fig. 1). Bartoszewicza Street runsalong this part of the scarp, with Dynasy Street along its foot.The scarp height is approx. 17.5 m and in cli na tion of thescarp is approx. 36o in ref er ence to geo detic mea sure ments.
The geo log i cal struc ture of the Scarp con sists of a com -plex sys tem of de pos its. The first layer which can be in di -cated in the War saw pla teau and Vistula val ley is made-ground of about 3 m in thick ness (Bajda and Falkowski,2014). The crown of the scarp, un der the fill, con sists of tillsfrom Warta gla ci ation (about 1-m-thick layer) and Odra gla -ci ation (about 10.5-m-thick layer; Wysokiñski, 1999). These two lay ers are interbedded by flu vio gla cial me dium sand(sev eral me ters in thick ness). Near the sur face of the scarpthere is col lu vium zone. Fur ther more, be low the tills in thecrown of the scarp and val ley de pos its is a Mio-Plio cene claylayer. In the Vistula Val ley, be low the fill, there is a thin layer
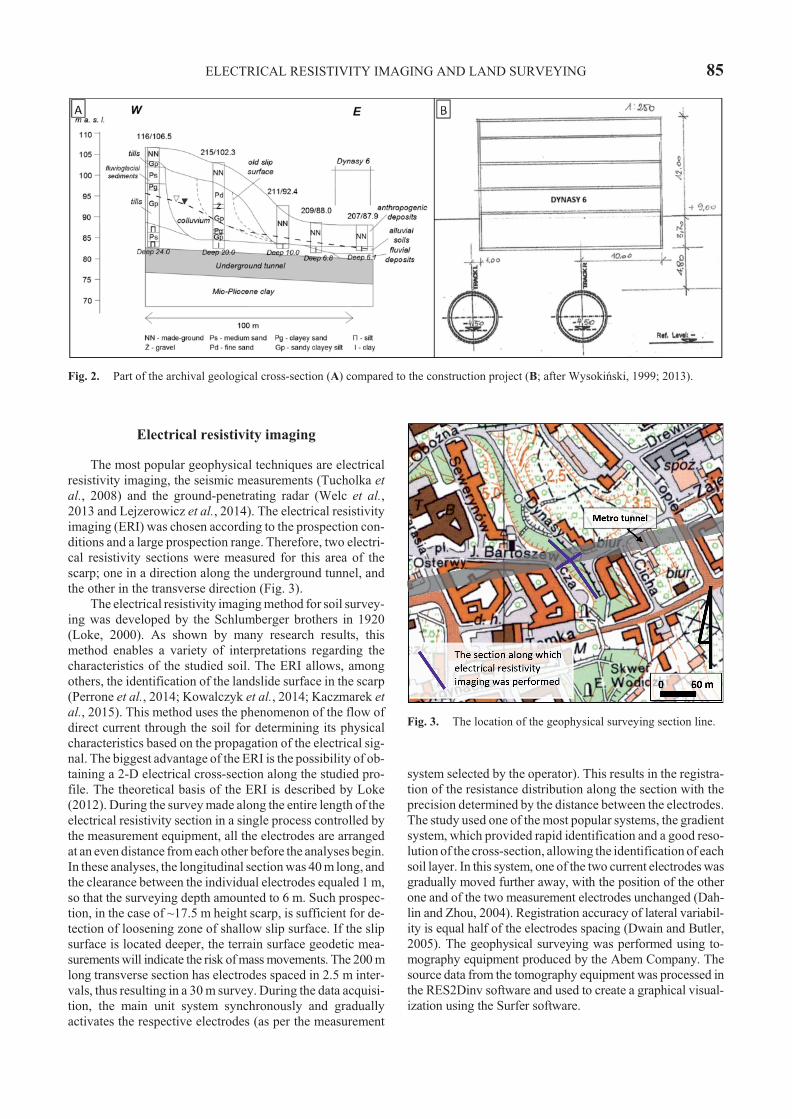
of flu vial silt and next un der lies a thin layer of me dium sand(flu vial de pos its). Fig ure 2 shows a scheme of the geo log i calstruc ture (Wysokiñski, 1999; 2013) and the lo ca tion of theun der ground tun nel with the build ings in the Vistula val ley.
The ground wa ter level is approx. 14 m be low ter rainsur face of the scarp crown and 4.7 m be low ground level atthe scarp toe (Wysokiñski, 1999).
METH ODS
The elec tri cal re sis tiv ity im ag ing was performed for rec -og ni tion of geo log i cal struc ture and a po ten tial land slide sur -face or zone. In or der to ver ify pres ence of the mass move-ments pro cess ex pressed by the ac tiv ity of the hor i zon tal andver ti cal dis place ments, the avail able re sults of land sur vey -ing in the area were an a lyzed, and some ad di tional mea sure -ments us ing high pre ci sion au to matic to tal sta tion were madepro vid ing de tails on the three co or di nates of the con trolledpoints. The in cli na tion of the scarp and its height above un-derground line were ad di tional re sults of geo detic sur vey ing.
84 £. KACZMAREK et al.
Fig. 1. The lo ca tion of the an a lyzed sec tion of the War saw Scarp on the top o graphic map (www.geoportal.gov.pl) as well as in the sche -matic map of War saw and Po land.
Elec tri cal re sis tiv ity im ag ing
The most pop u lar geo phys i cal tech niques are elec tri calre sis tiv ity im ag ing, the seis mic mea sure ments (Tucholka etal., 2008) and the ground-pen e trat ing ra dar (Welc et al.,2013 and Lejzerowicz et al., 2014). The elec tri cal re sis tiv ityim ag ing (ERI) was cho sen ac cord ing to the prospection con -di tions and a large prospection range. There fore, two elec tri -cal re sis tiv ity sec tions were mea sured for this area of thescarp; one in a di rec tion along the un der ground tun nel, andthe other in the trans verse di rec tion (Fig. 3).
The elec tri cal re sis tiv ity im ag ing method for soil sur vey -ing was de vel oped by the Schlumberger broth ers in 1920(Loke, 2000). As shown by many re search re sults, thismethod en ables a va ri ety of in ter pre ta tions re gard ing thechar ac ter is tics of the stud ied soil. The ERI al lows, amongoth ers, the iden ti fi ca tion of the land slide sur face in the scarp(Perrone et al., 2014; Kowalczyk et al., 2014; Kaczmarek etal., 2015). This method uses the phe nom e non of the flow ofdi rect cur rent through the soil for de ter min ing its phys i calchar ac ter is tics based on the prop a ga tion of the elec tri cal sig -nal. The big gest ad van tage of the ERI is the pos si bil ity of ob -tain ing a 2-D elec tri cal cross-sec tion along the stud ied pro-file. The the o ret i cal ba sis of the ERI is de scribed by Loke(2012). Dur ing the sur vey made along the en tire length of theelec tri cal re sis tiv ity sec tion in a sin gle pro cess con trolled bythe mea sure ment equip ment, all the elec trodes are ar rangedat an even dis tance from each other be fore the anal y ses be gin. In these anal y ses, the lon gi tu di nal sec tion was 40 m long, and the clear ance be tween the in di vid ual elec trodes equaled 1 m,so that the sur vey ing depth amounted to 6 m. Such prospec-tion, in the case of ~17.5 m height scarp, is suf fi cient for de -tec tion of loos en ing zone of shal low slip sur face. If the slipsur face is lo cated deeper, the ter rain sur face geo detic mea-surements will in di cate the risk of mass move ments. The 200 mlong trans verse sec tion has elec trodes spaced in 2.5 m in ter -vals, thus re sult ing in a 30 m sur vey. Dur ing the data ac qui si -tion, the main unit sys tem syn chro nously and grad u allyac ti vates the re spec tive elec trodes (as per the mea sure ment
sys tem se lected by the op er a tor). This re sults in the reg is tra -tion of the re sis tance dis tri bu tion along the sec tion with thepre ci sion de ter mined by the dis tance be tween the elec trodes.The study used one of the most pop u lar sys tems, the gra di entsys tem, which pro vided rapid iden ti fi ca tion and a good res o -lu tion of the cross-sec tion, al low ing the iden ti fi ca tion of each soil layer. In this sys tem, one of the two cur rent elec trodes wasgrad u ally moved fur ther away, with the po si tion of the otherone and of the two mea sure ment elec trodes un changed (Dah-lin and Zhou, 2004). Reg is tra tion ac cu racy of lat eral vari abil -ity is equal half of the elec trodes spac ing (Dwain and But ler,2005). The geo phys i cal sur vey ing was per formed us ing to -mog ra phy equip ment pro duced by the Abem Com pany. Thesource data from the to mog ra phy equip ment was pro cessed inthe RES2Dinv soft ware and used to cre ate a graph i cal vi su al -iza tion us ing the Surfer soft ware.
ELEC TRI CAL RE SIS TIV ITY IM AG ING AND LAND SUR VEY ING 85
Fig. 2. Part of the ar chi val geo log i cal cross-sec tion (A) com pared to the con struc tion pro ject (B; af ter Wysokiñski, 1999; 2013).
Fig. 3. The lo ca tion of the geo phys i cal sur vey ing sec tion line.
Sur vey ing – pre ci sion to tal sta tion
Is sues re lat ing to the mea sure ment of ter rain sur face andfa cil i ties dis place ments were pre sented in PN-N-02211(2000) and the GUGiK guide lines G3.1-2007. Ad di tion ally,is sues as so ci ated with land sur vey ing of dis place ments in ur -ban en vi ron ment like War saw me trop o lis were de scribed inWoŸniak (1999); WoŸniak and ¯aczek-Pepliñska (2014).A detailed de scrip tion of the the o ret i cal ba sis with ex am plesof cal cu la tion for de ter min ing dis place ment of mea sure mentpoints can be found in pa pers by Lazzarini (1977) as well asPrószyñski and Kwaœniak (2006). The use of high-pre ci sionto tal sta tions for mea sure ments in the study of dis place mentsand con di tions of this work was pre sented in the pa per ofWoŸniak (2005).
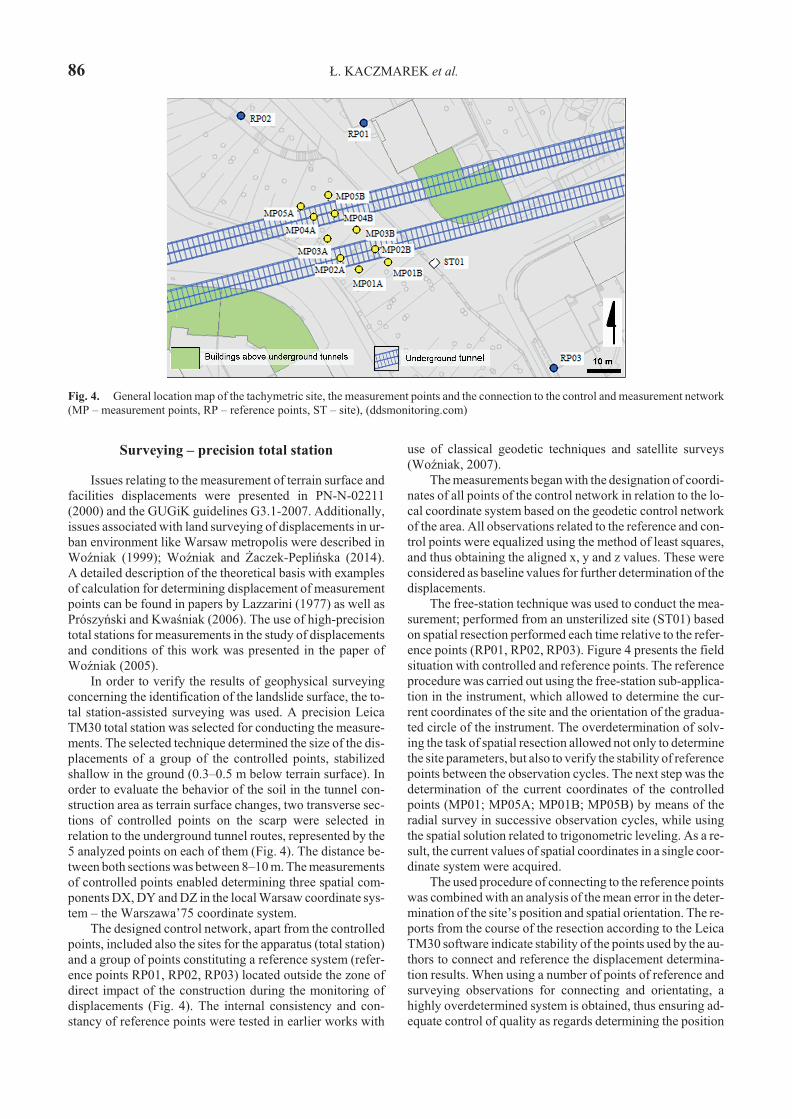
In or der to ver ify the re sults of geo phys i cal sur vey ingcon cern ing the iden ti fi ca tion of the land slide sur face, the to -tal sta tion-as sisted sur vey ing was used. A pre ci sion LeicaTM30 to tal sta tion was se lected for con duct ing the mea sure -ments. The se lected tech nique de ter mined the size of the dis -place ments of a group of the con trolled points, sta bi lizedshal low in the ground (0.3–0.5 m be low ter rain sur face). Inor der to eval u ate the be hav ior of the soil in the tun nel con -struc tion area as ter rain sur face changes, two trans verse sec -tions of con trolled points on the scarp were se lected inre la tion to the un der ground tun nel routes, rep re sented by the5 an a lyzed points on each of them (Fig. 4). The dis tance be -tween both sec tions was be tween 8–10 m. The mea sure ments of con trolled points en abled de ter min ing three spa tial com -po nents DX, DY and DZ in the lo cal War saw co or di nate sys -tem – the Warszawa’75 co or di nate sys tem.
The de signed con trol net work, apart from the con trolledpoints, in cluded also the sites for the ap pa ra tus (to tal sta tion)and a group of points con sti tut ing a ref er ence sys tem (ref er -ence points RP01, RP02, RP03) lo cated out side the zone ofdi rect im pact of the con struc tion dur ing the mon i tor ing ofdis place ments (Fig. 4). The in ter nal con sis tency and con -stancy of ref er ence points were tested in ear lier works with
use of clas si cal geo detic tech niques and sat el lite sur veys(WoŸniak, 2007).
The mea sure ments be gan with the des ig na tion of co or di -nates of all points of the con trol net work in re la tion to the lo -cal co or di nate sys tem based on the geo detic con trol net workof the area. All ob ser va tions re lated to the ref er ence and con -trol points were equal ized us ing the method of least squares,and thus ob tain ing the aligned x, y and z val ues. These werecon sid ered as base line val ues for fur ther de ter mi na tion of the dis place ments.
The free-sta tion tech nique was used to con duct the mea -sure ment; per formed from an un ster il ized site (ST01) basedon spa tial re sec tion per formed each time rel a tive to the ref er -ence points (RP01, RP02, RP03). Fig ure 4 pres ents the fieldsit u a tion with con trolled and ref er ence points. The ref er encepro ce dure was car ried out us ing the free-sta tion sub-ap pli ca -tion in the in stru ment, which al lowed to de ter mine the cur -rent co or di nates of the site and the ori en ta tion of the gradua-ted cir cle of the in stru ment. The overdetermination of solv -ing the task of spa tial re sec tion al lowed not only to de ter minethe site pa ram e ters, but also to ver ify the sta bil ity of ref er ence points be tween the ob ser va tion cy cles. The next step was thede ter mi na tion of the cur rent co or di nates of the con trolledpoints (MP01; MP05A; MP01B; MP05B) by means of thera dial sur vey in suc ces sive ob ser va tion cy cles, while us ingthe spa tial so lu tion re lated to trig o no met ric lev el ing. As a re -sult, the cur rent val ues of spa tial co or di nates in a sin gle co or -di nate sys tem were ac quired.
The used pro ce dure of con nect ing to the ref er ence points was com bined with an anal y sis of the mean er ror in the de ter -mi na tion of the site’s po si tion and spa tial ori en ta tion. The re -ports from the course of the re sec tion ac cord ing to the LeicaTM30 soft ware in di cate sta bil ity of the points used by the au -thors to con nect and ref er ence the dis place ment de ter mi na -tion re sults. When us ing a num ber of points of ref er ence andsur vey ing ob ser va tions for con nect ing and ori en tat ing, ahighly overdetermined sys tem is ob tained, thus en sur ing ad -e quate con trol of qual ity as re gards de ter min ing the po si tion
86 £. KACZMAREK et al.
Fig. 4. Gen eral lo ca tion map of the tachymetric site, the mea sure ment points and the con nec tion to the con trol and mea sure ment net work(MP – mea sure ment points, RP – ref er ence points, ST – site), (ddsmonitoring.com)

of the site. In the tra di tional lev el ing pro cess, an gu lar and lin -ear ob ser va tions, in clud ing the iden ti fi ca tion of the sta bil ityof points, should be per formed. This pro ce dure could greatlyex tend the pro cess of mea sur ing and de ter min ing the dis -place ments, with out no tice able pre ci sion ef fects. The in di -cated po si tion and ori en ta tion of the in stru ment is the ba sisfor de ter min ing the cur rent co or di nates of all the con trolledpoints in a given ob ser va tion cy cle.
Dur ing the anal y sis of the re sults of to tal sta tion ob ser va -tions of the mon i tored ob ject (the sur face of the War sawScarp), it is im por tant to have in for ma tion on the ob tained ac -cu racy of the sur vey ing re sults. The so-called mean er ror(mp) of the point po si tion may be adapted as a pa ram e ter de -scrib ing the ac cu racy of de ter min ing the hor i zon tal po si tionof the point, de fined ac cord ing to the fol low ing for mula:
mp2 = sEasting2 + sNorthing2 [mm];
where:sóEasting, sNorth ing – mean er ror of the X and Y co or di nate, re -spec tively.
For the two ob ser va tion se ries con ducted in late 2013 forthe con trolled points, the re sult ing mean er rors were re cordedin the re port au to mat i cally gen er ated by the stan dard soft wareof the TM30 in stru ment. The ob tained re sults per mit ted to de -ter mine the po si tion er ror of the de ter mined mea sure mentpoints (mp). A mean er ror of de ter min ing the po si tion of thegroup of the con trolled points in the range be tween 0.6 and1.3 mm was ob tained in the con ducted sur vey ing.
RE SULTS AND DIS CUS SION
As a re sult of the ERI prospection we ob tain two per pen -dic u lar re sis tiv ity sec tions of the scarp. The Fig ure 5 showsthe dis tri bu tion of the elec tri cal re sis tiv ity of the soil in thepar al lel sec tion to un der ground line, with clearly vis i blebound aries of ar eas with dif fer ent geoelectrical prop er ties.This ERI prospection sec tion was made in the line of ar chi valgeo log i cal cross-sec tion (Fig. 2). There fore, the con ti nu ity of shal low soil layer on the scarp could be an a lyzed. Based onar chi val sec tion the in ter pre ta tion of re sis tiv ity sec tions wasmade. There are two dis tin guish able com plexes along withthe un der ground tun nels:
– com plex I: it is lo cated across the whole scarp. In Fig ure
5 this com plex has re sis tiv ity be tween 120 Wm and 600 Wm,with an av er age thick ness in the elec tri cal re sis tiv ity cross-sec tion of approx. 3 m. Fol low ing a cor re la tion with the his -tor i cal data, the in ter preted soil was named as sand or clayeysand with el e vated hu mid ity (anthropogenic soil: made-ground);
– com plex II: un der ly ing firs com plex. It is min i mum6–7 m be low scarp sur face. In Fig ure 5 char ac ter ized by thefol low ing re sis tiv ity: 5 Wm–70 Wm. Such resistances in di -cate co he sive soils, like col lu vium sandy clay.
In ter pret ing per pen dic u lar sec tion to scarp ex ten sion itshould be noted that the geo phys i cal im age of the study areadoes not con tain loos en ing soil zones, which could in di cateslip sur face.
In the case of a cross-sec tion per pen dic u lar to the ex tent of the scarp (Fig. 7), the con ducted anal y ses pro vided a notclear im age. In this case, re sis tiv ity im age is dis torted, dueto the pres ence of metal el e ments, elec tri cal wires andempty space in side tun nels in the un der ground line. Thereliable in for ma tion is re lated to con fir ma tion of the vari a -tion of geo log i cal de pos its and pres ence of the un der ground tun nels in these cross-sec tions. The prob a ble in ter pre ta tionof this sec tion, based on ar chi val cross-sec tion (Fig. 2) ispre sented be low. In such prospection con di tion, ex act in ter -pre ta tion of soil types and con ti nu ity of com plex is pre -cluded.
ELEC TRI CAL RE SIS TIV ITY IM AG ING AND LAND SUR VEY ING 87
Fig. 5. The re sults of soil anal y ses us ing elec tri cal re sis tiv ity im -ag ing, per formed lon gi tu di nally on the scarp (along the pro file onFig. 3).
Fig. 6. The re sults of the ERI prospection, per formed par al lel to the scarp foot ex ten sion and per pen dic u lar to the un der ground tun nels(along the pro file on Fig. 3)

Sur vey ing re sults
In or der to an a lyze the im pact of the un der ground con -struc tion, the his tor i cal re sults of mea sure ments made by theun der ground con trac tor were used be fore start ing the con -struc tion, dur ing its course and af ter its com ple tion. The mea -sure ments were also made fol low ing the con struc tion of theun der ground tun nels in or der to ver ify the re sults of the de ter -mi na tion of dis place ments, and they were added to the chartspre sented in Fig. 7. The chart show ing ver ti cal dis place mentof a sam ple con trolled point MP01 as a func tion of time(Fig. 7) clearly shows pe ri ods of sta bil ity of the re sults in ter -rupted by sud den in creases in the value of the dis place ments.The first in crease in dis place ment within the an a lyzed area is
caused by the pas sage of the cut ting shield of the TBM drill -ing the south ern tun nel be tween 24 Sep 2013 and 26 Sep2013. This change amounted to –13 mm. Af ter this pe riod,sta bi li za tion of the an a lyzed ob ject and of the dis place mentvalue was in ef fect un til the time of the pas sage of the sec ondTBM drill ing the north ern tun nel. The TBM was in the areaun der study be tween 01 Nov 2013 and 03 Nov 2013, whichled to an in crease in dis place ments up to –19 mm. The char -ac ter of the ob served ter rain dis place ments shows quasi-elas -tic be hav ior, which in hi bi tion is due to both the sched ule ofearth works, as well as, the de layed re ac tion of soil mas sive(Potts and Zdravkoviæ, 2001; Kuszyk and Siemiñska-Le-wandowska, 2009).
88 £. KACZMAREK et al.
Fig. 7. Ver ti cal dis place ments as a func tion of time for the con trolled point MP01. The im por tant mo ment of un der ground con struc tion.
Fig. 8. Cu mu la tive ver ti cal dis place ments at the end of the mon i tor ing pe riod for the an a lyzed sec tion of the scarp.

The Fig ure 8 be low pres ents the cu mu la tive ver ti cal dis -place ments (set tle ment) of the con trolled points on the scarp,show ing that the largest sub si dence oc curred in the south -west ern part of the mon i tored area. The 3-di men sional coun -ter map was elab o rated with the use of Surfer v.10 soft ware,by gridding method named kriging.
Ta ble 1 con tains the ini tial co or di nates of the con trolledpoints and sum mary val ues of sub si dence z from be gin ningof ob ser va tions to its end (16 Dec 2013).
The ta ble be low de scribes the key mo ments in the prog -ress of the in vest ment and the changes in the XY po si tion ofthe MP01 point. It is worth not ing that the thresh old hor i zon -tal or ver ti cal dis place ment val ues adopted by the un der -ground con trac tor, ac cord ing to their observation, were15 mm for an alert state and 20 mm for an emer gency. Whenthese val ues were ap proached, con struc tion work was sus -pended and the changes in the dis place ment val ues were be -ing ob served. If there had been no neg a tive im pact on theen vi ron ment (e.g., frac tur ing), the emer gency val ues wouldhave been in creased by the un der ground de sign ers.
Fig ure 9 shows hor i zon tal dis place ments of one of thecon trolled points. The other points move in a sim i lar man ner.The pre sented chart shows cu mu la tive dis place ments be -tween the im por tant stages of the in vest ment. We can clearly
see the im pact of the pas sage of the first TBM on the mon i -tored sec tion of the scarp, as an in crease in dis place mentsamount ing to approx. 7 mm. The pas sage of the sec ond TBMwas fol lowed by a fur ther dis place ment of approx. 6 mm. The ob served dis place ments are di rected to wards the north-east.The last mea sure ments clearly show that the dis place mentsto wards the in cline of the scarp stopped.
CON CLU SIONS
Sum ma riz ing the re sults of the anal y ses, the ques tion re -gard ing the im pact of build ing the un der ground tun nels onthe War saw Scarp at Dynasy Street No. 6, called into ques -tion in the sub ject of the pa per, can be an swered as fol lows:the im pact is no tice able by pres ent de for ma tions of the scarp,al though small enough not to pose a threat to the sta bil ity and
ELEC TRI CAL RE SIS TIV ITY IM AG ING AND LAND SUR VEY ING 89
Ta ble 1Sub si dence for se lected con trolled points
Point nameNorth ing data
X [m]Easting data
Y [m]Sub si dence
Dz [mm]
MP01A –95.8072 782.6908 –19.43
MP02A –92.4173 777.4073 –23.76
MP03A –86.8925 773.7317 –22.72
MP04A –80.8163 769.7007 –21.99
MP05A –77.8713 765.9785 –19.12
MP01B –93.7303 790.8351 –17.42
MP02B –89.9010 787.3268 –22.37
MP03B –84.3757 781.8970 –19.72
MP04B –79.8821 775.8274 –12.95
MP05B –75.0309 774.1595 –6.68
Ta ble 2Char ac ter is tic mo ments of un der ground con struc tion as so -
ci ated with co or di nates of the rep re sen ta tive con trolledpoint MP01A
No. ofstage
De scrip tion of the mea -sure ment per formed
Date East [m] North [m]
0 Zero mea sure ment 28-08-2013 782.6879 –95.8197
1Mea sure ment be fore thepas sage of the first TBM
21-09-2013 782.6885 –95.8199
2Soon af ter the pas sage of
the first TBM29-09-2013 782.6908 –95.8103
3Mea sure ment be fore thepas sage of the sec ond
TBM26-10-2013 782.6906 –95.8106
4Soon af ter the pas sage of
the sec ond TBM8-11-2013 782.6903 –95.8074
5Own as-built mea sure -
ment sur vey16-12-2013 782.6908 –95.8072
Fig. 9. The hor i zon tal vec tors of dis place ments of con trolledpoint MP01A lo cated on War saw Scarp, at dif fer ent char ac ter is ticun der ground con struc tion stages (No. of stage in blue, the de scrip -tion of stage in Tab. 2).

the nearby struc tures. To tal sta tion mea sure ments of pointslo cated on the War saw Scarp en able cal cu la tion of de for ma -tion field and dis place ment vec tors of ter rain sur face abovethe un der ground tun nels. In the case of the ERI prospection,de spite of the dif fi cult test con di tions, the con ti nu ity of soilcom plex up to approx. 6 m be low scarp sur face were ver i fied. The as sess ment of the im pact of the sec ond un der ground linecon struc tion on the War saw Scarp in di cates high use ful nessof two used com bined meth ods, which en able an ex ten siveand re li able anal y sis of im ple ment ing the in vest ment in com -plex ur ban con di tions.
Ac knowl edg ments
Au thors would like to thank Re view ers for their valu able com -ments that con trib uted to the im prove ment of this work. This workwas sup ported by the Uni ver sity of War saw Fac ulty of Ge ol ogy(con tract No. DSM 113232).
REF ER ENCES
Bajda, M., Falkowski, T., 2014. Geotechnical tests for es ti ma tion of geo log i cal con di tions of the es carp ment zone of “Skarpa War-szawska” in the vi cin ity of Tamka Street. Landform Anal y sis26, 77–84.
But ler, D.K., 2005. Near-Sur face Geo phys ics. So ci ety of Ex plo ra -tion Geo phys i cists, Tulsa.
Dahlin, T., Zhou, B., 2004. A nu mer i cal com par i son of 2D re sis tiv -ity im ag ing with 10 elec trode ar rays. Geo phys i cal Pros pect ing52, 379–398.
Duncan, J.M., Wright, S.G., 2005. Soil strength and slope sta bil ity.John Wiley & Sons, Hoboken, N.J.
GUGiK, 2007. Tech ni cal guide lines G-3.1: Mea sure ments and de -velop ex e cu tion (Wytyczne techniczne G-3.1: Pomiary i opra-cowania realizacyjne). Warszawa (in Pol ish).
ILF Con sult ing En gi neers Polska Sp. z o. o., 2010. Mon i tor ing pro -ject, de scrip tion of the ob ject and en vi ron men tal mon i tor ingsys tem for the cen tral part of the War saw un der ground II line,ex e cuted by sur vey ing tech niques, geotechnical tech niquesand di rect ob ser va tions (Projekt mon i tor ing, opis systemumonitoringu obiektowego i œrodowiskowego dla centralnegoodcinka II linii metra w Warszawie, realizowanego technikami geodezyjnymi, geotechnicznymi i obserwacjami bezpoœred-nimi). Astaldi S.p.A., Gulermak, PBDiM Sp. z o.o., Warszawa(in Pol ish).
Kaczmarek, £., Mieszkowski, R., Ko³paczyñski, M., Pacanowski,G., 2015. Ap pli ca tion of elec tri cal re sis tiv ity to mog ra phy(ERT) in the in ves ti ga tion of Qua ter nary land slide zones,based on the se lected re gions of P³ock slope. Studia Quater-naria 31 (2), 101–107. DOI: 10.2478/squa-2014-0010
Kowalczyk, S., Mieszkowski, R., Pacanowski, G., 2014. The sta bil -ity eval u a tion of War saw slope se lected pieces based on Elec -tri cal Re sis tiv ity To mog ra phy sur vey (ERT) (Ocena statecz-noœci wybranych fragmentów skarpy warszawskiej w œwietlebadañ geofizycznych metod¹ tomografii elektrooporowej).Przegl¹d Geologiczny 62 (10/2), 634–640 (in Pol ish with Eng -lish sum mary).
Kuszyk, R., Siemiñska-Lewandowska, A., 2009. Eval u a tion of thesub si dence prog ress above the metro tun nel cre ated by Tun nelBor ing Ma chine (Ocena rozwoju niecki osiadañ nad tunelemdr¹¿onym tarcz¹ zmechanizowan¹). Gór. Geoin¿yn. 33 (3/1),229–237 (in Pol ish).
Lazzarini, T., (ed.) 1977. Sur vey ing of build ings and their sur -round ings dis place ments (Geodezyjne pomiary przemiesz-czeñ budowli i ich otoczenia). Pañstw. Przeds. Wydaw. Kar-
tograficznych, Warszawa (in Pol ish).Lejzerowicz, A., Kowalczyk, S., Wysocka, A., 2014. The use ful -
ness of ground-pen e trat ing ra dar im ages for the re search of alarge sand-bed braided river: case study from the Vistula River(cen tral Po land). Geologos 20 (1), 35–47.
Loke, M.H., 2000. Elec tri cal im ag ing sur veys for en vi ron men taland en gi neer ing stud ies. Wyd. Abem, Stokholm.
Loke, M.H., 2012. Tu to rial: 2-D and 3-D elec tri cal im ag ing sur -veys. Wyd. Abem, Stokholm.
Perrone, A., Lapenna, V., Piscitelli, S., 2014. Elec tri cal re sis tiv ityto mog ra phy tech nique for land slide in ves ti ga tion: A re view.Earth-Sci ence Re views 135, 65–82.
PN-N-02211. 2000. Ge od esy. Sur vey de ter min ing of dis place -ments (Geodezja. Geodezyjne wyznaczenie przemieszczeñ).Warszawa (in Pol ish).
Potts, D.M., Zdravkoviæ, L., 2001. Fi nite el e ment anal y sis in geo-tech ni cal en gi neer ing. Thomas Tel ford, Lon don.
Prószyñski, W., Kwaœniak, M., 2006. Ba sics of geo detic de ter mi na -tion of dis place ments (Podstawy geodezyjnego wyznaczaniaprzemieszczeñ). Oficyna Wydawnicza Politechniki War-szawskiej, Warszawa (in Pol ish).
Sarnacka, Z., 1992. Stra tig ra phy of Qua ter nary sed i ments of War -saw and sur round ings (Stratygrafia osadów czwartorzêdo-wych Warszawy i okolic). Wyd. PIG, Warszawa (in Pol ish).
Tucholka, P., Kie³basiñski, K., Mieszkowski, R., 2008. Trac ingseis mic Sur face waves in duced by road traf fic in ur ban en vi -ron ment: ex am ple of st. Catherine’s church hill in War saw.Geologija 50, S79–S84.
Welc, F., Trzciñski, J., Kowalczyk, S., Mieszkowski, R., 2013.Geo phys i cal sur vey (GPR) in West Saqqara (Egypt) pre lim i -nary re marks. Studia Quaternaria 30 (2), 99–108.
WoŸniak, M., 1999. Geo detic dis place ment mon i tor ing sys tems forthe con struc tion in dus try – geo detic mon i tor ing of dis place -ments dur ing the ob jects erect ing in deep trenches (Systemygeodezyjnego monitorowania przemieszczeñ dla potrzeb bu-downictwa – Geodezyjny mon i tor ing przemieszczeñ podczaswznoszenia obiektów w g³êbokich wykopach). Opracowaniemonograficzne Politechnika Warszawska, Warszawa (in Pol -ish).
WoŸniak, M., 2005. Geo detic mea sure ment sys tems in mon i tor ingof dis place ments. Re ports of Ge od esy 3 (74), 125–131.
WoŸniak, M., 2007. De vel op ment of the meth od ol ogy pro ce durefor the es tab lish ment of mon i tor ing sys tems for dis place mentsof se lected consruction com po nents (Opracowanie metodykipostêpowania przy zak³adaniu systemów monitoruj¹cychprzemieszczenia wybranych elementów konstrukcyjnych).Ekspertyza, Warszawa (in Pol ish).
WoŸniak, M., ¯aczek-Pepliñska, J., 2014. Mea sure ments of dis -place ments per formed in deep ex ca va tions con di tions (Po-miary przemieszczeñ realizowane w warunkach g³êbokichwykopów). Tom VI Seria Wydawnicza: Monografie Wy-dzia³u In¿ynierii L¹dowej, Oficyna Wydawnicza PolitechnikiWarszawskiej, Warszawa (in Pol ish).
Wysokiñski, L., 1999. The War saw Slope in the Œródmieœcie dis -trict (from al. Jerozolimskie to the Sanguszki St.) (Warszawska skarpa œródmiejska (od Al. Jerozolimskich do ul. Sanguszki)).Drukarnia Piotra W³odarskiego, Warszawa (in Pol ish).
Wysokiñski, L., 2013. The ex per tise for the de ter mi na tion of re al -iza tion con di tion ing of D13 tun nels con struc tion by Tun nelBor ing Ma chines TBM un der the War saw Slope dur ing thecon struc tion of the cen tral part of the II un der ground line inWar saw (Ekspertyza dotycz¹ca okreœlenia uwarunkowañ rea-lizacyjnych przy budowie tuneli szlakowych D13 tarczamizmechanizowanymi TBM pod Skarp¹ Warszawsk¹ podczasbudowy odcinka centralnego II linii metra w Warszawie).Warszawa (in Pol ish).
90 £. KACZMAREK et al.