anttonen, antti; karhula, pekka; lasanen, mika; majanen, mikko
TRANSCRIPT
This document is downloaded from theVTT’s Research Information Portalhttps://cris.vtt.fi
VTThttp://www.vtt.fiP.O. box 1000FI-02044 VTTFinland
By using VTT’s Research Information Portal you are bound by thefollowing Terms & Conditions.
I have read and I understand the following statement:
This document is protected by copyright and other intellectualproperty rights, and duplication or sale of all or part of any of thisdocument is not permitted, except duplication for research use oreducational purposes in electronic or print form. You must obtainpermission for any other use. Electronic or print copies may not beoffered for sale.
VTT Technical Research Centre of Finland
Enabling Massive Machine Type Communications with DECT-2020StandardAnttonen, Antti; Karhula, Pekka; Lasanen, Mika; Majanen, Mikko
Published: 01/01/2021
Document VersionPublisher's final version
Link to publication
Please cite the original version:Anttonen, A., Karhula, P., Lasanen, M., & Majanen, M. (2021). Enabling Massive Machine TypeCommunications with DECT-2020 Standard: A System-Level Performance Study. VTT Technical ResearchCentre of Finland. VTT Research Report No. VTT-R-00367-21
Download date: 25. Feb. 2022
RESEARCH REPORT VTT-R-00367-21
Enabling Massive Machine Type Communications with DECT-2020 Standard: A System-Level Performance Study
Authors: Antti Anttonen, Pekka Karhula, Mika Lasanen, Mikko Majanen
Confidentiality: Public
RESEARCH REPORT VTT-R-00367-21
1 (22)
Report’s title
Enabling Massive Machine Type Communications with DECT-2020 Standard: A System-Level
Performance Study Customer, contact persons Order reference
Wirepas, Juho Pirskanen and Jussi Numminen VTT-170069-20 Project name Project number/Short name
System Simulations for DECT-2020 128181/SySimD2020 Author(s) Pages
Antti Anttonen, Pekka Karhula, Mika Lasanen, Mikko Majanen 22 Keywords Report identification code
Massive machine type communications, DECT-2020, ITU
requirements, packet outage rate, system simulations
VTT-R-00367-21
Summary
The goal of this research report is to objectively evaluate the performance of emerging DECT-
2020 standard. The DECT-2020 standard from European Telecommunications Standards
Institute (ETSI) is a candidate technology for International Mobile Telecommunications 2020
(IMT-2020) wireless technology. The target use scenario involves the massive machine type
communications (mMTC) in an urban macro wireless channel environment. The International
Telecommunication Union (ITU) sets the requirements for any IMT-compliant mMTC
technology. Essentially, the supported device connection density must be at least 1 million
devices per km2 while the packet outage rate and packet delay must be at most 1 % and 10 s,
respectively.
The used simulation environment is developed using the well-recognized Network Simulator 3
(NS-3) software in order to estimate the packet outage rate constrained by the packet delay
and network density. The comprehensive system simulator can handle both the device
association phase as well as the application data transmission phase according to the DECT-
2020 standard specifications. A distinctive system parameter of interest is the proportion of
routing devices out of all source devices in the mesh network.
It is concluded that, for the given evaluation framework, the DECT-2020 is able to fulfil the
aforementioned ITU requirements and it appears, therefore, a potential candidate for the IMT-
2020-enabled mMTC digital services. During the project, VTT’s results also contributed to the
ETSI evaluation group work and were used in corresponding interim evaluation report
submitted to ITU-R by ETSI.
The views and results of this report are those of authors. Confidentiality Public
Oulu 21.4.2021 Written by
Mika Lasanen Project manager
Reviewed by
Tuomas Korpela Solution Sales Lead
Accepted by
Dr. Tiia Ojanperä Research Team Leader
VTT’s contact address
Kaitoväylä 1, FI-90571 Oulu
Distribution
Wirepas, VTT
The use of the name of VTT Technical Research Centre of Finland Ltd in advertising or publishing of a part of this
report is only permissible with written authorisation from VTT Technical Research Centre of Finland Ltd.
RESEARCH REPORT VTT-R-00367-21
2 (22)
Preface
System Simulations for DECT-2020 project was running between September 2020 and February 2021. The main goal of the project was to investigate the performance of the recent ETSI DECT-2020 NR standard against the massive machine type of communication (mMTC) requirements set by ITU-R for an IMT-2020 wireless technology. VTT planned their efforts for the sprint type of project employing their strong background in wireless systems and network simulations. Important part of the work was to take part in ETSI evaluation group set-up for producing evaluation report on DECT-2020 NR performance with respect to IMT-2020 wireless technology requirements. Interim evaluation report was submitted to ITU-R by ETSI in early February 2021. VTT’s results contributed for mMTC evaluations among other partners. Final evaluation report submission is expected in May 2021. VTT acknowledges ETSI collaboration with all the partners. Dr. Andreas Wilzeck from Sennheiser has managed this activity efficiently. In their system simulations, VTT used link level simulation results provided by Maxim Penner working at the Institute of Communication Technology, Leibniz University of Hannover. This collaboration is acknowledged. VTT is also very thankful for all support and guidance provided by Jussi Numminen and Juho Pirskanen from Wirepas. Finally, the authors of this report also acknowledge all support from research team leaders Dr. Tiia Ojanperä and Jyrki Huusko, and solutions sales lead Tuomas Korpela, all of them working at VTT. Oulu 21.4.2021 Authors
RESEARCH REPORT VTT-R-00367-21
3 (22)
Contents
Preface ................................................................................................................................... 2
Contents ................................................................................................................................. 3
Glossary ................................................................................................................................. 4
1. Introduction ....................................................................................................................... 5
2. Use Scenario and System Characteristics ........................................................................ 6
2.1 Massive Machine Type Communications .................................................................. 6 2.2 Overview of DECT-2020 Wireless Standard ............................................................. 7 2.3 Heterogeneous Channel Environment ...................................................................... 8
3. Performance Evaluation .................................................................................................. 11
3.1 Outline of Evaluation Guidelines ............................................................................. 11 3.2 Simulation Assumptions .......................................................................................... 12 3.3 Developed Simulation Environment ........................................................................ 15 3.4 Massive simulations: adaptations and considerations ............................................. 16 3.5 Simulation Results .................................................................................................. 17 3.6 Discussion .............................................................................................................. 20
4. Conclusion ...................................................................................................................... 21
5. References ..................................................................................................................... 22
RESEARCH REPORT VTT-R-00367-21
4 (22)
Glossary
3GPP 3rd Generation Partnership Project
5G Fifth generation
ACK Acknowledged
B2D Base to device
BS Base station
CRC Cyclic redundancy check
D2D Device to device
ETSI European Telecommunications Standards Institute
FFT Fast Fourier transform
FT Fixed termination point; similar to BS; however, FT can be less complex than BS
HARQ Hybrid automatic repeat request
IMT-2020 International Mobile Telecommunications 2020
ISD Intersite distance
ITU International Telecommunication Union
LBT Listen before talk
LOS Line of sight
MAC Medium access control
MCS Modulation and coding scheme
mMTC Massive machine type communications
NACK Not acknowledged
NLOS Non line of sight
NS-3 Network simulator 3
OFDM Orthogonal frequency division multiplexing
PER Packet error rate
PHY Physical
POR Packet outage rate
RD Radio device, similar to UE; two modes are possible: portable RD-P and fixed RD-F
RSSI Received signal strength indicator
SINR Signal to interference and noise ratio
UE User equipment
RESEARCH REPORT VTT-R-00367-21
5 (22)
1. Introduction
The new DECT-2020 standard has only recently appeared and there is not yet much information available about its system performance in massive machine type communications (mMTC) use scenarios. Consequently, the main objective of this report is to evaluate the system-level performance of DECT-2020 system in terms of packet outage rate (POR) where outages are caused by i) packet detection errors due to noise and interference and ii) packet delays due to scheduling and propagation.
In essence, following the IMT-2020 requirements, the maximum allowed POR is 1 % and the maximum allowed end-to-end packet delay is 10 s between a source and base station which may be interconnected via multiple hops. Moreover, the supported device connection density must be at least 1 million devices per km2.
The system specifications follow, for the relevant parts, the newest DECT-2020 standard [4][5][6][7] and ITU recommendations for system modelling [1][2][3]. The final target is to enable at least one million portable radio devices per km2 along with a specified number of fixed termination points and routing devices. The emphasis on the modelling is on routing, channel access, and interference modelling to allow simulation of such high number of devices. Moreover, sophisticated link-level models are incorporated to properly emulate the physical layer phenomena.
The rest of the report is organized as follows. First, brief overviews on the target mMTC use cases, DECT-2020 standard, and channel environment are provided in Section 2. Next, the evaluation framework and results are provided in Section 3. Finally, our conclusions are briefly given in Section 4.
RESEARCH REPORT VTT-R-00367-21
6 (22)
2. Use Scenario and System Characteristics
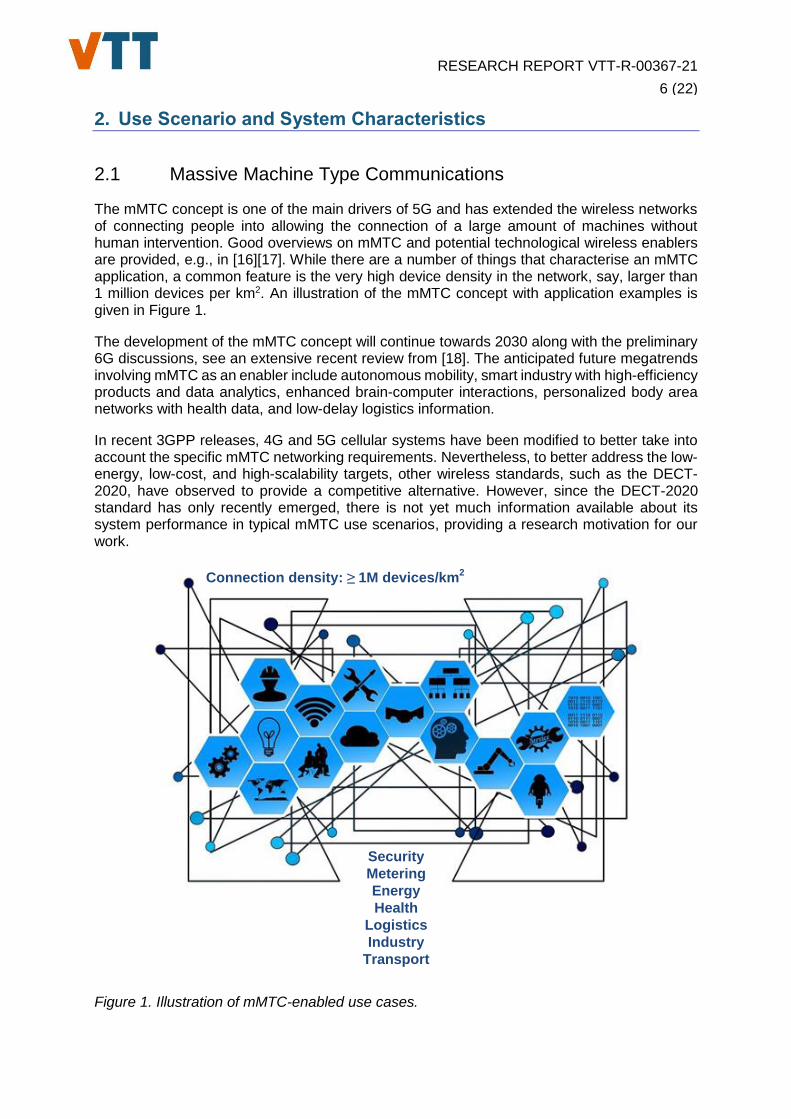
2.1 Massive Machine Type Communications
The mMTC concept is one of the main drivers of 5G and has extended the wireless networks of connecting people into allowing the connection of a large amount of machines without human intervention. Good overviews on mMTC and potential technological wireless enablers are provided, e.g., in [16][17]. While there are a number of things that characterise an mMTC application, a common feature is the very high device density in the network, say, larger than 1 million devices per km2. An illustration of the mMTC concept with application examples is given in Figure 1.
The development of the mMTC concept will continue towards 2030 along with the preliminary 6G discussions, see an extensive recent review from [18]. The anticipated future megatrends involving mMTC as an enabler include autonomous mobility, smart industry with high-efficiency products and data analytics, enhanced brain-computer interactions, personalized body area networks with health data, and low-delay logistics information.
In recent 3GPP releases, 4G and 5G cellular systems have been modified to better take into account the specific mMTC networking requirements. Nevertheless, to better address the low-energy, low-cost, and high-scalability targets, other wireless standards, such as the DECT-2020, have observed to provide a competitive alternative. However, since the DECT-2020 standard has only recently emerged, there is not yet much information available about its system performance in typical mMTC use scenarios, providing a research motivation for our work.
Connection density: ≥ 1M devices/km2
Security
Metering
Energy
Health
Logistics
Industry
Transport
Figure 1. Illustration of mMTC-enabled use cases.
RESEARCH REPORT VTT-R-00367-21
7 (22)
2.2 Overview of DECT-2020 Wireless Standard
The DECT-2020 standard is essentially a wireless mesh network which connects radio devices
(RDs) directly to fixed termination points (FTs) (that are further connected to Internet gateways)
or via multiple hops using other RDs that are all capable of routing the traffic of other devices
autonomously. Hence, RDs similar to UEs in 3GPP terminology can be either in a fixed mode
(RD-F, cluster coordination) or in a portable mode (RD-P, cluster member). FTs can be seen
as simple base stations having a low complexity implementation when compared to cellular
systems. In addition to mesh networking, the standard also supports conventional star and
point-to-point topologies.
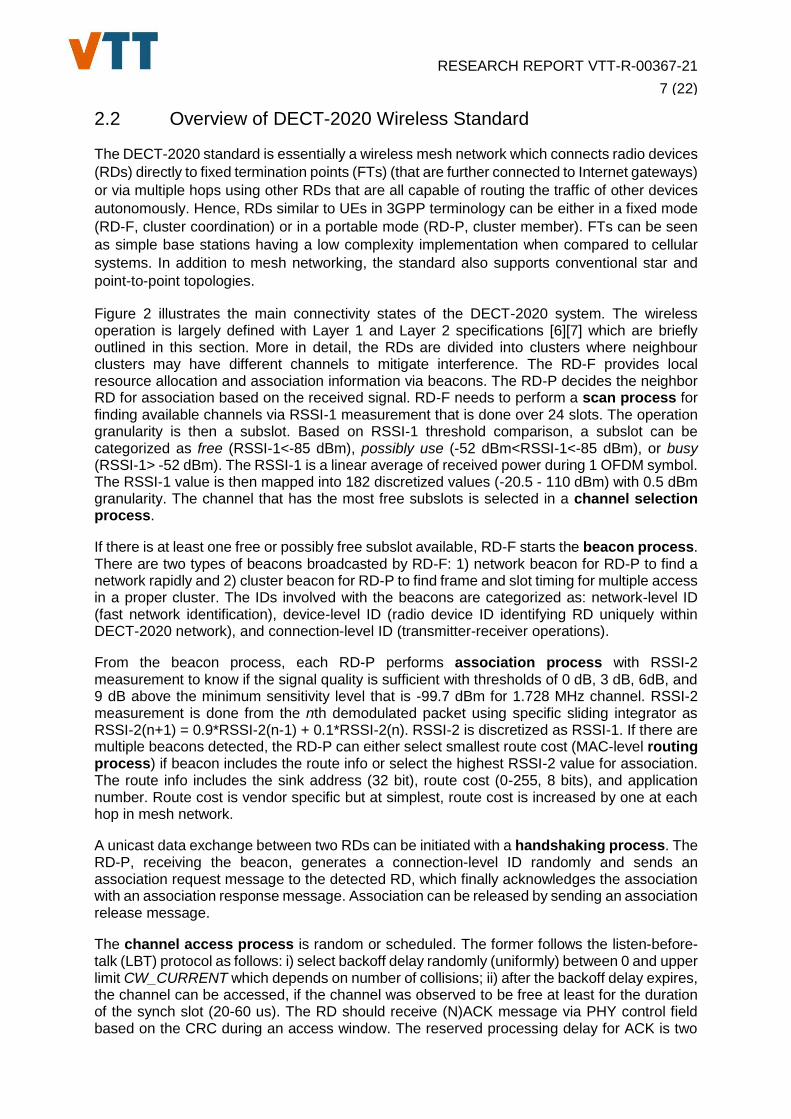
Figure 2 illustrates the main connectivity states of the DECT-2020 system. The wireless operation is largely defined with Layer 1 and Layer 2 specifications [6][7] which are briefly outlined in this section. More in detail, the RDs are divided into clusters where neighbour clusters may have different channels to mitigate interference. The RD-F provides local resource allocation and association information via beacons. The RD-P decides the neighbor RD for association based on the received signal. RD-F needs to perform a scan process for finding available channels via RSSI-1 measurement that is done over 24 slots. The operation granularity is then a subslot. Based on RSSI-1 threshold comparison, a subslot can be categorized as free (RSSI-1<-85 dBm), possibly use (-52 dBm<RSSI-1<-85 dBm), or busy (RSSI-1> -52 dBm). The RSSI-1 is a linear average of received power during 1 OFDM symbol. The RSSI-1 value is then mapped into 182 discretized values (-20.5 - 110 dBm) with 0.5 dBm granularity. The channel that has the most free subslots is selected in a channel selection process.
If there is at least one free or possibly free subslot available, RD-F starts the beacon process. There are two types of beacons broadcasted by RD-F: 1) network beacon for RD-P to find a network rapidly and 2) cluster beacon for RD-P to find frame and slot timing for multiple access in a proper cluster. The IDs involved with the beacons are categorized as: network-level ID (fast network identification), device-level ID (radio device ID identifying RD uniquely within DECT-2020 network), and connection-level ID (transmitter-receiver operations).
From the beacon process, each RD-P performs association process with RSSI-2 measurement to know if the signal quality is sufficient with thresholds of 0 dB, 3 dB, 6dB, and 9 dB above the minimum sensitivity level that is -99.7 dBm for 1.728 MHz channel. RSSI-2 measurement is done from the nth demodulated packet using specific sliding integrator as RSSI-2(n+1) = 0.9*RSSI-2(n-1) + 0.1*RSSI-2(n). RSSI-2 is discretized as RSSI-1. If there are multiple beacons detected, the RD-P can either select smallest route cost (MAC-level routing process) if beacon includes the route info or select the highest RSSI-2 value for association. The route info includes the sink address (32 bit), route cost (0-255, 8 bits), and application number. Route cost is vendor specific but at simplest, route cost is increased by one at each hop in mesh network.
A unicast data exchange between two RDs can be initiated with a handshaking process. The RD-P, receiving the beacon, generates a connection-level ID randomly and sends an association request message to the detected RD, which finally acknowledges the association with an association response message. Association can be released by sending an association release message.
The channel access process is random or scheduled. The former follows the listen-before-talk (LBT) protocol as follows: i) select backoff delay randomly (uniformly) between 0 and upper limit CW_CURRENT which depends on number of collisions; ii) after the backoff delay expires, the channel can be accessed, if the channel was observed to be free at least for the duration of the synch slot (20-60 us). The RD should receive (N)ACK message via PHY control field based on the CRC during an access window. The reserved processing delay for ACK is two
RESEARCH REPORT VTT-R-00367-21
8 (22)
slots. If it is not received, assume a collision, double backoff delay, and resend the message. If (N)ACK is received, assume no collision and set backoff delay to a target minimum value.
The hybrid automatic repeat request (HARQ) process first decodes PHY layer control field bits which include information on transmission mode, packet length, HARQ retransmission number. The HARQ process then combines the received retransmission with already received transmissions in the buffer (if any), decodes the data, and transmits N(ACK) based on the cyclic redundancy code test.
The physical transmission of the application data is based on orthogonal frequency division multiplexing (OFDM) signaling. Bit mapping and coding are performed using 11 different modulation and coding schemes with transport block sizes depending on the constellation size, coding rate, fast Fourier transform size, and subcarrier spacing, as detailed in [6].
Power off
(sleep)
Network
selection
Cluster
association
Appl. data
transfer
Power on Network
selected
Power off Coverage
loss
Association
selected Sleep
Association
release
Link failure
LBT/HARQ
Power off
Wake-up
Network
beacon
Cluster
beacon
Figure 2. Main connectivity states of the DECT-2020 system.
2.3 Heterogeneous Channel Environment
The DECT-2020 based mesh network needs to handle several different wireless link types which also significantly affect the performance evaluation. The most typical differentiating channel characteristics include:
1) Environment type: e.g. rural, urban, suburban
2) Cell coverage type: e.g. macrocell, microcell, picocell
RESEARCH REPORT VTT-R-00367-21
9 (22)
3) Location type (end-to-end): e.g. outdoor-to-outdoor; outdoor-to-indoor, indoor-to-indoor
4) Visibility type: e.g. line-of-sight (LOS), non-line-of-sight (NLOS)
5) Terminal type (end-to-end): e.g. base-to-device (B2D), device-to-device (D2D)
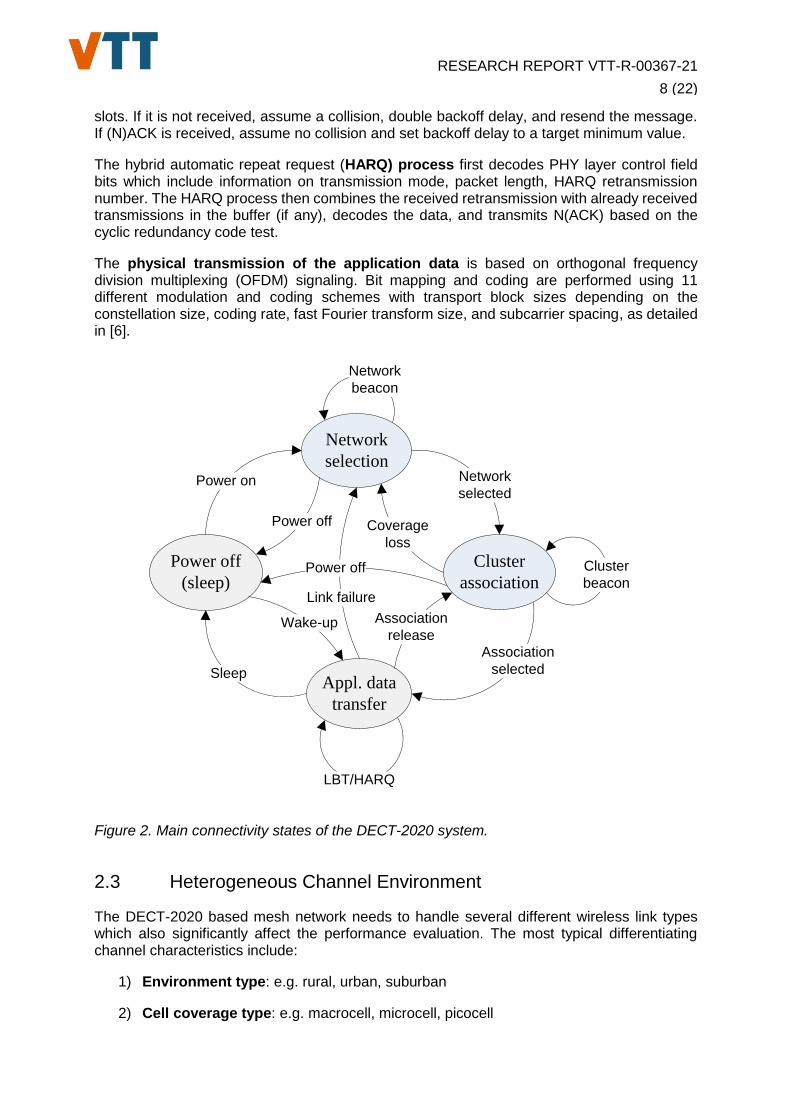
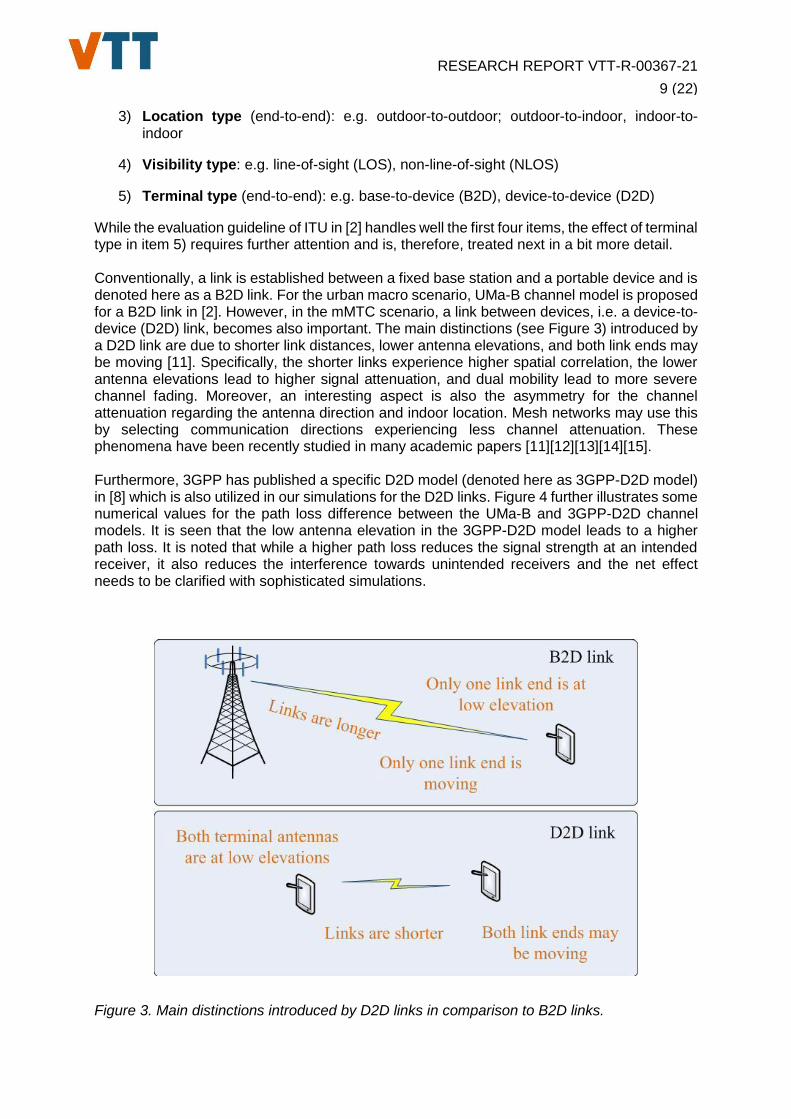
While the evaluation guideline of ITU in [2] handles well the first four items, the effect of terminal type in item 5) requires further attention and is, therefore, treated next in a bit more detail. Conventionally, a link is established between a fixed base station and a portable device and is denoted here as a B2D link. For the urban macro scenario, UMa-B channel model is proposed for a B2D link in [2]. However, in the mMTC scenario, a link between devices, i.e. a device-to-device (D2D) link, becomes also important. The main distinctions (see Figure 3) introduced by a D2D link are due to shorter link distances, lower antenna elevations, and both link ends may be moving [11]. Specifically, the shorter links experience higher spatial correlation, the lower antenna elevations lead to higher signal attenuation, and dual mobility lead to more severe channel fading. Moreover, an interesting aspect is also the asymmetry for the channel attenuation regarding the antenna direction and indoor location. Mesh networks may use this by selecting communication directions experiencing less channel attenuation. These phenomena have been recently studied in many academic papers [11][12][13][14][15]. Furthermore, 3GPP has published a specific D2D model (denoted here as 3GPP-D2D model) in [8] which is also utilized in our simulations for the D2D links. Figure 4 further illustrates some numerical values for the path loss difference between the UMa-B and 3GPP-D2D channel models. It is seen that the low antenna elevation in the 3GPP-D2D model leads to a higher path loss. It is noted that while a higher path loss reduces the signal strength at an intended receiver, it also reduces the interference towards unintended receivers and the net effect needs to be clarified with sophisticated simulations.
Figure 3. Main distinctions introduced by D2D links in comparison to B2D links.
RESEARCH REPORT VTT-R-00367-21
10 (22)
Figure 4. Illustration of path loss difference as a function of link distance between B2D (UMa-B) and D2D (3GPP-D2D) models for LOS and outdoor-to-outdoor link types. Used base antenna heights are given in the parentheses while device antennas have 1.5 m.
RESEARCH REPORT VTT-R-00367-21
11 (22)
3. Performance Evaluation
3.1 Outline of Evaluation Guidelines
Since the purpose of the study is to provide an assessment whether the DECT-2020 standard would fulfil the IMT-2020 requirements set by ITU, it is important that the study follows the determined evaluation guidelines from [2]. We do not intend to repeat all the guideline details here, but only to highlight some main aspects.
The following principles shall be followed in a system-level simulation for evaluating achievable device connection density for the mMTC scenario:
Users are dropped independently with a certain distribution over the predefined area of the network layout throughout the system.
User equipment (UE) are randomly assigned LOS and NLOS channel conditions.
Cell assignment to a UE is based on the proponent’s cell selection scheme.
Signal fading and interference from each transmitter into each receiver are computed on an aggregated basis.
In simulations, packets are not blocked when they arrive into the system (i.e. queue depths are assumed to be infinite).
Packets are scheduled with an appropriate packet scheduler(s), or with non-scheduled mechanism when applicable for full buffer and other traffic models separately. Channel quality feedback delay, feedback errors, protocol data unit errors and real channel estimation effects inclusive of channel estimation error are modelled and packets are retransmitted as necessary.
The overhead channels (i.e. the overhead due to feedback and control channels) should be realistically modelled.
For a given drop, the simulation is run and then the process is repeated with UEs dropped at new random locations. A sufficient number of drops is simulated to ensure convergence in the UE and system performance metrics.
All cells in the system shall be simulated with dynamic channel properties and performance statistics are collected taking into account the wrap-around configuration in the network layout, noting that wrap-around is not considered in the indoor case.
There are two possible evaluation methods to evaluate connection density requirement: our approach focuses to non-full buffer system-level simulation; another approach uses full-buffer system-level simulation followed by link-level simulation.
Run non-full buffer system-level simulation to obtain the packet outage rate. The outage rate is defined as the ratio of the number of packets that failed to be delivered to the destination receiver within a transmission delay of less than or equal to 10s to the total number of packets.
Calculate connection density by equation C = N’ / A, where the TRxP area A is calculated as A = ISD2 × sqrt(3)/6, N’ is the system user number per TRxP satisfying the packet outage rate of 1%, and ISD is the inter-site distance.
The requirement is fulfilled if the connection density C is greater than or equal to the connection density requirement, i.e. 1M devices per km2.
RESEARCH REPORT VTT-R-00367-21
12 (22)
3.2 Simulation Assumptions
We consider the DECT-2020 wireless network conducting uplink transmissions where a portable source RD (aka UE) is willing to transmit a fixed-length packet of 32 bytes (at Layer 2) to a target fixed termination (FT) point (aka BS) which acts as a message sink. Note that the FT can be much simpler in DECT-2020 than base stations in typical mobile systems. Furthermore, all RDs can be either in RD-F (cluster coordination) or in RD-P (cluster member) mode as discussed in Section 2.2. The packet and slot structure are shown in Figure 5. The FT may be reached directly or via multihops though a selected number of routing RD-F nodes. Also, RD-F nodes generate their own packets in addition to the routing packets. The communicating RDs are randomly placed into a network area of interest with fixed hexagonal grid of FTs having a selected inter-site distance (ISD). Each FT coordinates three sectors. RDs are further divided into clusters which are coordinated by RD-F nodes. Clusters and sectors may have different channels or antenna directions to mitigate interference. RD-F routers are randomly selected from all RDs so that the proportion of RD-Fs out of all RDs is ε % which is one of the key system parameters of DECT-2020. It is emphasized that RD-F deployment depends on target application and is neither specified by the standard nor a system design parameter. In practice, any device can act as a RD-F. The link types of one sector are further illustrated in Figure 6 and different network layouts of interests are presented in Figure 7.
The communication is divided into association phase and application payload phase. In the association phase, standard-specific beacons are used to find appropriate routes and slot timing for multiple access in each clusters. A simple routing algorithm, which selects the best route that fulfils minimum quality requirements with the smallest number of hops, is applied. The multiple access is performed via standard listen-before-talk (LBT) method, as specified in ETSI TS 103 636-4 [7]. In the application payload phase, application packets are transmitted using a selected modulation and coding scheme (MCS) and hybrid automatic repeat request (HARQ) from ETSI TS 103 636-3 [6] and ETSI TS 103 636-4 [7] and, finally, the resulted packet outage rate is measured over a given spatial area.
Time slot (417 us, 10 OFDM symbols)
0 1 2 3 4 5 6 7 8 9
mMTC application data
L2 packet (32 bytes)
Sync Control GuardData payload
Figure 5. Packet and slot structure used for the performance evaluation.
RESEARCH REPORT VTT-R-00367-21
13 (22)
Cluster k
Cluster k+1
RD-RD lin
ks
RD
-RD
links
FT
RD-P
RD-F
RD-P
RD-P
RD-F
RD-P
RD-P
RD-FT links
RD-P
Cluster k
Cluster k+2
RD-RD links
RD-RD links
FT
RD-P
RD-FRD-P
RD-P
RD-F
RD-P
RD-P
RD-FT links
RD-F
Cluster k+1RD-RD links
a) Realization m of network topology b) Realization m+1 of network topology
Figure 6. A simplified illustration of different DECT-2020 network node roles and link types within a single FT sector. The role of nodes can vary and is not a fixed node ability. The actual simulated number of RDs within a single FT sector is 72 169 which results in the density of 1 million nodes per km2 for ISD = 500 m.
Sector 2
Sector 1
Sector 3
ISD=500m
a) 1 FT; 3 sectors b) 7 FTs; 21 sectors c) 19 FTs; 57 sectors
Figure 7. Hexagonal grid network layouts for different FT configurations. Each FT coordinates three sectors.
The most essential DECT-2020 system parameters used in the simulations are presented in Table 1.The network simulations to evaluate the packet outage rates are performed using NS-3 simulation software and the link-level simulation results from [9] used with the network simulations are performed utilizing Matlab communication toolboxes.
RESEARCH REPORT VTT-R-00367-21
14 (22)
Table 1. DECT-2020 system assumptions for packet outage rate evaluation.
Parameter Value Comments
Communication direction Uplink Some control messages are sent via downlink
Channel bandwidth 1.728 MHz
Number of channels 5
Each channel has bandwidth of 1.728 MHz, so that system
bandwidth is 8.64 MHz (maximum allowed bandwidth for
ISD = 500m is 10 MHz in Report ITU-R M.2412-0 [2]).
Three channels are used by FTs; one FT uses separate
channels for its three sectors; an RD-F may select from
two remaining channels.
Traffic model Poisson 1 packet/2h/device; non-full buffer model
RD deployment 80% indoor, 20%
outdoor
RDs are randomly dropped to the area of interest; two
indoor RDs of the same link are considered to locate in the
same building, if their distance is less than 50 m, otherwise
they locate in different buildings.
Number of FTs 1, 7, 19 Depends on the network configuration, outage rate is
observed for the FT in the center
Number of RDs 216k, 1.5M and 4.0M Depends on the network configuration.
Proportion of RD-Fs 0.1, 0.2, 0.5 and 1.0 % Depends on the network configuration.
Maximum number of hops 3 RD RD-F RD-F FT
Inter-site distance (ISD) 500 m
RX sensitivity -99.7 dBm
Transmission power 23 dBm Also 10 dBm tested.
Thermal noise power -174 dBm/Hz
Noise figure 7 dB
Carrier frequency 700 MHz
Layer 2 packet size 32 bytes Transport block size is 296 bits
Slot length 417 us See the slot structure in Figure 5
Routing Minimum hops RDs can connect to the target FTs directly or via RD-Fs
using multihop links
Channel access Random access/listen
before talk
See ETSI TS 103 636-4 [7]
Number of random access slots FT: 9600; RD-F: 48
Cluster beacon period 4 s. Low power operation for RD-F.
2 slots from random access slots are used for beacons.
Also 24, 96 and 192 slots were tested for RD-Fs.
Number of antenna elements RD: 1; FT: 1
Maximum antenna gains RD: 0 dBi; FT: 8 dBi Report ITU-R M.2412-0 [2]
Antenna heights RD: 1.5 m; FT: 25 m
Spatial diversity None
Path loss model (incl. shadowing) UMa-B, 3GPP-D2D
UMa-B from Report ITU-R M.2412-0 [2] is used for RD-
FT links; 3GPP- D2D from 3GPP TR 36.843 (rel 12) [8] is
used for RD-RD links
Link fading model UMa-B, 3GPP-D2D
UMa-B from ITU-R M.2412-0 [2] is used for RD-FT
links; 3GPP- D2D from 3GPP TR 36.843 (rel 12) [8] is
used for RD-RD links
Subcarrier spacing 27 kHz
FFT length 64
Modulation and coding scheme MCS Index 1 See ETSI TS 103 636-3 [6]
Maximum HARQ retransmissions 8 See ETSI TS 103 636-4 [7]
Channel estimation Wiener
Equalization Zero forcing
Time and frequency
synchronization
Indirectly via SINR
degradation of 0.5 dB
RDs may apply multiple synchronization strategies at link
level
RD velocity 3 km/h Dual mobility model is used for RD-RD links at physical
layer.
RESEARCH REPORT VTT-R-00367-21
15 (22)
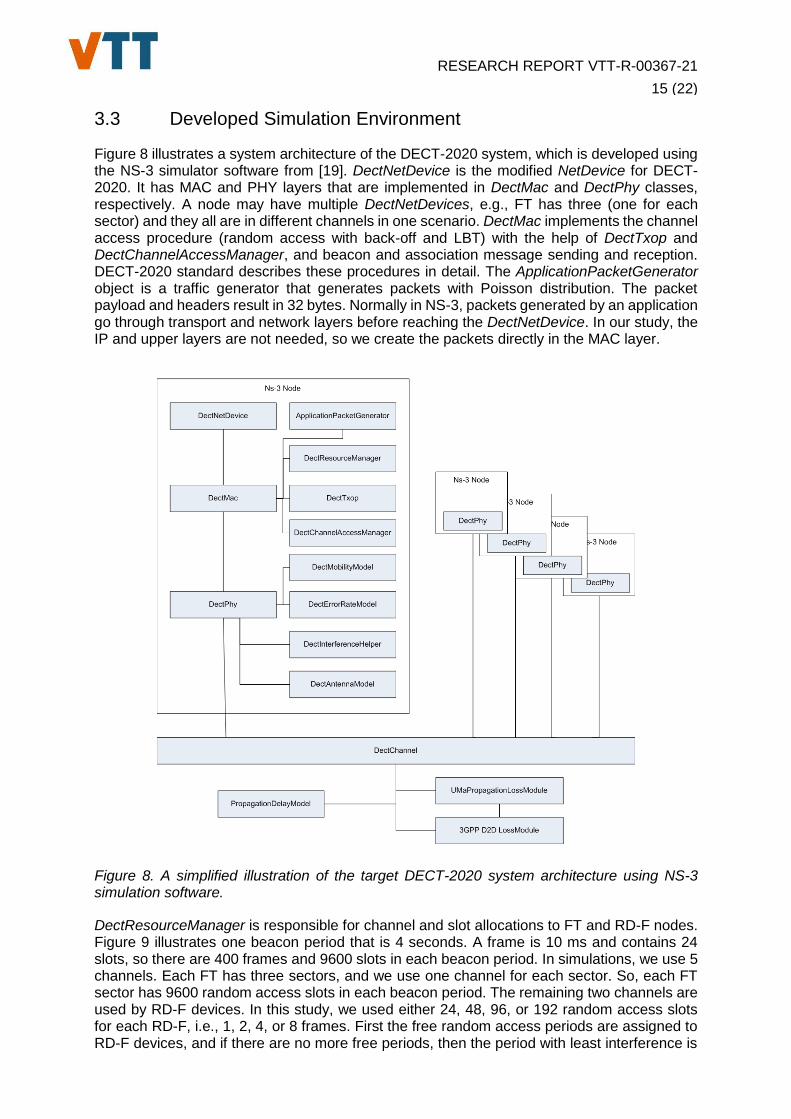
3.3 Developed Simulation Environment
Figure 8 illustrates a system architecture of the DECT-2020 system, which is developed using the NS-3 simulator software from [19]. DectNetDevice is the modified NetDevice for DECT-2020. It has MAC and PHY layers that are implemented in DectMac and DectPhy classes, respectively. A node may have multiple DectNetDevices, e.g., FT has three (one for each sector) and they all are in different channels in one scenario. DectMac implements the channel access procedure (random access with back-off and LBT) with the help of DectTxop and DectChannelAccessManager, and beacon and association message sending and reception. DECT-2020 standard describes these procedures in detail. The ApplicationPacketGenerator object is a traffic generator that generates packets with Poisson distribution. The packet payload and headers result in 32 bytes. Normally in NS-3, packets generated by an application go through transport and network layers before reaching the DectNetDevice. In our study, the IP and upper layers are not needed, so we create the packets directly in the MAC layer.
Figure 8. A simplified illustration of the target DECT-2020 system architecture using NS-3 simulation software.
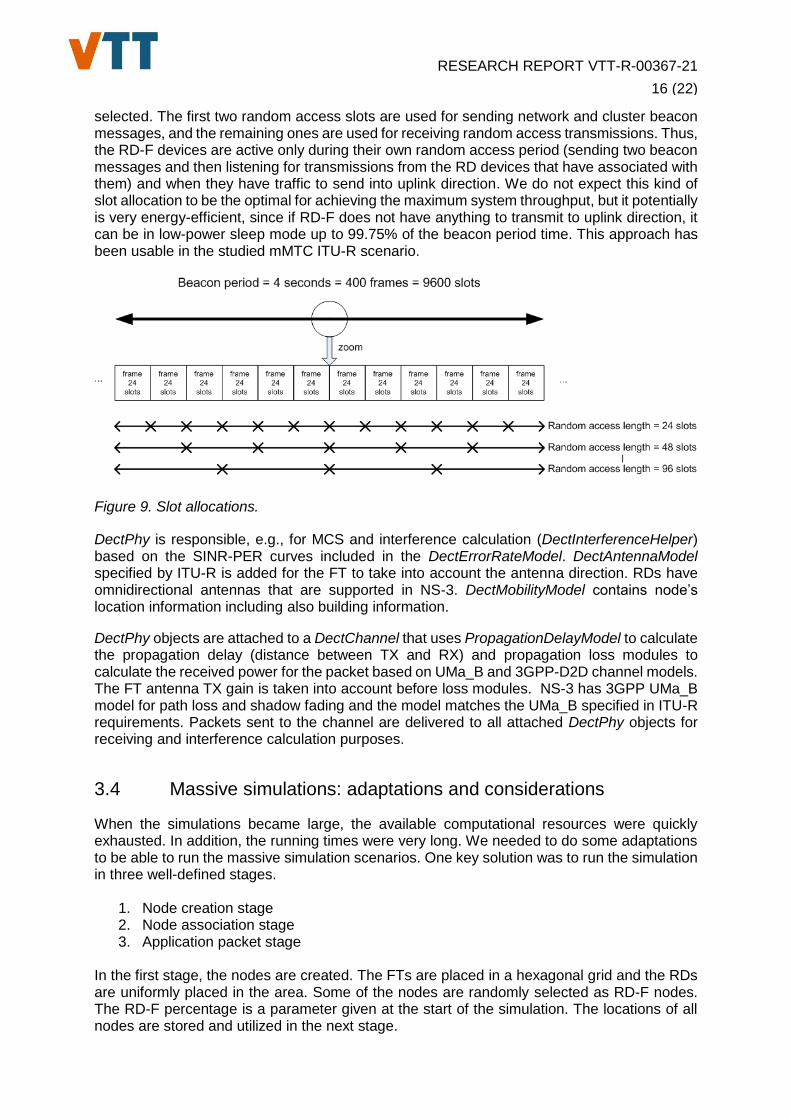
DectResourceManager is responsible for channel and slot allocations to FT and RD-F nodes. Figure 9 illustrates one beacon period that is 4 seconds. A frame is 10 ms and contains 24 slots, so there are 400 frames and 9600 slots in each beacon period. In simulations, we use 5 channels. Each FT has three sectors, and we use one channel for each sector. So, each FT sector has 9600 random access slots in each beacon period. The remaining two channels are used by RD-F devices. In this study, we used either 24, 48, 96, or 192 random access slots for each RD-F, i.e., 1, 2, 4, or 8 frames. First the free random access periods are assigned to RD-F devices, and if there are no more free periods, then the period with least interference is
RESEARCH REPORT VTT-R-00367-21
16 (22)
selected. The first two random access slots are used for sending network and cluster beacon messages, and the remaining ones are used for receiving random access transmissions. Thus, the RD-F devices are active only during their own random access period (sending two beacon messages and then listening for transmissions from the RD devices that have associated with them) and when they have traffic to send into uplink direction. We do not expect this kind of slot allocation to be the optimal for achieving the maximum system throughput, but it potentially is very energy-efficient, since if RD-F does not have anything to transmit to uplink direction, it can be in low-power sleep mode up to 99.75% of the beacon period time. This approach has been usable in the studied mMTC ITU-R scenario.
Figure 9. Slot allocations.
DectPhy is responsible, e.g., for MCS and interference calculation (DectInterferenceHelper) based on the SINR-PER curves included in the DectErrorRateModel. DectAntennaModel specified by ITU-R is added for the FT to take into account the antenna direction. RDs have omnidirectional antennas that are supported in NS-3. DectMobilityModel contains node’s location information including also building information.
DectPhy objects are attached to a DectChannel that uses PropagationDelayModel to calculate the propagation delay (distance between TX and RX) and propagation loss modules to calculate the received power for the packet based on UMa_B and 3GPP-D2D channel models. The FT antenna TX gain is taken into account before loss modules. NS-3 has 3GPP UMa_B model for path loss and shadow fading and the model matches the UMa_B specified in ITU-R requirements. Packets sent to the channel are delivered to all attached DectPhy objects for receiving and interference calculation purposes.
3.4 Massive simulations: adaptations and considerations
When the simulations became large, the available computational resources were quickly exhausted. In addition, the running times were very long. We needed to do some adaptations to be able to run the massive simulation scenarios. One key solution was to run the simulation in three well-defined stages.
1. Node creation stage 2. Node association stage 3. Application packet stage
In the first stage, the nodes are created. The FTs are placed in a hexagonal grid and the RDs are uniformly placed in the area. Some of the nodes are randomly selected as RD-F nodes. The RD-F percentage is a parameter given at the start of the simulation. The locations of all nodes are stored and utilized in the next stage.
RESEARCH REPORT VTT-R-00367-21
17 (22)
The second stage makes the devices functional and associates them either to a FT or RD-F. In this stage, we install a net device for each node, including the target PHY and MAC layer functionalities described in Section 2.2. The simulation supports multi-hops, which in this case is implemented so that half of the RD-Fs first associate to the FTs, then half of the remaining RD-Fs associate either to FTs or to previously associated RD-Fs. This continues until we have associated all the RD-Fs. If for some reason an RD-F cannot associate, we turn it into a normal RD node. Finally, all the remaining RDs are associated. The association related information is stored and passed to the next stage of the simulation. The third stage is the actual simulation scenario. The information that was stored in the previous stages is read and the nodes can start sending their application packets. The packet outage rate is monitored and reported at the end of this stage. The association stage of the simulation required most of the computational resources as there were a large amount packets being sent to a massive number of nodes. Most of the performance boost came from the idea that this stage could be partitioned into N separate sub-simulations. The N is a command line parameter that can be adjusted to each simulation scenario. Now, running the partitions sequentially would require just a minimal amount of memory. However, as the stages are independent, they could also be run in parallel in multiple machines, which would save a lot of time. Other significant performance related optimizations came from compressing some frequent values into fewer bits. In addition, after each simulation stage, the memory was flushed, and only the relevant information was preserved, which helped saving memory.
3.5 Simulation Results
This section presents the obtained system simulation perfomance results. We have simulated packet outage rate (POR) of the system. First, we studied the effect of the number of random access slots allocated to all RD-F devices. The results are shown in Table 2. More in detail, we have used different network configurations and parameters regarding the number of FTs (NFT), number of sectors (NS), total number of RDs (NRD), and different RD-F proportions out of all RDs (ε). All results of the table have been averaged over many independent simulation runs with different RD locations. Note that although the absolute number of network nodes changes per studied configuration, all configurations satisfy the density requirement of 1M RDs per km2. Also, the results do not vary significantly between NFT = 1, 7 and 19. The 95% confidence interval for 1 FT, ε = 0.5 % with 48 slots case is 0.26% - 0.29%. It is seen that the target maximum packet outage rate of 1% is fulfilled for all simulated network configurations.
Table 2. Packet outage rates for different network configurations (NFT, NS, NRD) and RD-F proportions (ε) and number of random access slots for RD-F devices. The missing values (marked with ‘-‘) in the table are due to the computing resource limitations; the scenario is too large compared to the available memory in our computing nodes.
Network configuration
Packet Outage Rate
Number of random
access slots NFT NS NRD NRD/km2 ε = 0.1 % ε = 0.2 % ε = 0.5 % ε = 1.0 %
1 3 216 507 1 000 000 0.36% 0.32% 0.30% 0.28% 24 slots
1 3 216 507 1 000 000 0.25% 0.25% 0.28% 0.26% 48 slots
1 3 216 507 1 000 000 0.24% 0.25% 0.28% 0.29% 96 slots
1 3 216 507 1 000 000 0.32% 0.41% 0.56% 0.53% 192 slots
7 21 1 500 000 1 000 000 0.25% 0.23% 0.22% - 48 slots
19 57 4 000 000 1 000 000 0.29% - - - 48 slots
RESEARCH REPORT VTT-R-00367-21
18 (22)
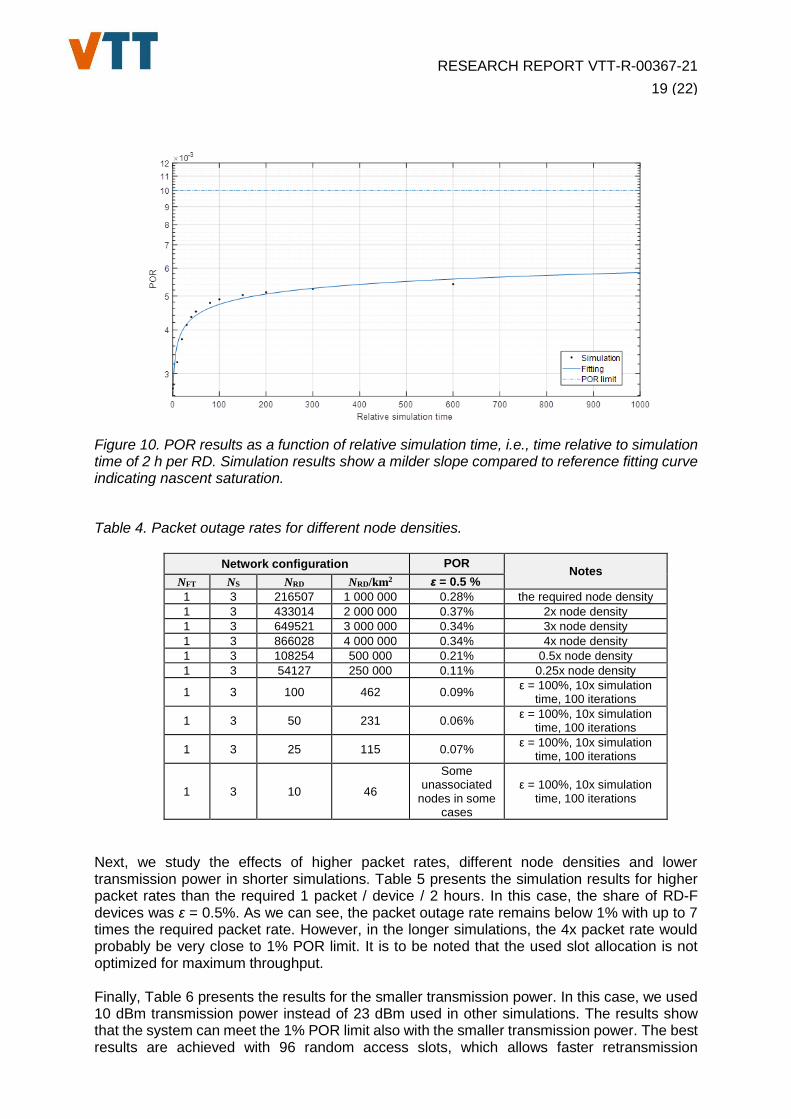
Based on the results above, we decided to use 48 random access slots for RD-F devices in the following simulations. Next, we studied the effect of simulation time to the POR. Because of high computing power and memory requirements, and also limited calendar time, the above simulation studies were made with 2 hours simulation time when considering the time over which RDs are sending their packets to FTs. However, as presented in Table 3, the POR increases when the simulation time is increased. Furthermore, the packet outage rate is settling down as the simulation time is increased more and more. With 7 FTs, there seems to be similar behaviour when observing two last example results in Table 3. We can also see that the packet outage rate of the longest simulation time (600 * 2 hours) is almost double compared to that of the shortest simulation time. However, even doubling all the results presented above in Table 2 still does not change the fact that the packet outage rate remains well below 1% with the required node density and packet rate with any studied number of random access slots; only the random access length of 192 slots with ε = 0.5% and 1.0% would be over 1% POR limit. Main reason for getting lower POR with smaller simulation time may be related to the fact that the network is initially empty from RD traffic so that first packets are less likely interfered as subsequent ones. Hence, there is an inherent transient period for the packet collisions and the steady state, regarding the averaged POR, is reached relatively slowly with the given sparse traffic model. Due to the very high spatial density of simulated RDs, the simulation time per RD is limited given the limited resources of the simulating computer. Nevertheless, our rough POR curve fitting analysis for single FT POR results of Table 3 is presented in Figure 10. The figure indicates a nascent saturation to a level that is well below the target POR limit of 1%. Additional simulations were run and these results showed similar trends. Interestingly, the extrapolation depicted in Figure 10 would take about 1600 years of real life time to reach POR of 1%. Based on our analysis, we can conclude that the DECT-2020 system fulfills the ITU requirement of 1% POR limit for mMTC scenario. Table 3. Packet outage rates for different simulation times (longer than above results).
Network configuration POR Notes
NFT NS NRD NRD/km2 ε = 0.5 %
1 3 216 507 1 000 000 0.28% 1x = 2 h simulation time 1 3 216 507 1 000 000 0.32% 10x simulation time 1 3 216 507 1 000 000 0.38% 20x simulation time 1 3 216 507 1 000 000 0.41% 30x simulation time 1 3 216 507 1 000 000 0.44% 40x simulation time 1 3 216 507 1 000 000 0.45% 50x simulation time 1 3 216 507 1 000 000 0.48% 80x simulation time 1 3 216 507 1 000 000 0.49% 100x simulation time 1 3 216 507 1 000 000 0.50% 150x simulation time
1 3 216 507 1 000 000 0.51% 200x simulation time
1 3 216 507 1 000 000 0.52% 300x simulation time
1 3 216 507 1 000 000 0.54% 600x simulation time
7 21 1 500 000 1 000 000 0.25% 1x simulation time, ε = 0.1 %
7 21 1 500 000 1 000 000 0.30% 10x simulation time, ε = 0.1 %
Table 4 presents the simulation results for different node densities. Shorter simulations were run for these results (2 h or 20 h simulation time). It can be seen from the results that there are no problems with four times bigger node density than the required 1M nodes per km2. Additionally, we tested what would be the smallest number of devices in the coverage area of 1 FT so that every device is still able to have service. In this case, all devices were set to the RD-F mode so that they could forward each other’s messages. We found out that with 25 devices, all devices still have service access and the packet outage rate is well below 1%. With 10 devices, some devices were unable to associate with any other device. For this case, we used 100 independent simulation iterations that had different device locations.
RESEARCH REPORT VTT-R-00367-21
19 (22)
Figure 10. POR results as a function of relative simulation time, i.e., time relative to simulation time of 2 h per RD. Simulation results show a milder slope compared to reference fitting curve indicating nascent saturation.
Table 4. Packet outage rates for different node densities.
Network configuration POR Notes
NFT NS NRD NRD/km2 ε = 0.5 %
1 3 216507 1 000 000 0.28% the required node density
1 3 433014 2 000 000 0.37% 2x node density
1 3 649521 3 000 000 0.34% 3x node density
1 3 866028 4 000 000 0.34% 4x node density
1 3 108254 500 000 0.21% 0.5x node density
1 3 54127 250 000 0.11% 0.25x node density
1 3 100 462 0.09% ε = 100%, 10x simulation
time, 100 iterations
1 3 50 231 0.06% ε = 100%, 10x simulation
time, 100 iterations
1 3 25 115 0.07% ε = 100%, 10x simulation
time, 100 iterations
1 3 10 46
Some unassociated
nodes in some cases
ε = 100%, 10x simulation time, 100 iterations
Next, we study the effects of higher packet rates, different node densities and lower transmission power in shorter simulations. Table 5 presents the simulation results for higher packet rates than the required 1 packet / device / 2 hours. In this case, the share of RD-F devices was ε = 0.5%. As we can see, the packet outage rate remains below 1% with up to 7 times the required packet rate. However, in the longer simulations, the 4x packet rate would probably be very close to 1% POR limit. It is to be noted that the used slot allocation is not optimized for maximum throughput. Finally, Table 6 presents the results for the smaller transmission power. In this case, we used 10 dBm transmission power instead of 23 dBm used in other simulations. The results show that the system can meet the 1% POR limit also with the smaller transmission power. The best results are achieved with 96 random access slots, which allows faster retransmission
RESEARCH REPORT VTT-R-00367-21
20 (22)
possibilities than 48 or 24 slots. Thus, adjusting minimum and maximum values of congestion window, using different kind of slot allocations, or allowing e.g. one more hop, could be beneficial for the performance. However, studying this in more detail is left for future work.
Table 5. Packet outage rates for higher packet rates with 20 hours simulation time.
Network configuration POR Packet rate
NFT NS NRD NRD/km2 ε = 0.5 %
1 3 216507 1 000 000 0.32% the required packet rate
1 3 216507 1 000 000 0.42% 2x packet rate
1 3 216507 1 000 000 0.58% 4x packet rate
1 3 216507 1 000 000 0.75% 6x packet rate
1 3 216507 1 000 000 0.88% 7x packet rate
1 3 216507 1 000 000 1.02% 8x packet rate
Table 6. Packet outage rates for smaller transmission power.
Network configuration POR Tx power and random access
length NFT NS NRD NRD/km2 ε = 1.0 %
1 3 216 507 1 000 000 0.50% tx power = 10 dBm, 24 slots
1 3 216 507 1 000 000 0.51% tx power = 10 dBm, 48 slots
1 3 216 507 1 000 000 0.39% tx power = 10 dBm, 96 slots
1 3 216 507 1 000 000 0.87% tx power = 10 dBm, 192 slots
3.6 Discussion
The presented simulation results show that DECT-2020 is able to fulfil the given mMTC user density requirements of ITU. A key strength of the developed simulator is that it is able to model both the clustered RD association phase as well as the application data transfer phase with a reasonable accuracy and within a reasonable simulation time.
In the report, we present an extensive number of simulation cases to illustrate performance trends as a function of many system parameters. For many cases, we have used a limited simulation time. Longer simulations can be considered for an interesting case. Large scenarios require extensive computing power and memory. Even longer simulations would have been desirable than available calendar time allowed. We discuss and demonstrate the effect of simulation time to the POR in our simulation model in Section 3.5 of this report.
It is emphasised that, presently, we did not use all the available advanced techniques, such as multiantenna diversity coding, or optimise system parameters extensively, that could further improve the system performance in the future work. The remaining system parameter optimization involves, e.g., optimal power control and routing strategies to minimize excessive interference to other network nodes. Furthermore, the DECT-2020 standard provides flexibility for bandwidth usage that was not been fully utilized yet.
RESEARCH REPORT VTT-R-00367-21
21 (22)
4. Conclusion
The mMTC applications deviate from traditional human-to-human communications in several ways. While recent 3GPP releases of 4G and 5G cellular systems have been modified to better take into account the specific mMTC networking requirements, other wireless standards, such as the DECT-2020, have been proposed to provide a competitive alternative in terms of low-energy, low-cost, and high-scalability targets.
In this research report, we have conducted an extensive study on the system-level performance of the DECT-2020 wireless system. First, brief overviews on the target mMTC use cases, DECT-2020 standard, and channel environment are presented. Next, the evaluation framework and simulation results are provided. Our results demonstrate DECT-2020 scalability characteristics via allowing high variation in user devices (RD) and extending network coverage via relaying functionality. Specifically, the evaluated RD density range was 100 - 4 000 000 RDs per km2. Much lower transmit power can be used than possible in ITU-R requirements.
It is concluded that, for the given evaluation framework, the DECT-2020 system is able to fulfil the aforementioned ITU requirements and it appears, therefore, a potential candidate for the IMT-2020-enabled mMTC digital services. Further work is beneficial for clarifying additional performance limits. The results of authors have also been contributed to ETSI, see [10], that was adopted to ETSI evaluation group report submitted to ITU-R [21].
RESEARCH REPORT VTT-R-00367-21
22 (22)
5. References
[1] Report ITU-R M.2410-0, Minimum requirements related to technical performance
for IMT-2020 radio interface(s).
[2] Report ITU-R M.2412-0, Guidelines for evaluation of radio interface technologies
for IMT-2020
[3] IMT-2020/17-E Revision 1, Acknowledgement of candidate SRIT submission from
ETSI (TC DECT) and DECT forum under step 3 of the IMT-2020 process.
[4] ETSI TS 103 636-1: "DECT-2020 New Radio (NR); Part 1: Overview; Release 1".
[5] ETSI TS 103 636-2: "DECT-2020 New Radio (NR); Part 2: Radio reception and
transmission requirements; Release 1".
[6] ETSI TS 103 636-3: "DECT-2020 New Radio (NR); Part 3: Physical layer; Release
1".
[7] ETSI TS 103 636-4: "DECT-2020 New Radio (NR); Part 4: MAC layer; Release 1".
[8] TR 36.843, “Study on LTE Device to Device Proximity Services (ProSe) — Radio
Aspects Release 12”, 2013.
[9] ETSI MSGEVAL(21)003006: "Link Level Simulation Results for mMTC,"
Sennheiser Electronic GmbH, January 26, 2021.
[10] ETSI MSGEVAL(21)004005: DECT-2020-NR for mMTC scenario: System
simulations," VTT Technical Research Centre of Finland, Feb. 1, 2021.
[11] X. Cheng et al., “Device-to-device channel measurements and models: A survey,”
IET Commun., 2014.
[12] X. Zhao et al, “Measurements and modelling for D2D indoor wideband MIMO radio
channels at 5GHz,” IET Commun., 2016.
[13] Z. Wang et al.,”Statistical peer-to-peer channel models for outdoor urban
environments at 2GHz and 5GHz,” in Proc. IEEE VTC 2004.
[14] P. Agrawal et al., ”Correlated link shadow fading in multi-hop wireless networks,”
IEEE Wireless Commun., 2009.
[15] S. Cotton, ”Human body shadowing in cellular device-to-device communications:
Channel modeling using the shadowed k-u fading model, ” IEE J. Sel. Areas
Commun., 2015.
[16] P. Jain et al.,”Machine type communications in 3GPP networks: potential,
challenges, adn solutions,” IEEE Commun. Mag., 2012.
[17] H. Wang et al., ”A survey of enabling technologies of low power and long range
machine-tomachine communications,” IEEE Commun. Surveys & Tut., 2017.
[18] N. Mahmood et al., ”White paper on critical and massive machine type
communications towards 6G,” White Paper 2020.
[19] NS-3 simulation software. https://www.nsnam.org/
[20] R.A. Rouil, et al. "An LTE Device-to-Device module for ns-3.", 2016.
[21] ETSI Evaluation Group, “Interim Evaluation Report for SRIT Submission from ETSI
(TC DECT), DECT Forum (Doc. IMT-2020/17(rev.1)), for DECT-2020 NR
Component RIT,” Document 5D/412-E, Feb. 10th, 2021.