antimicrobial resistance surveillance in europe - european centre
TRANSCRIPT

SURVEILLANCE REPORT
Antimicrobial resistance surveillance in Europe
2010
www.ecdc.europa.eu

Antimicrobial resistance surveillance in Europe
Annual report of the European Antimicrobial Resistance Surveillance Network (EARS-Net)
2010
ii
SURVEILLANCE REPORTAntimicrobial resistance surveillance in Europe 2010
Revised December 2011 This edition has been revised to correct a number of errors. The changes affect Figures 5.31 (Estonia and Romania), 5.32 (Estonia), 5.33 (Estonia and Romania) and 5.34 (Estonia). Estonia has been added to the listed countries showing a decrease in MRSA: pages 1, 30. Greece has been added as showing a significant decrease in vancomycin-resistant E faecium: page 34. Table 5.8a has been added.
Suggested citation for full report: European Centre for Disease Prevention and Control. Antimicrobial resistance surveillance in Europe 2010. Annual Report of the European Antimicrobial Resistance Surveillance Network (EARS-Net). Stockholm: ECDC; 2011.
Cover picture © istockphoto
ISSN 1831-9491
ISBN 978-92-9193-323-5
doi 10.2900/14911
© European Centre for Disease Prevention and Control, 2011.
Reproduction is authorised, provided the source is acknowledged.
CoordinationThis report of the European Centre for Disease Prevention and Control (ECDC) was coordinated by Ole Heuer.
Contributing authorsOle Heuer, Anna-Pelagia Magiorakos, Marianne Gunell, Assimoula Economopoulou, Paula Bianca Blomquist, Derek Brown, Christine Walton, Nita Patel and Dominique Monnet.
Data analysisCarlo Gagliotti, Carl Suetens, Jolanta Griskeviciene
AcknowledgementsThe EARS-Net Coordination group members: Christian Giske, Hajo Grundmann, Vincent Jarlier, Gunnar Kahlmeter, Jolanta Miciuleviciene, Gian Maria Rossolini, Gunnar Skov Simonsen, Nienke van de Sande-Bruinsma and Helena Zemlickova are acknowledged for providing valuable comments and scientific advice during the production of the report.
All EARS-Net participants and National Epidemiological Contact Points are acknowledged for providing valuable comments for this report.
All EARS-Net participating laboratories and hospitals in the Member States are acknowledged for providing data for this report.
John Stelling, Silvia Sarbu and Catalin Albu are acknowledged for data management and providing helpdesk support to the participating countries.
iii
Antimicrobial resistance surveillance in Europe 2010SURVEILLANCE REPORT
Contents
Abbreviations and acronyms . . . . . . . . . . . . . . . . . . . . . . . . . . . . . . . . . . . . . . . . . . . . . . . . . . . . . . . . . . . . . . . . . . . . . . . . . . . . . . . . . . . . . . . . . . . . . . . . . . . . . . . . . . . . . . . . . . . . . .vii
Countries participating in EARS-Net 2010 . . . . . . . . . . . . . . . . . . . . . . . . . . . . . . . . . . . . . . . . . . . . . . . . . . . . . . . . . . . . . . . . . . . . . . . . . . . . . . . . . . . . . . . . . . . . . . .ix
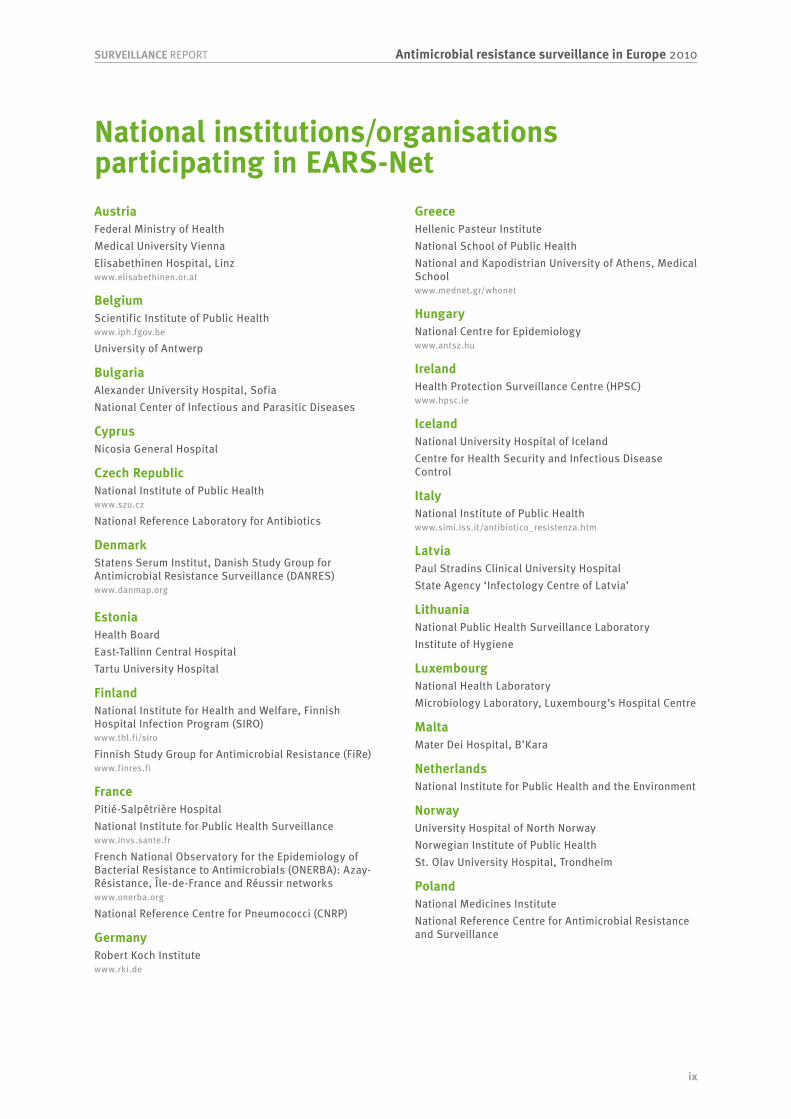
National institutions/organisations participating in EARS-Net . . . . . . . . . . . . . . . . . . . . . . . . . . . . . . . . . . . . . . . . . . . . . . . . . . . . . . . . . .xi
Summary . . . . . . . . . . . . . . . . . . . . . . . . . . . . . . . . . . . . . . . . . . . . . . . . . . . . . . . . . . . . . . . . . . . . . . . . . . . . . . . . . . . . . . . . . . . . . . . . . . . . . . . . . . . . . . . . . . . . . . . . . . . . . . . . . . . . . . . . . . . . . . . . . . . . . . . . . . . .1
1 Introduction . . . . . . . . . . . . . . . . . . . . . . . . . . . . . . . . . . . . . . . . . . . . . . . . . . . . . . . . . . . . . . . . . . . . . . . . . . . . . . . . . . . . . . . . . . . . . . . . . . . . . . . . . . . . . . . . . . . . . . . . . . . . . . . . . . . . . . . . . . . . . . . . . . . .3
2 Carbapenem-resistant Klebsiella pneumoniae and Pseudomonas aeruginosa. Analysis of data from laboratories reporting continuously from 2005 to 2010 . . . . . . . . . . . . . . . . . . . . . . . . . . . . . .5
2.1 Introduction . . . . . . . . . . . . . . . . . . . . . . . . . . . . . . . . . . . . . . . . . . . . . . . . . . . . . . . . . . . . . . . . . . . . . . . . . . . . . . . . . . . . . . . . . . . . . . . . . . . . . . . . . . . . . . . . . . . . . . . . . . . . . . . . . . . . . . . . . . . . . . . . . .5
2.2 Methods . . . . . . . . . . . . . . . . . . . . . . . . . . . . . . . . . . . . . . . . . . . . . . . . . . . . . . . . . . . . . . . . . . . . . . . . . . . . . . . . . . . . . . . . . . . . . . . . . . . . . . . . . . . . . . . . . . . . . . . . . . . . . . . . . . . . . . . . . . . . . . . . . . . . . . .6
2.3 Results . . . . . . . . . . . . . . . . . . . . . . . . . . . . . . . . . . . . . . . . . . . . . . . . . . . . . . . . . . . . . . . . . . . . . . . . . . . . . . . . . . . . . . . . . . . . . . . . . . . . . . . . . . . . . . . . . . . . . . . . . . . . . . . . . . . . . . . . . . . . . . . . . . . . . . . . .6
2.4 Discussion . . . . . . . . . . . . . . . . . . . . . . . . . . . . . . . . . . . . . . . . . . . . . . . . . . . . . . . . . . . . . . . . . . . . . . . . . . . . . . . . . . . . . . . . . . . . . . . . . . . . . . . . . . . . . . . . . . . . . . . . . . . . . . . . . . . . . . . . . . . . . . . . . . . .7
3 External Quality Assessment Exercise (EQA) 2010 . . . . . . . . . . . . . . . . . . . . . . . . . . . . . . . . . . . . . . . . . . . . . . . . . . . . . . . . . . . . . . . . . . . . . . . . . . . .11
3.1. Introduction . . . . . . . . . . . . . . . . . . . . . . . . . . . . . . . . . . . . . . . . . . . . . . . . . . . . . . . . . . . . . . . . . . . . . . . . . . . . . . . . . . . . . . . . . . . . . . . . . . . . . . . . . . . . . . . . . . . . . . . . . . . . . . . . . . . . . . . . . . . . . . . .11
3.2. Results . . . . . . . . . . . . . . . . . . . . . . . . . . . . . . . . . . . . . . . . . . . . . . . . . . . . . . . . . . . . . . . . . . . . . . . . . . . . . . . . . . . . . . . . . . . . . . . . . . . . . . . . . . . . . . . . . . . . . . . . . . . . . . . . . . . . . . . . . . . . . . . . . . . . . . .11
3.3 Conclusions . . . . . . . . . . . . . . . . . . . . . . . . . . . . . . . . . . . . . . . . . . . . . . . . . . . . . . . . . . . . . . . . . . . . . . . . . . . . . . . . . . . . . . . . . . . . . . . . . . . . . . . . . . . . . . . . . . . . . . . . . . . . . . . . . . . . . . . . . . . . . . . . 16
4 EARS-Net laboratory/hospital denominator data 2010 . . . . . . . . . . . . . . . . . . . . . . . . . . . . . . . . . . . . . . . . . . . . . . . . . . . . . . . . . . . . . . . . . . . . 17
4.1 Introduction . . . . . . . . . . . . . . . . . . . . . . . . . . . . . . . . . . . . . . . . . . . . . . . . . . . . . . . . . . . . . . . . . . . . . . . . . . . . . . . . . . . . . . . . . . . . . . . . . . . . . . . . . . . . . . . . . . . . . . . . . . . . . . . . . . . . . . . . . . . . . . . . 17
4.2 Methods . . . . . . . . . . . . . . . . . . . . . . . . . . . . . . . . . . . . . . . . . . . . . . . . . . . . . . . . . . . . . . . . . . . . . . . . . . . . . . . . . . . . . . . . . . . . . . . . . . . . . . . . . . . . . . . . . . . . . . . . . . . . . . . . . . . . . . . . . . . . . . . . . . . . . 17
4.3 Participation . . . . . . . . . . . . . . . . . . . . . . . . . . . . . . . . . . . . . . . . . . . . . . . . . . . . . . . . . . . . . . . . . . . . . . . . . . . . . . . . . . . . . . . . . . . . . . . . . . . . . . . . . . . . . . . . . . . . . . . . . . . . . . . . . . . . . . . . . . . . . . . 17
4.4 Population coverage . . . . . . . . . . . . . . . . . . . . . . . . . . . . . . . . . . . . . . . . . . . . . . . . . . . . . . . . . . . . . . . . . . . . . . . . . . . . . . . . . . . . . . . . . . . . . . . . . . . . . . . . . . . . . . . . . . . . . . . . . . . . . . . . . . . 17
4.5 Hospital denominator information . . . . . . . . . . . . . . . . . . . . . . . . . . . . . . . . . . . . . . . . . . . . . . . . . . . . . . . . . . . . . . . . . . . . . . . . . . . . . . . . . . . . . . . . . . . . . . . . . . . . . . . . . . . . . . . . 19
4.6 Hospital characteristics . . . . . . . . . . . . . . . . . . . . . . . . . . . . . . . . . . . . . . . . . . . . . . . . . . . . . . . . . . . . . . . . . . . . . . . . . . . . . . . . . . . . . . . . . . . . . . . . . . . . . . . . . . . . . . . . . . . . . . . . . . . . . . . 19
4.7 Laboratory denominator information. . . . . . . . . . . . . . . . . . . . . . . . . . . . . . . . . . . . . . . . . . . . . . . . . . . . . . . . . . . . . . . . . . . . . . . . . . . . . . . . . . . . . . . . . . . . . . . . . . . . . . . . . . . . . 19
4.8 Conclusions . . . . . . . . . . . . . . . . . . . . . . . . . . . . . . . . . . . . . . . . . . . . . . . . . . . . . . . . . . . . . . . . . . . . . . . . . . . . . . . . . . . . . . . . . . . . . . . . . . . . . . . . . . . . . . . . . . . . . . . . . . . . . . . . . . . . . . . . . . . . . . . . 19
5 Antimicrobial resistance in Europe . . . . . . . . . . . . . . . . . . . . . . . . . . . . . . . . . . . . . . . . . . . . . . . . . . . . . . . . . . . . . . . . . . . . . . . . . . . . . . . . . . . . . . . . . . . . . . . . . . . . . . . . 21
5.1 Streptococcus pneumoniae . . . . . . . . . . . . . . . . . . . . . . . . . . . . . . . . . . . . . . . . . . . . . . . . . . . . . . . . . . . . . . . . . . . . . . . . . . . . . . . . . . . . . . . . . . . . . . . . . . . . . . . . . . . . . . . . . . . . . . . . . . . 21
5.2 Staphylococcus aureus . . . . . . . . . . . . . . . . . . . . . . . . . . . . . . . . . . . . . . . . . . . . . . . . . . . . . . . . . . . . . . . . . . . . . . . . . . . . . . . . . . . . . . . . . . . . . . . . . . . . . . . . . . . . . . . . . . . . . . . . . . . . . . . . .30
5.3 Enterococci . . . . . . . . . . . . . . . . . . . . . . . . . . . . . . . . . . . . . . . . . . . . . . . . . . . . . . . . . . . . . . . . . . . . . . . . . . . . . . . . . . . . . . . . . . . . . . . . . . . . . . . . . . . . . . . . . . . . . . . . . . . . . . . . . . . . . . . . . . . . . . . . . 33
5.4 Escherichia coli . . . . . . . . . . . . . . . . . . . . . . . . . . . . . . . . . . . . . . . . . . . . . . . . . . . . . . . . . . . . . . . . . . . . . . . . . . . . . . . . . . . . . . . . . . . . . . . . . . . . . . . . . . . . . . . . . . . . . . . . . . . . . . . . . . . . . . . . . . .38
5.5 Klebsiella pneumoniae . . . . . . . . . . . . . . . . . . . . . . . . . . . . . . . . . . . . . . . . . . . . . . . . . . . . . . . . . . . . . . . . . . . . . . . . . . . . . . . . . . . . . . . . . . . . . . . . . . . . . . . . . . . . . . . . . . . . . . . . . . . . . . . . .48
5.6 Pseudomonas aeruginosa . . . . . . . . . . . . . . . . . . . . . . . . . . . . . . . . . . . . . . . . . . . . . . . . . . . . . . . . . . . . . . . . . . . . . . . . . . . . . . . . . . . . . . . . . . . . . . . . . . . . . . . . . . . . . . . . . . . . . . . . . . . . 59
Annex 1: Technical notes . . . . . . . . . . . . . . . . . . . . . . . . . . . . . . . . . . . . . . . . . . . . . . . . . . . . . . . . . . . . . . . . . . . . . . . . . . . . . . . . . . . . . . . . . . . . . . . . . . . . . . . . . . . . . . . . . . . . . . . . . . . . . 73
Annex 2: Country summary sheets . . . . . . . . . . . . . . . . . . . . . . . . . . . . . . . . . . . . . . . . . . . . . . . . . . . . . . . . . . . . . . . . . . . . . . . . . . . . . . . . . . . . . . . . . . . . . . . . . . . . . . . . . . . 77

iv
SURVEILLANCE REPORTAntimicrobial resistance surveillance in Europe 2010
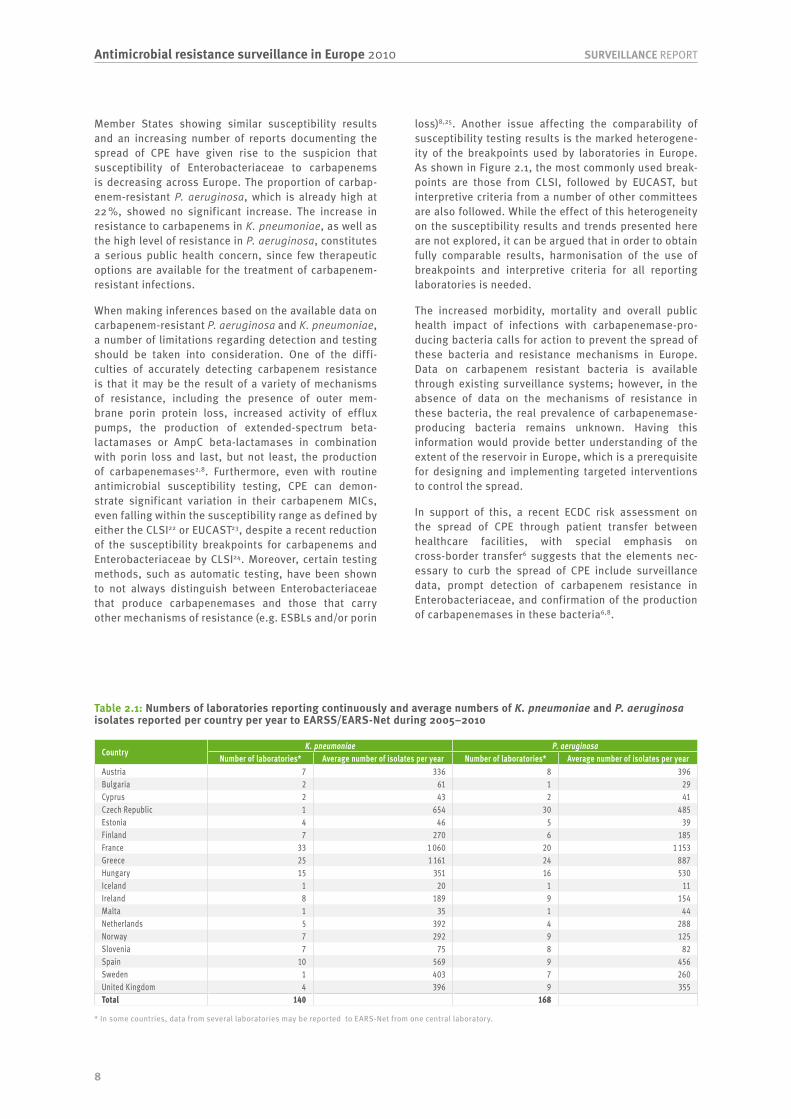
List of tables2.1: Numbers of laboratories reporting continuously and average numbers of K. pneumoniae and P. aeruginosa isolates reported per country per year to EARSS/EARS-Net during 2005–2010 . . . . . . . . . . . . . . . . . . . . . . . . . . . . . . . . . . . . . . . . . . . . . . . . . . . . . . . . . . . . . . . . . . . . . . . . . . . . . . . . . . . . . . . . . . . . . . . . . . . . . . . . . .83.1: Klebsiella pneumoniae (0243): Minimum inhibitory concentration (MIC) and intended results reported by the reference laboratories and the overall concordance of the participating laboratories . . . . . . . . . . . . . . . . . . . . . . . . . . . . . . . . . . . . . . . . . . . . . . . . . . . . . . . . . . . . . . . . . . . . . . . . . . . . . . . . . . . . . . . . . . . . . . . . . 133.2: Escherichia coli (0244): Minimum inhibitory concentration (MIC) and intended results reported by the reference laboratories and the overall concordance of the participating laboratories . . . . . . . . . . . . . . . . . . . . . . . . . . . . . . . . . . . . . . . . . . . . . . . . . . . . . . . . . . . . . . . . . . . . . . . . . . . . . . . . . . . . . . . . . . . . . . . . . . . . . . . 143.3: Streptococcus pneumoniae (0245): Minimum inhibitory concentration (MIC) and intended results reported by the reference laboratories and the overall concordance of the participating laboratories . . . . . . . . . . . . . . . . . . . . . . . . . . . . . . . . . . . . . . . . . . . . . . . . . . . . . . . . . . . . . . . . . . . . . . . . . . . . . . . . . . 143.4: Enterococcus faecium (0246): Minimum inhibitory concentration (MIC) and intended results reported by the reference laboratories and the overall concordance of the participating laboratories . . . . . . . . . . . . . . . . . . . . . . . . . . . . . . . . . . . . . . . . . . . . . . . . . . . . . . . . . . . . . . . . . . . . . . . . . . . . . . . . . . . . . . . . . . . . . . . . . 153.5: Pseudomonas aeruginosa (0247): Minimum inhibitory concentration (MIC) and intended results reported by the reference laboratories and the overall concordance of the participating laboratories . . . . . . . . . . . . . . . . . . . . . . . . . . . . . . . . . . . . . . . . . . . . . . . . . . . . . . . . . . . . . . . . . . . . . . . . . . . . . . . . . . 153.6: Staphylococcus aureus (0248): Minimum inhibitory concentration (MIC) and intended results reported by the reference laboratories and the overall concordance of the participating laboratories . . . . . . . . . . . . . . . . . . . . . . . . . . . . . . . . . . . . . . . . . . . . . . . . . . . . . . . . . . . . . . . . . . . . . . . . . . . . . . . . . . 164.1: Hospital denominator data for 2010 . . . . . . . . . . . . . . . . . . . . . . . . . . . . . . . . . . . . . . . . . . . . . . . . . . . . . . . . . . . . . . . . . . . . . . . . . . . . . . . . . . . . . . . . . . . . . . . . . . . . . . . . . . . . . . . . . . . . . . . . . . . 174.2: Hospital characteristics for 2010 . . . . . . . . . . . . . . . . . . . . . . . . . . . . . . . . . . . . . . . . . . . . . . . . . . . . . . . . . . . . . . . . . . . . . . . . . . . . . . . . . . . . . . . . . . . . . . . . . . . . . . . . . . . . . . . . . . . . . . . . . . . . . .204.3: Laboratory denominator information for 2010 . . . . . . . . . . . . . . . . . . . . . . . . . . . . . . . . . . . . . . . . . . . . . . . . . . . . . . . . . . . . . . . . . . . . . . . . . . . . . . . . . . . . . . . . . . . . . . . . . . . . . . . . . . . . . . .205.1: Number and proportion of invasive S. pneumoniae isolates penicillin-non-susceptible (PNSP), penicillin-resistant (PRSP), macrolide-non-susceptible (MNSP), single penicillin (PEN), single macrolides (MACR) and non-susceptible to penicillin and macrolides isolates, including 95 % confidence intervals (95 % CI), reported per country in 2010 . . . . . . . . . . . . . . . . . . . . . . . . . . . . . . . . . . . . . . . . . . . . . . . . . . . . . . . . . . . . . . . . . . . . . 235.2: Distribution of single penicillin, single macrolides and non-susceptibility to penicillin and macrolides, among the most common serogroups reported per country in 2010 . . . . . . . . . . . . . . . . . . . . . . . . . . . . . . . . . . . . . . . . . . . . . . . . . . . . . . . . . . . . . . . . . . . . . . . . . . . . . . . . . . . . . . . . . . . . . . . . . . . . . . . . . . . . . . . . . . . . . . . . . 255.3: Number and proportion of invasive S. aureus isolates resistant to meticillin (MRSA) and rifampin (RIF), including 95 % confidence intervals (95 % CI), reported per country in 2010 . . . . . . . . . . . . . . . . . . . . . . . . . . . . . . . . . . . . . . . . . . . . . . . . . . . . . . . . . . . . . . . . . . . . . . . . . . . . . . . . . . . . . . . . . . . . . . . . . . . . . . . . . . . . . . . . . 315.4: Number of invasive E. faecalis and E. faecium isolates and proportion of high-level aminoglycoside-resistant E. faecalis and vancomycin-resistant E. faecium (%R), including 95 % confidence intervals (95 % CI), reported per country in 2010 . . . . . . . . . . . . . . . . . . . . . . . . . . . . . . . . .365.5: Number and proportion of invasive E. coli isolates resistant to aminopenicillins, third-generation cephalosporins, fluoroquinolo-nes and aminoglycosides, and multiresistant (%R), including 95 % confidence intervals (95 % CI), reported per country in 2010 . . . . . . . . . . . . . . . . . .385.6: Number of invasive E. coli isolates resistant to third-generation cephalosporins (CREC) and proportion of ESBL-positive (% ESBL) among these isolates, as ascertained by the participating laboratories in 2010 . . . . . . . . . . . . . . . . . . . . . . . . . . . . . . . . . . . . . . . . . . . . . . . . . . . . . . . . . . . . . . . . . . . . . . . . . . . .395.7: Overall resistance and resistance combinations among invasive E. coli isolates tested against aminopenicillins, fluoroquinolones, third-generation cephalosporins and aminoglycosides (n = 49 847) in Europe, 2010 . . . . . . . . . . . . . . . . . . . . . . . . . . . . . . . . . . . . . . . . . . . . . . . . . . . . . . . . . . . . . . . . . . . . . . .425.8: Number and proportion of invasive K. pneumoniae isolates resistant to fluoroquinolones, third-generation cephalosporins, aminoglycosides and multiresistant (%R), including 95 % confidence intervals (95 % CI), reported per country in 2010 . . . . . . . . . . . . . . . . . . . . . . . . . . . . . 575.8a: Number and proportion of invasive K. pneumoniae isolates resistant to carbapenems and confidence intervals (95% CI) per country in 2010 . . . . . . . . . . . . . . . . . . . . . . . . . . . . . . . . . . . . . . . . . . . . . . . . . . . . . . . . . . . . . . . . . . . . . . . . . . . . . . . . . . . . . . . . . . . . . . . . . . . . . . . . . . . . . . . . . . . . . . . . . . . . . . . . . . . . . . . . . . . . . . . . . . . . . . . . . 575.9: Number of invasive K. pneumoniae isolates resistant to third-generation cephalosporins (CRKP) and proportion ESBL-positive (% ESBL) among these isolates, as ascertained by the participating laboratories in 2010 . . . . . . . . . . . . . . . . . . . . . . . . . . . . . . . . . . . . . . . . . . . . . . . . . . . . . . . . . . . . . . . . 575.10: Overall resistance and resistance combinations among invasive K. pneumoniae isolates tested against fluoroquinolones, third-generation cephalosporins and aminoglycosides (n = 12 665) in Europe, 2010 . . . . . . . . . . . . . . . . . . . . . . . . . . . . . . . . . . . . . . . . . . . . . . . . . . . . . . . . . . . . . . . . . . . . . . . . . . . . . .585.11: Number and proportion of invasive P. aeruginosa isolates resistant to piperacillin±tazobactam, fluoroquinolones, ceftazidime, aminoglycosides, carbapenems and multiresistant (%R), including 95 % confidence intervals (95 % CI), reported per country in 2010 . . . . . . . . . . . 635.12: Overall resistance and resistance combinations among invasive Pseudomonas aeruginosa isolates tested against at least three antibiotic classes among piperacillin±tazobactam, ceftazidime, fluoroquinolones, aminoglycosides and carbapenems (n= 8 485) in Europe, 2010 . . . . . . . . . . . . . . . . . . . . . . . . . . . . . . . . . . . . . . . . . . . . . . . . . . . . . . . . . . . . . . . . . . . . . . . . . . . . . . . . . . . . . . . . . . . . . . . . . . . . . . . . . . . . . . . . . . . . . . . . . . . . . . . . . . . . . . . . . . . . . . . . . . . . . . . . . . . 70
List of figures1.1: Organisation of EARS-Net . . . . . . . . . . . . . . . . . . . . . . . . . . . . . . . . . . . . . . . . . . . . . . . . . . . . . . . . . . . . . . . . . . . . . . . . . . . . . . . . . . . . . . . . . . . . . . . . . . . . . . . . . . . . . . . . . . . . . . . . . . . . . . . . . . . . . . . . .22.1: Percentage of EARS-Net participating laboratories employing interpretive criteria from various breakpoint committees for antimicrobial susceptibility testing in 2010. Only data for laboratories returning EQA data for K. pneumoniae and P. aeruginosa are included . . . . .62.2: Klebsiella pneumoniae: Percentage of invasive isolates resistant to carbapenems reported to EARSS/EARS-Net by year, 2005–2010 (18 countries;140 laboratories) . . . . . . . . . . . . . . . . . . . . . . . . . . . . . . . . . . . . . . . . . . . . . . . . . . . . . . . . . . . . . . . . . . . . . . . . . . . . . . . . . . . . . . . . . . . . . . . . . . . . . . . . . . . . . . . . . . . . . . . . . .62.3: Pseudomonas aeruginosa: Percentage of invasive isolates resistant to carbapenems reported to EARSS/EARS-Net by year, 2005–2010 (18 countries;168 laboratories). . . . . . . . . . . . . . . . . . . . . . . . . . . . . . . . . . . . . . . . . . . . . . . . . . . . . . . . . . . . . . . . . . . . . . . . . . . . . . . . . . . . . . . . . . . . . . . . . . . . . . . . . . . . . . . . . . . . . . . . . .73.1: Number of participating laboratories returning reports, per country, 2010 . . . . . . . . . . . . . . . . . . . . . . . . . . . . . . . . . . . . . . . . . . . . . . . . . . . . . . . . . . . . . . . . . . . . . . . . . . . . . .11

v
Antimicrobial resistance surveillance in Europe 2010SURVEILLANCE REPORT
3.2: Adherence to guidelines: number of laboratories per country, 2010 . . . . . . . . . . . . . . . . . . . . . . . . . . . . . . . . . . . . . . . . . . . . . . . . . . . . . . . . . . . . . . . . . . . . . . . . . . . . . . . . . . . . . 124.1: Number of hospitals (A) and laboratories (B) reporting AMR and/or denominator data in 2010 . . . . . . . . . . . . . . . . . . . . . . . . . . . . . . . . . . . . . . . . . . . . . . . . . . . . . 184.2: Proportion of small, medium and large hospitals per country, based on the number of beds, for all hospital reporting both antimicrobial resistance data and denominator data in 2010 . . . . . . . . . . . . . . . . . . . . . . . . . . . . . . . . . . . . . . . . . . . . . . . . . . . . . . . . . . . . . . . . . . . . . . . . . . . . . . . . . . . . . . . . . . . . . . . . . . . 195.1: Streptococcus pneumoniae: proportion of invasive isolates non-susceptible to penicillin (PNSP) in 2010 . . . . . . . . . . . . . . . . . . . . . . . . . . . . . . . . . . . . . . . . .225.2: Streptococcus pneumoniae: proportion of invasive isolates non-susceptible to macrolides in 2010 . . . . . . . . . . . . . . . . . . . . . . . . . . . . . . . . . . . . . . . . . . . . . . . .245.3: Streptococcus pneumoniae: proportion of invasive isolates with non-susceptibility to penicillin and macrolides in 2010 . . . . . . . . . . . . . . . . . . . . . . 255.4: Streptococcus pneumoniae: trends of non-susceptibility to penicillin by country, 2007–2010 . . . . . . . . . . . . . . . . . . . . . . . . . . . . . . . . . . . . . . . . . . . . . . . . . . . . . .265.5: Streptococcus pneumoniae: trends of non-susceptibility to macrolides by country, 2007–2010 . . . . . . . . . . . . . . . . . . . . . . . . . . . . . . . . . . . . . . . . . . . . . . . . . . . . 275.6: Streptococcus pneumoniae: trends of non-susceptibility to penicillin and macrolides by country, 2007–2010 . . . . . . . . . . . . . . . . . . . . . . . . . . . . . . . . . . .285.7: Distribution of serogroups and the resistance profile of S. pneumoniae isolates per serogroup in 2010 . . . . . . . . . . . . . . . . . . . . . . . . . . . . . . . . . . . . . . . . . .295.8: Staphylococcus aureus: proportion of invasive isolates resistant to meticillin (MRSA) in 2010 . . . . . . . . . . . . . . . . . . . . . . . . . . . . . . . . . . . . . . . . . . . . . . . . . . . . . . 315.9: Staphylococcus aureus: trend of resistance to meticillin (MRSA) by country, 2007–2010 . . . . . . . . . . . . . . . . . . . . . . . . . . . . . . . . . . . . . . . . . . . . . . . . . . . . . . . . . . . . . 325.10: Enterococcus faecalis: proportion of invasive isolates with high-level resistance to aminoglycosides in 2010 . . . . . . . . . . . . . . . . . . . . . . . . . . . . . . . . . . . . . . .345.11: Enterococcus faecalis: trends of high-level resistance to aminoglycosides by country, 2007–2010 . . . . . . . . . . . . . . . . . . . . . . . . . . . . . . . . . . . . . . . . . . . . . . . . 355.12: Enterococcus faecium: proportion of invasive isolates resistant to vancomycin in 2010 . . . . . . . . . . . . . . . . . . . . . . . . . . . . . . . . . . . . . . . . . . . . . . . . . . . . . . . . . . . . .365.13: Enterococcus faecium: trends of resistance to vancomycin by country 2007–2010 . . . . . . . . . . . . . . . . . . . . . . . . . . . . . . . . . . . . . . . . . . . . . . . . . . . . . . . . . . . . . . . . . . 375.14: Escherichia coli: proportion of invasive isolates with resistance to third-generation cephalosporins in 2010 . . . . . . . . . . . . . . . . . . . . . . . . . . . . . . . . . . .395.15: Escherichia coli: proportion of invasive isolates with resistance to fluoroquinolones in 2010 . . . . . . . . . . . . . . . . . . . . . . . . . . . . . . . . . . . . . . . . . . . . . . . . . . . . . .405.16: Escherichia coli: proportion of invasive isolates with resistance to aminoglycosides in 2010 . . . . . . . . . . . . . . . . . . . . . . . . . . . . . . . . . . . . . . . . . . . . . . . . . . . . . . 415.17: Escherichia coli: trends of resistance to aminopenicillin by country, 2007–2010 . . . . . . . . . . . . . . . . . . . . . . . . . . . . . . . . . . . . . . . . . . . . . . . . . . . . . . . . . . . . . . . . . . . . . 435.18: Escherichia coli: trends of resistance to third-generation cephalosporins by country, 2007–2010 . . . . . . . . . . . . . . . . . . . . . . . . . . . . . . . . . . . . . . . . . . . . . . . .445.19: Escherichia coli: trends of resistance to fluoroquinolones by country, 2007–2010 . . . . . . . . . . . . . . . . . . . . . . . . . . . . . . . . . . . . . . . . . . . . . . . . . . . . . . . . . . . . . . . . . . 455.20: Escherichia coli: trends of resistance to aminoglycosides by country, 2007–2010 . . . . . . . . . . . . . . . . . . . . . . . . . . . . . . . . . . . . . . . . . . . . . . . . . . . . . . . . . . . . . . . . . . .465.21: Escherichia coli: trends of combined resistance (resistant to fluoroquinolones, third-generation cephalosporins and aminoglycosides) by country, 2007–2010 . . . . . . . . . . . . . . . . . . . . . . . . . . . . . . . . . . . . . . . . . . . . . . . . . . . . . . . . . . . . . . . . . . . . . . . . . . . . . . . . . . . . . . . . . . . . . . . . . . . . . . . . . . . . . . . . . . . . . . . . . . 475.22: Klebsiella pneumoniae: proportion of invasive isolates resistant to third-generation cephalosporins in 2010 . . . . . . . . . . . . . . . . . . . . . . . . . . . . . . . . . . . . . .485.23: Klebsiella pneumoniae: proportion of invasive isolates resistant to fluoroquinolones in 2010 . . . . . . . . . . . . . . . . . . . . . . . . . . . . . . . . . . . . . . . . . . . . . . . . . . . .495.24: Klebsiella pneumoniae: proportion of invasive isolates resistant to aminoglycosides in 2010 . . . . . . . . . . . . . . . . . . . . . . . . . . . . . . . . . . . . . . . . . . . . . . . . . . . . . 505.25: Klebsiella pneumoniae: proportion of invasive isolates resistant to carbapenems in 2010 . . . . . . . . . . . . . . . . . . . . . . . . . . . . . . . . . . . . . . . . . . . . . . . . . . . . . . . . . 515.26: Klebsiella pneumoniae: trends of resistance to third-generation cephalosporins by country, 2007–2010. . . . . . . . . . . . . . . . . . . . . . . . . . . . . . . . . . . . . . . 525.27: Klebsiella pneumoniae: trends of resistance to fluoroquinolones by country, 2007–2010 . . . . . . . . . . . . . . . . . . . . . . . . . . . . . . . . . . . . . . . . . . . . . . . . . . . . . . . . . . 535.28: Klebsiella pneumoniae: trends of resistance to aminoglycosides by country, 2007–2010 . . . . . . . . . . . . . . . . . . . . . . . . . . . . . . . . . . . . . . . . . . . . . . . . . . . . . . . . . . 545.29: Klebsiella pneumoniae: trends of resistance to carbapenems by country, 2007–2010 . . . . . . . . . . . . . . . . . . . . . . . . . . . . . . . . . . . . . . . . . . . . . . . . . . . . . . . . . . . . . . 555.30: Klebsiella pneumoniae: trend of multiresistance (third-generation cephalosporins, fluoroquinolones and aminoglycosides) by country, 2007–2010 . . . . . . . . . . . . . . . . . . . . . . . . . . . . . . . . . . . . . . . . . . . . . . . . . . . . . . . . . . . . . . . . . . . . . . . . . . . . . . . . . . . . . . . . . . . . . . . . . . . . . . . . . . . . . . . . . . . . . . . . . . . . . . . . . . . . . . . . . . . . . . . . . . . 565.31: Pseudomonas aeruginosa: proportion of invasive isolates resistant to piperacillin±tazobactam in 2010. . . . . . . . . . . . . . . . . . . . . . . . . . . . . . . . . . . . . . . . . 595.32: Pseudomonas aeruginosa: proportion of invasive isolates resistant to ceftazidime in 2010 . . . . . . . . . . . . . . . . . . . . . . . . . . . . . . . . . . . . . . . . . . . . . . . . . . . . . . .605.33: Pseudomonas aeruginosa: proportion of invasive isolates resistant to fluoroquinolones in 2010 . . . . . . . . . . . . . . . . . . . . . . . . . . . . . . . . . . . . . . . . . . . . . . . . . 615.34: Pseudomonas aeruginosa: proportion of invasive isolates resistant to aminoglycosides in 2010 . . . . . . . . . . . . . . . . . . . . . . . . . . . . . . . . . . . . . . . . . . . . . . . . .625.35: Pseudomonas aeruginosa: proportion of invasive isolates resistant to carbapenems in 2010 . . . . . . . . . . . . . . . . . . . . . . . . . . . . . . . . . . . . . . . . . . . . . . . . . . . . . 635.36: Pseudomonas aeruginosa: trend of resistance to piperacillin±tazobactam by country, 2007–2010 . . . . . . . . . . . . . . . . . . . . . . . . . . . . . . . . . . . . . . . . . . . . . .645.37: Pseudomonas aeruginosa: trend of resistance to ceftazidime by country, 2007–2010 . . . . . . . . . . . . . . . . . . . . . . . . . . . . . . . . . . . . . . . . . . . . . . . . . . . . . . . . . . . . . . 655.38: Pseudomonas aeruginosa: trend of resistance to fluoroquinolones by country, 2007–2010. . . . . . . . . . . . . . . . . . . . . . . . . . . . . . . . . . . . . . . . . . . . . . . . . . . . . . . .665.39: Pseudomonas aeruginosa: trend of resistance to aminoglycosides by country, 2007–2010 . . . . . . . . . . . . . . . . . . . . . . . . . . . . . . . . . . . . . . . . . . . . . . . . . . . . . . . . 675.40: Pseudomonas aeruginosa: trend of resistance to carbapenems by country, 2007–2010 . . . . . . . . . . . . . . . . . . . . . . . . . . . . . . . . . . . . . . . . . . . . . . . . . . . . . . . . . . . .685.41: Pseudomonas aeruginosa: trend of combined resistance (R to three or more antimicrobial classes among piperacillin±tazobactam, ceftazidime, fluoroquinolones, aminoglycosides and carbapenems) by country, 2007–2010 . . . . . . . . . . . . . . . . . . . . . . . . . . . . . .69


vii
Antimicrobial resistance surveillance in Europe 2010SURVEILLANCE REPORT
AMR Antimicrobial resistance
AmpC Ampicillinase C
AST Antimicrobial susceptibility testing
BSAC British Society for Antimicrobial Chemotherapy
BSI Bloodstream infections
CC Clonal complex
CLSI Clinical and Laboratory Standards Institute
CMY Cephamycinase
CNSE Carbapenem-non-susceptible Enterobacteriaceae
CPE Carbapenemase-producing Enterobacteriaceae
CREC Third-generation cephalosporin-resistant Escherichia coli
CRG Commissie Richtlijnen Gevoeligheidsbepalingen (Dutch)
CRKP Third-generation cephalosporin-resistant Klebsiella pneumoniae
CSF Cerebrospinal fluid
DIN Deutsche Industrie Norm (German)
DNA Deoxyribonucleic acid
EARSS European Antimicrobial Resistance Surveillance System
EARS-Net European Antimicrobial Resistance Surveillance Network
ECDC European Centre for Disease Prevention and Control
EU European Union
EQA External quality assessment
ESAC European Surveillance of Antimicrobial Consumption
ESBL Extended-spectrum beta-lactamase
ESCMID European Society of Clinical Microbiology and Infectious Diseases
ESGARS ESCMID Study Group for Antimicrobial Resistance Surveillance
EUCAST European Committee on Antimicrobial Susceptibility Testing
FREC Fluoroquinolone-resistant Escherichia coli
ICU Intensive care unit
IMP Imipenemase
KPC Klebsiella pneumoniae carbapenemase
MIC Minimum inhibitory concentration
MLS Macrolide, lincosamide and streptogramin
MNSP Macrolide non-susceptible Streptococcus pneumoniae
MRSA Meticillin-resistant Staphylococcus aureus
NDM New Delhi metallo-beta-lactamase
NRL National reference laboratories
NWGA Norwegian Working Group on Antimicrobials
OXA Oxacillinase gene
PBP Penicillin-binding protein
PCV Pneumococcal conjugate vaccine
PNSP Penicillin-non-susceptible Streptococcus pneumoniae
PRSP Penicillin-resistant Streptococcus pneumoniae
RNA Ribonucleic acid
SFM Comité de l’Antibiogramme de la Société Française de Microbiologie (French)
SIR Sensitive, intermediate, resistant
SHV Sulfhydryl-variable extended-spectrum beta-lactamase gene
SRGA Swedish Reference Group for Antibiotics
TESSy The European Surveillance System (at ECDC)
TEM Temoneira extended-spectrum beta-lactamase gene
UK NEQAS United Kingdom National External Quality Assessment Scheme for Microbiology
VISA Vancomycin-intermediate Staphylococcus aureus
VIM Verona integron-encoded metallo-beta-lactamase
VRE Vancomycin-resistant enterococci
WHO World Health Organization
WHONET WHO microbiology laboratory database software
Abbreviations and acronyms

viii
SURVEILLANCE REPORTAntimicrobial resistance surveillance in Europe 2010
Countries participating in EARS-Net 2010
Participating countriesNon participating countries
AT
BE
BG
CY
CZ
DE
DK
EE
ES
FI
FR
EL
HU
IE
IS
IT
LT
LU
LV
MT
NL
NO
PL
PT
RO
SE
SI
UK
AT AustriaBE BelgiumBG BulgariaCY CyprusCZ Czech RepublicDE GermanyDK DenmarkEE EstoniaEL GreeceES Spain
FI FinlandFR FranceHU HungaryIE IrelandIS IcelandIT ItalyLT LithuaniaLU LuxembourgLV LatviaMT Malta
NL NetherlandsNO NorwayPL PolandPT PortugalRO RomaniaSE SwedenSI SloveniaUK United Kingdom
As of 1 January 2010, only EU and EEA Member States can report data to EARS-Net. Antimicrobial resistance surveillance data from five countries previously participating in EARSS (Bosnia-Herzegovina, Croatia, Israel, Switzerland and Turkey) are therefore not included in this report.
ix
Antimicrobial resistance surveillance in Europe 2010SURVEILLANCE REPORT
AustriaFederal Ministry of HealthMedical University ViennaElisabethinen Hospital, Linz www.elisabethinen.or.at
BelgiumScientific Institute of Public Healthwww.iph.fgov.be
University of Antwerp
BulgariaAlexander University Hospital, SofiaNational Center of Infectious and Parasitic Diseases
CyprusNicosia General Hospital
Czech RepublicNational Institute of Public Healthwww.szu.cz
National Reference Laboratory for Antibiotics
DenmarkStatens Serum Institut, Danish Study Group for Antimicrobial Resistance Surveillance (DANRES)www.danmap.org
EstoniaHealth BoardEast-Tallinn Central HospitalTartu University Hospital
FinlandNational Institute for Health and Welfare, Finnish Hospital Infection Program (SIRO)www.thl.fi/siro
Finnish Study Group for Antimicrobial Resistance (FiRe)www.finres.fi
FrancePitié-Salpêtrière HospitalNational Institute for Public Health Surveillancewww.invs.sante.fr
French National Observatory for the Epidemiology of Bacterial Resistance to Antimicrobials (ONERBA): Azay-Résistance, Île-de-France and Réussir networkswww.onerba.org
National Reference Centre for Pneumococci (CNRP)
GermanyRobert Koch Institutewww.rki.de
GreeceHellenic Pasteur InstituteNational School of Public HealthNational and Kapodistrian University of Athens, Medical School www.mednet.gr/whonet
HungaryNational Centre for Epidemiologywww.antsz.hu
IrelandHealth Protection Surveillance Centre (HPSC)www.hpsc.ie
IcelandNational University Hospital of Iceland Centre for Health Security and Infectious Disease Control
ItalyNational Institute of Public Healthwww.simi.iss.it/antibiotico_resistenza.htm
LatviaPaul Stradins Clinical University HospitalState Agency ‘Infectology Centre of Latvia’
LithuaniaNational Public Health Surveillance LaboratoryInstitute of Hygiene
LuxembourgNational Health LaboratoryMicrobiology Laboratory, Luxembourg’s Hospital Centre
MaltaMater Dei Hospital, B’Kara
NetherlandsNational Institute for Public Health and the Environment
NorwayUniversity Hospital of North NorwayNorwegian Institute of Public HealthSt. Olav University Hospital, Trondheim
PolandNational Medicines InstituteNational Reference Centre for Antimicrobial Resistance and Surveillance
National institutions/organisations participating in EARS-Net
x
SURVEILLANCE REPORTAntimicrobial resistance surveillance in Europe 2010
PortugalNational Institute of Health Dr. Ricardo Jorge www.insarj.pt
Ministry of HealthDirectorate-General of Health
RomaniaNational Institute of Research and Development for Microbiology and Immunology ‘Cantacuzino’Institute of Public Health
SloveniaNational Institute of Public HealthUniversity of Ljubljana
SpainHealth Institute Carlos lll www.isciii.es
National Centre of Microbiology
SwedenSwedish Institute for Communicable Disease Controlwww.smi.se
United KingdomHealth Protection Agencywww.hpa.org.uk
Health Protection ScotlandPublic Health Agency Northern Ireland

1
Antimicrobial resistance surveillance in Europe 2010SURVEILLANCE REPORT
This report is based on antimicrobial resistance data reported to EARS-Net by 28 countries in 2010 and trend analyses including EARSS data from previous years. The data show that the Europe-wide increase of antimicro-bial resistance observed in Escherichia coli during recent years is continuing unimpeded. The highest resistance proportions in E. coli were reported for aminopenicil-lins ranging up to 83 %. Despite the already high level of resistance the increase continues even in countries presenting resistance well above 50 %. The percentage of third-generation cephalosporin resistance reported among E. coli isolates has increased significantly over the last four years in half of the reporting countries, while a decreasing trend was observed in only one country. This resistance is directly linked to the high proportions (65–100 %) of ESBL-positives among cepha-losporin-resistant E. coli isolates reported in 2010.
A high frequency of multi-drug resistant Klebsiella pneu-moniae was observed in southern, central and eastern Europe. In half of the reporting countries, the propor-tion of multiresistant K. pneumoniae isolates (combined resistance to third-generation cephalosporins, fluoro-quinolones and aminoglycosides) was above 10 % and five countries show an increasing trend of carbapenem-resistant K. pneumoniae. Carbapenems have been widely used in many countries due to the increasing rate of extended-spectrum beta-lactamase (ESBL) produc-ing Enterobacteriaceae with a consequent impact on the emergence of carbapenemase production (VIM, KPC and NDM-1).
Other trends in the occurrence of resistance reported to EARS-Net bring hope that national efforts on infection control and efforts targeted at containment of resistance may in some cases bring the development of resistance to a halt, or even reverse undesirable resistance trends, as exemplified by the development for meticillin-resist-ant Staphylococcus aureus (MRSA). Even though the proportion of MRSA among S. aureus is still above 25 % in eight out of 28 countries, the occurrence of MRSA is stabilising or decreasing in some countries and a sus-tained decrease has been observed in Austria, Cyprus, Estonia, France, Greece, Ireland and the UK.
Furthermore, the United Kingdom has shown a consist-ent reduction of resistant proportions in K. pneumoniae for all antimicrobial classes under surveillance, and in a few countries (Germany, Greece, Italy and the UK) the efforts to control glycopeptide resistance in Enterococcus faecium seem to be successful and result-ing in a continuous decrease of proportions of resistant isolates. Meanwhile, high-level aminoglycoside resist-ance in Enterococcus faecalis is stabilising in Europe at a level of 25–50 %.
For Streptococcus pneumoniae, non-susceptibility to penicillin remains generally stable in Europe and non-susceptibility to macrolides has declined in five countries while an increasing trend was observed in only one country. For Pseudomonas aeruginosa, high propor-tions of resistance to fluoroquinolones, carbapenems and combined resistance have been reported by many countries, especially in southern and eastern Europe.
For several antimicrobial and pathogen combinations, e.g. fluoroquinolone resistance in E. coli, K. pneumo-niae, P. aeruginosa and for MRSA, a north to south gradient is evident in Europe. In general, lower resist-ance proportions are reported in the north and higher proportions in the south of Europe. This is likely to be a reflection of differences in infection control practices, presence or absence of legislation regarding prescrip-tion of antimicrobial drugs. However, for K. pneumoniae, increasing trends of resistance to specific antimicrobial classes and of multiresistance have also been observed in northern European countries, like Denmark and Norway, which traditionally have a prudent approach to antimicrobial use.
In addition to the regular trend analysis and situation overview, this 2010 EARS-Net report contains a focus chapter providing in-depth analysis for carbapenem-resistant K. pneumoniae and P. aeruginosa. Results from susceptibility testing to carbapenems for these two pathogens reported since 2005, reveal a sig-nificant decrease of susceptibility to carbapenems in invasive K. pneumoniae over the period 2005–2010. Carbapenems are some of the few effective antimicro-bials for the treatment of infections caused by bacteria that produce extended-spectrum beta-lactamases and thus resistance to carbapenems leaves very few thera-peutic options available.
Based on EARS-Net data, the antimicrobial resistance situation in Europe displays large variation depending on pathogen type, antimicrobial substance and geo-graphical region. Besides evidence of stabilisation of the situation for some pathogens (e.g. MRSA) in a number of countries, the data show the unimpeded decline of antimicrobial susceptibility in other major pathogens (e.g. E. coli) and the alarming emergence of carbapenem resistance in K. pneumonia, leading to an unfortunate loss of antimicrobial treatment options.
Summary

2
SURVEILLANCE REPORTAntimicrobial resistance surveillance in Europe 2010
Figure 1.1: Organisation of EARS-Net
National Laboratories
National Epidemiological Contact PointsDisease Experts Data Managers
European Antimicrobial Resistance Surveillance Network (EARS-Net)
at
European Centre for Disease Prevention and Control (ECDC)
National Advisory Board
EARS-Net Coordination Group
EUCAST
ESCMID
ESAC-Net
HAI-Net
WHO
3
Antimicrobial resistance surveillance in Europe 2010SURVEILLANCE REPORT
This is the second Annual Report of the European Antimicrobial Resistance Surveillance Network (EARS-Net) published by European Centre of Disease Prevention and Control (ECDC). The report represents the continua-tion of a series of highly valued EARSS Annual Reports published by the network since 2001. The results pre-sented in this report are based on data submitted from over 900 laboratories serving more than 1400 hospitals in 26 EU Member States, Norway and Iceland.
Surveillance of antimicrobial resistance within the EU is carried out in agreement with Decision No 2119/98/EC of the European Parliament and of the Council of 24 September 1998 and Regulation (EC) No 851/2004 of the European Parliament and of the Council of 21 April 2004 establishing a European Centre for Disease Prevention and Control.
The antimicrobial resistance surveillance data col-lected previously by EARSS and currently by EARS-Net, play an important role in documenting the occurrence and spread of antimicrobial resistance in Europe, and contribute to raising awareness of the problem at the political level, among public health officials, in the sci-entific community and in the general public.
In the present report, results referring to 2010 and trend analyses including data from previous years are pre-sented and discussed in Chapter 5. This year’s focus chapter (Chapter 2) is on carbapenem-resistant K. pneu-moniae and P. aeruginosa. Country-specific information is provided in Annex 2.
About EARS-NetThe European Antimicrobial Resistance Surveillance Network (EARS-Net) is a European-wide network of national surveillance systems, providing European refer-ence data on the occurrence of antimicrobial resistance. EARS-Net is the largest publicly funded surveillance sys-tem for antimicrobial resistance in Europe.
The management and coordination of EARS-Net was transferred from the Dutch National Institute for Public Health and the Environment (RIVM) to the European Centre for Disease Prevention and Control in January
2010. At ECDC, the management and coordination of EARS-Net is carried out by the Surveillance Section in collaboration with the Disease Programme for Antimicrobial Resistance and Healthcare-associated Infections.
Scientific guidance and support to the coordination of the network is provided by the EARS-Net Coordination Group (see Figure 1.1), composed of experts selected from among the nominated disease-specific contact points and experts from other organisations involved in surveillance of antimicrobial resistance. EARS-Net activities are coordinated in close collaboration with two other major surveillance networks: the European Surveillance of Antimicrobial Consumption Network (ESAC-Net) and the Healthcare-associated Infections Surveillance Network (HAI-Net). EARS-Net collaborates with the European Society of Clinical Microbiology and Infectious Diseases (ESCMID), in particular with the society’s subcommittee, the European Committee on Antimicrobial Susceptibility Testing (EUCAST).
Data for EARS-Net are provided by a network of national surveillance systems in the participating countries. The national surveillance systems collect data from clinical laboratories on antimicrobial susceptibility of seven bac-terial pathogens of public health importance in humans: Streptococcus pneumoniae, Staphylococcus aureus, Escherichia coli, Enterococcus faecalis, Enterococcus faecium, Klebsiella pneumoniae and Pseudomonas aeruginosa. The majority of countries participating in EARS-Net even collect and report denominator data on laboratory/hospital activity and patient characteristics.
The data from national surveillance systems are uploaded by national data managers to a central data-base at ECDC (The European Surveillance System, ‘TESSy’). After uploading, each country approves its own data and the results are made available from the ECDC website. EARS-Net maintains an interactive database at the ECDC websitei and publishes annual reports on the occurrence of antimicrobial resistance in Europe.
i http://ecdc.europa.eu/en/activities/surveillance/EARS-Net/Pages/index.aspx
1 Introduction


5
Antimicrobial resistance surveillance in Europe 2010SURVEILLANCE REPORT
2.1 IntroductionThe increase of carbapenem resistance in Gram-negative bacteria has become an exceedingly important clinical and public health issue in recent years. Carbapenems are some of the few effective antimicrobials for the treatment of infections caused by bacteria that pro-duce extended-spectrum beta-lactamases and so resistance to carbapenems leaves very few therapeu-tic options1. Although carbapenem resistance in both Klebsiella pneumoniae and Pseudomonas aeruginosa can result through various mechanisms of resistance2, the emergence and spread of carbapenemases, a group of clinically important beta-lactamases, especially in members of Enterobacteriaceae family1–4, has made the surveillance of carbapenem resistance and carbapen-emases in Gram-negative bacteria imperative.
Key points• A significant decrease in susceptibility to carbap-
enems in invasive K. pneumoniae isolates was observed in Europe from 2005 to 2010. During the same period, no significant change in suscepti-bility to carbapenems in invasive P. aeruginosa isolates was observed.
• A marked heterogeneity was observed with regard to the interpretive criteria being used by clinical microbiology laboratories for reporting susceptibility testing results. Harmonised use of breakpoints would substantially increase the comparability of data.
• Carbapenem resistance can result through vari-ous mechanisms, including the production of carbapenemases. Confirming the presence of carbapenemases in Enterobacteriaceae, would allow a closer surveillance of the spread of car-bapenemase-producing Enterobacteriaceae (CPE) in Europe.
Carbapenemase enzymes that can efficiently hydro-lyse most beta-lactams, including carbapenems1,3 have emerged and spread among all members of the Enterobacteriaceae family worldwide4–6. Though the exact prevalence of carbapenemase-producing Enterobacteriaceae (CPE) in healthcare facilities and in the community in Europe is not known, publications from Member States indicate that CPE are endemic in certain countries in Europe7,8. Although some of the
most widespread types of carbapenemases found in Enterobacteriaceae are K. pneumoniae carbapenemase (KPC) and Verona integron-encoded metallo-beta-lacta-mase (VIM)8–13, other carbapenemases like OXA-489,14 and New Delhi metallo-beta-lactamase (NDM)15,16 have also emerged. Variants of NDM carbapenemase, such as NDM-2, have recently been reported from countries in the north of Africa17.
The emergence and spread of CPE has been identi-fied as a public health threat, especially since recent studies on CPE18,19 and carbapenem-non-susceptible Enterobacteriaceae (CNSE)20,21 have shown that infec-tion or colonisation is associated with higher in-hospital mortality.
Results from testing the susceptibility of K. pneumo-niae and P. aeruginosa to carbapenems have been reported to EARSS/EARS-Net by participating clinical microbiological laboratories since 2005. Susceptibility to carbapenems reported to EARS-Net is based on the results of testing against either imipenem or mero-penem. The choice of which breakpoint committee’s interpretive criteria is used for the interpretation of minimum inhibitory concentrations (MIC) as either sus-ceptible (S), intermediate (I) or resistant (R), is at the discretion of each clinical microbiology laboratory. In general, however, EARS-Net encourages the use of EUCAST breakpoints.
Because of the public health impact of infections caused by CPE, it is important to follow the trends of carbap-enem resistance in Europe. Confirming the presence of carbapenemases in bacteria and understanding the extent of the reservoir in Europe is a prerequisite for tar-geted intervention to control the spread.
Although carbapenem susceptibility results are avail-able from EARS-Net reports, it is important to note that these only provide resistance profiles with no further characterisation of resistance mechanisms. The results may therefore be useful for the surveillance of carbap-enem resistance in Gram-negative bacteria, but may not be useful for following the occurrence of carbap-enemases. Performance of phenotypic and molecular testing for screening and confirmation of the presence of carbapenemases would add a significant and important layer of information to the existing data.
2 Carbapenem-resistant Klebsiella pneumoniae and Pseudomonas aeruginosa Analysis of data from laboratories reporting continuously from 2005 to 2010

6
SURVEILLANCE REPORTAntimicrobial resistance surveillance in Europe 2010
2.2 MethodsResults of testing susceptibility to carbapenems of invasive K. pneumoniae and P. aeruginosa isolates causing blood stream infections (BSI) and infections of cerebrospinal fluid (CSF) were extracted from the EARSS/EARS-Net database for 2005–2010. A trend anal-ysis was performed using the Cochran-Armitage test for trend for both K. pneumoniae and P. aeruginosa.
The following data were also extracted from the EARSS/EARS-Net database with regard to reporting of carbap-enem resistance of K. pneumoniae and P. aeruginosa isolates from 2005 to 2010:
• the number of countries reporting to EARSS/EARS-Net annually for these organisms,
• the number of clinical microbiology laboratories reporting to EARSS/EARS-Net per country per year,
• the number of clinical microbiology laboratories in each country that have reported their results continu-ously during the period (some countries may report through one central laboratory),
• the total number of laboratories using the interpretive criteria of various breakpoint committees as reported by EARS-Net laboratories participating in the 2010 EARS-Net External Quality Assessment (EQA) exercise (see Figure 3.2).
2.3 ResultsNumber of participating countries
Twenty-one countries reported results to EARSS for K. pneumoniae and 22 reported for P. aeruginosa, in 2005; this number had increased to 28 for both organisms by 2010. Eighteen countries reported continuously for the two pathogens throughout the period 2005–2010. Trend
Figure 2.1: Percentage of EARS-Net participating laboratories employing interpretive criteria from various breakpoint committees for antimicrobial susceptibility testing in 2010. Only data for laboratories returning EQA data for K. pneumoniae and P. aeruginosa are included
% la
bs p
artic
patin
g
0
10
20
30
40
50
60
70
80
OtherSRGA SFM NWGA EUCASTDIN CRG CLSICOMB BSAC
Data: UKNEQAS 2010BSAC: British Society of Antimicrobial Chemotherapy; COMB: Combination; CLSI: Clinical Laboratory Standards Institute; CRG: Commissie Richtlijnen Gevoeligheidsbepalingen; DIN: Deutsches Institut für Normung; EUCAST: European Committee for Antimicrobial Susceptibility Testing; NWGA: Norwegian Working Group on Antibiotics; SFM: Société Française de Microbiologie; SRGA: Swedish Reference Group for Antibiotics.
Figure 2.2: Klebsiella pneumoniae: Percentage of carbapenem-resistant invasive isolates reported to EARSS/EARS-Net by year, 2005–2010 (18 countries; 140 laboratories)
Perc
enta
ge
5
10
15
20
201020092008200720062005
Only laboratories that continuously reported susceptibility results for carbapenems during the period 2005–2010 are included in the analysis.

7
Antimicrobial resistance surveillance in Europe 2010SURVEILLANCE REPORT
analyses for 2005–2010 presented in this chapter for both K. pneumoniae and P. aeruginosa are based only on data from the laboratories reporting continuously during the period (Table 2.1).
Participation of clinical microbiology laboratories
There has been an overall increase of 56 % (366 to 570) and 69 % (312 to 526) in the total numbers of clinical microbiology laboratories reporting K. pneumoniae and P. aeruginosa isolates, respectively, from 2005 to 2010.
Number of continuously reporting laboratories
The numbers of laboratories continuously reporting sus-ceptibility results for K. pneumoniae and P. aeruginosa isolates throughout the period 2005–2010, were 140 and 168, respectively. The number of continuously reporting laboratories per country and the average number of iso-lates per year and country can be seen in Table 2.1.
Use of various interpretive criteria by participating laboratories
The distribution of the interpretive criteria used by all laboratories that participated in the EARS-Net EQA in June 2010 is shown in Figure 2.1. Data from this EQA showed that 66 % of participating laboratories used guidelines from the Clinical Laboratory Standards Institute (CLSI) and 14 % used those from the European Committee on Antimicrobial Susceptibility Testing (EUCAST); making the interpretive criteria provided by these the two breakpoint committees the most widely used.
Trends in resistance
Klebsiella pneumoniae
Between 2005 and 2010, a total of 140 laboratories from 18 countries continuously reported results on the sus-ceptibility to carbapenems of invasive K. pneumoniae isolates. During this period, the number of laboratories
reporting continuously per country ranged from one laboratory in the Czech Republic, Iceland, Malta and Sweden, to 33 laboratories in France. Trend analy-sis was performed only on the results from these 140 laboratories.
Results from this analysis show that in Europe the proportion of K. pneumoniae isolates resistant to car-bapenems increased from 8 % to 15 % between 2005 and 2010. This increase was found to be highly significant (p < 0.001) (Figure 2.2) but this is mainly due to a sub-stantial increase in a few countries.
For more detailed trends of carbapenem resistance in K. pneumoniae per country for 2007–2010, please refer to chapter 5, figure 5.29.
Pseudomonas aeruginosa
A total of 168 laboratories from 18 countries continu-ously reported results on susceptibility of invasive P. aeruginosa isolates to carbapenems between 2005 and 2010. The number of laboratories continuously reporting per country, ranged from one each in Bulgaria, Iceland and Malta to 24 in Greece. Trend analysis was performed only on the results from these 168 laboratories.
Results from this analysis show that in Europe the proportion of P. aeruginosa isolates resistant to carbap-enems was 22 % in 2005, increased to 24 % in 2008, and decreased to 22 % in 2010. Trend analysis on these data showed no significant change over the study period (p < 0.49) (Figure 2.3).
For more detailed trends of carbapenem resistance in P. aeruginosa per country for 2007 – 2010, please refer to chapter 5, figure 5.40.
2.4 DiscussionResults from the analyses in this report show that car-bapenem resistance is significantly increasing among K. pneumoniae invasive isolates in Europe. Reports from
Figure 2.3: Pseudomonas aeruginosa: Percentage of carbapenem-resistant invasive isolates reported to EARSS/EARS-Net by year, 2005–2010 (18 countries; 168 laboratories).
Perc
enta
ge
0
5
10
15
20
25
201020092008200720062005
Only laboratories that continuously reported susceptibility results for carbapenems during the period 2005–2010 are included in the analysis.
8
SURVEILLANCE REPORTAntimicrobial resistance surveillance in Europe 2010
Table 2.1: Numbers of laboratories reporting continuously and average numbers of K. pneumoniae and P. aeruginosa isolates reported per country per year to EARSS/EARS-Net during 2005–2010
CountryK. pneumoniae P. aeruginosa
Number of laboratories* Average number of isolates per year Number of laboratories* Average number of isolates per year Austria 7 336 8 396Bulgaria 2 61 1 29Cyprus 2 43 2 41Czech Republic 1 654 30 485Estonia 4 46 5 39Finland 7 270 6 185France 33 1 060 20 1 153Greece 25 1 161 24 887Hungary 15 351 16 530Iceland 1 20 1 11Ireland 8 189 9 154Malta 1 35 1 44Netherlands 5 392 4 288Norway 7 292 9 125Slovenia 7 75 8 82Spain 10 569 9 456Sweden 1 403 7 260United Kingdom 4 396 9 355Total 140 168
* In some countries, data from several laboratories may be reported to EARS-Net from one central laboratory.
Member States showing similar susceptibility results and an increasing number of reports documenting the spread of CPE have given rise to the suspicion that susceptibility of Enterobacteriaceae to carbapenems is decreasing across Europe. The proportion of carbap-enem-resistant P. aeruginosa, which is already high at 22 %, showed no significant increase. The increase in resistance to carbapenems in K. pneumoniae, as well as the high level of resistance in P. aeruginosa, constitutes a serious public health concern, since few therapeutic options are available for the treatment of carbapenem-resistant infections.
When making inferences based on the available data on carbapenem-resistant P. aeruginosa and K. pneumoniae, a number of limitations regarding detection and testing should be taken into consideration. One of the diffi-culties of accurately detecting carbapenem resistance is that it may be the result of a variety of mechanisms of resistance, including the presence of outer mem-brane porin protein loss, increased activity of efflux pumps, the production of extended-spectrum beta-lactamases or AmpC beta-lactamases in combination with porin loss and last, but not least, the production of carbapenemases2,8. Furthermore, even with routine antimicrobial susceptibility testing, CPE can demon-strate significant variation in their carbapenem MICs, even falling within the susceptibility range as defined by either the CLSI22 or EUCAST23, despite a recent reduction of the susceptibility breakpoints for carbapenems and Enterobacteriaceae by CLSI24. Moreover, certain testing methods, such as automatic testing, have been shown to not always distinguish between Enterobacteriaceae that produce carbapenemases and those that carry other mechanisms of resistance (e.g. ESBLs and/or porin
loss)8,25. Another issue affecting the comparability of susceptibility testing results is the marked heterogene-ity of the breakpoints used by laboratories in Europe. As shown in Figure 2.1, the most commonly used break-points are those from CLSI, followed by EUCAST, but interpretive criteria from a number of other committees are also followed. While the effect of this heterogeneity on the susceptibility results and trends presented here are not explored, it can be argued that in order to obtain fully comparable results, harmonisation of the use of breakpoints and interpretive criteria for all reporting laboratories is needed.
The increased morbidity, mortality and overall public health impact of infections with carbapenemase-pro-ducing bacteria calls for action to prevent the spread of these bacteria and resistance mechanisms in Europe. Data on carbapenem resistant bacteria is available through existing surveillance systems; however, in the absence of data on the mechanisms of resistance in these bacteria, the real prevalence of carbapenemase-producing bacteria remains unknown. Having this information would provide better understanding of the extent of the reservoir in Europe, which is a prerequisite for designing and implementing targeted interventions to control the spread.
In support of this, a recent ECDC risk assessment on the spread of CPE through patient transfer between healthcare facilities, with special emphasis on cross-border transfer6 suggests that the elements nec-essary to curb the spread of CPE include surveillance data, prompt detection of carbapenem resistance in Enterobacteriaceae, and confirmation of the production of carbapenemases in these bacteria6,8.
9
Antimicrobial resistance surveillance in Europe 2010SURVEILLANCE REPORT
References1. Paterson DL, Bonomo RA. Extended-spectrum beta-lactamases: a
clinical update. Clin Microbiol Rev. 2005 Oct;18(4):657-86.2. Miriagou V, Cornaglia G, Edelstein M, Galani I, Giske CG,
Gniadkowski M, et al. Acquired carbapenemases in Gram-negative bacterial pathogens: detection and surveillance issues. Clinical Microbiology & Infection. 2010 Feb;16(2):112-22.
3. Queenan AM, Bush K. Carbapenemases: the versatile beta-lactama-ses. Clin Microbiol Rev. 2007 Jul;20(3):440-58, table of contents.
4. Nordmann P, Cuzon G, Naas T. The real threat of Klebsiella pneu-moniae carbapenemase-producing bacteria. Lancet Infect Dis. 2009 Apr;9(4):228-36.
5. Bush K, Jacoby GA. Updated Functional Classification of {beta}-Lactamases. Antimicrob Agents Chemother. 2010 March 1, 2010;54(3):969-76.
6. European Centre for Disease Prevention and Control. Risk assess-ment on the spread of CPE through patient transfer between health-care facilities. Stockholm: ECDC 2011.
7. Vatopoulos A. High rates of metallo-beta-lactamase-producing Klebsiella pneumoniae in Greece--a review of the current evidence. Euro Surveill. 2008 Jan 24;13(4).
8. Grundmann H, Livermore DM, Giske CG, Canton R, Rossolini GM, Campos J, et al. Carbapenem-non-susceptible Enterobacteriaceae in Europe: conclusions from a meeting of national experts. Euro Surveill. 2010 Nov 18;15(46).
9. Poirel L, Ros A, Carrër A, Fortineau N, Carricajo A, Berthelot P, et al. Cross-border transmission of OXA-48-producing Enterobacter cloacae from Morocco to France. Journal of Antimicrobial Chemotherapy. 2011 May 1, 2011;66(5):1181-2.
10. Levast M, Poirel L, Carrër A, Deiber M, Decroisette E, Mallaval F-O, et al. Transfer of OXA-48-positive carbapenem-resistant Klebsiella pneumoniae from Turkey to France. Journal of Antimicrobial Chemotherapy. 2011.
11. Galan-Sanchez F, Marin-Casanova P, Aznar-Marin P, Foncubierta E, García-Martos P, García-Tapia A, et al. Detection of OXA-48-encoding plasmid in a clinical strain of Enterobacter cloacae iso-lated in Spain. 21st European Congress of Clinical Microbiology and Infectious Diseases (ECCMID)27th International Congress of Chemotherapy (ICC); Milano, Italy2011.
12. Nordmann P, Cuzon G, Naas T. The real threat of Klebsiella pneu-moniae carbapenemase-producing bacteria. Lancet Infect Dis. 2009 Apr;9(4):228-36.
13. Walsh TR. Clinically significant carbapenemases: an update. Curr Opin Infect Dis. 2008 Aug;21(4):367-71.
14. Carrer A, Poirel L, Yilmaz M, Akan OA, Feriha C, Cuzon G, et al. Spread of OXA-48-encoding plasmid in Turkey and beyond. Antimicrobial Agents and Chemotherapy. [Jour]. 2010;54(3):1369-73.
15. Kumarasamy KK, Toleman MA, Walsh TR, Bagaria J, Butt F, Balakrishnan R, et al. Emergence of a new antibiotic resist-ance mechanism in India, Pakistan, and the UK: a molecular, biological, and epidemiological study. Lancet Infect Dis. 2010 Sep;10(9):597-602.
16. Struelens MJ, Monnet DL, Magiorakos AP, Santos O’Connor F, Giesecke J. New Delhi metallo-beta-lactamase 1-producing Enterobacteriaceae: emergence and response in Europe. Euro Surveill. 2010 Nov 18;15(46).
17. Kaase M, Nordmann P, Wichelhaus TA, Gatermann SG, Bonnin RA, Poirel L. NDM-2 carbapenemase in Acinetobacter baumannii from Egypt. J Antimicrob Chemother. 2011 Jun;66(6):1260-2.
18. Gasink LB, Edelstein PH, Lautenbach E, Synnestvedt M, Fishman NO. Risk factors and clinical impact of klebsiella pneumoniae carbapenemase-producing K. pneumoniae. Infection Control and Hospital Epidemiology. [Jour]. 2009;30(12):1180-5.
19. Marchaim D, Navon-Venezia S, Schwaber MJ, Carmeli Y. Isolation of imipenem-resistant Enterobacter species: emergence of KPC-2 carbapenemase, molecular characterization, epidemiol-ogy, and outcomes. Antimicrobial Agents & Chemotherapy. 2008 Apr;52(4):1413-8.
20. Borer A, Saidel-Odes L, Riesenberg K, Eskira S, Peled N, Nativ R, et al. Attributable mortality rate for carbapenem-resistant Klebsiella pneumoniae bacteremia. Infection Control and Hospital Epidemiology. [Jour]. 2009;30(10):972-6.
21. Schwaber MJ, Klarfeld-Lidji S, Navon-Venezia S, Schwartz D, Leavitt A, Carmeli Y. Predictors of carbapenem-resistant Klebsiella pneu-moniae acquisition among hospitalized adults and effect of acqui-sition on mortality. Antimicrobial Agents & Chemotherapy. 2008 Mar;52(3):1028-33.
22. Clinical and Laboratory Standards Institute. Performance Standards for Antimicrobial Susceptibility Testing; Nineteenth Informational Supplement. CLSI document M100-S19, Wayne, Pa.:Clinical and Laboratory Standards Institute, 2009;29(3)
23. EUCAST. Clinical Breakpoints.24. Clinical and Laboratory Standards Institute. Performance Standards
for Antimicrobial Susceptibility Testing; Twentieth Informational Supplement (June 2010 update). CLSI document M100-S20-U, Wayne, Pa.:Clinical and Laboratory Standards Institute, 2010;30(15). 2010.
25. Woodford N, Eastaway AT, Ford M, Leanord A, Keane C, Quayle RM, et al. Comparison of BD Phoenix, Vitek 2, and MicroScan automated systems for detection and inference of mechanisms responsible for carbapenem resistance in Enterobacteriaceae. J Clin Microbiol. 2010 Aug;48(8):2999-3002.

10
SURVEILLANCE REPORTAntimicrobial resistance surveillance in Europe 2010

11
Antimicrobial resistance surveillance in Europe 2010SURVEILLANCE REPORT
3.1 IntroductionSince 2000, EARSS/EARS-Net have organised external quality assessment (EQA) exercises of antimicrobial susceptibility testing in collaboration with UK NEQAS (United Kingdom National External Quality Assessment Service). UK NEQAS is based at the Health Protection Agency in London, and is a non-profit organisation with more than 35 years of experience in external quality assessment in different countries (www.ukneqasmicro.org.uk).
The purpose of the EARS-Net EQA exercises is:
• to assess the ability of participating laboratories to identify antimicrobial resistance of clinical and public health importance;
• to determine the accuracy of susceptibility test results reported by individual laboratories;
• to estimate the overall comparability of routinely col-lected test results between laboratories and countries across Europe.
The EQA exercise conducted in 2010 was open to all 28 countries participating in EARS-Net. In addition, the
EQA was offered to previous EARSS participants includ-ing Bosnia-Herzegovina, Croatia, Turkey and Israel. A panel of six strains (S. pneumoniae, S. aureus, E. coli, K. pneumoniae, P. aeruginosa and E. faecium) resem-bling resistance phenotypes of bacterial species under surveillance by EARS-Net was included in the exercise. The strains were characterised and tested in two refer-ence laboratories (Addenbrooke’s Hospital, Cambridge, UK and City Hospital, Birmingham, UK). Both reference laboratories confirmed MICs and interpreted the results according to frequently used breakpoint criteria such as CLSI and EUCAST, as indicated in each of the species’ chapters.
3.2 ResultsThe six strains were distributed to 873 laboratories con-nected to EARS-Net. The laboratories were asked to report the identification of each organism and clinical susceptibility characterisation – susceptible, intermedi-ate and resistant (S, I, R) – according to the guidelines used. The return rate was similar to previous years; 766 laboratories (88 %) returned reports. Figure 3.1 shows the number of participating laboratories returning results per country. Participants’ results were analysed
3 External quality assessment exercise (EQA) 2010
Figure 3.1: Number of participating laboratories returning reports per country, 2010
0 20 40 60 80 100
United KingdomTurkey
SwedenSpain
SloveniaRomaniaPortugal
PolandNorway
NetherlandsMalta
LuxembourgLithuania
LatviaItaly
IrelandIceland
HungaryGreece
GermanyFrance
FinlandEstonia
DenmarkCzech Republic
CyprusCroatia
BulgariaBosnia & Herzegovina
BelgiumAustria
No results
Results
Coun
try
Number of laboratories
The external quality assessment exercise was open to all countries participating in EARSS in 2010.

12
SURVEILLANCE REPORTAntimicrobial resistance surveillance in Europe 2010
Figure 3.2: Adherence to guidelines: number of laboratories per country, 2010
0 20 40 60 80 100
United Kingdom Turkey
SwedenSpain
SloveniaRomaniaPortugal
PolandNorway
NetherlandsMalta
LuxembourgLithuania
LatviaItaly
IrelandIceland
HungaryGreece
GermanyFrance
FinlandEstonia
DenmarkCzech Republic
CyprusCroatia
BulgariaBosnia & Herzegovina
BelgiumAustria
COMB
CRG
DIN
EUCAST
CLSI
NWGA
SFM
SRGA
Other
BSAC
Coun
try
Number of laboratories
BSAC: British Society for Antimicrobial Chemotherapy; CRG: (Dutch) Commissie Richtlijnen Gevoeligheidsbepalingen; DIN: Deutsche Industrie Norm; EUCAST: European Committee on Antimicrobial Susceptibility Testing; CLSI: Clinical and Laboratory Standards institute; NWGA: Norwegian Working Group on Antimicrobials; SFM: Société Française de Microbiologie; SRGA: Swedish Reference Group for Antibiotics. Laboratories specifying ‘other’ indicates did they did not use any of the specified guidelines above. Where more than one guideline was used to cover certain antimicrobial/organism combinations laboratories could select combined (COMB) as the guideline.
and considered ‘concordant’ if the reported categori-sation agreed with the interpretation of the reference laboratories.
For the determination of AST results, laboratories used automated methods (42 %), disc diffusion tests (34 %) or combined methods (14 %). For species identification laboratories used automated (52 %) or conventional methods (46 %). Increased use of conventional methods was associated with identification of the S. pneumoniae and E. faecium.
The majority of laboratories applied CLSI guidelines (66 %), and some countries used national guidelines, e.g. France (SFM), United Kingdom (BSAC), and Sweden (SRGA). EUCAST guidelines were reported by 107 (14 %) laboratories. However, the United Kingdom, Sweden, the Netherlands, Germany, France and Norway have been implementing EUCAST breakpoints in their national MIC breakpoint recommendations, as harmonised breakpoints have been agreed, and their disc diffu-sion method has been adjusted accordingly. Therefore, a combined total of some 29 % of laboratories used
EUCAST breakpoints. Figure 3.2 shows the adherence to (inter)national guidelines by number of laboratories per country.
3.2.1 Specimen 0243 Klebsiella pneumoniae
This specimen consisted of a Klebsiella pneumoniae with plasmid-mediated CIT-type (CMY-like enzymes derived from C. freundii) AmpC beta-lactamase production.
Reporting of susceptibility to cephalosporins by partici-pants was very variable (cefotaxime S 20.1 %, I 18.5 %, R 61.4 %; ceftriaxone S 16.1 %, I 24.6 %, R 59.3 %; ceftazidime S 2.8 %, I 22.9 %, R 74.3 %). MICs of cepha-losporins included in reference tests (cefotaxime 4−16 mg/L, ceftriaxone > 32 mg/L, ceftazidime 32 mg/L) were all in the resistant range with current EUCAST and CLSI breakpoints, although cefotaxime MICs were border-line. CLSI breakpoints for Enterobacteriaceae tested against cefotaxime, ceftriaxone and ceftazidime were significantly reduced in January 2010. It is likely that many laboratories have not yet implemented the new breakpoints in their systems and according to old CLSI

13
Antimicrobial resistance surveillance in Europe 2010SURVEILLANCE REPORT
recommendations it would have been correct to report bacteria with MICs of 4 or 8 mg/L as sensitive to cefotax-ime if the isolate did not have a class A ESBL. Reports of susceptible to cefotaxime, ceftriaxone and ceftazidime were returned by significantly fewer participants follow-ing EUCAST-related guidelines (4.0 % of 199, 3.4 % of 58 and 0.5 % of 210, respectively) than participants fol-lowing CLSI guidelines (27.1 % of 431, 18.1 % of 221 and 3.7 % of 488, respectively).
As seen with the E. coli with plasmid-mediated AmpC beta-lactamase distributed in the EARSS EQA distribu-tion in 2009 (specimen 9011), reports that the organism was an ESBL-producer were not uncommon: 22.4 % of the participants incorrectly reported the presence of an ESBL. Synergy between third-generation cephalosporins and clavulanate was not seen in reference tests and some participants may have reported the presence of an ESBL simply because ESBLs are the most common mech-anism of resistance to third-generation cephalosporins in K. pneumoniae. However, AmpC-mediated resistance in K. pneumoniae is not rare and reflects acquisition of a plasmid-mediated form of the enzyme. AmpC enzymes do have an extended spectrum of activity and it has been argued that the established definition of an ESBL, based mainly on activity against third-generation cepha-losporins and inhibited by clavulanate, is unreasonably narrow. Some participants may have used an extended definition of an ESBL when giving results for the ESBL test, although this extended definition is controversial and not widely accepted.
Isolates with plasmid-mediated AmpC beta-lacta-mase are typically resistant to third-generation cephalosporins, cefuroxime, penicillin+clavulanate com-binations, and cefoxitin, but susceptible to cefepime, cefpirome and carbapenems. They are negative in ESBL confirmation tests, but synergy is seen with cepha-losporin–boronic acid or cephalosporin–cloxacillin tests.
High discrepancy rates were also seen with piperacil-lin–tazobactam, 70.9 % of participants reporting the organism susceptible, 17.4 % intermediate and 11.7 % resistant. However, it is important to notice that pipera-cillin–tazobactam is an extremely difficult substance to test, and therefore it is difficult to correctly classify isolates that are borderline. In reference MIC tests, the organism appeared borderline susceptible/intermediate to piperacillin–tazobactam (MIC 8−16 mg/L). There is little clinical evidence on whether infections caused by K. pneumoniae with plasmid-mediated AmpC are treat-able with piperacillin–tazobactam when the producers appear susceptible in vitro, and response will probably depend on the type and amount of AmpC produced. Results should, however, be viewed with considerable caution and it may be that some participants edited results from susceptible to intermediate or resistant on this basis. There were no significant problems with susceptibility testing of this organism against other ref-erence agents (Table 3.1).
Table 3.1: Klebsiella pneumoniae (0243): Minimum inhibitory concentration (MIC) and intended results reported by the reference laboratories and the overall concordance of the participating laboratories
Antibiotic agentMIC range (mg/L) ref. lab. Intended interpretation
from to EUCAST/CLSI Overall concordance (%)Amikacin 1 2 S 99Amoxicillin NT* R 100Ampicillin 128 >128 R 99Cefotaxime 4 16 R 61Ceftazidime 32 32 R 74Ceftriaxone >32 >32 R 59Ciprofloxacin 16 32 R 99Gentamicin 0.25 0.5 S 99Imipenem 0.12 0.12 S 99Meropenem 0.016 0.03 S 99Piperacillin** R 79Piperacillin–tazobactam 8 16 S 71Tobramycin 0.5 1 S 98ESBL Negative 78
* Not tested, result inferred from ampicillin result. ** Not tested, reference MICs were participants’ results.S: susceptible; R: resistant; I: intermediate.

14
SURVEILLANCE REPORTAntimicrobial resistance surveillance in Europe 2010
Table 3.2: Escherichia coli (0244): Minimum inhibitory concentration (MIC) and intended results reported by the reference laboratories and the overall concordance of the participating laboratories
Antibiotic agentMIC range (mg/L) ref. lab. Intended interpretation
from to EUCAST/CLSI Overall concordance (%)Amikacin 8 16 S 51Amoxicillin NT* R 89Ampicillin 16 128 R 96Cefotaxime 0.03 0.12 S 99Ceftazidime 0.12 0.25 S 99Ceftriaxone 0.125 0.25 S 99Ciprofloxacin 0.004 0.016 S 99Gentamicin 16 32 R 93Imipenem 0.06 0.12 S 99Meropenem 0.016 0.016 S 99Piperacillin** S 66Piperacillin–tazobactam 2 2 S 99Tobramycin 32 64 R 98ESBL Negative 99
* Not tested, result inferred from ampicillin result. ** Not tested, reference MICs were participants’ results.S: susceptible; R: resistant; I: intermediate.
Table 3.3: Streptococcus pneumoniae (0245): Minimum inhibitory concentration (MIC) and intended results reported by the reference laboratories and the overall concordance of the participating laboratories
Antibiotic agentMIC range (mg/L) ref. lab. Intended interpretation
from to EUCAST/CLSI Overall concordance (%)Cefotaxime 99 Meningitis <0.004 <0.004 S 99 Non-meningitis S 99Ceftriaxone 99 Meningitis <0.04 <0.04 S 99 Non-meningitis S 99Ciprofloxacin >32 >32 R 95Clindamycin 0.032 0.064 S 97Erythromycin 16 16 R 96Penicillin 98 Meningitis 0.015 0.015 S 99 Non-meningitis S 95
S: susceptible; R: resistant; I: intermediate.
3.2.2 Specimen 0244 Escherichia coli
This specimen consisted of an Escherichia coli with low-level penicillinase production and borderline sus-ceptibility to amikacin.
Reference MICs of ampicillin and amoxicillin both varied from 16 to 128 mg/L (resistant by EUCAST guidelines, intermediate–resistant by CLSI guidelines) and most par-ticipants reported resistance to both agents (amoxicillin 89 % resistant, ampicillin 96 % resistant). No reference MIC results are available for piperacillin alone but the majority of participants reporting an MIC gave results in the range 4−16 mg/L (susceptible by EUCAST and CLSI breakpoints). Among participants, 65.7 % reported sus-ceptible, 19.3 % intermediate and 15.0 % resistant.
The organism is borderline in susceptibility to amikacin (MIC 8−16 mg/L) and would be reported susceptible/intermediate by EUCAST guidelines and susceptible by CLSI guidelines. This was reflected in the variable sus-ceptibility reported by participants (51.4 % susceptible, 31.7 % intermediate, 16.9 % resistant) (Table 3.2).
3.2.3 Specimen 0245 Streptococcus pneumoniae
This specimen consisted of a Streptococcus pneumoniae resistant to ciprofloxacin and erythromycin but suscep-tible to other reference agents tested. There were no significant problems in susceptibility testing with any of the reference agents.
Participants were asked if they would use a norfloxacin screening test with this isolate: 185 participants reported that they used a 10µg disc and all correctly reported the isolate resistant to this agent. Some 768 participants, following a variety of guidelines, reported a disc content value for ciprofloxacin with this specimen; 454 indi-cated that they used a content of 1µg and 313 used 5µg. However, only 429 participants reported a test result. The results for participants using a disc content of 1µg were: 11 susceptible, 4 intermediate and 137 resistant; and for those using a disc content of 5µg were: 4 suscep-tible, 3 intermediate and 269 resistant (Table 3.3).
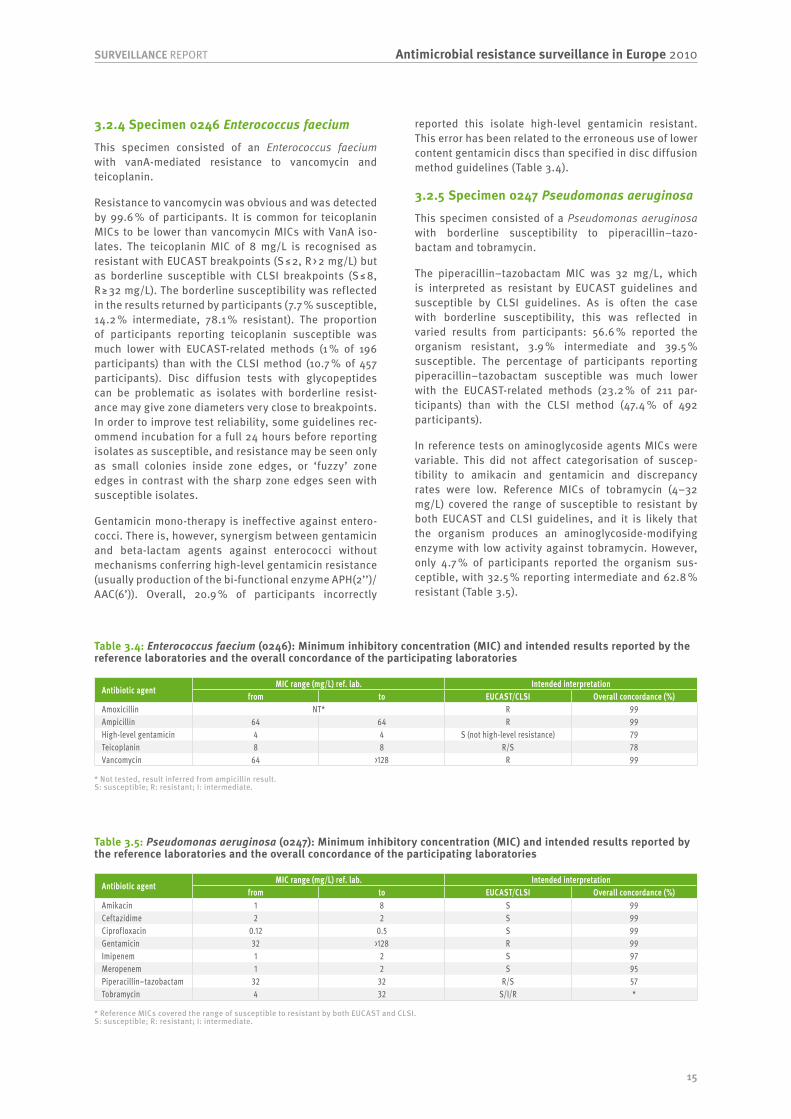
15
Antimicrobial resistance surveillance in Europe 2010SURVEILLANCE REPORT
3.2.4 Specimen 0246 Enterococcus faecium
This specimen consisted of an Enterococcus faecium with vanA-mediated resistance to vancomycin and teicoplanin.
Resistance to vancomycin was obvious and was detected by 99.6 % of participants. It is common for teicoplanin MICs to be lower than vancomycin MICs with VanA iso-lates. The teicoplanin MIC of 8 mg/L is recognised as resistant with EUCAST breakpoints (S ≤ 2, R > 2 mg/L) but as borderline susceptible with CLSI breakpoints (S ≤ 8, R ≥ 32 mg/L). The borderline susceptibility was reflected in the results returned by participants (7.7 % susceptible, 14.2 % intermediate, 78.1 % resistant). The proportion of participants reporting teicoplanin susceptible was much lower with EUCAST-related methods (1 % of 196 participants) than with the CLSI method (10.7 % of 457 participants). Disc diffusion tests with glycopeptides can be problematic as isolates with borderline resist-ance may give zone diameters very close to breakpoints. In order to improve test reliability, some guidelines rec-ommend incubation for a full 24 hours before reporting isolates as susceptible, and resistance may be seen only as small colonies inside zone edges, or ‘fuzzy’ zone edges in contrast with the sharp zone edges seen with susceptible isolates.
Gentamicin mono-therapy is ineffective against entero-cocci. There is, however, synergism between gentamicin and beta-lactam agents against enterococci without mechanisms conferring high-level gentamicin resistance (usually production of the bi-functional enzyme APH(2’’)/AAC(6’)). Overall, 20.9 % of participants incorrectly
reported this isolate high-level gentamicin resistant. This error has been related to the erroneous use of lower content gentamicin discs than specified in disc diffusion method guidelines (Table 3.4).
3.2.5 Specimen 0247 Pseudomonas aeruginosa
This specimen consisted of a Pseudomonas aeruginosa with borderline susceptibility to piperacillin–tazo-bactam and tobramycin.
The piperacillin–tazobactam MIC was 32 mg/L, which is interpreted as resistant by EUCAST guidelines and susceptible by CLSI guidelines. As is often the case with borderline susceptibility, this was reflected in varied results from participants: 56.6 % reported the organism resistant, 3.9 % intermediate and 39.5 % susceptible. The percentage of participants reporting piperacillin–tazobactam susceptible was much lower with the EUCAST-related methods (23.2 % of 211 par-ticipants) than with the CLSI method (47.4 % of 492 participants).
In reference tests on aminoglycoside agents MICs were variable. This did not affect categorisation of suscep-tibility to amikacin and gentamicin and discrepancy rates were low. Reference MICs of tobramycin (4−32 mg/L) covered the range of susceptible to resistant by both EUCAST and CLSI guidelines, and it is likely that the organism produces an aminoglycoside-modifying enzyme with low activity against tobramycin. However, only 4.7 % of participants reported the organism sus-ceptible, with 32.5 % reporting intermediate and 62.8 % resistant (Table 3.5).
Table 3.4: Enterococcus faecium (0246): Minimum inhibitory concentration (MIC) and intended results reported by the reference laboratories and the overall concordance of the participating laboratories
Antibiotic agentMIC range (mg/L) ref. lab. Intended interpretation
from to EUCAST/CLSI Overall concordance (%)Amoxicillin NT* R 99Ampicillin 64 64 R 99High-level gentamicin 4 4 S (not high-level resistance) 79Teicoplanin 8 8 R/S 78Vancomycin 64 >128 R 99
* Not tested, result inferred from ampicillin result. S: susceptible; R: resistant; I: intermediate.
Table 3.5: Pseudomonas aeruginosa (0247): Minimum inhibitory concentration (MIC) and intended results reported by the reference laboratories and the overall concordance of the participating laboratories
Antibiotic agentMIC range (mg/L) ref. lab. Intended interpretation
from to EUCAST/CLSI Overall concordance (%)Amikacin 1 8 S 99Ceftazidime 2 2 S 99Ciprofloxacin 0.12 0.5 S 99Gentamicin 32 >128 R 99Imipenem 1 2 S 97Meropenem 1 2 S 95Piperacillin–tazobactam 32 32 R/S 57Tobramycin 4 32 S/I/R *
* Reference MICs covered the range of susceptible to resistant by both EUCAST and CLSI.S: susceptible; R: resistant; I: intermediate.

16
SURVEILLANCE REPORTAntimicrobial resistance surveillance in Europe 2010
3.2.6 Specimen 0248 Staphylococcus aureus
This specimen consisted of a Staphylococcus aureus, sequence type 239, resistant to multiple agents. There were no significant problems with susceptibility test-ing of this organism against the reference agents (Table 3.6).
3.3 ConclusionsThe response to this ninth EARSS/EARS-Net EQA exercise by the participating laboratories was good, with a high return rate and very few late responders. Performance was generally very good and consistent with that seen in previous EQA exercises. Problems, where experienced, were related to borderline susceptibility and when guidelines revealed remaining discrepancies in routine susceptibility testing.
ECDC would like to thank UK NEQAS, the reference labora-tories, the members of the EARS-Net Coordination Group and the country coordinators for the swift distribution of the strains, and all the participating laboratories for their efforts and timely response to the exercise.
Table 3.6: Staphylococcus aureus (0248): Minimum inhibitory concentration (MIC) and intended results reported by the reference laboratories and the overall concordance of the participating laboratories
Antibiotic agentMIC range (mg/L) ref. lab. Intended interpretation
from to EUCAST/CLSI Overall concordance (%)Cefoxitin 128 >128 R 99Ciprofloxacin 32 32 R 98Clindamycin >128 >128 R 99Erythromycin >128 >128 R 100Fusidic acid 0.06 0.12 S 99Gentamicin >128 >128 R 99Meticillin NT* R 98Oxacillin >128 >128 R 99Penicillin 32 64 R 99Rifampicin 0.004 0.008 S 99Teicoplanin 1 2 S 99Tetracycline >128 >128 R 98Vancomycin 1 2 S 98
* Not tested, result inferred from oxacillin and cefoxitin results. S: susceptible; R: resistant; I: intermediate.
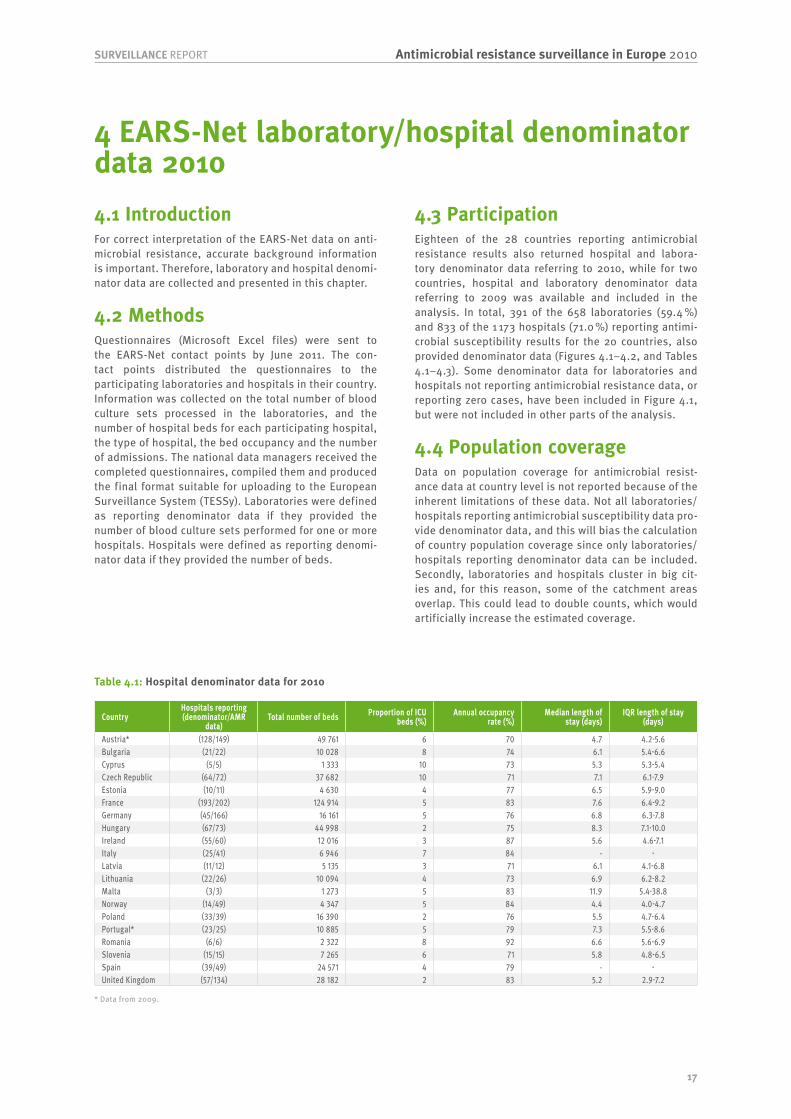
17
Antimicrobial resistance surveillance in Europe 2010SURVEILLANCE REPORT
4.1 IntroductionFor correct interpretation of the EARS-Net data on anti-microbial resistance, accurate background information is important. Therefore, laboratory and hospital denomi-nator data are collected and presented in this chapter.
4.2 MethodsQuestionnaires (Microsoft Excel files) were sent to the EARS-Net contact points by June 2011. The con-tact points distributed the questionnaires to the participating laboratories and hospitals in their country. Information was collected on the total number of blood culture sets processed in the laboratories, and the number of hospital beds for each participating hospital, the type of hospital, the bed occupancy and the number of admissions. The national data managers received the completed questionnaires, compiled them and produced the final format suitable for uploading to the European Surveillance System (TESSy). Laboratories were defined as reporting denominator data if they provided the number of blood culture sets performed for one or more hospitals. Hospitals were defined as reporting denomi-nator data if they provided the number of beds.
4.3 ParticipationEighteen of the 28 countries reporting antimicrobial resistance results also returned hospital and labora-tory denominator data referring to 2010, while for two countries, hospital and laboratory denominator data referring to 2009 was available and included in the analysis. In total, 391 of the 658 laboratories (59.4 %) and 833 of the 1 173 hospitals (71.0 %) reporting antimi-crobial susceptibility results for the 20 countries, also provided denominator data (Figures 4.1–4.2, and Tables 4.1–4.3). Some denominator data for laboratories and hospitals not reporting antimicrobial resistance data, or reporting zero cases, have been included in Figure 4.1, but were not included in other parts of the analysis.
4.4 Population coverage Data on population coverage for antimicrobial resist-ance data at country level is not reported because of the inherent limitations of these data. Not all laboratories/hospitals reporting antimicrobial susceptibility data pro-vide denominator data, and this will bias the calculation of country population coverage since only laboratories/hospitals reporting denominator data can be included. Secondly, laboratories and hospitals cluster in big cit-ies and, for this reason, some of the catchment areas overlap. This could lead to double counts, which would artificially increase the estimated coverage.
4 EARS-Net laboratory/hospital denominator data 2010
Table 4.1: Hospital denominator data for 2010
CountryHospitals reporting (denominator/AMR
data)Total number of beds Proportion of ICU
beds (%)Annual occupancy
rate (%)Median length of
stay (days)IQR length of stay
(days)
Austria* (128/149) 49 761 6 70 4.7 4.2-5.6Bulgaria (21/22) 10 028 8 74 6.1 5.4-6.6Cyprus (5/5) 1 333 10 73 5.3 5.3-5.4Czech Republic (64/72) 37 682 10 71 7.1 6.1-7.9Estonia (10/11) 4 630 4 77 6.5 5.9-9.0France (193/202) 124 914 5 83 7.6 6.4-9.2Germany (45/166) 16 161 5 76 6.8 6.3-7.8Hungary (67/73) 44 998 2 75 8.3 7.1-10.0Ireland (55/60) 12 016 3 87 5.6 4.6-7.1Italy (25/41) 6 946 7 84 - -Latvia (11/12) 5 135 3 71 6.1 4.1-6.8Lithuania (22/26) 10 094 4 73 6.9 6.2-8.2Malta (3/3) 1 273 5 83 11.9 5.4-38.8Norway (14/49) 4 347 5 84 4.4 4.0-4.7Poland (33/39) 16 390 2 76 5.5 4.7-6.4Portugal* (23/25) 10 885 5 79 7.3 5.5-8.6Romania (6/6) 2 322 8 92 6.6 5.6-6.9Slovenia (15/15) 7 265 6 71 5.8 4.8-6.5Spain (39/49) 24 571 4 79 - -United Kingdom (57/134) 28 182 2 83 5.2 2.9-7.2
* Data from 2009.

18
SURVEILLANCE REPORTAntimicrobial resistance surveillance in Europe 2010
0 50 100 150 200 250
United Kingdom
Spain
Slovenia
Romania
Portugal*
Poland
Norway
Malta
Lithuania
Latvia
Italy
Ireland
Hungary
Germany
France
Estonia
Czech Republic
Cyprus
Bulgaria
Austria*
Denominator information only
AMR information only
AMR and denominator information
Coun
try
Number of laboratories
Figure 4.1: Number of hospitals (A) and laboratories (B) reporting AMR and/or denominator data in 2010
0 50 100 150 200 250 300 350 400
United Kingdom
Spain
Slovenia
Romania
Portugal*
Poland
Norway
Malta
Lithuania
Latvia
Italy
Ireland
Hungary
Germany
France
Estonia
Czech Republic
Cyprus
Bulgaria
Austria*
Denominator information only
AMR information only
AMR and denominator information
Coun
try
Number of hospitals
A)
B)
* Denominator data from 2009
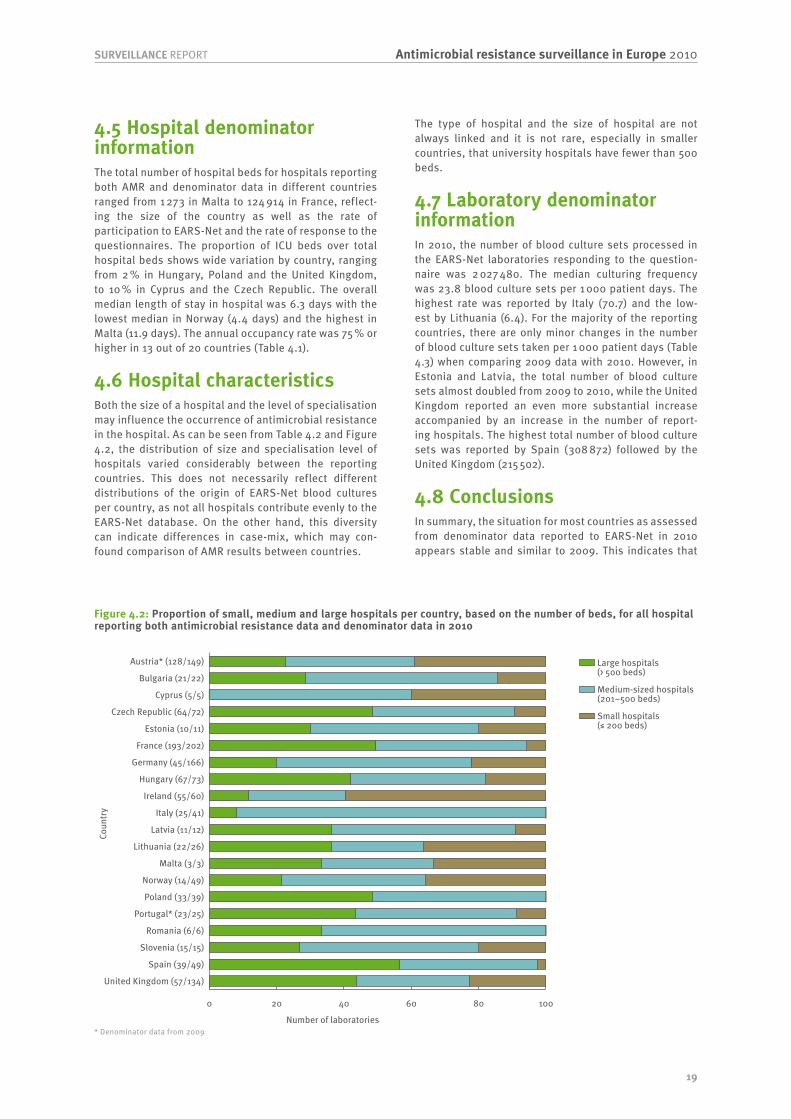
19
Antimicrobial resistance surveillance in Europe 2010SURVEILLANCE REPORT
4.5 Hospital denominator informationThe total number of hospital beds for hospitals reporting both AMR and denominator data in different countries ranged from 1 273 in Malta to 124 914 in France, reflect-ing the size of the country as well as the rate of participation to EARS-Net and the rate of response to the questionnaires. The proportion of ICU beds over total hospital beds shows wide variation by country, ranging from 2 % in Hungary, Poland and the United Kingdom, to 10 % in Cyprus and the Czech Republic. The overall median length of stay in hospital was 6.3 days with the lowest median in Norway (4.4 days) and the highest in Malta (11.9 days). The annual occupancy rate was 75 % or higher in 13 out of 20 countries (Table 4.1).
4.6 Hospital characteristicsBoth the size of a hospital and the level of specialisation may influence the occurrence of antimicrobial resistance in the hospital. As can be seen from Table 4.2 and Figure 4.2, the distribution of size and specialisation level of hospitals varied considerably between the reporting countries. This does not necessarily reflect different distributions of the origin of EARS-Net blood cultures per country, as not all hospitals contribute evenly to the EARS-Net database. On the other hand, this diversity can indicate differences in case-mix, which may con-found comparison of AMR results between countries.
The type of hospital and the size of hospital are not always linked and it is not rare, especially in smaller countries, that university hospitals have fewer than 500 beds.
4.7 Laboratory denominator informationIn 2010, the number of blood culture sets processed in the EARS-Net laboratories responding to the question-naire was 2 027 480. The median culturing frequency was 23.8 blood culture sets per 1 000 patient days. The highest rate was reported by Italy (70.7) and the low-est by Lithuania (6.4). For the majority of the reporting countries, there are only minor changes in the number of blood culture sets taken per 1 000 patient days (Table 4.3) when comparing 2009 data with 2010. However, in Estonia and Latvia, the total number of blood culture sets almost doubled from 2009 to 2010, while the United Kingdom reported an even more substantial increase accompanied by an increase in the number of report-ing hospitals. The highest total number of blood culture sets was reported by Spain (308 872) followed by the United Kingdom (215 502).
4.8 ConclusionsIn summary, the situation for most countries as assessed from denominator data reported to EARS-Net in 2010 appears stable and similar to 2009. This indicates that
Figure 4.2: Proportion of small, medium and large hospitals per country, based on the number of beds, for all hospital reporting both antimicrobial resistance data and denominator data in 2010
0 20 40 60 80 100
United Kingdom (57/134)
Spain (39/49)
Slovenia (15/15)
Romania (6/6)
Portugal* (23/25)
Poland (33/39)
Norway (14/49)
Malta (3/3)
Lithuania (22/26)
Latvia (11/12)
Italy (25/41)
Ireland (55/60)
Hungary (67/73)
Germany (45/166)
France (193/202)
Estonia (10/11)
Czech Republic (64/72)
Cyprus (5/5)
Bulgaria (21/22)
Austria* (128/149)
Coun
try
Number of laboratories
Small hospitals (≤ 200 beds)
Medium-sized hospitals (201–500 beds)
Large hospitals (> 500 beds)
* Denominator data from 2009

20
SURVEILLANCE REPORTAntimicrobial resistance surveillance in Europe 2010
the comparison of occurrence of resistance over time based on EARS-Net data remains feasible, and the increasing number of countries reporting denominator data is encouraging.
The BSIs ascertainment is strongly linked to the blood culture rate. Therefore, the wide range in culture rate observed in the countries providing denominator data will have implications for inter-country comparison of both the incidence rate of infections, which could be underestimated in some countries, and of the proportion of resistance. In particular, the proportion of resistance could be overestimated if there is a frequent use of
empiric therapy also for invasive infections, and if the cultures are more likely to be performed in patients not responding to the empiric treatment.
For future improvement of the denominator data col-lection and analysis, a further increase of the number of countries reporting denominator data, as well as an increased number of hospital and laboratories participating within countries, would be desirable. Furthermore, an improved estimation of the coverage of the EARS-Net surveillance, e.g. by using estimations done at the national level based on knowledge of the country-specific situation, would also be desirable.
Table 4.3: Laboratory denominator information for 2010
Country Laboratories reporting (denominator/AMR data) Number of hospitals* Total number of blood culture sets Number of blood culture sets per
1000 patient daysAustria* (36/38) 120 158 529 13.1Bulgaria (20/21) 21 19 090 7Cyprus (5/5) 5 14 207 40Czech Republic (42/45) 62 145 548 15.2Estonia (10/11) 11 20 593 15.7France (27/202) 27 289 724 46.5Germany (10/17) 37 44 101 12.1Hungary (29/32) 64 84 846 7.3Ireland (36/41) 51 176 917 46.1Italy (22/35) 22 119 221 70.7Latvia (11/11) 11 12 726 9.6Lithuania (10/11) 22 17 356 6.4Malta (1/1) 3 6 328 16.4Norway (9/15) 14 62 532 46.7Poland (33/35) 33 93 059 20.5Portugal* (21/22) 23 158 902 50.7Romania (4/6) 4 28 947 37.3Slovenia (10/10) 14 50 480 27Spain (39/41) 39 308 872 43.4United Kingdom (16/59) 26 215 502 46.1
* Data from 2009.
Table 4.2: Hospital characteristics for 2010
CountryHospitals reporting
(denominator/AMR data)Proportion of hospitals by level of care (%)
Tertiary level Secondary level Primary level Other UnknownAustria* (128/149) 8 23 44 26 0Bulgaria (21/22) 52 33 5 10 0Cyprus (5/5) 20 20 40 20 0Czech Republic (64/72) 38 36 25 0 2Estonia (10/11) 0 50 20 30 0France (193/202) 28 72 0 0 0Germany (45/166) 24 47 24 4 0Hungary (67/73) 45 30 16 9 0Ireland (55/60) 17 50 13 17 2Italy (25/41) 0 8 0 0 92Latvia (11/12) 45 18 9 27 0Lithuania (22/26) 45 41 14 0 0Malta (3/3) 33 33 0 33 0Norway (14/49) 36 36 29 0 0Poland (33/39) 39 61 0 0 0Portugal* (23/25) 57 26 4 13 0Romania (6/6) 50 17 0 0 33Slovenia (15/15) 13 47 20 13 7Spain (39/49) 56 38 5 0 0United Kingdom (57/134) 37 23 16 18 7
* Data from 2009. Primary level or district hospital = has few specialties, limited laboratory services; bed capacity ranges from 30 to 200 beds. Secondary level, or provincial hospital = highly differentiated by function with five to 10 clinical specialties; bed capacity ranging from 200 to 800 beds. Tertiary level or central/regional hospital = highly specialised staff and technical equipment; clinical services are highly differentiated by function; may have teaching activities; bed capacity ranges from 300 to 1500 beds. Other = hospitals for a specific patient population, like a military hospital, or hospitals with any single specialty, like a burns unit. Unknown = not available.

21
Antimicrobial resistance surveillance in Europe 2010SURVEILLANCE REPORT
5.1 Streptococcus pneumoniae5.1.1 Clinical and epidemiological importance
Streptococcus pneumoniae is a common cause of dis-ease, especially among young children, elderly people and patients with compromised immune functions. The clinical spectrum ranges from upper airway infections, such as sinusitis, and otitis media to pneumonia and invasive bloodstream infections and meningitis. Since S. pneumoniae is the most common cause of pneumonia worldwide, morbidity and mortality are high and annu-ally approximately 3 million people are estimated to die of pneumococcal infections.
Pneumococci carry a variety of virulence factors that facilitate adherence and transcytosis of epithelial cells. The cell wall of pneumococci is coated with a viscous polysaccharide slime layer termed the capsule. This is the most important virulence factor because it protects the bacteria from the adhesion of opsonising antibodies and the destruction by leucocytes. Capsular polysac-charides are highly diverse and play an important role in immune evasion. Around 80 different serotypes have been described. The serotype distribution varies with age, disease and geographical region. Interestingly, serotypes most frequently involved in pneumococcal disease or colonisation in infants are also most fre-quently associated with antimicrobial resistance.
5.1.2 Resistance mechanisms
Beta-lactam antibiotics bind to cell wall synthesising enzymes, so-called penicillin-binding proteins (PBPs), and interfere with the biosynthesis and remodelling of the bacterial cell wall during cell growth and division. The mechanism of penicillin resistance in S. pneumoniae consists of alterations in PBPs, which result in reduced affinity with this class of antibiotics. Alterations in PBPs are due to a continuous mutation process that causes different degrees of resistance proceeding from reduced susceptibility through low-level clinical resistance – conventionally termed intermediatei (I) – to full clinical resistance (R). Although intermediately resistant strains are clearly less susceptible than sensitive strains, in the absence of meningitis, infections with these strains are often successfully treated with high doses of penicillin or other beta-lactam compounds.
Macrolide, lincosamide and streptogramin (MLS) antibiotics are chemically distinct, but all bind to a ribosomal subunit inhibiting the initiation of mRNA bind-ing and thus act as protein synthesis inhibitors. In S.
i Microorganisms are defined as intermediate by a level of antimicro-bial activity with uncertain clinical effect. Occasionally, this can be overcome if antibiotics can be administered at a higher dose and/or are concentrated at the infected body site.
pneumoniae two resistance mechanisms against MLS antibiotics have been reported:
• The acquisition of an erythromycin ribosomal meth-ylation gene (erm) results in a post-transcriptional modification of the 23S subunit of ribosomal RNA, which blocks the binding of the macrolide to the ribosome. Once expression of the gene is induced, this often results in high-level resistance (MICs > 128 mg/L) to macrolide, lincosamide and streptogramin B, termed MLSB resistance.
• The acquisition of a macrolide efflux system gene (mef(E)) results in the excretion of the antimicrobial, and effectively reduces intracellular erythromycin, azithromycin and clarithromycin to subinhibitory con-centrations. In contrast to beta-lactam resistance, macrolide resistance via these mechanisms (particu-larly for MLSB) provides very high MICs, and cannot be overcome by increasing the dosages of antibiotics.
Since S. pneumoniae is the most frequent cause of community-acquired pneumonia and cannot clinically be easily distinguished from lower airway infections caused by other pathogens, empirical treatment of community-acquired lower respiratory infections needs to be active against pneumococci and should take the local preva-lence of antimicrobial resistance into account. Habitual prescription of non-beta-lactam compounds is therefore typical in countries where penicillin resistance has been frequently reported. Such reactive prescribing increases the selection pressure for alternative antibiotics such as macrolides and novel fluoroquinolones. It is therefore no surprise to see a dynamic antimicrobial resistance picture emerge in different European countries. At the same time, the existence of frequent dual beta-lactam/macrolides resistance, particularly among serotypes commonly found in children, assures that in practice the use of drugs from either of these classes will increase resistance for the members of the other one, and so the extended use of macrolides has been considered as a major driver for the increase in beta-lactam resistance.
Even though a certain small decrease in penicillin resist-ance had been detected in some countries before the introduction of the PCV7 vaccine, the widespread use of this vaccine is an important factor that may have influenced the decrease in antibiotic resistance levels, eliminating the infections (and more importantly, the children’s carriage) of frequent ‘classic’ resistant sero-types, 14, 6B, 19F and 23F, all of them covered by PCV7. The distribution of serotypes in 2010 had slight changes to that for 2009, and includes serotypes 19A (13.2 %), 1 (12.7 %), 7F (11.3 %), 3 (8.4 %), 12F (5.8 %), 22 (5.5 %) and 6 (5.3 %). Even though only a limited number of coun-tries have provided serotyping data, ad hoc studies in other EU countries, like France, Spain, Greece, Norway
5 Antimicrobial resistance in Europe

22
SURVEILLANCE REPORTAntimicrobial resistance surveillance in Europe 2010
and Portugal, confirm the current generality of this pat-tern. This shift indicates the effect of the PCV7 vaccine, selecting the non-vaccine serotypes, and more impor-tantly the serotype 19A. In fact the ‘classic diversity pattern’ of well adapted types of S. pneumoniae clones in children has been maintained, being these clones ‘disguised’ under the PCV7-non-covered 19A capsule type. At least 10 non-19A serotypes had a 19A capsular switch. Eventually, the introduction of PCV13 vaccine (covering 19A) will probably produce a new reduction in antibiotic resistance in S. pneumoniae.
5.1.3 Results
Penicillin
• Twenty-seven countries reported 11 389 isolates of which 1 056 (9.27 %) were non-susceptible to peni-cillin; 418 of the 1 056 non-susceptible isolates were identified as resistant. Greece did not report and Malta reported fewer than 10 isolates (accordingly no data are displayed on the maps for these countries) (Figure 5.1).
• The proportion of isolates reported as non-suscep-tible was: below 1 % in one country, 1–5 % in nine countries, 5–10 % in three countries, 10–25 % in 10 countries and 25–50 % in four countries (Figure 5.1, Table 5.1).
• Trends for the period 2007–2010 were calculated for 22 countries. Two countries (Spain and Norway) had a significant increasing trend with proportions of
non-susceptibility to penicillin in 2010 of 29.8 %, and 3.7 % respectively. These trends were, however, not significant when considering only data from labora-tories reporting consistently for all four years (Figure 5.4).
• Significant decreasing trends were observed for five countries: Belgiumi, the United Kingdom, Italy, Hungary, and France, with proportions of non-sus-ceptibility to penicillin of 0.4 %, 3.1 %, 9.2 %, 15 %, and 27.6 % respectively in 2010. In three of these countries, (Belgium, Hungary and France) the trends remained significant even when considering only the data from laboratories reporting consistently for all four years (Figure 5.4).
Macrolides
• Twenty-seven countries reported 11 439 isolates of which 1 778 (15.5 %) were non-susceptible to mac-rolides (Figure 5.2).
• The proportion of isolates reported as non-susceptible ranged from 0.0 % (Lithuania) to 54.5 % (Cyprus), and was reported as under 5 % in six countries, 5–10 % in four countries, 10–25 % in ten countries (including
i The proportion of Streptococcus pneumoniae non-susceptible to penicillin reported by Belgium dropped from 8% in 2008 to < 1% in 2009. This is largely due to the fact that the clinical breakpoints (CLSI) used to determine SIR have changed. The laboratory that performs all the susceptibility tests started using the new CLSI clinical breakpoints in the beginning of 2009. During the entire EARS-Net surveillance, the same method of susceptibility testing has been used, only clinical breakpoints have changed.
Figure 5.1: Streptococcus pneumoniae: proportion of invasive isolates non-susceptible to penicillin (PNSP) in 2010
LuxembourgLiechtenstein
Malta
Non-visible countries
toto
No data reported or less than 10 isolatesNot included
toto

23
Antimicrobial resistance surveillance in Europe 2010SURVEILLANCE REPORT
Bulgaria with exactly 25 %), 25–50 % in six countries and over 50 % in one country (Figure 5.2, Table 5.1).
• Trends for the period 2007–2010 were calculated for 22 countries. Spain, which reported a proportion of non-susceptibility of 26.7 % in 2010, had a significant increasing trend, which remained significant even when considering only data from laboratories report-ing consistently throughout the period 2007–2010 (Figure 5.5).
• Significant decreasing trends were observed for five countries: Denmark, France, Hungary, Norway and the United Kingdom, with proportions of non-susceptibil-ity to macrolides of 4.2 %, 30.0 %, 24.1 %, 3.8 %, and 4.7 % respectively in 2010. In all these countries, the trends were significant even when including only data from laboratories reporting consistently for all four years (Figure 5.5).
Non-susceptibility to penicillin and macrolides
• Twenty-seven countries reported 10 959 isolates tested for penicillin and macrolides. In 2010, 676 (6.2 %) of these isolates were non-susceptible to both these antibiotic classes. One country (Malta) reported fewer than 10 isolates (therefore it is not included in Figure 5.3).
• Proportions of non-susceptibility to penicillin and macrolides ranged from 0.0 % (Estonia, Lithuania) to 36.4 % (Cyprus), and were reported below 1 % in six countries, 1–5 % in eight countries (including Bulgaria
with exactly 5 %), 5–10 % in five countries 10–25 % in six countries, and 25–50 % in two countries (Figure 5.3, Table 5.1).
• Trends for 2007–2010 were calculated for 22 coun-tries. A significant increase was observed for Ireland and Spain, which in 2010 reported 12.4 % and 17.2 %, respectively. For Spain the trend was significant even when including only laboratories reporting for all four years. A significant decreasing trend was observed for three countries (Belgium, France and Hungary) which reported non-susceptibility to penicillin and macrolides proportions of 22.7 %, 9.8 %, and 0.3 %, respectively, in 2010. The trends for these three coun-tries remained significant even when considering only the data from laboratories reporting consistently throughout the period 2007–2010 (Figure 5.6).
Serogroups
• Six countries reported 2 852 S. pneumoniae isolates with identification of the serotype / serogroup (Table 5.2).
• In 2010, serogroups 19 and 1 were the most prevalent (each accounting for 13 % of the isolates), followed by serogroup 7 (11 %), serogroup 3 (8 %), serogroup 12 (6 %) as well as serogroups 22 and 6 (both at 5 %) (Figure 5.7, Table 5.2).
• Non-susceptibility to penicillin and macrolides has been mainly observed in serogroups 19, 6, 14, 15, 9, and 7; (order of decreasing proportion). Single
Table 5.1: Number and proportion of invasive S. pneumoniae isolates penicillin-non-susceptible (PNSP), penicillin-resistant (PRSP), macrolide non-susceptible (MNSP), single penicillin (PEN), single macrolides (MACR) and non-susceptible to penicillin and microlides isolates, including 95% confidence intervals (95% CI), reported per country in 2010
CountryNumber of isolates
tested for (PEN/MACR/both)
%PNSP (95%CI)
%PRSP (95%CI)
%MNSP (95%CI)
%single PEN (95%CI)
%single MACR (95%CI)
%DUAL (95%CI)*
Austria 351/323/310 4.0 (2-7) 2.3 (1-4) 10.5 (7-14) 2.6 (1-5) 8.4 (6-12) 1.9 (1-4)Belgium 1 797/1 797/1 797 0.4 (0-1) 0.4 (0-1) 24.8 (23-27) 0.1 (0-0) 24.5 (23-27) 0.3 (0-1)Bulgaria 22/20/20 18.2 (5-40) 18.2 (5-40) 25.0 (9-49) 10.0 (1-32) 20.0 (6-44) 5.0 (0-25)Cyprus 12/11/11 41.7 (15-72) 33.3 (10-65) 54.5 (23-83) 0.0 (0-28) 18.2 (2-52) 36.4 (11-69)Czech Republic 288/288/288 4.9 (3-8) 0.0 (0-1) 6.3 (4-10) 3.1 (1-6) 4.5 (2-8) 1.7 (1-4)Denmark 954/954/954 3.6 (2-5) 0.1 (0-1) 4.2 (3-6) 2.0 (1-3) 2.6 (2-4) 1.6 (1-3)Estonia 64/45/45 1.6 (0-8) 1.6 (0-8) 4.4 (1-15) 2.2 (0-12) 4.4 (1-15) 0.0 (0-8)Finland 611/607/596 14.2 (12-17) 1.3 (1-3) 27.5 (24-31) 3.5 (2-5) 16.4 (14-20) 11.1 (9-14)France 1 127/1 127/1 127 27.6 (25-30) 0.2 (0-1) 30.0 (27-33) 4.9 (4-6) 7.3 (6-9) 22.7 (20-25)Germany 354/358/349 3.7 (2-6) 0.3 (0-2) 9.2 (6-13) 1.7 (1-4) 7.2 (5-10) 2.0 (1-4)Hungary 140/133/133 15.0 (10-22) 5.7 (2-11) 24.1 (17-32) 5.3 (2-11) 14.3 (9-21) 9.8 (5-16)Iceland 37/37/37 5.4 (1-18) 2.7 (0-14) 10.8 (3-25) 0.0 (0-9) 5.4 (1-18) 5.4 (1-18)Ireland 310/290/290 18.1 (14-23) 4.8 (3-8) 15.5 (12-20) 6.6 (4-10) 3.1 (1-6) 12.4 (9-17)Italy 229/297/222 9.2 (6-14) 5.2 (3-9) 29.0 (24-34) 3.2 (1-6) 21.6 (16-28) 6.3 (3-10)Latvia 37/38/37 5.4 (1-18) 5.4 (1-18) 5.3 (1-18) 2.7 (0-14) 2.7 (0-14) 2.7 (0-14)Lithuania 39/35/34 12.8 (4-27) 7.7 (2-21) 0.0 (0-10) 14.7 (5-31) 0.0 (0-10) 0.0 (0-10)Luxembourg 46/47/46 13.0 (5-26) 4.3 (1-15) 19.1 (9-33) 6.5 (1-18) 13.0 (5-26) 6.5 (1-18)Malta 09/11/09 22.2 (3-60) 11.1 (0-48) 18.2 (2-52) 22.2 (3-60) 11.1 (0-48) 0.0 (0-34)Netherlands 753/898/681 2.0 (1-3) 0.3 (0-1) 6.0 (5-8) 1.3 (1-2) 5.6 (4-8) 0.9 (0-2)Norway 575/547/546 3.7 (2-6) 0.3 (0-1) 3.8 (2-6) 2.9 (2-5) 3.1 (2-5) 0.7 (0-2)Poland 75/71/70 24.0 (15-35) 24.0 (15-35) 39.4 (28-52) 1.4 (0-8) 17.1 (9-28) 21.4 (13-33)Portugal 156/156/156 14.7 (10-21) 14.7 (10-21) 21.8 (16-29) 4.5 (2-9) 11.5 (7-18) 10.3 (6-16)Romania 13/11/11 30.8 (9-61) 30.8 (9-61) 36.4 (11-69) 0.0 (0-28) 9.1 (0-41) 27.3 (6-61)Slovenia 232/232/232 15.5 (11-21) 0.4 (0-2) 17.2 (13-23) 9.1 (6-14) 10.8 (7-15) 6.5 (4-10)Spain 862/862/862 29.8 (27-33) 29.8 (27-33) 26.7 (24-30) 12.6 (10-15) 9.5 (8-12) 17.2 (15-20)Sweden 960/955/907 3.8 (3-5) 2.3 (1-3) 4.0 (3-5) 2.2 (1-3) 2.5 (2-4) 1.7 (1-3)United Kingdom 1 336/1 289/1 189 3.1 (2-4) 0.7 (0-1) 4.7 (4-6) 1.3 (1-2) 2.9 (2-4) 1.7 (1-3)

24
SURVEILLANCE REPORTAntimicrobial resistance surveillance in Europe 2010
non-susceptibility to penicillin in serogroups 19, 9, 14, 23; and single non-susceptibility to macrolides in serogroups 19, 1, 14, 33, 6, 15, 9, 23, 7, 11, 10, and 3 (Figure 5.7, Table 5.2).
5.1.4 Conclusions
In 2010, the proportion of S. pneumoniae isolates that were non-susceptible to penicillin remained generally stable in Europe with two countries reporting increasing trends and five reporting decreasing trends. Thirteen of 27 countries reported proportions of non-susceptibility below 10 %. The proportion of S. pneumoniae non-susceptible to macrolides declined significantly in five countries while one country had an increasing trend. Nevertheless, 10 of 27 countries reported proportions
of non-susceptibility below 10 %. The non-susceptibility to both penicillin and macrolides was above 10 % in 19 countries out of 27. The lowest proportions of S. pneu-moniae non-susceptible to penicillin and/or macrolides were reported by countries of central and northern Europe, with Finland as the only northern exception.
So far, the serogroup data reported to EARS-Net should not be regarded as representative for Europe in gen-eral; only six countries reported 2 852 S. pneumoniae isolates with serogroup identification. The serogroup distribution reported in 2010 is similar to the previous year. Most non-susceptible isolates belong to few sero-groups, especially serogroups 1, 19, 7 and 3.
Figure 5.2: Streptococcus pneumoniae: proportion of invasive isolates non-susceptible to macrolides in 2010
LuxembourgLiechtenstein
Malta
Non-visible countries
toto
No data reported or less than 10 isolatesNot included
toto
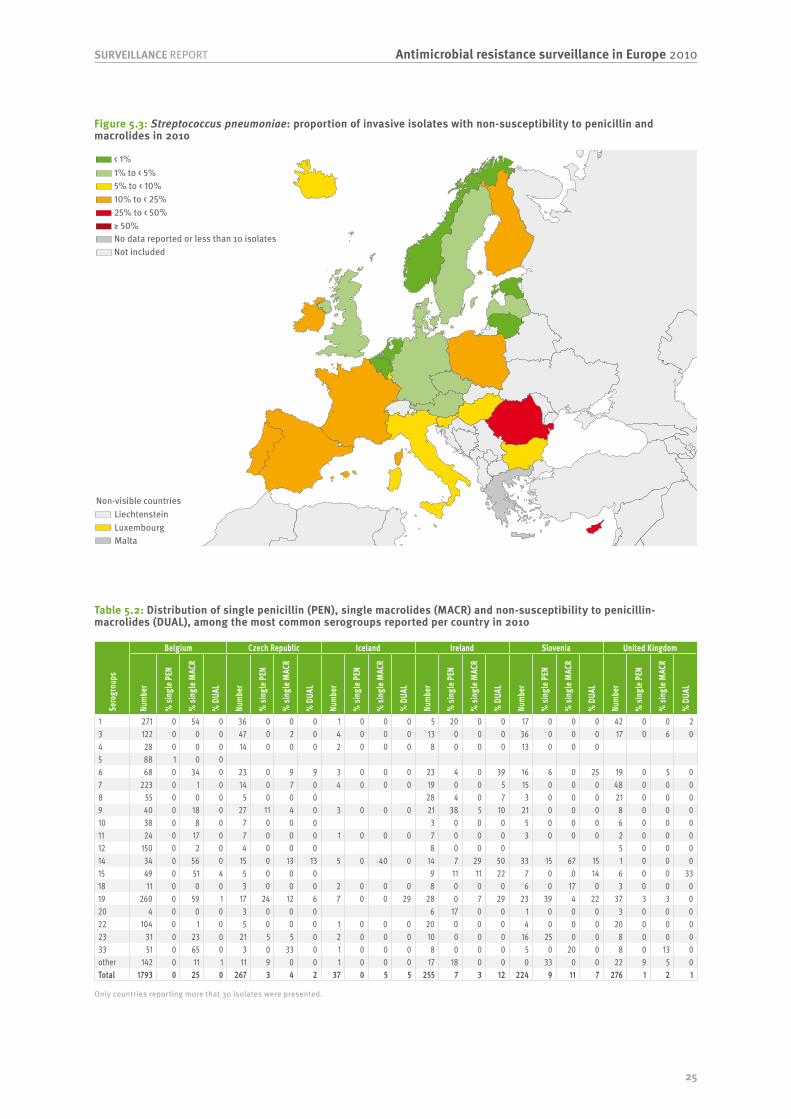
25
Antimicrobial resistance surveillance in Europe 2010SURVEILLANCE REPORT
Figure 5.3: Streptococcus pneumoniae: proportion of invasive isolates with non-susceptibility to penicillin and macrolides in 2010
LuxembourgLiechtenstein
Malta
toto
No data reported or less than 10 isolatesNot included
toto
Non-visible countries
Table 5.2: Distribution of single penicillin (PEN), single macrolides (MACR) and non-susceptibility to penicillin-macrolides (DUAL), among the most common serogroups reported per country in 2010
Sero
grou
ps
Belgium Czech Republic Iceland Ireland Slovenia United Kingdom
Numb
er
% si
ngle
PEN
% si
ngle
MAC
R
% D
UAL
Numb
er
% si
ngle
PEN
% si
ngle
MAC
R
% D
UAL
Numb
er
% si
ngle
PEN
% si
ngle
MAC
R
% D
UAL
Numb
er
% si
ngle
PEN
% si
ngle
MAC
R
% D
UAL
Numb
er
% si
ngle
PEN
% si
ngle
MAC
R
% D
UAL
Numb
er
% si
ngle
PEN
% si
ngle
MAC
R
% D
UAL
1 271 0 54 0 36 0 0 0 1 0 0 0 5 20 0 0 17 0 0 0 42 0 0 23 122 0 0 0 47 0 2 0 4 0 0 0 13 0 0 0 36 0 0 0 17 0 6 04 28 0 0 0 14 0 0 0 2 0 0 0 8 0 0 0 13 0 0 05 88 1 0 06 68 0 34 0 23 0 9 9 3 0 0 0 23 4 0 39 16 6 0 25 19 0 5 07 223 0 1 0 14 0 7 0 4 0 0 0 19 0 0 5 15 0 0 0 48 0 0 08 55 0 0 0 5 0 0 0 28 4 0 7 3 0 0 0 21 0 0 09 40 0 18 0 27 11 4 0 3 0 0 0 21 38 5 10 21 0 0 0 8 0 0 010 38 0 8 0 7 0 0 0 3 0 0 0 5 0 0 0 6 0 0 011 24 0 17 0 7 0 0 0 1 0 0 0 7 0 0 0 3 0 0 0 2 0 0 012 150 0 2 0 4 0 0 0 8 0 0 0 5 0 0 014 34 0 56 0 15 0 13 13 5 0 40 0 14 7 29 50 33 15 67 15 1 0 0 015 49 0 51 4 5 0 0 0 9 11 11 22 7 0 0 14 6 0 0 3318 11 0 0 0 3 0 0 0 2 0 0 0 8 0 0 0 6 0 17 0 3 0 0 019 260 0 59 1 17 24 12 6 7 0 0 29 28 0 7 29 23 39 4 22 37 3 3 020 4 0 0 0 3 0 0 0 6 17 0 0 1 0 0 0 3 0 0 022 104 0 1 0 5 0 0 0 1 0 0 0 20 0 0 0 4 0 0 0 20 0 0 023 31 0 23 0 21 5 5 0 2 0 0 0 10 0 0 0 16 25 0 0 8 0 0 033 51 0 65 0 3 0 33 0 1 0 0 0 8 0 0 0 5 0 20 0 8 0 13 0other 142 0 11 1 11 9 0 0 1 0 0 0 17 18 0 0 0 33 0 0 22 9 5 0Total 1793 0 25 0 267 3 4 2 37 0 5 5 255 7 3 12 224 9 11 7 276 1 2 1
Only countries reporting more that 30 isolates were presented.

26
SURVEILLANCE REPORTAntimicrobial resistance surveillance in Europe 2010
Figure 5.4: Streptococcus pneumoniae: trends of non-susceptibility to penicillin by country, 2007–2010
Only countries that reported 20 isolates or more per year were included. The symbols > and < indicate significant increasing and decreasing trends, respectively. The asterisks indicate significant trends in the overall data that were not supported by data from laboratories consistently reporting for all four years.
0 5 10 15 20 25 30 35 40
ES (>*)
FR (<)
BG
IE
SI
HU (<)
PT
FI
LU
LT
IT (<*)
IS
CZ
AT
SE
DE
NO (>*)
DK
UK (<*)
NL
EE
BE (<)
Coun
try c
ode
% penicilllin non-susceptibility
2008
2009
2010
2007
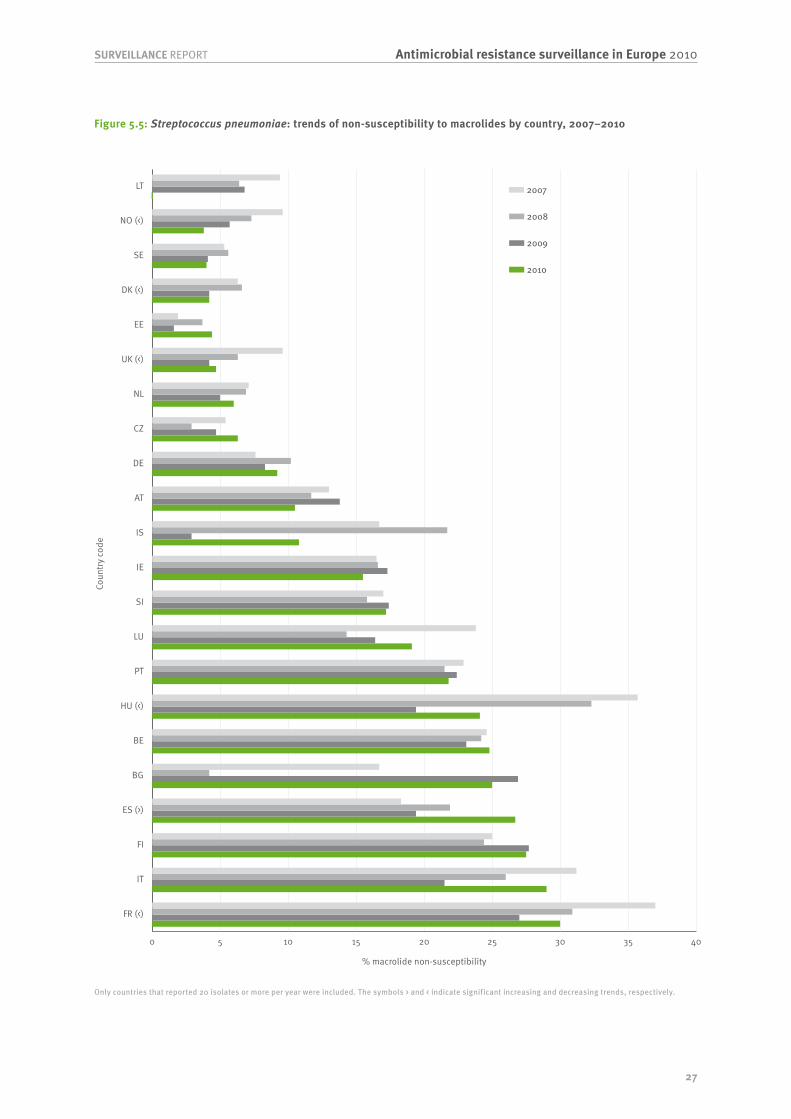
27
Antimicrobial resistance surveillance in Europe 2010SURVEILLANCE REPORT
Figure 5.5: Streptococcus pneumoniae: trends of non-susceptibility to macrolides by country, 2007–2010
Only countries that reported 20 isolates or more per year were included. The symbols > and < indicate significant increasing and decreasing trends, respectively.
0 5 10 15 20 25 30 35 40
FR (<)
IT
FI
ES (>)
BG
BE
HU (<)
PT
LU
SI
IE
IS
AT
DE
CZ
NL
UK (<)
EE
DK (<)
SE
NO (<)
LT
Coun
try c
ode
% macrolide non-susceptibility
2008
2009
2010
2007
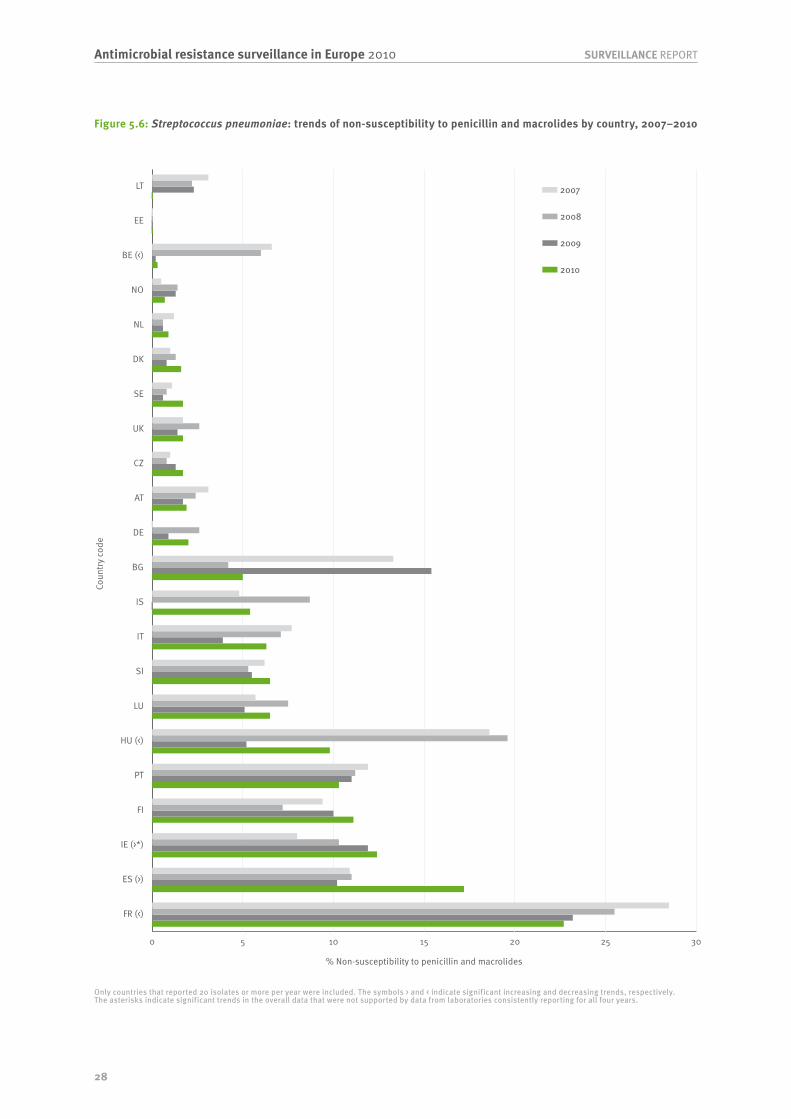
28
SURVEILLANCE REPORTAntimicrobial resistance surveillance in Europe 2010
Figure 5.6: Streptococcus pneumoniae: trends of non-susceptibility to penicillin and macrolides by country, 2007–2010
Only countries that reported 20 isolates or more per year were included. The symbols > and < indicate significant increasing and decreasing trends, respectively.The asterisks indicate significant trends in the overall data that were not supported by data from laboratories consistently reporting for all four years.
0 5 10 15 20 25 30
FR (<)
ES (>)
IE (>*)
FI
PT
HU (<)
LU
SI
IT
IS
BG
DE
AT
CZ
UK
SE
DK
NL
NO
BE (<)
EE
LT
Coun
try c
ode
% Non-susceptibility to penicillin and macrolides
2008
2009
2010
2007
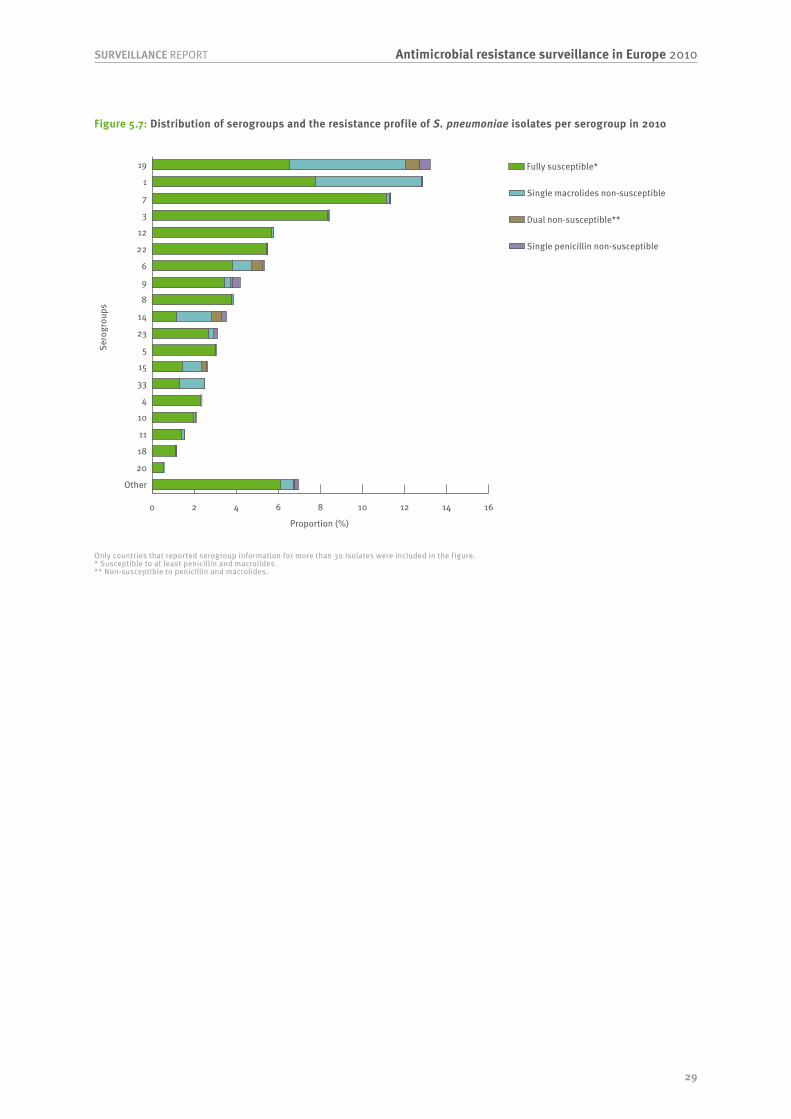
29
Antimicrobial resistance surveillance in Europe 2010SURVEILLANCE REPORT
Figure 5.7: Distribution of serogroups and the resistance profile of S. pneumoniae isolates per serogroup in 2010
Only countries that reported serogroup information for more than 30 isolates were included in the figure.* Susceptible to at least penicillin and macrolides.** Non-susceptible to penicillin and macrolides.
0 2 4 6 8 10 12 14 16
Other
20
18
11
10
4
33
15
5
23
14
8
9
6
22
12
3
7
1
19
Single macrolides non-susceptible
Dual non-susceptible**
Single penicillin non-susceptible
Fully susceptible*
Sero
grou
ps
Proportion (%)

30
SURVEILLANCE REPORTAntimicrobial resistance surveillance in Europe 2010
5.2 Staphylococcus aureus5.2.1 Clinical and epidemiological importance
Staphylococcus aureus is a Gram-positive bacterium that colonises the skin of about 30 % of healthy humans. Although mainly a harmless coloniser, S. aureus can cause severe infection. Its oxacillin-resistant form (meticillin-resistant S. aureus, MRSA) is the most impor-tant cause of antibiotic-resistant healthcare-associated infections worldwide. Since healthcare-associated MRSA infections add to the number of infections caused by meticillin-susceptible S. aureus, a high incidence of MRSA adds to the overall burden of infections caused by this species in hospitals. Moreover, infections with MRSA may result in prolonged hospital stay and in higher mortality rates, owing mainly to the increased toxicity and limited effectiveness of alternative treat-ment regimens. MRSA is currently the most commonly identified antibiotic-resistant pathogen in hospitals in many parts of the world, including Europe, the Americas, North Africa and the Middle- and Far East.
5.2.2 Resistance mechanisms
S. aureus acquires resistance to meticillin and all other beta-lactam antibiotics through expression of the exogenous mecA gene, that codes for a variant penicillin-binding protein PBP2’ (PBP2a) with low affin-ity to beta-lactams, thus preventing the drug-induced inhibition of cell wall synthesis. The level of meticillin resistance, as defined by MIC, depends on the amount of PBP2’ production which is influenced by various genetic factors. Resistance levels of mecA-positive strains can thus range from phenotypically susceptible to highly resistant. Upon challenge with beta-lactam antibiotics, a population of a heterogeneously resistant MRSA strain may quickly be outgrown by a subpopulation of highly resistant variants.
5.2.3 Results
Beta-lactams
• Twenty-eight countries reported 31 854 isolates of which 5 555 (17.4 %) were identified as meticillin-resistant S. aureus (MRSA), with proportions ranging from 0.5 % to 52.2 % in the reporting countries.
• The proportion of isolates that were found to be MRSA was below 1 % in three countries, 1–5 % in four coun-tries, 5–10 % in one country, 10–25 % in 12 countries, 25–50 % in seven countries and above 50 % in one country (Figure 5.8, Table 5.3).
• Trends for the period 2007–2010 were calculated for 28 countries (Figure 5.9). Significant decreasing trends were observed for seven countries, even when considering only data from laboratories consistently reporting throughout all four years (Figure 5.9). In 2010, these seven countries reported the following proportions of MRSA: 0–5 % in one country (Estonia), 5–10 % in one country case (Austria), 10–25 % in three countries cases (the UK, France, and Ireland) and 25–50 % in two countries cases (Cyprus and Greece).
• Four countries (Italy, Hungary, Germany, and Slovenia) reported a significant increasing trend of MRSA pro-portions (Figure 5.9). The increasing trend remained significant for three of these countries (Hungary, Germany, and Slovenia) when looking only at data from laboratories that reported consistently through-out the 2007–2010 period.
Rifampin
• Twenty-seven countries reported 22 949 isolates of which 196 (0.9 %) were identified as resistant to rifampin, and 22 of these countries reported at least one resistant isolate. Sixty-five percent of the rifampin-resistant isolates were also MRSA. The pro-portion of rifampin resistance was 3.0 % among the MRSA isolates and 0.4 % among the MSSA isolates.
• The proportion of isolates that were resistant was below 1 % in 21 countries, 1–5 % in four countries, 5–10 % in one country, 10–25 % in one country (Table 5.3).
Fluoroquinolones
• Twenty-six countries reported susceptibility data for at least one fluoroquinolone in 20 683 isolates. Among them, 4 825 (23.3 %) were non-susceptible to fluoroquinolones. Eighteen percent (3 747/20 558) of all S. aureus isolates reported were non-susceptible to both meticillin and fluoroquinolones. Eighty-nine percent of the MRSA (3 747/4 203) were resistant to fluoroquinolones.
• Various fluoroquinolones were tested: ciprofloxacin (n=13 829), levofloxacin (n=6 484), norfloxacin (n=364). The number of isolates tested against at least one of these agents was 20 683.
Linezolid
• Twenty-six countries reported susceptibility data for 18 527 isolates of S. aureus, of which 23 (0.1 %) were non-susceptible.
5.2.4 Conclusions
The proportion of S. aureus isolates found to be MRSA is stabilising or decreasing in most European countries. Seven countries reported decreasing trends while four reported an increasing trend. The countries showing a more evident and sustained decrease of MRSA pro-portion are Austria, Cyprus, Estonia, France, Ireland, Latvia and the UK. Although these observations provide reasons for optimism, MRSA remains a public health pri-ority, as the proportion of MRSA is still above 25 % in eight out of 28 countries, mainly in southern and east-ern Europe. The occurrence of resistance to rifampin, which is recommended in combination with other anti-microbials to treat various staphylococcal infections, remains low in most European countries.
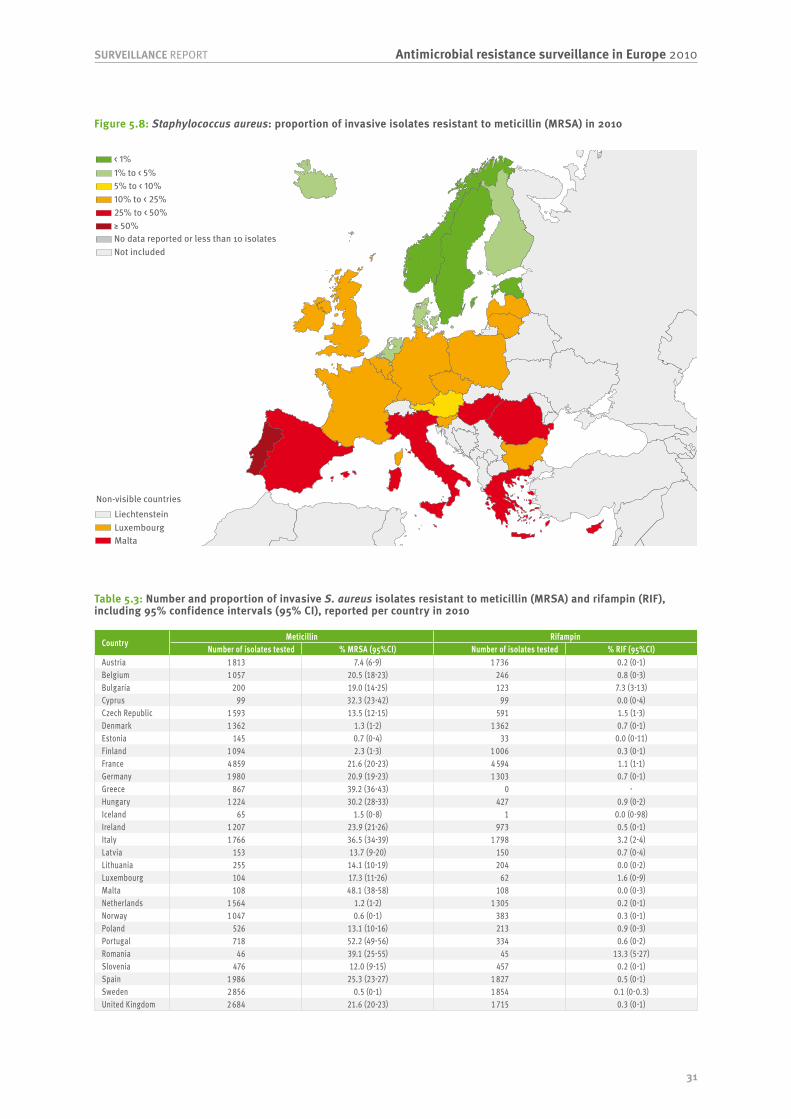
31
Antimicrobial resistance surveillance in Europe 2010SURVEILLANCE REPORT
Figure 5.8: Staphylococcus aureus: proportion of invasive isolates resistant to meticillin (MRSA) in 2010
LuxembourgLiechtenstein
Malta
Non-visible countries
toto
No data reported or less than 10 isolatesNot included
toto
Table 5.3: Number and proportion of invasive S. aureus isolates resistant to meticillin (MRSA) and rifampin (RIF), including 95% confidence intervals (95% CI), reported per country in 2010
CountryMeticillin Rifampin
Number of isolates tested % MRSA (95%CI) Number of isolates tested % RIF (95%CI)Austria 1 813 7.4 (6-9) 1 736 0.2 (0-1)Belgium 1 057 20.5 (18-23) 246 0.8 (0-3)Bulgaria 200 19.0 (14-25) 123 7.3 (3-13)Cyprus 99 32.3 (23-42) 99 0.0 (0-4)Czech Republic 1 593 13.5 (12-15) 591 1.5 (1-3)Denmark 1 362 1.3 (1-2) 1 362 0.7 (0-1)Estonia 145 0.7 (0-4) 33 0.0 (0-11)Finland 1 094 2.3 (1-3) 1 006 0.3 (0-1)France 4 859 21.6 (20-23) 4 594 1.1 (1-1)Germany 1 980 20.9 (19-23) 1 303 0.7 (0-1)Greece 867 39.2 (36-43) 0 -Hungary 1 224 30.2 (28-33) 427 0.9 (0-2)Iceland 65 1.5 (0-8) 1 0.0 (0-98)Ireland 1 207 23.9 (21-26) 973 0.5 (0-1)Italy 1 766 36.5 (34-39) 1 798 3.2 (2-4)Latvia 153 13.7 (9-20) 150 0.7 (0-4)Lithuania 255 14.1 (10-19) 204 0.0 (0-2)Luxembourg 104 17.3 (11-26) 62 1.6 (0-9)Malta 108 48.1 (38-58) 108 0.0 (0-3)Netherlands 1 564 1.2 (1-2) 1 305 0.2 (0-1)Norway 1 047 0.6 (0-1) 383 0.3 (0-1)Poland 526 13.1 (10-16) 213 0.9 (0-3)Portugal 718 52.2 (49-56) 334 0.6 (0-2)Romania 46 39.1 (25-55) 45 13.3 (5-27)Slovenia 476 12.0 (9-15) 457 0.2 (0-1)Spain 1 986 25.3 (23-27) 1 827 0.5 (0-1)Sweden 2 856 0.5 (0-1) 1 854 0.1 (0-0.3)United Kingdom 2 684 21.6 (20-23) 1 715 0.3 (0-1)
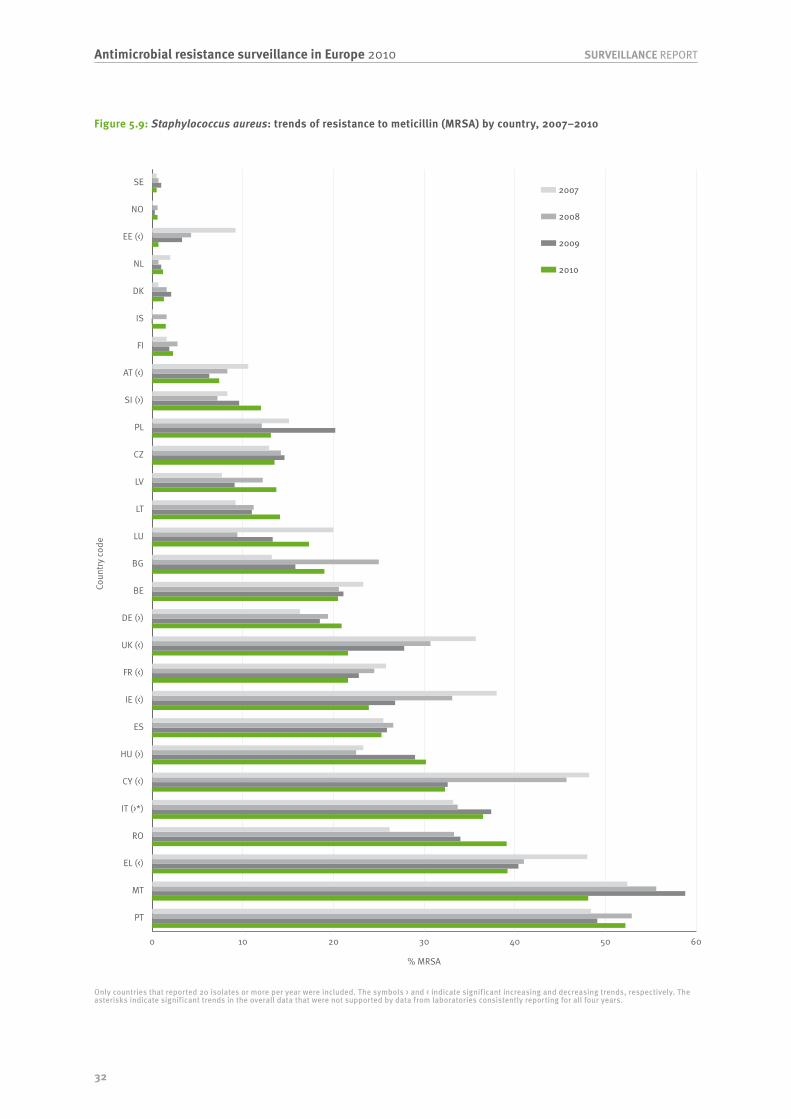
32
SURVEILLANCE REPORTAntimicrobial resistance surveillance in Europe 2010
Figure 5.9: Staphylococcus aureus: trends of resistance to meticillin (MRSA) by country, 2007–2010
Only countries that reported 20 isolates or more per year were included. The symbols > and < indicate significant increasing and decreasing trends, respectively. The asterisks indicate significant trends in the overall data that were not supported by data from laboratories consistently reporting for all four years.
0 10 20 30 40 50 60
PT
MT
EL (<)
RO
IT (>*)
CY (<)
HU (>)
ES
IE (<)
FR (<)
UK (<)
DE (>)
BE
BG
LU
LT
LV
CZ
PL
SI (>)
AT (<)
FI
IS
DK
NL
EE (<)
NO
SE
Coun
try c
ode
% MRSA
2008
2009
2010
2007

33
Antimicrobial resistance surveillance in Europe 2010SURVEILLANCE REPORT
5.3 Enterococci5.3.1 Clinical and epidemiological importance
Enterococci belong to the normal bacterial flora of the gastrointestinal tract of humans, other mammals, birds and reptiles. Enterococci are regarded harmless commensals, and are even believed to have positive effects on a number of gastrointestinal and systemic conditions. However, when the commensal relation-ship with the host is disrupted, enterococci can cause invasive diseases. Recently, the recognition of high risk clones such as those of the polyclonal subcluster CC17 in Enterococcus faecium, suggests that some par-ticular strains can act as true pathogens, and not only as opportunistic commensals. Enterococci can cause a variety of clinical syndromes, including endocardi-tis, bacteraemia, meningitis, wound and urinary tract infections and are associated with peritonitis and intra-abdominal abscesses. In the United States, three to four nosocomial bloodstream infections per 10 000 hospital discharges are caused by enterococci, and contribute to patient mortality as well as additional hospital stay.
The vast majority (around 80 %) of clinical enterococcal infections in humans are caused by Enterococcus fae-calis, while E. faecium accounts for the majority of the remaining 20 %. Epidemiological data collected over the last two decades have documented the emergence of Enterococci as important nosocomial pathogens, exem-plified by the expansion of a major hospital-adapted polyclonal subcluster CC17 in E. faecium, and by CC2 and CC9 E. faecalis. The latter clones have even been isolated from farm animals. The emergence of particular clones and clonal complexes of E. faecalis and E. faecium was paralleled by increases in resistance to glycopeptides and high-level aminoglycosides. These two antimicro-bial groups represent the few remaining therapeutic options for treatment of human infections caused by E. faecium when resistance has emerged against penicil-lins. Besides the fact that infections caused by resistant enterococci are difficult to treat, they are highly tena-cious and thus easily disseminate in the hospital setting.
5.3.2 Resistance mechanisms
Enterococci are intrinsically resistant to a broad range of antibiotics including cephalosporins, sulphonamides and low concentrations of aminoglycosides. Patient safety in hospitals is challenged by the ability of ente-rococci to acquire additional resistance through the transfer of plasmids and transposons and recombination or mutation.
Beta-lactam antibiotics – By nature, enterococci have low susceptibility to many beta-lactam antibiotics as a consequence of their low-affinity PBPs. Two possible mechanisms of resistance of enterococci to beta-lactams have been reported: the production of beta-lactamase, which is an extremely rare finding; and the overproduc-tion and modification of PBPs, particularly PBP5, that causes high-level penicillin resistance in E. faecium. Complete penicillin resistance in E. faecalis is cur-rently absent; therefore, the first choice for treatment
of infections caused by this microorganism is still an aminopenicillin such as ampicillin. In E. faecium, amp-icillin-resistance has increased significantly during the last years not the least due to the wide dissemination of ampicillin-resistant strains belonging to the polyclonal subcluster CC17.
Aminoglycosides – In addition to the intrinsic mecha-nism of low-level resistance, which causes a low uptake of the drug, enterococci have acquired genes conferring high-level resistance to aminoglycosides. High-level resistance to streptomycin can be mediated by single mutations within a protein of the 30S ribosomal subu-nit, the target of aminoglycoside activity. In addition, different aminoglycoside-modifying enzymes have been identified, targeting eight different aminoglycosides.
Glycopeptides – Vancomycin resistance in enterococci was first encountered in France and England but showed the most dramatic increase in the United States and was attributed to the widespread use of vancomycin in US hospitals. Whereas vancomycin consumption was less pronounced in Europe, a closely related glycopep-tide, avoparcin, was widely used as growth promoter in animal husbandry from the late-1970s until it was banned in the EU by 1998. Glycopeptide resistance is due to the synthesis of modified cell wall precursors that show a decreased affinity for glycopeptides. Six phenotypes have been identified of which two have clin-ical relevance: VanA, with high-level resistance to both vancomycin and teicoplanin; and VanB, with a variable level of resistance to only vancomycin. The VanA and VanB phenotypes, mostly found among E. faecalis and E. faecium, may be transferred by plasmids and through conjugative transposition.
5.3.3 Results E. faecalis
High-level aminoglycosides
• Twenty-five countries reported 7 533 isolates of which 2 600 (34.5 %) had high-level resistance to gentamicin.
• The majority of the countries (21 of 25) reported resist-ant proportions between 50 % and 20 %. Belgium, Iceland, Sweden and France reported proportions below 20 % and only one country (Hungary) reported resistance proportions above 50 % (Figure 5.10 and Table 5.4).
• Twenty of 26 countries have reported more than 20 isolates per year since 2007 and were included in the trend analysis for the period 2007–2010. During the past four years, a significant increase was observed only for Italy. The trend for Italy remained significant when including only data from laboratories reporting consistently for all four years (Figure 5.11).
• Five countries (Germany, Greece, Portugal, Cyprus and Belgium) reported significant decreasing trends of high-level aminoglycoside resistance. These trends were, however, significant only for Greece, Cyprus and Belgium when considering data from laboratories reporting consistently for all four years (Figure 5.11).

34
SURVEILLANCE REPORTAntimicrobial resistance surveillance in Europe 2010
5.3.4 Results E. faecium
Vancomycin
• Twenty-eight countries reported 5 577 isolates of which 410 (7.4 %) were resistant to vancomycin. Only one country (Luxembourg) reported fewer than 10 iso-lates (thus it is not shown in Figure 5.12).
• One country reported resistance proportions above 25 % (Ireland, with 38.7 %) and five countries reported resistant proportions between 10 % and 25 %, while the majority of countries (22 of 28) reported resistant proportions below 10 %. Eight of these countries even reported below 1 % (Sweden, Cyprus, Estonia, Bulgaria, Finland, Malta, Romania and the Netherlands) (Figure 5.12 and Table 5.4).
• Twenty of 28 countries have reported more than 20 isolates per year since 2007 and were included in the trend analysis for the period 2007–2010. During the past four years, a significant increase was observed only for Latvia. However, the increasing trend was not significant when considering data from laboratories reporting consistently for all four years (Figure 5.13).
• Four countries (Greece, the UK, Germany, and Italy) reported significant decreasing trends of vancomycin resistance. Considering data from laboratories report-ing consistently for all four years, the decreasing trend was only significant for Greece and Italy (Figure 5.13).
5.3.5 Conclusions
High-level aminoglycoside resistance in E. faecalis seems stable in Europe but at a relatively high level of resist-ance. The majority of countries reported proportions of resistant isolates between 25 % and 50 %. However, a consistent decrease was reported by Germany, Greece, Portugal, Cyprus and Belgium. Only for Italy was a sig-nificantly increasing trend observed.
The occurrence of vancomycin resistance in E. faecium seems to continue to decrease in Europe. In some countries (Greece, Germany, Italy and UK) the efforts to control glycopeptide-resistant enterococci are obvi-ously successful and resulting in a continuous decrease of proportions of resistant isolates, only one country reported resistance above 25 %, while most of the coun-tries reported resistant proportions below 5 %.
Figure 5.10: Enterococcus faecalis: proportion of invasive isolates with high-level resistance to aminoglycosides in 2010
LuxembourgLiechtenstein
Malta
Non-visible countries
toto
No data reported or less than 10 isolatesNot included
toto
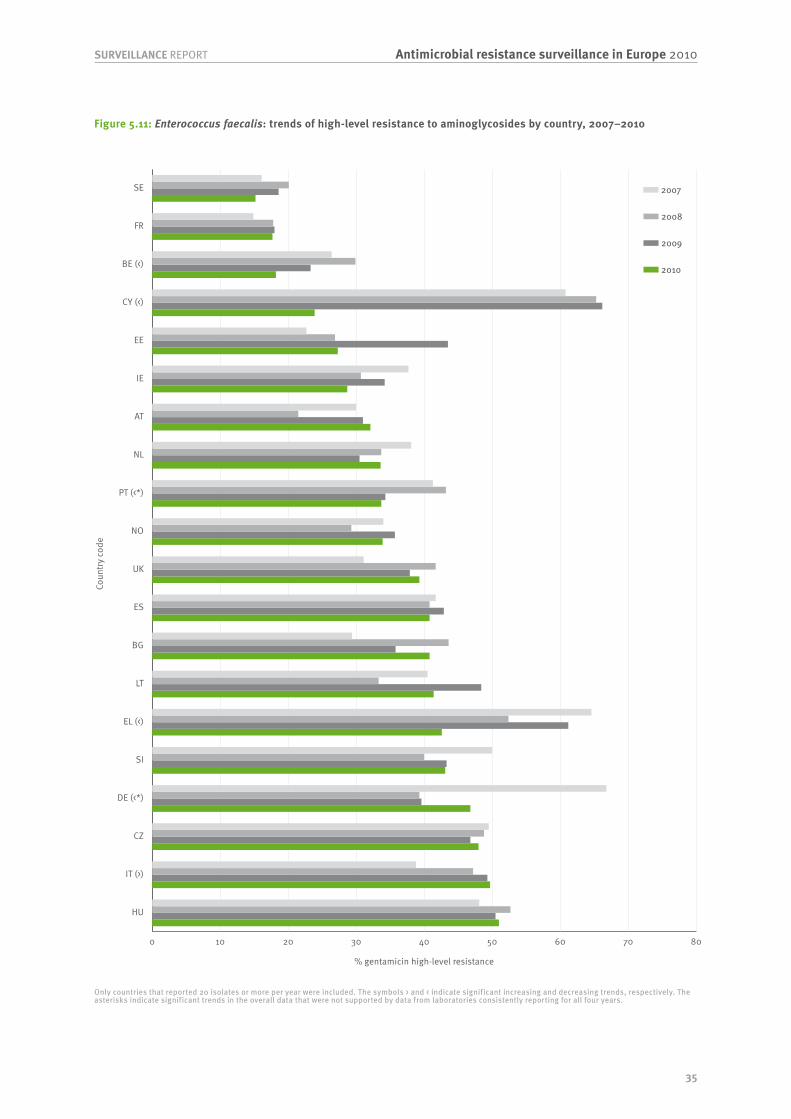
35
Antimicrobial resistance surveillance in Europe 2010SURVEILLANCE REPORT
Figure 5.11: Enterococcus faecalis: trends of high-level resistance to aminoglycosides by country, 2007–2010
Only countries that reported 20 isolates or more per year were included. The symbols > and < indicate significant increasing and decreasing trends, respectively. The asterisks indicate significant trends in the overall data that were not supported by data from laboratories consistently reporting for all four years.
0 10 20 30 40 50 60 70 80
HU
IT (>)
CZ
DE (<*)
SI
EL (<)
LT
BG
ES
UK
NO
PT (<*)
NL
AT
IE
EE
CY (<)
BE (<)
FR
SE
Coun
try c
ode
% gentamicin high-level resistance
2008
2009
2010
2007

36
SURVEILLANCE REPORTAntimicrobial resistance surveillance in Europe 2010
Figure 5.12: Enterococcus faecium: proportion of invasive isolates resistant to vancomycin in 2010
LuxembourgLiechtenstein
Malta
toto
No data reported or less than 10 isolatesNot included
toto
Non-visible countries
Table 5.4: Number of invasive E. faecalis and E. faecium isolates and proportion of high-level aminoglycoside-resistant E. faecalis and vancomycin-resistant E. faecium (%R), including 95% confidence intervals (95% CI), reported per country in 2010
CountryHigh-level aminoglycoside resistant E. faecalis Vancomycin-resistant E. faecium
Number of isolates % R (95% CI) Number of isolates % R (95% CI)Austria 312 32.1 (27-38) 354 4.0 (2-7)Belgium 187 18.2 (13-24) 79 2.5 (0-9)Bulgaria 76 40.8 (30-53) 23 0.0 (0-15)Cyprus 67 23.9 (14-36) 23 0.0 (0-15)Czech Republic 571 48.0 (44-52) 188 4.8 (2-9)Denmark 44 36.4 (22-52) 501 1.8 (1-3)Estonia 22 27.3 (11-50) 23 0.0 (0-15)Finland 0 - 239 0.0 (0-2)France 1 409 17.7 (16-20) 540 1.1 (0-2)Germany 457 46.8 (42-52) 437 8.5 (6-11)Greece 620 42.6 (39-47) 435 22.5 (19-27)Hungary 486 51.0 (46-56) 105 1.9 (0-7)Iceland 15 13.3 (2-40) 16 6.3 (0-30)Ireland 268 28.7 (23-35) 382 38.7 (34-44)Italy 380 49.7 (45-55) 412 3.9 (2-6)Latvia 38 47.4 (31-64) 23 13.0 (3-34)Lithuania 29 41.4 (24-61) 24 8.3 (1-27)Luxembourg 4 25.0 (1-81) 9 11.1 (0-48)Malta 0 - 12 0.0 (0-26)Netherlands 298 33.6 (28-39) 365 0.5 (0-2)Norway 218 33.9 (28-41) 135 1.5 (0-5)Poland 158 36.1 (29-44) 102 7.8 (3-15)Portugal 184 33.7 (27-41) 67 23.9 (14-36)Romania 0 - 10 0.0 (0-31)Slovenia 137 43.1 (35-52) 59 1.7 (0-9)Spain 959 40.8 (38-44) 471 1.5 (1-3)Sweden 533 15.2 (12-19) 293 0.0 (0-1)United Kingdom 61 39.3 (27-53) 250 10.4 (7-15)

37
Antimicrobial resistance surveillance in Europe 2010SURVEILLANCE REPORT
Figure 5.13: Enterococcus faecium: trends of resistance to vancomycin by country 2007–2010
Only countries that reported 20 isolates or more per year were included. The symbols > and < indicate significant increasing and decreasing trends, respectively. The asterisks indicate significant trends in the overall data that were not supported by data from laboratories consistently reporting for all four years.** Data for Ireland showed a significant increasing trend only for data from laboratories which reported continuously for the last four years.
0 5 10 15 20 25 30 35 40
IE**
PT
EL (<)
LV (>*)
UK (<*)
DE (<*)
CZ
AT
IT (<)
BE
HU
DK
SI
ES
NO
FR
NL
FI
SE
EE
Coun
try c
ode
% vancomycin resistance
2008
2009
2010
2007
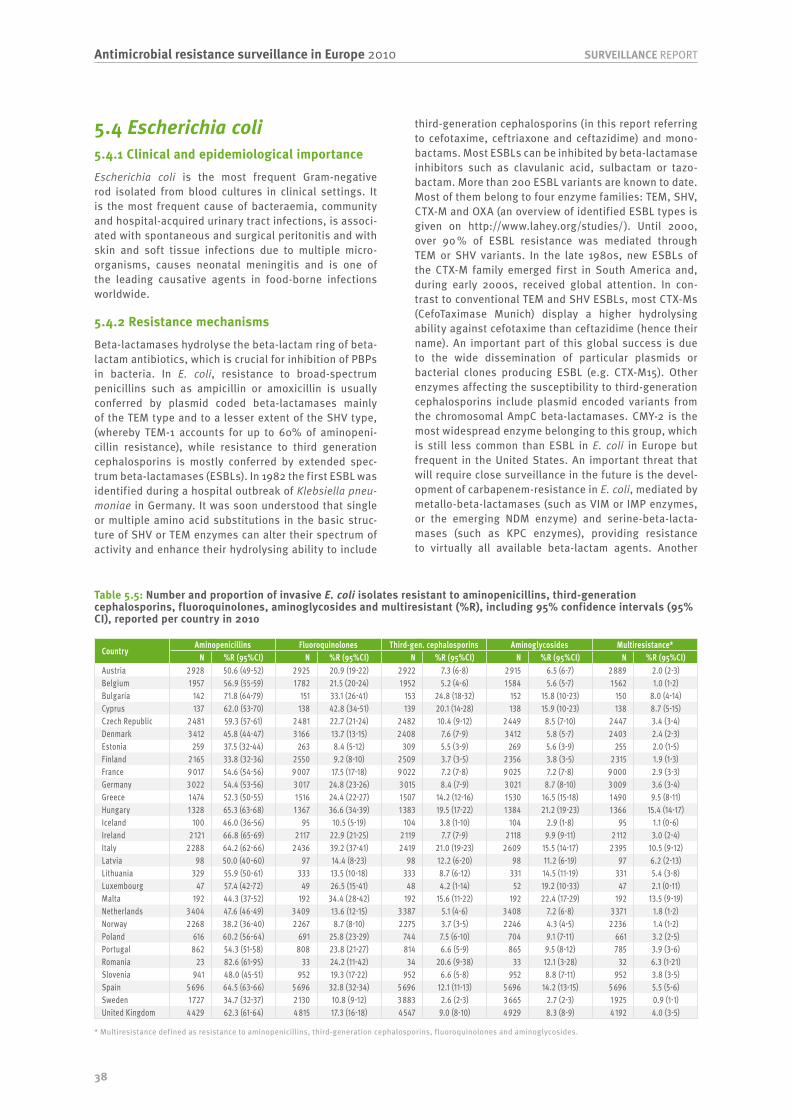
38
SURVEILLANCE REPORTAntimicrobial resistance surveillance in Europe 2010
5.4 Escherichia coli5.4.1 Clinical and epidemiological importance
Escherichia coli is the most frequent Gram-negative rod isolated from blood cultures in clinical settings. It is the most frequent cause of bacteraemia, community and hospital-acquired urinary tract infections, is associ-ated with spontaneous and surgical peritonitis and with skin and soft tissue infections due to multiple micro-organisms, causes neonatal meningitis and is one of the leading causative agents in food-borne infections worldwide.
5.4.2 Resistance mechanisms
Beta-lactamases hydrolyse the beta-lactam ring of beta-lactam antibiotics, which is crucial for inhibition of PBPs in bacteria. In E. coli, resistance to broad-spectrum penicillins such as ampicillin or amoxicillin is usually conferred by plasmid coded beta-lactamases mainly of the TEM type and to a lesser extent of the SHV type, (whereby TEM-1 accounts for up to 60% of aminopeni-cillin resistance), while resistance to third generation cephalosporins is mostly conferred by extended spec-trum beta-lactamases (ESBLs). In 1982 the first ESBL was identified during a hospital outbreak of Klebsiella pneu-moniae in Germany. It was soon understood that single or multiple amino acid substitutions in the basic struc-ture of SHV or TEM enzymes can alter their spectrum of activity and enhance their hydrolysing ability to include
third-generation cephalosporins (in this report referring to cefotaxime, ceftriaxone and ceftazidime) and mono-bactams. Most ESBLs can be inhibited by beta-lactamase inhibitors such as clavulanic acid, sulbactam or tazo-bactam. More than 200 ESBL variants are known to date. Most of them belong to four enzyme families: TEM, SHV, CTX-M and OXA (an overview of identified ESBL types is given on http://www.lahey.org/studies/). Until 2000, over 90 % of ESBL resistance was mediated through TEM or SHV variants. In the late 1980s, new ESBLs of the CTX-M family emerged first in South America and, during early 2000s, received global attention. In con-trast to conventional TEM and SHV ESBLs, most CTX-Ms (CefoTaximase Munich) display a higher hydrolysing ability against cefotaxime than ceftazidime (hence their name). An important part of this global success is due to the wide dissemination of particular plasmids or bacterial clones producing ESBL (e.g. CTX-M15). Other enzymes affecting the susceptibility to third-generation cephalosporins include plasmid encoded variants from the chromosomal AmpC beta-lactamases. CMY-2 is the most widespread enzyme belonging to this group, which is still less common than ESBL in E. coli in Europe but frequent in the United States. An important threat that will require close surveillance in the future is the devel-opment of carbapenem-resistance in E. coli, mediated by metallo-beta-lactamases (such as VIM or IMP enzymes, or the emerging NDM enzyme) and serine-beta-lacta-mases (such as KPC enzymes), providing resistance to virtually all available beta-lactam agents. Another
Table 5.5: Number and proportion of invasive E. coli isolates resistant to aminopenicillins, third-generation cephalosporins, fluoroquinolones, aminoglycosides and multiresistant (%R), including 95% confidence intervals (95% CI), reported per country in 2010
CountryAminopenicillins Fluoroquinolones Third-gen. cephalosporins Aminoglycosides Multiresistance*
N %R (95%CI) N %R (95%CI) N %R (95%CI) N %R (95%CI) N %R (95%CI)Austria 2 928 50.6 (49-52) 2 925 20.9 (19-22) 2 922 7.3 (6-8) 2 915 6.5 (6-7) 2 889 2.0 (2-3)Belgium 1 957 56.9 (55-59) 1 782 21.5 (20-24) 1 952 5.2 (4-6) 1 584 5.6 (5-7) 1 562 1.0 (1-2)Bulgaria 142 71.8 (64-79) 151 33.1 (26-41) 153 24.8 (18-32) 152 15.8 (10-23) 150 8.0 (4-14)Cyprus 137 62.0 (53-70) 138 42.8 (34-51) 139 20.1 (14-28) 138 15.9 (10-23) 138 8.7 (5-15)Czech Republic 2 481 59.3 (57-61) 2 481 22.7 (21-24) 2 482 10.4 (9-12) 2 449 8.5 (7-10) 2 447 3.4 (3-4)Denmark 3 412 45.8 (44-47) 3 166 13.7 (13-15) 2 408 7.6 (7-9) 3 412 5.8 (5-7) 2 403 2.4 (2-3)Estonia 259 37.5 (32-44) 263 8.4 (5-12) 309 5.5 (3-9) 269 5.6 (3-9) 255 2.0 (1-5)Finland 2 165 33.8 (32-36) 2 550 9.2 (8-10) 2 509 3.7 (3-5) 2 356 3.8 (3-5) 2 315 1.9 (1-3)France 9 017 54.6 (54-56) 9 007 17.5 (17-18) 9 022 7.2 (7-8) 9 025 7.2 (7-8) 9 000 2.9 (3-3)Germany 3 022 54.4 (53-56) 3 017 24.8 (23-26) 3 015 8.4 (7-9) 3 021 8.7 (8-10) 3 009 3.6 (3-4)Greece 1 474 52.3 (50-55) 1 516 24.4 (22-27) 1 507 14.2 (12-16) 1 530 16.5 (15-18) 1 490 9.5 (8-11)Hungary 1 328 65.3 (63-68) 1 367 36.6 (34-39) 1 383 19.5 (17-22) 1 384 21.2 (19-23) 1 366 15.4 (14-17)Iceland 100 46.0 (36-56) 95 10.5 (5-19) 104 3.8 (1-10) 104 2.9 (1-8) 95 1.1 (0-6)Ireland 2 121 66.8 (65-69) 2 117 22.9 (21-25) 2 119 7.7 (7-9) 2 118 9.9 (9-11) 2 112 3.0 (2-4)Italy 2 288 64.2 (62-66) 2 436 39.2 (37-41) 2 419 21.0 (19-23) 2 609 15.5 (14-17) 2 395 10.5 (9-12)Latvia 98 50.0 (40-60) 97 14.4 (8-23) 98 12.2 (6-20) 98 11.2 (6-19) 97 6.2 (2-13)Lithuania 329 55.9 (50-61) 333 13.5 (10-18) 333 8.7 (6-12) 331 14.5 (11-19) 331 5.4 (3-8)Luxembourg 47 57.4 (42-72) 49 26.5 (15-41) 48 4.2 (1-14) 52 19.2 (10-33) 47 2.1 (0-11)Malta 192 44.3 (37-52) 192 34.4 (28-42) 192 15.6 (11-22) 192 22.4 (17-29) 192 13.5 (9-19)Netherlands 3 404 47.6 (46-49) 3 409 13.6 (12-15) 3 387 5.1 (4-6) 3 408 7.2 (6-8) 3 371 1.8 (1-2)Norway 2 268 38.2 (36-40) 2 267 8.7 (8-10) 2 275 3.7 (3-5) 2 246 4.3 (4-5) 2 236 1.4 (1-2)Poland 616 60.2 (56-64) 691 25.8 (23-29) 744 7.5 (6-10) 704 9.1 (7-11) 661 3.2 (2-5)Portugal 862 54.3 (51-58) 808 23.8 (21-27) 814 6.6 (5-9) 865 9.5 (8-12) 785 3.9 (3-6)Romania 23 82.6 (61-95) 33 24.2 (11-42) 34 20.6 (9-38) 33 12.1 (3-28) 32 6.3 (1-21)Slovenia 941 48.0 (45-51) 952 19.3 (17-22) 952 6.6 (5-8) 952 8.8 (7-11) 952 3.8 (3-5)Spain 5 696 64.5 (63-66) 5 696 32.8 (32-34) 5 696 12.1 (11-13) 5 696 14.2 (13-15) 5 696 5.5 (5-6)Sweden 1 727 34.7 (32-37) 2 130 10.8 (9-12) 3 883 2.6 (2-3) 3 665 2.7 (2-3) 1 925 0.9 (1-1)United Kingdom 4 429 62.3 (61-64) 4 815 17.3 (16-18) 4 547 9.0 (8-10) 4 929 8.3 (8-9) 4 192 4.0 (3-5)
* Multiresistance defined as resistance to aminopenicillins, third-generation cephalosporins, fluoroquinolones and aminoglycosides.

39
Antimicrobial resistance surveillance in Europe 2010SURVEILLANCE REPORT
growing family of ESBLs is the OXA- type enzymes that confer resistance to ampicillin and cephalothin and are characterised by their high hydrolytic activity against oxacillin and cloxacillin and the fact that they are poorly inhibited by clavulanic acid.
Fluoroquinolones interact with DNA gyrase and topoisomerase IV, which are enzymes that regulate conformational changes in the bacterial chromosome during replication and transcription. This interaction leads to irreversible inhibition of the enzyme activity followed by DNA fragmentation and eventually to cell death. Resistance to fluoroquinolones arises through stepwise mutations in the coding regions of the gyrase subunits (gyrA and gyrB) and DNA topoisomerase IV (parC). Accumulation of mutations in several of these genes increases the MIC in a stepwise manner. Low-level resistance to fluoroquinolones may also arise through changes in outer membrane porins or from upregula-tion of efflux pumps, resulting in lower outer membrane permeability and higher efflux, respectively. In recent years, several plasmid-mediated quinolone resistance mechanisms have also been identified, including the Qnr proteins, which protect DNA topoisomerases from quinolone binding, the AAC(6’)-Ib-cr enzyme, which inactivates some fluoroquinolones by acetylation, and the QepA efflux pump, which effluxes hydrophilic qui-nolones. These mechanisms are a concern because of transferability and their frequent association with CTX-M and CMY-type enzymes inactivating third-gener-ation cephalosporins.
Aminoglycosides block protein synthesis by binding to the ribosomes, which are involved in the translation of RNA into proteins, and are also able to damage the outer membrane of Gram-negative rods. Resistance to aminoglycosides can be due to targeted modification (methylation) of the large ribosomal subunit, which excludes aminoglycoside molecules, or by aminogly-coside modifying enzymes that acetylate, adenylate or phosphorylate their target molecules and thereby neu-tralise the biologic effect of aminoglycosides.
Table 5.6: Number of invasive E. coli isolates resistant to third-generation cephalosporins (CREC) and proportion of ESBL-positive (%ESBL) among these isolates, as ascertained by the participating laboratories in 2010
Country Number of laboratories Number of CREC %ESBL
Austria 30 139 89.9Bulgaria 12 35 91.4Czech Republic 40 257 87.5France 40 361 64.8Germany 12 184 92.9Ireland 26 133 82Italy 1 23 100Lithuania 7 20 95Poland 20 56 87.5Portugal 8 34 88.2Slovenia 9 63 90.5Spain 41 690 91.3
Only data from laboratories consistently reporting the ESBL test results for all isolates identified as resistant to third-generation cephalosporins and from countries with at least 10 of such isolates were selected for the analysis.
Figure 5.14: Escherichia coli: proportion of invasive isolates with resistance to third-generation cephalosporins in 2010
LuxembourgLiechtenstein
Malta
Non-visible countries
toto
No data reported or less than 10 isolatesNot included
toto
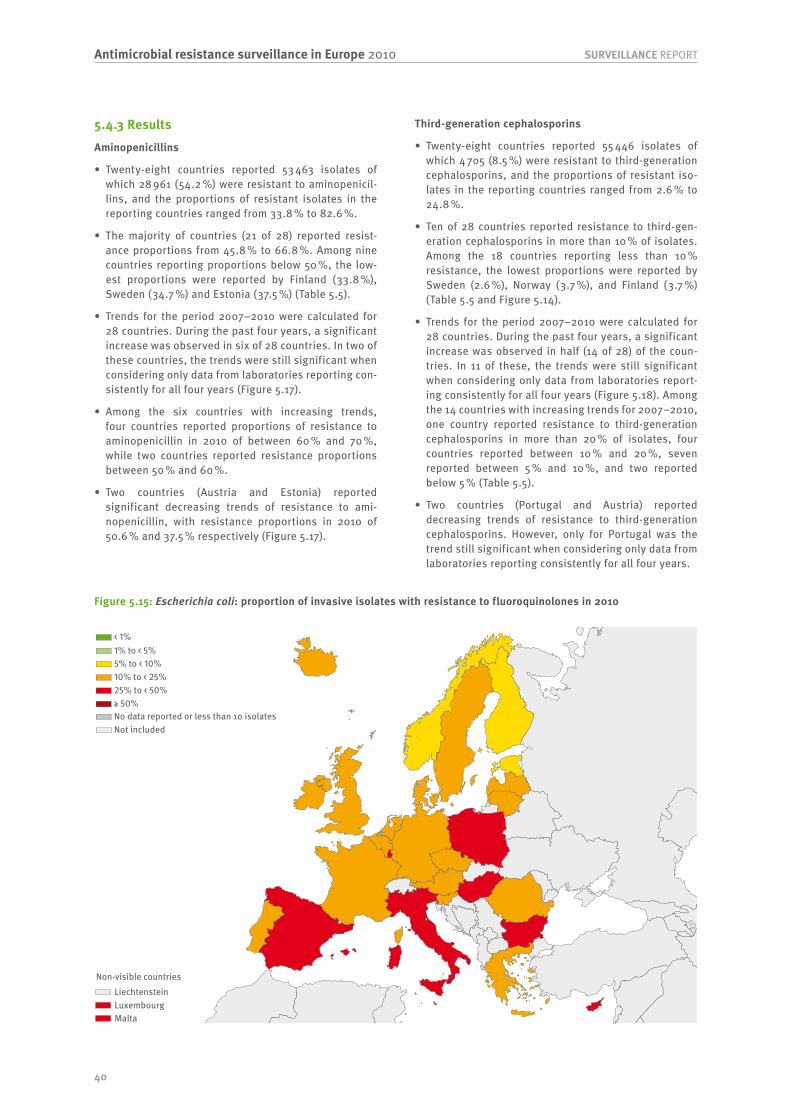
40
SURVEILLANCE REPORTAntimicrobial resistance surveillance in Europe 2010
5.4.3 Results
Aminopenicillins
• Twenty-eight countries reported 53 463 isolates of which 28 961 (54.2 %) were resistant to aminopenicil-lins, and the proportions of resistant isolates in the reporting countries ranged from 33.8 % to 82.6 %.
• The majority of countries (21 of 28) reported resist-ance proportions from 45.8 % to 66.8 %. Among nine countries reporting proportions below 50 %, the low-est proportions were reported by Finland (33.8 %), Sweden (34.7 %) and Estonia (37.5 %) (Table 5.5).
• Trends for the period 2007–2010 were calculated for 28 countries. During the past four years, a significant increase was observed in six of 28 countries. In two of these countries, the trends were still significant when considering only data from laboratories reporting con-sistently for all four years (Figure 5.17).
• Among the six countries with increasing trends, four countries reported proportions of resistance to aminopenicillin in 2010 of between 60 % and 70 %, while two countries reported resistance proportions between 50 % and 60 %.
• Two countries (Austria and Estonia) reported significant decreasing trends of resistance to ami-nopenicillin, with resistance proportions in 2010 of 50.6 % and 37.5 % respectively (Figure 5.17).
Third-generation cephalosporins
• Twenty-eight countries reported 55 446 isolates of which 4 705 (8.5 %) were resistant to third-generation cephalosporins, and the proportions of resistant iso-lates in the reporting countries ranged from 2.6 % to 24.8 %.
• Ten of 28 countries reported resistance to third-gen-eration cephalosporins in more than 10 % of isolates. Among the 18 countries reporting less than 10 % resistance, the lowest proportions were reported by Sweden (2.6 %), Norway (3.7 %), and Finland (3.7 %) (Table 5.5 and Figure 5.14).
• Trends for the period 2007–2010 were calculated for 28 countries. During the past four years, a significant increase was observed in half (14 of 28) of the coun-tries. In 11 of these, the trends were still significant when considering only data from laboratories report-ing consistently for all four years (Figure 5.18). Among the 14 countries with increasing trends for 2007–2010, one country reported resistance to third-generation cephalosporins in more than 20 % of isolates, four countries reported between 10 % and 20 %, seven reported between 5 % and 10 %, and two reported below 5 % (Table 5.5).
• Two countries (Portugal and Austria) reported decreasing trends of resistance to third-generation cephalosporins. However, only for Portugal was the trend still significant when considering only data from laboratories reporting consistently for all four years.
Figure 5.15: Escherichia coli: proportion of invasive isolates with resistance to fluoroquinolones in 2010
LuxembourgLiechtenstein
Malta
Non-visible countries
toto
No data reported or less than 10 isolatesNot included
toto
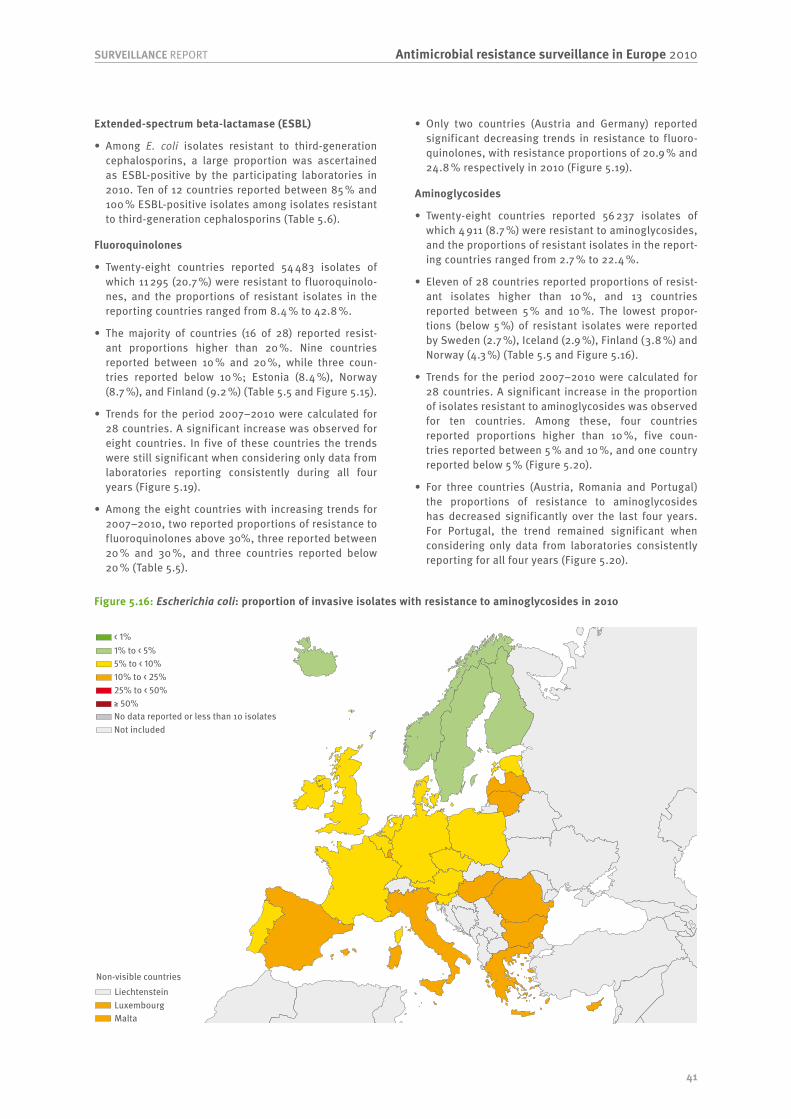
41
Antimicrobial resistance surveillance in Europe 2010SURVEILLANCE REPORT
Extended-spectrum beta-lactamase (ESBL)
• Among E. coli isolates resistant to third-generation cephalosporins, a large proportion was ascertained as ESBL-positive by the participating laboratories in 2010. Ten of 12 countries reported between 85 % and 100 % ESBL-positive isolates among isolates resistant to third-generation cephalosporins (Table 5.6).
Fluoroquinolones
• Twenty-eight countries reported 54 483 isolates of which 11 295 (20.7 %) were resistant to fluoroquinolo-nes, and the proportions of resistant isolates in the reporting countries ranged from 8.4 % to 42.8 %.
• The majority of countries (16 of 28) reported resist-ant proportions higher than 20 %. Nine countries reported between 10 % and 20 %, while three coun-tries reported below 10 %; Estonia (8.4 %), Norway (8.7 %), and Finland (9.2 %) (Table 5.5 and Figure 5.15).
• Trends for the period 2007–2010 were calculated for 28 countries. A significant increase was observed for eight countries. In five of these countries the trends were still significant when considering only data from laboratories reporting consistently during all four years (Figure 5.19).
• Among the eight countries with increasing trends for 2007–2010, two reported proportions of resistance to fluoroquinolones above 30%, three reported between 20 % and 30 %, and three countries reported below 20 % (Table 5.5).
• Only two countries (Austria and Germany) reported significant decreasing trends in resistance to fluoro-quinolones, with resistance proportions of 20.9 % and 24.8 % respectively in 2010 (Figure 5.19).
Aminoglycosides
• Twenty-eight countries reported 56 237 isolates of which 4 911 (8.7 %) were resistant to aminoglycosides, and the proportions of resistant isolates in the report-ing countries ranged from 2.7 % to 22.4 %.
• Eleven of 28 countries reported proportions of resist-ant isolates higher than 10 %, and 13 countries reported between 5 % and 10 %. The lowest propor-tions (below 5 %) of resistant isolates were reported by Sweden (2.7 %), Iceland (2.9 %), Finland (3.8 %) and Norway (4.3 %) (Table 5.5 and Figure 5.16).
• Trends for the period 2007–2010 were calculated for 28 countries. A significant increase in the proportion of isolates resistant to aminoglycosides was observed for ten countries. Among these, four countries reported proportions higher than 10 %, five coun-tries reported between 5 % and 10 %, and one country reported below 5 % (Figure 5.20).
• For three countries (Austria, Romania and Portugal) the proportions of resistance to aminoglycosides has decreased significantly over the last four years. For Portugal, the trend remained significant when considering only data from laboratories consistently reporting for all four years (Figure 5.20).
Figure 5.16: Escherichia coli: proportion of invasive isolates with resistance to aminoglycosides in 2010
LuxembourgLiechtenstein
Malta
Non-visible countries
toto
No data reported or less than 10 isolatesNot included
toto
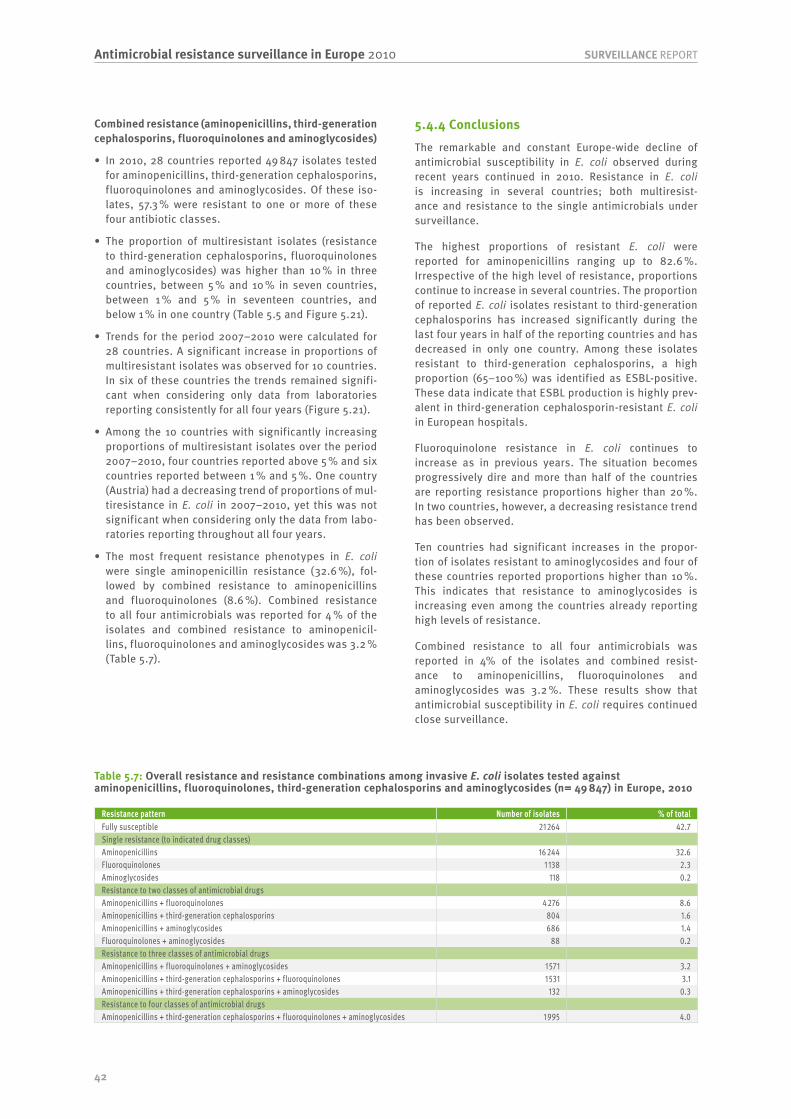
42
SURVEILLANCE REPORTAntimicrobial resistance surveillance in Europe 2010
Table 5.7: Overall resistance and resistance combinations among invasive E. coli isolates tested against aminopenicillins, fluoroquinolones, third-generation cephalosporins and aminoglycosides (n= 49 847) in Europe, 2010
Resistance pattern Number of isolates % of totalFully susceptible 21 264 42.7Single resistance (to indicated drug classes)Aminopenicillins 16 244 32.6Fluoroquinolones 1 138 2.3Aminoglycosides 118 0.2Resistance to two classes of antimicrobial drugsAminopenicillins + fluoroquinolones 4 276 8.6Aminopenicillins + third-generation cephalosporins 804 1.6Aminopenicillins + aminoglycosides 686 1.4Fluoroquinolones + aminoglycosides 88 0.2Resistance to three classes of antimicrobial drugsAminopenicillins + fluoroquinolones + aminoglycosides 1 571 3.2Aminopenicillins + third-generation cephalosporins + fluoroquinolones 1 531 3.1Aminopenicillins + third-generation cephalosporins + aminoglycosides 132 0.3Resistance to four classes of antimicrobial drugsAminopenicillins + third-generation cephalosporins + fluoroquinolones + aminoglycosides 1 995 4.0
Combined resistance (aminopenicillins, third-generation cephalosporins, fluoroquinolones and aminoglycosides)
• In 2010, 28 countries reported 49 847 isolates tested for aminopenicillins, third-generation cephalosporins, fluoroquinolones and aminoglycosides. Of these iso-lates, 57.3 % were resistant to one or more of these four antibiotic classes.
• The proportion of multiresistant isolates (resistance to third-generation cephalosporins, fluoroquinolones and aminoglycosides) was higher than 10 % in three countries, between 5 % and 10 % in seven countries, between 1 % and 5 % in seventeen countries, and below 1 % in one country (Table 5.5 and Figure 5.21).
• Trends for the period 2007–2010 were calculated for 28 countries. A significant increase in proportions of multiresistant isolates was observed for 10 countries. In six of these countries the trends remained signifi-cant when considering only data from laboratories reporting consistently for all four years (Figure 5.21).
• Among the 10 countries with significantly increasing proportions of multiresistant isolates over the period 2007–2010, four countries reported above 5 % and six countries reported between 1 % and 5 %. One country (Austria) had a decreasing trend of proportions of mul-tiresistance in E. coli in 2007–2010, yet this was not significant when considering only the data from labo-ratories reporting throughout all four years.
• The most frequent resistance phenotypes in E. coli were single aminopenicillin resistance (32.6 %), fol-lowed by combined resistance to aminopenicillins and fluoroquinolones (8.6 %). Combined resistance to all four antimicrobials was reported for 4 % of the isolates and combined resistance to aminopenicil-lins, fluoroquinolones and aminoglycosides was 3.2 % (Table 5.7).
5.4.4 Conclusions
The remarkable and constant Europe-wide decline of antimicrobial susceptibility in E. coli observed during recent years continued in 2010. Resistance in E. coli is increasing in several countries; both multiresist-ance and resistance to the single antimicrobials under surveillance.
The highest proportions of resistant E. coli were reported for aminopenicillins ranging up to 82.6 %. Irrespective of the high level of resistance, proportions continue to increase in several countries. The proportion of reported E. coli isolates resistant to third-generation cephalosporins has increased significantly during the last four years in half of the reporting countries and has decreased in only one country. Among these isolates resistant to third-generation cephalosporins, a high proportion (65–100 %) was identified as ESBL-positive. These data indicate that ESBL production is highly prev-alent in third-generation cephalosporin-resistant E. coli in European hospitals.
Fluoroquinolone resistance in E. coli continues to increase as in previous years. The situation becomes progressively dire and more than half of the countries are reporting resistance proportions higher than 20 %. In two countries, however, a decreasing resistance trend has been observed.
Ten countries had significant increases in the propor-tion of isolates resistant to aminoglycosides and four of these countries reported proportions higher than 10 %. This indicates that resistance to aminoglycosides is increasing even among the countries already reporting high levels of resistance.
Combined resistance to all four antimicrobials was reported in 4% of the isolates and combined resist-ance to aminopenicillins, fluoroquinolones and aminoglycosides was 3.2 %. These results show that antimicrobial susceptibility in E. coli requires continued close surveillance.

43
Antimicrobial resistance surveillance in Europe 2010SURVEILLANCE REPORT
Figure 5.17: Escherichia coli: trends of resistance to aminopenicillin by country, 2007–2010
Only countries that reported 20 isolates or more per year were included. The symbols > and < indicate significant increasing and decreasing trends, respectively. The asterisks indicate significant trends in the overall data that were not supported by data from laboratories consistently reporting for all four years.
0 20 40 60 80 100
RO
BG
IE
HU (>)
ES (>)
IT (>*)
UK (>*)
CY
PL
CZ (>*)
LU
BE
LT
FR
DE
PT
EL (>*)
AT (<*)
LV
SI
NL
IS
DK
MT
NO
EE (<)
SE
FI
Coun
try c
ode
% aminopenicillin resistance
2008
2009
2010
2007

44
SURVEILLANCE REPORTAntimicrobial resistance surveillance in Europe 2010
Figure 5.18: Escherichia coli: trends of resistance to third-generation cephalosporins by country, 2007–2010
Only countries that reported 20 isolates or more per year were included. The symbols > and < indicate significant increasing and decreasing trends, respectively. The asterisks indicate significant trends in the overall data that were not supported by data from laboratories consistently reporting for all four years.
0 5 10 15 20 25 30
BG
IT (>*)
RO
CY
HU (>)
MT
EL (>)
LV
ES (>)
CZ (>)
UK
LT
DE (>*)
IE (>)
DK (>)
PL (>*)
AT (<*)
FR (>)
PT (<)
SI (>)
EE
BE (>)
NL
LU
IS
FI (>)
NO (>)
SE
Coun
try c
ode
% third-generation cephalosporin resistance
2008
2009
2010
2007
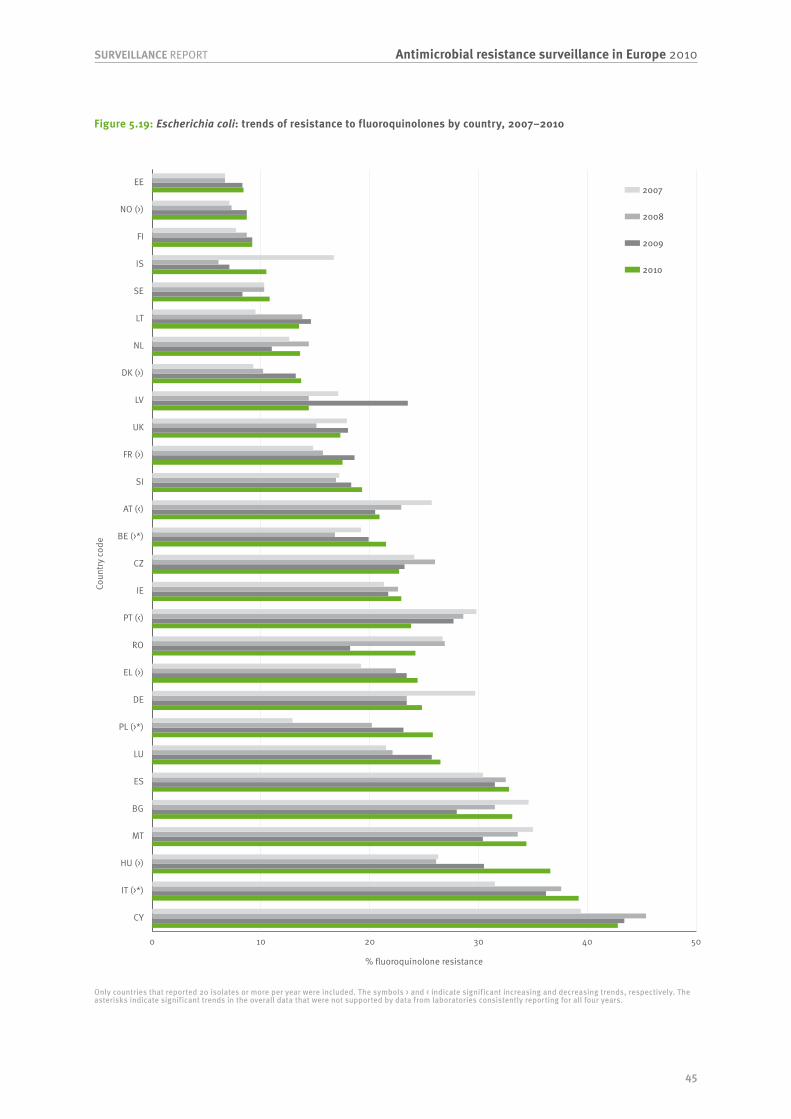
45
Antimicrobial resistance surveillance in Europe 2010SURVEILLANCE REPORT
Figure 5.19: Escherichia coli: trends of resistance to fluoroquinolones by country, 2007–2010
Only countries that reported 20 isolates or more per year were included. The symbols > and < indicate significant increasing and decreasing trends, respectively. The asterisks indicate significant trends in the overall data that were not supported by data from laboratories consistently reporting for all four years.
0 10 20 30 40 50
CY
IT (>*)
HU (>)
MT
BG
ES
LU
PL (>*)
DE
EL (>)
RO
PT (<)
IE
CZ
BE (>*)
AT (<)
SI
FR (>)
UK
LV
DK (>)
NL
LT
SE
IS
FI
NO (>)
EE
Coun
try c
ode
% fluoroquinolone resistance
2008
2009
2010
2007

46
SURVEILLANCE REPORTAntimicrobial resistance surveillance in Europe 2010
Figure 5.20: Escherichia coli: trends of resistance to aminoglycosides by country, 2007–2010
Only countries that reported 20 isolates or more per year were included. The symbols > and < indicate significant increasing and decreasing trends, respectively. The asterisks indicate significant trends in the overall data that were not supported by data from laboratories consistently reporting for all four years.
0 5 10 15 20 25 30 35 40
MT
HU (>)
LU (>*)
EL (>)
CY
BG
IT
LT
ES (>)
RO (<*)
LV
IE
PT (<)
PL
SI (>)
DE (>*)
CZ
UK
NL (>)
FR (>)
AT (<*)
DK (>)
BE
EE
NO (>)
FI
IS
SE
Coun
try c
ode
% aminoglycoside resistance
2008
2009
2010
2007

47
Antimicrobial resistance surveillance in Europe 2010SURVEILLANCE REPORT
Figure 5.21: Escherichia coli: trends of combined resistance (resistant to fluoroquinolones, third-generation cephalosporins and aminoglycosides) by country, 2007–2010
Only countries that reported 20 isolates or more per year were included. The symbols > and < indicate significant increasing and decreasing trends, respectively. The asterisks indicate significant trends in the overall data that were not supported by data from laboratories consistently reporting for all four years.
0 5 10 15 20 25
HU (>)
MT
IT (>*)
EL (>)
CY
BG
RO
LV
ES (>)
LT
UK
PT
SI
DE (>*)
CZ
PL (>*)
IE (>)
FR (>)
DK (>)
LU
AT (<*)
EE
FI
NL
NO (>*)
IS
BE
SE
Coun
try c
ode
% combined resistance
2008
2009
2010
2007
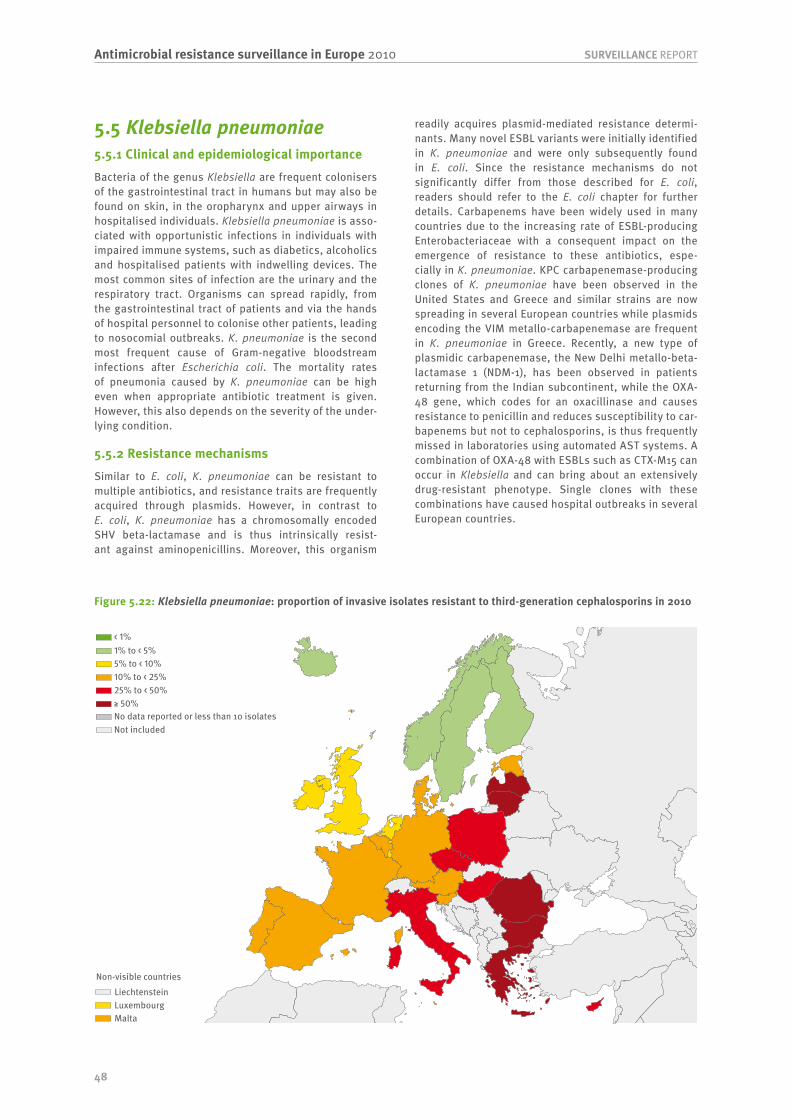
48
SURVEILLANCE REPORTAntimicrobial resistance surveillance in Europe 2010
5.5 Klebsiella pneumoniae5.5.1 Clinical and epidemiological importance
Bacteria of the genus Klebsiella are frequent colonisers of the gastrointestinal tract in humans but may also be found on skin, in the oropharynx and upper airways in hospitalised individuals. Klebsiella pneumoniae is asso-ciated with opportunistic infections in individuals with impaired immune systems, such as diabetics, alcoholics and hospitalised patients with indwelling devices. The most common sites of infection are the urinary and the respiratory tract. Organisms can spread rapidly, from the gastrointestinal tract of patients and via the hands of hospital personnel to colonise other patients, leading to nosocomial outbreaks. K. pneumoniae is the second most frequent cause of Gram-negative bloodstream infections after Escherichia coli. The mortality rates of pneumonia caused by K. pneumoniae can be high even when appropriate antibiotic treatment is given. However, this also depends on the severity of the under-lying condition.
5.5.2 Resistance mechanisms
Similar to E. coli, K. pneumoniae can be resistant to multiple antibiotics, and resistance traits are frequently acquired through plasmids. However, in contrast to E. coli, K. pneumoniae has a chromosomally encoded SHV beta-lactamase and is thus intrinsically resist-ant against aminopenicillins. Moreover, this organism
readily acquires plasmid-mediated resistance determi-nants. Many novel ESBL variants were initially identified in K. pneumoniae and were only subsequently found in E. coli. Since the resistance mechanisms do not significantly differ from those described for E. coli, readers should refer to the E. coli chapter for further details. Carbapenems have been widely used in many countries due to the increasing rate of ESBL-producing Enterobacteriaceae with a consequent impact on the emergence of resistance to these antibiotics, espe-cially in K. pneumoniae. KPC carbapenemase-producing clones of K. pneumoniae have been observed in the United States and Greece and similar strains are now spreading in several European countries while plasmids encoding the VIM metallo-carbapenemase are frequent in K. pneumoniae in Greece. Recently, a new type of plasmidic carbapenemase, the New Delhi metallo-beta-lactamase 1 (NDM-1), has been observed in patients returning from the Indian subcontinent, while the OXA-48 gene, which codes for an oxacillinase and causes resistance to penicillin and reduces susceptibility to car-bapenems but not to cephalosporins, is thus frequently missed in laboratories using automated AST systems. A combination of OXA-48 with ESBLs such as CTX-M15 can occur in Klebsiella and can bring about an extensively drug-resistant phenotype. Single clones with these combinations have caused hospital outbreaks in several European countries.
Figure 5.22: Klebsiella pneumoniae: proportion of invasive isolates resistant to third-generation cephalosporins in 2010
LuxembourgLiechtenstein
Malta
toto
No data reported or less than 10 isolatesNot included
toto
Non-visible countries

49
Antimicrobial resistance surveillance in Europe 2010SURVEILLANCE REPORT
5.5.3 Results
Third-generation cephalosporins
• Twenty-eight countries reported 13 240 isolates of which 3 635 (27.5 %) were resistant to third-generation cephalosporins.
• The proportions of isolates found to be resistant ranged from 1.7 % (Sweden) to 75.6 % (Bulgaria). Among the 28 countries, four countries reported pro-portions below 5 %, four countries reported 5–10 %, 10 countries reported 10–25 %, five countries reported 25–50 %, and five countries reported above 50 % (Figure 5.22, Table 5.8).
• Trends for the period 2007–2010 were calculated for 25 countries (Figure 5.26). A significant increase was observed for nine countries. In seven of these (Austria, France, Estonia, Finland, Greece, Hungary and Lithuania), the trends were still significant when considering only data from laboratories reporting con-sistently for all four years (Figure 5.26).
• None of the countries reported a significant decreasing trend of proportions of resistance to third-generation cephalosporins (Figure 5.26).
Extended-spectrum beta-lactamase (ESBL)
• Fifteen countries were included in the calculation of ESBL proportions for K. pneumoniae. Data were only included from laboratories reporting ESBL test results for all isolates identified as resistant to
third-generation cephalosporins, and only from coun-tries with at least 10 of such isolates.
• The proportion of K. pneumoniae isolates resistant to third-generation cephalosporins and ESBL produc-ers, as ascertained by the participating laboratories, ranged from 59.3 % to 100 %. The proportion of ESBL producers was under 75 % in one country, 75–85 % in two countries, 85–95 % in six countries, and above 95 % in six countries (Table 5.9).
Fluoroquinolones
• Twenty-eight countries reported 13 013 iso-lates of which 3 706 (28.5 %) were resistant to fluoroquinolones.
• The proportion of isolates found to be resistant ranged from 0.0 % (Iceland) to 70.9 % (Greece). One country reported below 1 %, two countries 1–5 %, five countries 5–10 %, ten countries 10–25 % (including Estonia and Slovenia with exactly 25 %), 25–50 % in six countries, and above 50 % in four countries (Figure 5.23, Table 5.8).
• Trends for the period 2007–2010 were calculated for 23 countries. A significant increase was observed for eleven countries. In nine of these countries (Austria, Cyprus, Czech Republic, Estonia, France, Greece, Hungary, Lithuania and Norway) the trends were still significant when considering only data from labora-tories which reported consistently for all four years (Figure 5.27).
Figure 5.23: Klebsiella pneumoniae: proportion of invasive isolates resistant to fluoroquinolones in 2010
LuxembourgLiechtenstein
Malta
toto
No data reported or less than 10 isolatesNot included
toto
Non-visible countries

50
SURVEILLANCE REPORTAntimicrobial resistance surveillance in Europe 2010
• Three countries (Ireland, Sweden and the United Kingdom) reported significant decreasing trends of proportions of resistance to fluoroquinolones (Figure 5.27). However, only for Ireland did the trend maintain its significance when taking into account only data from laboratories that reported consistently through-out the period 2007–2010.
Aminoglycosides
• Twenty-eight countries reported 13 454 isolates of which 3 108 (23.1 %) were resistant to aminoglycosides.
• Proportions of isolates found to be resistant ranged from 0.0 % (Iceland) to 70.6 % (Romania), and were reported as below 5 % in six countries, 5–10 % in six countries, 10–25 % in six countries, 25–50 % in five countries and above 50 % in five countries (Figure 5.24, Table 5.8).
• Trends for the period 2007–2010 were calculated for 25 countries (Figure 5.28). A significant increase was observed for nine countries. In all of these countries (Czech Republic, Estonia, Finland, France, Greece, Hungary, Latvia, Malta and Portugal), the trends were significant even when considering only data from lab-oratories reporting consistently for all four years.
• One country (United Kingdom) reported a significant decreasing trend of proportions of isolates resist-ant to aminoglycosides (Figure 5.28) which remained significant when looking only at laboratories report-ing consistently throughout the 2007–2010 period. In
2010 the proportion of resistance to aminoglycosides in the UK was 4.9 %.
Carbapenems
• Twenty-eight countries reported 12 328 isolates of which 990 (8.0 %) were resistant to carbapenems. The majority of the resistant isolates (828; 83.6 %) were identified in Greece, 111 in Italy, 27 in Hungary and 11 in Cyprus. Twelve countries reported one or more resistant isolate(s) in 2010.
• The proportion of isolates resistant to carbapenems was 49.1 % in Greece, 16.4 % in Cyprus, 15.2 % in Italy, 5.5 % in Hungary, 1.7 % in Portugal, and below 1 % in the rest of the reporting countries (Figure 5.25).
• Trends for the period 2007–2010 were calculated for 23 countries (Figure 5.29). A significant increase was observed for five countries (Austria, Cyprus, Greece, Hungary and Italy). For all of these countries, the trends were significant even when considering only data from laboratories reporting consistently for all four years. For Austria, Hungary and Italy, the increase occurred mainly during the last year (2009–2010).
• One country (Germany) had a significant decreasing trend of proportions of isolates resistant to carbap-enems (Figure 5.29). However, this trend was not significant when including only data from labora-tories reporting consistently throughout the period 2007–2010.
Figure 5.24: Klebsiella pneumoniae: proportion of invasive isolates resistant to aminoglycosides in 2010
LuxembourgLiechtenstein
Malta
Non-visible countries
toto
No data reported or less than 10 isolatesNot included
toto

51
Antimicrobial resistance surveillance in Europe 2010SURVEILLANCE REPORT
Combined resistance (third-generation cephalosporins, fluoroquinolones and aminoglycosides)
• Twenty-eight countries reported 12 665 isolates tested for susceptibility to third-generation cephalosporins, fluoroquinolones and aminoglycosides. In 2010, 35 % of isolates were resistant to one or more of the three considered antibiotic classes. The most frequent pat-tern of resistance (19 %) was multiresistance (resistant (R) to all three antibiotic classes) (Table 5.10).
• Proportions of multiresistance ranged from 0.0 % (Iceland) to 57.4 % (Greece), and was reported as below 1 % in three countries, 1–5 % in eight countries, 5–10 % in three countries, 10–25 % in seven countries, 25–50 % in six countries and above 50 % in one coun-try (Table 5.8).
• Trends for the period 2007–2010 were calculated for 25 countries. A significant increase of multiresistance was observed for nine countries. In seven of these countries (Czech Republic, Estonia, France, Greece, Hungary, Latvia, and Lithuania), the trends were significant even when considering only data from laboratories reporting consistently for all four years (Figure 5.30).
• Two countries (United Kingdom and Austria) reported a significant decreasing trend of proportions of mul-tiresistance (Figure 5.30), with 2010 proportions of 3.6 % and 1.8 %, respectively. Both these trends were significant even when looking only at data from labo-ratories reporting throughout the 2007–2010 period.
5.5.4 Conclusions
Antimicrobial resistance in K. pneumoniae is a pub-lic health concern of increasing importance in Europe. In 2010, a high frequency of multidrug-resistant K. pneumoniae (combined resistance to third-generation cephalosporins, fluoroquinolones and aminoglycosides) was evident in southern, central and eastern Europe. In two thirds of the reporting countries, the propor-tions of resistance to third-generation cephalosporins and fluoroquinolones was higher than 10 %, and more than one third of the countries reported proportions higher than 25 %. The majority of isolates resistant to third-generation cephalosporins were also resistant to fluoroquinolones and aminoglycosides, which indicates that combined resistance was common. Proportions of multiresistance above 10 % were reported by half of the countries.
The occurrence of carbapenem-resistant K. pneumoniae has increased dramatically in a number of countries. In 2009, carbapenem resistance in K. pneumoniae was only established in Greece. In 2010, in addition to Greece, an increasing trend of carbapenem-resistant K. pneu-moniae was also observed in Austria, Cyprus, Hungary and Italy. This increasing trend is a particularly worry-ing phenomenon as carbapenems are some of the few effective antimicrobials available for the treatment of infections caused by bacteria producing extended-spec-trum beta-lactamases and resistance to carbapenems leaves very few therapeutic options.
Figure 5.25: Klebsiella pneumoniae: proportion of invasive isolates resistant to carbapenems in 2010
LuxembourgLiechtenstein
Malta
toto
No data reported or less than 10 isolatesNot included
toto
Non-visible countries

52
SURVEILLANCE REPORTAntimicrobial resistance surveillance in Europe 2010
Figure 5.26: Klebsiella pneumoniae: trends of resistance to third-generation cephalosporins by country, 2007–2010
Only countries that reported 20 isolates or more per year were included. The symbols > and < indicate significant increasing and decreasing trends, respectively. The asterisks indicate significant trends in the overall data that were not supported by data from laboratories consistently reporting for all four years.
0 10 20 30 40 50 60 70 80
BG
EL (>)
LV
LT (>)
CZ
IT (>*)
HU (>)
CY
SI
FR (>)
EE (>)
PT
DE (>*)
AT (>)
MT
DK
ES
UK
IE
NL
LU
FI (>)
IS
NO
SE
Coun
try c
ode
% third-generation cephalosporin resistance
2008
2009
2010
2007

53
Antimicrobial resistance surveillance in Europe 2010SURVEILLANCE REPORT
Figure 5.27: Klebsiella pneumoniae: trends of resistance to fluoroquinolones by country, 2007–2010
Only countries that reported 20 isolates or more per year were included. The symbols > and < indicate significant increasing and decreasing trends, respectively. The asterisks indicate significant trends in the overall data that were not supported by data from laboratories consistently reporting for all four years.
0 10 20 30 40 50 60 70 80
EL (>)
CZ (>)
LV
BG
HU (>)
CY (>)
IT (>*)
LT (>)
EE (>)
SI
PT (>*)
FR (>)
AT (>)
MT
DE
ES
DK
LU
IE (<)
UK (<*)
NO (>)
NL
SE (<*)
FI
IS
Coun
try c
ode
% fluoroquinolone resistance
2008
2009
2010
2007

54
SURVEILLANCE REPORTAntimicrobial resistance surveillance in Europe 2010
Figure 5.28: Klebsiella pneumoniae: trends of resistance to aminoglycosides by country, 2007–2010
Only countries that reported 20 isolates or more per year were included. The symbols > and < indicate significant increasing and decreasing trends, respectively.
0 10 20 30 40 50 60 70 80
BG
EL (>)
LV (>)
LT
HU (>)
CZ (>)
IT
EE (>)
SI
PT (>)
CY
FR (>)
MT (>)
DE
ES
IE
NL
LU
DK
AT
UK (<)
FI (>)
NO
SE
IS
Coun
try c
ode
% aminoglycoside resistance
2008
2009
2010
2007

55
Antimicrobial resistance surveillance in Europe 2010SURVEILLANCE REPORT
Figure 5.29: Klebsiella pneumoniae: trends of resistance to carbapenems by country, 2007–2010
Only countries that reported 20 isolates or more per year were included. The symbols > and < indicate significant increasing and decreasing trend, respectively. The asterisks indicate significant trends in the overall data that were not supported by data from laboratories consistently reporting for all four years.
0 10 20 30 40 50
EL (>)
CY (>)
IT (>)
HU (>)
PT
AT (>)
SI
NL
SE
CZ
FR
UK
BG
DE (<*)
DK
EE
ES
FI
IE
LT
LV
MT
NO
Coun
try c
ode
% carbapenem resistance
2008
2009
2010
2007

56
SURVEILLANCE REPORTAntimicrobial resistance surveillance in Europe 2010
Figure 5.30: Klebsiella pneumoniae: trends of combined resistance (third-generation cephalosporins, fluoroquinolones and aminoglycosides) by country, 2007–2010
Only countries that reported 20 isolates or more per year were included. The symbols > and < indicate significant increasing and decreasing trend, respectively. The asterisks indicate significant trends in the overall data that were not supported by data from laboratories consistently reporting for all four years.
0 10 20 30 40 50 60
EL (>)
LV (>)
BG
HU (>)
CZ (>)
LT (>)
IT (>*)
CY
SI
EE (>)
FR (>)
PT (>*)
DE
DK
MT
ES
NL
UK (<)
LU
IE
AT (<)
FI
NO
SE
IS
Coun
try c
ode
% combined resistance
2008
2009
2010
2007

57
Antimicrobial resistance surveillance in Europe 2010SURVEILLANCE REPORT
Table 5.8: Number and proportion of invasive K. pneumoniae isolates resistant to fluoroquinolones, third-generation cephalosporins, aminoglycosides and multiresistant (%R), including 95% confidence intervals (95% CI), reported per country in 2010
CountryFluoroquinolones Third-gen. cephalosporins Aminoglycosides Multiresistance*
N %R (95%CI) N %R (95%CI) N %R (95%CI) N %R (95%CI)Austria 720 18.2 (15-21) 720 12.6 (10-15) 720 5.6 (4-7) 716 1.8 (1-3)Belgium 144 12.5 (8-19) 143 12.6 (8-19) 133 2.3 (0-6) 132 0.8 (0-4)Bulgaria 126 52.4 (43-61) 127 75.6 (67-83) 127 68.5 (60-76) 126 43.7 (35-53)Cyprus 67 38.8 (27-51) 67 34.3 (23-47) 67 19.4 (11-31) 67 19.4 (11-31)Czech Republic 1 263 55.1 (52-58) 1 263 48.2 (45-51) 1 245 46.7 (44-49) 1 244 35.9 (33-39)Denmark 673 11.3 (9-14) 559 10.6 (8-13) 799 6.1 (5-8) 557 5.4 (4-8)Estonia 64 25.0 (15-37) 81 17.3 (10-27) 66 25.8 (16-38) 63 15.9 (8-27)Finland 401 2.5 (1-5) 397 4.0 (2-6) 372 3.8 (2-6) 368 1.4 (0-3)France 1 527 21.8 (20-24) 1 542 17.8 (16-20) 1 542 17.7 (16-20) 1 527 14.8 (13-17)Germany 478 14.9 (12-18) 478 12.8 (10-16) 478 10.5 (8-14) 478 7.5 (5-10)Greece 1 676 70.9 (69-73) 1 686 74.6 (72-77) 1 687 61.7 (59-64) 1 668 57.4 (55-60)Hungary 504 42.9 (38-47) 512 45.9 (42-50) 514 47.9 (43-52) 502 37.8 (34-42)Iceland 24 0.0 (0-14) 27 3.7 (0-19) 27 0.0 (0-13) 24 0.0 (0-14)Ireland 318 8.2 (5-12) 318 8.5 (6-12) 318 6.9 (4-10) 318 2.2 (1-4)Italy 696 38.5 (35-42) 701 46.5 (43-50) 735 29.1 (26-33) 685 26.3 (23-30)Latvia 63 52.4 (39-65) 64 54.7 (42-67) 64 54.7 (42-67) 63 49.2 (36-62)Lithuania 80 36.3 (26-48) 81 50.6 (39-62) 81 51.9 (40-63) 80 32.5 (22-44)Luxembourg 33 9.1 (2-24) 33 6.1 (1-20) 32 6.3 (1-21) 32 3.1 (0-16)Malta 57 15.8 (7-28) 57 12.3 (5-24) 57 12.3 (5-24) 57 5.3 (1-15)Netherlands 644 7.0 (5-9) 641 7.2 (5-9) 644 6.5 (5-9) 638 3.8 (2-6)Norway 476 7.4 (5-10) 479 2.1 (1-4) 471 1.7 (1-3) 468 1.1 (0-2)Poland 221 33.0 (27-40) 232 39.7 (33-46) 231 31.2 (25-38) 209 23.0 (17-29)Portugal 211 23.7 (18-30) 215 15.8 (11-21) 231 19.5 (15-25) 204 10.3 (6-15)Romania 17 29.4 (10-56) 17 70.6 (44-90) 17 70.6 (44-90) 17 23.5 (7-50)Slovenia 196 25.0 (19-32) 196 22.4 (17-29) 196 23.0 (17-29) 196 17.9 (13-24)Spain 1 161 13.6 (12-16) 1 161 10.2 (9-12) 1 161 8.7 (7-10) 1 161 4.7 (4-6)Sweden 405 4.7 (3-7) 700 1.7 (1-3) 642 1.2 (1-2) 364 0.8 (0-2)United Kingdom 768 7.4 (6-10) 743 9.7 (8-12) 797 4.9 (4-7) 701 3.6 (2-5)
* Multiresistance defined as being resistant to third-generation cephalosporins, fluoroquinolone and aminoglycosides.
Table 5.9: Number of invasive K. pneumoniae isolates resistant to third-generation cephalosporins (CRKP) and proportion ESBL-positive (% ESBL) among these isolates, as ascertained by the participating laboratories in 2010
Country Number of laboratories Number of CRKP %ESBL
Austria 27 73 78.1Bulgaria 13 77 100Czech Republic 43 609 86.4France 19 65 87.7Germany 6 32 96.9Ireland 12 27 59.3Italy 10 69 81.2Latvia 5 15 93.3Lithuania 7 35 100Netherlands 6 13 92.3Poland 21 92 98.9Portugal 7 22 90.9Romania 3 12 100Slovenia 5 44 97.7Spain 32 119 88.2
Only data from laboratories consistently reporting ESBL test results for all isolates identified as resistant to third-generation cephalosporins and from countries with at least 10 of such isolates were included in the analysis.
Table 5.8a: Number and proportion of invasive K. pneumoniae isolates resistant to carbapenems and confidence intervals (95% CI) per country in 2010
CountryCarbapenems
N %R (95%CI)Austria 509 0.6 (0-2)Belgium 116 0.0 (0-3)Bulgaria 126 0.0 (0-3)Cyprus 67 16.4 (8-27)Czech Republic 1103 0.1 (0-1)Denmark 491 0.0 (0-1)Estonia 66 0.0 (0-5)Finland 391 0.0 (0-1)France 1432 0.1 (0-0)Germany 464 0.0 (0-1)Greece 1687 49.1 (47-51)Hungary 491 5.5 (4-8)Iceland 13 0.0 (0-25)Ireland 301 0.0 (0-1)Italy 731 15.2 (13-18)Latvia 63 0.0 (0-6)Lithuania 43 0.0 (0-8)Luxembourg 33 0.0 (0-11)Malta 57 0.0 (0-6)Netherlands 640 0.3 (0-1)Norway 448 0.0 (0-1)Poland 238 0.0 (0-2)Portugal 116 1.7 (0-6)Romania 14 0.0 (0-23)Slovenia 195 0.5 (0-3)Spain 1161 0.0 (0-0)Sweden 655 0.3 (0-1)United Kingdom 677 0.1 (0-1)
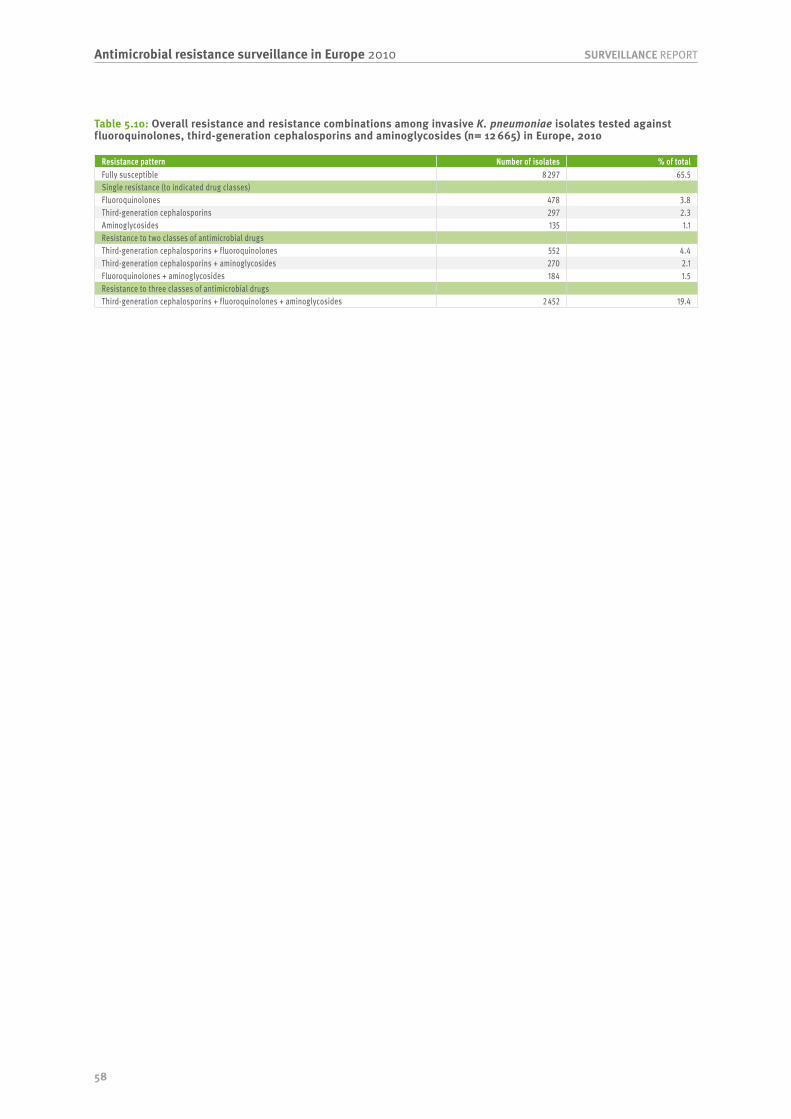
58
SURVEILLANCE REPORTAntimicrobial resistance surveillance in Europe 2010
Table 5.10: Overall resistance and resistance combinations among invasive K. pneumoniae isolates tested against fluoroquinolones, third-generation cephalosporins and aminoglycosides (n= 12 665) in Europe, 2010
Resistance pattern Number of isolates % of totalFully susceptible 8 297 65.5Single resistance (to indicated drug classes)Fluoroquinolones 478 3.8Third-generation cephalosporins 297 2.3Aminoglycosides 135 1.1Resistance to two classes of antimicrobial drugsThird-generation cephalosporins + fluoroquinolones 552 4.4Third-generation cephalosporins + aminoglycosides 270 2.1Fluoroquinolones + aminoglycosides 184 1.5Resistance to three classes of antimicrobial drugsThird-generation cephalosporins + fluoroquinolones + aminoglycosides 2 452 19.4

59
Antimicrobial resistance surveillance in Europe 2010SURVEILLANCE REPORT
5.6 Pseudomonas aeruginosa5.6.1 Clinical and epidemiological importance
Pseudomonas aeruginosa is a non-fermenting Gram-negative bacterium that is ubiquitous in aquatic environments in nature. It is an opportunistic patho-gen for plants, animals and humans, and is a major and dreaded cause of infection among hospitalised patients with localised or systemic impairment of immune defences, being a common cause of hospital-acquired pneumonia (including ventilator-associated pneumonia), bloodstream and urinary tract infections. Because of its ubiquity, its enormous versatility and intrinsic tolerance to many detergents, disinfectants and antimicrobial compounds, it is difficult to control P. aeruginosa in hospitals and institutional environments. Moreover, P. aeruginosa is a frequent cause of skin infections such as folliculitis and otitis externa among recreational and competitive swimmers. In patients with cystic fibrosis, P. aeruginosa causes severe bacterial complication leading to chronic colonisation and intermittent exacerbation of the condition with, for example, bronchiolitis and acute respiratory distress syndrome. Finally, P. aeruginosa is commonly found in burns units, and in these locations it is almost impossible to eradicate colonising strains with classic infection control procedures.
5.6.2 Resistance mechanism
P. aeruginosa is intrinsically resistant to the major-ity of antimicrobial compounds due to its selective
ability to exclude various molecules from penetrating its outer membrane. The antibiotic classes that remain active include some fluoroquinolones (e.g. ciprofloxacin and levofloxacin), aminoglycosides (e.g. gentamicin, tobramicin and amikacin), some beta-lactams (pip-eracillin–tazobactam, ceftazidime, cefipime and carbapenems) and colistin. Resistance in P. aeruginosa is acquired through one or more of several mechanisms:
• mutational modification of antibiotic targets such as topoisomerases or ribosomal proteins, which confer resistance to fluoroquinolones and aminoglycosides, respectively;
• mutational derepression of the chromosomally coded AmpC beta-lactamase, that can confer resist-ance to penicillins and cephalosporins active against pseudomonas;
• mutational loss of outer membrane proteins prevent-ing the uptake of antimicrobial substances such as carbapenems;
• mutational upregulation of efflux systems, that can confer resistance to beta-lactams, fluoroquinolones and aminoglycosides; and
• acquisition of plasmid-mediated resistance genes coding for various beta-lactamases and aminoglyco-side-modifying enzymes that can confer resistance to various beta-lactams including carbapenems (e.g. metallo-beta-lactamases) and aminoglycosides.
Figure 5.31: Pseudomonas aeruginosa: proportion of invasive isolates resistant to piperacillin±tazobactam in 2010
LuxembourgLiechtenstein
Malta
Non-visible countries
toto
No data reported or less than 10 isolatesNot included
toto

60
SURVEILLANCE REPORTAntimicrobial resistance surveillance in Europe 2010
5.6.3 Results
Piperacillin±tazobactam
• Twenty-eight countries reported 8 203 iso-lates of which 1 322 (16.1 %) were resistant to piperacillin±tazobactam. One country reported fewer than 10 isolates and was therefore excluded from the map (Figure 5.31).
• Proportions of isolates found to be resistant ranged from 1.1 % (Sweden) to 62.5 % (Romania) and were reported less than 5 % in five countries, 5–10 % in seven countries, 10–25 % in eleven countries, 25–50 % in four countries and above 50 % in one country (Figure 5.31, Table 5.11).
• Trends for the period 2007–2010 were calculated for 22 countries. A significant increase in resistance was observed for France, which in 2010 reported a propor-tion of resistance to piperacillin±tazobactam of 20.3 %. This increasing trend remained significant even when including only data from laboratories reporting con-sistently throughout the period 2007–2010 (Figure 5.36).
Ceftazidime
• Twenty-eight countries reported 8 095 isolates of which 1 103 (13.6 %) were resistant to ceftazidime. One country (Estonia) reported fewer than 10 isolates and therefore was not included in the map (Figure 5.32).
• Proportions of isolates found to be resistant ranged from 0.0 % (Luxembourg) to 60.0 % (Romania), and was reported as less than 5 % in seven countries, 5–10 % in nine countries, 10–25 % in nine countries and 25–50 % in two countries, and over 50 % in one country. (Figure 5.32, Table 5.11).
• Trends for the period 2007–2010 were calculated for 22 countries. A significant increasing trend was observed for France, which in 2010 reported a propor-tion of resistance to ceftazidime of 12.7 %. This trend remained significant even when including only data from laboratories reporting consistently throughout the period 2007–2010. A significant decreasing trend was observed for the Czech Republic, Italy, Portugal and Germany (where proportions of resistance in 2010 were 28.5 %, 17.7 %, 12.0 % and 8.1 % respectively). However, this trend remained significant only for the Czech Republic and Italy when including only data from laboratories reporting consistently throughout the four years (Figure 5.37).
Fluoroquinolones
• Twenty-eight countries reported 8 434 isolates of which 1 878 (22.3 %) were resistant to fluoroquinolones.
• Proportions of isolates found to be resistant ranged from 4.3 % (Netherlands) to 55.6 % (Romania) and was reported as less than 5 % in two countries, 5–10 % in four countries, 10–25 % in sixteen countries, 25–50 % in five countries, and above 50 % in one country (Figure 5.33, Table 5.11).
Figure 5.32: Pseudomonas aeruginosa: proportion of invasive isolates resistant to ceftazidime in 2010
LuxembourgLiechtenstein
Malta
Non-visible countries
toto
No data reported or less than 10 isolatesNot included
toto

61
Antimicrobial resistance surveillance in Europe 2010SURVEILLANCE REPORT
• Trends for the period 2007–2010 were calculated for 21 countries. No country reported a significant increase in proportions of resistance to fluoroquinolo-nes. A significant decreasing trend was observed for Greece, Germany, Ireland and Slovenia, which in 2010 reported proportions of fluoroquinolone resistance of 45.7 %, 18.4 %, 10.6 % and 9.5 %, respectively. In three of these countries (Greece, Ireland and Slovenia) the trends were significant even when including only data from laboratories reporting consistently for all four years (Figure 5.38).
Aminoglycosides
• Twenty-eight countries reported 8 338 isolates of which 1 485 (17.8 %) were resistant to aminoglycosides.
• Proportions of isolates found to be resistant ranged from 0.0 % (Iceland) to 50.0 % (Romania), and was reported as below 1 % in three countries, 1–5 % in five countries, 5–10 % in two countries, 10–25 % in eleven countries (including Austria with exactly 10 %), 25–50 % in six countries and exactly 50 % in one coun-try (Figure 5.34, Table 5.11).
• Trends for the period 2007–2010 were calculated for 22 countries. One country (Malta) reported a significant increasing trend with a proportion of aminoglycoside resistance of 31.0 % in 2010 (Figure 5.39). This increas-ing trend remained significant even when examining data from laboratories which reported consistently throughout the 2007–2010 period.
• Significant decreasing trends were observed for four countries (Greece, Lithuania, Cyprus and the UK). For all of these, the trends remained significant even when considering only data from laboratories reporting con-sistently for all four years (Figure 5.39). In 2010, these four countries reported the following proportions of resistance to aminoglycosides: Greece with 41.8 %, Lithuania with 12.9 %, Cyprus with 10.4 %, and the UK with 1.9 %.
Carbapenems
• Twenty-eight countries reported 8 448 isolates of which 1 510 (17.9 %) were resistant to carbapenems.
• Proportions of isolates found to be resistant ranged from 0.0 % (Iceland) to 70.0 % (Romania) and was reported as below 1 % in one country, 1–5 % in five countries, 5–10 % in four countries, 10–25 % in thir-teen countries, 25–50 % in four countries and above 50 % in one country (Figure 5.35, Table 5.11).
• Trends for the period 2007–2010 were calculated for 22 countries. Two countries (Hungary and France) reported a significant increasing trend with propor-tions of resistance to carbapenems in 2010 of 24.9 % and 17.8 %, respectively. However, this increasing trend remained significant only in Hungary when considering only data from laboratories reporting con-sistently for all four years (Figure 5.40).
Figure 5.33: Pseudomonas aeruginosa: proportion of invasive isolates resistant to fluoroquinolones in 2010
LuxembourgLiechtenstein
Malta
toto
No data reported or less than 10 isolatesNot included
toto
Non-visible countries
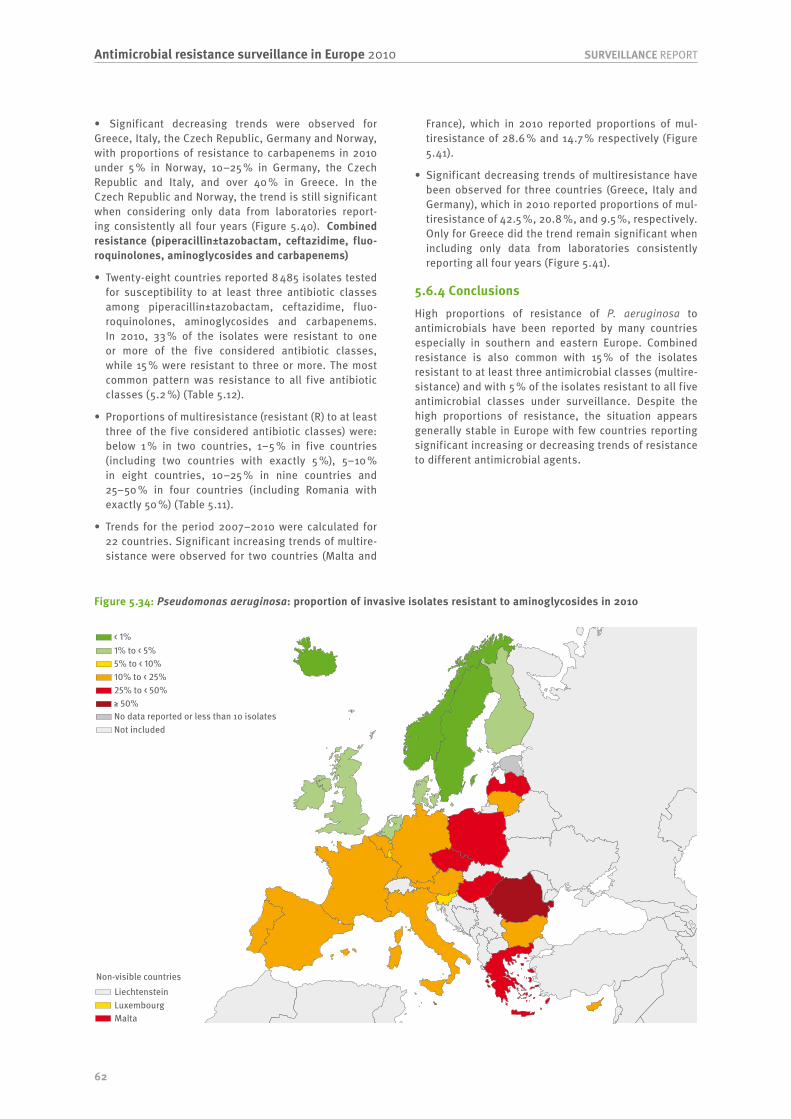
62
SURVEILLANCE REPORTAntimicrobial resistance surveillance in Europe 2010
Figure 5.34: Pseudomonas aeruginosa: proportion of invasive isolates resistant to aminoglycosides in 2010
LuxembourgLiechtenstein
Malta
toto
No data reported or less than 10 isolatesNot included
toto
Non-visible countries
• Significant decreasing trends were observed for Greece, Italy, the Czech Republic, Germany and Norway, with proportions of resistance to carbapenems in 2010 under 5 % in Norway, 10–25 % in Germany, the Czech Republic and Italy, and over 40 % in Greece. In the Czech Republic and Norway, the trend is still significant when considering only data from laboratories report-ing consistently all four years (Figure 5.40). Combined resistance (piperacillin±tazobactam, ceftazidime, fluo-roquinolones, aminoglycosides and carbapenems)
• Twenty-eight countries reported 8 485 isolates tested for susceptibility to at least three antibiotic classes among piperacillin±tazobactam, ceftazidime, fluo-roquinolones, aminoglycosides and carbapenems. In 2010, 33 % of the isolates were resistant to one or more of the five considered antibiotic classes, while 15 % were resistant to three or more. The most common pattern was resistance to all five antibiotic classes (5.2 %) (Table 5.12).
• Proportions of multiresistance (resistant (R) to at least three of the five considered antibiotic classes) were: below 1 % in two countries, 1–5 % in five countries (including two countries with exactly 5 %), 5–10 % in eight countries, 10–25 % in nine countries and 25–50 % in four countries (including Romania with exactly 50 %) (Table 5.11).
• Trends for the period 2007–2010 were calculated for 22 countries. Significant increasing trends of multire-sistance were observed for two countries (Malta and
France), which in 2010 reported proportions of mul-tiresistance of 28.6 % and 14.7 % respectively (Figure 5.41).
• Significant decreasing trends of multiresistance have been observed for three countries (Greece, Italy and Germany), which in 2010 reported proportions of mul-tiresistance of 42.5 %, 20.8 %, and 9.5 %, respectively. Only for Greece did the trend remain significant when including only data from laboratories consistently reporting all four years (Figure 5.41).
5.6.4 Conclusions
High proportions of resistance of P. aeruginosa to antimicrobials have been reported by many countries especially in southern and eastern Europe. Combined resistance is also common with 15 % of the isolates resistant to at least three antimicrobial classes (multire-sistance) and with 5 % of the isolates resistant to all five antimicrobial classes under surveillance. Despite the high proportions of resistance, the situation appears generally stable in Europe with few countries reporting significant increasing or decreasing trends of resistance to different antimicrobial agents.

63
Antimicrobial resistance surveillance in Europe 2010SURVEILLANCE REPORT
Figure 5.35: Pseudomonas aeruginosa: proportion of invasive isolates resistant to carbapenems in 2010
LuxembourgLiechtenstein
Malta
toto
No data reported or less than 10 isolatesNot included
toto
Non-visible countries
Table 5.11: Number and proportion of invasive P. aeruginosa isolates resistant to piperacillin±tazobactam, fluoroquinolones, ceftazidime, aminoglycosides, carbapenems and multiresistant (%R), including 95% confidence intervals (95% CI), reported per country in 2010
CountryPiperacillin± tazobactam Fluoroquinolones Ceftazidime Aminoglycosides Carbapenems Multiresistance*
N %R (95%CI) N %R (95%CI) N %R (95%CI) N %R (95%CI) N %R (95%CI) N %R (95%CI)Austria 503 8.7 (6-12) 500 15.6 (13-19) 461 7.6 (5-10) 500 10.0 (8-13) 473 14.4 (11-18) 503 8.5 (6-11)Belgium 121 11.6 (6-19) 121 12.4 (7-20) 120 6.7 (3-13) 94 13.8 (8-22) 130 4.6 (2-10) 121 5.0 (2-10)Bulgaria 41 14.6 (6-29) 42 21.4 (10-37) 37 18.9 (8-35) 42 19.0 (9-34) 42 31.0 (18-47) 42 14.3 (5-29)Cyprus 48 18.8 (9-33) 47 17.0 (8-31) 48 16.7 (7-30) 48 10.4 (3-23) 48 29.2 (17-44) 48 14.6 (6-28)Czech Republic 510 27.6 (24-32) 510 40.8 (36-45) 509 28.5 (25-33) 510 32.4 (28-37) 510 16.5 (13-20) 510 29.4 (25-34)Denmark 361 3.9 (2-6) 360 6.1 (4-9) 358 2.8 (1-5) 375 1.3 (0-3) 356 3.1 (2-5) 360 1.9 (1-4)Estonia 7 14.3 (0-58) 9 11.1 (0-48) 8 12.5 (0-53) 9 11.1 (0-48) 41 22.0 (11-38) 9 11.1 (0-48)Finland 270 7.0 (4-11) 280 11.1 (8-15) 281 2.8 (1-6) 270 4.1 (2-7) 275 9.8 (7-14) 281 5.3 (3-9)France 1 125 20.3 (18-23) 1 181 22.8 (20-25) 1 009 12.7 (11-15) 1 121 18.6 (16-21) 1 186 17.8 (16-20) 1191 14.7 (13-17)Germany 315 15.6 (12-20) 315 18.4 (14-23) 309 8.1 (5-12) 315 10.2 (7-14) 311 12.5 (9-17) 315 9.5 (7-13)Greece 998 38.9 (36-42) 985 45.7 (43-49) 967 40.2 (37-43) 994 41.8 (39-45) 999 43.1 (40-46) 981 42.5 (39-46)Hungary 596 13.8 (11-17) 629 26.7 (23-30) 635 10.6 (8-13) 634 29.0 (26-33) 635 24.9 (22-28) 636 17.8 (15-21)Iceland 12 8.3 (0-38) 12 16.7 (2-48) 12 8.3 (0-38) 12 0.0 (0-26) 12 0.0 (0-26) 12 8.3 (0-38)Ireland 218 8.3 (5-13) 218 10.6 (7-15) 216 6.0 (3-10) 219 4.6 (2-8) 216 6.5 (4-11) 219 5.0 (3-9)Italy 429 21.2 (17-25) 467 31.0 (27-35) 407 17.7 (14-22) 467 23.3 (20-27) 509 22.0 (18-26) 467 20.8 (17-25)Latvia 21 19.0 (5-42) 21 19.0 (5-42) 21 9.5 (1-30) 21 28.6 (11-52) 21 14.3 (3-36) 21 9.5 (1-30)Lithuania 31 6.5 (1-21) 31 16.1 (5-34) 31 9.7 (2-26) 31 12.9 (4-30) 30 26.7 (12-46) 31 9.7 (2-26)Luxembourg 25 8.0 (1-26) 25 20.0 (7-41) 25 0.0 (0-14) 25 8.0 (1-26) 25 8.0 (1-26) 25 8.0 (1-26)Malta 42 35.7 (22-52) 42 23.8 (12-39) 42 14.3 (5-29) 42 31.0 (18-47) 42 23.8 (12-39) 42 28.6 (16-45)Netherlands 374 4.3 (2-7) 375 4.3 (2-7) 372 2.7 (1-5) 376 2.4 (1-4) 371 2.7 (1-5) 375 1.1 (0-3)Norway 163 3.1 (1-7) 165 3.6 (1-8) 162 2.5 (1-6) 167 0.6 (0-3) 168 1.2 (0-4) 167 0.6 (0-3)Poland 163 29.4 (23-37) 158 27.8 (21-36) 151 21.9 (16-29) 145 29.7 (22-38) 167 24.6 (18-32) 163 23.3 (17-31)Portugal 215 16.7 (12-22) 203 21.2 (16-27) 216 12.0 (8-17) 216 13.9 (10-19) 203 16.3 (11-22) 217 13.8 (10-19)Romania 8 62.5 (24-91) 9 55.6 (21-86) 10 60.0 (26-88) 10 50.0 (19-81) 10 70.0 (35-93) 10 50.0 (19-81)Slovenia 95 14.7 (8-23) 95 9.5 (4-17) 95 5.3 (2-12) 93 8.6 (4-16) 89 19.1 (12-29) 95 9.5 (4-17)Spain 749 6.4 (5-8) 749 24.8 (22-28) 749 7.5 (6-10) 749 18.2 (15-21) 749 17.8 (15-21) 749 12.3 (10-15)Sweden 272 1.1 (0-3) 317 6.3 (4-10) 311 2.9 (1-5) 278 0.0 (0-1) 337 4.5 (3-7) 329 0.3 (0-2)United Kingdom 491 3.9 (2-6) 568 6.7 (5-9) 533 4.9 (3-7) 575 1.9 (1-3) 493 6.5 (4-9) 566 2.1 (1-4)
* Multiresistance defined as being resistant to three or more antibiotic classes among piperacillin±tazobactam, ceftazidime, fluoroquinolones, aminoglycosides and carbapenems.
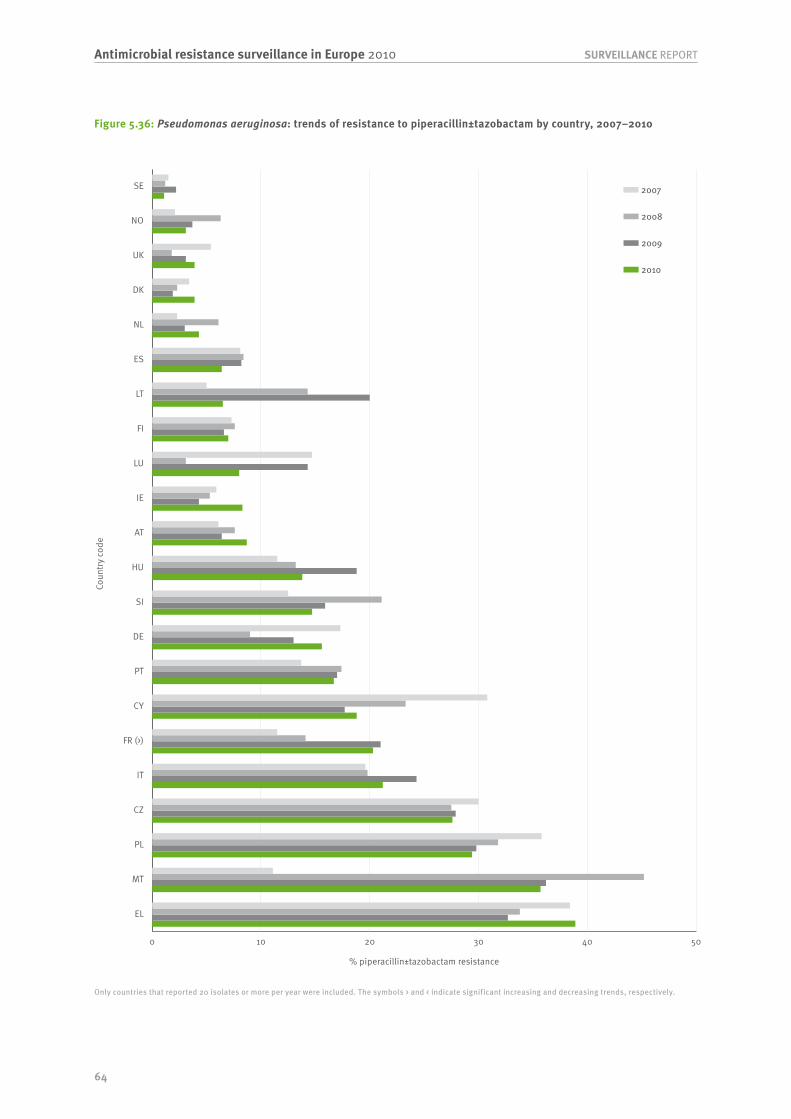
64
SURVEILLANCE REPORTAntimicrobial resistance surveillance in Europe 2010
Figure 5.36: Pseudomonas aeruginosa: trends of resistance to piperacillin±tazobactam by country, 2007–2010
Only countries that reported 20 isolates or more per year were included. The symbols > and < indicate significant increasing and decreasing trends, respectively.
0 10 20 30 40 50
EL
MT
PL
CZ
IT
FR (>)
CY
PT
DE
SI
HU
AT
IE
LU
FI
LT
ES
NL
DK
UK
NO
SE
Coun
try c
ode
% piperacillin±tazobactam resistance
2008
2009
2010
2007

65
Antimicrobial resistance surveillance in Europe 2010SURVEILLANCE REPORT
Figure 5.37: Pseudomonas aeruginosa: trends of resistance to ceftazidime by country, 2007–2010
Only countries that reported 20 isolates or more per year were included. The symbols > and < indicate significant increasing and decreasing trends, respectively. The asterisks indicate significant trends in the overall data that were not supported by data from laboratories consistently reporting for all four years.
0 10 20 30 40 50
EL
CZ (<)
PL
IT (<)
CY
MT
FR (>)
PT (<*)
HU
LT
DE (<*)
AT
ES
IE
SI
UK
SE
FI
DK
NL
NO
LU
Coun
try c
ode
% ceftazidime resistance
2008
2009
2010
2007

66
SURVEILLANCE REPORTAntimicrobial resistance surveillance in Europe 2010
Figure 5.38: Pseudomonas aeruginosa: trends of resistance to fluoroquinolones by country, 2007–2010
Only countries that reported 20 isolates or more per year were included. The symbols > and < indicate significant increasing and decreasing trends, respectively. The asterisks indicate significant trends in the overall data that were not supported by data from laboratories consistently reporting for all four years.
0 10 20 30 40 50
EL (<)
CZ
IT
HU
ES
MT
FR
PT
LU
DE (<*)
CY
LT
AT
FI
IE (<)
SI (<)
UK
SE
DK
NL
NO
Coun
try c
ode
% fluoroquinolone resistance
2008
2009
2010
2007

67
Antimicrobial resistance surveillance in Europe 2010SURVEILLANCE REPORT
Figure 5.39: Pseudomonas aeruginosa: trends of resistance to aminoglycosides by country, 2007–2010
Only countries that reported 20 isolates or more per year were included. The symbols > and < indicate significant increasing and decreasing trends, respectively.
0 10 20 30 40 50
EL (<)
CZ
MT (>)
PL
HU
IT
FR
ES
PT
LT (<)
CY (<)
DE
AT
SI
LU
IE
FI
NL
UK (<)
DK
NO
SE
Coun
try c
ode
% aminoglycoside resistance
2008
2009
2010
2007
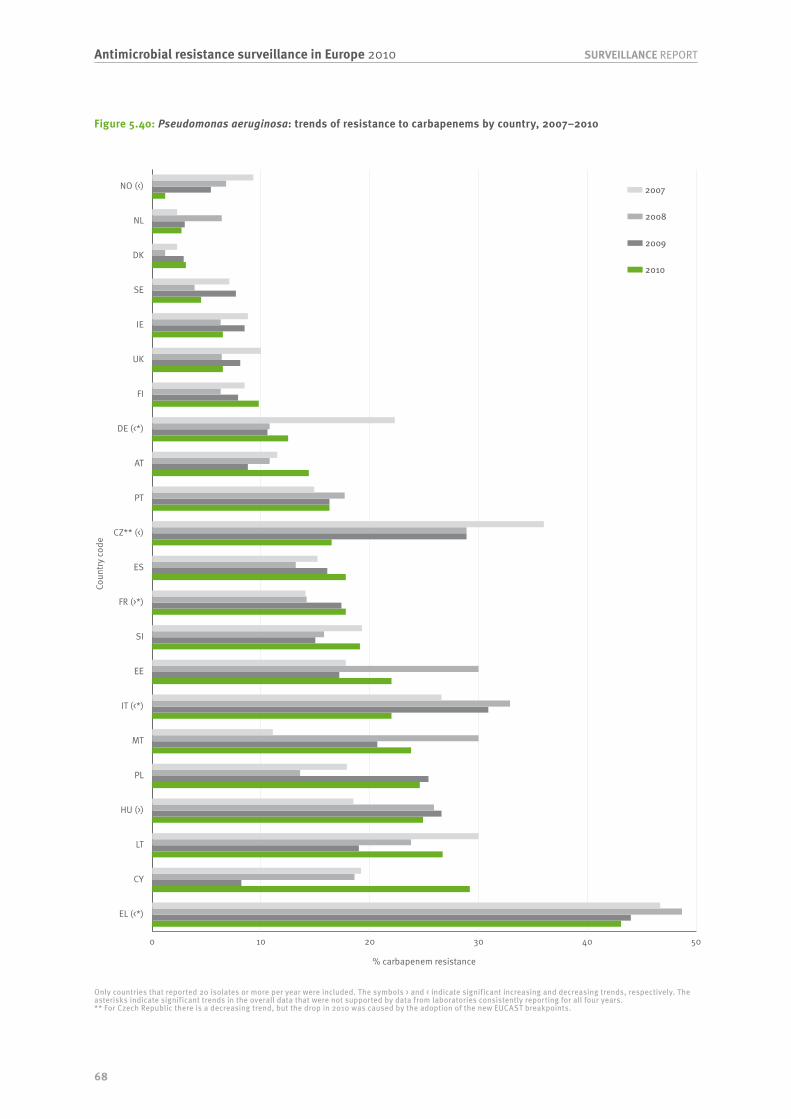
68
SURVEILLANCE REPORTAntimicrobial resistance surveillance in Europe 2010
Figure 5.40: Pseudomonas aeruginosa: trends of resistance to carbapenems by country, 2007–2010
Only countries that reported 20 isolates or more per year were included. The symbols > and < indicate significant increasing and decreasing trends, respectively. The asterisks indicate significant trends in the overall data that were not supported by data from laboratories consistently reporting for all four years.** For Czech Republic there is a decreasing trend, but the drop in 2010 was caused by the adoption of the new EUCAST breakpoints.
0 10 20 30 40 50
EL (<*)
CY
LT
HU (>)
PL
MT
IT (<*)
EE
SI
FR (>*)
ES
CZ** (<)
PT
AT
DE (<*)
FI
UK
IE
SE
DK
NL
NO (<)
Coun
try c
ode
% carbapenem resistance
2008
2009
2010
2007
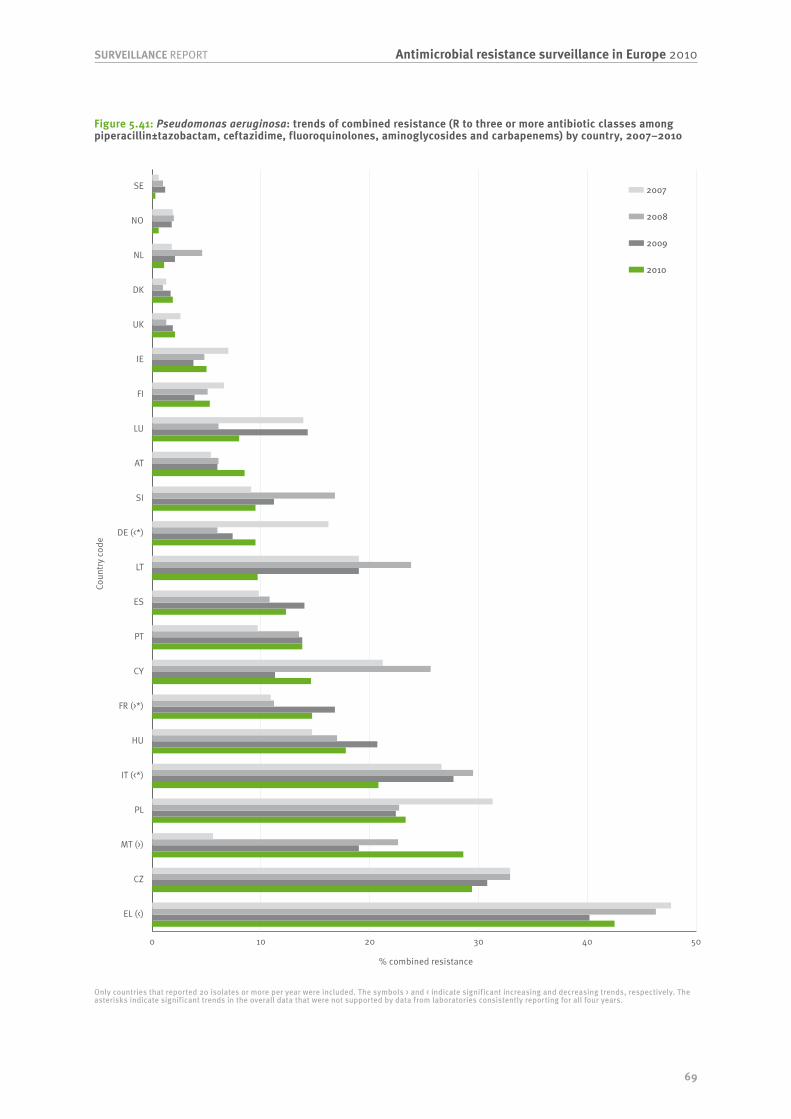
69
Antimicrobial resistance surveillance in Europe 2010SURVEILLANCE REPORT
Figure 5.41: Pseudomonas aeruginosa: trends of combined resistance (R to three or more antibiotic classes among piperacillin±tazobactam, ceftazidime, fluoroquinolones, aminoglycosides and carbapenems) by country, 2007–2010
Only countries that reported 20 isolates or more per year were included. The symbols > and < indicate significant increasing and decreasing trends, respectively. The asterisks indicate significant trends in the overall data that were not supported by data from laboratories consistently reporting for all four years.
0 10 20 30 40 50
EL (<)
CZ
MT (>)
PL
IT (<*)
HU
FR (>*)
CY
PT
ES
LT
DE (<*)
SI
AT
LU
FI
IE
UK
DK
NL
NO
SE
Coun
try c
ode
% combined resistance
2008
2009
2010
2007
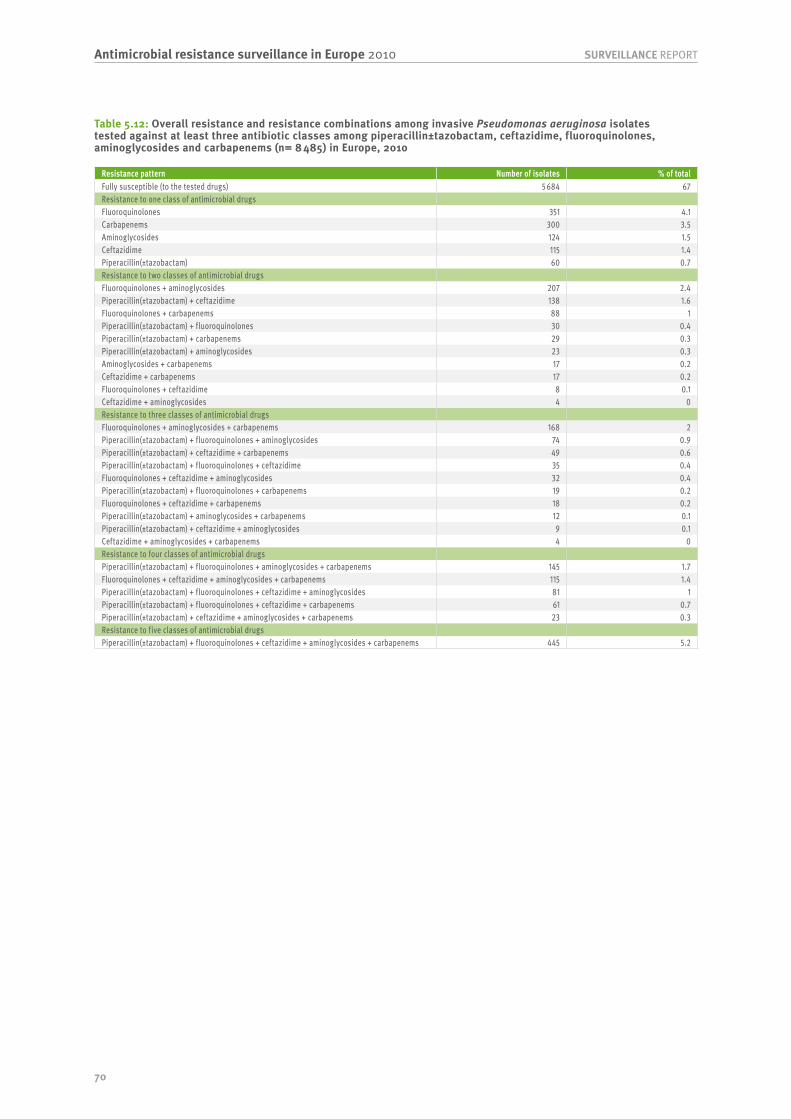
70
SURVEILLANCE REPORTAntimicrobial resistance surveillance in Europe 2010
Table 5.12: Overall resistance and resistance combinations among invasive Pseudomonas aeruginosa isolates tested against at least three antibiotic classes among piperacillin±tazobactam, ceftazidime, fluoroquinolones, aminoglycosides and carbapenems (n= 8 485) in Europe, 2010
Resistance pattern Number of isolates % of totalFully susceptible (to the tested drugs) 5 684 67Resistance to one class of antimicrobial drugsFluoroquinolones 351 4.1Carbapenems 300 3.5Aminoglycosides 124 1.5Ceftazidime 115 1.4Piperacillin(±tazobactam) 60 0.7Resistance to two classes of antimicrobial drugsFluoroquinolones + aminoglycosides 207 2.4Piperacillin(±tazobactam) + ceftazidime 138 1.6Fluoroquinolones + carbapenems 88 1Piperacillin(±tazobactam) + fluoroquinolones 30 0.4Piperacillin(±tazobactam) + carbapenems 29 0.3Piperacillin(±tazobactam) + aminoglycosides 23 0.3Aminoglycosides + carbapenems 17 0.2Ceftazidime + carbapenems 17 0.2Fluoroquinolones + ceftazidime 8 0.1Ceftazidime + aminoglycosides 4 0Resistance to three classes of antimicrobial drugsFluoroquinolones + aminoglycosides + carbapenems 168 2Piperacillin(±tazobactam) + fluoroquinolones + aminoglycosides 74 0.9Piperacillin(±tazobactam) + ceftazidime + carbapenems 49 0.6Piperacillin(±tazobactam) + fluoroquinolones + ceftazidime 35 0.4Fluoroquinolones + ceftazidime + aminoglycosides 32 0.4Piperacillin(±tazobactam) + fluoroquinolones + carbapenems 19 0.2Fluoroquinolones + ceftazidime + carbapenems 18 0.2Piperacillin(±tazobactam) + aminoglycosides + carbapenems 12 0.1Piperacillin(±tazobactam) + ceftazidime + aminoglycosides 9 0.1Ceftazidime + aminoglycosides + carbapenems 4 0Resistance to four classes of antimicrobial drugsPiperacillin(±tazobactam) + fluoroquinolones + aminoglycosides + carbapenems 145 1.7Fluoroquinolones + ceftazidime + aminoglycosides + carbapenems 115 1.4Piperacillin(±tazobactam) + fluoroquinolones + ceftazidime + aminoglycosides 81 1Piperacillin(±tazobactam) + fluoroquinolones + ceftazidime + carbapenems 61 0.7Piperacillin(±tazobactam) + ceftazidime + aminoglycosides + carbapenems 23 0.3Resistance to five classes of antimicrobial drugsPiperacillin(±tazobactam) + fluoroquinolones + ceftazidime + aminoglycosides + carbapenems 445 5.2
71
Antimicrobial resistance surveillance in Europe 2010SURVEILLANCE REPORT
Bibliography• Prevention of pneumococcal disease: recommendations of the
Advisory Committee on Immunization Practices (ACIP). MMWR Recomm Rep 1997;46:1-24.
• Arthur M, Molinas C, Depardieu F, Courvalin P. Characterization of Tn1546, a Tn3-related transposon conferring glycopeptide resist-ance by synthesis of depsipeptide peptidoglycan precursors in Enterococcus faecium BM4147. J Bacteriol 1993;175:117-27.
• Banerjee SN, Emori TG, Culver DH, Gaynes RP, Jarvis WR, Horan T et al. Secular trends in nosocomial primary bloodstream infections in the United States, 1980–1989. National Nosocomial Infections Surveillance System. Am J Med 1991;91:86S-9S.
• Benyacoub J, Czarnecki-Maulden GL, Cavadini C, Sauthier T, Anderson RE, Schiffrin EJ et al. Supplementation of food with Enterococcus faecium (SF68) stimulates immune functions in young dogs. J Nutr 2003;133:1158-62.
• Berger-Bachi B, Rohrer S. Factors influencing methicillin resistance in staphylococci. Arch Microbiol 2002;178:165-71.
• Chow JW. Aminoglycoside resistance in enterococci. Clin Infect Dis 2000;31:586-9.
• Cosgrove SE, Sakoulas G, Perencevich EN, Schwaber MJ, Karchmer AW, Carmeli Y. Comparison of mortality associated with methicillin-resistant and methicillin-susceptible Staphylococcus aureus bac-teremia: a meta-analysis. Clin Infect Dis 2003;36:53-9.
• DiazGranados CA, Jernigan JA. Impact of vancomycin resistance on mortality among patients with neutropenia and enterococcal blood-stream infection. J Infect Dis 2005;191:588-95.
• Diekema DJ, Pfaller MA, Schmitz FJ, Smayevsky J, Bell J, Jones RN et al. Survey of infections due to Staphylococcus species: frequency of occurrence and antimicrobial susceptibility of isolates collected in the United States, Canada, Latin America, Europe, and the Western Pacific region for the SENTRY Antimicrobial Surveillance Program, 1997–1999. Clin Infect Dis 2001;32 Suppl 2:S114-32.
• Evans AS BP. Bacterial infections of humans, epidemiology and con-trol. New York: Plenum Medical Book Company; 1991. p. 525-46.
• Fluit AC, Jones ME, Schmitz FJ, Acar J, Gupta R, Verhoef J. Antimicrobial susceptibility and frequency of occurrence of clinical blood isolates in Europe from the SENTRY antimicrobial surveillance program, 1997 and 1998. Clin Infect Dis 2000;30:454-60.
• Fontana R, Ligozzi M, Pittaluga F, Satta G. Intrinsic penicillin resist-ance in enterococci. Microb Drug Resist 1996;2:209-13.
• Franz CM, Holzapfel WH, Stiles ME. Enterococci at the crossroads of food safety? Int J Food Microbiol 1999;47:1-24.
• Garau J. Role of beta-lactam agents in the treatment of community-acquired pneumonia. Eur J Clin Microbiol Infect Dis 2005;24:83-99.
• Gold HS, Moellering RC Jr. Antimicrobial-drug resistance. N Engl J Med 1996;335:1445-53.
• Hausdorff WP, Bryant J, Kloek C, Paradiso PR, Siber GR. The con-tribution of specific pneumococcal serogroups to different disease manifestations: implications for conjugate vaccine formulation and use, part II. Clin Infect Dis 2000;30:122-40.
• Hausdorff WP, Bryant J, Paradiso PR, Siber GR. Which pneumo-coccal serogroups cause the most invasive disease: implications for conjugate vaccine formulation and use, part I. Clin Infect Dis 2000;30:100-21.
• Hausdorff WP, Siber G, Paradiso PR. Geographical differences in invasive pneumococcal disease rates and serotype frequency in young children. Lancet 2001;357:950-2.
• Hawkey PM. Mechanisms of quinolone action and microbial response. J Antimicrob Chemother 2003;51 Suppl 1:29-35.
• Herwaldt LA. Control of methicillin-resistant Staphylococcus aureus in the hospital setting. Am J Med 1999;106:11S-8S; discussion 48S-52S.
• Hiramatsu K, Cui L, Kuroda M, Ito T. The emergence and evolution of methicillin-resistant Staphylococcus aureus. Trends Microbiol 2001;9:486-93.
• Huycke MM, Sahm DF, Gilmore MS. Multiple-drug resistant entero-cocci: the nature of the problem and an agenda for the future. Emerg Infect Dis 1998;4:239-49.
• Jacobs MR. In vivo veritas: in vitro macrolide resistance in systemic Streptococcus pneumoniae infections does result in clinical failure. Clin Infect Dis 2002;35:565-9.
• Jacobs MR. Worldwide trends in antimicrobial resistance among common respiratory tract pathogens in children. Pediatr Infect Dis J 2003;22(8 Suppl):S109-19.
• Jett BD, Huycke MM, Gilmore MS. Virulence of enterococci. Clin Microbiol Rev 1994;7:462-78.
• Karchmer AW. Nosocomial bloodstream infections: organisms, risk factors, and implications. Clin Infect Dis 2000;31 Suppl 4:S139-43.
• Kumarasamy KK, et al. Emergence of a new antibiotic resistance mechanism in India, Pakistan, and the UK: a molecular, biological, and epidemiological study. Lancet Infect Dis 2010;10:597-602.
• Landry SL, Kaiser DL, Wenzel RP. Hospital stay and mortality attrib-uted to nosocomial enterococcal bacteremia: a controlled study. Am J Infect Control 1989;17:323-9.
• Leclercq R, Courvalin P. Resistance to glycopeptides in enterococci. Clin Infect Dis 1997;24:545-54; quiz 555-6.
• Marchaim D, Navon-Venezia S, Schwaber MJ, and Carmeli Y. Isolation of imipenem-resistant Enterobacter species: Emergence of KPC-2 carbapenemase, molecular characterization, epidemiology, and outcomes. Antimicrob Agents Chemother 2008;52(4): 1413–18. Published online 2008 January 28. doi: 10.1128/AAC.01103-07.
• McCormick AW, Whitney CG, Farley MM, Lynfield R, Harrison LH, Bennett NM et al. Geographic diversity and temporal trends of anti-microbial resistance in Streptococcus pneumoniae in the United States. Nat Med 2003;9:424-30.
• McGowan JE. Resistance in nonfermenting gram-negative bacteria: multidrug resistance to the maximum. Am J Infect Control 2006;34(5 Suppl 1).
• Mitra AK, Rabbani GH. A double-blind, controlled trial of bio-florin (Streptococcus faecium SF68) in adults with acute diarrhea due to Vibrio cholerae and enterotoxigenic Escherichia coli. Gastroenterology 1990;99:1149-52.
• Mundy LM, Sahm DF, Gilmore M. Relationships between entero-coccal virulence and antimicrobial resistance. Clin Microbiol Rev 2000;13:513-22.
• Murray BE. Beta-lactamase-producing enterococci. Antimicrob Agents Chemother 1992;36:2355-9.
• Paterson DL. Resistance in gram-negative bacteria: Enterobacteriaceae. Am J Infect Control 2006;34(5 Suppl 1).
• Paterson DL, Ko WC, Von Gottberg A, Mohapatra S, Casellas JM, Goossens H et al. International prospective study of Klebsiella pneumoniae bacteremia: implications of extended-spectrum beta-lactamase production in nosocomial Infections. Ann Intern Med 2004;140:26-32.
• Perichon B, Reynolds P, Courvalin P. VanD-type glycopeptide-resist-ant Enterococcus faecium BM4339. Antimicrob Agents Chemother 1997;41:2016-8.
• Peterson LR. Squeezing the antibiotic balloon: the impact of anti-microbial classes on emerging resistance. Clin Microbiol Infect 2005;11 Suppl 5.
• Reacher MH, Shah A, Livermore DM, Wale MC, Graham C, Johnson AP, et al. Bacteraemia and antibiotic resistance of its pathogens reported in England and Wales between 1990 and 1998: trend analy-sis. BMJ 2000;320:213-6.
• Rodriguez-Martinez JM, Poirel L, Pascual A, Nordmann P. Plasmid-mediated quinolone resistance in Australia. Microb Drug Resist 2006;12:99-102.
• Strahilevitz J, Jacoby GA, Hooper DC, Robicsek A. Plasmid-mediated quinolone resistance: a multifaceted threat. Clin Microbiol Rev. 2009;22:664-89.
• Schmitt HJ. Pneumococcal conjugate vaccines in Europe, Berlin, Germany, 23-25 August 2000. Report of a European advisory board meeting. Vaccine 2001;19:3347-54.
• Shepard BD, Gilmore MS. Antibiotic-resistant enterococci: the mechanisms and dynamics of drug introduction and resistance. Microbes Infect 2002;4:215-24.
• Sturenburg E, Mack D. Extended-spectrum beta-lactamases: impli-cations for the clinical microbiology laboratory, therapy, and infec-tion control. J Infect 2003;47:273-95.
• Vatopoulos A. High rates of metallo-beta-lactamase-producing Klebsiella pneumoniae in Greece – a review of the current evidence. Euro Surveill 2008; 13(4) pii 8023.
• Watson DA, Musher DM. A brief history of the pneumococcus in bio-medical research. Semin Respir Infect 1999;14:198-208.
• Weisblum B. Insights into erythromycin action from studies of its activity as inducer of resistance. Antimicrob Agents Chemother 1995;39:797-805.
• Willems RJ, Top J, van Santen M, Robinson DA, Coque TM, Baquero F et al. Global spread of vancomycin-resistant Enterococcus fae-cium from distinct nosocomial genetic complex. Emerg Infect Dis 2005;11:821-8.
• Wuorimaa T, Kayhty H. Current state of pneumococcal vaccines. Scand J Immunol 2002;56:111-29.
• Zhong P, Cao Z, Hammond R, Chen Y, Beyer J, Shortridge VD et al. Induction of ribosome methylation in MLS-resistant Streptococcus pneumoniae by macrolides and ketolides. Microb Drug Resist 1999;5:183-8.

72
SURVEILLANCE REPORTAntimicrobial resistance surveillance in Europe 2010
73
Antimicrobial resistance surveillance in Europe 2010SURVEILLANCE REPORT
Annex 1:Technical notes
73


75
Antimicrobial resistance surveillance in Europe 2010SURVEILLANCE REPORT
Technical notes for chapter 4Number of blood culture sets
The total number of blood culture sets was defined as the number of blood samples, not the number of patients sampled.
Patient days
If patient days were not available at hospital level, these were calculated by:
Number of beds * (annual occupancy / 100) * 365
Type of hospitals
Since hospital categorisation was always intricate, more specific definitions from WHO have been implemented to make the categorisation of hospitals easier.
Primary level, often referred to as a district hospital or first-level referral: A hospital with few specialities, mainly internal medicine, obstetrics-gynecology, pae-diatrics, and general surgery, or only general practice; limited laboratory services are available for general, but not for specialised pathological analysis; the bed capac-ity ranges from 30 to 200 beds.
Secondary level, often referred to as provincial hospital: A hospital highly differentiated by function with five to 10 clinical specialities; bed capacity ranging from 200 to 800 beds.
Tertiary level, often referred to as central, regional or tertiary-level hospital: A hospital with highly specialised staff and technical equipment, e.g., cardiology, ICU and specialised imaging units; clinical services are highly differentiated by function; the hospital may have teach-ing activities; bed capacity ranges from 300 to 1 500 beds. A fourth category was for hospitals with a single specialty.
Averaged variables
Annual occupancy rate and length of stay were averaged per country. In these totals only laboratory/hospital questionnaires that provided information on all vari-ables needed for the specific formula were included.
Technical notes for chapter 5Resistance trend analysis
Resistance trends were calculated for the last four years. To determine significant trends over time, the Cochrane–Armitage test was used, excluding countries reporting fewer than 20 isolates per year. To exclude possible biases in the trend analyses, a sensitivity analysis was done, per country, to determine the sensitivity of the trend analysis for using the complete dataset, versus a subset from laboratories reporting all four years. In the graphs, trends were indicated in the following way:
• using ‘<*’ if decreasing or ‘>*’ if increasing when sig-nificant trends were only identified in the complete dataset; and
• using ‘<’ if decreasing or ‘>’ if increasing when a sig-nificant trend was detected in both the subset and the complete dataset.
European maps showing resistance levels
To be included in the maps of Europe displaying the resistance proportions per country, for all pathogen–antimicrobial combinations under surveillance by EARS-Net, a country had to report results for at least 10 isolates.

77
Antimicrobial resistance surveillance in Europe 2010SURVEILLANCE REPORT
Annex 2:Country summary sheets
77

79
Antimicrobial resistance surveillance in Europe 2010SURVEILLANCE REPORT
Explanation to the country summary sheetsGeneral information about EARS-Net participating laboratories and hospitals
Table 1 gives the number of laboratories and isolates reported by year and by pathogen under EARS-Net sur-veillance for the period 2003–2010.
Antibiotic resistance 2003–2010
Table 2 provides information on the proportion of inva-sive bacterial isolates non-susceptible (I+R) or resistant (R) to the antibiotics or antibiotic classes mentioned in the EARSS protocols. When interpreting the results in Table 2, always check the number of isolates provided in Table 1.
Demographic characteristics
Table 3 gives the proportional distribution of the iso-lates reported by source, gender, age, and hospital department, and the proportion of resistance within the different groups, for the period 2009–2010.
The abbreviations used in this table stand for: PNSP = penicillin-non-susceptible S. pneumoniae; MRSA = meticillin-resistant S. aureus; FREC = fluoroquinolone-resistant E. coli; VRE = vancomycin-resistant E. faecalis or E. faecium; CRKP = third-generation cephalosporin-resistant K. pneumoniae; and CRPA = carbapenem-resistant P. aeruginosa.
If the number of isolates in a certain category accounts for less than 0.5% of the total number of isolates, the % total is set at <1.
PNSP at laboratory level/MRSA, FREC and CRKP at hospital level
Figures 1, 2, 3 and 4 show the local variation in the pro-portions of PNSP by laboratory and of MRSA, FREC and CRKP by hospital. These figures are based on data from 2009 and 2010, only including the laboratories and hos-pitals that reported at least five isolates in these two years. The total number of laboratories or hospitals, the minimum, maximum, median, first and third quartile of the proportion of resistance is displayed in a box in the figures.

80
SURVEILLANCE REPORTAntimicrobial resistance surveillance in Europe 2010
Austria
General information about EARS-Net participating laboratories
Antibiotic resistance from 2003 to 2010
Table 1: Number of laboratories and number of isolates reported for the period 2003–2010
YearS. pneumoniae S. aureus E. coli Enterecocci K. pneumoniae P. aeruginosaLabs Isolates Labs Isolates Labs Isolates Labs Isolates Labs Isolates Labs Isolates
2003 20 163 20 871 21 985 19 327 - - - -2004 28 257 30 1453 31 1862 28 604 - - - -2005 31 298 32 1481 33 2058 30 568 7 89 8 772006 32 293 33 1640 33 2483 33 699 30 434 31 4052007 35 322 34 1577 34 2545 33 688 33 445 33 4112008 38 380 38 1899 38 2985 38 864 38 583 38 5102009 38 379 38 1794 38 2625 36 825 37 622 36 5252010 35 375 39 1840 39 2937 39 944 39 722 39 504
Table 2: Proportion (%) of antibiotic non-susceptible isolates
Pathogens by antimicrobial classes 2003 2004 2005 2006 2007 2008 2009 2010Streptococcus pneumoniaePenicillin R 1 1 <1 <1 2 <1 3 2Penicillin RI 9 5 5 5 5 5 5 4Macrolides RI 13 13 15 13 13 12 14 11Staphylococcus aureusOxacillin/Meticillin R 15 14 14 9 11 8 6 7Escherichia coliAminopenicilins R 41 46 49 53 53 50 49 51Aminoglycosides R 5 6 6 8 8 7 6 6Fluoroquinolones R 14 17 19 22 26 23 20 21Third-gen. cephalosporins R 2 3 4 7 9 7 8 7Carbapenems R <1 <1 <1 <1 <1 <1 <1 <1Enterococcus faecalisAminopenicilins RI 1 <1 1 2 2 2 1 2HL Gentamicin R 33 23 29 29 30 21 31 32Vancomycin R <1 <1 <1 <1 <1 <1 <1 <1Enterococcus faeciumAminopenicilins RI 85 85 85 89 82 91 88 92HL Gentamicin R 22 22 30 21 28 19 31 42Vancomycin R <1 <1 1 <1 2 2 4 4Klebsiella pneumoniaeAminoglycosides R - - 3 5 5 6 4 6Fluoroquinolones R - - 11 8 13 12 8 18Third-gen. cephalosporins R - - 6 6 8 8 8 13Carbapenems R - - <1 <1 <1 <1 <1 <1Pseudomonas aeruginosaPiperacillin R - - 13 8 6 8 6 9Ceftazidime R - - 7 9 5 6 6 8Carbapenems R - - 10 15 12 11 9 14Aminoglycosides R - - 6 9 9 8 8 10Fluoroquinolones R - - 14 15 15 12 13 16

81
Antimicrobial resistance surveillance in Europe 2010SURVEILLANCE REPORT
Demographic characteristics
Table 3: Selected details on invasive isolates from the reporting period 2009 and 2010
CharacteristicS. pneumoniae
n=703S. aureus n=3 552
E. coli n=5 541
E. faecalis n=1 083
E. faecium n=664
K. pneumoniae n=1 335
P. aeruginosa n=986
% total % PNSP % total % MRSA % total % FREC % total % VRE % total % VRE % total % CRKP % total % CRPAIsolate sourceBlood 97 4 100 7 100 21 100 1 100 4 100 10 100 11CSF 3 13 - - <1 67 - - - - <1 33 <1 0GenderMale 56 5 58 7 41 25 61 1 60 5 54 13 59 11Female 44 3 41 6 58 18 38 0 39 3 45 7 39 12Unknown <1 0 1 13 1 29 1 0 1 0 1 10 1 21Age (years)0–4 6 5 1 4 1 6 3 0 1 0 1 18 1 05–19 4 3 2 7 1 11 <1 0 1 0 1 0 1 020–64 41 4 33 5 26 20 31 1 36 5 32 12 31 1665 and over 49 4 64 8 72 21 66 0 62 4 66 10 67 10Hospital departmentICU 19 7 10 9 8 25 15 1 27 6 13 13 16 18Internal med. 50 4 47 6 54 19 39 1 34 3 41 9 34 9Surgery 2 0 9 14 6 18 9 1 11 4 9 12 9 9Other 27 4 29 6 28 24 31 0 25 4 33 11 37 13Unknown 2 0 5 4 4 18 6 0 4 4 5 3 4 5
PNSP: penicillin-non-susceptible S. pneumoniae; MRSA: meticillin-resistant S. aureus; FREC: fluoroquinolone-resistant E. coli; VRE: vancomycin-resistant Enterococcus; CRKP: third-generation cephalosporin-resistant K. pneumoniae; CRPA: carbapenems-resistant P. aeruginosa.
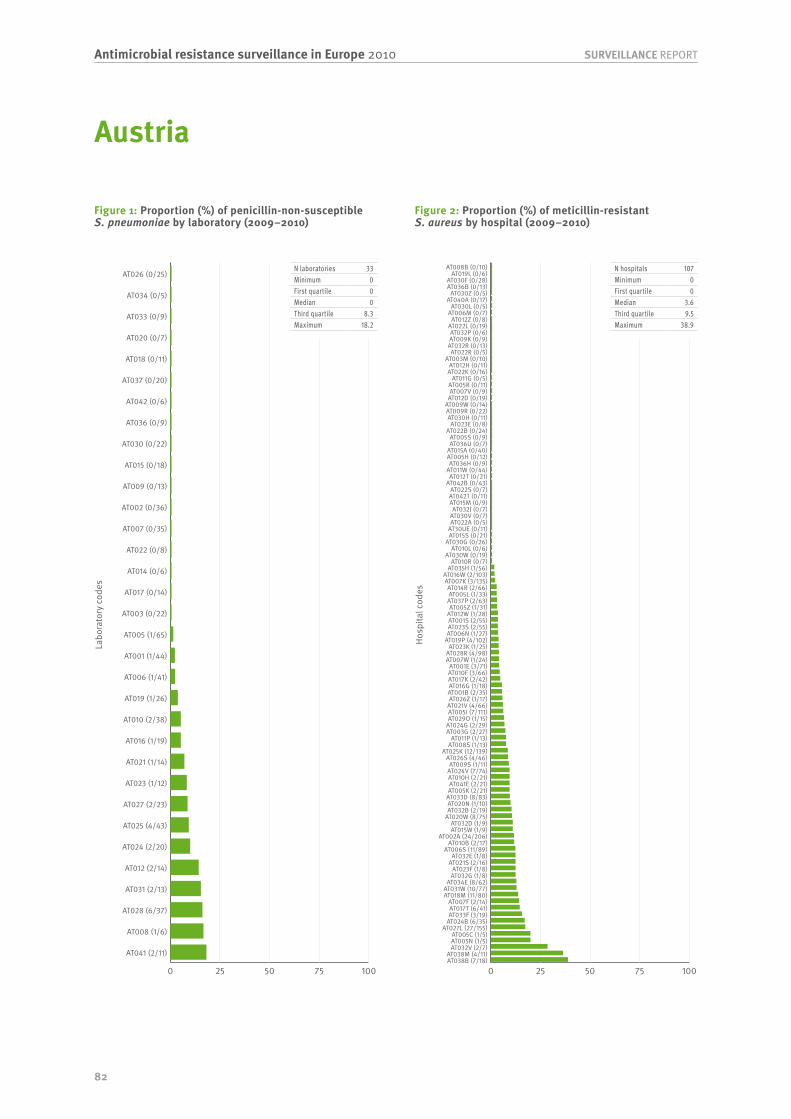
82
SURVEILLANCE REPORTAntimicrobial resistance surveillance in Europe 2010
Labo
rato
ry c
odes
0 25 50 75 100
AT041 (2/11)
AT008 (1/6)
AT028 (6/37)
AT031 (2/13)
AT012 (2/14)
AT024 (2/20)
AT025 (4/43)
AT027 (2/23)
AT023 (1/12)
AT021 (1/14)
AT016 (1/19)
AT010 (2/38)
AT019 (1/26)
AT006 (1/41)
AT001 (1/44)
AT005 (1/65)
AT003 (0/22)
AT017 (0/14)
AT014 (0/6)
AT022 (0/8)
AT007 (0/35)
AT002 (0/36)
AT009 (0/13)
AT015 (0/18)
AT030 (0/22)
AT036 (0/9)
AT042 (0/6)
AT037 (0/20)
AT018 (0/11)
AT020 (0/7)
AT033 (0/9)
AT034 (0/5)
AT026 (0/25)
Hosp
ital c
odes
0 25 50 75 100AT038B (7/18)AT038M (4/11)
AT032V (2/7)AT005N (1/5)AT005C (1/5)
AT027L (27/155)AT024B (6/35)AT033F (3/19)AT017T (6/41)AT007F (2/14)
AT018M (11/80)AT031W (10/77)
AT034E (8/62)AT032G (1/8)AT023F (1/8)
AT021S (2/16)AT032E (1/8)
AT006S (11/89)AT010B (2/17)
AT002A (24/206)AT015W (1/9)AT032D (1/9)
AT020W (8/75)AT032B (2/19)AT020N (1/10)AT033D (8/83)AT005K (2/21)AT041E (2/21)AT010H (2/21)AT024V (7/74)AT009S (1/11)
AT026S (4/46)AT025K (12/139)
AT008S (1/13)AT011P (1/13)
AT003G (2/27)AT024G (2/29)AT029O (1/15)AT005I (7/111)AT021V (4/66)AT026Z (1/17)AT001B (2/35)AT016G (1/18)AT017K (2/42)AT010F (3/66)AT001E (3/71)
AT007W (1/24)AT028R (4/98)AT023K (1/25)
AT019P (4/102)AT006N (1/27)AT023S (2/55)AT001S (2/55)AT012W (1/28)AT005Z (1/31)
AT037P (2/63)AT005L (1/33)AT014R (2/66)
AT007K (3/135)AT016W (2/103)
AT035H (1/56)AT010R (0/7)
AT030W (0/19)AT010L (0/6)
AT030G (0/26)AT015S (0/21)AT30UE (0/11)AT022A (0/5)AT030V (0/7)AT032J (0/7)
AT015M (0/9)AT042T (0/11)AT022S (0/7)
AT042B (0/43)AT012T (0/21)
AT011W (0/44)AT036H (0/9)
AT005H (0/12)AT015A (0/40)AT036U (0/7)AT005S (0/9)
AT022B (0/24)AT023E (0/8)
AT030H (0/11)AT009R (0/22)AT009W (0/14)AT012D (0/19)AT007V (0/9)AT005R (0/11)
AT011G (0/5)AT022K (0/16)AT012H (0/11)
AT003M (0/10)AT022R (0/5)
AT032R (0/13)AT009K (0/9)AT032P (0/6)
AT022L (0/19)AT012Z (0/8)
AT006M (0/7)AT030L (0/5)
AT040A (0/17)AT030Z (0/5)
AT036B (0/13)AT030F (0/28)
AT019L (0/6)AT008B (0/10)
Figure 1: Proportion (%) of penicillin-non-susceptible S. pneumoniae by laboratory (2009–2010)
Figure 2: Proportion (%) of meticillin-resistant S. aureus by hospital (2009–2010)
N laboratories 33Minimum 0First quartile 0Median 0Third quartile 8.3Maximum 18.2
N hospitals 107Minimum 0First quartile 0Median 3.6Third quartile 9.5Maximum 38.9
Austria

83
Antimicrobial resistance surveillance in Europe 2010SURVEILLANCE REPORT
Hosp
ital c
odes
0 25 50 75 100AT015U (4/5)
AT006M (6/12)AT005N (4/8)AT023E (9/19)AT005C (4/9)AT030L (3/7)
AT030Z (4/10)AT005I (76/191)AT005H (11/28)
AT011P (8/21)AT011G (3/8)
AT009W (4/11)AT022K (6/18)AT006B (2/6)AT022A (2/6)
AT006O (5/15)AT012H (4/12)
AT005S (9/27)AT014R (23/74)AT029O (9/29)
AT030G (12/39)AT005J (4/13)
AT035H (32/105)AT038M (8/27)
AT037P (26/88)AT032P (2/7)
AT020N (10/35)AT008K (2/7)
AT030H (8/28)AT022R (3/11)AT006N (3/11)
AT012W (11/42)AT022L (16/62)AT033F (11/43)
AT033D (35/137)AT012D (6/24)AT015M (3/12)
AT017K (13/54)AT011W (15/63)AT009R (5/21)
AT002A (58/244)AT027L (61/266)AT001E (26/114)
AT020W (23/101)AT006S (31/137)
AT031W (24/109)AT019P (24/114)AT018M (23/111)AT030W (6/29)AT026Z (6/29)
AT007K (32/156)AT025K (52/258)
AT023G (1/5)AT016G (5/25)
AT030V (4/20)AT007F (3/15)
AT015A (15/75)AT030F (15/76)AT042B (11/56)AT038B (5/26)
AT001S (23/121)AT005Z (9/48)AT007W (5/27)
AT041E (19/109)AT028R (35/205)
AT021V (11/67)AT032G (3/19)AT040A (5/32)AT021S (2/13)AT017T (8/53)AT010H (5/34)AT042T (2/14)AT022B (3/21)
AT007E (1/7)AT003G (5/35)
AT024V (14/99)AT026S (13/92)
AT016W (20/145)AT010F (10/74)AT023S (13/97)
AT032B (2/15)AT032V (3/23)AT005K (5/39)AT001B (5/39)AT005R (2/16)
AT012Z (1/8)AT30UE (2/16)AT036H (2/17)
AT034E (10/87)AT005L (7/62)AT010R (2/19)AT019L (1/10)AT022S (1/10)
AT036B (2/20)AT008S (3/31)AT024G (5/52)AT010L (2/21)
AT003M (1/11)AT008A (1/11)
AT024B (5/57)AT012T (2/23)
AT010B (6/70)AT032D (1/12)AT009K (1/14)AT015W (1/17)AT007V (2/35)AT015S (1/23)
AT023K (2/48)AT036D (0/7)
AT009S (0/18)AT032R (0/14)
Hosp
ital c
odes
0 25 50 75 100AT038M (3/9)AT040A (2/6)AT005S (2/6)AT030G (2/6)
AT003G (3/10)AT011P (2/7)
AT037P (3/11)AT009K (2/8)AT024G (2/8)
AT035H (5/23)AT019P (5/23)AT024V (3/14)
AT005I (14/67)AT018M (4/22)
AT005R (1/6)AT020W (7/44)
AT005K (2/13)AT033F (2/15)
AT007K (4/32)AT034E (2/16)AT015A (2/16)
AT016W (4/34)AT002A (10/88)
AT005Z (1/9)AT030F (1/9)
AT027L (7/64)AT033D (3/28)
AT017T (1/10)AT005L (1/11)
AT001E (3/38)AT006S (4/52)AT031W (2/31)AT025K (4/63)AT017K (1/16)AT021V (1/17)AT010F (1/20)AT011W (1/24)AT028R (1/61)AT041E (0/18)AT001B (0/7)
AT023S (0/24)AT001S (0/33)AT016G (0/8)AT012D (0/5)
AT006N (0/6)AT005J (0/5)AT021S (0/5)
AT015M (0/6)AT029O (0/8)AT032B (0/8)
AT042B (0/24)AT007V (0/7)AT014R (0/7)AT010B (0/8)AT012W (0/6)
AT023K (0/14)AT008S (0/6)AT036B (0/7)
AT026S (0/10)AT032P (0/5)
AT020N (0/14)AT005H (0/5)AT009R (0/8)AT042T (0/5)
AT022L (0/13)
Figure 3: Proportion (%) of fluoroquinolone-resistant E. coli by hospital (2009–2010)
Figure 4: Proportion (%) of third-generation cephalosporin-resistant K. pneumoniae by hospital (2009–2010)
N hospitals 111Minimum 0First quartile 12.8Median 20Third quartile 28.6Maximum 80
N hospitals 65Minimum 0First quartile 0Median 6.3Third quartile 15.4Maximum 33.3

84
SURVEILLANCE REPORTAntimicrobial resistance surveillance in Europe 2010
Belgium
General information about EARS-Net participating laboratories
Antibiotic resistance from 2003 to 2010
Table 1: Number of laboratories and number of isolates reported for the period 2003–2010
YearS. pneumoniae S. aureus E. coli Enterecocci K. pneumoniae P. aeruginosaLabs Isolates Labs Isolates Labs Isolates Labs Isolates Labs Isolates Labs Isolates
2003 107 1488 47 1133 24 1326 16 146 - - - -2004 95 1443 49 1227 25 1601 18 228 - - - -2005 97 1539 41 1048 25 1592 19 223 - - - -2006 98 1427 33 858 21 1632 22 267 - - - -2007 105 1511 34 855 17 1460 20 245 - - - -2008 101 1647 38 906 16 1430 19 236 - - - -2009 101 1885 34 949 18 1610 14 227 8 142 8 1362010 97 1797 40 1088 23 1966 22 323 14 145 15 130
Table 2: Proportion (%) of antibiotic non-susceptible isolates
Pathogens by antimicrobial classes 2003 2004 2005 2006 2007 2008 2009 2010Streptococcus pneumoniaePenicillin R <1 <1 3 4 3 <1 <1 <1Penicillin RI 12 9 12 10 9 8 <1 <1Macrolides RI 34 33 31 31 25 24 23 25Staphylococcus aureusOxacillin/Meticillin R 30 33 31 22 23 21 21 21Escherichia coliAminopenicilins R 50 50 53 54 57 55 56 57Aminoglycosides R 5 5 4 6 5 4 7 6Fluoroquinolones R 12 15 17 19 19 17 20 22Third-gen. cephalosporins R 3 3 4 3 4 4 6 5Carbapenems R - - - - - - - <1Enterococcus faecalisAminopenicilins RI 1 2 <1 <1 <1 3 1 2HL Gentamicin R 17 22 26 30 26 30 23 18Vancomycin R 1 <1 <1 <1 1 <1 1 <1Enterococcus faeciumAminopenicilins RI 78 63 61 67 68 76 90 89HL Gentamicin R <1 11 22 19 23 17 32 30Vancomycin R <1 5 14 4 <1 5 4 3Klebsiella pneumoniaeAminoglycosides R - - - - - - 10 2Fluoroquinolones R - - - - - - 13 13Third-gen. cephalosporins R - - - - - - 15 13Carbapenems R - - - - - - 1 <1Pseudomonas aeruginosaPiperacillin R - - - - - - 7 12Ceftazidime R - - - - - - 6 7Carbapenems R - - - - - - 9 5Aminoglycosides R - - - - - - 10 14Fluoroquinolones R - - - - - - 16 12

85
Antimicrobial resistance surveillance in Europe 2010SURVEILLANCE REPORT
Demographic characteristics
Table 3: Selected details on invasive isolates from the reporting period 2009 and 2010
CharacteristicS. pneumoniae
n=3 682S. aureus n=2 006
E. coli n=3 286
E. faecalis n=389
E. faecium n=146
K. pneumoniae n=285
P. aeruginosa n=264
% total % PNSP % total % MRSA % total % FREC % total % VRE % total % VRE % total % CRKP % total % CRPAIsolate sourceBlood 96 0 100 21 100 21 100 1 100 3 100 14 100 7CSF 4 8 - - <1 0 - - - - <1 0 <1 0GenderMale 55 0 62 22 46 24 64 1 56 5 57 13 68 4Female 44 0 37 19 53 18 35 0 42 2 42 15 32 13Unknown 1 0 1 7 <1 40 1 0 1 0 <1 0 - -Age (years)0–4 17 1 4 16 2 11 3 0 1 0 5 13 3 05–19 5 1 2 9 1 26 <1 0 - - - - 2 020–64 37 0 34 17 30 17 28 0 33 2 29 15 25 965 and over 41 0 59 24 67 23 68 1 64 4 65 13 71 6Unknown - - - - - - 1 0 1 0 - - - -Hospital departmentICU 7 1 1 4 1 37 7 0 7 0 - - - -Internal med. 15 0 2 16 1 27 10 3 10 0 - - - -Surgery 1 0 1 27 <1 29 3 0 1 0 - - - -Other 15 0 5 16 1 67 5 0 7 0 - - - -Unknown 63 0 91 21 97 20 75 0 76 5 100 14 100 7
PNSP: penicillin-non-susceptible S. pneumoniae; MRSA: meticillin-resistant S. aureus; FREC: fluoroquinolone-resistant E. coli; VRE: vancomycin-resistant Enterococcus; CRKP: third-generation cephalosporin-resistant K. pneumoniae; CRPA: carbapenems-resistant P. aeruginosa.

86
SURVEILLANCE REPORTAntimicrobial resistance surveillance in Europe 2010
Labo
rato
ry c
odes
0 25 50 75 100BE109 (1/5)
BE154 (1/21)BE044 (1/27)BE095 (1/31)
BE048 (1/34)BE143 (1/34)BE118 (1/39)
BE063 (1/47)BE008 (1/69)BE043 (1/85)BE033 (0/24)BE161 (0/36)
BE100 (0/24)BE006 (0/48)BE054 (0/48)BE069 (0/14)BE016 (0/76)BE026 (0/18)BE019 (0/33)BE110 (0/32)
BE146 (0/44)BE157 (0/6)
BE092 (0/103)BE061 (0/56)BE060 (0/27)BE057 (0/14)BE159 (0/29)
BE056 (0/104)BE017 (0/17)BE101 (0/42)BE160 (0/23)BE164 (0/38)BE129 (0/15)BE001 (0/62)
BE141 (0/6)BE021 (0/61)BE137 (0/21)
BE105 (0/44)BE005 (0/16)
BE004 (0/48)BE018 (0/19)
BE087 (0/20)BE081 (0/10)BE035 (0/20)BE012 (0/16)BE102 (0/34)BE076 (0/6)
BE051 (0/29)BE002 (0/24)BE024 (0/70)BE014 (0/31)
BE153 (0/5)BE071 (0/25)
BE032 (0/39)BE139 (0/57)
BE049 (0/45)BE111 (0/94)BE113 (0/55)BE115 (0/60)
BE070 (0/84)BE073 (0/12)
BE083 (0/26)BE029 (0/13)BE114 (0/28)BE047 (0/17)BE130 (0/38)BE090 (0/27)BE104 (0/45)BE023 (0/34)BE011 (0/12)
BE103 (0/28)BE152 (0/14)
BE003 (0/34)BE107 (0/24)BE125 (0/15)BE116 (0/33)
BE046 (0/53)BE112 (0/95)
BE077 (0/45)BE007 (0/14)BE031 (0/21)
BE030 (0/64)BE064 (0/19)BE084 (0/31)BE097 (0/69)BE091 (0/88)BE098 (0/36)BE093 (0/31)BE072 (0/23)BE065 (0/10)BE037 (0/30)BE009 (0/10)BE045 (0/48)BE074 (0/50)BE022 (0/46)
BE010 (0/8)BE075 (0/59)
BE108 (0/148)
Hosp
ital c
odes
0 25 50 75 100
BE1361 (5/11)
BE0291 (11/27)
BE1431 (19/55)
BE1601 (3/9)
BE0701 (41/124)
BE0191 (5/16)
BE0321 (26/84)
BE1641 (4/14)
BE1521 (4/14)
BE0221 (14/52)
BE0241 (17/67)
BE0051 (3/12)
BE0061 (18/77)
BE0611 (26/118)
BE0121 (9/41)
BE0971 (21/97)
BE1391 (16/74)
BE0081 (24/119)
BE0161 (24/123)
BE0021 (12/62)
BE1121 (17/88)
BE0741 (17/95)
BE0071 (3/17)
BE0571 (3/17)
BE0451 (9/52)
BE0631 (14/91)
BE0031 (3/20)
BE1611 (1/7)
BE1301 (7/55)
BE0541 (5/43)
BE0561 (1/9)
BE0481 (2/19)
BE1111 (3/30)
BE1151 (10/115)
BE0301 (2/26)
BE0771 (6/107)
Figure 1: Proportion (%) of penicillin-non-susceptible S. pneumoniae by laboratory (2009–2010)
Figure 2: Proportion (%) of meticillin-resistant S. aureus by hospital (2009–2010)
N laboratories 98Minimum 0First quartile 0Median 0Third quartile 0Maximum 20
N hospitals 36Minimum 5.6First quartile 14.6Median 19.8Third quartile 27.7Maximum 45.5
Belgium

87
Antimicrobial resistance surveillance in Europe 2010SURVEILLANCE REPORT
Hosp
ital c
odes
0 25 50 75 100
BE0051 (9/22)
BE0721 (5/14)
BE0121 (25/81)
BE0771 (42/144)
BE1601 (6/21)
BE1641 (10/36)
BE0441 (23/90)
BE1361 (15/62)
BE0631 (54/226)
BE0161 (62/260)
BE0701 (68/287)
BE0611 (51/224)
BE0291 (13/62)
BE0081 (68/339)
BE1391 (30/152)
BE0221 (29/150)
BE0971 (57/309)
BE1121 (41/246)
BE0061 (31/187)
BE0071 (12/82)
BE0031 (5/39)
BE0321 (28/249)
Hosp
ital c
odes
0 25 50 75 100
BE0291 (4/10)
BE1151 (14/53)
BE0921 (7/34)
BE0081 (9/49)
BE0441 (1/11)
BE0611 (1/11)
BE0771 (1/12)
BE0421 (1/13)
BE0031 (1/17)
BE0161 (0/14)
BE1391 (0/14)
BE0061 (0/22)
BE1601 (0/5)
BE1121 (0/8)
BE0241 (0/6)
Figure 3: Proportion (%) of fluoroquinolone-resistant E. coli by hospital (2009–2010)
Figure 4: Proportion (%) of third-generation cephalosporin-resistant K. pneumoniae by hospital (2009–2010)
N hospitals 22Minimum 11.2First quartile 18.4Median 23.2Third quartile 27.8Maximum 40.9
N hospitals 15Minimum 0First quartile 0Median 7.7Third quartile 18.4Maximum 40.0
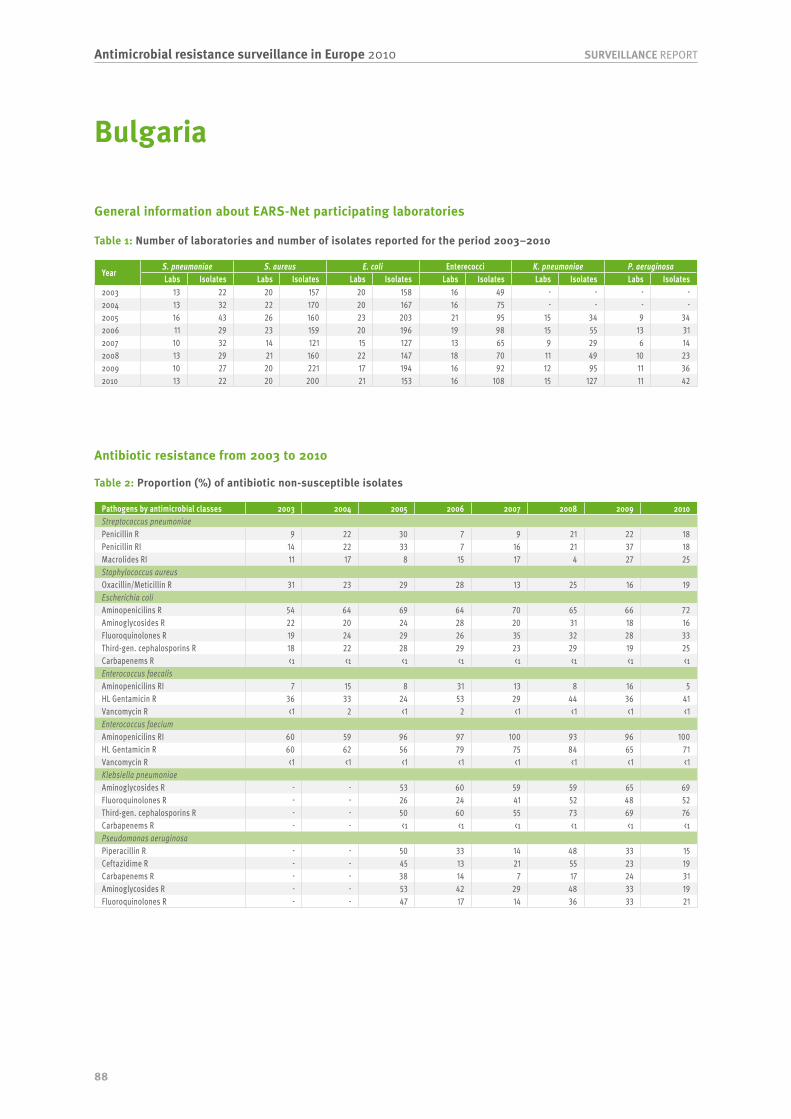
88
SURVEILLANCE REPORTAntimicrobial resistance surveillance in Europe 2010
Bulgaria
General information about EARS-Net participating laboratories
Antibiotic resistance from 2003 to 2010
Table 1: Number of laboratories and number of isolates reported for the period 2003–2010
YearS. pneumoniae S. aureus E. coli Enterecocci K. pneumoniae P. aeruginosaLabs Isolates Labs Isolates Labs Isolates Labs Isolates Labs Isolates Labs Isolates
2003 13 22 20 157 20 158 16 49 - - - -2004 13 32 22 170 20 167 16 75 - - - -2005 16 43 26 160 23 203 21 95 15 34 9 342006 11 29 23 159 20 196 19 98 15 55 13 312007 10 32 14 121 15 127 13 65 9 29 6 142008 13 29 21 160 22 147 18 70 11 49 10 232009 10 27 20 221 17 194 16 92 12 95 11 362010 13 22 20 200 21 153 16 108 15 127 11 42
Table 2: Proportion (%) of antibiotic non-susceptible isolates
Pathogens by antimicrobial classes 2003 2004 2005 2006 2007 2008 2009 2010Streptococcus pneumoniaePenicillin R 9 22 30 7 9 21 22 18Penicillin RI 14 22 33 7 16 21 37 18Macrolides RI 11 17 8 15 17 4 27 25Staphylococcus aureusOxacillin/Meticillin R 31 23 29 28 13 25 16 19Escherichia coliAminopenicilins R 54 64 69 64 70 65 66 72Aminoglycosides R 22 20 24 28 20 31 18 16Fluoroquinolones R 19 24 29 26 35 32 28 33Third-gen. cephalosporins R 18 22 28 29 23 29 19 25Carbapenems R <1 <1 <1 <1 <1 <1 <1 <1Enterococcus faecalisAminopenicilins RI 7 15 8 31 13 8 16 5HL Gentamicin R 36 33 24 53 29 44 36 41Vancomycin R <1 2 <1 2 <1 <1 <1 <1Enterococcus faeciumAminopenicilins RI 60 59 96 97 100 93 96 100HL Gentamicin R 60 62 56 79 75 84 65 71Vancomycin R <1 <1 <1 <1 <1 <1 <1 <1Klebsiella pneumoniaeAminoglycosides R - - 53 60 59 59 65 69Fluoroquinolones R - - 26 24 41 52 48 52Third-gen. cephalosporins R - - 50 60 55 73 69 76Carbapenems R - - <1 <1 <1 <1 <1 <1Pseudomonas aeruginosaPiperacillin R - - 50 33 14 48 33 15Ceftazidime R - - 45 13 21 55 23 19Carbapenems R - - 38 14 7 17 24 31Aminoglycosides R - - 53 42 29 48 33 19Fluoroquinolones R - - 47 17 14 36 33 21
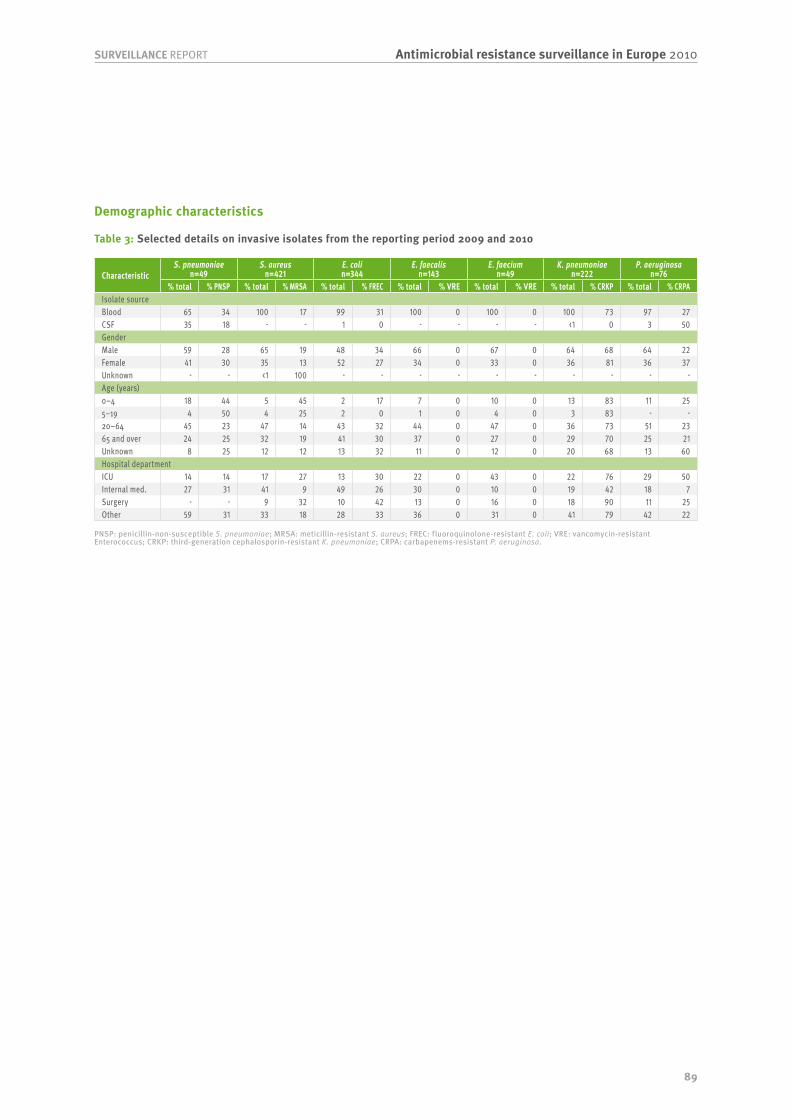
89
Antimicrobial resistance surveillance in Europe 2010SURVEILLANCE REPORT
Demographic characteristics
Table 3: Selected details on invasive isolates from the reporting period 2009 and 2010
CharacteristicS. pneumoniae
n=49S. aureus
n=421E. coli n=344
E. faecalis n=143
E. faecium n=49
K. pneumoniae n=222
P. aeruginosa n=76
% total % PNSP % total % MRSA % total % FREC % total % VRE % total % VRE % total % CRKP % total % CRPAIsolate sourceBlood 65 34 100 17 99 31 100 0 100 0 100 73 97 27CSF 35 18 - - 1 0 - - - - <1 0 3 50GenderMale 59 28 65 19 48 34 66 0 67 0 64 68 64 22Female 41 30 35 13 52 27 34 0 33 0 36 81 36 37Unknown - - <1 100 - - - - - - - - - -Age (years)0–4 18 44 5 45 2 17 7 0 10 0 13 83 11 255–19 4 50 4 25 2 0 1 0 4 0 3 83 - -20–64 45 23 47 14 43 32 44 0 47 0 36 73 51 2365 and over 24 25 32 19 41 30 37 0 27 0 29 70 25 21Unknown 8 25 12 12 13 32 11 0 12 0 20 68 13 60Hospital departmentICU 14 14 17 27 13 30 22 0 43 0 22 76 29 50Internal med. 27 31 41 9 49 26 30 0 10 0 19 42 18 7Surgery - - 9 32 10 42 13 0 16 0 18 90 11 25Other 59 31 33 18 28 33 36 0 31 0 41 79 42 22
PNSP: penicillin-non-susceptible S. pneumoniae; MRSA: meticillin-resistant S. aureus; FREC: fluoroquinolone-resistant E. coli; VRE: vancomycin-resistant Enterococcus; CRKP: third-generation cephalosporin-resistant K. pneumoniae; CRPA: carbapenems-resistant P. aeruginosa.

90
SURVEILLANCE REPORTAntimicrobial resistance surveillance in Europe 2010
Labo
rato
ry c
odes
0 25 50 75 100
BG003 (3/6)
BG017 (3/9)
BG013 (2/7)
BG005 (1/6)
Hosp
ital c
odes
0 25 50 75 100
BG004A (4/8)
BG022A (4/9)
BG026A (3/8)
BG027A (5/15)
BG006A (9/28)
BG001A (7/26)
BG005A (9/37)
BG018A (6/28)
BG009A (2/10)
BG021A (5/32)
BG003A (4/27)
BG023A (2/14)
BG007A (5/42)
BG013A (1/14)
BG017A (5/78)
BG011A (1/20)
BG002A (0/14)
BG029A (0/6)
Figure 1: Proportion (%) of penicillin-non-susceptible S. pneumoniae by laboratory (2009–2010)
Figure 2: Proportion (%) of meticillin-resistant S. aureus by hospital (2009–2010)
N laboratories 4Minimum 16.7First quartile 22.6Median 31Third quartile 41.7Maximum 50
N hospitals 18Minimum 0First quartile 7.1Median 17.8Third quartile 32.1Maximum 50
Bulgaria
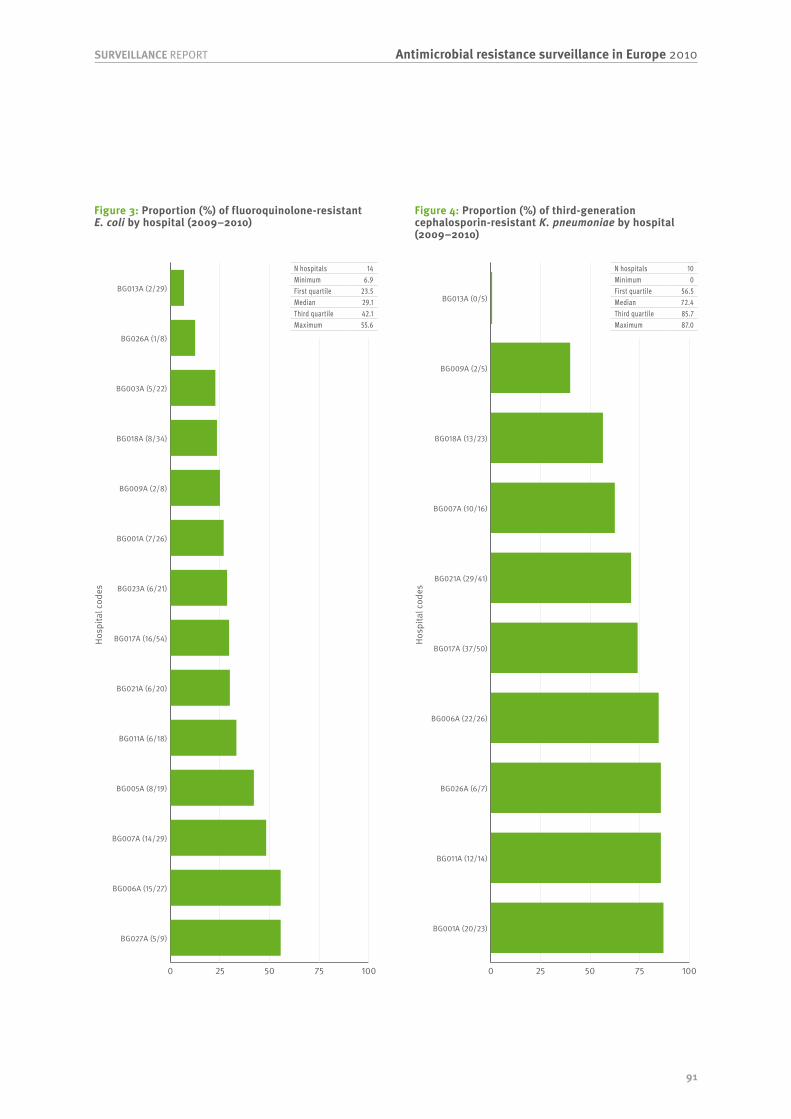
91
Antimicrobial resistance surveillance in Europe 2010SURVEILLANCE REPORT
Hosp
ital c
odes
0 25 50 75 100
BG027A (5/9)
BG006A (15/27)
BG007A (14/29)
BG005A (8/19)
BG011A (6/18)
BG021A (6/20)
BG017A (16/54)
BG023A (6/21)
BG001A (7/26)
BG009A (2/8)
BG018A (8/34)
BG003A (5/22)
BG026A (1/8)
BG013A (2/29)
Hosp
ital c
odes
0 25 50 75 100
BG001A (20/23)
BG011A (12/14)
BG026A (6/7)
BG006A (22/26)
BG017A (37/50)
BG021A (29/41)
BG007A (10/16)
BG018A (13/23)
BG009A (2/5)
BG013A (0/5)
Figure 3: Proportion (%) of fluoroquinolone-resistant E. coli by hospital (2009–2010)
Figure 4: Proportion (%) of third-generation cephalosporin-resistant K. pneumoniae by hospital (2009–2010)
N hospitals 14Minimum 6.9First quartile 23.5Median 29.1Third quartile 42.1Maximum 55.6
N hospitals 10Minimum 0First quartile 56.5Median 72.4Third quartile 85.7Maximum 87.0

92
SURVEILLANCE REPORTAntimicrobial resistance surveillance in Europe 2010
Cyprus
General information about EARS-Net participating laboratories
Antibiotic resistance from 2003 to 2010
Table 1: Number of laboratories and number of isolates reported for the period 2003–2010
YearS. pneumoniae S. aureus E. coli Enterecocci K. pneumoniae P. aeruginosaLabs Isolates Labs Isolates Labs Isolates Labs Isolates Labs Isolates Labs Isolates
2003 1 3 1 28 1 19 1 28 - - - -2004 1 7 3 39 4 46 3 38 - - - -2005 4 16 5 54 5 75 3 40 4 9 4 82006 5 13 5 62 5 90 4 48 4 26 4 372007 4 15 4 85 5 109 3 63 4 39 3 522008 4 14 5 92 4 119 5 85 5 62 5 432009 4 11 5 89 5 136 5 80 5 53 5 622010 4 12 5 99 5 139 5 91 4 67 5 48
Table 2: Proportion (%) of antibiotic non-susceptible isolates
Pathogens by antimicrobial classes 2003 2004 2005 2006 2007 2008 2009 2010Streptococcus pneumoniaePenicillin R <1 <1 <1 31 7 21 18 33Penicillin RI <1 14 19 38 33 43 36 42Macrolides RI 33 <1 13 31 27 29 36 55Staphylococcus aureusOxacillin/Meticillin R 64 49 56 34 48 46 33 32Escherichia coliAminopenicilins R 63 61 72 62 72 58 66 62Aminoglycosides R 11 11 13 10 11 10 10 16Fluoroquinolones R 32 22 29 35 39 45 43 43Third-gen. cephalosporins R 11 9 16 16 18 19 14 20Carbapenems R <1 <1 <1 <1 2 <1 <1 <1Enterococcus faecalisAminopenicilins RI <1 3 3 5 2 16 32 6HL Gentamicin R 43 77 71 44 61 65 66 24Vancomycin R <1 3 <1 <1 <1 1 <1 <1Enterococcus faeciumAminopenicilins RI 100 100 80 43 92 60 80 78HL Gentamicin R - 33 <1 14 33 10 13 <1Vancomycin R <1 33 40 14 25 20 13 <1Klebsiella pneumoniaeAminoglycosides R - - 11 12 13 21 19 19Fluoroquinolones R - - 22 12 23 23 43 39Third-gen. cephalosporins R - - 33 27 31 35 42 34Carbapenems R - - <1 <1 3 10 17 16Pseudomonas aeruginosaPiperacillin R - - 13 27 31 23 18 19Ceftazidime R - - 38 24 15 9 18 17Carbapenems R - - 13 11 19 19 8 29Aminoglycosides R - - 13 11 25 21 5 10Fluoroquinolones R - - 13 27 23 38 13 17

93
Antimicrobial resistance surveillance in Europe 2010SURVEILLANCE REPORT
Demographic characteristics
Table 3: Selected details on invasive isolates from the reporting period 2009 and 2010
CharacteristicS. pneumoniae
n=23S. aureus
n=188E. coli n=274
E. faecalis n=133
E. faecium n=38
K. pneumoniae n=120
P. aeruginosa n=109
% total % PNSP % total % MRSA % total % FREC % total % VRE % total % VRE % total % CRKP % total % CRPAIsolate sourceBlood 91 38 100 32 100 43 100 0 100 5 99 38 99 18CSF 9 50 - - - - - - - - 1 0 1 0GenderMale 74 41 64 34 46 53 62 0 63 8 56 37 60 20Female 26 33 34 30 53 35 37 0 37 0 43 37 34 14Unknown - - 2 25 1 0 1 0 - - 2 50 6 14Age (years)0–4 4 100 8 20 3 11 4 0 5 0 6 0 7 135–19 13 33 2 0 1 50 1 0 - - 2 0 - -20–64 17 75 23 32 16 51 27 0 37 0 35 33 28 1965 and over 30 29 39 42 45 48 49 0 50 5 38 48 40 18Unknown 35 25 28 25 34 35 20 0 8 33 19 39 24 15Hospital departmentICU 4 100 16 35 10 48 44 0 47 11 32 53 39 31Internal med. 70 25 47 30 62 44 26 0 16 0 32 26 25 11Surgery - - 14 46 7 50 12 0 11 0 13 31 10 9Other 26 67 22 27 20 36 18 0 24 0 23 36 25 4Unknown - - 1 50 1 33 - - 3 0 - - 2 50
PNSP: penicillin-non-susceptible S. pneumoniae; MRSA: meticillin-resistant S. aureus; FREC: fluoroquinolone-resistant E. coli; VRE: vancomycin-resistant Enterococcus; CRKP: third-generation cephalosporin-resistant K. pneumoniae; CRPA: carbapenems-resistant P. aeruginosa.

94
SURVEILLANCE REPORTAntimicrobial resistance surveillance in Europe 2010
Labo
rato
ry c
odes
0 25 50 75 100
CY002 (3/7)
CY001 (4/10)
Hosp
ital c
odes
0 25 50 75 100
CY004A (4/11)
CY001A (35/100)
CY002A (19/56)
CY003A (3/17)
Figure 1: Proportion (%) of penicillin-non-susceptible S. pneumoniae by laboratory (2009–2010)
Figure 2: Proportion (%) of meticillin-resistant S. aureus by hospital (2009–2010)
N laboratories 2Minimum 40First quartile 40Median 41.4Third quartile 42.9Maximum 42.9
N hospitals 4Minimum 17.6First quartile 25.8Median 34.5Third quartile 35.7Maximum 36.4
Cyprus

95
Antimicrobial resistance surveillance in Europe 2010SURVEILLANCE REPORT
Hosp
ital c
odes
0 25 50 75 100
CY003A (16/34)
CY001A (65/150)
CY002A (30/70)
CY004A (5/13)
CY005A (2/7)
Hosp
ital c
odes
0 25 50 75 100
CY001A (26/56)
CY002A (15/38)
CY003A (3/14)
CY005A (1/9)
Figure 3: Proportion (%) of fluoroquinolone-resistant E. coli by hospital (2009–2010)
Figure 4: Proportion (%) of third-generation cephalosporin-resistant K. pneumoniae by hospital (2009–2010)
N hospitals 5Minimum 28.6First quartile 38.5Median 42.9Third quartile 43.3Maximum 47.1
N hospitals 4Minimum 11.1First quartile 16.3Median 30.5Third quartile 43Maximum 46.4
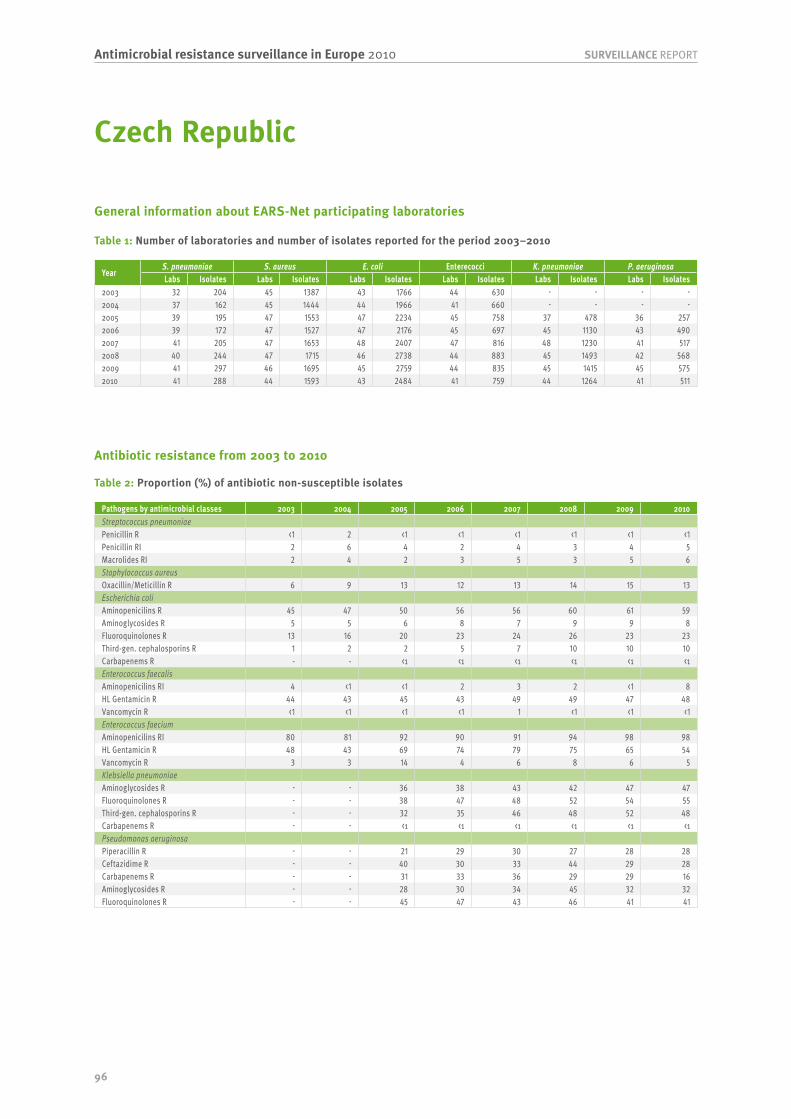
96
SURVEILLANCE REPORTAntimicrobial resistance surveillance in Europe 2010
Czech Republic
General information about EARS-Net participating laboratories
Antibiotic resistance from 2003 to 2010
Table 1: Number of laboratories and number of isolates reported for the period 2003–2010
YearS. pneumoniae S. aureus E. coli Enterecocci K. pneumoniae P. aeruginosaLabs Isolates Labs Isolates Labs Isolates Labs Isolates Labs Isolates Labs Isolates
2003 32 204 45 1387 43 1766 44 630 - - - -2004 37 162 45 1444 44 1966 41 660 - - - -2005 39 195 47 1553 47 2234 45 758 37 478 36 2572006 39 172 47 1527 47 2176 45 697 45 1130 43 4902007 41 205 47 1653 48 2407 47 816 48 1230 41 5172008 40 244 47 1715 46 2738 44 883 45 1493 42 5682009 41 297 46 1695 45 2759 44 835 45 1415 45 5752010 41 288 44 1593 43 2484 41 759 44 1264 41 511
Table 2: Proportion (%) of antibiotic non-susceptible isolates
Pathogens by antimicrobial classes 2003 2004 2005 2006 2007 2008 2009 2010Streptococcus pneumoniaePenicillin R <1 2 <1 <1 <1 <1 <1 <1Penicillin RI 2 6 4 2 4 3 4 5Macrolides RI 2 4 2 3 5 3 5 6Staphylococcus aureusOxacillin/Meticillin R 6 9 13 12 13 14 15 13Escherichia coliAminopenicilins R 45 47 50 56 56 60 61 59Aminoglycosides R 5 5 6 8 7 9 9 8Fluoroquinolones R 13 16 20 23 24 26 23 23Third-gen. cephalosporins R 1 2 2 5 7 10 10 10Carbapenems R - - <1 <1 <1 <1 <1 <1Enterococcus faecalisAminopenicilins RI 4 <1 <1 2 3 2 <1 8HL Gentamicin R 44 43 45 43 49 49 47 48Vancomycin R <1 <1 <1 <1 1 <1 <1 <1Enterococcus faeciumAminopenicilins RI 80 81 92 90 91 94 98 98HL Gentamicin R 48 43 69 74 79 75 65 54Vancomycin R 3 3 14 4 6 8 6 5Klebsiella pneumoniaeAminoglycosides R - - 36 38 43 42 47 47Fluoroquinolones R - - 38 47 48 52 54 55Third-gen. cephalosporins R - - 32 35 46 48 52 48Carbapenems R - - <1 <1 <1 <1 <1 <1Pseudomonas aeruginosaPiperacillin R - - 21 29 30 27 28 28Ceftazidime R - - 40 30 33 44 29 28Carbapenems R - - 31 33 36 29 29 16Aminoglycosides R - - 28 30 34 45 32 32Fluoroquinolones R - - 45 47 43 46 41 41

97
Antimicrobial resistance surveillance in Europe 2010SURVEILLANCE REPORT
Demographic characteristics
Table 3: Selected details on invasive isolates from the reporting period 2009 and 2010
CharacteristicS. pneumoniae
n=585S. aureus n=3 288
E. coli n=5 239
E. faecalis n=1 196
E. faecium n=397
K. pneumoniae n=2 678
P. aeruginosa n=1 085
% total % PNSP % total % MRSA % total % FREC % total % VRE % total % VRE % total % CRKP % total % CRPAIsolate sourceBlood 87 5 100 14 100 23 100 0 100 5 100 50 99 23CSF 13 4 - - <1 9 - - - - <1 18 1 50GenderMale 56 3 61 14 43 27 65 0 63 6 61 52 62 25Female 44 7 39 14 57 20 35 0 37 4 39 47 38 20Unknown - - - - <1 100 - - - - - - - -Age (years)0–4 6 6 4 0 2 5 3 0 2 0 2 26 1 85–19 5 4 2 1 1 29 1 0 1 0 1 50 2 3520–64 48 5 41 12 31 21 41 1 46 9 43 53 45 2665 and over 42 5 53 17 66 24 55 0 51 2 54 49 51 20Unknown - - <1 0 <1 0 - - - - <1 20 <1 0Hospital departmentICU 25 3 25 16 20 25 46 0 44 1 41 56 47 25Internal med. 37 5 44 15 49 22 27 0 19 4 34 44 25 17Surgery 1 17 9 15 6 24 7 1 7 0 8 54 6 29Other 32 4 22 10 25 24 19 0 31 13 17 47 21 24Unknown 4 12 1 30 <1 25 <1 0 - - 1 65 1 33
PNSP: penicillin-non-susceptible S. pneumoniae; MRSA: meticillin-resistant S. aureus; FREC: fluoroquinolone-resistant E. coli; VRE: vancomycin-resistant Enterococcus; CRKP: third-generation cephalosporin-resistant K. pneumoniae; CRPA: carbapenems-resistant P. aeruginosa.
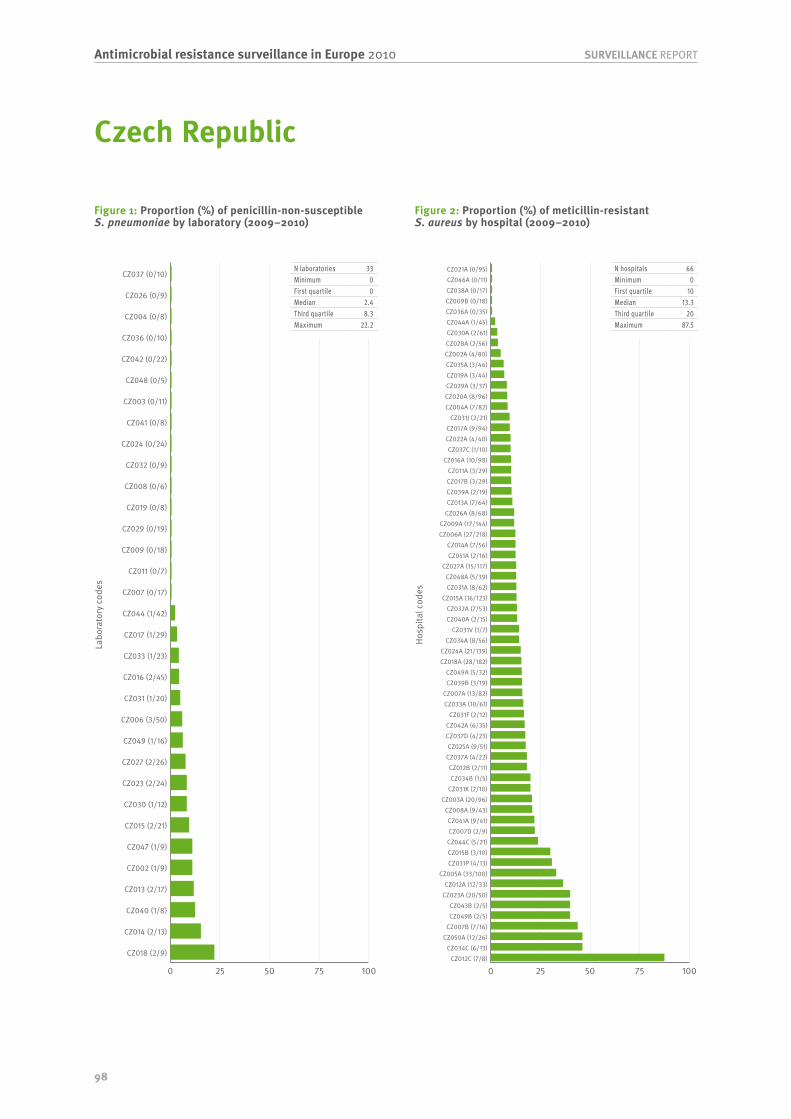
98
SURVEILLANCE REPORTAntimicrobial resistance surveillance in Europe 2010
Labo
rato
ry c
odes
0 25 50 75 100
CZ018 (2/9)
CZ014 (2/13)
CZ040 (1/8)
CZ013 (2/17)
CZ002 (1/9)
CZ047 (1/9)
CZ015 (2/21)
CZ030 (1/12)
CZ023 (2/24)
CZ027 (2/26)
CZ049 (1/16)
CZ006 (3/50)
CZ031 (1/20)
CZ016 (2/45)
CZ033 (1/23)
CZ017 (1/29)
CZ044 (1/42)
CZ007 (0/17)
CZ011 (0/7)
CZ009 (0/18)
CZ029 (0/19)
CZ019 (0/8)
CZ008 (0/6)
CZ032 (0/9)
CZ024 (0/24)
CZ041 (0/8)
CZ003 (0/11)
CZ048 (0/5)
CZ042 (0/22)
CZ036 (0/10)
CZ004 (0/8)
CZ026 (0/9)
CZ037 (0/10)
Hosp
ital c
odes
0 25 50 75 100CZ012C (7/8)
CZ034C (6/13)CZ050A (12/26)
CZ007B (7/16)CZ049B (2/5)CZ043B (2/5)
CZ023A (20/50)CZ012A (12/33)
CZ005A (33/100)CZ031P (4/13)CZ015B (3/10)CZ044C (5/21)CZ007D (2/9)CZ041A (9/41)
CZ008A (9/43)CZ003A (20/96)
CZ031K (2/10)CZ034B (1/5)
CZ012B (2/11)CZ037A (4/22)CZ025A (9/51)
CZ037D (4/23)CZ042A (6/35)
CZ031F (2/12)CZ033A (10/61)CZ007A (13/82)
CZ039B (3/19)CZ049A (5/32)
CZ018A (28/182)CZ024A (21/139)
CZ034A (8/56)CZ031V (1/7)
CZ040A (2/15)CZ032A (7/53)
CZ015A (16/123)CZ031A (8/62)CZ048A (5/39)
CZ027A (15/117)CZ051A (2/16)CZ014A (7/56)
CZ006A (27/218)CZ009A (17/144)
CZ026A (8/68)CZ013A (7/64)CZ039A (2/19)CZ017B (3/29)CZ011A (3/29)
CZ016A (10/98)CZ037C (1/10)
CZ022A (4/40)CZ017A (9/94)
CZ031J (2/21)CZ004A (7/82)CZ020A (8/96)CZ029A (3/37)CZ019A (3/44)CZ035A (3/46)CZ002A (4/80)CZ028A (2/56)CZ030A (2/61)CZ044A (1/45)CZ036A (0/35)CZ009B (0/18)CZ038A (0/17)CZ046A (0/11)CZ021A (0/95)
Figure 1: Proportion (%) of penicillin-non-susceptible S. pneumoniae by laboratory (2009–2010)
Figure 2: Proportion (%) of meticillin-resistant S. aureus by hospital (2009–2010)
N laboratories 33Minimum 0First quartile 0Median 2.4Third quartile 8.3Maximum 22.2
N hospitals 66Minimum 0First quartile 10Median 13.3Third quartile 20Maximum 87.5
Czech Republic

99
Antimicrobial resistance surveillance in Europe 2010SURVEILLANCE REPORT
Hosp
ital c
odes
0 25 50 75 100CZ012C (11/16)CZ034C (9/16)
CZ025A (27/53)CZ049B (8/18)
CZ031C (3/7)CZ007B (13/31)CZ039B (11/29)CZ036A (22/59)CZ017B (20/59)CZ051A (10/30)
CZ002A (66/213)CZ033A (17/56)CZ050A (6/20)
CZ027A (58/194)CZ031A (29/99)
CZ009A (40/138)CZ042A (33/115)
CZ007E (2/7)CZ035A (18/64)
CZ011A (9/32)CZ039A (8/29)
CZ021A (47/171)CZ031K (3/11)
CZ037C (7/26)CZ034A (11/41)
CZ044A (10/38)CZ031J (11/42)
CZ044C (6/23)CZ023A (22/85)CZ041A (16/63)
CZ006A (98/404)CZ005A (42/174)CZ046A (10/42)CZ017A (28/118)CZ049A (16/68)CZ038A (12/51)
CZ026A (20/87)CZ028A (17/74)
CZ018A (52/227)CZ004A (27/120)
CZ037D (10/45)CZ034B (2/9)
CZ024A (43/196)CZ031P (8/38)CZ031F (5/24)
CZ031Y (1/5)CZ007A (22/111)CZ022A (12/61)
CZ013A (22/113)CZ008A (16/83)CZ016A (32/171)
CZ003A (20/107)CZ012B (5/28)
CZ019A (19/112)CZ047B (2/13)CZ037A (8/52)
CZ014A (13/88)CZ012A (5/35)
CZ015A (28/203)CZ048A (7/51)CZ007D (2/15)CZ031V (2/16)
CZ029A (10/86)CZ047A (4/38)
CZ032A (13/134)CZ040A (1/11)
CZ020A (6/86)CZ030A (9/144)
CZ015B (0/11)
Hosp
ital c
odes
0 25 50 75 100CZ043C (7/8)
CZ050A (13/15)CZ031J (12/14)
CZ011A (19/23)CZ007B (25/31)
CZ007E (4/5)CZ043B (4/5)
CZ012C (8/10)CZ023A (30/39)CZ046A (18/24)CZ038A (22/31)CZ031K (12/17)CZ013A (19/27)CZ034C (8/12)
CZ036A (14/21)CZ042A (27/41)CZ047A (13/20)CZ044C (11/17)
CZ009A (130/203)CZ021A (14/22)
CZ025A (25/40)CZ031V (3/5)
CZ007D (3/5)CZ012A (11/19)
CZ027A (66/114)CZ003A (48/83)
CZ051A (4/7)CZ002A (8/14)
CZ041A (13/23)CZ022A (18/32)CZ037A (12/22)CZ028A (19/35)CZ019A (28/53)
CZ006A (107/206)CZ048A (15/29)CZ035A (43/84)CZ049A (22/43)CZ004A (26/51)
CZ039B (6/12)CZ009B (9/18)
CZ026A (33/70)CZ049B (7/15)
CZ007A (20/43)CZ024A (42/91)
CZ018A (83/182)CZ033A (26/59)CZ016A (25/57)
CZ037D (3/7)CZ005A (49/115)
CZ012B (4/10)CZ034A (18/45)CZ017A (23/59)CZ017B (12/33)CZ044A (5/14)
CZ029A (14/40)CZ031F (6/18)
CZ031A (16/49)CZ031P (5/17)
CZ030A (6/21)CZ034B (2/7)
CZ020A (15/56)CZ008A (11/47)
CZ015A (7/38)CZ032A (5/29)CZ014A (6/49)CZ039A (1/10)
Figure 3: Proportion (%) of fluoroquinolone-resistant E. coli by hospital (2009–2010)
Figure 4: Proportion (%) of third-generation cephalosporin-resistant K. pneumoniae by hospital (2009–2010)
N hospitals 69Minimum 0First quartile 18.7Median 23.5Third quartile 28.6Maximum 68.8
N hospitals 66Minimum 10First quartile 40Median 52.4Third quartile 65Maximum 87.5

100
SURVEILLANCE REPORTAntimicrobial resistance surveillance in Europe 2010
Denmark
General information about EARS-Net participating laboratories
Antibiotic resistance from 2003 to 2010
Table 1: Number of laboratories and number of isolates reported for the period 2003–2010
YearS. pneumoniae S. aureus E. coli Enterecocci K. pneumoniae P. aeruginosaLabs Isolates Labs Isolates Labs Isolates Labs Isolates Labs Isolates Labs Isolates
2003 5 606 5 671 - - - - - - - -2004 15 1188 15 1436 - - - - - - - -2005 14 1081 15 1350 5 1283 - - - - - -2006 15 872 15 1279 11 2723 11 711 11 607 - -2007 15 1030 14 1315 12 3021 13 927 13 784 13 4172008 15 934 15 1295 14 3283 14 1005 14 793 14 4202009 15 996 15 1395 14 3532 14 1100 14 822 14 4292010 15 954 15 1362 14 3418 14 1112 14 799 14 376
Table 2: Proportion (%) of antibiotic non-susceptible isolates
Pathogens by antimicrobial classes 2003 2004 2005 2006 2007 2008 2009 2010Streptococcus pneumoniaePenicillin R <1 <1 <1 <1 <1 <1 <1 <1Penicillin RI 3 3 4 4 3 3 4 4Macrolides RI 5 5 6 6 6 7 4 4Staphylococcus aureusOxacillin/Meticillin R <1 1 2 2 <1 2 2 1Escherichia coliAminopenicilins R - - 40 42 43 43 43 46Aminoglycosides R - - 2 3 4 4 4 6Fluoroquinolones R - - 5 7 9 10 13 14Third-gen. cephalosporins R - - 1 2 3 4 6 8Carbapenems R - - <1 <1 <1 <1 <1 <1Enterococcus faecalisAminopenicilins RI - - - <1 2 2 1 <1HL Gentamicin R - - - . . 37 33 36Vancomycin R - - - <1 <1 <1 <1 <1Enterococcus faeciumAminopenicilins RI - - - 87 88 88 88 93HL Gentamicin R - - - . . 61 52 74Vancomycin R - - - <1 <1 <1 2 2Klebsiella pneumoniaeAminoglycosides R - - - 2 6 7 7 6Fluoroquinolones R - - - 6 13 16 16 11Third-gen. cephalosporins R - - - 4 10 9 11 11Carbapenems R - - - <1 <1 <1 <1 <1Pseudomonas aeruginosaPiperacillin R - - - - 3 2 2 4Ceftazidime R - - - - 2 3 4 3Carbapenems R - - - - 2 1 3 3Aminoglycosides R - - - - 1 1 <1 1Fluoroquinolones R - - - - 6 3 5 6
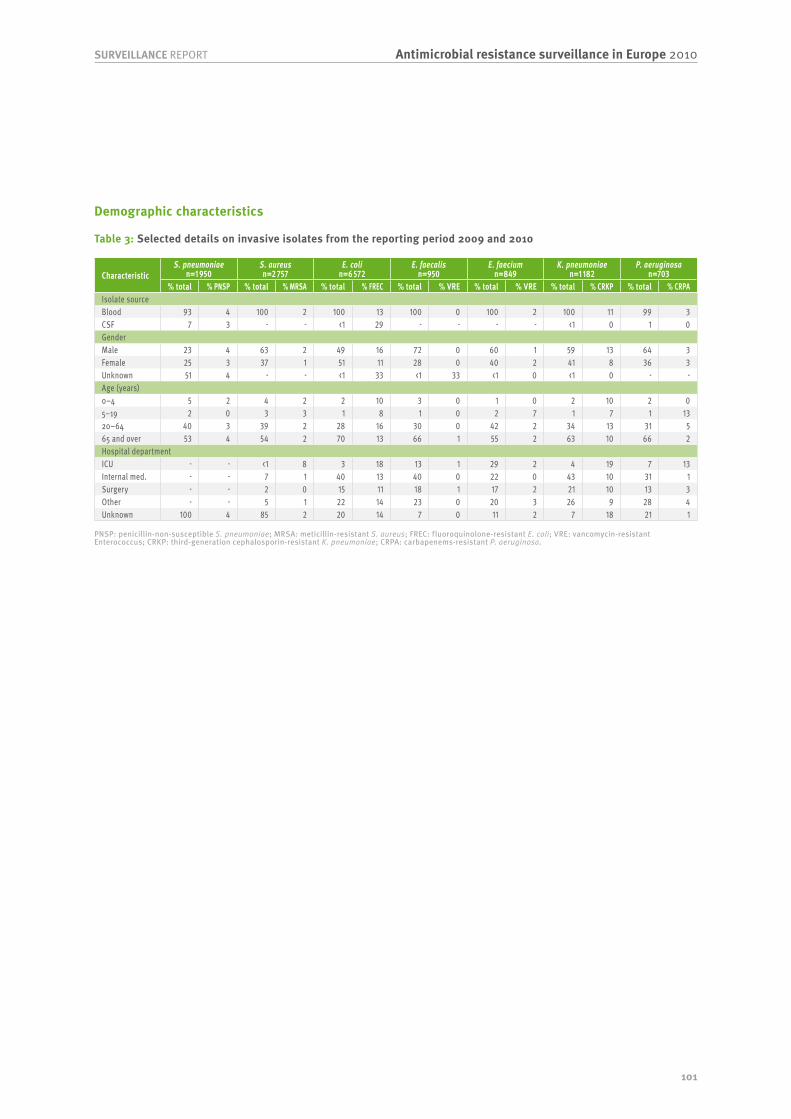
101
Antimicrobial resistance surveillance in Europe 2010SURVEILLANCE REPORT
Demographic characteristics
Table 3: Selected details on invasive isolates from the reporting period 2009 and 2010
CharacteristicS. pneumoniae
n=1 950S. aureus n=2 757
E. coli n=6 572
E. faecalis n=950
E. faecium n=849
K. pneumoniae n=1 182
P. aeruginosa n=703
% total % PNSP % total % MRSA % total % FREC % total % VRE % total % VRE % total % CRKP % total % CRPAIsolate sourceBlood 93 4 100 2 100 13 100 0 100 2 100 11 99 3CSF 7 3 - - <1 29 - - - - <1 0 1 0GenderMale 23 4 63 2 49 16 72 0 60 1 59 13 64 3Female 25 3 37 1 51 11 28 0 40 2 41 8 36 3Unknown 51 4 - - <1 33 <1 33 <1 0 <1 0 - -Age (years)0–4 5 2 4 2 2 10 3 0 1 0 2 10 2 05–19 2 0 3 3 1 8 1 0 2 7 1 7 1 1320–64 40 3 39 2 28 16 30 0 42 2 34 13 31 565 and over 53 4 54 2 70 13 66 1 55 2 63 10 66 2Hospital departmentICU - - <1 8 3 18 13 1 29 2 4 19 7 13Internal med. - - 7 1 40 13 40 0 22 0 43 10 31 1Surgery - - 2 0 15 11 18 1 17 2 21 10 13 3Other - - 5 1 22 14 23 0 20 3 26 9 28 4Unknown 100 4 85 2 20 14 7 0 11 2 7 18 21 1
PNSP: penicillin-non-susceptible S. pneumoniae; MRSA: meticillin-resistant S. aureus; FREC: fluoroquinolone-resistant E. coli; VRE: vancomycin-resistant Enterococcus; CRKP: third-generation cephalosporin-resistant K. pneumoniae; CRPA: carbapenems-resistant P. aeruginosa.
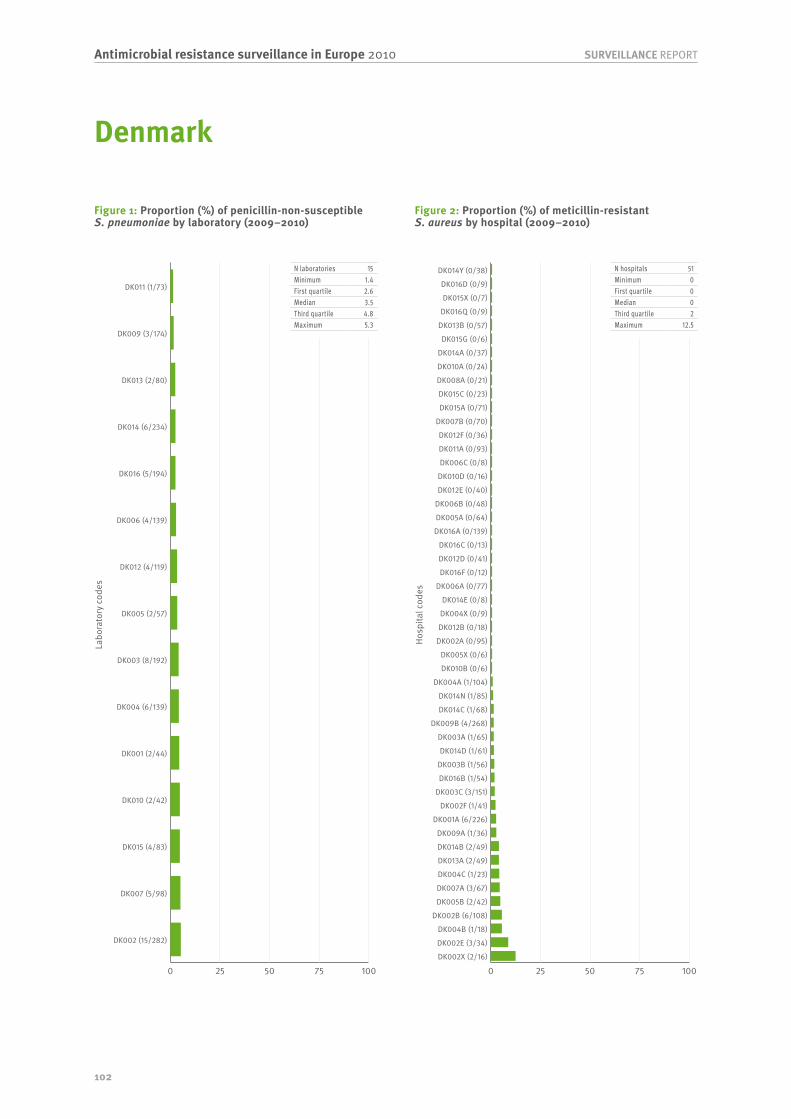
102
SURVEILLANCE REPORTAntimicrobial resistance surveillance in Europe 2010
Labo
rato
ry c
odes
0 25 50 75 100
DK002 (15/282)
DK007 (5/98)
DK015 (4/83)
DK010 (2/42)
DK001 (2/44)
DK004 (6/139)
DK003 (8/192)
DK005 (2/57)
DK012 (4/119)
DK006 (4/139)
DK016 (5/194)
DK014 (6/234)
DK013 (2/80)
DK009 (3/174)
DK011 (1/73)
Hosp
ital c
odes
0 25 50 75 100DK002X (2/16)
DK002E (3/34)
DK004B (1/18)
DK002B (6/108)
DK005B (2/42)
DK007A (3/67)
DK004C (1/23)
DK013A (2/49)
DK014B (2/49)
DK009A (1/36)
DK001A (6/226)
DK002F (1/41)
DK003C (3/151)
DK016B (1/54)
DK003B (1/56)
DK014D (1/61)
DK003A (1/65)
DK009B (4/268)
DK014C (1/68)
DK014N (1/85)
DK004A (1/104)
DK010B (0/6)
DK005X (0/6)
DK002A (0/95)
DK012B (0/18)
DK004X (0/9)
DK014E (0/8)
DK006A (0/77)
DK016F (0/12)
DK012D (0/41)
DK016C (0/13)
DK016A (0/139)
DK005A (0/64)
DK006B (0/48)
DK012E (0/40)
DK010D (0/16)
DK006C (0/8)
DK011A (0/93)
DK012F (0/36)
DK007B (0/70)
DK015A (0/71)
DK015C (0/23)
DK008A (0/21)
DK010A (0/24)
DK014A (0/37)
DK015G (0/6)
DK013B (0/57)
DK016Q (0/9)
DK015X (0/7)
DK016D (0/9)
DK014Y (0/38)
Figure 1: Proportion (%) of penicillin-non-susceptible S. pneumoniae by laboratory (2009–2010)
Figure 2: Proportion (%) of meticillin-resistant S. aureus by hospital (2009–2010)
N laboratories 15Minimum 1.4First quartile 2.6Median 3.5Third quartile 4.8Maximum 5.3
N hospitals 51Minimum 0First quartile 0Median 0Third quartile 2Maximum 12.5
Denmark
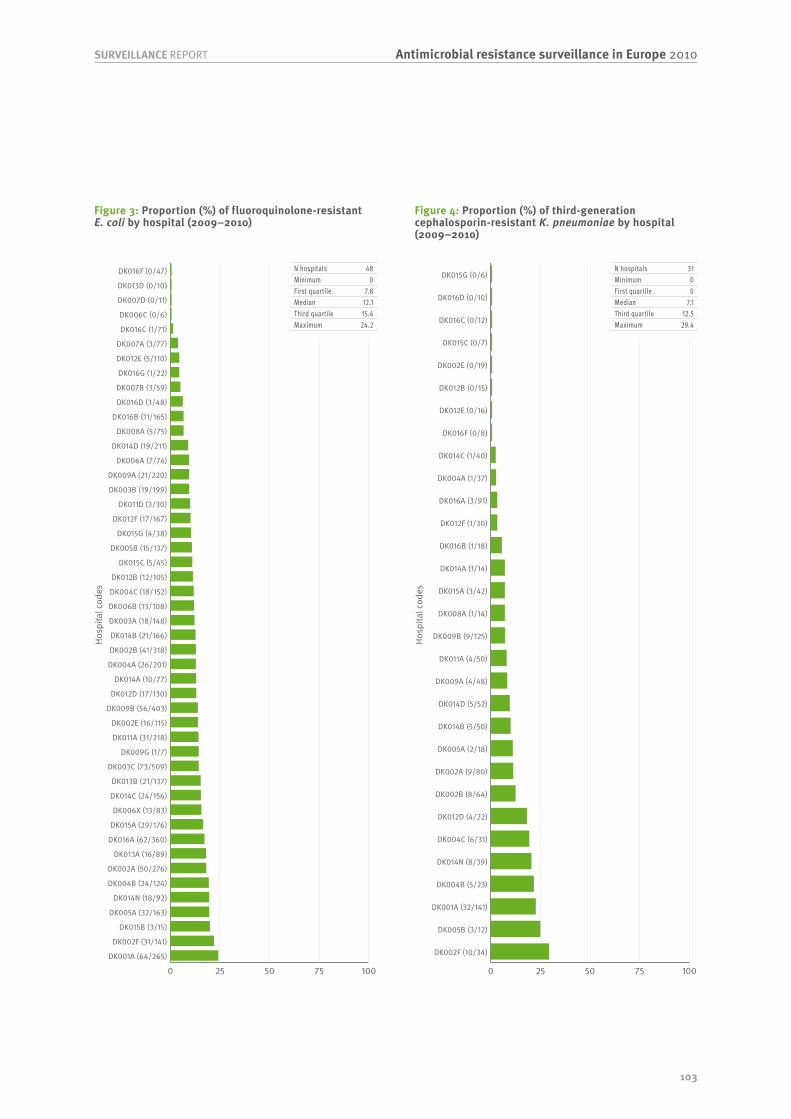
103
Antimicrobial resistance surveillance in Europe 2010SURVEILLANCE REPORT
Hosp
ital c
odes
0 25 50 75 100DK001A (64/265)
DK002F (31/141)
DK015B (3/15)
DK005A (32/163)
DK014N (18/92)
DK004B (24/124)
DK002A (50/276)
DK013A (16/89)
DK016A (62/360)
DK015A (29/176)
DK006X (13/83)
DK014C (24/156)
DK013B (21/137)
DK003C (73/509)
DK009G (1/7)
DK011A (31/218)
DK002E (16/115)
DK009B (56/403)
DK012D (17/130)
DK014A (10/77)
DK004A (26/201)
DK002B (41/318)
DK014B (21/166)
DK003A (18/148)
DK006B (13/108)
DK004C (18/152)
DK012B (12/105)
DK015C (5/45)
DK005B (15/137)
DK015G (4/38)
DK012F (17/167)
DK011D (3/30)
DK003B (19/199)
DK009A (21/220)
DK006A (7/74)
DK014D (19/211)
DK008A (5/75)
DK016B (11/165)
DK016D (3/48)
DK007B (3/59)
DK016G (1/22)
DK012E (5/110)
DK007A (3/77)
DK016C (1/71)
DK006C (0/6)
DK007D (0/11)
DK013D (0/10)
DK016F (0/47)
Hosp
ital c
odes
0 25 50 75 100
DK002F (10/34)
DK005B (3/12)
DK001A (32/141)
DK004B (5/23)
DK014N (8/39)
DK004C (6/31)
DK012D (4/22)
DK002B (8/64)
DK002A (9/80)
DK005A (2/18)
DK014B (5/50)
DK014D (5/52)
DK009A (4/48)
DK011A (4/50)
DK009B (9/125)
DK008A (1/14)
DK015A (3/42)
DK014A (1/14)
DK016B (1/18)
DK012F (1/30)
DK016A (3/91)
DK004A (1/37)
DK014C (1/40)
DK016F (0/8)
DK012E (0/16)
DK012B (0/15)
DK002E (0/19)
DK015C (0/7)
DK016C (0/12)
DK016D (0/10)
DK015G (0/6)
Figure 3: Proportion (%) of fluoroquinolone-resistant E. coli by hospital (2009–2010)
Figure 4: Proportion (%) of third-generation cephalosporin-resistant K. pneumoniae by hospital (2009–2010)
N hospitals 48Minimum 0First quartile 7.8Median 12.1Third quartile 15.4Maximum 24.2
N hospitals 31Minimum 0First quartile 0Median 7.1Third quartile 12.5Maximum 29.4

104
SURVEILLANCE REPORTAntimicrobial resistance surveillance in Europe 2010
Estonia
General information about EARS-Net participating laboratories
Antibiotic resistance from 2003 to 2010
Table 1: Number of laboratories and number of isolates reported for the period 2003–2010
YearS. pneumoniae S. aureus E. coli Enterecocci K. pneumoniae P. aeruginosaLabs Isolates Labs Isolates Labs Isolates Labs Isolates Labs Isolates Labs Isolates
2003 8 26 9 98 9 98 6 27 - - - -2004 6 40 9 104 10 167 5 63 - - - -2005 7 53 8 141 10 156 7 66 7 38 5 382006 8 52 9 154 9 215 8 85 6 47 6 432007 8 64 10 206 11 219 8 66 9 63 8 482008 10 66 11 185 11 267 11 86 10 72 8 412009 8 82 11 213 11 320 8 72 7 60 6 432010 10 64 9 152 11 317 8 66 9 82 8 42
Table 2: Proportion (%) of antibiotic non-susceptible isolates
Pathogens by antimicrobial classes 2003 2004 2005 2006 2007 2008 2009 2010Streptococcus pneumoniaePenicillin R <1 <1 <1 <1 <1 <1 <1 2Penicillin RI <1 <1 2 2 <1 5 1 2Macrolides RI 10 6 <1 3 2 4 2 4Staphylococcus aureusOxacillin/Meticillin R 4 5 2 3 9 4 3 <1Escherichia coliAminopenicilins R 42 55 45 52 50 47 38 37Aminoglycosides R 3 2 4 2 6 5 4 6Fluoroquinolones R 5 6 5 7 7 7 8 8Third-gen. cephalosporins R 1 4 1 <1 1 5 2 6Carbapenems R <1 <1 <1 <1 <1 <1 <1 <1Enterococcus faecalisAminopenicilins RI 4 14 14 9 <1 9 9 14HL Gentamicin R 22 32 50 35 23 27 43 27Vancomycin R <1 <1 <1 <1 <1 <1 <1 <1Enterococcus faeciumAminopenicilins RI 75 79 83 84 94 85 90 90HL Gentamicin R 50 79 74 78 89 75 79 67Vancomycin R <1 <1 <1 <1 <1 3 <1 <1Klebsiella pneumoniaeAminoglycosides R - - 8 9 2 15 15 26Fluoroquinolones R - - <1 5 2 7 19 25Third-gen. cephalosporins R - - 8 9 3 12 17 17Carbapenems R - - <1 <1 <1 <1 <1 <1Pseudomonas aeruginosaPiperacillin R - - 27 12 9 18 13 14Ceftazidime R - - 18 7 7 13 7 13Carbapenems R - - 38 29 18 30 17 22Aminoglycosides R - - 28 8 7 17 10 11Fluoroquinolones R - - 14 10 9 18 19 11

105
Antimicrobial resistance surveillance in Europe 2010SURVEILLANCE REPORT
Demographic characteristics
Table 3: Selected details on invasive isolates from the reporting period 2009 and 2010
CharacteristicS. pneumoniae
n=146S. aureus
n=358E. coli n=565
E. faecalis n=72
E. faecium n=63
K. pneumoniae n=139
P. aeruginosa n=70
% total % PNSP % total % MRSA % total % FREC % total % VRE % total % VRE % total % CRKP % total % CRPAIsolate sourceBlood 92 1 100 2 99 8 100 0 100 0 100 17 99 20CSF 8 0 - - 1 0 - - - - - - 1 0GenderMale 58 1 57 2 37 11 64 0 44 0 51 23 57 25Female 42 2 42 3 62 7 36 0 56 0 49 12 43 13Unknown - - 1 0 1 0 - - - - - - - -Age (years)0–4 8 9 8 0 2 0 17 0 3 0 9 8 1 05–19 3 0 4 7 2 8 3 0 . . 2 0 6 020–64 61 1 49 1 38 10 33 0 46 0 40 18 39 1165 and over 28 0 39 4 58 7 46 0 51 0 49 19 54 29Unknown - - <1 0 - - 1 0 - - - - - -Hospital departmentICU 29 0 24 5 16 6 28 0 51 0 34 23 41 31Internal med. 28 2 33 3 47 6 24 0 8 0 32 16 21 20Surgery 1 0 7 0 4 21 11 0 6 0 7 10 3 0Other 42 2 37 1 33 12 36 0 35 0 27 13 34 8Unknown - - - - - - 1 0 - - - - - -
PNSP: penicillin-non-susceptible S. pneumoniae; MRSA: meticillin-resistant S. aureus; FREC: fluoroquinolone-resistant E. coli; VRE: vancomycin-resistant Enterococcus; CRKP: third-generation cephalosporin-resistant K. pneumoniae; CRPA: carbapenems-resistant P. aeruginosa.
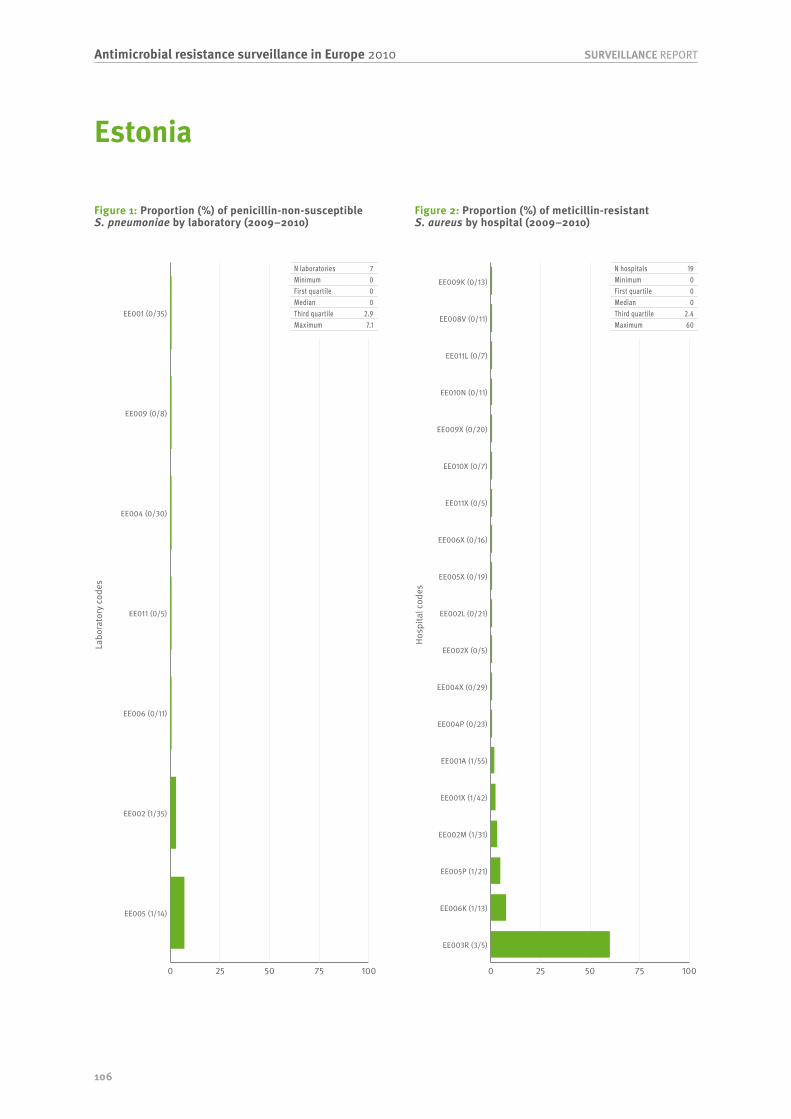
106
SURVEILLANCE REPORTAntimicrobial resistance surveillance in Europe 2010
Labo
rato
ry c
odes
0 25 50 75 100
EE005 (1/14)
EE002 (1/35)
EE006 (0/11)
EE011 (0/5)
EE004 (0/30)
EE009 (0/8)
EE001 (0/35)
Hosp
ital c
odes
0 25 50 75 100
EE003R (3/5)
EE006K (1/13)
EE005P (1/21)
EE002M (1/31)
EE001X (1/42)
EE001A (1/55)
EE004P (0/23)
EE004X (0/29)
EE002X (0/5)
EE002L (0/21)
EE005X (0/19)
EE006X (0/16)
EE011X (0/5)
EE010X (0/7)
EE009X (0/20)
EE010N (0/11)
EE011L (0/7)
EE008V (0/11)
EE009K (0/13)
Figure 1: Proportion (%) of penicillin-non-susceptible S. pneumoniae by laboratory (2009–2010)
Figure 2: Proportion (%) of meticillin-resistant S. aureus by hospital (2009–2010)
N laboratories 7Minimum 0First quartile 0Median 0Third quartile 2.9Maximum 7.1
N hospitals 19Minimum 0First quartile 0Median 0Third quartile 2.4Maximum 60
Estonia

107
Antimicrobial resistance surveillance in Europe 2010SURVEILLANCE REPORT
Hosp
ital c
odes
0 25 50 75 100
EE011L (3/10)
EE003X (2/7)
EE008V (2/7)
EE009X (2/11)
EE006K (6/35)
EE010X (1/7)
EE006X (4/34)
EE004X (6/52)
EE003R (1/11)
EE001A (5/77)
EE002M (4/63)
EE008X (1/16)
EE001X (5/80)
EE004P (2/35)
EE005X (1/30)
EE005P (1/32)
EE011X (0/14)
EE009K (0/16)
EE012P (0/5)
EE002X (0/10)
EE010N (0/6)
Hosp
ital c
odes
0 25 50 75 100
EE009K (3/6)
EE004P (2/7)
EE006X (2/7)
EE001X (7/26)
EE004X (4/15)
EE001A (4/21)
EE006K (1/6)
EE002X (1/19)
EE005X (0/5)
EE002M (0/10)
Figure 3: Proportion (%) of fluoroquinolone-resistant E. coli by hospital (2009–2010)
Figure 4: Proportion (%) of third-generation cephalosporin-resistant K. pneumoniae by hospital (2009–2010)
N hospitals 21Minimum 0First quartile 3.1Median 6.3Third quartile 14.3Maximum 30
N hospitals 10Minimum 0First quartile 5.3Median 22.9Third quartile 28.6Maximum 50

108
SURVEILLANCE REPORTAntimicrobial resistance surveillance in Europe 2010
Finland
General information about EARS-Net participating laboratories
Antibiotic resistance from 2003 to 2010
Table 1: Number of laboratories and number of isolates reported for the period 2003–2010
YearS. pneumoniae S. aureus E. coli Enterecocci K. pneumoniae P. aeruginosaLabs Isolates Labs Isolates Labs Isolates Labs Isolates Labs Isolates Labs Isolates
2003 16 517 16 727 15 1450 15 266 - - - -2004 17 548 17 883 17 1749 17 336 - - - -2005 17 543 17 790 17 1924 17 340 14 175 13 1082006 15 501 15 894 15 1875 15 348 14 228 14 1622007 16 547 16 814 16 1949 16 400 15 273 14 1832008 15 643 15 923 15 2111 15 381 12 288 12 1752009 20 688 20 978 20 2224 20 506 20 375 18 2332010 20 622 20 1094 20 2551 20 521 20 401 20 281
Table 2: Proportion (%) of antibiotic non-susceptible isolates
Pathogens by antimicrobial classes 2003 2004 2005 2006 2007 2008 2009 2010Streptococcus pneumoniaePenicillin R 2 <1 <1 2 1 <1 2 1Penicillin RI 10 8 7 12 13 11 13 14Macrolides RI 20 20 20 24 25 24 28 28Staphylococcus aureusOxacillin/Meticillin R 1 3 3 3 2 3 2 2Escherichia coliAminopenicilins R 33 33 35 36 34 35 36 34Aminoglycosides R 1 2 2 2 3 4 3 4Fluoroquinolones R 5 7 7 8 8 9 9 9Third-gen. cephalosporins R 1 2 2 2 2 2 3 4Carbapenems R <1 <1 <1 <1 <1 <1 <1 <1Enterococcus faecalisAminopenicilins RI <1 <1 <1 <1 2 <1 <1 <1HL Gentamicin R 39 39 27 25 22 13 - -Vancomycin R <1 <1 <1 <1 <1 <1 <1 <1Enterococcus faeciumAminopenicilins RI 79 69 78 80 87 87 87 82HL Gentamicin R 4 12 1 16 19 15 - -Vancomycin R <1 <1 <1 <1 <1 <1 <1 <1Klebsiella pneumoniaeAminoglycosides R - - 3 1 <1 1 1 4Fluoroquinolones R - - 3 4 <1 2 3 2Third-gen. cephalosporins R - - 2 <1 1 2 1 4Carbapenems R - - <1 <1 <1 <1 <1 <1Pseudomonas aeruginosaPiperacillin R - - 8 8 7 8 7 7Ceftazidime R - - 5 3 5 5 5 3Carbapenems R - - 15 8 9 6 8 10Aminoglycosides R - - 11 8 8 6 4 4Fluoroquinolones R - - 16 17 11 15 11 11

109
Antimicrobial resistance surveillance in Europe 2010SURVEILLANCE REPORT
Demographic characteristics
Table 3: Selected details on invasive isolates from the reporting period 2009 and 2010
CharacteristicS. pneumoniae
n=1 263S. aureus n=2 072
E. coli n=4 773
E. faecalis n=541
E. faecium n=482
K. pneumoniae n=764
P. aeruginosa n=504
% total % PNSP % total % MRSA % total % FREC % total % VRE % total % VRE % total % CRKP % total % CRPAIsolate sourceBlood 96 14 100 2 100 9 100 0 100 0 100 3 98 9CSF 4 11 - - <1 13 - - - - <1 0 2 8GenderMale 54 13 62 2 37 13 70 0 61 0 54 4 61 10Female 46 14 38 2 63 7 30 0 39 0 46 2 39 7Age (years)0–4 15 24 3 1 2 5 6 0 2 0 1 20 1 205–19 4 8 4 0 1 5 1 0 2 0 1 0 2 2720–64 46 11 39 2 28 9 27 0 32 0 28 4 27 1365 and over 35 13 53 3 69 9 65 0 63 0 70 2 70 7Hospital departmentICU 1 13 1 0 1 4 1 0 2 0 <1 0 2 18Internal med. 6 7 6 1 5 10 4 0 7 0 4 0 5 0Surgery <1 50 2 3 1 8 2 0 5 0 2 7 2 20Other 22 12 16 3 16 9 15 0 10 0 15 4 9 4Unknown 71 14 74 2 77 9 78 0 76 0 80 3 81 10
PNSP: penicillin-non-susceptible S. pneumoniae; MRSA: meticillin-resistant S. aureus; FREC: fluoroquinolone-resistant E. coli; VRE: vancomycin-resistant Enterococcus; CRKP: third-generation cephalosporin-resistant K. pneumoniae; CRPA: carbapenems-resistant P. aeruginosa.
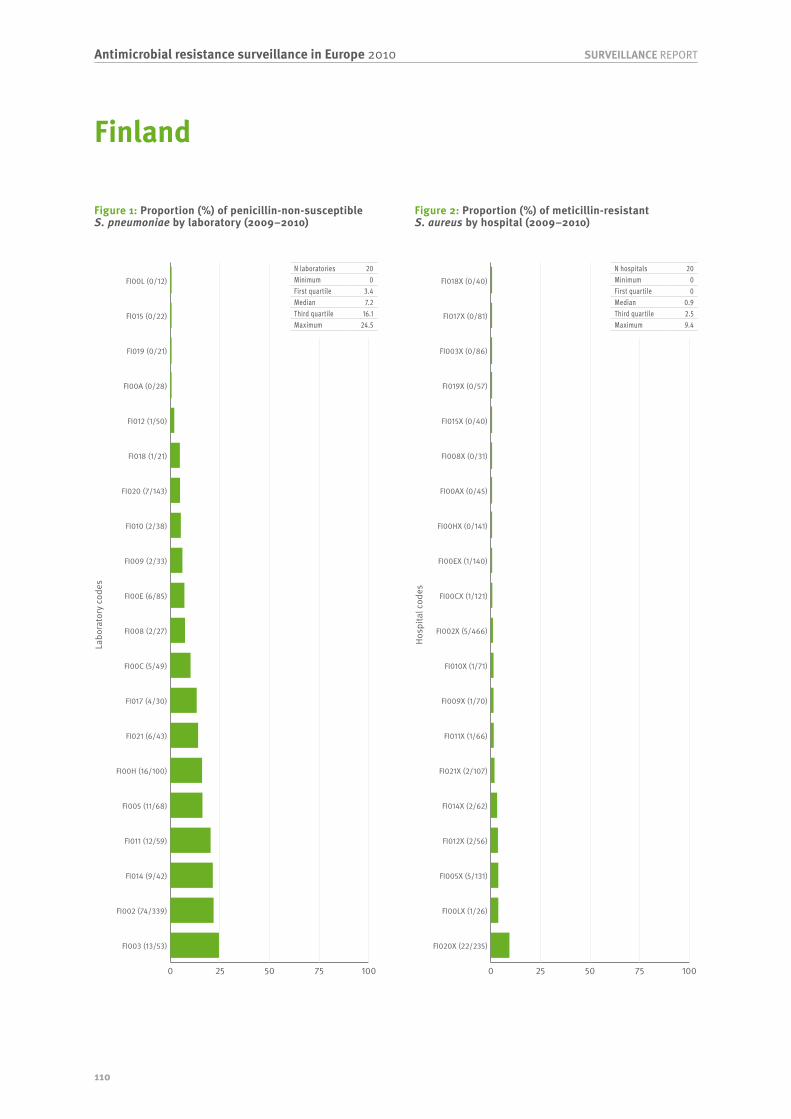
110
SURVEILLANCE REPORTAntimicrobial resistance surveillance in Europe 2010
Labo
rato
ry c
odes
0 25 50 75 100
FI003 (13/53)
FI002 (74/339)
FI014 (9/42)
FI011 (12/59)
FI005 (11/68)
FI00H (16/100)
FI021 (6/43)
FI017 (4/30)
FI00C (5/49)
FI008 (2/27)
FI00E (6/85)
FI009 (2/33)
FI010 (2/38)
FI020 (7/143)
FI018 (1/21)
FI012 (1/50)
FI00A (0/28)
FI019 (0/21)
FI015 (0/22)
FI00L (0/12)
Hosp
ital c
odes
0 25 50 75 100
FI020X (22/235)
FI00LX (1/26)
FI005X (5/131)
FI012X (2/56)
FI014X (2/62)
FI021X (2/107)
FI011X (1/66)
FI009X (1/70)
FI010X (1/71)
FI002X (5/466)
FI00CX (1/121)
FI00EX (1/140)
FI00HX (0/141)
FI00AX (0/45)
FI008X (0/31)
FI015X (0/40)
FI019X (0/57)
FI003X (0/86)
FI017X (0/81)
FI018X (0/40)
Figure 1: Proportion (%) of penicillin-non-susceptible S. pneumoniae by laboratory (2009–2010)
Figure 2: Proportion (%) of meticillin-resistant S. aureus by hospital (2009–2010)
N laboratories 20Minimum 0First quartile 3.4Median 7.2Third quartile 16.1Maximum 24.5
N hospitals 20Minimum 0First quartile 0Median 0.9Third quartile 2.5Maximum 9.4
Finland
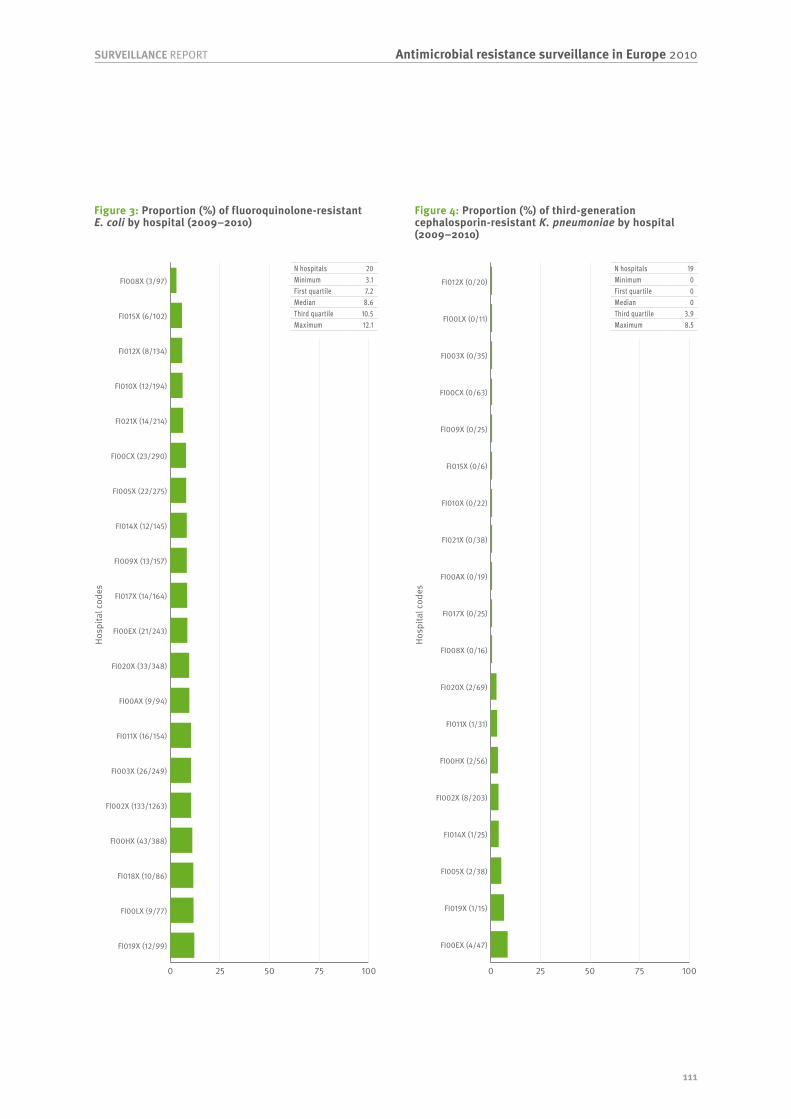
111
Antimicrobial resistance surveillance in Europe 2010SURVEILLANCE REPORT
Hosp
ital c
odes
0 25 50 75 100
FI019X (12/99)
FI00LX (9/77)
FI018X (10/86)
FI00HX (43/388)
FI002X (133/1263)
FI003X (26/249)
FI011X (16/154)
FI00AX (9/94)
FI020X (33/348)
FI00EX (21/243)
FI017X (14/164)
FI009X (13/157)
FI014X (12/145)
FI005X (22/275)
FI00CX (23/290)
FI021X (14/214)
FI010X (12/194)
FI012X (8/134)
FI015X (6/102)
FI008X (3/97)
Hosp
ital c
odes
0 25 50 75 100
FI00EX (4/47)
FI019X (1/15)
FI005X (2/38)
FI014X (1/25)
FI002X (8/203)
FI00HX (2/56)
FI011X (1/31)
FI020X (2/69)
FI008X (0/16)
FI017X (0/25)
FI00AX (0/19)
FI021X (0/38)
FI010X (0/22)
FI015X (0/6)
FI009X (0/25)
FI00CX (0/63)
FI003X (0/35)
FI00LX (0/11)
FI012X (0/20)
Figure 3: Proportion (%) of fluoroquinolone-resistant E. coli by hospital (2009–2010)
Figure 4: Proportion (%) of third-generation cephalosporin-resistant K. pneumoniae by hospital (2009–2010)
N hospitals 20Minimum 3.1First quartile 7.2Median 8.6Third quartile 10.5Maximum 12.1
N hospitals 19Minimum 0First quartile 0Median 0Third quartile 3.9Maximum 8.5

112
SURVEILLANCE REPORTAntimicrobial resistance surveillance in Europe 2010
France
General information about EARS-Net participating laboratories
Antibiotic resistance from 2003 to 2010
Table 1: Number of laboratories and number of isolates reported for the period 2003–2010
YearS. pneumoniae S. aureus E. coli Enterecocci K. pneumoniae P. aeruginosaLabs Isolates Labs Isolates Labs Isolates Labs Isolates Labs Isolates Labs Isolates
2003 - - 21 1710 21 2266 20 468 - - - -2004 - - 50 3355 50 5678 46 871 - - - -2005 195 632 50 3484 50 6056 47 1023 49 838 48 9932006 97 371 50 3824 50 6718 50 1152 50 963 47 10062007 168 663 57 4265 57 8093 56 1545 56 1187 56 13052008 127 557 56 4380 56 7993 54 1555 54 1138 54 12252009 225 826 54 4727 54 8451 54 1969 52 1378 32 12212010 181 1127 56 4883 56 9028 54 1970 56 1542 36 1191
Table 2: Proportion (%) of antibiotic non-susceptible isolates
Pathogens by antimicrobial classes 2003 2004 2005 2006 2007 2008 2009 2010Streptococcus pneumoniaePenicillin R - - 5 4 4 7 6 <1Penicillin RI - - 36 32 34 30 27 28Macrolides RI - - 41 36 37 31 27 30Staphylococcus aureusOxacillin/Meticillin R 29 29 27 27 26 24 23 22Escherichia coliAminopenicilins R 50 47 50 53 54 54 55 55Aminoglycosides R 5 4 5 6 6 7 8 7Fluoroquinolones R 9 8 11 14 15 16 19 18Third-gen. cephalosporins R <1 <1 1 2 2 4 7 7Carbapenems R <1 <1 <1 <1 <1 <1 <1 <1Enterococcus faecalisAminopenicilins RI 3 1 <1 1 1 <1 1 <1HL Gentamicin R 16 17 15 16 15 18 18 18Vancomycin R <1 <1 <1 <1 <1 <1 <1 <1Enterococcus faeciumAminopenicilins RI 30 56 64 69 67 68 63 78HL Gentamicin R 23 21 24 30 30 30 38 41Vancomycin R <1 5 3 3 1 <1 <1 1Klebsiella pneumoniaeAminoglycosides R - - 5 7 11 17 20 18Fluoroquinolones R - - 7 9 14 21 24 22Third-gen. cephalosporins R - - 4 6 10 15 19 18Carbapenems R . . <1 <1 <1 <1 <1 <1Pseudomonas aeruginosaPiperacillin R - - 15 11 11 14 21 20Ceftazidime R - - 9 6 7 8 17 13Carbapenems R - - 14 12 14 14 17 18Aminoglycosides R - - 22 16 18 15 19 19Fluoroquinolones R - - 27 23 24 22 25 23

113
Antimicrobial resistance surveillance in Europe 2010SURVEILLANCE REPORT
Demographic characteristics
Table 3: Selected details on invasive isolates from the reporting period 2009 and 2010
CharacteristicS. pneumoniae
n=1 953S. aureus n=9 579
E. coli n=17 360
E. faecalis n=2 788
E. faecium n=1 131
K. pneumoniae n=2 920
P. aeruginosa n=2 405
% total % PNSP % total % MRSA % total % FREC % total % VRE % total % VRE % total % CRKP % total % CRPAIsolate sourceBlood 66 27 100 22 100 18 100 0 100 1 100 18 100 18CSF 34 29 - - - - - - - - - - - -GenderMale 55 27 62 22 47 20 65 0 60 1 59 21 62 17Female 45 28 37 22 51 16 33 0 38 0 40 14 38 18Unknown <1 0 2 22 2 16 2 0 2 0 1 13 <1 60Age (years)0–4 24 31 5 10 2 6 4 0 2 0 2 23 2 95–19 9 14 3 6 1 11 1 0 1 0 1 29 2 1320–64 35 22 39 16 34 18 37 0 45 1 47 22 50 2265 and over 32 34 53 29 62 19 57 0 51 1 50 14 45 13Unknown - - <1 0 <1 25 <1 0 <1 0 <1 0 <1 0Hospital departmentICU - - 13 23 8 21 19 0 26 2 15 36 27 25Internal med. - - 34 24 26 20 30 0 27 0 28 17 22 14Surgery - - 14 20 10 18 15 0 14 1 15 24 14 19Other - - 35 20 51 17 31 0 31 1 36 10 32 14Unknown 100 27 4 21 5 17 5 0 2 0 6 13 5 9
PNSP: penicillin-non-susceptible S. pneumoniae; MRSA: meticillin-resistant S. aureus; FREC: fluoroquinolone-resistant E. coli; VRE: vancomycin-resistant Enterococcus; CRKP: third-generation cephalosporin-resistant K. pneumoniae; CRPA: carbapenems-resistant P. aeruginosa.
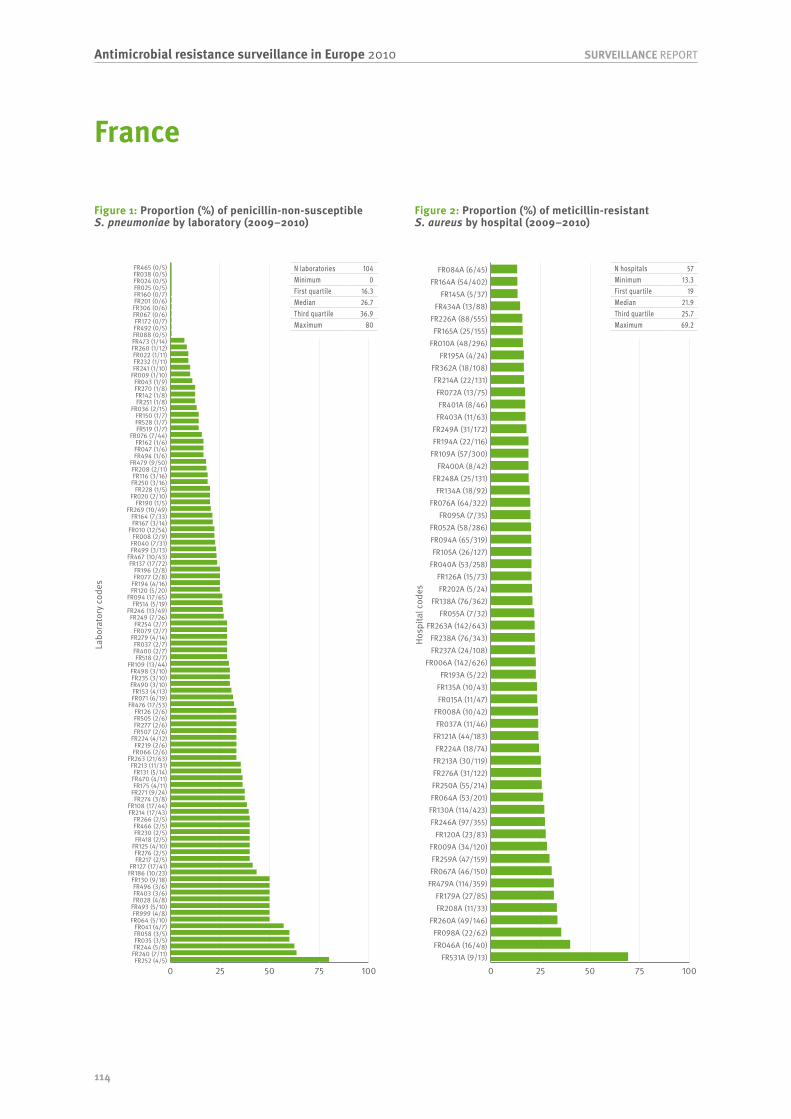
114
SURVEILLANCE REPORTAntimicrobial resistance surveillance in Europe 2010
Labo
rato
ry c
odes
0 25 50 75 100FR252 (4/5)
FR240 (7/11)FR244 (5/8)FR035 (3/5)FR058 (3/5)FR041 (4/7)
FR064 (5/10)FR999 (4/8)
FR493 (5/10)FR028 (4/8)FR403 (3/6)FR496 (3/6)
FR130 (9/18)FR186 (10/23)FR127 (17/41)
FR217 (2/5)FR276 (2/5)
FR125 (4/10)FR418 (2/5)FR230 (2/5)FR466 (2/5)FR266 (2/5)
FR214 (17/43)FR108 (17/44)
FR274 (3/8)FR271 (9/24)FR175 (4/11)
FR470 (4/11)FR131 (5/14)
FR213 (11/31)FR263 (21/63)
FR066 (2/6)FR219 (2/6)
FR224 (4/12)FR507 (2/6)FR277 (2/6)FR505 (2/6)FR126 (2/6)
FR476 (17/53)FR071 (6/19)FR153 (4/13)
FR490 (3/10)FR235 (3/10)FR498 (3/10)
FR109 (13/44)FR518 (2/7)
FR400 (2/7)FR037 (2/7)
FR279 (4/14)FR079 (2/7)FR254 (2/7)
FR249 (7/26)FR246 (13/49)
FR514 (5/19)FR094 (17/65)
FR120 (5/20)FR194 (4/16)FR077 (2/8)FR196 (2/8)
FR137 (17/72)FR467 (10/43)
FR499 (3/13)FR040 (7/31)FR008 (2/9)
FR010 (12/54)FR167 (3/14)FR164 (7/33)
FR269 (10/49)FR190 (1/5)
FR020 (2/10)FR228 (1/5)
FR250 (3/16)FR116 (3/16)FR208 (2/11)
FR479 (9/50)FR494 (1/6)FR047 (1/6)FR162 (1/6)
FR076 (7/44)FR519 (1/7)FR528 (1/7)FR150 (1/7)
FR036 (2/15)FR251 (1/8)FR142 (1/8)FR270 (1/8)FR043 (1/9)
FR009 (1/10)FR241 (1/10)FR232 (1/11)FR022 (1/11)FR260 (1/12)FR473 (1/14)FR088 (0/5)FR492 (0/5)FR172 (0/7)
FR067 (0/6)FR306 (0/6)FR201 (0/6)FR160 (0/7)FR025 (0/5)FR024 (0/5)FR038 (0/5)FR465 (0/5)
Hosp
ital c
odes
0 25 50 75 100FR531A (9/13)
FR046A (16/40)FR098A (22/62)
FR260A (49/146)FR208A (11/33)FR179A (27/85)
FR479A (114/359)FR067A (46/150)FR259A (47/159)
FR009A (34/120)FR120A (23/83)
FR246A (97/355)FR130A (114/423)FR064A (53/201)FR250A (55/214)FR276A (31/122)FR213A (30/119)FR224A (18/74)
FR121A (44/183)FR037A (11/46)
FR008A (10/42)FR015A (11/47)FR135A (10/43)FR193A (5/22)
FR006A (142/626)FR237A (24/108)FR238A (76/343)
FR263A (142/643)FR055A (7/32)
FR138A (76/362)FR202A (5/24)
FR126A (15/73)FR040A (53/258)FR105A (26/127)
FR094A (65/319)FR052A (58/286)
FR095A (7/35)FR076A (64/322)
FR134A (18/92)FR248A (25/131)
FR400A (8/42)FR109A (57/300)FR194A (22/116)FR249A (31/172)FR403A (11/63)FR401A (8/46)
FR072A (13/75)FR214A (22/131)
FR362A (18/108)FR195A (4/24)
FR010A (48/296)FR165A (25/155)
FR226A (88/555)FR434A (13/88)
FR145A (5/37)FR164A (54/402)
FR084A (6/45)
Figure 1: Proportion (%) of penicillin-non-susceptible S. pneumoniae by laboratory (2009–2010)
Figure 2: Proportion (%) of meticillin-resistant S. aureus by hospital (2009–2010)
N laboratories 104Minimum 0First quartile 16.3Median 26.7Third quartile 36.9Maximum 80
N hospitals 57Minimum 13.3First quartile 19Median 21.9Third quartile 25.7Maximum 69.2
France

115
Antimicrobial resistance surveillance in Europe 2010SURVEILLANCE REPORT
Hosp
ital c
odes
0 25 50 75 100FR046A (21/41)
FR064A (118/415)FR055A (20/71)FR095A (14/52)
FR105A (83/320)FR015A (34/132)
FR248A (48/187)FR237A (51/200)FR259A (64/254)
FR006A (283/1124)FR479A (124/541)FR138A (148/657)
FR214A (72/325)FR165A (82/375)
FR246A (138/641)FR193A (10/47)
FR076A (112/532)FR052A (116/576)FR164A (127/641)FR094A (98/500)FR403A (27/138)FR098A (30/154)FR263A (171/925)
FR109A (106/586)FR121A (49/276)FR213A (58/338)FR084A (14/82)
FR260A (47/278)FR401A (17/103)
FR362A (44/272)FR040A (72/446)
FR135A (18/115)FR067A (42/282)FR126A (23/158)FR179A (10/70)
FR224A (30/217)FR008A (18/133)FR010A (58/434)FR202A (18/135)FR120A (23/174)FR072A (21/160)FR134A (27/209)FR130A (72/598)
FR009A (34/285)FR249A (36/302)FR250A (55/468)
FR195A (6/53)FR194A (24/216)FR276A (26/234)FR226A (75/699)FR400A (15/144)FR238A (58/567)
FR037A (8/79)FR434A (24/239)
FR145A (7/70)FR531A (1/17)
FR208A (3/73)
Hosp
ital c
odes
0 25 50 75 100FR138A (102/220)
FR037A (11/26)FR226A (97/246)
FR213A (17/53)FR009A (8/25)FR193A (4/13)
FR046A (3/10)FR403A (11/39)
FR145A (3/11)FR135A (5/19)FR015A (6/23)
FR121A (17/70)FR134A (5/21)
FR263A (44/193)FR095A (2/10)FR055A (4/21)
FR165A (18/95)FR105A (17/96)
FR479A (18/104)FR126A (4/24)FR120A (3/21)
FR246A (13/98)FR179A (5/39)FR010A (6/47)FR238A (7/57)
FR040A (6/49)FR006A (25/207)
FR214A (8/67)FR076A (11/93)FR224A (2/17)
FR064A (7/62)FR195A (1/10)
FR248A (6/63)FR084A (2/21)FR259A (6/66)FR401A (3/38)FR250A (3/43)
FR094A (6/101)FR130A (3/52)FR164A (2/38)FR362A (2/40)FR052A (3/67)FR249A (1/24)FR260A (1/25)FR109A (3/87)FR067A (1/37)FR098A (0/9)FR276A (0/11)FR237A (0/14)FR434A (0/21)FR072A (0/7)
FR400A (0/16)FR008A (0/14)
FR531A (0/6)FR194A (0/23)FR202A (0/9)
Figure 3: Proportion (%) of fluoroquinolone-resistant E. coli by hospital (2009–2010)
Figure 4: Proportion (%) of third-generation cephalosporin-resistant K. pneumoniae by hospital (2009–2010)
N hospitals 57Minimum 4.1First quartile 12Median 16.5Third quartile 21.5Maximum 51.2
N hospitals 56Minimum 0First quartile 4.3Median 11.9Third quartile 21.4Maximum 46.4

116
SURVEILLANCE REPORTAntimicrobial resistance surveillance in Europe 2010
Germany
General information about EARS-Net participating laboratories
Antibiotic resistance from 2003 to 2010
Table 1: Number of laboratories and number of isolates reported for the period 2003–2010
YearS. pneumoniae S. aureus E. coli Enterecocci K. pneumoniae P. aeruginosaLabs Isolates Labs Isolates Labs Isolates Labs Isolates Labs Isolates Labs Isolates
2003 17 175 20 920 19 997 17 347 - - - -2004 16 145 22 1107 22 1217 22 606 - - 1 12005 15 119 17 827 17 961 17 569 12 105 12 1172006 15 85 18 799 18 850 16 529 14 148 12 1622007 11 75 12 853 12 977 12 648 10 173 11 1972008 11 209 14 1090 14 1615 13 451 11 235 11 1672009 16 346 17 1893 17 2803 17 952 15 479 16 2872010 16 363 17 1980 17 3024 16 1009 15 478 15 315
Table 2: Proportion (%) of antibiotic non-susceptible isolates
Pathogens by antimicrobial classes 2003 2004 2005 2006 2007 2008 2009 2010Streptococcus pneumoniaePenicillin R <1 <1 <1 1 <1 <1 <1 <1Penicillin RI 1 1 4 5 3 5 2 4Macrolides RI 11 13 17 12 8 10 8 9Staphylococcus aureusOxacillin/Meticillin R 18 20 21 20 16 19 18 21Escherichia coliAminopenicilins R 47 55 54 60 55 55 56 54Aminoglycosides R 5 4 6 10 6 7 8 9Fluoroquinolones R 14 24 23 29 30 23 23 25Third-gen. cephalosporins R <1 2 2 4 8 5 8 8Carbapenems R <1 <1 <1 <1 <1 <1 <1 <1Enterococcus faecalisAminopenicilins RI 7 7 3 3 7 <1 3 <1HL Gentamicin R 47 42 34 29 67 39 40 47Vancomycin R <1 <1 <1 <1 <1 <1 <1 <1Enterococcus faeciumAminopenicilins RI 78 93 96 94 95 95 94 94HL Gentamicin R 47 61 52 38 73 35 45 45Vancomycin R 3 11 10 8 15 6 6 8Klebsiella pneumoniaeAminoglycosides R - - 10 12 6 10 10 10Fluoroquinolones R - - 6 12 9 15 15 15Third-gen. cephalosporins R - - 7 14 6 11 13 13Carbapenems R - - 2 <1 2 <1 <1 <1Pseudomonas aeruginosaPiperacillin R - <1 18 17 17 9 13 16Ceftazidime R - <1 11 12 17 8 11 8Carbapenems R - <1 25 17 22 11 11 13Aminoglycosides R - <1 12 18 9 10 7 10Fluoroquinolones R - <1 23 28 28 22 17 18

117
Antimicrobial resistance surveillance in Europe 2010SURVEILLANCE REPORT
Demographic characteristics
Table 3: Selected details on invasive isolates from the reporting period 2009 and 2010
CharacteristicS. pneumoniae
n=682S. aureus n=3 865
E. coli n=5 803
E. faecalis n=1 106
E. faecium n=845
K. pneumoniae n=949
P. aeruginosa n=594
% total % PNSP % total % MRSA % total % FREC % total % VRE % total % VRE % total % CRKP % total % CRPAIsolate sourceBlood 91 3 100 20 100 24 100 0 100 7 99 13 99 12CSF 9 3 - - <1 8 - - - - 1 29 1 13GenderMale 35 3 42 19 31 28 48 1 47 6 44 15 48 11Female 30 4 24 20 37 22 24 0 29 7 31 10 24 16Unknown 35 3 34 20 32 22 28 0 23 10 26 13 28 8Age (years)0–4 8 4 2 3 1 9 2 0 3 5 3 8 2 05–19 2 7 1 4 1 24 <1 0 1 0 <1 0 1 1320–64 37 4 27 17 22 28 26 1 35 7 28 18 29 1965 and over 52 2 69 22 76 23 71 0 62 8 69 11 68 9Unknown - - - - <1 0 - - - - - - - -Hospital departmentICU 24 2 18 22 13 25 22 1 42 7 19 20 22 21Internal med. 51 3 47 20 55 21 45 0 29 7 43 9 37 8Surgery 3 0 12 22 7 27 11 0 11 3 11 9 10 10Other 20 4 21 17 22 31 21 0 18 10 24 18 27 10Unknown 2 0 1 20 3 27 2 0 1 0 3 4 4 14
PNSP: penicillin-non-susceptible S. pneumoniae; MRSA: meticillin-resistant S. aureus; FREC: fluoroquinolone-resistant E. coli; VRE: vancomycin-resistant Enterococcus; CRKP: third-generation cephalosporin-resistant K. pneumoniae; CRPA: carbapenems-resistant P. aeruginosa.

118
SURVEILLANCE REPORTAntimicrobial resistance surveillance in Europe 2010
Labo
rato
ry c
odes
0 25 50 75 100
DE0111 (5/29)
DE1302 (1/15)
DE0102 (3/49)
DE0301 (2/35)
DE0911 (6/123)
DE0402 (1/21)
DE0908 (1/49)
DE0110 (2/165)
DE1304 (0/14)
DE0401 (0/18)
DE0107 (0/37)
DE0907 (0/94)
DE0202 (0/5)
DE1303 (0/20)
Hosp
ital c
odes
0 25 50 75 100DE011079 (12/14)DE130312 (16/27)DE090833 (7/14)DE090714 (8/19)
DE0401C (2/5)DE011042 (7/18)
DE091125 (13/34)DE091127 (4/11)
DE011037 (9/25)DE090803 (9/26)DE091122 (14/41)DE011063 (4/12)DE090814 (5/15)
DE011005 (3/9)DE091119 (5/15)DE030102 (3/9)DE011016 (5/15)DE090901 (2/6)
DE130307 (12/37)DE011068 (6/19)
DE090806 (19/61)DE130201 (33/108)DE130403 (14/46)DE090905 (7/23)DE091108 (3/10)
DE090903 (3/10)DE011014 (6/20)DE0401B (3/10)
DE090801 (15/53)DE011004 (5/18)
DE011038 (11/40)DE130320 (6/22)
DE090706 (9/33)DE090808 (3/11)DE030109 (9/33)
DE091126 (13/48)DE090804 (7/26)DE090710 (7/26)DE011012 (7/26)DE011021 (11/41)DE090906 (2/8)
DE090802 (3/12)DE011025 (7/28)
DE090709 (14/57)DE090705 (25/102)
DE030110 (5/21)DE091134 (5/21)
DE030108 (9/38)DE090713 (4/17)DE040201 (7/30)
DE090716 (22/95)DE090707 (9/40)
DE011024 (7/32)DE091116 (3/14)DE011085 (7/33)
DE090701 (15/71)DE091132 (11/53)DE091102 (3/15)DE011022 (4/20)
DE011015 (1/5)DE011020 (10/50)DE090812 (2/10)DE011006 (2/10)DE091133 (5/26)DE091143 (4/21)DE091101 (8/42)DE090719 (2/11)DE091104 (2/11)DE011045 (4/23)DE030801 (1/6)
DE011101 (27/163)DE091131 (4/25)
DE070103 (3/19)DE120301 (19/125)
DE011010 (5/33)DE011031 (3/20)
DE090718 (6/40)DE011066 (3/20)
DE090807 (3/20)DE011003 (3/20)
DE070101 (16/110)DE090708 (6/42)DE030103 (3/21)
DE011029 (1/7)DE091110 (1/7)
DE091135 (4/29)DE091107 (2/15)DE091129 (3/23)
DE090704 (4/31)DE011026 (2/16)
DE091121 (1/8)DE040202 (2/17)
DE2020 (7/62)DE011083 (9/80)
DE0102A (19/170)DE030101 (4/37)DE011061 (1/10)DE011087 (1/10)DE010702 (1/10)DE090715 (2/22)DE091120 (3/33)
DE0401A (14/155)DE011062 (1/12)DE011017 (2/25)
DE091105 (2/28)DE0102B (1/14)DE091117 (3/51)
DE040204 (1/17)DE010701 (3/56)DE011007 (1/25)DE011086 (1/26)DE090832 (0/7)DE011044 (0/10)
DE011018 (0/9)DE011039 (0/12)
DE0401D (0/8)DE091128 (0/5)DE011027 (0/5)
DE011028 (0/13)DE091106 (0/22)
DE011041 (0/8)DE090819 (0/14)
DE091114 (0/9)DE091112 (0/6)
DE011001 (0/11)DE011102 (0/6)
DE030107 (0/6)DE070102 (0/8)
Figure 1: Proportion (%) of penicillin-non-susceptible S. pneumoniae by laboratory (2009–2010)
Figure 2: Proportion (%) of meticillin-resistant S. aureus by hospital (2009–2010)
N laboratories 14Minimum 0First quartile 0Median 1.6Third quartile 5.7Maximum 17.2
N hospitals 128Minimum 0First quartile 10.4Median 19.1Third quartile 27.3Maximum 85.7
Germany
Note. Individual laboratories may serve a large number of hospitals over a wide geographical area within Germany.
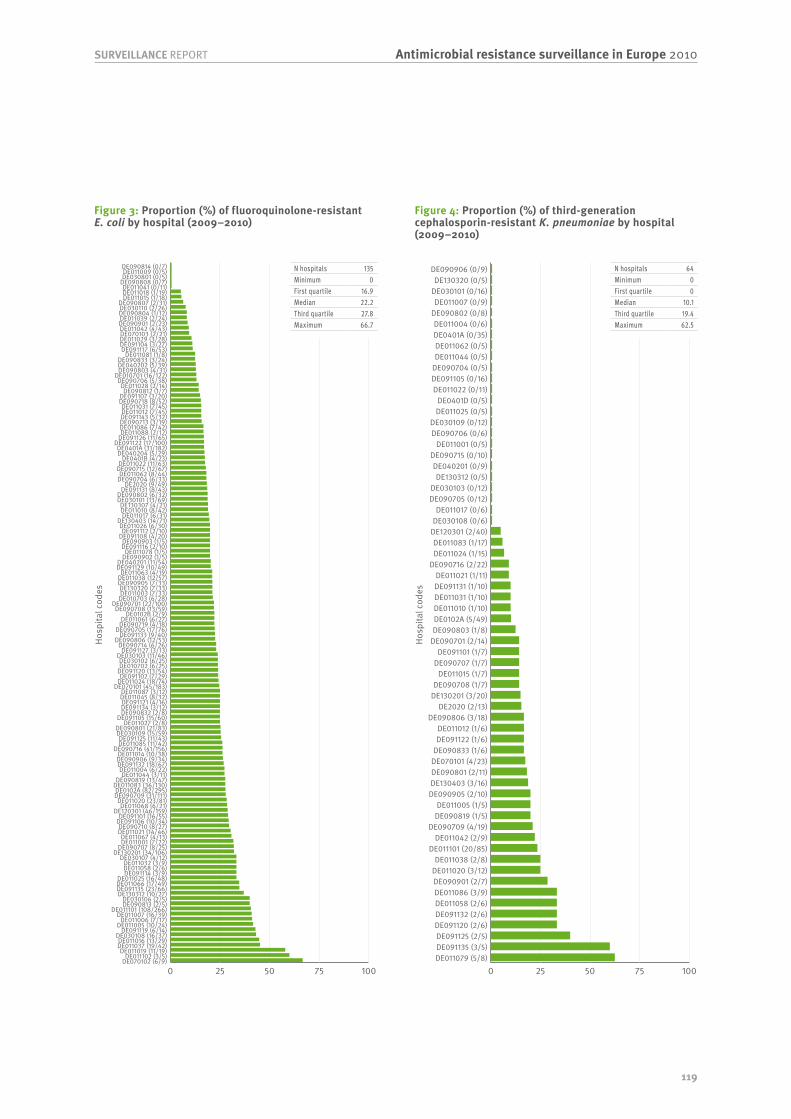
119
Antimicrobial resistance surveillance in Europe 2010SURVEILLANCE REPORT
Hosp
ital c
odes
0 25 50 75 100DE070102 (6/9)DE011102 (3/5)
DE011019 (11/19)DE011037 (19/42)DE011016 (13/29)
DE030108 (16/37)DE091119 (6/14)
DE011005 (10/24)DE011006 (7/17)
DE011007 (16/39)DE011101 (108/266)
DE090813 (2/5)DE030106 (2/5)
DE130312 (10/27)DE091135 (23/66)DE011066 (17/49)DE011025 (16/48)
DE091114 (3/9)DE011058 (2/6)DE011032 (3/9)
DE030107 (4/12)DE130201 (34/106)
DE090707 (8/25)DE011001 (7/22)DE011067 (4/13)
DE011021 (14/46)DE090710 (8/27)
DE091106 (10/34)DE091101 (16/55)
DE120301 (46/159)DE011068 (6/21)
DE011020 (23/81)DE090709 (31/111)DE0102A (82/295)
DE011083 (36/130)DE090819 (13/47)
DE011044 (3/11)DE011004 (6/22)
DE091132 (18/67)DE090906 (9/34)DE011014 (10/38)
DE090716 (41/156)DE011085 (11/42)DE091125 (11/43)
DE030109 (15/59)DE090801 (21/83)
DE011027 (2/8)DE091105 (15/60)
DE090832 (2/8)DE091134 (3/12)DE091121 (4/16)
DE011045 (8/32)DE011087 (3/12)
DE070101 (45/183)DE011024 (18/74)DE091102 (7/29)
DE091120 (13/54)DE010702 (6/25)DE030102 (6/25)
DE030103 (11/46)DE091127 (3/13)
DE090714 (6/26)DE090806 (12/53)
DE091133 (9/40)DE090705 (17/76)
DE090719 (4/18)DE011061 (6/27)
DE0102B (2/9)DE090708 (13/59)
DE090701 (22/100)DE010703 (6/28)DE011003 (7/33)DE130320 (7/33)
DE090905 (7/33)DE011038 (12/57)DE011063 (4/19)
DE091129 (10/49)DE040201 (11/54)
DE090902 (1/5)DE011078 (1/5)
DE091116 (2/10)DE090903 (1/5)
DE091108 (4/20)DE091112 (2/10)
DE011026 (6/30)DE130403 (14/71)
DE011017 (6/31)DE011010 (8/42)DE130307 (4/21)
DE030101 (13/69)DE090802 (6/32)
DE091131 (8/43)DE2020 (9/49)
DE090704 (6/33)DE011062 (8/44)
DE090715 (12/67)DE011022 (11/63)
DE0401B (4/23)DE040204 (5/29)DE0401A (31/182)
DE091122 (17/100)DE091126 (11/65)DE011088 (2/12)DE011086 (7/42)DE090713 (3/19)DE091143 (5/32)DE011012 (7/45)DE011031 (7/45)
DE090718 (8/52)DE091107 (3/20)
DE090812 (1/7)DE011028 (2/14)
DE090706 (5/38)DE010701 (16/122)
DE090803 (4/31)DE040202 (5/39)DE090833 (3/24)
DE011081 (1/8)DE091117 (6/53)DE091104 (3/27)DE011029 (3/28)DE070103 (2/21)DE011042 (4/43)DE090901 (2/23)DE011039 (2/24)DE090804 (1/12)DE030110 (2/26)DE090807 (2/31)
DE011015 (1/18)DE011018 (1/19)DE011041 (0/11)
DE090808 (0/7)DE030801 (0/5)DE011009 (0/5)DE090814 (0/7)
Hosp
ital c
odes
0 25 50 75 100DE011079 (5/8)DE091135 (3/5)DE091125 (2/5)DE091120 (2/6)DE091132 (2/6)DE011058 (2/6)DE011086 (3/9)DE090901 (2/7)DE011020 (3/12)DE011038 (2/8)
DE011101 (20/85)DE011042 (2/9)
DE090709 (4/19)DE090819 (1/5)DE011005 (1/5)
DE090905 (2/10)DE130403 (3/16)DE090801 (2/11)DE070101 (4/23)DE090833 (1/6)DE091122 (1/6)DE011012 (1/6)
DE090806 (3/18)DE2020 (2/13)
DE130201 (3/20)DE090708 (1/7)
DE011015 (1/7)DE090707 (1/7)DE091101 (1/7)
DE090701 (2/14)DE090803 (1/8)DE0102A (5/49)DE011010 (1/10)DE011031 (1/10)DE091131 (1/10)DE011021 (1/11)
DE090716 (2/22)DE011024 (1/15)DE011083 (1/17)
DE120301 (2/40)DE030108 (0/6)DE011017 (0/6)
DE090705 (0/12)DE030103 (0/12)
DE130312 (0/5)DE040201 (0/9)
DE090715 (0/10)DE011001 (0/5)
DE090706 (0/6)DE030109 (0/12)
DE011025 (0/5)DE0401D (0/5)
DE011022 (0/11)DE091105 (0/16)DE090704 (0/5)DE011044 (0/5)DE011062 (0/5)DE0401A (0/35)DE011004 (0/6)
DE090802 (0/8)DE011007 (0/9)
DE030101 (0/16)DE130320 (0/5)
DE090906 (0/9)
Figure 3: Proportion (%) of fluoroquinolone-resistant E. coli by hospital (2009–2010)
Figure 4: Proportion (%) of third-generation cephalosporin-resistant K. pneumoniae by hospital (2009–2010)
N hospitals 135Minimum 0First quartile 16.9Median 22.2Third quartile 27.8Maximum 66.7
N hospitals 64Minimum 0First quartile 0Median 10.1Third quartile 19.4Maximum 62.5

120
SURVEILLANCE REPORTAntimicrobial resistance surveillance in Europe 2010
Greece
General information about EARS-Net participating laboratories
Antibiotic resistance from 2003 to 2010
Table 1: Number of laboratories and number of isolates reported for the period 2003–2010
YearS. pneumoniae S. aureus E. coli Enterecocci K. pneumoniae P. aeruginosaLabs Isolates Labs Isolates Labs Isolates Labs Isolates Labs Isolates Labs Isolates
2003 - - 34 682 35 1076 32 621 - - - -2004 - - 35 610 39 1131 34 565 - - - -2005 - - 35 682 35 1140 34 737 33 774 33 6992006 - - 42 828 41 1253 39 949 38 841 38 8182007 - - 41 819 43 1234 39 999 38 972 37 8022008 - - 46 907 44 1462 42 992 41 1093 42 9202009 - - 48 1025 49 1831 47 1190 47 1649 47 11232010 - - 44 902 45 1549 43 1105 40 1703 42 1014
Table 2: Proportion (%) of antibiotic non-susceptible isolates
Pathogens by antimicrobial classes 2003 2004 2005 2006 2007 2008 2009 2010Streptococcus pneumoniaePenicillin R - - - - - - - -Penicillin RI - - - - - - - -Macrolides RI - - - - - - - -Staphylococcus aureusOxacillin/Meticillin R 45 44 42 43 48 41 40 39Escherichia coliAminopenicilins R 44 46 46 46 48 50 51 52Aminoglycosides R 6 6 7 7 9 15 14 16Fluoroquinolones R 12 12 12 14 19 22 23 24Third-gen. cephalosporins R 6 6 7 6 8 10 10 14Carbapenems R <1 <1 <1 <1 <1 <1 <1 <1Enterococcus faecalisAminopenicilins RI 4 4 3 5 4 3 4 3HL Gentamicin R 52 59 54 57 65 52 61 43Vancomycin R 7 4 4 5 7 7 6 3Enterococcus faeciumAminopenicilins RI 89 84 85 88 91 85 86 93HL Gentamicin R 40 52 34 35 44 52 63 53Vancomycin R 18 20 37 42 37 28 27 23Klebsiella pneumoniaeAminoglycosides R - - 60 54 54 55 60 62Fluoroquinolones R - - 54 50 55 64 66 71Third-gen. cephalosporins R - - 61 58 62 66 69 75Carbapenems R - - 28 33 42 37 44 49Pseudomonas aeruginosaPiperacillin R - - 30 39 38 34 33 39Ceftazidime R - - 27 34 40 37 34 40Carbapenems R - - 39 48 47 49 44 43Aminoglycosides R - - 40 47 49 48 41 42Fluoroquinolones R - - 39 45 50 48 45 46

121
Antimicrobial resistance surveillance in Europe 2010SURVEILLANCE REPORT
Demographic characteristics
Table 3: Selected details on invasive isolates from the reporting period 2009 and 2010
CharacteristicS. pneumoniae
n=.S. aureus n=1 863
E. coli n=3 322
E. faecalis n=1 372
E. faecium n=870
K. pneumoniae n=3 320
P. aeruginosa n=2 094
% total % PNSP % total % MRSA % total % FREC % total % VRE % total % VRE % total % CRKP % total % CRPAIsolate sourceBlood - - 100 40 100 24 100 5 100 25 97 71 97 43CSF - - - - <1 7 - - - - 3 89 3 68GenderMale - - 8 35 8 23 6 3 9 25 5 65 6 38Female - - 4 34 8 17 4 0 7 31 4 57 4 32Unknown - - 88 41 84 25 89 5 84 24 91 73 90 44Age (years)0–4 - - 6 36 7 21 9 9 8 20 8 79 6 435–19 - - - - <1 14 - - - - <1 0 <1 020–64 - - 3 25 3 12 1 0 3 33 2 44 2 2265 and over - - 3 31 5 29 3 0 3 26 3 57 3 27Unknown - - 88 41 86 24 86 4 86 25 88 72 89 45Hospital departmentICU - - 13 51 6 31 31 10 33 30 46 91 47 56Internal med. - - 73 37 77 23 51 2 49 24 37 53 39 34Surgery - - 10 52 10 32 14 3 15 15 13 68 12 34Other - - 3 28 4 8 2 0 3 17 4 35 2 18Unknown - - 2 48 3 16 2 7 1 20 1 41 1 6
PNSP: penicillin-non-susceptible S. pneumoniae; MRSA: meticillin-resistant S. aureus; FREC: fluoroquinolone-resistant E. coli; VRE: vancomycin-resistant Enterococcus; CRKP: third-generation cephalosporin-resistant K. pneumoniae; CRPA: carbapenems-resistant P. aeruginosa.
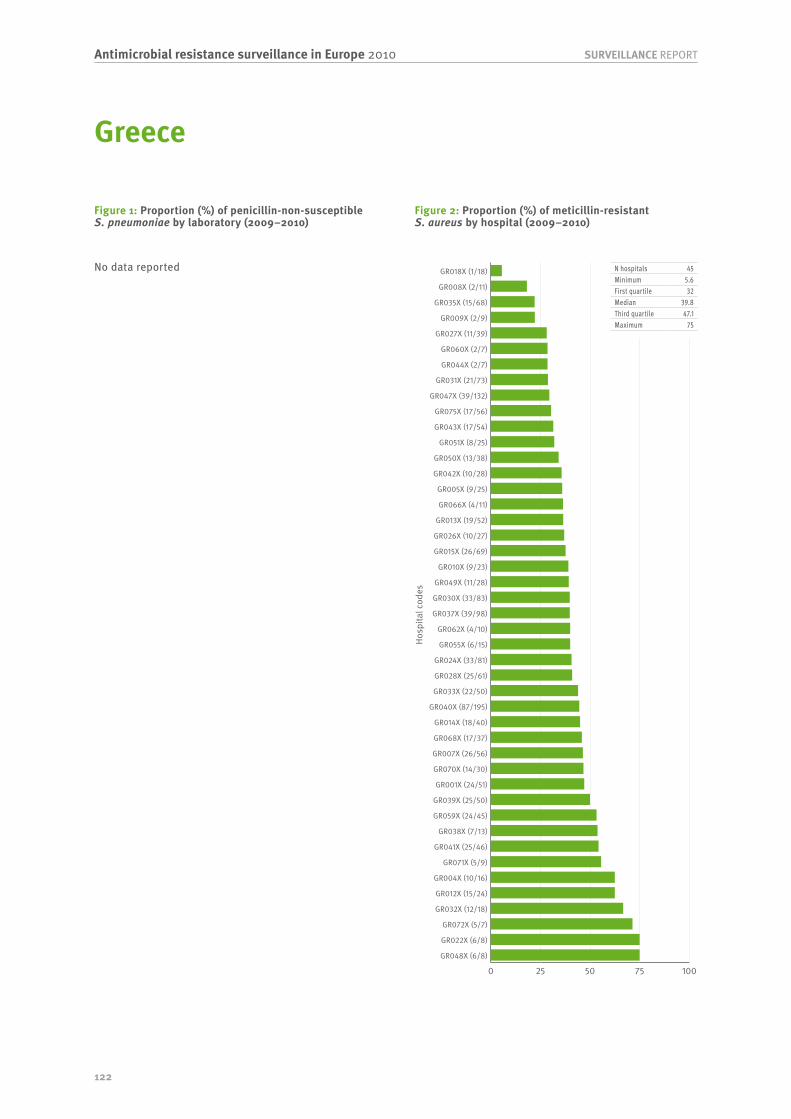
122
SURVEILLANCE REPORTAntimicrobial resistance surveillance in Europe 2010
Hosp
ital c
odes
0 25 50 75 100
GR048X (6/8)
GR022X (6/8)
GR072X (5/7)
GR032X (12/18)
GR012X (15/24)
GR004X (10/16)
GR071X (5/9)
GR041X (25/46)
GR038X (7/13)
GR059X (24/45)
GR039X (25/50)
GR001X (24/51)
GR070X (14/30)
GR007X (26/56)
GR068X (17/37)
GR014X (18/40)
GR040X (87/195)
GR033X (22/50)
GR028X (25/61)
GR024X (33/81)
GR055X (6/15)
GR062X (4/10)
GR037X (39/98)
GR030X (33/83)
GR049X (11/28)
GR010X (9/23)
GR015X (26/69)
GR026X (10/27)
GR013X (19/52)
GR066X (4/11)
GR005X (9/25)
GR042X (10/28)
GR050X (13/38)
GR051X (8/25)
GR043X (17/54)
GR075X (17/56)
GR047X (39/132)
GR031X (21/73)
GR044X (2/7)
GR060X (2/7)
GR027X (11/39)
GR009X (2/9)
GR035X (15/68)
GR008X (2/11)
GR018X (1/18)
Figure 1: Proportion (%) of penicillin-non-susceptible S. pneumoniae by laboratory (2009–2010)
Figure 2: Proportion (%) of meticillin-resistant S. aureus by hospital (2009–2010)
N hospitals 45Minimum 5.6First quartile 32Median 39.8Third quartile 47.1Maximum 75
Greece
No data reported
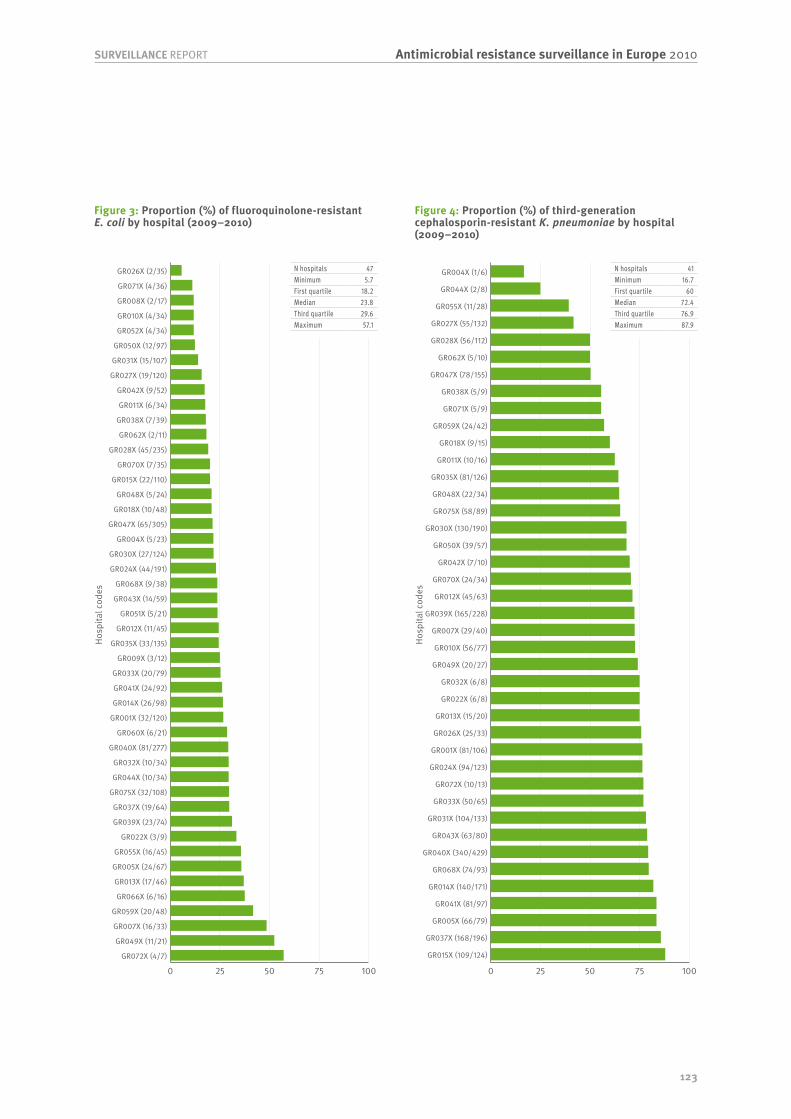
123
Antimicrobial resistance surveillance in Europe 2010SURVEILLANCE REPORT
Hosp
ital c
odes
0 25 50 75 100GR072X (4/7)
GR049X (11/21)
GR007X (16/33)
GR059X (20/48)
GR066X (6/16)
GR013X (17/46)
GR005X (24/67)
GR055X (16/45)
GR022X (3/9)
GR039X (23/74)
GR037X (19/64)
GR075X (32/108)
GR044X (10/34)
GR032X (10/34)
GR040X (81/277)
GR060X (6/21)
GR001X (32/120)
GR014X (26/98)
GR041X (24/92)
GR033X (20/79)
GR009X (3/12)
GR035X (33/135)
GR012X (11/45)
GR051X (5/21)
GR043X (14/59)
GR068X (9/38)
GR024X (44/191)
GR030X (27/124)
GR004X (5/23)
GR047X (65/305)
GR018X (10/48)
GR048X (5/24)
GR015X (22/110)
GR070X (7/35)
GR028X (45/235)
GR062X (2/11)
GR038X (7/39)
GR011X (6/34)
GR042X (9/52)
GR027X (19/120)
GR031X (15/107)
GR050X (12/97)
GR052X (4/34)
GR010X (4/34)
GR008X (2/17)
GR071X (4/36)
GR026X (2/35)
Hosp
ital c
odes
0 25 50 75 100
GR015X (109/124)
GR037X (168/196)
GR005X (66/79)
GR041X (81/97)
GR014X (140/171)
GR068X (74/93)
GR040X (340/429)
GR043X (63/80)
GR031X (104/133)
GR033X (50/65)
GR072X (10/13)
GR024X (94/123)
GR001X (81/106)
GR026X (25/33)
GR013X (15/20)
GR022X (6/8)
GR032X (6/8)
GR049X (20/27)
GR010X (56/77)
GR007X (29/40)
GR039X (165/228)
GR012X (45/63)
GR070X (24/34)
GR042X (7/10)
GR050X (39/57)
GR030X (130/190)
GR075X (58/89)
GR048X (22/34)
GR035X (81/126)
GR011X (10/16)
GR018X (9/15)
GR059X (24/42)
GR071X (5/9)
GR038X (5/9)
GR047X (78/155)
GR062X (5/10)
GR028X (56/112)
GR027X (55/132)
GR055X (11/28)
GR044X (2/8)
GR004X (1/6)
Figure 3: Proportion (%) of fluoroquinolone-resistant E. coli by hospital (2009–2010)
Figure 4: Proportion (%) of third-generation cephalosporin-resistant K. pneumoniae by hospital (2009–2010)
N hospitals 47Minimum 5.7First quartile 18.2Median 23.8Third quartile 29.6Maximum 57.1
N hospitals 41Minimum 16.7First quartile 60Median 72.4Third quartile 76.9Maximum 87.9

124
SURVEILLANCE REPORTAntimicrobial resistance surveillance in Europe 2010
Hungary
General information about EARS-Net participating laboratories
Antibiotic resistance from 2003 to 2010
Table 1: Number of laboratories and number of isolates reported for the period 2003–2010
YearS. pneumoniae S. aureus E. coli Enterecocci K. pneumoniae P. aeruginosaLabs Isolates Labs Isolates Labs Isolates Labs Isolates Labs Isolates Labs Isolates
2003 20 134 27 858 27 842 25 279 - - - -2004 26 143 30 1020 28 967 26 366 - - - -2005 23 133 28 1083 27 1046 27 476 21 314 24 5072006 23 151 27 1127 26 1135 25 453 24 302 25 5462007 22 146 26 1199 25 1179 26 400 23 322 24 5182008 22 166 26 1181 25 1057 21 428 23 369 25 5132009 22 143 26 1068 25 1057 27 444 24 361 25 5182010 27 140 30 1224 29 1385 29 591 29 514 28 636
Table 2: Proportion (%) of antibiotic non-susceptible isolates
Pathogens by antimicrobial classes 2003 2004 2005 2006 2007 2008 2009 2010Streptococcus pneumoniaePenicillin R 3 <1 4 1 5 8 3 6Penicillin RI 24 16 21 18 23 27 12 15Macrolides RI 25 25 32 19 36 32 19 24Staphylococcus aureusOxacillin/Meticillin R 15 17 20 25 23 23 29 30Escherichia coliAminopenicilins R 49 55 51 53 54 59 60 65Aminoglycosides R 8 10 9 12 11 13 16 21Fluoroquinolones R 15 19 22 27 26 26 30 37Third-gen. cephalosporins R <1 3 4 5 5 9 13 19Carbapenems R <1 <1 <1 <1 <1 <1 <1 <1Enterococcus faecalisAminopenicilins RI <1 2 1 3 2 3 2 1HL Gentamicin R 87 57 43 47 48 53 51 51Vancomycin R <1 <1 <1 <1 <1 <1 <1 <1Enterococcus faeciumAminopenicilins RI 91 95 91 88 88 96 97 97HL Gentamicin R 96 80 64 67 53 62 70 62Vancomycin R <1 <1 <1 <1 <1 3 1 2Klebsiella pneumoniaeAminoglycosides R - - 26 20 29 36 40 48Fluoroquinolones R - - 21 13 22 33 33 43Third-gen. cephalosporins R - - 28 20 25 35 38 46Carbapenems R . . <1 <1 <1 <1 <1 5Pseudomonas aeruginosaPiperacillin R - - 10 9 11 13 19 14Ceftazidime R - - 10 8 9 11 12 11Carbapenems R - - 18 16 19 26 27 25Aminoglycosides R - - 32 23 26 26 29 29Fluoroquinolones R - - 28 21 24 26 27 27
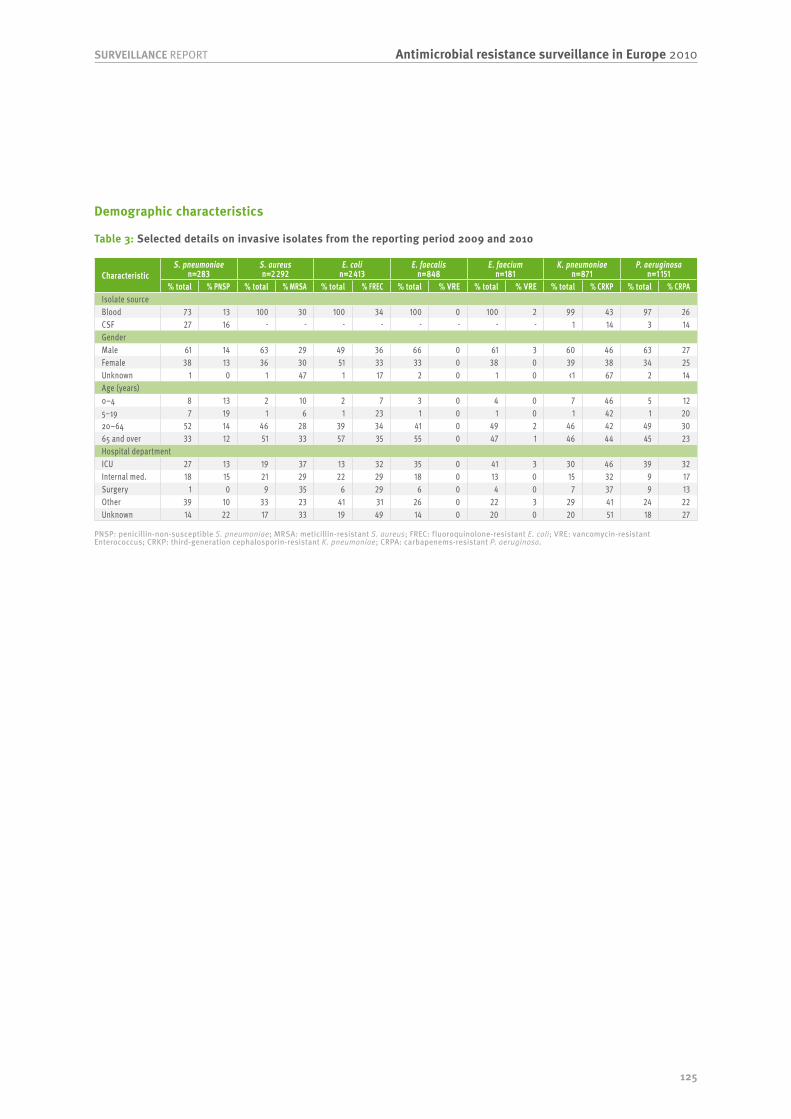
125
Antimicrobial resistance surveillance in Europe 2010SURVEILLANCE REPORT
Demographic characteristics
Table 3: Selected details on invasive isolates from the reporting period 2009 and 2010
CharacteristicS. pneumoniae
n=283S. aureus n=2 292
E. coli n=2 413
E. faecalis n=848
E. faecium n=181
K. pneumoniae n=871
P. aeruginosa n=1 151
% total % PNSP % total % MRSA % total % FREC % total % VRE % total % VRE % total % CRKP % total % CRPAIsolate sourceBlood 73 13 100 30 100 34 100 0 100 2 99 43 97 26CSF 27 16 - - - - - - - - 1 14 3 14GenderMale 61 14 63 29 49 36 66 0 61 3 60 46 63 27Female 38 13 36 30 51 33 33 0 38 0 39 38 34 25Unknown 1 0 1 47 1 17 2 0 1 0 <1 67 2 14Age (years)0–4 8 13 2 10 2 7 3 0 4 0 7 46 5 125–19 7 19 1 6 1 23 1 0 1 0 1 42 1 2020–64 52 14 46 28 39 34 41 0 49 2 46 42 49 3065 and over 33 12 51 33 57 35 55 0 47 1 46 44 45 23Hospital departmentICU 27 13 19 37 13 32 35 0 41 3 30 46 39 32Internal med. 18 15 21 29 22 29 18 0 13 0 15 32 9 17Surgery 1 0 9 35 6 29 6 0 4 0 7 37 9 13Other 39 10 33 23 41 31 26 0 22 3 29 41 24 22Unknown 14 22 17 33 19 49 14 0 20 0 20 51 18 27
PNSP: penicillin-non-susceptible S. pneumoniae; MRSA: meticillin-resistant S. aureus; FREC: fluoroquinolone-resistant E. coli; VRE: vancomycin-resistant Enterococcus; CRKP: third-generation cephalosporin-resistant K. pneumoniae; CRPA: carbapenems-resistant P. aeruginosa.

126
SURVEILLANCE REPORTAntimicrobial resistance surveillance in Europe 2010
Labo
rato
ry c
odes
0 25 50 75 100
HU006 (3/6)
HU005 (3/7)
HU025 (6/16)
HU028 (3/11)
HU019 (3/12)
HU029 (6/28)
HU035 (1/6)
HU026 (1/6)
HU032 (3/20)
HU024 (1/8)
HU009 (2/26)
HU034 (1/17)
HU022 (3/56)
HU002 (0/12)
HU020 (0/11)
HU033 (0/7)
HU040 (0/8)
HU027 (0/5)
Hosp
ital c
odes
0 25 50 75 100
HU022S (17/26)
HU038A (14/25)
HU033A (64/133)
HU006A (18/39)
HU004G (5/11)
HU007B (13/29)
HU005A (26/59)
HU039A (9/21)
HU020A (21/49)
HU009A (70/164)
HU029V (93/252)
HU012G (16/44)
HU007C (6/17)
HU040A (19/54)
HU020C (3/9)
HU019G (3/9)
HU009B (14/42)
HU008F (2/7)
HU035A (22/84)
HU026A (25/96)
HU022P (11/43)
HU032A (34/133)
HU019H (2/8)
HU041A (7/28)
HU001Q (3/12)
HU028A (45/190)
HU005J (3/13)
HU022I (32/139)
HU031A (1/5)
HU019A (22/120)
HU006B (3/18)
HU022Y (1/7)
HU024A (6/43)
HU034A (10/78)
HU001R (1/8)
HU002G (4/34)
HU027A (4/35)
HU002M (1/10)
HU025A (9/90)
HU006W (1/11)
HU020L (1/14)
HU002Y (0/6)
HU034C (0/12)
HU037A (0/5)
Figure 1: Proportion (%) of penicillin-non-susceptible S. pneumoniae by laboratory (2009–2010)
Figure 2: Proportion (%) of meticillin-resistant S. aureus by hospital (2009–2010)
N laboratories 18Minimum 0First quartile 0Median 13.8Third quartile 25Maximum 50
N hospitals 44Minimum 0First quartile 13.4Median 25.3Third quartile 36.6Maximum 65.4
Hungary

127
Antimicrobial resistance surveillance in Europe 2010SURVEILLANCE REPORT
Hosp
ital c
odes
0 25 50 75 100
HU009A (115/186)
HU022S (22/36)
HU005A (20/37)
HU028A (118/252)
HU033A (42/110)
HU032A (56/147)
HU025A (48/128)
HU041A (14/39)
HU016D (2/6)
HU007B (14/42)
HU020C (2/6)
HU020A (12/37)
HU034A (34/108)
HU040A (14/45)
HU035A (22/71)
HU022I (81/262)
HU029V (77/253)
HU026A (15/50)
HU006B (2/7)
HU009B (8/34)
HU006A (12/53)
HU024A (11/50)
HU039A (6/29)
HU037A (1/5)
HU002M (1/5)
HU022Y (1/5)
HU012G (4/22)
HU034C (2/11)
HU020L (5/28)
HU027A (11/65)
HU001Q (1/6)
HU038A (3/18)
HU031A (2/13)
HU019A (15/115)
HU002G (3/27)
HU022P (2/18)
HU019G (1/10)
HU004G (1/12)
HU001R (0/12)
Hosp
ital c
odes
0 25 50 75 100
HU007C (4/6)
HU012G (6/10)
HU005A (8/14)
HU032A (65/117)
HU039A (5/9)
HU001P (6/11)
HU028A (98/181)
HU006A (8/16)
HU001R (4/8)
HU009A (16/32)
HU029V (61/132)
HU007B (9/20)
HU027A (4/9)
HU025A (18/48)
HU033A (16/43)
HU002G (5/15)
HU035A (6/23)
HU034A (6/24)
HU020A (2/8)
HU041A (3/13)
HU022I (4/20)
HU031A (1/5)
HU026A (3/23)
HU040A (1/11)
HU019A (1/17)
HU005J (0/6)
HU024A (0/8)
HU009B (0/5)
Figure 3: Proportion (%) of fluoroquinolone-resistant E. coli by hospital (2009–2010)
Figure 4: Proportion (%) of third-generation cephalosporin-resistant K. pneumoniae by hospital (2009–2010)
N hospitals 39Minimum 0First quartile 16.9Median 23.5Third quartile 33.3Maximum 61.8
N hospitals 28Minimum 0First quartile 20Median 37.4Third quartile 52.1Maximum 66.7

128
SURVEILLANCE REPORTAntimicrobial resistance surveillance in Europe 2010
Iceland
General information about EARS-Net participating laboratories
Antibiotic resistance from 2003 to 2010
Table 1: Number of laboratories and number of isolates reported for the period 2003–2010
YearS. pneumoniae S. aureus E. coli Enterecocci K. pneumoniae P. aeruginosaLabs Isolates Labs Isolates Labs Isolates Labs Isolates Labs Isolates Labs Isolates
2003 2 35 2 64 2 100 2 22 - - - -2004 2 54 2 55 2 119 1 27 - - - -2005 2 37 2 78 2 130 2 31 2 22 1 132006 2 52 2 57 2 130 2 40 2 13 1 92007 2 42 2 65 2 105 1 29 2 27 1 112008 2 46 2 63 2 123 2 17 1 24 2 72009 2 35 2 59 2 111 2 51 2 27 2 162010 2 37 2 65 2 104 2 31 2 27 2 12
Table 2: Proportion (%) of antibiotic non-susceptible isolates
Pathogens by antimicrobial classes 2003 2004 2005 2006 2007 2008 2009 2010Streptococcus pneumoniaePenicillin R <1 2 <1 <1 2 <1 <1 3Penicillin RI 9 17 8 6 7 9 <1 5Macrolides RI 20 8 17 10 17 22 3 11Staphylococcus aureusOxacillin/Meticillin R <1 <1 <1 <1 <1 2 <1 2Escherichia coliAminopenicilins R 42 43 38 45 46 44 50 46Aminoglycosides R 2 <1 <1 7 6 7 7 3Fluoroquinolones R 6 2 3 12 17 6 7 11Third-gen. cephalosporins R 1 <1 <1 <1 2 <1 2 4Carbapenems R <1 <1 <1 <1 <1 <1 <1 <1Enterococcus faecalisAminopenicilins RI <1 <1 <1 7 <1 <1 <1 <1HL Gentamicin R <1 5 <1 3 13 30 15 13Vancomycin R <1 <1 <1 <1 <1 <1 <1 <1Enterococcus faeciumAminopenicilins RI 57 63 80 56 57 43 68 38HL Gentamicin R <1 13 <1 14 14 43 36 13Vancomycin R <1 <1 <1 <1 <1 <1 8 6Klebsiella pneumoniaeAminoglycosides R - - <1 <1 <1 4 <1 <1Fluoroquinolones R - - <1 <1 <1 8 <1 <1Third-gen. cephalosporins R - - <1 <1 <1 4 <1 4Carbapenems R - - <1 <1 <1 <1 <1 <1Pseudomonas aeruginosaPiperacillin R - - 8 <1 <1 <1 13 8Ceftazidime R - - 8 <1 <1 <1 6 8Carbapenems R - - 8 <1 <1 <1 <1 <1Aminoglycosides R - - <1 <1 <1 <1 <1 <1Fluoroquinolones R - - <1 <1 <1 <1 13 17

129
Antimicrobial resistance surveillance in Europe 2010SURVEILLANCE REPORT
Demographic characteristics
Table 3: Selected details on invasive isolates from the reporting period 2009 and 2010
CharacteristicS. pneumoniae
n=72S. aureus
n=124E. coli n=194
E. faecalis n=41
E. faecium n=41
K. pneumoniae n=54
P. aeruginosa n=28
% total % PNSP % total % MRSA % total % FREC % total % VRE % total % VRE % total % CRKP % total % CRPAIsolate sourceBlood 96 3 100 1 99 9 100 0 100 7 100 2 100 0CSF 4 0 - - 1 0 - - - - - - - -GenderMale 53 3 62 1 46 11 76 0 56 13 57 3 71 0Female 47 3 38 0 54 7 24 0 44 0 43 0 29 0Age (years)0–4 15 18 3 0 4 0 5 0 - - - - 4 05–19 4 0 4 0 2 0 - - 2 0 - - - -20–64 43 0 40 2 30 16 32 0 37 7 39 0 32 065 and over 38 0 53 0 64 6 63 0 61 8 61 3 64 0Hospital departmentICU 3 0 2 0 2 33 10 0 10 0 - - 4 0Internal med. 15 9 25 0 20 3 15 0 10 0 15 0 25 0Surgery - - 5 0 3 17 10 0 15 0 4 0 7 0Other 78 2 67 1 73 10 63 0 59 13 80 2 61 0Unknown 4 0 1 0 3 0 2 0 7 0 2 0 4 0
PNSP: penicillin-non-susceptible S. pneumoniae; MRSA: meticillin-resistant S. aureus; FREC: fluoroquinolone-resistant E. coli; VRE: vancomycin-resistant Enterococcus; CRKP: third-generation cephalosporin-resistant K. pneumoniae; CRPA: carbapenems-resistant P. aeruginosa.
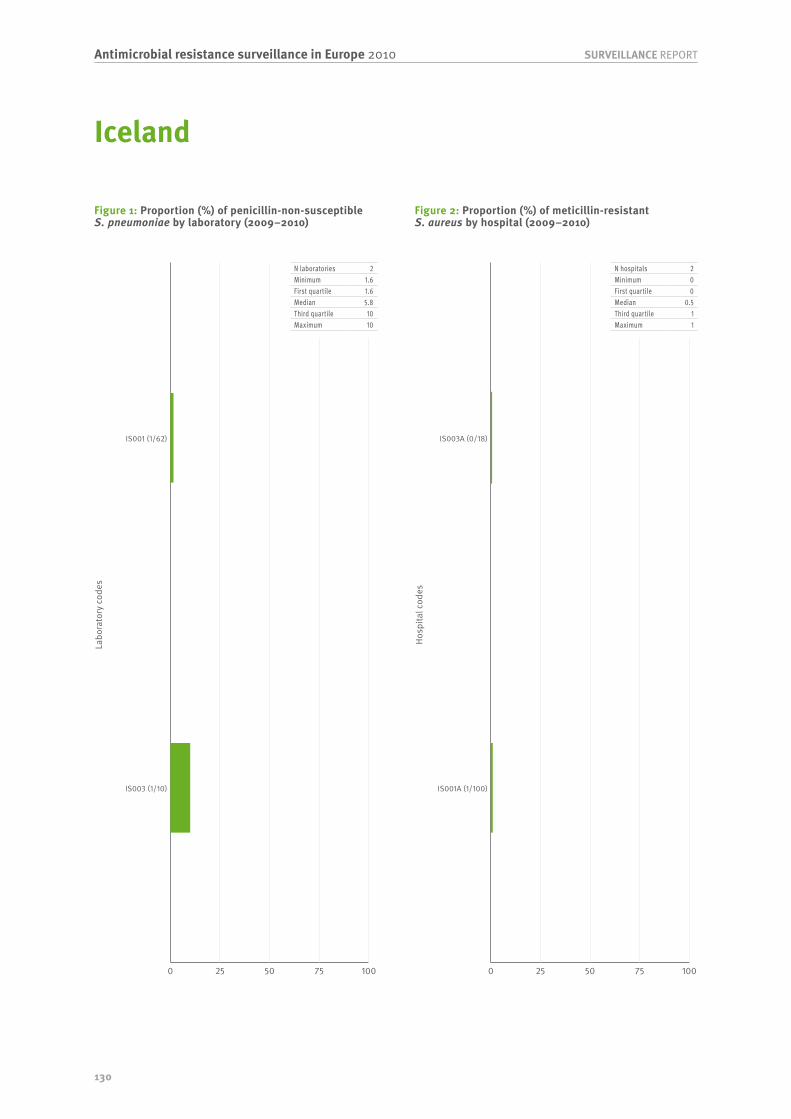
130
SURVEILLANCE REPORTAntimicrobial resistance surveillance in Europe 2010
Labo
rato
ry c
odes
0 25 50 75 100
IS003 (1/10)
IS001 (1/62)
Hosp
ital c
odes
0 25 50 75 100
IS001A (1/100)
IS003A (0/18)
Figure 1: Proportion (%) of penicillin-non-susceptible S. pneumoniae by laboratory (2009–2010)
Figure 2: Proportion (%) of meticillin-resistant S. aureus by hospital (2009–2010)
N laboratories 2Minimum 1.6First quartile 1.6Median 5.8Third quartile 10Maximum 10
N hospitals 2Minimum 0First quartile 0Median 0.5Third quartile 1Maximum 1
Iceland

131
Antimicrobial resistance surveillance in Europe 2010SURVEILLANCE REPORT
Hosp
ital c
odes
0 25 50 75 100
IS001A (16/165)
IS001B (0/7)
IS001C (0/7)
IS001G (0/8)
Hosp
ital c
odes
0 25 50 75 100
IS001A (1/48)
Figure 3: Proportion (%) of fluoroquinolone-resistant E. coli by hospital (2009–2010)
Figure 4: Proportion (%) of third-generation cephalosporin-resistant K. pneumoniae by hospital (2009–2010)
N hospitals 4Minimum 0First quartile 0Median 0Third quartile 4.8Maximum 9.7
N hospitals 1Minimum 2.1First quartile 2.1Median 2.1Third quartile 2.1Maximum 2.1

132
SURVEILLANCE REPORTAntimicrobial resistance surveillance in Europe 2010
Ireland
General information about EARS-Net participating laboratories
Antibiotic resistance from 2003 to 2010
Table 1: Number of laboratories and number of isolates reported for the period 2003–2010
YearS. pneumoniae S. aureus E. coli Enterecocci K. pneumoniae P. aeruginosaLabs Isolates Labs Isolates Labs Isolates Labs Isolates Labs Isolates Labs Isolates
2003 24 363 26 1108 26 978 21 348 - - - -2004 28 399 38 1286 37 1235 29 418 - - - -2005 31 397 38 1360 39 1424 33 502 15 42 11 292006 32 406 38 1347 39 1638 32 550 28 211 23 1282007 33 435 41 1332 42 1750 37 598 31 237 29 1722008 35 442 38 1242 41 1875 37 685 33 307 29 1912009 34 356 41 1261 41 2012 38 671 37 316 30 2362010 32 310 39 1207 40 2121 38 670 34 318 30 219
Table 2: Proportion (%) of antibiotic non-susceptible isolates
Pathogens by antimicrobial classes 2003 2004 2005 2006 2007 2008 2009 2010Streptococcus pneumoniaePenicillin R 3 3 3 3 6 6 6 5Penicillin RI 12 10 11 16 17 23 20 18Macrolides RI 12 14 12 16 17 17 17 16Staphylococcus aureusOxacillin/Meticillin R 42 41 42 42 38 33 27 24Escherichia coliAminopenicilins R 61 65 67 69 65 67 66 67Aminoglycosides R 4 5 7 7 10 9 9 10Fluoroquinolones R 10 12 17 21 21 23 22 23Third-gen. cephalosporins R 2 2 4 4 5 6 6 8Carbapenems R <1 <1 <1 <1 <1 <1 <1 <1Enterococcus faecalisAminopenicilins RI 5 <1 4 5 2 <1 3 2HL Gentamicin R 32 42 42 43 38 31 34 29Vancomycin R <1 1 3 3 3 3 <1 <1Enterococcus faeciumAminopenicilins RI 91 96 93 94 93 95 93 96HL Gentamicin R 54 56 52 44 36 27 38 39Vancomycin R 19 22 31 36 33 35 38 39Klebsiella pneumoniaeAminoglycosides R - - 5 9 10 9 11 7Fluoroquinolones R - - 3 16 17 11 11 8Third-gen. cephalosporins R - - 7 9 8 11 11 8Carbapenems R - - <1 <1 <1 <1 <1 <1Pseudomonas aeruginosaPiperacillin R - - 7 7 6 5 4 8Ceftazidime R - - 10 6 5 4 6 6Carbapenems R - - 11 9 9 6 8 6Aminoglycosides R - - 7 9 10 6 6 5Fluoroquinolones R - - 14 17 18 16 9 11

133
Antimicrobial resistance surveillance in Europe 2010SURVEILLANCE REPORT
Demographic characteristics
Table 3: Selected details on invasive isolates from the reporting period 2009 and 2010
CharacteristicS. pneumoniae
n=666S. aureus n=2 468
E. coli n=4 122
E. faecalis n=571
E. faecium n=768
K. pneumoniae n=632
P. aeruginosa n=440
% total % PNSP % total % MRSA % total % FREC % total % VRE % total % VRE % total % CRKP % total % CRPAIsolate sourceBlood 97 20 100 25 100 22 100 1 100 38 100 10 99 8CSF 3 5 - - <1 11 - - - - - - 1 0GenderMale 54 18 64 26 45 26 59 0 57 40 55 11 55 7Female 46 20 36 25 55 19 41 0 43 36 45 9 45 8Unknown - - - - <1 0 <1 100 - - - - - -Age (years)0–4 12 21 9 7 3 4 10 0 3 13 4 18 4 65–19 4 8 4 10 1 8 1 0 2 20 1 0 3 3120–64 37 15 38 21 30 19 35 1 41 50 45 9 36 1165 and over 47 22 49 33 65 25 54 1 54 32 49 10 57 4Unknown - - - - <1 0 - - - - - - - -Hospital departmentICU 4 8 3 37 3 24 4 0 7 33 3 0 6 12Internal med. 13 23 12 39 13 26 13 0 7 38 8 6 12 6Surgery 1 29 6 30 6 25 5 0 5 31 4 8 6 7Other 30 16 21 17 23 17 18 1 12 29 19 4 15 13Unknown 53 20 58 24 55 23 60 1 69 41 67 12 61 6
PNSP: penicillin-non-susceptible S. pneumoniae; MRSA: meticillin-resistant S. aureus; FREC: fluoroquinolone-resistant E. coli; VRE: vancomycin-resistant Enterococcus; CRKP: third-generation cephalosporin-resistant K. pneumoniae; CRPA: carbapenems-resistant P. aeruginosa.

134
SURVEILLANCE REPORTAntimicrobial resistance surveillance in Europe 2010
Labo
rato
ry c
odes
0 25 50 75 100
IE-43 (7/12)
IE-30 (3/9)
IE-70 (4/13)
IE-62 (4/13)
IE-46 (5/17)
IE-48 (4/14)
IE-74 (2/7)
IE-20 (9/32)
IE-47 (6/22)
IE-4 (11/41)
IE-25 (9/35)
IE-44 (3/12)
IE-65 (2/9)
IE-2 (7/37)
IE-58 (3/16)
IE-34 (8/46)
IE-73 (1/6)
IE-31 (3/18)
IE-10 (12/74)
IE-61 (2/13)
IE-6 (2/13)
IE-50 (7/58)
IE-1 (4/38)
IE-32 (3/29)
IE-60 (1/16)
IE-15 (2/33)
IE-18 (0/7)
IE-49 (0/12)
Hosp
ital c
odes
0 25 50 75 100IE-52 (9/15)
IE-58 (32/58)
IE-70 (21/43)
IE-26 (5/11)
IE-30 (15/35)
IE-33 (12/30)
IE-13 (9/25)
IE-62 (6/17)
IE-74 (12/35)
IE-34 (39/115)
IE-51 (5/15)
IE-79 (2/6)
IE-29 (50/152)
IE-61 (6/19)
IE-48 (23/73)
IE-44 (11/36)
IE-38 (4/14)
IE-47 (14/50)
IE-1 (50/179)
IE-10 (25/91)
IE-35 (3/11)
IE-32 (11/43)
IE-11 (15/61)
IE-50 (40/166)
IE-15 (39/162)
IE-73 (4/17)
IE-20 (33/144)
IE-31 (9/41)
IE-2 (41/192)
IE-43 (5/24)
IE-6 (11/53)
IE-4 (24/118)
IE-64 (3/15)
IE-80 (2/13)
IE-18 (4/26)
IE-12 (6/40)
IE-72 (1/7)
IE-60 (6/46)
IE-76 (1/9)
IE-63 (1/13)
IE-71 (1/14)
IE-21 (1/17)
IE-46 (3/62)
IE-49 (1/21)
IE-59 (1/36)
IE-77 (0/19)
IE-65 (0/9)
IE-37 (0/5)
IE-36 (0/12)
IE-57 (0/24)
Figure 1: Proportion (%) of penicillin-non-susceptible S. pneumoniae by laboratory (2009–2010)
Figure 2: Proportion (%) of meticillin-resistant S. aureus by hospital (2009–2010)
N laboratories 28Minimum 0First quartile 13.7Median 18.8Third quartile 28.3Maximum 58.3
N hospitals 50Minimum 0First quartile 13Median 23.8Third quartile 32.9Maximum 60
Ireland
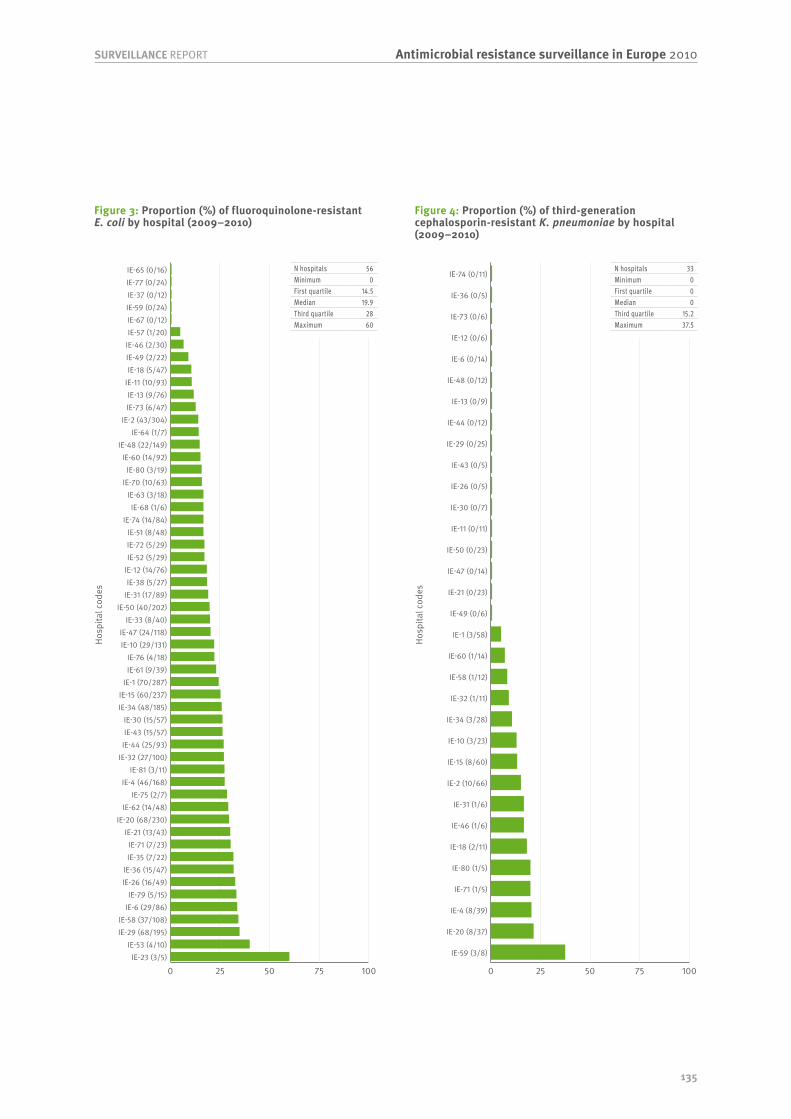
135
Antimicrobial resistance surveillance in Europe 2010SURVEILLANCE REPORT
Hosp
ital c
odes
0 25 50 75 100IE-23 (3/5)
IE-53 (4/10)IE-29 (68/195)IE-58 (37/108)
IE-6 (29/86)IE-79 (5/15)
IE-26 (16/49)IE-36 (15/47)
IE-35 (7/22)IE-71 (7/23)
IE-21 (13/43)IE-20 (68/230)
IE-62 (14/48)IE-75 (2/7)
IE-4 (46/168)IE-81 (3/11)
IE-32 (27/100)IE-44 (25/93)IE-43 (15/57)IE-30 (15/57)
IE-34 (48/185)IE-15 (60/237)
IE-1 (70/287)IE-61 (9/39)IE-76 (4/18)
IE-10 (29/131)IE-47 (24/118)
IE-33 (8/40)IE-50 (40/202)
IE-31 (17/89)IE-38 (5/27)
IE-12 (14/76)IE-52 (5/29)IE-72 (5/29)IE-51 (8/48)
IE-74 (14/84)IE-68 (1/6)
IE-63 (3/18)IE-70 (10/63)
IE-80 (3/19)IE-60 (14/92)
IE-48 (22/149)IE-64 (1/7)
IE-2 (43/304)IE-73 (6/47)IE-13 (9/76)
IE-11 (10/93)IE-18 (5/47)IE-49 (2/22)IE-46 (2/30)IE-57 (1/20)IE-67 (0/12)IE-59 (0/24)IE-37 (0/12)IE-77 (0/24)IE-65 (0/16)
Hosp
ital c
odes
0 25 50 75 100
IE-59 (3/8)
IE-20 (8/37)
IE-4 (8/39)
IE-71 (1/5)
IE-80 (1/5)
IE-18 (2/11)
IE-46 (1/6)
IE-31 (1/6)
IE-2 (10/66)
IE-15 (8/60)
IE-10 (3/23)
IE-34 (3/28)
IE-32 (1/11)
IE-58 (1/12)
IE-60 (1/14)
IE-1 (3/58)
IE-49 (0/6)
IE-21 (0/23)
IE-47 (0/14)
IE-50 (0/23)
IE-11 (0/11)
IE-30 (0/7)
IE-26 (0/5)
IE-43 (0/5)
IE-29 (0/25)
IE-44 (0/12)
IE-13 (0/9)
IE-48 (0/12)
IE-6 (0/14)
IE-12 (0/6)
IE-73 (0/6)
IE-36 (0/5)
IE-74 (0/11)
Figure 3: Proportion (%) of fluoroquinolone-resistant E. coli by hospital (2009–2010)
Figure 4: Proportion (%) of third-generation cephalosporin-resistant K. pneumoniae by hospital (2009–2010)
N hospitals 56Minimum 0First quartile 14.5Median 19.9Third quartile 28Maximum 60
N hospitals 33Minimum 0First quartile 0Median 0Third quartile 15.2Maximum 37.5

136
SURVEILLANCE REPORTAntimicrobial resistance surveillance in Europe 2010
Italy
General information about EARS-Net participating laboratories
Antibiotic resistance from 2003 to 2010
Table 1: Number of laboratories and number of isolates reported for the period 2003–2010
YearS. pneumoniae S. aureus E. coli Enterecocci K. pneumoniae P. aeruginosaLabs Isolates Labs Isolates Labs Isolates Labs Isolates Labs Isolates Labs Isolates
2003 44 293 46 1480 17 923 44 634 - - - -2004 37 271 42 1225 14 645 40 576 - - - -2005 38 331 41 1479 16 1195 40 714 38 344 - -2006 34 269 38 1164 13 910 35 650 32 321 12 1832007 34 298 38 1167 14 1052 36 656 37 391 10 1852008 27 194 30 939 14 957 31 580 27 331 11 1682009 21 216 23 987 9 863 22 509 22 313 10 1952010 33 323 35 1886 23 2623 35 1106 34 739 23 517
Table 2: Proportion (%) of antibiotic non-susceptible isolates
Pathogens by antimicrobial classes 2003 2004 2005 2006 2007 2008 2009 2010Streptococcus pneumoniaePenicillin R 5 5 5 <1 4 3 3 5Penicillin RI 13 14 9 7 15 10 6 9Macrolides RI 37 29 31 33 31 26 21 29Staphylococcus aureusOxacillin/Meticillin R 39 40 37 38 33 34 37 37Escherichia coliAminopenicilins R 52 53 55 56 58 62 63 64Aminoglycosides R 10 9 11 8 14 14 13 15Fluoroquinolones R 25 28 28 27 32 38 36 39Third-gen. cephalosporins R 6 5 8 7 11 16 17 21Carbapenems R - - - - <1 <1 <1 <1Enterococcus faecalisAminopenicilins RI 4 4 4 4 4 13 20 13HL Gentamicin R 39 36 38 38 39 47 49 50Vancomycin R 2 2 3 3 2 2 3 2Enterococcus faeciumAminopenicilins RI 80 78 77 86 73 64 60 70HL Gentamicin R 44 39 36 48 53 49 52 59Vancomycin R 24 21 19 18 11 6 4 4Klebsiella pneumoniaeAminoglycosides R - - 8 26 25 28 19 29Fluoroquinolones R - - 11 23 27 28 20 39Third-gen. cephalosporins R - - 20 33 35 39 37 47Carbapenems R - - - 1 1 2 1 15Pseudomonas aeruginosaPiperacillin R - - - 23 20 20 24 21Ceftazidime R - - - 20 25 24 16 18Carbapenems R - - - 21 27 33 31 22Aminoglycosides R - - - 30 27 30 36 23Fluoroquinolones R - - - 36 35 36 42 31

137
Antimicrobial resistance surveillance in Europe 2010SURVEILLANCE REPORT
Demographic characteristics
Table 3: Selected details on invasive isolates from the reporting period 2009 and 2010
CharacteristicS. pneumoniae
n=431S. aureus n=2 744
E. coli n=3 299
E. faecalis n=956
E. faecium n=600
K. pneumoniae n=973
P. aeruginosa n=697
% total % PNSP % total % MRSA % total % FREC % total % VRE % total % VRE % total % CRKP % total % CRPAIsolate sourceBlood 90 8 100 37 100 38 100 2 100 4 98 44 98 24CSF 10 7 - - <1 27 - - - - 2 56 2 27GenderMale 47 8 54 39 44 46 58 3 54 4 54 49 58 24Female 39 9 36 37 46 33 34 1 35 4 37 42 34 25Unknown 14 3 10 24 10 34 8 1 11 3 9 21 8 25Age (years)0–4 8 6 2 25 1 8 4 0 1 0 3 45 1 205–19 2 0 1 13 1 21 <1 0 1 0 1 50 <1 6720–64 24 5 22 27 17 36 18 2 19 3 22 44 20 3765 and over 41 6 47 41 44 38 51 2 47 3 45 48 41 17Unknown 24 15 28 39 37 42 28 3 33 6 28 37 37 25Hospital departmentICU 6 8 7 41 4 42 13 2 13 4 13 57 17 35Internal med. 21 9 34 38 30 38 32 2 28 5 30 47 26 19Surgery 2 13 8 42 11 42 10 2 10 3 11 35 10 16Other 35 10 17 29 25 39 13 2 18 3 16 34 15 19Unknown 35 5 34 37 30 36 31 3 32 4 30 43 31 28
PNSP: penicillin-non-susceptible S. pneumoniae; MRSA: meticillin-resistant S. aureus; FREC: fluoroquinolone-resistant E. coli; VRE: vancomycin-resistant Enterococcus; CRKP: third-generation cephalosporin-resistant K. pneumoniae; CRPA: carbapenems-resistant P. aeruginosa.

138
SURVEILLANCE REPORTAntimicrobial resistance surveillance in Europe 2010
Labo
rato
ry c
odes
0 25 50 75 100
IT034 (9/25)
IT077 (2/6)
IT042 (2/7)
IT059 (2/14)
IT024 (2/15)
IT089 (1/14)
IT091 (1/15)
IT004 (2/31)
IT072 (2/32)
IT019 (1/17)
IT064 (1/18)
IT061 (3/71)
IT037 (1/53)
IT067 (0/13)
IT044 (0/5)
IT090 (0/13)
IT021 (0/7)
IT028 (0/5)
IT060 (0/26)
IT022 (0/7)
IT031 (0/7)
Hosp
ital c
odes
0 25 50 75 100
IT0089 (45/68)
IT0035 (35/53)
IT0040 (30/47)
IT0037 (102/167)
IT0086 (25/43)
IT0034 (84/160)
IT004C (6/12)
IT0044 (3/6)
IT0091 (39/79)
IT0085 (20/44)
IT0074 (20/45)
IT004G (34/81)
IT0070 (14/35)
IT0031 (42/108)
IT0075 (7/18)
IT0042 (15/39)
IT0052 (21/55)
IT0072 (51/136)
IT0022 (23/62)
IT0023 (17/46)
IT0060 (21/57)
IT004F (14/38)
IT004A (11/30)
IT004D (9/25)
IT0047 (23/65)
IT004B (7/20)
IT004E (12/37)
IT0092 (10/31)
IT0061 (73/230)
IT0045 (15/48)
IT0065 (5/16)
IT0090 (9/33)
IT0059 (35/134)
IT0028 (9/35)
IT0064 (13/53)
IT0067 (41/169)
IT0001 (24/101)
IT0049 (6/29)
IT0019 (27/152)
IT0088 (3/18)
IT0077 (6/41)
IT0079 (1/7)
IT0071 (1/16)
IT0024 (3/55)
Figure 1: Proportion (%) of penicillin-non-susceptible S. pneumoniae by laboratory (2009–2010)
Figure 2: Proportion (%) of meticillin-resistant S. aureus by hospital (2009–2010)
N laboratories 21Minimum 0First quartile 0Median 5.6Third quartile 7.1Maximum 36
N hospitals 44Minimum 5.5First quartile 25.9Median 36.8Third quartile 43.2Maximum 66.2
Italy
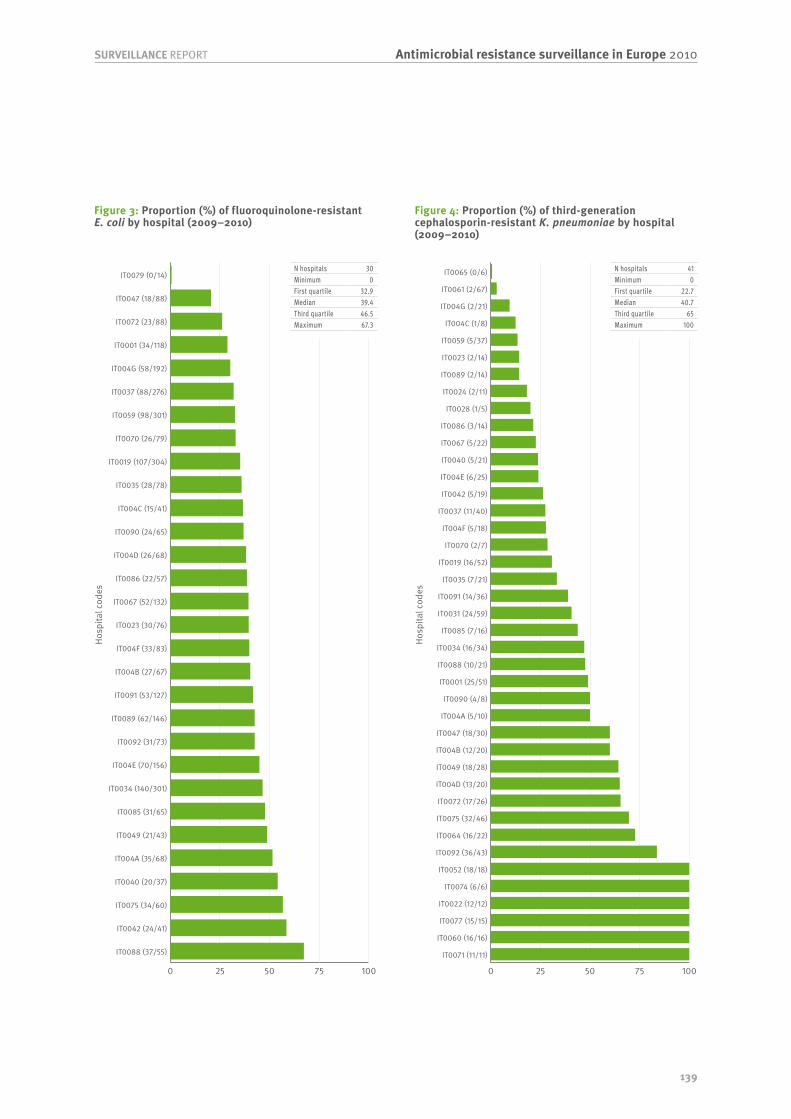
139
Antimicrobial resistance surveillance in Europe 2010SURVEILLANCE REPORT
Hosp
ital c
odes
0 25 50 75 100
IT0088 (37/55)
IT0042 (24/41)
IT0075 (34/60)
IT0040 (20/37)
IT004A (35/68)
IT0049 (21/43)
IT0085 (31/65)
IT0034 (140/301)
IT004E (70/156)
IT0092 (31/73)
IT0089 (62/146)
IT0091 (53/127)
IT004B (27/67)
IT004F (33/83)
IT0023 (30/76)
IT0067 (52/132)
IT0086 (22/57)
IT004D (26/68)
IT0090 (24/65)
IT004C (15/41)
IT0035 (28/78)
IT0019 (107/304)
IT0070 (26/79)
IT0059 (98/301)
IT0037 (88/276)
IT004G (58/192)
IT0001 (34/118)
IT0072 (23/88)
IT0047 (18/88)
IT0079 (0/14)
Hosp
ital c
odes
0 25 50 75 100
IT0071 (11/11)
IT0060 (16/16)
IT0077 (15/15)
IT0022 (12/12)
IT0074 (6/6)
IT0052 (18/18)
IT0092 (36/43)
IT0064 (16/22)
IT0075 (32/46)
IT0072 (17/26)
IT004D (13/20)
IT0049 (18/28)
IT004B (12/20)
IT0047 (18/30)
IT004A (5/10)
IT0090 (4/8)
IT0001 (25/51)
IT0088 (10/21)
IT0034 (16/34)
IT0085 (7/16)
IT0031 (24/59)
IT0091 (14/36)
IT0035 (7/21)
IT0019 (16/52)
IT0070 (2/7)
IT004F (5/18)
IT0037 (11/40)
IT0042 (5/19)
IT004E (6/25)
IT0040 (5/21)
IT0067 (5/22)
IT0086 (3/14)
IT0028 (1/5)
IT0024 (2/11)
IT0089 (2/14)
IT0023 (2/14)
IT0059 (5/37)
IT004C (1/8)
IT004G (2/21)
IT0061 (2/67)
IT0065 (0/6)
Figure 3: Proportion (%) of fluoroquinolone-resistant E. coli by hospital (2009–2010)
Figure 4: Proportion (%) of third-generation cephalosporin-resistant K. pneumoniae by hospital (2009–2010)
N hospitals 30Minimum 0First quartile 32.9Median 39.4Third quartile 46.5Maximum 67.3
N hospitals 41Minimum 0First quartile 22.7Median 40.7Third quartile 65Maximum 100

140
SURVEILLANCE REPORTAntimicrobial resistance surveillance in Europe 2010
Latvia
General information about EARS-Net participating laboratories
Antibiotic resistance from 2003 to 2010
Table 1: Number of laboratories and number of isolates reported for the period 2003–2010
YearS. pneumoniae S. aureus E. coli Enterecocci K. pneumoniae P. aeruginosaLabs Isolates Labs Isolates Labs Isolates Labs Isolates Labs Isolates Labs Isolates
2004 4 17 7 87 - - - - - - - -2005 5 36 7 127 - - - - - - - -2006 7 37 11 172 10 62 10 56 6 28 9 162007 6 31 12 169 9 76 8 57 7 27 6 162008 3 18 12 164 10 90 9 51 11 40 6 112009 7 30 12 188 9 86 8 48 10 44 7 182010 4 38 10 155 8 98 8 61 8 64 6 21
Table 2: Proportion (%) of antibiotic non-susceptible isolates
Pathogens by antimicrobial classes 2003 2004 2005 2006 2007 2008 2009 2010Streptococcus pneumoniaePenicillin R - <1 <1 <1 <1 6 <1 5Penicillin RI - <1 <1 <1 <1 6 <1 5Macrolides RI - 7 3 3 <1 <1 3 5Staphylococcus aureusOxacillin/Meticillin R - 26 20 19 8 12 9 14Escherichia coliAminopenicilins R - - - 44 43 48 43 50Aminoglycosides R - - - 5 14 10 13 11Fluoroquinolones R - - - 10 17 14 24 14Third-gen. cephalosporins R - - - 6 14 11 12 12Carbapenems R - - - <1 <1 <1 2 <1Enterococcus faecalisAminopenicilins RI - - - 9 30 5 12 5HL Gentamicin R - - - 50 - 27 38 47Vancomycin R - - - <1 <1 <1 <1 <1Enterococcus faeciumAminopenicilins RI - - - 94 77 90 82 100HL Gentamicin R - - - 73 <1 78 79 83Vancomycin R - - - <1 <1 7 18 13Klebsiella pneumoniaeAminoglycosides R - - - 25 22 52 43 55Fluoroquinolones R - - - 26 27 45 34 52Third-gen. cephalosporins R - - - 36 44 58 55 55Carbapenems R - - - <1 <1 3 <1 <1Pseudomonas aeruginosaPiperacillin R - - - 17 31 30 17 19Ceftazidime R - - - 29 13 36 17 10Carbapenems R - - - 13 6 40 7 14Aminoglycosides R - - - 47 31 44 22 29Fluoroquinolones R - - - 33 13 45 12 19
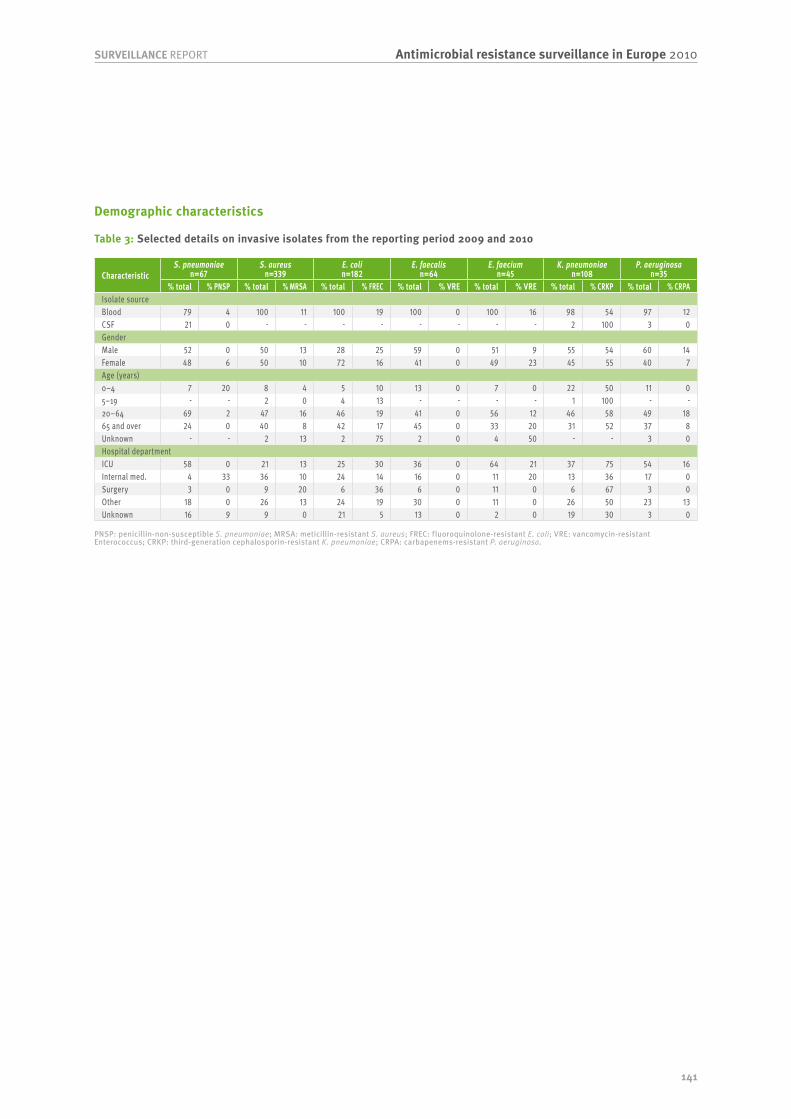
141
Antimicrobial resistance surveillance in Europe 2010SURVEILLANCE REPORT
Demographic characteristics
Table 3: Selected details on invasive isolates from the reporting period 2009 and 2010
CharacteristicS. pneumoniae
n=67S. aureus
n=339E. coli n=182
E. faecalis n=64
E. faecium n=45
K. pneumoniae n=108
P. aeruginosa n=35
% total % PNSP % total % MRSA % total % FREC % total % VRE % total % VRE % total % CRKP % total % CRPAIsolate sourceBlood 79 4 100 11 100 19 100 0 100 16 98 54 97 12CSF 21 0 - - - - - - - - 2 100 3 0GenderMale 52 0 50 13 28 25 59 0 51 9 55 54 60 14Female 48 6 50 10 72 16 41 0 49 23 45 55 40 7Age (years)0–4 7 20 8 4 5 10 13 0 7 0 22 50 11 05–19 - - 2 0 4 13 - - - - 1 100 - -20–64 69 2 47 16 46 19 41 0 56 12 46 58 49 1865 and over 24 0 40 8 42 17 45 0 33 20 31 52 37 8Unknown - - 2 13 2 75 2 0 4 50 - - 3 0Hospital departmentICU 58 0 21 13 25 30 36 0 64 21 37 75 54 16Internal med. 4 33 36 10 24 14 16 0 11 20 13 36 17 0Surgery 3 0 9 20 6 36 6 0 11 0 6 67 3 0Other 18 0 26 13 24 19 30 0 11 0 26 50 23 13Unknown 16 9 9 0 21 5 13 0 2 0 19 30 3 0
PNSP: penicillin-non-susceptible S. pneumoniae; MRSA: meticillin-resistant S. aureus; FREC: fluoroquinolone-resistant E. coli; VRE: vancomycin-resistant Enterococcus; CRKP: third-generation cephalosporin-resistant K. pneumoniae; CRPA: carbapenems-resistant P. aeruginosa.

142
SURVEILLANCE REPORTAntimicrobial resistance surveillance in Europe 2010
Labo
rato
ry c
odes
0 25 50 75 100
LV003 (1/17)
LV004 (0/36)
Hosp
ital c
odes
0 25 50 75 100
LV013A (5/5)
LV007A (3/7)
LV001A (19/110)
LV004A (7/88)
LV003A (3/44)
LV012A (1/22)
LV011A (0/5)
LV005A (0/18)
LV006A (0/6)
LV009A (0/6)
LV002A (0/23)
Figure 1: Proportion (%) of penicillin-non-susceptible S. pneumoniae by laboratory (2009–2010)
Figure 2: Proportion (%) of meticillin-resistant S. aureus by hospital (2009–2010)
N laboratories 2Minimum 0First quartile 0Median 2.9Third quartile 5.9Maximum 5.9
N hospitals 11Minimum 0First quartile 0Median 4.5Third quartile 17.3Maximum 100
Latvia

143
Antimicrobial resistance surveillance in Europe 2010SURVEILLANCE REPORT
Hosp
ital c
odes
0 25 50 75 100
LV001A (13/37)
LV002A (2/7)
LV004A (12/54)
LV012A (3/17)
LV003A (4/54)
LV005A (0/8)
Hosp
ital c
odes
0 25 50 75 100
LV001A (29/38)
LV002A (12/20)
LV004A (9/20)
LV012A (2/8)
LV003A (1/9)
Figure 3: Proportion (%) of fluoroquinolone-resistant E. coli by hospital (2009–2010)
Figure 4: Proportion (%) of third-generation cephalosporin-resistant K. pneumoniae by hospital (2009–2010)
N hospitals 6Minimum 0First quartile 7.4Median 19.9Third quartile 28.6Maximum 35.1
N hospitals 5Minimum 11.1First quartile 25Median 45Third quartile 60Maximum 76.3

144
SURVEILLANCE REPORTAntimicrobial resistance surveillance in Europe 2010
Lithuania
General information about EARS-Net participating laboratories
Antibiotic resistance from 2003 to 2010
Table 1: Number of laboratories and number of isolates reported for the period 2003–2010
YearS. pneumoniae S. aureus E. coli Enterecocci K. pneumoniae P. aeruginosaLabs Isolates Labs Isolates Labs Isolates Labs Isolates Labs Isolates Labs Isolates
2006 9 35 13 167 11 171 8 30 8 35 7 142007 10 67 12 240 13 235 10 56 10 41 7 212008 11 48 12 278 12 304 10 67 11 54 7 212009 10 46 13 258 13 297 11 57 12 68 8 212010 9 40 11 257 10 333 10 59 9 81 8 31
Table 2: Proportion (%) of antibiotic non-susceptible isolates
Pathogens by antimicrobial classes 2003 2004 2005 2006 2007 2008 2009 2010Streptococcus pneumoniaePenicillin R - - - <1 1 <1 7 8Penicillin RI - - - 16 4 2 9 13Macrolides RI - - - <1 9 6 7 <1Staphylococcus aureusOxacillin/Meticillin R - - - 13 9 11 11 14Escherichia coliAminopenicilins R - - - 55 50 54 58 56Aminoglycosides R - - - 15 12 12 15 15Fluoroquinolones R - - - 12 9 14 15 14Third-gen. cephalosporins R - - - 5 7 6 8 9Carbapenems R - - - <1 <1 <1 <1 <1Enterococcus faecalisAminopenicilins RI - - - 5 3 5 3 13HL Gentamicin R - - - 50 41 33 48 41Vancomycin R - - - <1 <1 <1 <1 <1Enterococcus faeciumAminopenicilins RI - - - 75 100 88 95 88HL Gentamicin R - - - 75 81 78 64 87Vancomycin R - - - <1 <1 <1 11 8Klebsiella pneumoniaeAminoglycosides R - - - 26 37 41 56 52Fluoroquinolones R - - - 3 8 23 37 36Third-gen. cephalosporins R - - - 23 27 36 57 51Carbapenems R - - - <1 <1 <1 <1 <1Pseudomonas aeruginosaPiperacillin R - - - 21 5 14 20 6Ceftazidime R - - - 31 <1 10 14 10Carbapenems R - - - 21 30 24 19 27Aminoglycosides R - - - 29 33 38 19 13Fluoroquinolones R - - - 46 38 35 33 16
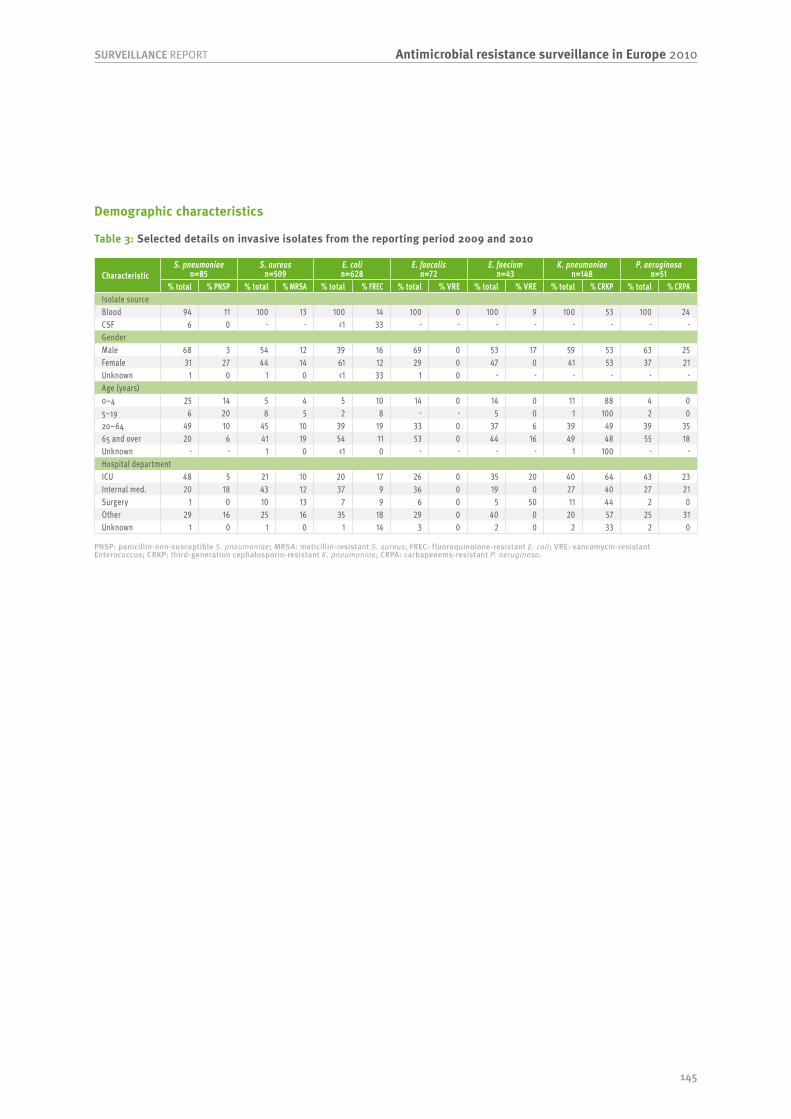
145
Antimicrobial resistance surveillance in Europe 2010SURVEILLANCE REPORT
Demographic characteristics
Table 3: Selected details on invasive isolates from the reporting period 2009 and 2010
CharacteristicS. pneumoniae
n=85S. aureus
n=509E. coli n=628
E. faecalis n=72
E. faecium n=43
K. pneumoniae n=148
P. aeruginosa n=51
% total % PNSP % total % MRSA % total % FREC % total % VRE % total % VRE % total % CRKP % total % CRPAIsolate sourceBlood 94 11 100 13 100 14 100 0 100 9 100 53 100 24CSF 6 0 - - <1 33 - - - - - - - -GenderMale 68 3 54 12 39 16 69 0 53 17 59 53 63 25Female 31 27 44 14 61 12 29 0 47 0 41 53 37 21Unknown 1 0 1 0 <1 33 1 0 - - - - - -Age (years)0–4 25 14 5 4 5 10 14 0 14 0 11 88 4 05–19 6 20 8 5 2 8 - - 5 0 1 100 2 020–64 49 10 45 10 39 19 33 0 37 6 39 49 39 3565 and over 20 6 41 19 54 11 53 0 44 16 49 48 55 18Unknown - - 1 0 <1 0 - - - - 1 100 - -Hospital departmentICU 48 5 21 10 20 17 26 0 35 20 40 64 43 23Internal med. 20 18 43 12 37 9 36 0 19 0 27 40 27 21Surgery 1 0 10 13 7 9 6 0 5 50 11 44 2 0Other 29 16 25 16 35 18 29 0 40 0 20 57 25 31Unknown 1 0 1 0 1 14 3 0 2 0 2 33 2 0
PNSP: penicillin-non-susceptible S. pneumoniae; MRSA: meticillin-resistant S. aureus; FREC: fluoroquinolone-resistant E. coli; VRE: vancomycin-resistant Enterococcus; CRKP: third-generation cephalosporin-resistant K. pneumoniae; CRPA: carbapenems-resistant P. aeruginosa.
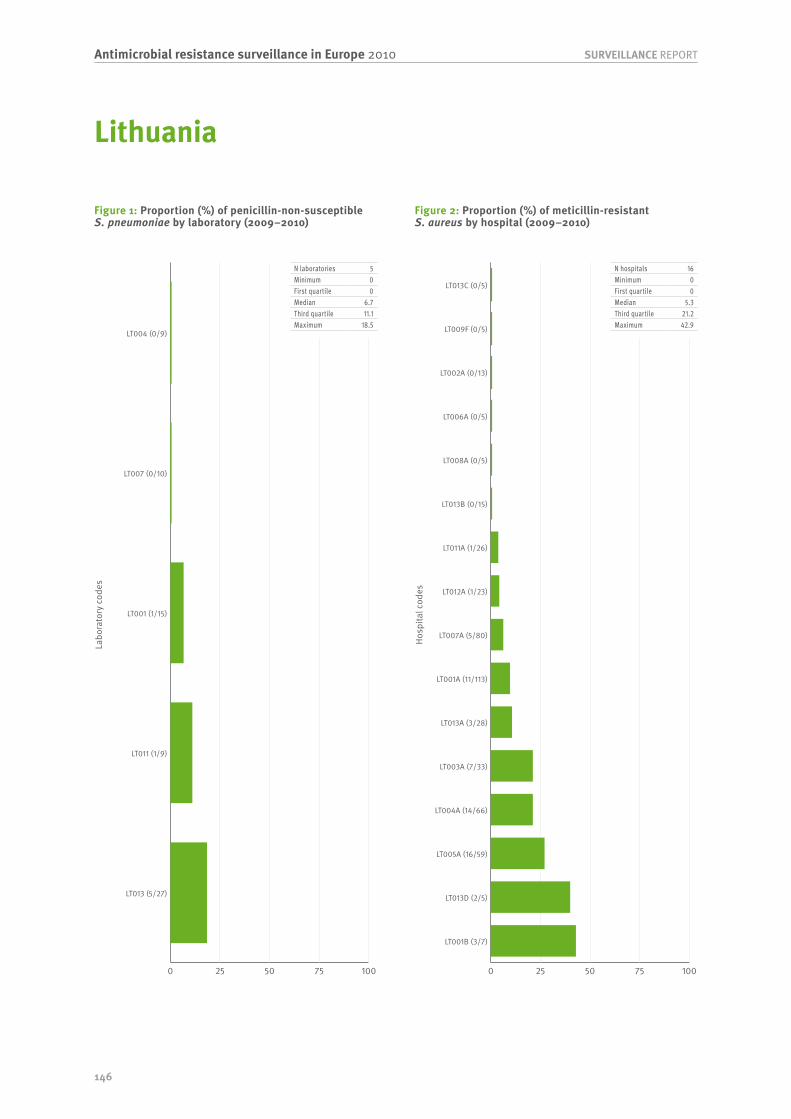
146
SURVEILLANCE REPORTAntimicrobial resistance surveillance in Europe 2010
Labo
rato
ry c
odes
0 25 50 75 100
LT013 (5/27)
LT011 (1/9)
LT001 (1/15)
LT007 (0/10)
LT004 (0/9)
Hosp
ital c
odes
0 25 50 75 100
LT001B (3/7)
LT013D (2/5)
LT005A (16/59)
LT004A (14/66)
LT003A (7/33)
LT013A (3/28)
LT001A (11/113)
LT007A (5/80)
LT012A (1/23)
LT011A (1/26)
LT013B (0/15)
LT008A (0/5)
LT006A (0/5)
LT002A (0/13)
LT009F (0/5)
LT013C (0/5)
Figure 1: Proportion (%) of penicillin-non-susceptible S. pneumoniae by laboratory (2009–2010)
Figure 2: Proportion (%) of meticillin-resistant S. aureus by hospital (2009–2010)
N laboratories 5Minimum 0First quartile 0Median 6.7Third quartile 11.1Maximum 18.5
N hospitals 16Minimum 0First quartile 0Median 5.3Third quartile 21.2Maximum 42.9
Lithuania

147
Antimicrobial resistance surveillance in Europe 2010SURVEILLANCE REPORT
Hosp
ital c
odes
0 25 50 75 100
LT001A (36/134)
LT003A (9/37)
LT011A (3/17)
LT004A (8/64)
LT008A (1/8)
LT002A (3/24)
LT013A (10/82)
LT013D (1/9)
LT005A (8/77)
LT012A (1/10)
LT001B (1/13)
LT007A (5/92)
LT009F (0/19)
LT013C (0/6)
LT013B (0/11)
Hosp
ital c
odes
0 25 50 75 100
LT011A (15/16)
LT012A (9/13)
LT001A (21/32)
LT004A (7/13)
LT007A (6/12)
LT003A (5/12)
LT005A (6/17)
LT013A (3/10)
Figure 3: Proportion (%) of fluoroquinolone-resistant E. coli by hospital (2009–2010)
Figure 4: Proportion (%) of third-generation cephalosporin-resistant K. pneumoniae by hospital (2009–2010)
N hospitals 15Minimum 0First quartile 5.4Median 11.1Third quartile 12.5Maximum 26.9
N hospitals 8Minimum 30First quartile 38.5Median 51.9Third quartile 67.4Maximum 93.8

148
SURVEILLANCE REPORTAntimicrobial resistance surveillance in Europe 2010
Luxembourg
General information about EARS-Net participating laboratories
Antibiotic resistance from 2003 to 2010
Table 1: Number of laboratories and number of isolates reported for the period 2003–2010
YearS. pneumoniae S. aureus E. coli Enterecocci K. pneumoniae P. aeruginosaLabs Isolates Labs Isolates Labs Isolates Labs Isolates Labs Isolates Labs Isolates
2003 7 54 8 95 8 227 7 41 - - - -2004 6 36 7 96 7 216 5 28 - - - -2005 5 47 5 83 5 188 5 31 - - 1 12006 5 31 5 77 5 167 4 42 4 21 4 232007 6 48 6 117 6 275 5 37 6 52 5 362008 6 59 5 117 6 303 5 61 6 52 4 332009 6 67 6 113 6 301 5 54 3 28 6 352010 6 47 5 104 3 56 4 21 4 33 4 25
Table 2: Proportion (%) of antibiotic non-susceptible isolates
Pathogens by antimicrobial classes 2003 2004 2005 2006 2007 2008 2009 2010Streptococcus pneumoniaePenicillin R <1 6 7 5 3 5 11 4Penicillin RI 15 11 12 5 6 11 19 13Macrolides RI 28 33 24 26 24 14 16 19Staphylococcus aureusOxacillin/Meticillin R 21 16 13 19 20 9 13 17Escherichia coliAminopenicilins R 49 49 49 46 49 56 57 57Aminoglycosides R 4 4 7 6 5 8 9 19Fluoroquinolones R 12 18 19 20 21 22 26 27Third-gen. cephalosporins R <1 <1 3 2 4 6 8 4Carbapenems R <1 <1 <1 <1 <1 <1 <1 <1Enterococcus faecalisAminopenicilins RI 5 <1 <1 <1 <1 3 10 18HL Gentamicin R 32 18 24 32 44 17 28 25Vancomycin R <1 <1 <1 <1 <1 3 10 <1Enterococcus faeciumAminopenicilins RI 100 50 36 75 67 76 93 100HL Gentamicin R <1 <1 23 30 10 21 29 40Vancomycin R <1 <1 <1 <1 <1 5 36 11Klebsiella pneumoniaeAminoglycosides R - - - <1 4 13 18 6Fluoroquinolones R - - - 6 12 12 21 9Third-gen. cephalosporins R - - - 10 2 19 25 6Carbapenems R - - - <1 <1 <1 <1 <1Pseudomonas aeruginosaPiperacillin R - - <1 9 15 3 14 8Ceftazidime R - - <1 10 11 3 14 <1Carbapenems R - - <1 7 20 25 15 8Aminoglycosides R - - <1 4 22 6 9 8Fluoroquinolones R - - <1 10 36 15 11 20

149
Antimicrobial resistance surveillance in Europe 2010SURVEILLANCE REPORT
Demographic characteristics
Table 3: Selected details on invasive isolates from the reporting period 2009 and 2010
CharacteristicS. pneumoniae
n=110S. aureus
n=217E. coli n=349
E. faecalis n=50
E. faecium n=23
K. pneumoniae n=61
P. aeruginosa n=58
% total % PNSP % total % MRSA % total % FREC % total % VRE % total % VRE % total % CRKP % total % CRPAIsolate sourceBlood 93 16 100 15 99 26 100 8 100 26 95 16 100 12CSF 7 25 - - 1 50 - - - - 5 0 - -GenderMale 55 16 59 12 45 26 68 9 52 33 54 15 67 13Female 45 16 41 20 55 26 32 6 48 18 46 14 33 11Age (years)0–4 9 20 2 0 2 0 2 0 - - 2 0 2 05–19 4 0 2 40 <1 0 - - 4 0 - - - -20–64 41 13 39 8 28 27 22 9 22 20 28 18 28 2565 and over 46 20 57 20 69 26 76 8 74 29 70 14 71 7Hospital departmentICU 4 75 7 33 1 50 4 0 - - 11 14 9 0Internal med. 3 0 3 17 1 0 2 0 - - 2 0 - -Surgery 1 0 3 17 1 33 2 0 4 0 11 0 2 100Other 16 11 27 14 5 25 12 0 26 17 26 6 22 0Unknown 76 15 60 14 93 26 80 10 70 31 49 23 67 15
PNSP: penicillin-non-susceptible S. pneumoniae; MRSA: meticillin-resistant S. aureus; FREC: fluoroquinolone-resistant E. coli; VRE: vancomycin-resistant Enterococcus; CRKP: third-generation cephalosporin-resistant K. pneumoniae; CRPA: carbapenems-resistant P. aeruginosa.

150
SURVEILLANCE REPORTAntimicrobial resistance surveillance in Europe 2010
Labo
rato
ry c
odes
0 25 50 75 100
LU003 (11/30)
LU001 (5/40)
LU007 (1/9)
LU006 (1/13)
LU004 (0/13)
LU002 (0/5)
Hosp
ital c
odes
0 25 50 75 100
LU002A (2/8)
LU003A (14/65)
LU006A (5/32)
LU004A (3/21)
LU001A (7/72)
LU007A (1/15)
Figure 1: Proportion (%) of penicillin-non-susceptible S. pneumoniae by laboratory (2009–2010)
Figure 2: Proportion (%) of meticillin-resistant S. aureus by hospital (2009–2010)
N laboratories 6Minimum 0First quartile 0Median 9.4Third quartile 12.5Maximum 36.7
N hospitals 6Minimum 6.7First quartile 9.7Median 15Third quartile 21.5Maximum 25
Luxembourg

151
Antimicrobial resistance surveillance in Europe 2010SURVEILLANCE REPORT
Hosp
ital c
odes
0 25 50 75 100
LU002B (3/6)
LU001A (28/105)
LU003A (18/68)
LU004A (16/62)
LU002A (4/16)
LU006A (14/61)
LU007A (7/31)
Hosp
ital c
odes
0 25 50 75 100
LU006A (3/8)
LU001A (6/36)
LU003A (0/9)
Figure 3: Proportion (%) of fluoroquinolone-resistant E. coli by hospital (2009–2010)
Figure 4: Proportion (%) of third-generation cephalosporin-resistant K. pneumoniae by hospital (2009–2010)
N hospitals 7Minimum 22.6First quartile 23Median 25.8Third quartile 26.7Maximum 50
N hospitals 3Minimum 0First quartile 0Median 16.7Third quartile 37.5Maximum 37.5
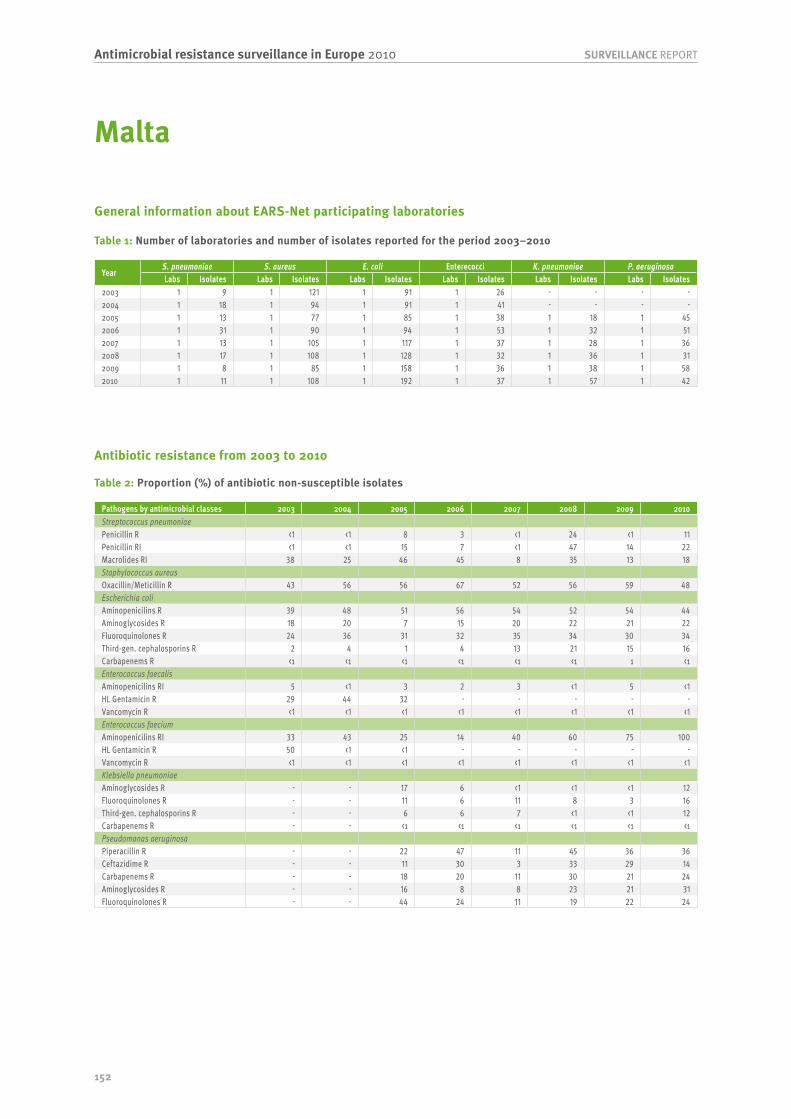
152
SURVEILLANCE REPORTAntimicrobial resistance surveillance in Europe 2010
Malta
General information about EARS-Net participating laboratories
Antibiotic resistance from 2003 to 2010
Table 1: Number of laboratories and number of isolates reported for the period 2003–2010
YearS. pneumoniae S. aureus E. coli Enterecocci K. pneumoniae P. aeruginosaLabs Isolates Labs Isolates Labs Isolates Labs Isolates Labs Isolates Labs Isolates
2003 1 9 1 121 1 91 1 26 - - - -2004 1 18 1 94 1 91 1 41 - - - -2005 1 13 1 77 1 85 1 38 1 18 1 452006 1 31 1 90 1 94 1 53 1 32 1 512007 1 13 1 105 1 117 1 37 1 28 1 362008 1 17 1 108 1 128 1 32 1 36 1 312009 1 8 1 85 1 158 1 36 1 38 1 582010 1 11 1 108 1 192 1 37 1 57 1 42
Table 2: Proportion (%) of antibiotic non-susceptible isolates
Pathogens by antimicrobial classes 2003 2004 2005 2006 2007 2008 2009 2010Streptococcus pneumoniaePenicillin R <1 <1 8 3 <1 24 <1 11Penicillin RI <1 <1 15 7 <1 47 14 22Macrolides RI 38 25 46 45 8 35 13 18Staphylococcus aureusOxacillin/Meticillin R 43 56 56 67 52 56 59 48Escherichia coliAminopenicilins R 39 48 51 56 54 52 54 44Aminoglycosides R 18 20 7 15 20 22 21 22Fluoroquinolones R 24 36 31 32 35 34 30 34Third-gen. cephalosporins R 2 4 1 4 13 21 15 16Carbapenems R <1 <1 <1 <1 <1 <1 1 <1Enterococcus faecalisAminopenicilins RI 5 <1 3 2 3 <1 5 <1HL Gentamicin R 29 44 32 - - - - -Vancomycin R <1 <1 <1 <1 <1 <1 <1 <1Enterococcus faeciumAminopenicilins RI 33 43 25 14 40 60 75 100HL Gentamicin R 50 <1 <1 - - - - -Vancomycin R <1 <1 <1 <1 <1 <1 <1 <1Klebsiella pneumoniaeAminoglycosides R - - 17 6 <1 <1 <1 12Fluoroquinolones R - - 11 6 11 8 3 16Third-gen. cephalosporins R - - 6 6 7 <1 <1 12Carbapenems R - - <1 <1 <1 <1 <1 <1Pseudomonas aeruginosaPiperacillin R - - 22 47 11 45 36 36Ceftazidime R - - 11 30 3 33 29 14Carbapenems R - - 18 20 11 30 21 24Aminoglycosides R - - 16 8 8 23 21 31Fluoroquinolones R - - 44 24 11 19 22 24

153
Antimicrobial resistance surveillance in Europe 2010SURVEILLANCE REPORT
Demographic characteristics
Table 3: Selected details on invasive isolates from the reporting period 2009 and 2010
CharacteristicS. pneumoniae
n=16S. aureus
n=193E. coli n=350
E. faecalis n=55
E. faecium n=18
K. pneumoniae n=95
P. aeruginosa n=100
% total % PNSP % total % MRSA % total % FREC % total % VRE % total % VRE % total % CRKP % total % CRPAIsolate sourceBlood 100 19 100 53 100 33 100 0 100 0 100 7 95 23CSF - - - - <1 0 - - - - - - 5 0GenderMale 50 13 68 56 50 37 62 0 72 0 55 8 67 22Female 50 25 32 47 50 28 38 0 28 0 45 7 33 21Age (years)0–4 6 0 6 67 2 0 11 0 6 0 5 0 4 05–19 - - 2 25 <1 0 2 0 - - 4 0 5 2020–64 44 0 38 45 27 31 33 0 67 0 34 16 33 3065 and over 50 38 53 58 70 34 55 0 28 0 57 4 58 19Hospital departmentICU 13 0 7 43 2 43 29 0 33 0 13 0 31 39Other - - 2 100 4 64 2 0 - - 5 0 1 0Unknown 88 21 91 53 94 31 69 0 67 0 82 9 68 15
PNSP: penicillin-non-susceptible S. pneumoniae; MRSA: meticillin-resistant S. aureus; FREC: fluoroquinolone-resistant E. coli; VRE: vancomycin-resistant Enterococcus; CRKP: third-generation cephalosporin-resistant K. pneumoniae; CRPA: carbapenems-resistant P. aeruginosa.
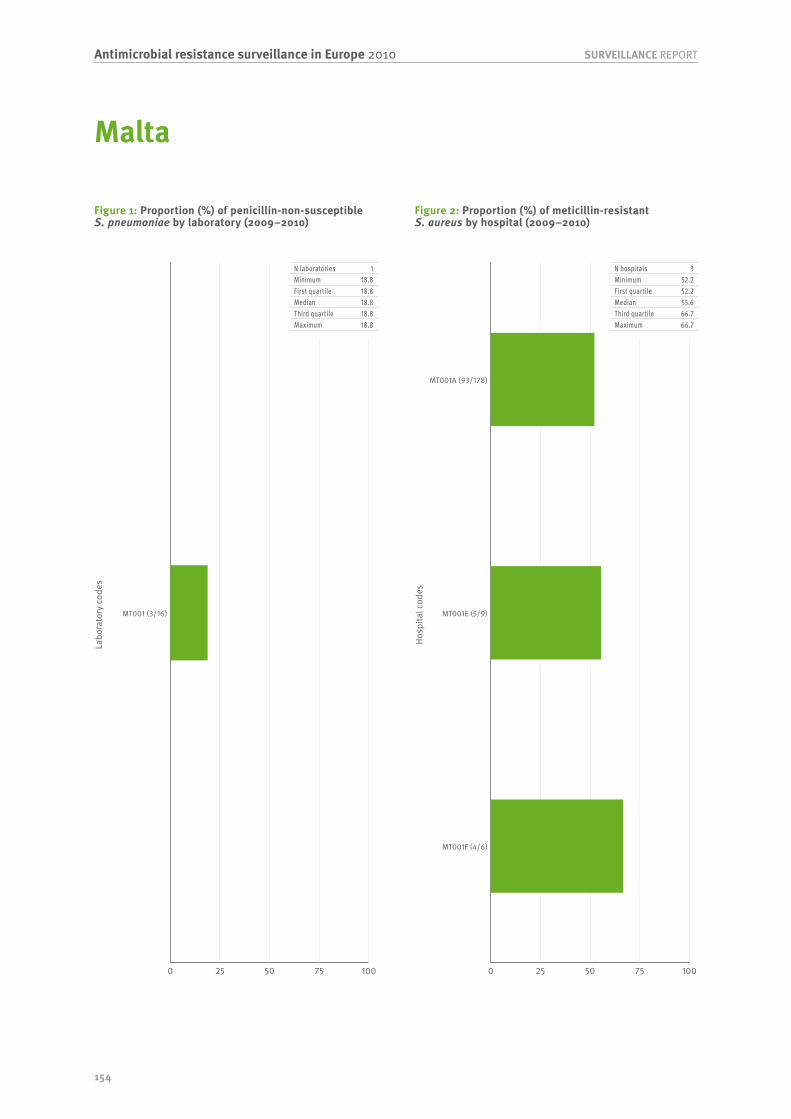
154
SURVEILLANCE REPORTAntimicrobial resistance surveillance in Europe 2010
Labo
rato
ry c
odes
0 25 50 75 100
MT001 (3/16)
Hosp
ital c
odes
0 25 50 75 100
MT001F (4/6)
MT001E (5/9)
MT001A (93/178)
Figure 1: Proportion (%) of penicillin-non-susceptible S. pneumoniae by laboratory (2009–2010)
Figure 2: Proportion (%) of meticillin-resistant S. aureus by hospital (2009–2010)
N laboratories 1Minimum 18.8First quartile 18.8Median 18.8Third quartile 18.8Maximum 18.8
N hospitals 3Minimum 52.2First quartile 52.2Median 55.6Third quartile 66.7Maximum 66.7
Malta
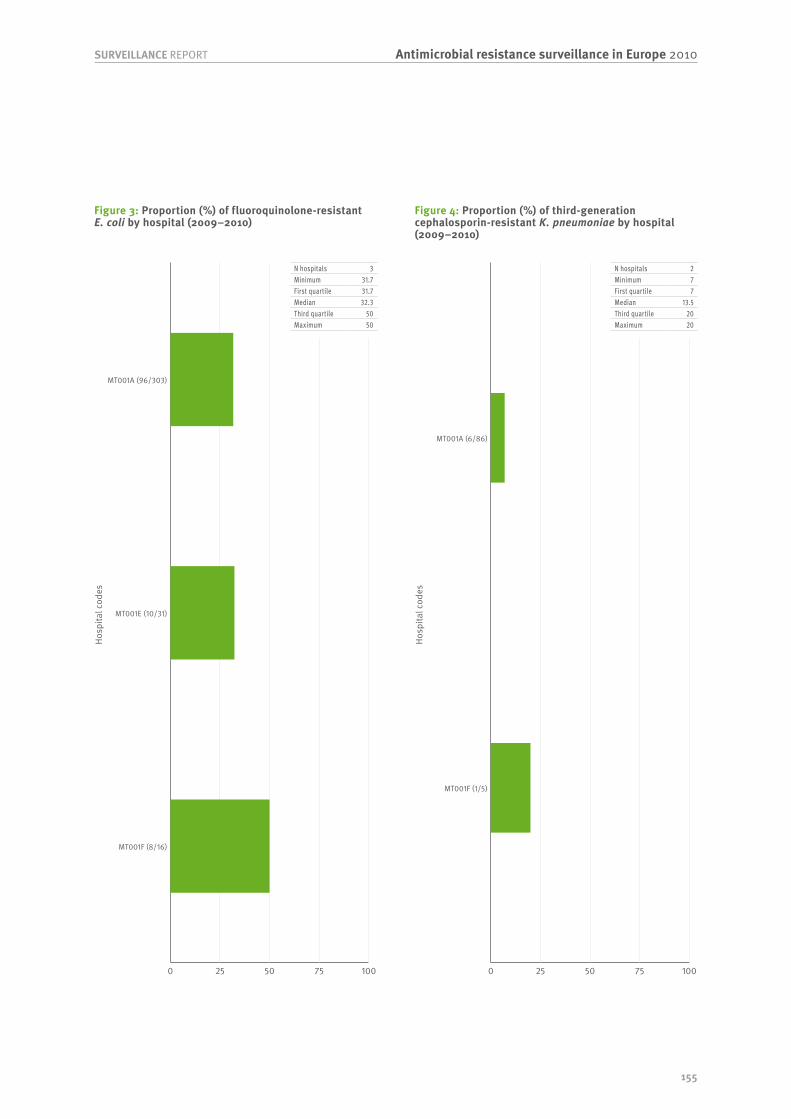
155
Antimicrobial resistance surveillance in Europe 2010SURVEILLANCE REPORT
Hosp
ital c
odes
0 25 50 75 100
MT001F (8/16)
MT001E (10/31)
MT001A (96/303)
Hosp
ital c
odes
0 25 50 75 100
MT001F (1/5)
MT001A (6/86)
Figure 3: Proportion (%) of fluoroquinolone-resistant E. coli by hospital (2009–2010)
Figure 4: Proportion (%) of third-generation cephalosporin-resistant K. pneumoniae by hospital (2009–2010)
N hospitals 3Minimum 31.7First quartile 31.7Median 32.3Third quartile 50Maximum 50
N hospitals 2Minimum 7First quartile 7Median 13.5Third quartile 20Maximum 20

156
SURVEILLANCE REPORTAntimicrobial resistance surveillance in Europe 2010
Netherlands
General information about EARS-Net participating laboratories
Antibiotic resistance from 2003 to 2010
Table 1: Number of laboratories and number of isolates reported for the period 2003–2010
YearS. pneumoniae S. aureus E. coli Enterecocci K. pneumoniae P. aeruginosaLabs Isolates Labs Isolates Labs Isolates Labs Isolates Labs Isolates Labs Isolates
2003 24 891 23 1422 23 2133 23 480 - - - -2004 22 758 22 1339 21 2111 22 444 - - - -2005 23 815 23 1407 23 2201 23 563 16 301 16 2102006 22 1006 23 1636 22 2905 23 776 18 458 19 3302007 21 940 21 1471 21 2801 21 827 19 497 19 3382008 17 723 16 1191 16 2283 17 632 15 463 15 3452009 17 746 16 1035 16 2398 16 522 15 408 15 2352010 22 971 21 1565 21 3422 20 834 20 647 21 376
Table 2: Proportion (%) of antibiotic non-susceptible isolates
Pathogens by antimicrobial classes 2003 2004 2005 2006 2007 2008 2009 2010Streptococcus pneumoniaePenicillin R <1 <1 <1 <1 <1 <1 <1 <1Penicillin RI 1 2 1 1 2 2 1 2Macrolides RI 5 8 11 8 7 7 5 6Staphylococcus aureusOxacillin/Meticillin R 1 1 <1 <1 2 <1 <1 1Escherichia coliAminopenicilins R 45 43 48 47 49 48 45 48Aminoglycosides R 3 3 4 3 5 6 4 7Fluoroquinolones R 7 7 10 11 13 14 11 14Third-gen. cephalosporins R 1 1 2 3 4 5 4 5Carbapenems R <1 <1 <1 <1 <1 <1 <1 <1Enterococcus faecalisAminopenicilins RI 4 3 3 5 5 <1 2 3HL Gentamicin R 29 37 38 28 38 34 31 34Vancomycin R 1 <1 <1 <1 <1 <1 <1 <1Enterococcus faeciumAminopenicilins RI 30 42 61 73 83 86 89 89HL Gentamicin R 20 20 40 50 62 53 76 65Vancomycin R <1 <1 <1 <1 <1 <1 <1 <1Klebsiella pneumoniaeAminoglycosides R - - 5 4 5 7 3 7Fluoroquinolones R - - 6 4 4 7 4 7Third-gen. cephalosporins R - - 4 4 7 8 6 7Carbapenems R - - <1 <1 <1 <1 <1 <1Pseudomonas aeruginosaPiperacillin R - - 4 2 2 6 3 4Ceftazidime R - - 5 5 4 6 4 3Carbapenems R - - 5 2 2 6 3 3Aminoglycosides R - - 7 4 3 4 1 2Fluoroquinolones R - - 9 9 5 8 7 4

157
Antimicrobial resistance surveillance in Europe 2010SURVEILLANCE REPORT
Demographic characteristics
Table 3: Selected details on invasive isolates from the reporting period 2009 and 2010
CharacteristicS. pneumoniae
n=1 325S. aureus n=2 599
E. coli n=5 786
E. faecalis n=770
E. faecium n=572
K. pneumoniae n=1 041
P. aeruginosa n=605
% total % PNSP % total % MRSA % total % FREC % total % VRE % total % VRE % total % CRKP % total % CRPAIsolate sourceBlood 93 2 100 1 100 13 100 0 100 1 100 6 98 3CSF 7 0 - - <1 18 - - - - <1 20 2 10GenderMale 52 2 59 1 49 16 70 0 63 1 55 9 70 3Female 48 1 41 1 51 9 30 0 37 0 45 4 30 2Age (years)0–4 4 3 5 0 2 7 4 0 3 0 2 5 2 105–19 2 0 2 3 1 17 1 0 2 0 1 10 1 020–64 41 2 34 1 27 13 27 0 38 0 30 7 31 465 and over 52 1 59 1 70 12 68 0 57 1 67 6 66 2Hospital departmentICU 9 2 11 3 9 12 18 0 43 1 11 16 19 6Internal med. 11 1 12 0 18 12 13 0 12 0 17 2 16 4Surgery 3 7 7 2 5 12 6 0 4 0 5 4 7 0Other 46 1 33 1 32 13 30 0 22 1 28 6 24 1Unknown 30 2 38 1 36 13 33 0 20 1 39 6 34 2
PNSP: penicillin-non-susceptible S. pneumoniae; MRSA: meticillin-resistant S. aureus; FREC: fluoroquinolone-resistant E. coli; VRE: vancomycin-resistant Enterococcus; CRKP: third-generation cephalosporin-resistant K. pneumoniae; CRPA: carbapenems-resistant P. aeruginosa.

158
SURVEILLANCE REPORTAntimicrobial resistance surveillance in Europe 2010
Labo
rato
ry c
odes
0 25 50 75 100
NL104 (1/20)
NL145 (2/51)
NL014 (2/62)
NL141 (1/36)
NL119 (2/73)
NL126 (1/37)
NL113 (4/165)
NL101 (2/88)
NL026 (1/46)
NL134 (1/55)
NL031 (2/125)
NL007 (1/68)
NL002 (2/157)
NL023 (1/84)
NL005 (0/28)
NL132 (0/80)
NL131 (0/74)
NL107 (0/6)
NL112 (0/63)
Hosp
ital c
odes
0 25 50 75 100NL101C (1/5)
NL014V (1/17)NL031B (1/19)NL113D (1/29)NL134A (2/77)NL023B (1/41)NL141A (2/86)
NL002B (2/87)NL126A (1/44)
NL132A (2/107)NL119A (3/161)NL104B (1/55)NL104A (1/58)NL145A (1/59)NL101A (1/65)NL031A (1/68)
NL026A (2/139)NL126B (1/76)NL030E (1/76)NL007A (1/87)NL131A (1/95)
NL112A (1/106)NL007B (0/11)
NL134B (0/7)NL002C (0/30)NL002A (0/58)
NL131B (0/19)NL014G (0/15)NL113C (0/33)
NL030A (0/32)NL118B (0/12)NL101B (0/21)
NL023D (0/17)NL014C (0/14)
NL030D (0/42)NL023A (0/30)NL113A (0/106)NL030F (0/19)NL031C (0/52)NL112X (0/11)
NL030H (0/68)NL113B (0/28)
NL030C (0/24)NL113E (0/6)
NL007C (0/113)NL030I (0/29)NL118C (0/38)NL131C (0/10)NL112B (0/30)
NL030G (0/30)NL101D (0/9)
NL026B (0/27)NL014B (0/18)NL145B (0/12)
NL030B (0/17)NL005A (0/37)
Figure 1: Proportion (%) of penicillin-non-susceptible S. pneumoniae by laboratory (2009–2010)
Figure 2: Proportion (%) of meticillin-resistant S. aureus by hospital (2009–2010)
N laboratories 19Minimum 0First quartile 0Median 1.8Third quartile 2.7Maximum 5
N hospitals 56Minimum 0First quartile 0Median 0Third quartile 1.6Maximum 20
Netherlands

159
Antimicrobial resistance surveillance in Europe 2010SURVEILLANCE REPORT
Hosp
ital c
odes
0 25 50 75 100NL026B (10/27)
NL101D (7/23)NL101C (2/7)
NL030I (16/68)NL030C (13/71)
NL030F (19/105)NL141A (25/141)NL031B (16/91)
NL132A (53/305)NL007A (21/128)
NL126A (8/49)NL007C (20/128)
NL112B (9/60)NL023D (6/40)
NL030B (10/67)NL119A (43/294)
NL014X (1/7)NL014C (6/42)
NL113D (17/121)NL101A (23/164)
NL113B (12/87)NL030E (28/205)NL112A (29/219)
NL026A (24/184)NL145B (3/23)NL134B (2/16)
NL005A (12/99)NL118C (12/101)
NL002A (13/112)NL031C (17/147)NL126B (17/148)
NL113E (5/45)NL014B (4/36)NL023A (9/82)
NL113A (30/281)NL030G (13/123)
NL113C (10/95)NL014G (5/49)
NL131A (18/179)NL131C (3/30)
NL030D (12/123)NL002C (9/94)NL131B (4/42)
NL145A (12/126)NL002B (18/189)
NL101B (4/43)NL031A (13/141)
NL134A (10/109)NL030H (14/171)
NL104B (7/87)NL023B (9/117)
NL112X (3/41)NL118B (5/70)NL014V (3/43)NL104A (6/93)NL030A (4/62)NL007B (0/20)
NL014A (0/5)
Hosp
ital c
odes
0 25 50 75 100NL132A (11/47)
NL104A (4/21)
NL141A (5/30)
NL131A (5/30)
NL002A (4/27)
NL126A (1/7)
NL023B (2/16)
NL007C (5/44)
NL007A (4/36)
NL014B (1/9)
NL112B (1/9)
NL145A (2/19)
NL118C (2/19)
NL002B (4/42)
NL134A (3/37)
NL112A (3/39)
NL026A (3/41)
NL119A (4/61)
NL101B (1/16)
NL002C (1/20)
NL113A (1/33)
NL030A (0/10)
NL030C (0/5)
NL104B (0/16)
NL031B (0/24)
NL030I (0/6)
NL030G (0/15)
NL007B (0/6)
NL030H (0/19)
NL014C (0/9)
NL023D (0/5)
NL113B (0/17)
NL118B (0/14)
NL014G (0/8)
NL131B (0/5)
NL126B (0/23)
NL101A (0/28)
NL014V (0/8)
NL031A (0/26)
NL030D (0/17)
NL113C (0/11)
NL131C (0/8)
NL030F (0/13)
NL030E (0/31)
NL005A (0/8)
NL113D (0/24)
NL031C (0/25)
NL023A (0/18)
NL030B (0/10)
Figure 3: Proportion (%) of fluoroquinolone-resistant E. coli by hospital (2009–2010)
Figure 4: Proportion (%) of third-generation cephalosporin-resistant K. pneumoniae by hospital (2009–2010)
N hospitals 58Minimum 0First quartile 9.5Median 11.6Third quartile 14.9Maximum 37
N hospitals 49Minimum 0First quartile 0Median 0Third quartile 10.5Maximum 23.4

160
SURVEILLANCE REPORTAntimicrobial resistance surveillance in Europe 2010
Norway
General information about EARS-Net participating laboratories
Antibiotic resistance from 2003 to 2010
Table 1: Number of laboratories and number of isolates reported for the period 2003–2010
YearS. pneumoniae S. aureus E. coli Enterecocci K. pneumoniae P. aeruginosaLabs Isolates Labs Isolates Labs Isolates Labs Isolates Labs Isolates Labs Isolates
2003 11 512 11 506 11 1179 11 192 4 46 4 252004 11 600 11 516 11 1212 11 235 4 51 4 272005 11 606 11 553 11 1331 11 304 11 193 11 972006 12 601 12 734 12 1574 12 349 12 263 12 962007 13 616 13 794 13 1713 13 416 13 320 13 1052008 13 576 13 837 13 1799 13 403 13 349 13 1482009 12 554 12 909 12 1846 12 478 12 396 12 1662010 15 576 15 1050 15 2277 15 563 15 479 15 168
Table 2: Proportion (%) of antibiotic non-susceptible isolates
Pathogens by antimicrobial classes 2003 2004 2005 2006 2007 2008 2009 2010Streptococcus pneumoniaePenicillin R <1 <1 <1 <1 <1 <1 <1 <1Penicillin RI <1 2 2 2 2 2 2 4Macrolides RI 8 8 14 12 10 7 6 4Staphylococcus aureusOxacillin/Meticillin R <1 <1 <1 <1 <1 <1 <1 <1Escherichia coliAminopenicilins R 34 32 34 35 38 38 37 38Aminoglycosides R <1 <1 2 2 3 3 3 4Fluoroquinolones R 2 4 5 5 7 7 9 9Third-gen. cephalosporins R <1 <1 <1 1 2 3 2 4Carbapenems R <1 <1 <1 <1 <1 <1 <1 <1Enterococcus faecalisAminopenicilins RI 4 <1 3 3 2 2 <1 <1HL Gentamicin R 38 27 32 33 34 29 36 34Vancomycin R <1 <1 <1 <1 <1 <1 <1 <1Enterococcus faeciumAminopenicilins RI 43 80 72 75 81 78 76 85HL Gentamicin R 14 25 44 45 52 54 38 57Vancomycin R <1 <1 <1 <1 <1 <1 <1 1Klebsiella pneumoniaeAminoglycosides R <1 2 3 <1 <1 1 3 2Fluoroquinolones R <1 <1 1 7 5 4 6 7Third-gen. cephalosporins R <1 <1 2 2 2 2 3 2Carbapenems R <1 <1 <1 <1 <1 <1 <1 <1Pseudomonas aeruginosaPiperacillin R <1 13 3 3 2 6 4 3Ceftazidime R <1 <1 3 5 3 4 5 2Carbapenems R <1 4 3 9 9 7 5 1Aminoglycosides R <1 4 <1 1 2 <1 <1 <1Fluoroquinolones R 4 5 4 9 7 3 2 4
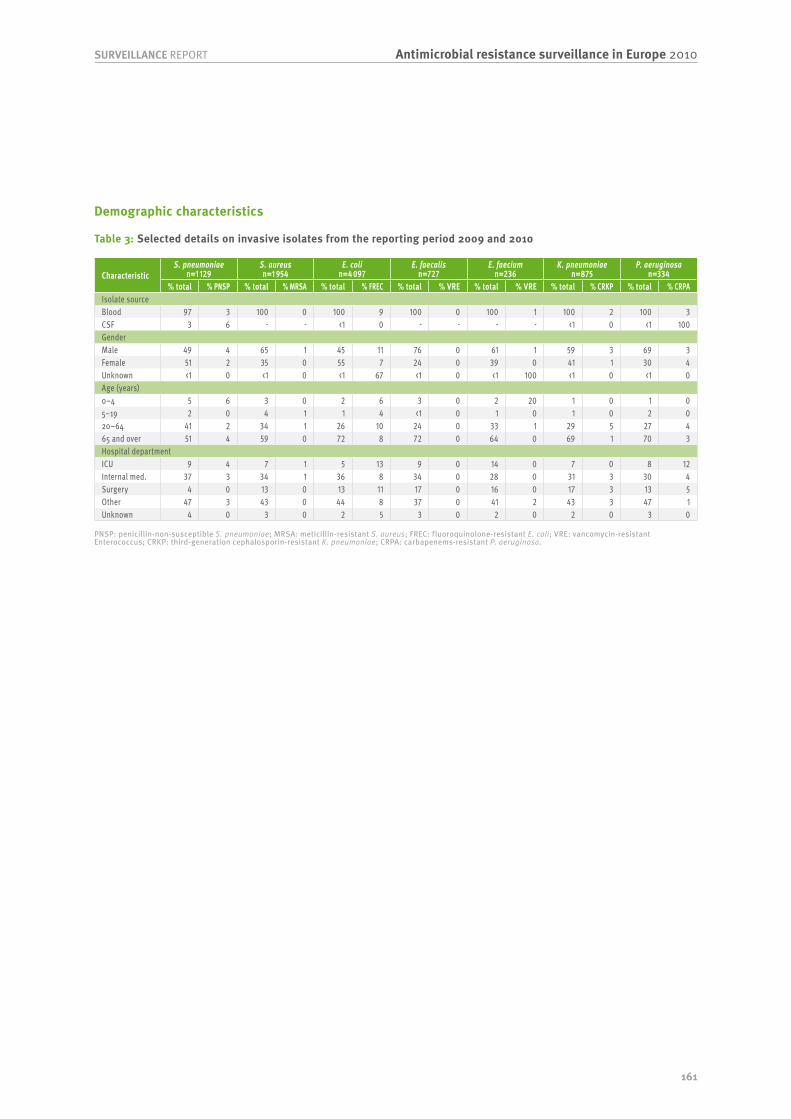
161
Antimicrobial resistance surveillance in Europe 2010SURVEILLANCE REPORT
Demographic characteristics
Table 3: Selected details on invasive isolates from the reporting period 2009 and 2010
CharacteristicS. pneumoniae
n=1 129S. aureus n=1 954
E. coli n=4 097
E. faecalis n=727
E. faecium n=236
K. pneumoniae n=875
P. aeruginosa n=334
% total % PNSP % total % MRSA % total % FREC % total % VRE % total % VRE % total % CRKP % total % CRPAIsolate sourceBlood 97 3 100 0 100 9 100 0 100 1 100 2 100 3CSF 3 6 - - <1 0 - - - - <1 0 <1 100GenderMale 49 4 65 1 45 11 76 0 61 1 59 3 69 3Female 51 2 35 0 55 7 24 0 39 0 41 1 30 4Unknown <1 0 <1 0 <1 67 <1 0 <1 100 <1 0 <1 0Age (years)0–4 5 6 3 0 2 6 3 0 2 20 1 0 1 05–19 2 0 4 1 1 4 <1 0 1 0 1 0 2 020–64 41 2 34 1 26 10 24 0 33 1 29 5 27 465 and over 51 4 59 0 72 8 72 0 64 0 69 1 70 3Hospital departmentICU 9 4 7 1 5 13 9 0 14 0 7 0 8 12Internal med. 37 3 34 1 36 8 34 0 28 0 31 3 30 4Surgery 4 0 13 0 13 11 17 0 16 0 17 3 13 5Other 47 3 43 0 44 8 37 0 41 2 43 3 47 1Unknown 4 0 3 0 2 5 3 0 2 0 2 0 3 0
PNSP: penicillin-non-susceptible S. pneumoniae; MRSA: meticillin-resistant S. aureus; FREC: fluoroquinolone-resistant E. coli; VRE: vancomycin-resistant Enterococcus; CRKP: third-generation cephalosporin-resistant K. pneumoniae; CRPA: carbapenems-resistant P. aeruginosa.

162
SURVEILLANCE REPORTAntimicrobial resistance surveillance in Europe 2010
Labo
rato
ry c
odes
0 25 50 75 100
NO502 (3/54)
NO301 (1/19)
NO103 (5/101)
NO101 (6/133)
NO106 (6/140)
NO102 (2/47)
NO402 (1/28)
NO204 (4/141)
NO501 (1/36)
NO304 (1/37)
NO206 (2/97)
NO403 (1/74)
NO105 (0/26)
NO104 (0/92)
NO203 (0/104)
Hosp
ital c
odes
0 25 50 75 100
NO501A (1/24)
NO402B (1/42)
NO101C (1/46)
NO403D (3/159)
NO204I (1/79)
NO101A (2/198)
NO101D (0/46)
NO206O (0/78)
NO204E (0/103)
NO206Q (0/8)
NO104J (0/155)
NO103X (0/10)
NO106V (0/31)
NO203K (0/10)
NO106Q (0/42)
NO203D (0/27)
NO402H (0/18)
NO106U (0/13)
NO106T (0/19)
NO203C (0/80)
NO102B (0/115)
NO106S (0/36)
NO502L (0/10)
NO304J (0/32)
NO203X (0/43)
NO103E (0/133)
NO502I (0/26)
NO403E (0/17)
NO502H (0/74)
NO105K (0/37)
NO106P (0/76)
NO301A (0/45)
NO502K (0/16)
NO502D (0/12)
NO206P (0/40)
NO501G (0/5)
NO501E (0/12)
NO204M (0/7)
NO501C (0/9)
Figure 1: Proportion (%) of penicillin-non-susceptible S. pneumoniae by laboratory (2009–2010)
Figure 2: Proportion (%) of meticillin-resistant S. aureus by hospital (2009–2010)
N laboratories 15Minimum 0First quartile 1.4Median 2.8Third quartile 4.5Maximum 5.6
N hospitals 39Minimum 0First quartile 0Median 0Third quartile 0Maximum 4.2
Norway
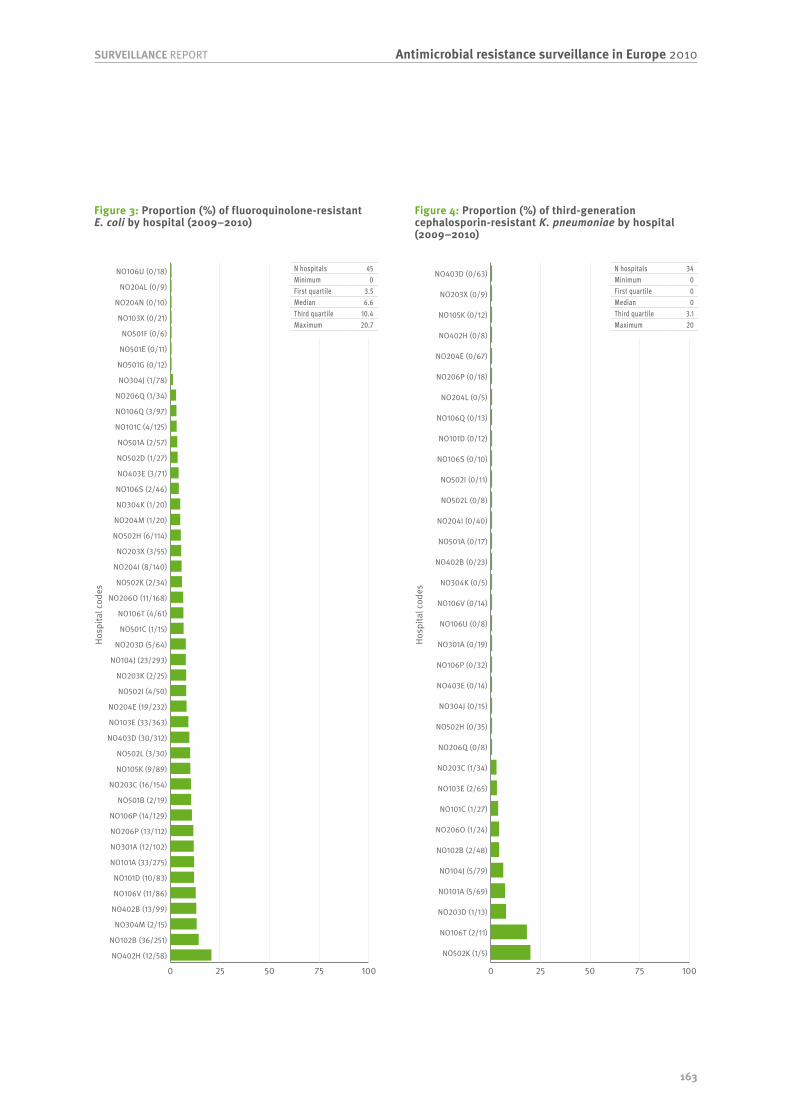
163
Antimicrobial resistance surveillance in Europe 2010SURVEILLANCE REPORT
Hosp
ital c
odes
0 25 50 75 100
NO402H (12/58)
NO102B (36/251)
NO304M (2/15)
NO402B (13/99)
NO106V (11/86)
NO101D (10/83)
NO101A (33/275)
NO301A (12/102)
NO206P (13/112)
NO106P (14/129)
NO501B (2/19)
NO203C (16/154)
NO105K (9/89)
NO502L (3/30)
NO403D (30/312)
NO103E (33/363)
NO204E (19/232)
NO502I (4/50)
NO203K (2/25)
NO104J (23/293)
NO203D (5/64)
NO501C (1/15)
NO106T (4/61)
NO206O (11/168)
NO502K (2/34)
NO204I (8/140)
NO203X (3/55)
NO502H (6/114)
NO204M (1/20)
NO304K (1/20)
NO106S (2/46)
NO403E (3/71)
NO502D (1/27)
NO501A (2/57)
NO101C (4/125)
NO106Q (3/97)
NO206Q (1/34)
NO304J (1/78)
NO501G (0/12)
NO501E (0/11)
NO501F (0/6)
NO103X (0/21)
NO204N (0/10)
NO204L (0/9)
NO106U (0/18)
Hosp
ital c
odes
0 25 50 75 100
NO502K (1/5)
NO106T (2/11)
NO203D (1/13)
NO101A (5/69)
NO104J (5/79)
NO102B (2/48)
NO206O (1/24)
NO101C (1/27)
NO103E (2/65)
NO203C (1/34)
NO206Q (0/8)
NO502H (0/35)
NO304J (0/15)
NO403E (0/14)
NO106P (0/32)
NO301A (0/19)
NO106U (0/8)
NO106V (0/14)
NO304K (0/5)
NO402B (0/23)
NO501A (0/17)
NO204I (0/40)
NO502L (0/8)
NO502I (0/11)
NO106S (0/10)
NO101D (0/12)
NO106Q (0/13)
NO204L (0/5)
NO206P (0/18)
NO204E (0/67)
NO402H (0/8)
NO105K (0/12)
NO203X (0/9)
NO403D (0/63)
Figure 3: Proportion (%) of fluoroquinolone-resistant E. coli by hospital (2009–2010)
Figure 4: Proportion (%) of third-generation cephalosporin-resistant K. pneumoniae by hospital (2009–2010)
N hospitals 45Minimum 0First quartile 3.5Median 6.6Third quartile 10.4Maximum 20.7
N hospitals 34Minimum 0First quartile 0Median 0Third quartile 3.1Maximum 20

164
SURVEILLANCE REPORTAntimicrobial resistance surveillance in Europe 2010
Poland
General information about EARS-Net participating laboratories
Antibiotic resistance from 2003 to 2010
Table 1: Number of laboratories and number of isolates reported for the period 2003–2010
YearS. pneumoniae S. aureus E. coli Enterecocci K. pneumoniae P. aeruginosaLabs Isolates Labs Isolates Labs Isolates Labs Isolates Labs Isolates Labs Isolates
2003 11 16 24 166 25 124 16 64 - - - -2004 11 16 30 262 29 192 23 52 - - - -2005 6 6 30 198 30 176 21 54 17 53 14 262006 4 9 24 174 26 206 21 68 15 42 16 372007 10 22 24 185 27 256 20 71 18 32 23 672008 34 84 15 99 14 84 11 26 11 19 8 222009 21 71 30 551 29 625 28 267 25 151 27 1532010 26 76 35 527 35 771 32 286 33 246 29 169
Table 2: Proportion (%) of antibiotic non-susceptible isolates
Pathogens by antimicrobial classes 2003 2004 2005 2006 2007 2008 2009 2010Streptococcus pneumoniaePenicillin R 19 <1 17 <1 10 12 30 24Penicillin RI 19 <1 33 <1 29 13 30 24Macrolides RI 14 19 33 11 . 50 19 39Staphylococcus aureusOxacillin/Meticillin R 19 19 24 20 15 12 20 13Escherichia coliAminopenicilins R 50 45 56 55 56 54 65 60Aminoglycosides R 10 5 7 11 6 7 7 9Fluoroquinolones R 7 9 20 20 13 20 23 26Third-gen. cephalosporins R 4 5 5 4 2 2 9 8Carbapenems R - <1 <1 <1 <1 <1 <1 <1Enterococcus faecalisAminopenicilins RI <1 2 9 2 4 6 <1 3HL Gentamicin R 48 33 48 50 46 29 39 36Vancomycin R <1 <1 <1 <1 2 <1 <1 <1Enterococcus faeciumAminopenicilins RI 91 86 95 95 88 78 98 95HL Gentamicin R 55 100 62 85 84 67 75 65Vancomycin R <1 <1 5 <1 <1 <1 1 8Klebsiella pneumoniaeAminoglycosides R - - 57 36 31 26 29 31Fluoroquinolones R - - 34 29 3 32 32 33Third-gen. cephalosporins R - - 66 38 34 37 49 40Carbapenems R - - <1 <1 <1 <1 <1 <1Pseudomonas aeruginosaPiperacillin R - - 50 43 36 32 30 29Ceftazidime R - - 31 42 21 27 21 22Carbapenems R - - 27 30 18 14 25 25Aminoglycosides R - - 56 46 40 27 27 30Fluoroquinolones R - - 31 41 37 13 26 28
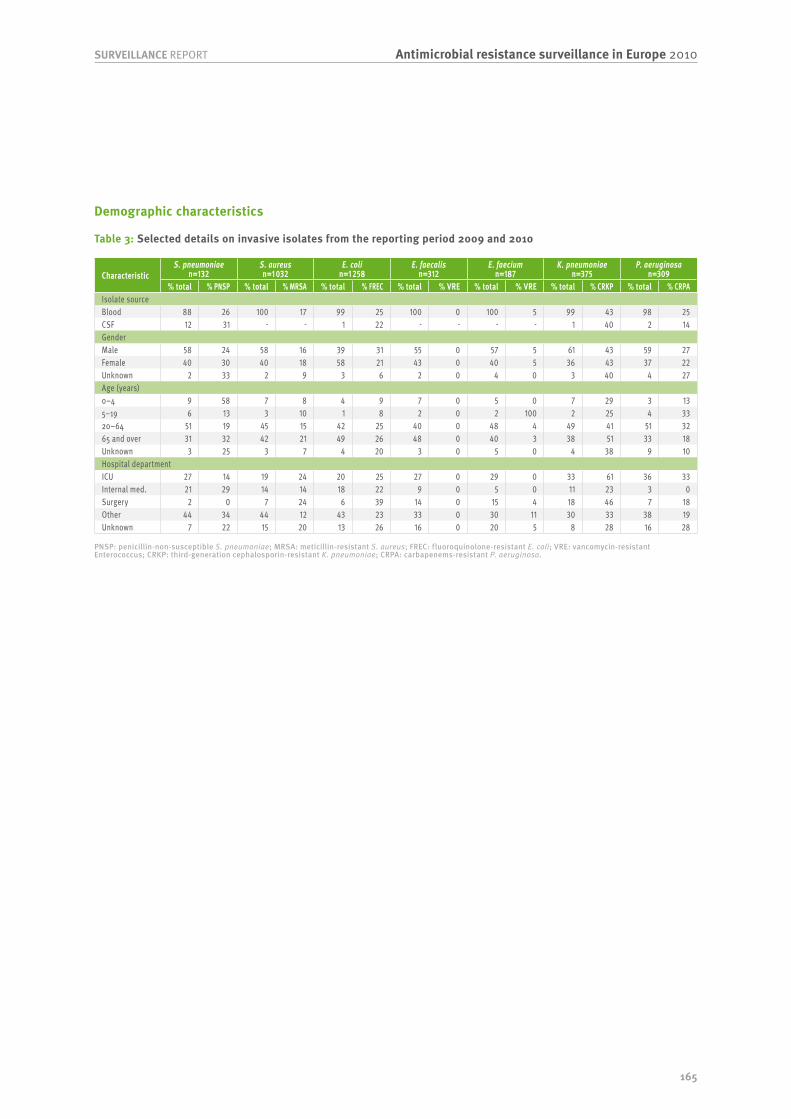
165
Antimicrobial resistance surveillance in Europe 2010SURVEILLANCE REPORT
Demographic characteristics
Table 3: Selected details on invasive isolates from the reporting period 2009 and 2010
CharacteristicS. pneumoniae
n=132S. aureus n=1 032
E. coli n=1 258
E. faecalis n=312
E. faecium n=187
K. pneumoniae n=375
P. aeruginosa n=309
% total % PNSP % total % MRSA % total % FREC % total % VRE % total % VRE % total % CRKP % total % CRPAIsolate sourceBlood 88 26 100 17 99 25 100 0 100 5 99 43 98 25CSF 12 31 - - 1 22 - - - - 1 40 2 14GenderMale 58 24 58 16 39 31 55 0 57 5 61 43 59 27Female 40 30 40 18 58 21 43 0 40 5 36 43 37 22Unknown 2 33 2 9 3 6 2 0 4 0 3 40 4 27Age (years)0–4 9 58 7 8 4 9 7 0 5 0 7 29 3 135–19 6 13 3 10 1 8 2 0 2 100 2 25 4 3320–64 51 19 45 15 42 25 40 0 48 4 49 41 51 3265 and over 31 32 42 21 49 26 48 0 40 3 38 51 33 18Unknown 3 25 3 7 4 20 3 0 5 0 4 38 9 10Hospital departmentICU 27 14 19 24 20 25 27 0 29 0 33 61 36 33Internal med. 21 29 14 14 18 22 9 0 5 0 11 23 3 0Surgery 2 0 7 24 6 39 14 0 15 4 18 46 7 18Other 44 34 44 12 43 23 33 0 30 11 30 33 38 19Unknown 7 22 15 20 13 26 16 0 20 5 8 28 16 28
PNSP: penicillin-non-susceptible S. pneumoniae; MRSA: meticillin-resistant S. aureus; FREC: fluoroquinolone-resistant E. coli; VRE: vancomycin-resistant Enterococcus; CRKP: third-generation cephalosporin-resistant K. pneumoniae; CRPA: carbapenems-resistant P. aeruginosa.

166
SURVEILLANCE REPORTAntimicrobial resistance surveillance in Europe 2010
Labo
rato
ry c
odes
0 25 50 75 100
PL033 (4/5)
PL116 (3/7)
PL105 (2/6)
PL041 (3/10)
PL118 (1/5)
PL126 (1/6)
PL058 (1/11)
PL024 (1/12)
PL148 (0/5)
PL110 (0/12)
Hosp
ital c
odes
0 25 50 75 100PL0023 (9/19)
PL0126 (34/74)
PL0012 (4/9)
PL0018 (5/13)
PL0031 (4/12)
PL0035 (4/12)
PL0113 (2/6)
PL0033 (10/33)
PL0130 (12/47)
PL0011 (5/21)
PL0131 (6/26)
PL0052 (3/13)
PL0115 (3/14)
PL0058 (4/20)
PL0119 (2/11)
PL0108 (1/6)
PL0112 (5/31)
PL0014 (5/33)
PL0116 (6/40)
PL0101 (4/28)
PL0137 (2/14)
PL0149 (1/7)
PL0124 (7/54)
PL0105 (4/31)
PL0103 (1/9)
PL0114 (2/20)
PL0024 (2/20)
PL0106 (2/20)
PL0123 (2/22)
PL0041 (3/34)
PL0003 (4/46)
PL0110 (1/13)
PL0138 (2/32)
PL0148 (1/17)
PL0048 (1/21)
PL0019 (1/23)
PL0109 (1/31)
PL0121 (0/15)
PL0006 (0/12)
PL0107 (0/20)
PL0118 (0/12)
PL0122 (0/6)
PL0005 (0/15)
PL0134 (0/5)
PL0056 (0/13)
PL0141 (0/9)
PL0015 (0/9)
PL0025 (0/6)
PL0132 (0/10)
Figure 1: Proportion (%) of penicillin-non-susceptible S. pneumoniae by laboratory (2009–2010)
Figure 2: Proportion (%) of meticillin-resistant S. aureus by hospital (2009–2010)
N laboratories 10Minimum 0First quartile 8.3Median 18.3Third quartile 33.3Maximum 80
N hospitals 49Minimum 0First quartile 3.2Median 11.1Third quartile 21.4Maximum 47.4
Poland

167
Antimicrobial resistance surveillance in Europe 2010SURVEILLANCE REPORT
Hosp
ital c
odes
0 25 50 75 100PL0005 (9/17)
PL0131 (13/28)
PL0126 (32/74)
PL0130 (27/67)
PL0043 (4/11)
PL0019 (8/23)
PL0138 (9/26)
PL0115 (9/26)
PL0106 (7/21)
PL0116 (12/37)
PL0102 (4/13)
PL0011 (3/10)
PL0012 (4/14)
PL0132 (2/7)
PL0112 (11/40)
PL0110 (14/54)
PL0035 (8/31)
PL0014 (10/39)
PL0018 (6/24)
PL0137 (6/25)
PL0048 (5/21)
PL0023 (3/13)
PL0118 (5/23)
PL0149 (1/5)
PL0109 (7/35)
PL0121 (6/30)
PL0103 (3/16)
PL0101 (5/27)
PL0029 (7/39)
PL0107 (10/60)
PL0123 (1/6)
PL0024 (7/43)
PL0003 (5/31)
PL0058 (6/39)
PL0041 (5/34)
PL0148 (6/41)
PL0056 (4/28)
PL0057 (1/7)
PL0124 (6/45)
PL0105 (3/23)
PL0108 (1/8)
PL0031 (1/8)
PL0141 (2/16)
PL0006 (2/16)
PL0113 (3/25)
PL0015 (1/9)
Hosp
ital c
odes
0 25 50 75 100
PL0019 (6/6)
PL0105 (7/8)
PL0023 (5/6)
PL0119 (9/11)
PL0112 (23/29)
PL0011 (8/11)
PL0029 (18/25)
PL0126 (15/21)
PL0006 (4/6)
PL0113 (5/8)
PL0101 (6/10)
PL0109 (7/12)
PL0003 (4/9)
PL0137 (3/7)
PL0141 (2/5)
PL0035 (5/13)
PL0103 (2/6)
PL0130 (10/33)
PL0123 (2/7)
PL0115 (5/18)
PL0124 (1/6)
PL0114 (1/6)
PL0131 (0/9)
PL0024 (0/6)
PL0014 (0/7)
PL0149 (0/9)
PL0107 (0/15)
PL0138 (0/7)
PL0121 (0/5)
PL0116 (0/7)
Figure 3: Proportion (%) of fluoroquinolone-resistant E. coli by hospital (2009–2010)
Figure 4: Proportion (%) of third-generation cephalosporin-resistant K. pneumoniae by hospital (2009–2010)
N hospitals 46Minimum 11.1First quartile 14.7Median 20.9Third quartile 30Maximum 52.9
N hospitals 30Minimum 0First quartile 0Median 39.2Third quartile 71.4Maximum 100
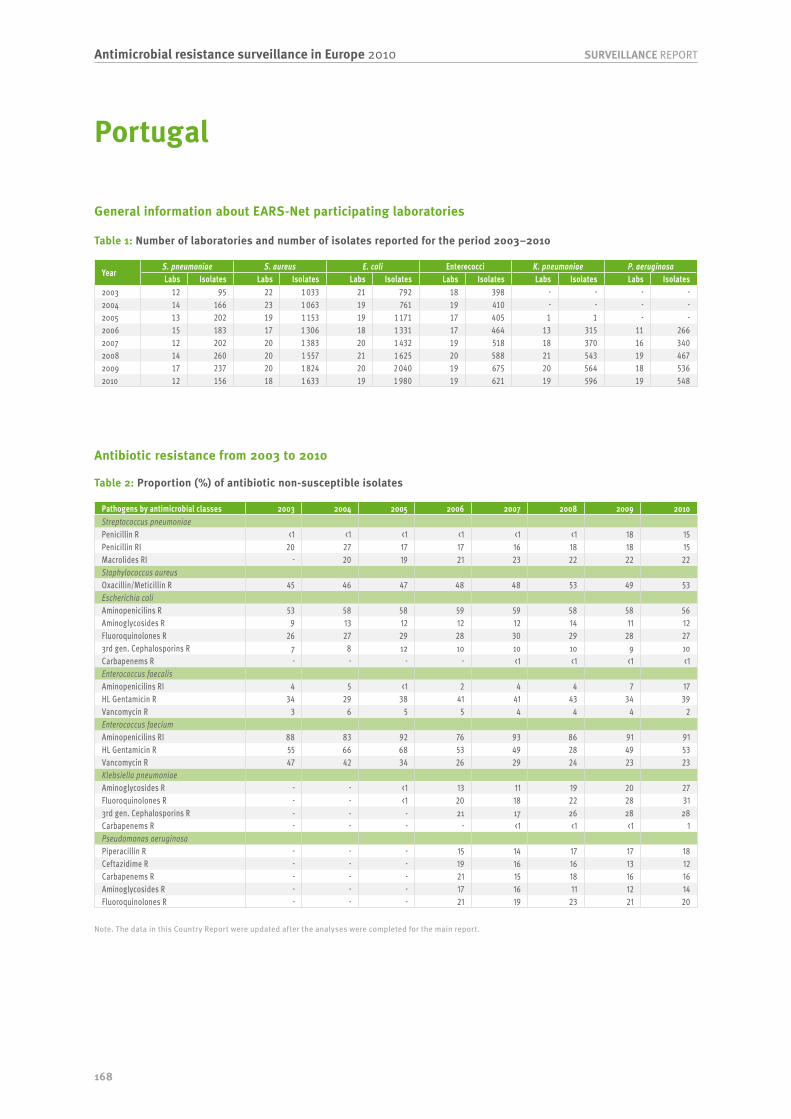
168
SURVEILLANCE REPORTAntimicrobial resistance surveillance in Europe 2010
Portugal
General information about EARS-Net participating laboratories
Antibiotic resistance from 2003 to 2010
Table 1: Number of laboratories and number of isolates reported for the period 2003–2010
YearS. pneumoniae S. aureus E. coli Enterecocci K. pneumoniae P. aeruginosaLabs Isolates Labs Isolates Labs Isolates Labs Isolates Labs Isolates Labs Isolates
2003 12 95 22 1 033 21 792 18 398 - - - -2004 14 166 23 1 063 19 761 19 410 - - - -2005 13 202 19 1 153 19 1 171 17 405 1 1 - -2006 15 183 17 1 306 18 1 331 17 464 13 315 11 2662007 12 202 20 1 383 20 1 432 19 518 18 370 16 3402008 14 260 20 1 557 21 1 625 20 588 21 543 19 4672009 17 237 20 1 824 20 2 040 19 675 20 564 18 5362010 12 156 18 1 633 19 1 980 19 621 19 596 19 548
Table 2: Proportion (%) of antibiotic non-susceptible isolates
Pathogens by antimicrobial classes 2003 2004 2005 2006 2007 2008 2009 2010Streptococcus pneumoniaePenicillin R <1 <1 <1 <1 <1 <1 18 15Penicillin RI 20 27 17 17 16 18 18 15Macrolides RI - 20 19 21 23 22 22 22Staphylococcus aureusOxacillin/Meticillin R 45 46 47 48 48 53 49 53Escherichia coliAminopenicilins R 53 58 58 59 59 58 58 56Aminoglycosides R 9 13 12 12 12 14 11 12Fluoroquinolones R 26 27 29 28 30 29 28 273rd gen. Cephalosporins R 7 8 12 10 10 10 9 10Carbapenems R - - - - <1 <1 <1 <1Enterococcus faecalisAminopenicilins RI 4 5 <1 2 4 4 7 17HL Gentamicin R 34 29 38 41 41 43 34 39Vancomycin R 3 6 5 5 4 4 4 2Enterococcus faeciumAminopenicilins RI 88 83 92 76 93 86 91 91HL Gentamicin R 55 66 68 53 49 28 49 53Vancomycin R 47 42 34 26 29 24 23 23Klebsiella pneumoniaeAminoglycosides R - - <1 13 11 19 20 27Fluoroquinolones R - - <1 20 18 22 28 313rd gen. Cephalosporins R - - - 21 17 26 28 28Carbapenems R - - - - <1 <1 <1 1Pseudomonas aeruginosaPiperacillin R - - - 15 14 17 17 18Ceftazidime R - - - 19 16 16 13 12Carbapenems R - - - 21 15 18 16 16Aminoglycosides R - - - 17 16 11 12 14Fluoroquinolones R - - - 21 19 23 21 20
Note. The data in this Country Report were updated after the analyses were completed for the main report.

169
Antimicrobial resistance surveillance in Europe 2010SURVEILLANCE REPORT
Demographic characteristics
Table 3: Selected details on invasive isolates from the reporting period 2009 and 2010
CharacteristicS. pneumoniae
n=393S. aureus n=3 457
E. coli n=3 894
E. faecalis n=833
E. faecium n=405
K. pneumoniae n=1 136
P. aeruginosa n=1 054
% total % PNSP % total % MRSA % total % FREC % total % VRE % total % VRE % total % CRKP % total % CRPAIsolate sourceBlood 93 17 100 51 100 28 100 3 100 23 100 28 99 16CSF 7 17 - - <1 11 - - - - <1 67 1 0GenderMale 58 17 62 50 44 31 56 3 54 19 55 28 59 19Female 41 17 38 53 56 25 44 2 45 27 45 28 41 13Unknown <1 0 <1 0 <1 18 <1 0 <1 100 <1 0 - -Age (years)0–4 8 19 5 17 2 10 4 3 2 0 3 31 2 55–19 6 22 2 13 1 17 1 0 2 29 1 27 2 1820–64 43 16 31 41 33 24 28 3 41 21 39 27 42 1465 and over 43 17 59 61 62 30 65 3 56 25 54 29 53 18Unknown 1 0 3 49 2 23 2 0 - - 3 30 1 21Hospital departmentICU 2 25 8 60 4 23 16 5 17 20 12 35 17 21Internal med. 10 11 24 61 19 30 18 3 14 29 15 25 17 17Surgery <1 0 9 63 5 33 12 2 17 26 10 21 9 19Other 88 17 58 44 70 27 53 2 52 21 63 28 57 14Unknown - - 1 50 1 24 1 0 - - 1 33 <1 0
PNSP: penicillin-non-susceptible S. pneumoniae; MRSA: meticillin-resistant S. aureus; FREC: fluoroquinolone-resistant E. coli; VRE: vancomycin-resistant Enterococcus; CRKP: third-generation cephalosporin-resistant K. pneumoniae; CRPA: carbapenems-resistant P. aeruginosa.
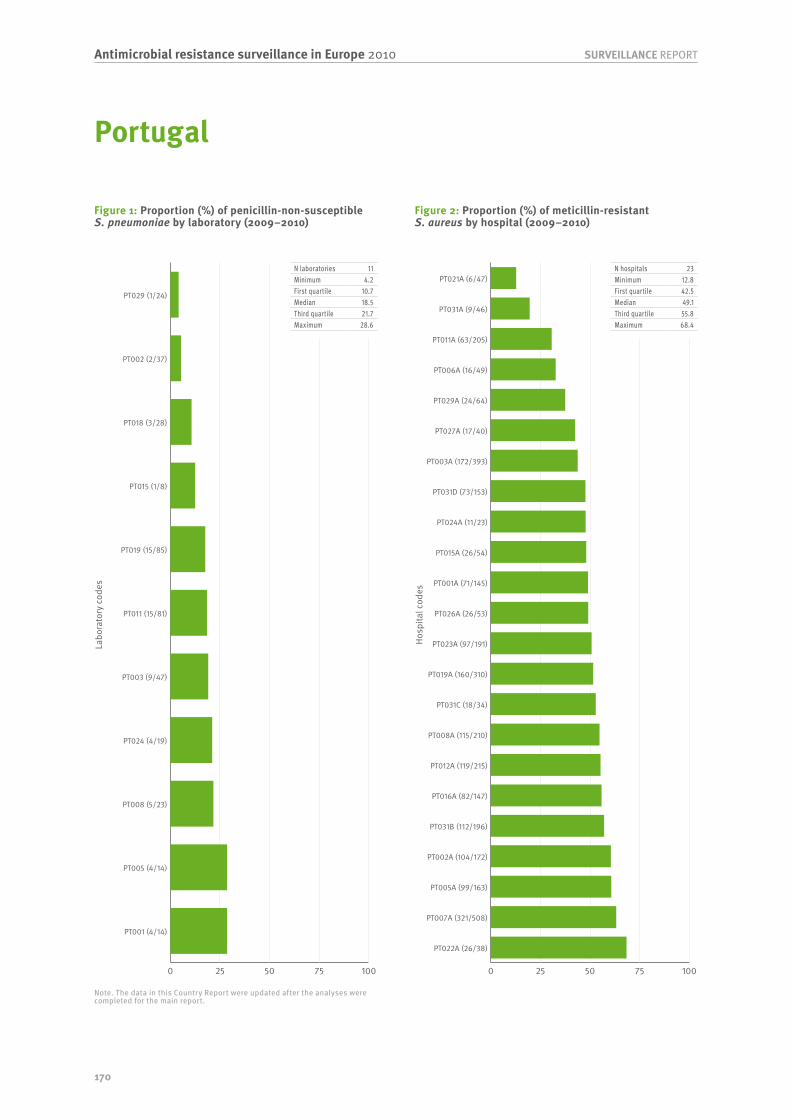
170
SURVEILLANCE REPORTAntimicrobial resistance surveillance in Europe 2010
Labo
rato
ry c
odes
0 25 50 75 100
PT001 (4/14)
PT005 (4/14)
PT008 (5/23)
PT024 (4/19)
PT003 (9/47)
PT011 (15/81)
PT019 (15/85)
PT015 (1/8)
PT018 (3/28)
PT002 (2/37)
PT029 (1/24)
Hosp
ital c
odes
0 25 50 75 100
PT022A (26/38)
PT007A (321/508)
PT005A (99/163)
PT002A (104/172)
PT031B (112/196)
PT016A (82/147)
PT012A (119/215)
PT008A (115/210)
PT031C (18/34)
PT019A (160/310)
PT023A (97/191)
PT026A (26/53)
PT001A (71/145)
PT015A (26/54)
PT024A (11/23)
PT031D (73/153)
PT003A (172/393)
PT027A (17/40)
PT029A (24/64)
PT006A (16/49)
PT011A (63/205)
PT031A (9/46)
PT021A (6/47)
Figure 1: Proportion (%) of penicillin-non-susceptible S. pneumoniae by laboratory (2009–2010)
Figure 2: Proportion (%) of meticillin-resistant S. aureus by hospital (2009–2010)
N laboratories 11Minimum 4.2First quartile 10.7Median 18.5Third quartile 21.7Maximum 28.6
N hospitals 23Minimum 12.8First quartile 42.5Median 49.1Third quartile 55.8Maximum 68.4
Portugal
Note. The data in this Country Report were updated after the analyses were completed for the main report.

171
Antimicrobial resistance surveillance in Europe 2010SURVEILLANCE REPORT
Hosp
ital c
odes
0 25 50 75 100
PT005A (40/90)
PT025A (4/10)
PT022A (13/39)
PT002A (81/255)
PT008A (32/104)
PT015A (18/59)
PT001A (49/161)
PT012A (52/171)
PT003A (204/691)
PT016A (38/129)
PT007A (135/467)
PT031B (62/216)
PT031D (68/240)
PT006A (20/72)
PT029A (29/110)
PT027A (17/65)
PT031C (6/26)
PT021A (18/78)
PT011A (67/292)
PT031A (5/23)
PT026A (11/54)
PT023A (46/238)
PT019A (52/270)
PT024A (4/34)
Hosp
ital c
odes
0 25 50 75 100
PT007A (100/188)
PT001A (20/44)
PT031A (5/11)
PT012A (16/36)
PT005A (17/51)
PT026A (5/15)
PT015A (5/15)
PT031D (29/100)
PT031C (4/14)
PT031B (21/77)
PT002A (4/17)
PT029A (5/22)
PT022A (2/9)
PT021A (5/23)
PT011A (26/129)
PT003A (35/178)
PT006A (3/21)
PT027A (1/9)
PT023A (5/46)
PT019A (6/62)
PT016A (2/40)
PT008A (1/23)
Figure 3: Proportion (%) of fluoroquinolone-resistant E. coli by hospital (2009–2010)
Figure 4: Proportion (%) of third-generation cephalosporin-resistant K. pneumoniae by hospital (2009–2010)
N hospitals 24Minimum 11.8First quartile 23Median 28.5Third quartile 30.5Maximum 44.4
N hospitals 22Minimum 4.3First quartile 14.3Median 23.1Third quartile 33.3Maximum 53.2

172
SURVEILLANCE REPORTAntimicrobial resistance surveillance in Europe 2010
Romania
General information about EARS-Net participating laboratories
Antibiotic resistance from 2003 to 2010
Table 1: Number of laboratories and number of isolates reported for the period 2003–2010
YearS. pneumoniae S. aureus E. coli Enterecocci K. pneumoniae P. aeruginosaLabs Isolates Labs Isolates Labs Isolates Labs Isolates Labs Isolates Labs Isolates
2003 5 26 9 85 9 50 5 12 - - - -2004 4 9 15 95 12 48 4 9 - - - -2005 5 18 13 93 13 84 7 14 1 3 2 232006 8 29 11 83 9 41 9 28 5 32 2 32007 5 27 9 42 9 63 5 14 6 30 2 42008 4 14 5 39 4 58 4 16 3 6 3 82009 3 17 6 48 7 90 5 27 4 27 4 242010 2 13 5 47 5 35 2 19 3 17 5 10
Table 2: Proportion (%) of antibiotic non-susceptible isolates
Pathogens by antimicrobial classes 2003 2004 2005 2006 2007 2008 2009 2010Streptococcus pneumoniaePenicillin R 21 11 22 10 22 54 24 31Penicillin RI 33 11 39 28 33 69 29 31Macrolides RI 29 <1 31 25 19 27 33 36Staphylococcus aureusOxacillin/Meticillin R 46 71 60 54 26 33 34 39Escherichia coliAminopenicilins R 70 79 78 85 76 55 60 83Aminoglycosides R 21 33 14 41 35 24 11 12Fluoroquinolones R 14 21 9 41 27 27 18 24Third-gen. cephalosporins R 19 23 17 41 27 24 14 21Carbapenems R <1 3 <1 3 <1 <1 <1 <1Enterococcus faecalisAminopenicilins RI <1 29 <1 <1 25 10 13 <1HL Gentamicin R 25 <1 50 15 50 22 42 -Vancomycin R <1 <1 <1 <1 <1 <1 <1 <1Enterococcus faeciumAminopenicilins RI 86 100 100 100 100 100 100 80HL Gentamicin R 63 100 70 80 67 50 71 -Vancomycin R <1 <1 <1 <1 <1 <1 <1 <1Klebsiella pneumoniaeAminoglycosides R - - 100 91 80 60 32 71Fluoroquinolones R - - 33 34 23 20 11 29Third-gen. cephalosporins R - - 100 94 80 50 65 71Carbapenems R - - <1 <1 <1 <1 <1 <1Pseudomonas aeruginosaPiperacillin R - - 61 33 25 25 31 63Ceftazidime R - - 52 <1 <1 13 30 60Carbapenems R - - 61 <1 <1 13 46 70Aminoglycosides R - - 64 33 25 38 38 50Fluoroquinolones R - - 64 33 25 25 31 56

173
Antimicrobial resistance surveillance in Europe 2010SURVEILLANCE REPORT
Demographic characteristics
Table 3: Selected details on invasive isolates from the reporting period 2009 and 2010
CharacteristicS. pneumoniae
n=30S. aureus
n=93E. coli n=88
E. faecalis n=24
E. faecium n=17
K. pneumoniae n=34
P. aeruginosa n=23
% total % PNSP % total % MRSA % total % FREC % total % VRE % total % VRE % total % CRKP % total % CRPAIsolate sourceBlood 57 29 100 37 100 20 100 0 100 0 100 68 96 59CSF 43 31 - - - - - - - - - - 4 0GenderMale 50 33 63 34 53 28 58 0 71 0 56 68 57 69Female 50 27 35 42 47 12 42 0 29 0 44 67 43 40Unknown - - 1 0 - - - - - - - - - -Age (years)0–4 30 44 20 37 11 20 21 0 65 0 47 94 26 175–19 13 50 9 25 1 100 - - - - 9 67 9 10020–64 40 8 53 41 43 16 46 0 35 0 29 40 43 6065 and over 17 40 18 29 44 23 33 0 - - 15 40 22 80Hospital departmentICU - - 5 100 5 25 4 0 6 0 6 0 35 88Internal med. - - 9 38 11 0 4 0 - - 9 33 9 0Surgery - - 4 0 - - - - - - 6 100 - -Other 100 30 77 36 82 24 92 0 94 0 79 74 57 46Unknown - - 4 0 2 0 - - - - - - - -
PNSP: penicillin-non-susceptible S. pneumoniae; MRSA: meticillin-resistant S. aureus; FREC: fluoroquinolone-resistant E. coli; VRE: vancomycin-resistant Enterococcus; CRKP: third-generation cephalosporin-resistant K. pneumoniae; CRPA: carbapenems-resistant P. aeruginosa.

174
SURVEILLANCE REPORTAntimicrobial resistance surveillance in Europe 2010
Labo
rato
ry c
odes
0 25 50 75 100
RO01E (2/6)
RO01A (5/22)
Hosp
ital c
odes
0 25 50 75 100
RO001B (6/12)
RO001D (6/12)
RO001E (2/5)
RO001A (14/41)
RO002A (3/10)
RO001I (0/9)
Figure 1: Proportion (%) of penicillin-non-susceptible S. pneumoniae by laboratory (2009–2010)
Figure 2: Proportion (%) of meticillin-resistant S. aureus by hospital (2009–2010)
N laboratories 2Minimum 22.7First quartile 22.7Median 28Third quartile 33.3Maximum 33.3
N hospitals 6Minimum 0First quartile 30Median 37.1Third quartile 50Maximum 50
Romania

175
Antimicrobial resistance surveillance in Europe 2010SURVEILLANCE REPORT
Hosp
ital c
odes
0 25 50 75 100
RO001D (5/14)
RO001C (3/13)
RO002A (3/16)
RO001A (5/36)
RO014A (0/6)
Hosp
ital c
odes
0 25 50 75 100
RO001B (15/16)
RO001C (2/5)
RO001D (3/9)
Figure 3: Proportion (%) of fluoroquinolone-resistant E. coli by hospital (2009–2010)
Figure 4: Proportion (%) of third-generation cephalosporin-resistant K. pneumoniae by hospital (2009–2010)
N hospitals 5Minimum 0First quartile 13.9Median 18.8Third quartile 23.1Maximum 35.7
N hospitals 3Minimum 33.3First quartile 33.3Median 40Third quartile 93.8Maximum 93.8

176
SURVEILLANCE REPORTAntimicrobial resistance surveillance in Europe 2010
Slovenia
General information about EARS-Net participating laboratories
Antibiotic resistance from 2003 to 2010
Table 1: Number of laboratories and number of isolates reported for the period 2003–2010
YearS. pneumoniae S. aureus E. coli Enterecocci K. pneumoniae P. aeruginosaLabs Isolates Labs Isolates Labs Isolates Labs Isolates Labs Isolates Labs Isolates
2003 11 172 11 299 11 401 10 76 - - - -2004 10 166 11 347 11 573 9 91 - - - -2005 11 208 11 349 11 657 11 119 10 78 8 382006 11 167 11 365 11 717 10 145 10 145 10 722007 10 195 10 422 10 851 9 183 10 170 9 882008 10 209 10 418 10 874 10 196 9 157 10 952009 10 253 10 471 10 893 10 198 10 189 10 1072010 10 232 10 476 10 952 10 196 10 196 10 95
Table 2: Proportion (%) of antibiotic non-susceptible isolates
Pathogens by antimicrobial classes 2003 2004 2005 2006 2007 2008 2009 2010Streptococcus pneumoniaePenicillin R 2 2 2 5 4 3 1 <1Penicillin RI 15 25 11 19 17 15 15 16Macrolides RI 9 11 11 13 17 16 17 17Staphylococcus aureusOxacillin/Meticillin R 13 12 10 7 8 7 10 12Escherichia coliAminopenicilins R 41 40 42 44 49 49 53 48Aminoglycosides R 2 5 4 7 7 7 10 9Fluoroquinolones R 11 12 12 15 17 17 18 19Third-gen. cephalosporins R <1 1 2 2 4 4 5 7Carbapenems R <1 <1 <1 <1 <1 <1 <1 <1Enterococcus faecalisAminopenicilins RI <1 <1 1 1 <1 <1 <1 2HL Gentamicin R 49 37 46 40 50 40 43 43Vancomycin R <1 <1 <1 <1 <1 <1 <1 <1Enterococcus faeciumAminopenicilins RI 83 76 93 86 92 96 94 95HL Gentamicin R 82 56 47 54 63 57 56 66Vancomycin R <1 <1 <1 6 5 13 4 2Klebsiella pneumoniaeAminoglycosides R - - 17 19 24 23 28 23Fluoroquinolones R - - 14 21 26 25 27 25Third-gen. cephalosporins R - - 19 24 28 26 31 22Carbapenems R . . <1 <1 <1 <1 <1 <1Pseudomonas aeruginosaPiperacillin R - - 21 18 13 21 16 15Ceftazidime R - - 11 8 7 14 8 5Carbapenems R - - 13 6 19 16 15 19Aminoglycosides R - - 18 15 10 13 12 9Fluoroquinolones R - - 29 21 17 24 13 9

177
Antimicrobial resistance surveillance in Europe 2010SURVEILLANCE REPORT
Demographic characteristics
Table 3: Selected details on invasive isolates from the reporting period 2009 and 2010
CharacteristicS. pneumoniae
n=485S. aureus
n=947E. coli
n=1 845E. faecalis
n=264E. faecium
n=130K. pneumoniae
n=385P. aeruginosa
n=196% total % PNSP % total % MRSA % total % FREC % total % VRE % total % VRE % total % CRKP % total % CRPA
Isolate sourceBlood 92 15 100 11 100 19 100 0 100 3 99 26 98 17CSF 8 13 - - <1 0 - - - - 1 100 2 33GenderMale 59 16 61 11 42 21 61 0 60 3 61 30 69 20Female 41 14 39 10 58 17 39 0 40 4 39 22 31 10Age (years)0–4 22 15 3 4 2 2 3 0 2 0 3 10 3 05–19 3 7 2 0 1 0 - - - - 1 20 1 020–64 36 16 37 10 27 20 29 0 48 5 34 29 37 2965 and over 39 15 58 12 70 19 68 0 50 2 63 27 60 10Hospital departmentICU 14 14 10 16 10 19 11 0 22 0 19 45 21 33Internal med. 38 16 43 9 47 18 38 0 28 0 40 14 33 6Surgery 1 33 12 23 6 24 20 0 18 4 15 34 18 23Other 47 15 35 7 37 19 30 0 32 7 25 29 28 13
PNSP: penicillin-non-susceptible S. pneumoniae; MRSA: meticillin-resistant S. aureus; FREC: fluoroquinolone-resistant E. coli; VRE: vancomycin-resistant Enterococcus; CRKP: third-generation cephalosporin-resistant K. pneumoniae; CRPA: carbapenems-resistant P. aeruginosa.
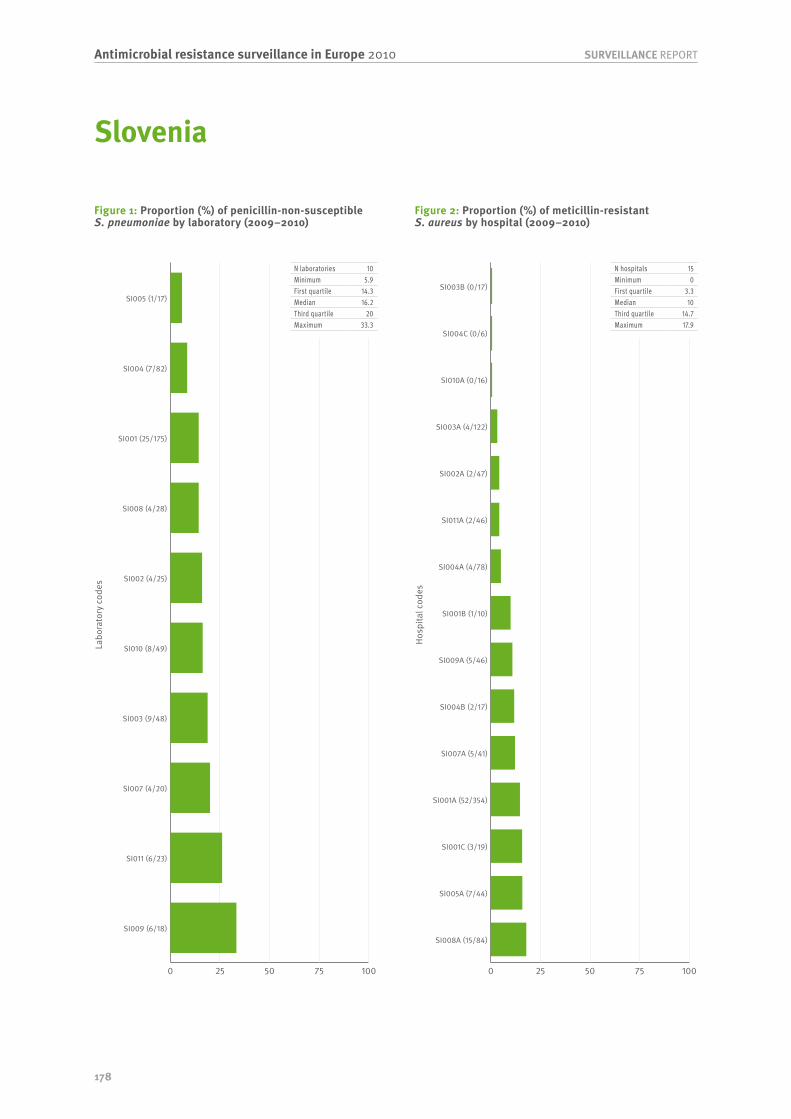
178
SURVEILLANCE REPORTAntimicrobial resistance surveillance in Europe 2010
Labo
rato
ry c
odes
0 25 50 75 100
SI009 (6/18)
SI011 (6/23)
SI007 (4/20)
SI003 (9/48)
SI010 (8/49)
SI002 (4/25)
SI008 (4/28)
SI001 (25/175)
SI004 (7/82)
SI005 (1/17)
Hosp
ital c
odes
0 25 50 75 100
SI008A (15/84)
SI005A (7/44)
SI001C (3/19)
SI001A (52/354)
SI007A (5/41)
SI004B (2/17)
SI009A (5/46)
SI001B (1/10)
SI004A (4/78)
SI011A (2/46)
SI002A (2/47)
SI003A (4/122)
SI010A (0/16)
SI004C (0/6)
SI003B (0/17)
Figure 1: Proportion (%) of penicillin-non-susceptible S. pneumoniae by laboratory (2009–2010)
Figure 2: Proportion (%) of meticillin-resistant S. aureus by hospital (2009–2010)
N laboratories 10Minimum 5.9First quartile 14.3Median 16.2Third quartile 20Maximum 33.3
N hospitals 15Minimum 0First quartile 3.3Median 10Third quartile 14.7Maximum 17.9
Slovenia
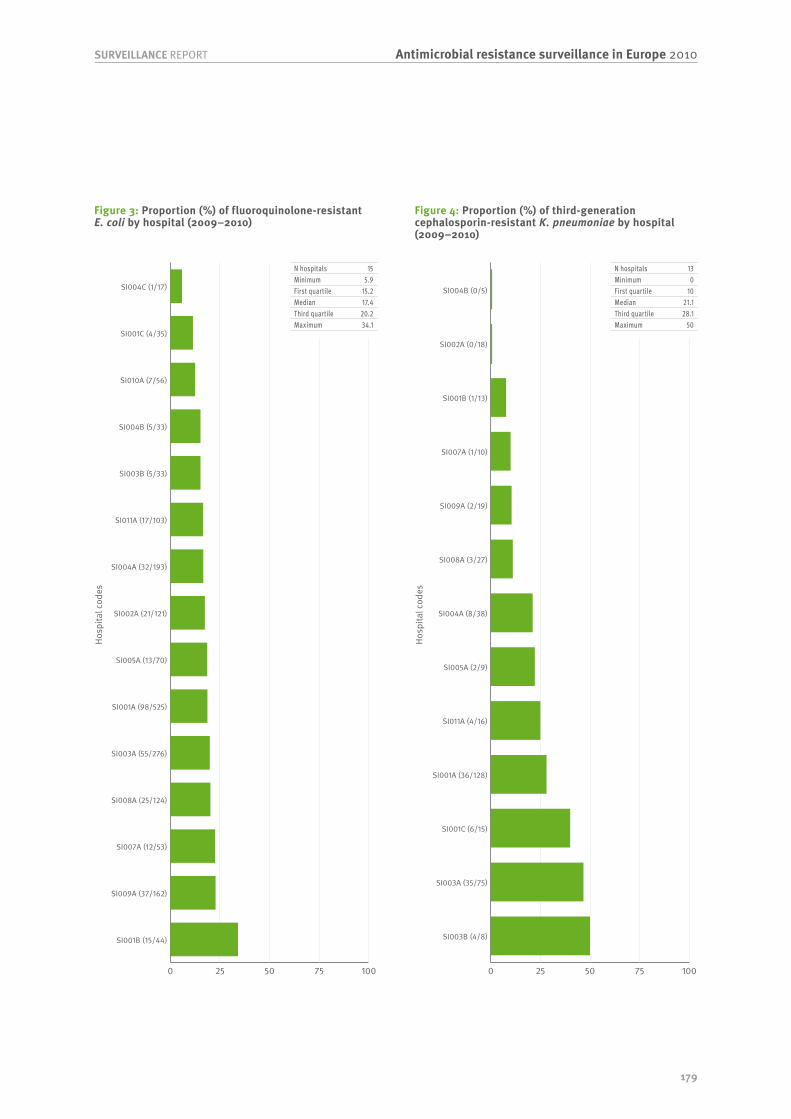
179
Antimicrobial resistance surveillance in Europe 2010SURVEILLANCE REPORT
Hosp
ital c
odes
0 25 50 75 100
SI001B (15/44)
SI009A (37/162)
SI007A (12/53)
SI008A (25/124)
SI003A (55/276)
SI001A (98/525)
SI005A (13/70)
SI002A (21/121)
SI004A (32/193)
SI011A (17/103)
SI003B (5/33)
SI004B (5/33)
SI010A (7/56)
SI001C (4/35)
SI004C (1/17)
Hosp
ital c
odes
0 25 50 75 100
SI003B (4/8)
SI003A (35/75)
SI001C (6/15)
SI001A (36/128)
SI011A (4/16)
SI005A (2/9)
SI004A (8/38)
SI008A (3/27)
SI009A (2/19)
SI007A (1/10)
SI001B (1/13)
SI002A (0/18)
SI004B (0/5)
Figure 3: Proportion (%) of fluoroquinolone-resistant E. coli by hospital (2009–2010)
Figure 4: Proportion (%) of third-generation cephalosporin-resistant K. pneumoniae by hospital (2009–2010)
N hospitals 15Minimum 5.9First quartile 15.2Median 17.4Third quartile 20.2Maximum 34.1
N hospitals 13Minimum 0First quartile 10Median 21.1Third quartile 28.1Maximum 50

180
SURVEILLANCE REPORTAntimicrobial resistance surveillance in Europe 2010
Spain
General information about EARS-Net participating laboratories
Antibiotic resistance from 2003 to 2010
Table 1: Number of laboratories and number of isolates reported for the period 2003–2010
YearS. pneumoniae S. aureus E. coli Enterecocci K. pneumoniae P. aeruginosaLabs Isolates Labs Isolates Labs Isolates Labs Isolates Labs Isolates Labs Isolates
2003 35 656 36 1391 29 2650 36 608 - - - -2004 36 684 36 1527 36 3471 36 710 - - - -2005 34 740 34 1337 34 2997 35 623 14 56 13 702006 35 625 35 1483 35 3364 34 755 33 564 32 4052007 35 862 35 1645 35 3678 35 885 33 618 35 4482008 31 695 32 1505 32 3626 32 1002 30 639 32 5482009 32 708 33 1715 33 3821 33 1093 32 628 33 5442010 41 862 41 1986 41 5696 41 1467 41 1161 41 749
Table 2: Proportion (%) of antibiotic non-susceptible isolates
Pathogens by antimicrobial classes 2003 2004 2005 2006 2007 2008 2009 2010Streptococcus pneumoniaePenicillin R 7 9 9 8 8 7 8 10Penicillin RI 32 29 25 27 22 23 22 30Macrolides RI 27 27 23 22 18 22 19 27Staphylococcus aureusOxacillin/Meticillin R 24 26 27 25 25 27 26 25Escherichia coliAminopenicilins R 58 60 62 64 62 63 65 65Aminoglycosides R 7 7 10 9 10 11 13 14Fluoroquinolones R 21 25 28 28 30 33 31 33Third-gen. cephalosporins R 4 7 8 7 7 9 11 12Carbapenems R <1 <1 <1 <1 <1 <1 <1 <1Enterococcus faecalisAminopenicilins RI 1 2 <1 2 1 3 3 1HL Gentamicin R 36 36 36 36 42 41 43 41Vancomycin R <1 <1 <1 <1 <1 <1 <1 <1Enterococcus faeciumAminopenicilins RI 64 66 67 73 79 79 83 83HL Gentamicin R 11 17 16 21 40 35 38 27Vancomycin R 3 2 3 3 2 1 3 1Klebsiella pneumoniaeAminoglycosides R - - 4 7 9 9 9 9Fluoroquinolones R - - 11 8 17 15 16 14Third-gen. cephalosporins R - - 7 9 10 12 11 10Carbapenems R . . <1 <1 <1 <1 <1 <1Pseudomonas aeruginosaPiperacillin R - - 4 9 8 8 8 6Ceftazidime R - - 6 7 10 11 8 7Carbapenems R - - 17 12 15 13 16 18Aminoglycosides R - - 4 11 15 18 19 18Fluoroquinolones R - - 14 19 25 23 25 25
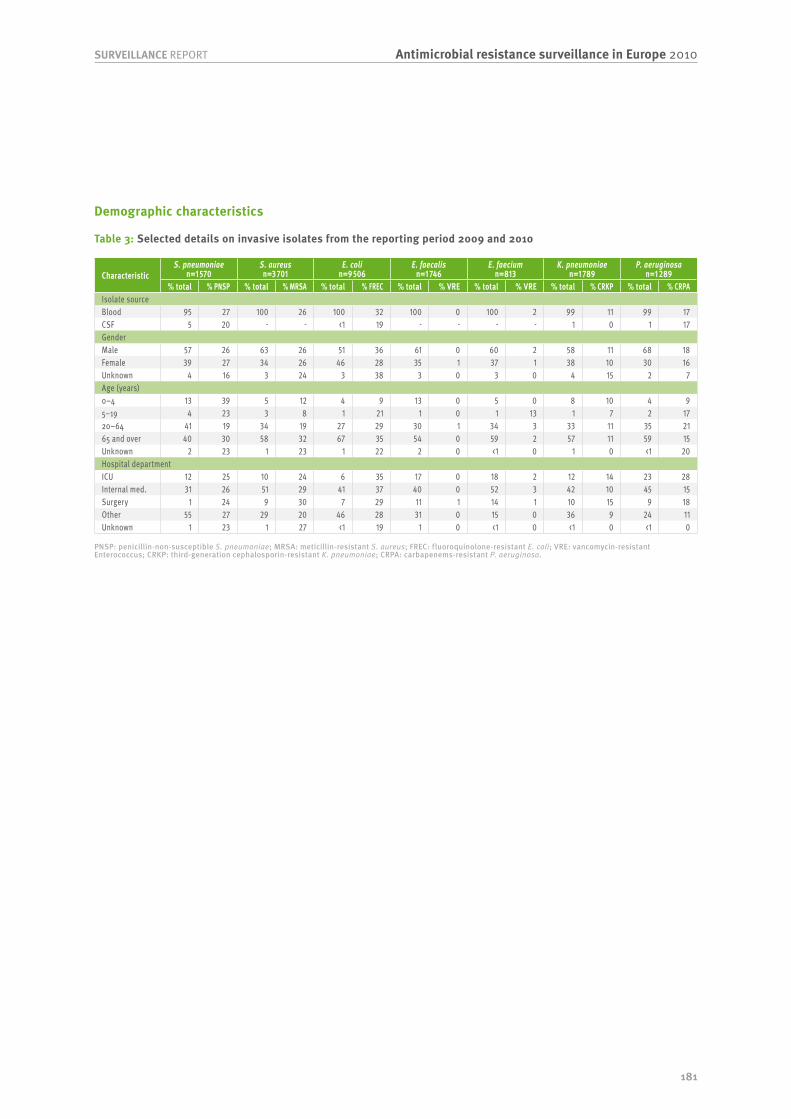
181
Antimicrobial resistance surveillance in Europe 2010SURVEILLANCE REPORT
Demographic characteristics
Table 3: Selected details on invasive isolates from the reporting period 2009 and 2010
CharacteristicS. pneumoniae
n=1 570S. aureus n=3 701
E. coli n=9 506
E. faecalis n=1 746
E. faecium n=813
K. pneumoniae n=1 789
P. aeruginosa n=1 289
% total % PNSP % total % MRSA % total % FREC % total % VRE % total % VRE % total % CRKP % total % CRPAIsolate sourceBlood 95 27 100 26 100 32 100 0 100 2 99 11 99 17CSF 5 20 - - <1 19 - - - - 1 0 1 17GenderMale 57 26 63 26 51 36 61 0 60 2 58 11 68 18Female 39 27 34 26 46 28 35 1 37 1 38 10 30 16Unknown 4 16 3 24 3 38 3 0 3 0 4 15 2 7Age (years)0–4 13 39 5 12 4 9 13 0 5 0 8 10 4 95–19 4 23 3 8 1 21 1 0 1 13 1 7 2 1720–64 41 19 34 19 27 29 30 1 34 3 33 11 35 2165 and over 40 30 58 32 67 35 54 0 59 2 57 11 59 15Unknown 2 23 1 23 1 22 2 0 <1 0 1 0 <1 20Hospital departmentICU 12 25 10 24 6 35 17 0 18 2 12 14 23 28Internal med. 31 26 51 29 41 37 40 0 52 3 42 10 45 15Surgery 1 24 9 30 7 29 11 1 14 1 10 15 9 18Other 55 27 29 20 46 28 31 0 15 0 36 9 24 11Unknown 1 23 1 27 <1 19 1 0 <1 0 <1 0 <1 0
PNSP: penicillin-non-susceptible S. pneumoniae; MRSA: meticillin-resistant S. aureus; FREC: fluoroquinolone-resistant E. coli; VRE: vancomycin-resistant Enterococcus; CRKP: third-generation cephalosporin-resistant K. pneumoniae; CRPA: carbapenems-resistant P. aeruginosa.
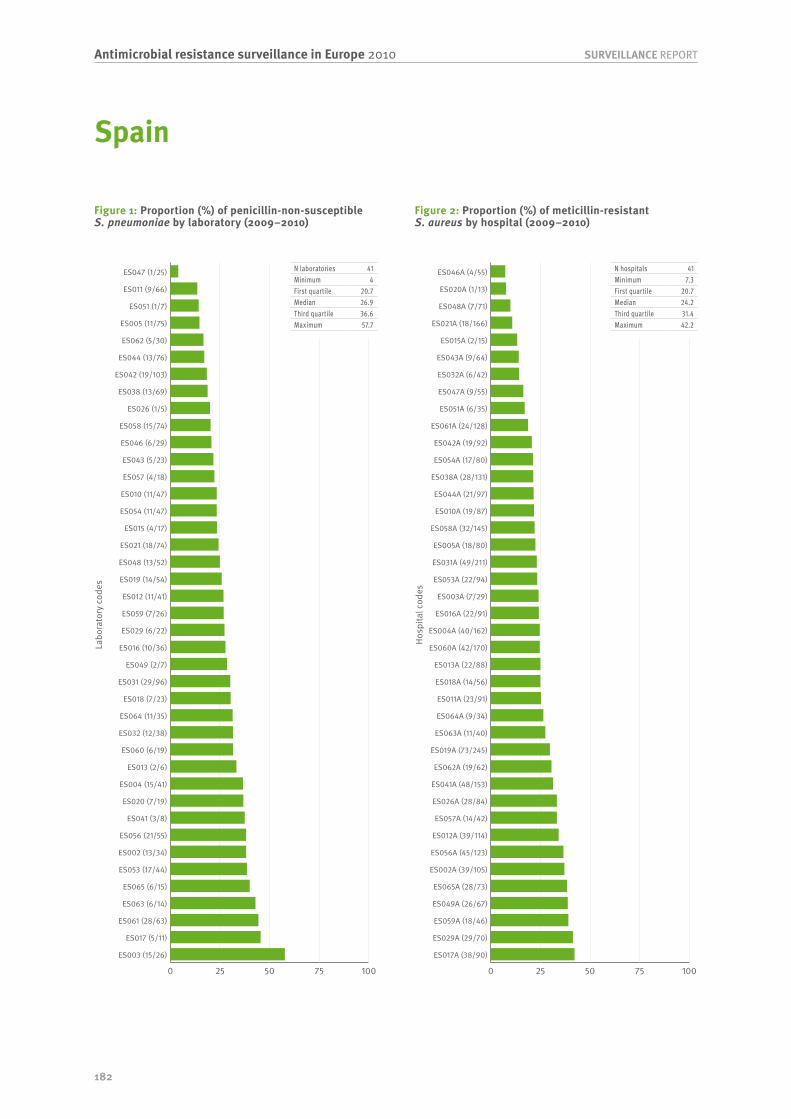
182
SURVEILLANCE REPORTAntimicrobial resistance surveillance in Europe 2010
Labo
rato
ry c
odes
0 25 50 75 100
ES003 (15/26)
ES017 (5/11)
ES061 (28/63)
ES063 (6/14)
ES065 (6/15)
ES053 (17/44)
ES002 (13/34)
ES056 (21/55)
ES041 (3/8)
ES020 (7/19)
ES004 (15/41)
ES013 (2/6)
ES060 (6/19)
ES032 (12/38)
ES064 (11/35)
ES018 (7/23)
ES031 (29/96)
ES049 (2/7)
ES016 (10/36)
ES029 (6/22)
ES059 (7/26)
ES012 (11/41)
ES019 (14/54)
ES048 (13/52)
ES021 (18/74)
ES015 (4/17)
ES054 (11/47)
ES010 (11/47)
ES057 (4/18)
ES043 (5/23)
ES046 (6/29)
ES058 (15/74)
ES026 (1/5)
ES038 (13/69)
ES042 (19/103)
ES044 (13/76)
ES062 (5/30)
ES005 (11/75)
ES051 (1/7)
ES011 (9/66)
ES047 (1/25)
Hosp
ital c
odes
0 25 50 75 100
ES017A (38/90)
ES029A (29/70)
ES059A (18/46)
ES049A (26/67)
ES065A (28/73)
ES002A (39/105)
ES056A (45/123)
ES012A (39/114)
ES057A (14/42)
ES026A (28/84)
ES041A (48/153)
ES062A (19/62)
ES019A (73/245)
ES063A (11/40)
ES064A (9/34)
ES011A (23/91)
ES018A (14/56)
ES013A (22/88)
ES060A (42/170)
ES004A (40/162)
ES016A (22/91)
ES003A (7/29)
ES053A (22/94)
ES031A (49/211)
ES005A (18/80)
ES058A (32/145)
ES010A (19/87)
ES044A (21/97)
ES038A (28/131)
ES054A (17/80)
ES042A (19/92)
ES061A (24/128)
ES051A (6/35)
ES047A (9/55)
ES032A (6/42)
ES043A (9/64)
ES015A (2/15)
ES021A (18/166)
ES048A (7/71)
ES020A (1/13)
ES046A (4/55)
Figure 1: Proportion (%) of penicillin-non-susceptible S. pneumoniae by laboratory (2009–2010)
Figure 2: Proportion (%) of meticillin-resistant S. aureus by hospital (2009–2010)
N laboratories 41Minimum 4First quartile 20.7Median 26.9Third quartile 36.6Maximum 57.7
N hospitals 41Minimum 7.3First quartile 20.7Median 24.2Third quartile 31.4Maximum 42.2
Spain

183
Antimicrobial resistance surveillance in Europe 2010SURVEILLANCE REPORT
Hosp
ital c
odes
0 25 50 75 100
ES032B (8/15)
ES056A (206/448)
ES017A (49/109)
ES047A (29/72)
ES049A (46/116)
ES012A (104/267)
ES004A (124/319)
ES031A (167/448)
ES059A (63/172)
ES046A (30/84)
ES044A (104/292)
ES063A (27/76)
ES016A (81/230)
ES043A (83/237)
ES051A (25/72)
ES015A (17/49)
ES002A (107/317)
ES003A (49/146)
ES041A (77/231)
ES061A (93/280)
ES005A (95/287)
ES053A (74/225)
ES048A (61/192)
ES019A (188/595)
ES042A (142/450)
ES054A (111/354)
ES021A (139/454)
ES010A (81/266)
ES018A (75/265)
ES038A (99/354)
ES060A (72/258)
ES032A (45/177)
ES058A (78/308)
ES013A (29/115)
ES062A (51/204)
ES029A (36/144)
ES057A (40/162)
ES011A (72/298)
ES065A (34/151)
ES064A (29/134)
ES020A (1/5)
ES026A (23/118)
Hosp
ital c
odes
0 25 50 75 100
ES043A (12/54)
ES013A (7/34)
ES060A (15/75)
ES003A (3/18)
ES016A (4/24)
ES044A (13/81)
ES031A (17/107)
ES056A (13/86)
ES059A (4/27)
ES018A (6/42)
ES021A (7/53)
ES054A (8/64)
ES057A (3/24)
ES042A (12/97)
ES002A (7/59)
ES012A (4/34)
ES026A (3/27)
ES062A (8/73)
ES038A (7/64)
ES065A (2/19)
ES058A (6/70)
ES004A (3/40)
ES061A (8/119)
ES005A (3/48)
ES019A (2/33)
ES041A (4/67)
ES053A (2/44)
ES048A (1/25)
ES049A (1/26)
ES063A (1/31)
ES010A (1/32)
ES011A (1/41)
ES017A (0/12)
ES046A (0/32)
ES032A (0/31)
ES051A (0/16)
ES064A (0/16)
ES047A (0/10)
ES015A (0/14)
ES029A (0/15)
Figure 3: Proportion (%) of fluoroquinolone-resistant E. coli by hospital (2009–2010)
Figure 4: Proportion (%) of third-generation cephalosporin-resistant K. pneumoniae by hospital (2009–2010)
N hospitals 42Minimum 19.5First quartile 25.4Median 33Third quartile 35.6Maximum 53.3
N hospitals 40Minimum 0First quartile 3.2Median 9.5Third quartile 13.7Maximum 22.2

184
SURVEILLANCE REPORTAntimicrobial resistance surveillance in Europe 2010
Sweden
General information about EARS-Net participating laboratories
Antibiotic resistance from 2003 to 2010
Table 1: Number of laboratories and number of isolates reported for the period 2003–2010
YearS. pneumoniae S. aureus E. coli Enterecocci K. pneumoniae P. aeruginosaLabs Isolates Labs Isolates Labs Isolates Labs Isolates Labs Isolates Labs Isolates
2003 21 919 21 1855 21 3350 21 850 - - - -2004 21 955 21 1906 21 3372 21 856 - - - -2005 21 1025 21 1774 21 3241 21 821 18 282 17 1492006 21 996 21 1968 20 3539 21 884 20 621 18 3002007 21 1032 21 2163 20 3749 21 932 20 649 20 3432008 21 1219 21 2410 20 4032 21 1059 20 826 20 3152009 19 1063 19 2460 18 4247 19 967 18 706 18 3382010 19 1008 19 2865 18 4846 18 1038 18 878 18 377
Table 2: Proportion (%) of antibiotic non-susceptible isolates
Pathogens by antimicrobial classes 2003 2004 2005 2006 2007 2008 2009 2010Streptococcus pneumoniaePenicillin R <1 <1 <1 <1 <1 <1 2 2Penicillin RI 5 3 4 2 3 2 3 4Macrolides RI 5 5 6 5 5 6 4 4Staphylococcus aureusOxacillin/Meticillin R <1 <1 1 <1 <1 <1 1 <1Escherichia coliAminopenicilins R 29 23 26 28 33 32 33 35Aminoglycosides R 1 1 1 2 2 2 3 3Fluoroquinolones R 7 8 6 8 10 10 8 11Third-gen. cephalosporins R <1 <1 1 2 2 2 3 3Carbapenems R . . <1 <1 <1 <1 <1 <1Enterococcus faecalisAminopenicilins RI <1 <1 <1 <1 <1 <1 <1 <1HL Gentamicin R 17 16 19 20 16 20 19 15Vancomycin R <1 <1 <1 <1 <1 <1 <1 <1Enterococcus faeciumAminopenicilins RI 77 78 74 76 79 82 76 82HL Gentamicin R 11 7 4 12 14 25 24 22Vancomycin R 2 1 <1 <1 <1 2 <1 <1Klebsiella pneumoniaeAminoglycosides R - - 1 <1 1 1 <1 1Fluoroquinolones R - - 5 5 6 7 2 5Third-gen. cephalosporins R - - 1 1 1 2 2 2Carbapenems R . . <1 <1 <1 <1 <1 <1Pseudomonas aeruginosaPiperacillin R - - 9 <1 2 1 2 1Ceftazidime R - - 5 6 4 5 7 3Carbapenems R - - 18 5 7 4 8 4Aminoglycosides R - - <1 <1 <1 <1 <1 <1Fluoroquinolones R - - 6 5 6 5 7 6
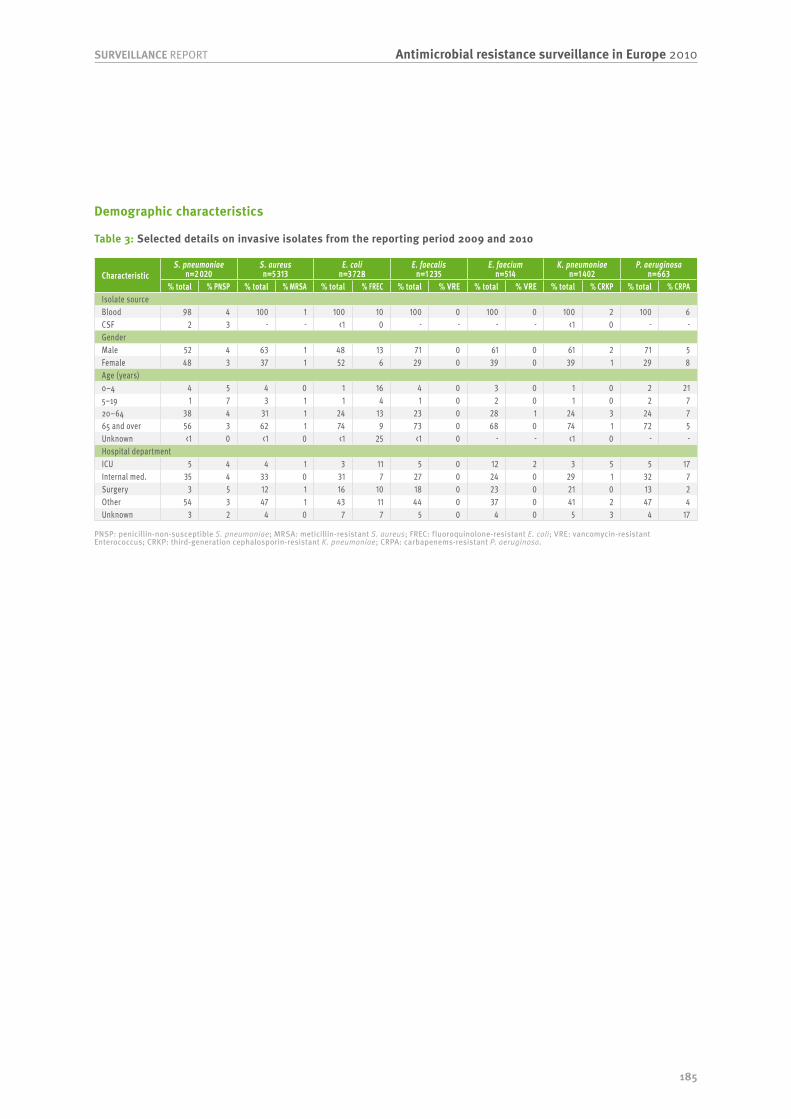
185
Antimicrobial resistance surveillance in Europe 2010SURVEILLANCE REPORT
Demographic characteristics
Table 3: Selected details on invasive isolates from the reporting period 2009 and 2010
CharacteristicS. pneumoniae
n=2 020S. aureus n=5 313
E. coli n=3 728
E. faecalis n=1 235
E. faecium n=514
K. pneumoniae n=1 402
P. aeruginosa n=663
% total % PNSP % total % MRSA % total % FREC % total % VRE % total % VRE % total % CRKP % total % CRPAIsolate sourceBlood 98 4 100 1 100 10 100 0 100 0 100 2 100 6CSF 2 3 - - <1 0 - - - - <1 0 - -GenderMale 52 4 63 1 48 13 71 0 61 0 61 2 71 5Female 48 3 37 1 52 6 29 0 39 0 39 1 29 8Age (years)0–4 4 5 4 0 1 16 4 0 3 0 1 0 2 215–19 1 7 3 1 1 4 1 0 2 0 1 0 2 720–64 38 4 31 1 24 13 23 0 28 1 24 3 24 765 and over 56 3 62 1 74 9 73 0 68 0 74 1 72 5Unknown <1 0 <1 0 <1 25 <1 0 - - <1 0 - -Hospital departmentICU 5 4 4 1 3 11 5 0 12 2 3 5 5 17Internal med. 35 4 33 0 31 7 27 0 24 0 29 1 32 7Surgery 3 5 12 1 16 10 18 0 23 0 21 0 13 2Other 54 3 47 1 43 11 44 0 37 0 41 2 47 4Unknown 3 2 4 0 7 7 5 0 4 0 5 3 4 17
PNSP: penicillin-non-susceptible S. pneumoniae; MRSA: meticillin-resistant S. aureus; FREC: fluoroquinolone-resistant E. coli; VRE: vancomycin-resistant Enterococcus; CRKP: third-generation cephalosporin-resistant K. pneumoniae; CRPA: carbapenems-resistant P. aeruginosa.

186
SURVEILLANCE REPORTAntimicrobial resistance surveillance in Europe 2010
Labo
rato
ry c
odes
0 25 50 75 100
SE250 (4/41)
SE110 (5/61)
SE430 (5/76)
SE100 (14/226)
SE240 (4/77)
SE310 (4/79)
SE540 (1/20)
SE120 (7/166)
SE620 (5/130)
SE200 (10/283)
SE230 (2/63)
SE610 (3/109)
SE600 (2/94)
SE350 (2/119)
SE450 (1/70)
SE320 (1/88)
SE440 (1/113)
SE400 (0/131)
SE730 (0/74)
Hosp
ital c
odes
0 25 50 75 100SE540A (3/52)SE240B (1/25)SE320B (1/41)
SE600A (5/264)SE200B (3/170)SE620A (3/171)
SE350B (1/61)SE120A (4/261)SE250A (2/146)SE200A (3/229)
SE250B (1/80)SE230A (1/93)
SE220A (1/101)SE100B (2/211)SE350C (1/125)SE240A (1/125)SE350A (1/150)SE450A (1/151)
SE400A (1/154)SE320A (1/159)SE310A (1/187)SE100A (1/350)
SE110B (0/45)SE110A (0/74)
SE450B (0/10)SE120B (0/32)SE440C (0/31)SE620C (0/54)
SE400B (0/123)SE100E (0/97)SE730D (0/19)SE220B (0/64)
SE430A (0/172)SE610A (0/179)
SE730C (0/17)SE200C (0/40)SE610C (0/76)SE730E (0/34)SE240C (0/51)SE450C (0/23)SE230B (0/28)SE430D (0/51)SE400C (0/35)
SE200D (0/5)SE100C (0/42)SE100G (0/16)SE620B (0/19)SE320C (0/13)SE620D (0/19)SE220C (0/20)
SE440A (0/156)SE310B (0/86)SE610B (0/48)SE450D (0/43)SE730B (0/23)SE730F (0/88)SE600C (0/30)SE100D (0/82)SE440B (0/49)
Figure 1: Proportion (%) of penicillin-non-susceptible S. pneumoniae by laboratory (2009–2010)
Figure 2: Proportion (%) of meticillin-resistant S. aureus by hospital (2009–2010)
N laboratories 19Minimum 0First quartile 1.4Median 3.5Third quartile 5.2Maximum 9.8
N hospitals 59Minimum 0First quartile 0Median 0Third quartile 0.8Maximum 5.8
Sweden
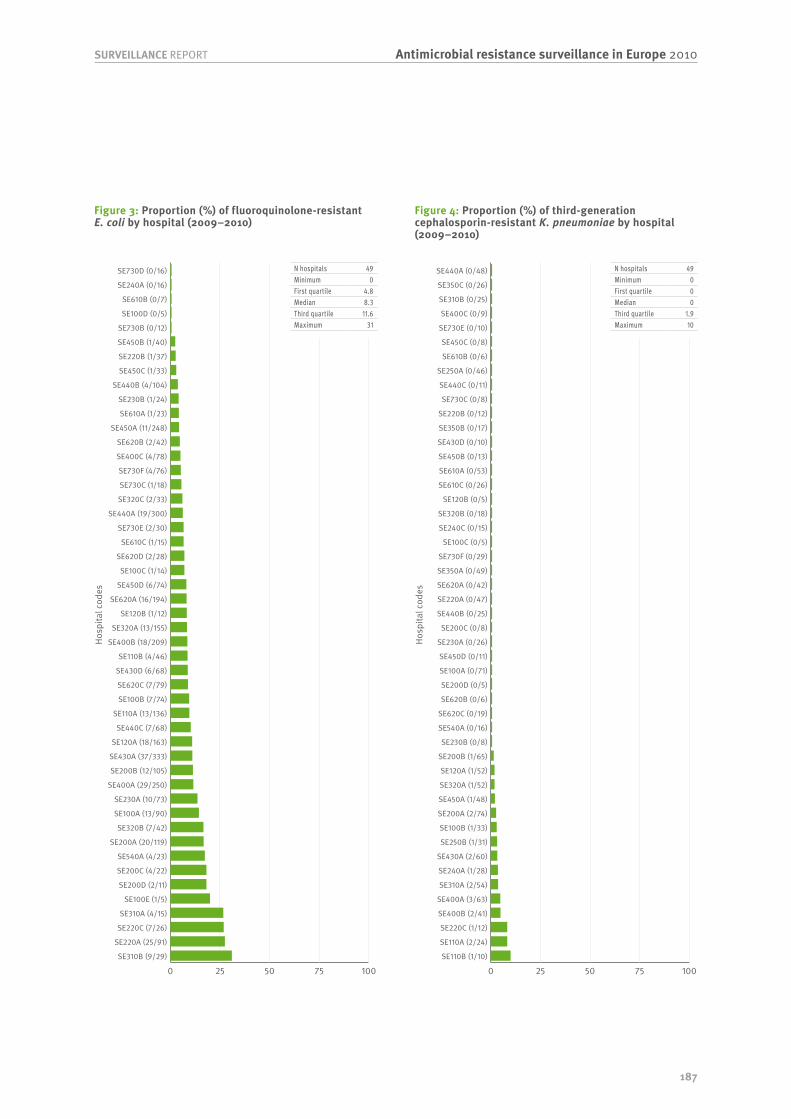
187
Antimicrobial resistance surveillance in Europe 2010SURVEILLANCE REPORT
Hosp
ital c
odes
0 25 50 75 100SE310B (9/29)
SE220A (25/91)
SE220C (7/26)
SE310A (4/15)
SE100E (1/5)
SE200D (2/11)
SE200C (4/22)
SE540A (4/23)
SE200A (20/119)
SE320B (7/42)
SE100A (13/90)
SE230A (10/73)
SE400A (29/250)
SE200B (12/105)
SE430A (37/333)
SE120A (18/163)
SE440C (7/68)
SE110A (13/136)
SE100B (7/74)
SE620C (7/79)
SE430D (6/68)
SE110B (4/46)
SE400B (18/209)
SE320A (13/155)
SE120B (1/12)
SE620A (16/194)
SE450D (6/74)
SE100C (1/14)
SE620D (2/28)
SE610C (1/15)
SE730E (2/30)
SE440A (19/300)
SE320C (2/33)
SE730C (1/18)
SE730F (4/76)
SE400C (4/78)
SE620B (2/42)
SE450A (11/248)
SE610A (1/23)
SE230B (1/24)
SE440B (4/104)
SE450C (1/33)
SE220B (1/37)
SE450B (1/40)
SE730B (0/12)
SE100D (0/5)
SE610B (0/7)
SE240A (0/16)
SE730D (0/16)
Hosp
ital c
odes
0 25 50 75 100SE110B (1/10)
SE110A (2/24)
SE220C (1/12)
SE400B (2/41)
SE400A (3/63)
SE310A (2/54)
SE240A (1/28)
SE430A (2/60)
SE250B (1/31)
SE100B (1/33)
SE200A (2/74)
SE450A (1/48)
SE320A (1/52)
SE120A (1/52)
SE200B (1/65)
SE230B (0/8)
SE540A (0/16)
SE620C (0/19)
SE620B (0/6)
SE200D (0/5)
SE100A (0/71)
SE450D (0/11)
SE230A (0/26)
SE200C (0/8)
SE440B (0/25)
SE220A (0/47)
SE620A (0/42)
SE350A (0/49)
SE730F (0/29)
SE100C (0/5)
SE240C (0/15)
SE320B (0/18)
SE120B (0/5)
SE610C (0/26)
SE610A (0/53)
SE450B (0/13)
SE430D (0/10)
SE350B (0/17)
SE220B (0/12)
SE730C (0/8)
SE440C (0/11)
SE250A (0/46)
SE610B (0/6)
SE450C (0/8)
SE730E (0/10)
SE400C (0/9)
SE310B (0/25)
SE350C (0/26)
SE440A (0/48)
Figure 3: Proportion (%) of fluoroquinolone-resistant E. coli by hospital (2009–2010)
Figure 4: Proportion (%) of third-generation cephalosporin-resistant K. pneumoniae by hospital (2009–2010)
N hospitals 49Minimum 0First quartile 4.8Median 8.3Third quartile 11.6Maximum 31
N hospitals 49Minimum 0First quartile 0Median 0Third quartile 1.9Maximum 10

188
SURVEILLANCE REPORTAntimicrobial resistance surveillance in Europe 2010
United Kingdom
General information about EARS-Net participating laboratories
Antibiotic resistance from 2003 to 2010
Table 1: Number of laboratories and number of isolates reported for the period 2003–2010
YearS. pneumoniae S. aureus E. coli Enterecocci K. pneumoniae P. aeruginosaLabs Isolates Labs Isolates Labs Isolates Labs Isolates Labs Isolates Labs Isolates
2003 50 1334 51 3548 19 2253 - - - - - -2004 54 1059 54 3562 20 2091 - - - - - -2005 53 1375 58 3971 23 2359 27 591 23 420 25 4382006 51 1514 55 4132 26 2438 22 547 22 404 24 3532007 50 1785 55 4865 20 2374 18 435 18 382 19 3702008 51 1223 55 3355 15 2456 14 274 15 350 14 3452009 59 1396 69 2977 28 4712 26 712 27 725 26 6392010 50 1459 55 2730 29 5389 28 651 28 840 28 588
Table 2: Proportion (%) of antibiotic non-susceptible isolates
Pathogens by antimicrobial classes 2003 2004 2005 2006 2007 2008 2009 2010Streptococcus pneumoniaePenicillin R 1 <1 2 <1 2 1 1 <1Penicillin RI 5 3 4 3 4 5 3 3Macrolides RI 13 13 11 12 10 6 4 5Staphylococcus aureusOxacillin/Meticillin R 44 44 44 42 36 31 28 22Escherichia coliAminopenicilins R 55 53 56 57 55 61 62 62Aminoglycosides R 4 6 8 7 7 7 7 8Fluoroquinolones R 11 14 17 20 18 15 18 17Third-gen. cephalosporins R 3 3 6 8 9 7 9 9Carbapenems R - - - <1 <1 <1 <1 <1Enterococcus faecalisAminopenicilins RI - - 2 3 4 2 2 6HL Gentamicin R - - 47 52 31 42 38 39Vancomycin R - - 2 1 2 4 2 1Enterococcus faeciumAminopenicilins RI - - 84 78 82 83 91 84HL Gentamicin R - - 53 18 35 7 38 31Vancomycin R - - 33 18 21 28 13 10Klebsiella pneumoniaeAminoglycosides R - - 6 8 9 6 5 5Fluoroquinolones R - - 12 13 12 7 6 7Third-gen. cephalosporins R - - 12 11 13 7 7 10Carbapenems R - - <1 <1 <1 1 <1 <1Pseudomonas aeruginosaPiperacillin R - - 2 1 5 2 3 4Ceftazidime R - - 3 3 7 4 5 5Carbapenems R - - 9 6 10 6 8 6Aminoglycosides R - - 3 3 5 3 1 2Fluoroquinolones R - - 8 8 9 8 7 7

189
Antimicrobial resistance surveillance in Europe 2010SURVEILLANCE REPORT
Demographic characteristics
Table 3: Selected details on invasive isolates from the reporting period 2009 and 2010
CharacteristicS. pneumoniae
n=2 636S. aureus n=5 567
E. coli n=8 945
E. faecalis n=779
E. faecium n=516
K. pneumoniae n=1 398
P. aeruginosa n=1 001
% total % PNSP % total % MRSA % total % FREC % total % VRE % total % VRE % total % CRKP % total % CRPAIsolate sourceBlood 99 3 100 25 100 18 100 2 100 12 100 9 100 7CSF 1 6 - - - - - - - - - - - -GenderMale 52 3 61 26 47 20 62 1 57 8 59 9 62 6Female 47 3 38 23 53 16 38 2 41 16 41 7 38 10Unknown 1 0 1 29 <1 23 <1 0 2 20 <1 33 <1 25Age (years)0–4 7 3 5 9 2 10 11 0 6 3 3 20 3 125–19 4 4 3 9 1 10 2 0 2 9 1 8 2 620–64 45 2 39 19 26 17 26 3 38 18 31 7 29 1065 and over 44 4 52 32 71 18 61 1 52 8 65 9 64 6Unknown 1 5 1 15 <1 0 1 0 2 8 <1 0 1 0Hospital departmentICU 5 1 3 34 - - - - - - - - - -Internal med. 17 4 11 35 - - - - - - - - - -Surgery 1 3 3 31 - - - - - - - - - -Other 30 3 21 25 - - - - - - - - - -Unknown 48 3 62 22 100 18 100 2 100 12 100 9 100 7
PNSP: penicillin-non-susceptible S. pneumoniae; MRSA: meticillin-resistant S. aureus; FREC: fluoroquinolone-resistant E. coli; VRE: vancomycin-resistant Enterococcus; CRKP: third-generation cephalosporin-resistant K. pneumoniae; CRPA: carbapenems-resistant P. aeruginosa.

190
SURVEILLANCE REPORTAntimicrobial resistance surveillance in Europe 2010
Labo
rato
ry c
odes
0 25 50 75 100UK084 (8/36)
UK031 (1/8)UK049 (1/10)UK076 (3/32)UK032 (6/67)UK057 (2/26)UK090 (2/28)UK100 (2/30)UK056 (2/30)UK055 (1/15)
UK047 (4/64)UK053 (2/39)UK010 (1/20)
UK064 (3/66)UK043 (3/66)UK078 (3/66)UK068 (4/96)UK093 (3/81)
UK099 (5/141)UK011 (1/29)
UK004 (1/29)UK092 (2/70)UK066 (1/35)
UK045 (3/107)UK007 (4/149)
UK008 (1/45)UK091 (2/95)UK020 (1/53)
UK101 (2/122)UK098 (1/70)UK012 (1/73)UK051 (1/73)UK015 (1/76)UK081 (0/6)UK070 (0/6)
UK023 (0/15)UK094 (0/74)UK102 (0/21)
UK046 (0/27)UK027 (0/18)UK044 (0/11)
UK069 (0/47)UK017 (0/50)UK063 (0/34)UK096 (0/59)UK097 (0/39)UK059 (0/72)UK052 (0/29)UK054 (0/45)UK001 (0/23)UK058 (0/9)UK042 (0/8)
UK050 (0/34)UK048 (0/17)UK080 (0/6)UK077 (0/9)
UK033 (0/26)
Hosp
ital c
odes
0 25 50 75 100UK008A (15/15)UK090X (17/17)
UK004A (5/5)UK094X (13/14)
UK043B (5/6)UK023X (4/5)
UK017B (31/41)UK020A (7/10)
UK007A (20/29)UK043A (17/25)UK032A (15/23)
UK007B (19/30)UK011A (11/18)
UK031A (3/5)UK084E (6/12)UK044C (6/12)UK010A (5/10)UK027A (7/15)UK032B (6/13)
UK046A (10/24)UK044D (6/15)
UK070X (15/39)UK081A (5/13)
UK077A (16/42)UK083A (38/101)
UK081B (3/8)UK079A (3/8)UK015A (3/8)
UK080A (17/46)UK048X (12/33)
UK052X (9/25)UK076A (23/66)UK056X (27/79)
UK078A (50/149)UK023A (6/18)UK084B (6/18)
UK069X (30/95)UK044A (31/99)UK090A (8/26)
UK084A (25/82)UK069A (16/53)UK057A (9/30)
UK054X (18/62)UK001A (2/7)
UK068X (54/193)UK051X (28/102)UK063X (12/44)UK063A (6/22)
UK047X (60/227)UK064X (28/111)
UK075A (7/28)UK076D (6/24)UK057X (8/33)
UK056A (16/66)UK053X (7/29)UK048A (6/25)
UK047A (37/157)UK099X (56/253)UK068B (40/188)
UK049X (7/33)UK059X (19/92)UK066X (10/49)
UK044B (2/10)UK046X (4/20)UK097X (14/72)UK049A (5/26)UK050X (7/38)
UK045X (30/164)UK093X (36/199)UK098X (24/140)
UK078B (2/12)UK091X (34/208)UK045A (21/131)
UK054A (7/45)UK051A (11/72)UK059A (11/73)UK004X (8/55)
UK033X (17/118)UK101X (43/301)
UK100X (9/64)UK096X (14/102)
UK066A (3/22)UK102X (12/95)UK055A (2/19)
UK064A (8/78)UK092X (13/132)
UK072X (2/24)UK053D (2/29)UK078C (1/25)UK055X (1/31)
UK050A (1/45)UK072A (0/10)UK052A (0/20)
Figure 1: Proportion (%) of penicillin-non-susceptible S. pneumoniae by laboratory (2009–2010)
Figure 2: Proportion (%) of meticillin-resistant S. aureus by hospital (2009–2010)
N laboratories 57Minimum 0First quartile 0Median 1.6Third quartile 4.5Maximum 22.2
N hospitals 93Minimum 0First quartile 17.1Median 27.3Third quartile 38.1Maximum 100
United Kingdom
100% meticillin resistance rates for isolates of S. aureus reflect reporting of MRSA only.

191
Antimicrobial resistance surveillance in Europe 2010SURVEILLANCE REPORT
Hosp
ital c
odes
0 25 50 75 100
UK003X (33/71)
UK094X (53/131)
UK043X (62/158)
UK007X (14/39)
UK027X (39/157)
UK099X (176/771)
UK101X (165/799)
UK042X (47/232)
UK026X (54/267)
UK020X (36/184)
UK012X (72/375)
UK092X (65/355)
UK102X (33/187)
UK015X (177/1024)
UK091X (86/504)
UK011X (41/245)
UK096X (47/282)
UK097X (34/224)
UK100X (21/140)
UK098X (62/458)
UK032X (84/644)
UK001X (15/117)
UK017X (52/408)
UK008X (30/245)
UK093X (26/226)
UK033X (18/208)
UK023X (30/349)
UK090X (6/143)
Hosp
ital c
odes
0 25 50 75 100
UK094X (5/5)
UK003X (3/5)
UK011X (5/33)
UK012X (6/47)
UK097X (3/26)
UK093X (4/35)
UK091X (14/129)
UK099X (12/121)
UK102X (4/41)
UK100X (3/31)
UK026X (7/74)
UK101X (14/149)
UK042X (3/36)
UK032X (10/131)
UK020X (2/30)
UK015X (10/155)
UK027X (1/19)
UK098X (3/58)
UK096X (2/40)
UK092X (2/43)
UK033X (2/45)
UK008X (1/34)
UK017X (2/72)
UK023X (0/32)
Figure 3: Proportion (%) of fluoroquinolone-resistant E. coli by hospital (2009–2010)
Figure 4: Proportion (%) of third-generation cephalosporin-resistant K. pneumoniae by hospital (2009–2010)
N hospitals 28Minimum 4.2First quartile 12.9Median 17.2Third quartile 20.5Maximum 46.5
N hospitals 24Minimum 0First quartile 5.1Median 8.9Third quartile 11.1Maximum 100


HOW TO OBTAIN EU PUBLICATIONSFree publications:
• via EU Bookshop (http://bookshop.europa.eu);• at the European Commission’s representations or delegations. You can
obtain their contact details on the Internet (http://ec.europa.eu) or by sending a fax to +352 2929-42758.
Priced publications:
• via EU Bookshop (http://bookshop.europa.eu).
Priced subscriptions (e.g. annual series of the Official Journal of the European Union and reports of cases before the Court of Justice of the European Union):
• via one of the sales agents of the Publications Office of the European Union(http://publications.europa.eu/others/agents/index_en.htm).
European Centre for Disease Prevention and Control (ECDC)
Postal address: ECDC, 171 83 Stockholm, Sweden
Visiting address: Tomtebodavägen 11a, Solna, Sweden
Phone +46 (0)8 58 60 1000Fax +46 (0)8 58 60 1001www.ecdc.europa.eu
An agency of the European Unionwww.europa.eu
TQ-AM-11-001-EN
-C