antimicrobial resistance surveillance from sentinel public ... · antimicrobial resistance...
TRANSCRIPT
August 2016_v1
Antimicrobial Resistance Surveillance from sentinel public hospitals, South Africa, 2015
Authors: Olga Perovic1,2 and Verushka Chetty1 1 National Institute for Communicable Diseases at National Health Laboratory Service 2Department of Clinical Microbiology and Infectious Diseases at University of
Witwatersrand
Introduction
Antimicrobial resistance (AMR) is a significant public health concern that threatens effective
treatment of severe infections, both locally and globally. Surveillance is conducted to
determine the extent and pattern of resistance amongst the most common pathogens causing
infections in humans.1 Integrated data on bacterial resistance is obtained from an electronic
database of bacterial antimicrobial susceptibility results generated by public health
laboratories in South Africa. This report is designed to provide information on antimicrobial
resistance trends in bacteria causing healthcare-associated infections and is prepared by the
National Institute for Communicable Diseases (NICD) and Corporate Data Warehouse
(CDW) at the National Health Laboratory Service (NHLS).
Objectives
1. To determine the number of cases reported from selected hospitals by month for the
following organisms isolated from blood cultures: Acinetobacter baumannii complex,
Enterobacter cloacae complex, Escherichia coli, Enterococcus faecalis, Enterococcus
faecium, Klebsiella pneumoniae, Pseudomonas aeruginosa and Staphylococcus
aureus.
2. To describe the antimicrobial susceptibility to the most important agents by individual
pathogen and by hospital.
Methods
The data for this report were sourced from the NHLS CDW. CDW is a national repository for
all public health hospitals in South Africa which contains archived data from the laboratory
information system (LIS), TrakCare.2
Bloodstream isolates data over a one-year period (January –December 2015) were extracted
for the following ESKAPE pathogens: Enterococcus faecalis, Enterococcus faecium,
Staphylococcus aureus, Klebsiella pneumoniae, Acinetobacter baumannii complex,
Pseudomonas aeruginosa, Enterobacter cloacae complex, and Escherichia coli. Routine
electronic data were collected from sentinel sites, mostly tertiary academic hospitals (Table
1).
Antimicrobial susceptibility test (AST) reporting was based on CLSI standards.3 Table 2
describes the different AST methods used in laboratories based at the sentinel sites.
Due to site-specific differences in testing methodologies and data capture on the LIS,
extensive cleaning and recoding of data were necessary; this was done within the CDW. The
CDW linking algorithm was used to create unique patient identifiers, which enabled the
generation of patient-level data and de-duplication within a 21 day patient episode initiated
from the first occurrence of resistance to a given antibiotic for a given pathogen.
August 2016_v1
Limitations 1. Data may be incomplete due to missing cases not captured on the LIS or non-standardised
coding of pathogens and antibiotics. Testing methods and microbiological practice vary
between sites and this could account for the results presented in this report.
2. Confirmatory AST methods were not performed for any of these organisms and results
presented here are reported as captured on LIS. Thus, while some results may suggest the
occurrence of an outbreak, it is not possible to confirm this.
3. For certain sites, not all organisms are represented; this may be due to organisms not being
identified at a particular site for 2015.
4. Vancomycin resistance is not reported for Staphylococcus aureus due to the lack of
confirmatory test methods (pending agreement with SASCM).
5. Data were omitted for those sites that tested less than 30 organisms for a particular
antibiotic.
Table 1. Characteristics of hospital sites involved in antimicrobial surveillance
Hospital Site Province Academic
Hospital
No of
beds
Frere Hospital Eastern Cape No 916
Livingstone Hospital Eastern Cape Yes 616
Nelson Mandela Academic Hospital/Mthatha
Tertiary (NMAH)
Eastern Cape Yes 520
Universitas Hospital (UH) Free State Yes 650
Charlotte Maxeke Johannesburg Academic
Hospital (CMJAH)
Gauteng Yes 1088
Chris Hani Baragwanath Hospital (CHBH) Gauteng Yes 3200
Dr George Mukhari Hospital (DGMH) Gauteng Yes 1200
Steve Biko Academic Hospital (SBAH) Gauteng Yes 832
Helen Joseph Hospital (HJH) Gauteng Yes 700
Grey’s Hospital (GH) KwaZulu-Natal Yes 530
Inkosi Albert Luthuli Central Hospital
(IALCH)
KwaZulu-Natal Yes 846
King Edward VIII Hospital (KEH) KwaZulu-Natal Yes 922
Mahatma Gandhi Hospital (MGH) KwaZulu-Natal No 350
RK Khan Hospital (RKKH) KwaZulu-Natal No 543
Tygerberg Hospital (TH) Western Cape Yes 1310
Groote Schuur Hospital (GSH) Western Cape Yes 893
August 2016_v1
Table 2. Antimicrobial susceptibility testing methods
NHLS Laboratories at Public
Hospitals
MicroScan Vitek 2 Disk diffusion
method
Charlotte Maxeke Johannesburg
Academic Hospital
√ √ √
Chris Hani Baragwanath Hospital √ √
Dr George Mukhari Hospital √
Grey’s Hospital/Northdale Laboratory √
Groote Schuur Hospital √
Helen Joseph Hospital √ √
Inkosi Albert Luthuli Central Hospital √
King Edward VIII Hospital √
Mahatma Gandhi Hospital √
Nelson Mandela Academic
Hospital/Mthatha Tertiary
√
Steve Biko Academic Hospital
(SBAH)
√
Frere Hospital √
Livingstone Hospital √
Universitas Hospital (UH) √
RK Khan Hospital (RKKH) √
Tygerberg Hospital (TH) √
Based on NHLS SOPs confirmation MIC for carbapenems resistance is recommended
by Etest at the routine laboratory level.
Results
Antimicrobial susceptibility results are shown as follows:
- Acinetobacter baumannii complex (Figures 1 & 2; Table 3),
- Enterobacter cloacae complex (Figures 3 & 4; table 4),
- Enterococcus faecalis (Figures 5 & 6; table 5),
- Enterococcus faecium (Figure 7 & 8; table 6)
- Escherichia coli (Figure 9 & 10, table 7)
- Klebsiella pneumoniae (Figures 11 & 12; table 8),
- Pseudomonas aeruginosa, (Figures 13 & 14; table 9 ) and
- Staphylococcus aureus (Figure 15 & 16; table 10).
For each organism, the total number of cases, susceptibility to selected antimicrobial agents
with numbers and ratios (susceptible: non-susceptible), and percentages of antimicrobial
susceptibility per site were analysed (Figures 1-16). Data in tables is not shown for sites
where less than 30 isolates were identified.
August 2016_v1
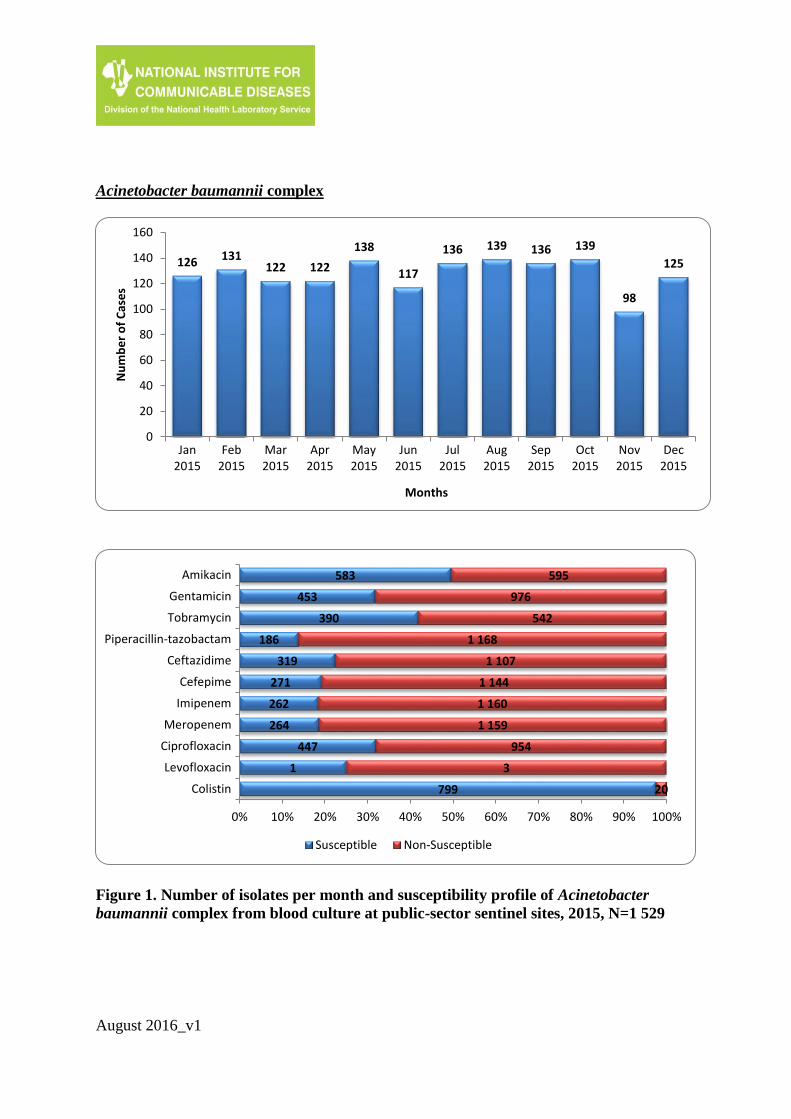
Acinetobacter baumannii complex
Figure 1. Number of isolates per month and susceptibility profile of Acinetobacter
baumannii complex from blood culture at public-sector sentinel sites, 2015, N=1 529
126 131122 122
138
117
136 139 136 139
98
125
0
20
40
60
80
100
120
140
160
Jan2015
Feb2015
Mar2015
Apr2015
May2015
Jun2015
Jul2015
Aug2015
Sep2015
Oct2015
Nov2015
Dec2015
Nu
mb
er
of
Cas
es
Months
583
453
390
186
319
271
262
264
447
1
799
595
976
542
1 168
1 107
1 144
1 160
1 159
954
3
20
0% 10% 20% 30% 40% 50% 60% 70% 80% 90% 100%
Amikacin
Gentamicin
Tobramycin
Piperacillin-tazobactam
Ceftazidime
Cefepime
Imipenem
Meropenem
Ciprofloxacin
Levofloxacin
Colistin
Susceptible Non-Susceptible
August 2016_v1
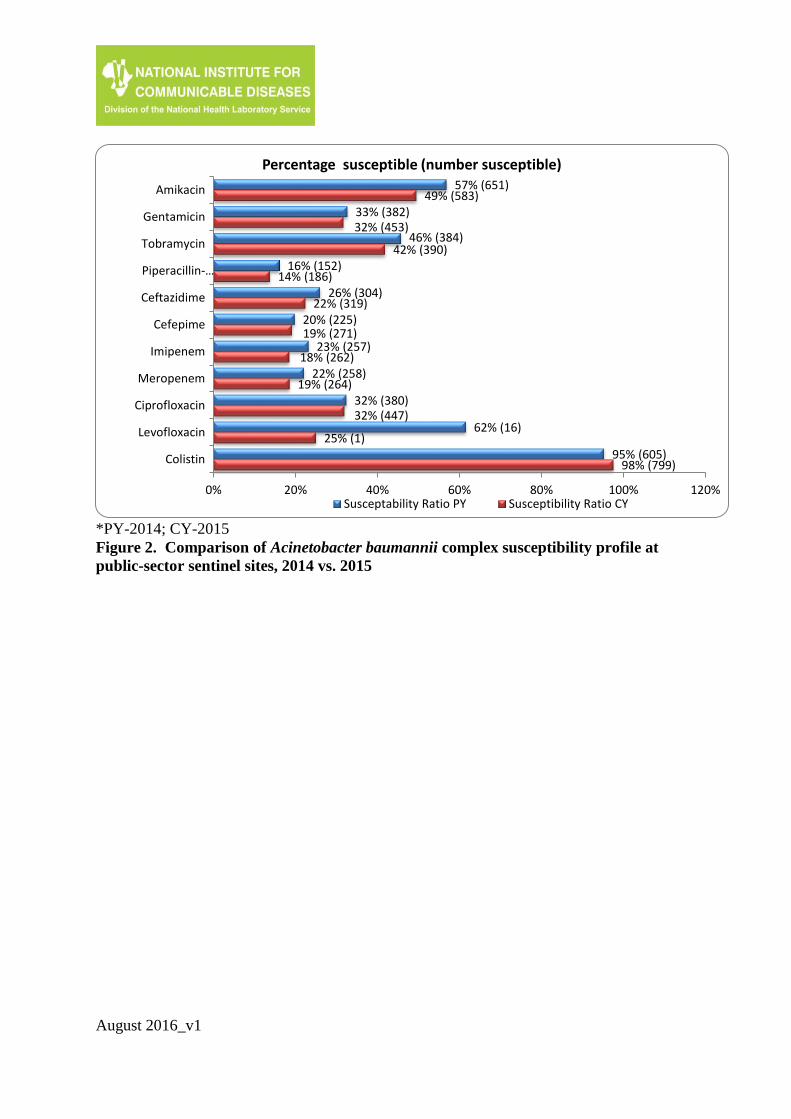
*PY-2014; CY-2015
Figure 2. Comparison of Acinetobacter baumannii complex susceptibility profile at
public-sector sentinel sites, 2014 vs. 2015
57% (651)
33% (382)
46% (384)
16% (152)
26% (304)
20% (225)
23% (257)
22% (258)
32% (380)
62% (16)
95% (605)
49% (583)
32% (453)
42% (390)
14% (186)
22% (319)
19% (271)
18% (262)
19% (264)
32% (447)
25% (1)
98% (799)
0% 20% 40% 60% 80% 100% 120%
Amikacin
Gentamicin
Tobramycin
Piperacillin-…
Ceftazidime
Cefepime
Imipenem
Meropenem
Ciprofloxacin
Levofloxacin
Colistin
Percentage susceptible (number susceptible)
Susceptability Ratio PY Susceptibility Ratio CY
August 2016_v1
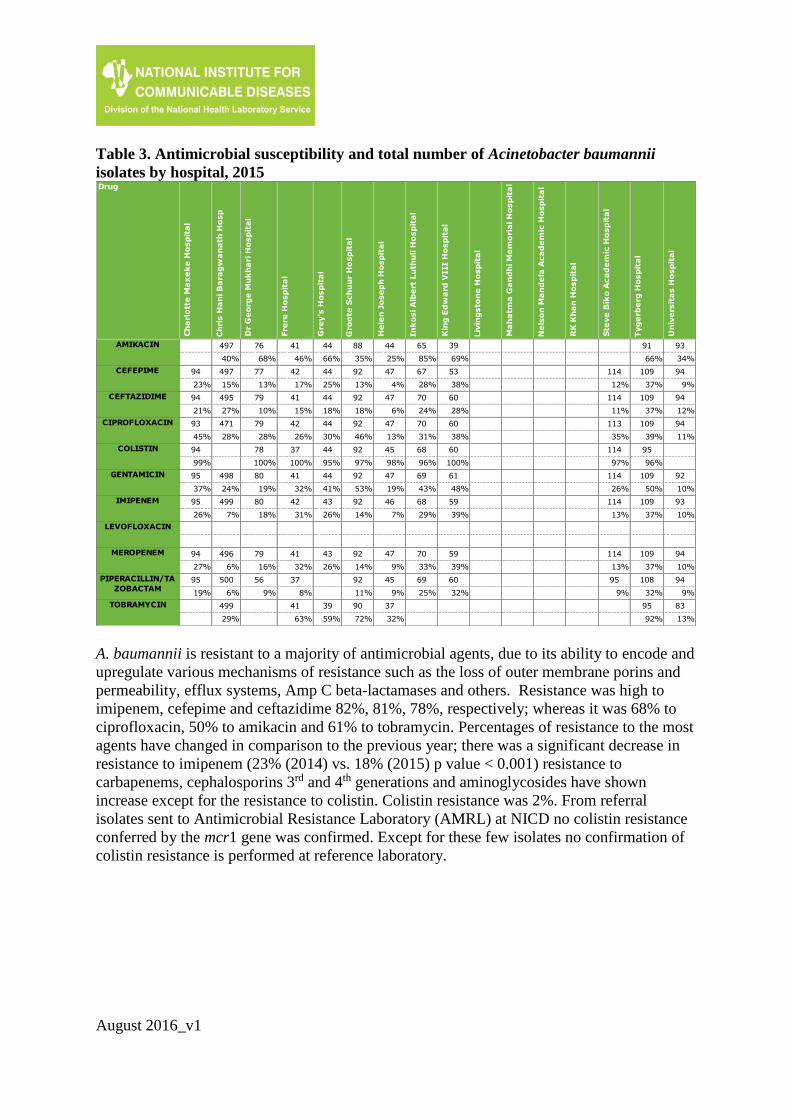
Table 3. Antimicrobial susceptibility and total number of Acinetobacter baumannii
isolates by hospital, 2015
A. baumannii is resistant to a majority of antimicrobial agents, due to its ability to encode and
upregulate various mechanisms of resistance such as the loss of outer membrane porins and
permeability, efflux systems, Amp C beta-lactamases and others. Resistance was high to
imipenem, cefepime and ceftazidime 82%, 81%, 78%, respectively; whereas it was 68% to
ciprofloxacin, 50% to amikacin and 61% to tobramycin. Percentages of resistance to the most
agents have changed in comparison to the previous year; there was a significant decrease in
resistance to imipenem (23% (2014) vs. 18% (2015) p value < 0.001) resistance to
carbapenems, cephalosporins 3rd and 4th generations and aminoglycosides have shown
increase except for the resistance to colistin. Colistin resistance was 2%. From referral
isolates sent to Antimicrobial Resistance Laboratory (AMRL) at NICD no colistin resistance
conferred by the mcr1 gene was confirmed. Except for these few isolates no confirmation of
colistin resistance is performed at reference laboratory.
Ch
ris H
an
i B
ara
gw
an
ath
Ho
sp
Gro
ote
Sch
uu
r H
osp
ita
l
In
ko
si A
lbe
rt L
uth
uli H
osp
ita
l
Liv
ing
sto
ne
Ho
sp
ita
l
Ne
lso
n M
an
de
la A
ca
de
mic
Ho
sp
ita
l
Tyg
erb
erg
Ho
sp
ita
l
497 88 65 91
40% 35% 85% 66%
497 92 67 109
15% 13% 28% 37%
495 92 70 109
27% 18% 24% 37%
471 92 70 109
28% 46% 31% 39%
92 68 95
97% 96% 96%
498 92 69 109
24% 53% 43% 50%
499 92 68 109
7% 14% 29% 37%
496 92 70 109
6% 14% 33% 37%
500 92 69 108
6% 11% 25% 32%
499 90 95
29% 72% 92%
DrugC
ha
rlo
tte
Ma
xe
ke
Ho
sp
ita
l
Dr
Ge
org
e M
uk
ha
ri H
osp
ita
l
Fre
re H
osp
ita
l
Gre
y's
Ho
sp
ita
l
He
len
Jo
se
ph
Ho
sp
ita
l
Kin
g E
dw
ard
VIII H
osp
ita
l
Ma
ha
tma
Ga
nd
hi M
em
ori
al H
osp
ita
l
RK
Kh
an
Ho
sp
ita
l
Ste
ve
Bik
o A
ca
de
mic
Ho
sp
ita
l
Un
ive
rsit
as H
osp
ita
l
AMIKACIN 76 41 44 44 39 93
68% 46% 66% 25% 69% 34%
CEFEPIME 94 77 42 44 47 53 114 94
23% 13% 17% 25% 4% 38% 12% 9%
CEFTAZIDIME 94 79 41 44 47 60 114 94
21% 10% 15% 18% 6% 28% 11% 12%
CIPROFLOXACIN 93 79 42 44 47 60 113 94
45% 28% 26% 30% 13% 38% 35% 11%
COLISTIN 94 78 37 44 45 60 114
99% 100% 100% 95% 98% 100% 97%
GENTAMICIN 95 80 41 44 47 61 114 92
37% 19% 32% 41% 19% 48% 26% 10%
IMIPENEM 95 80 42 43 46 59 114 93
26% 18% 31% 26% 7% 39% 13% 10%
LEVOFLOXACIN
MEROPENEM 94 79 41 43 47 59 114 94
27% 16% 32% 26% 9% 39% 13% 10%
PIPERACILLIN/TA
ZOBACTAM95 56 37 45 60 95 94
19% 9% 8% 9% 32% 9% 9%
TOBRAMYCIN 41 39 37 83
63% 59% 32% 13%
August 2016_v1
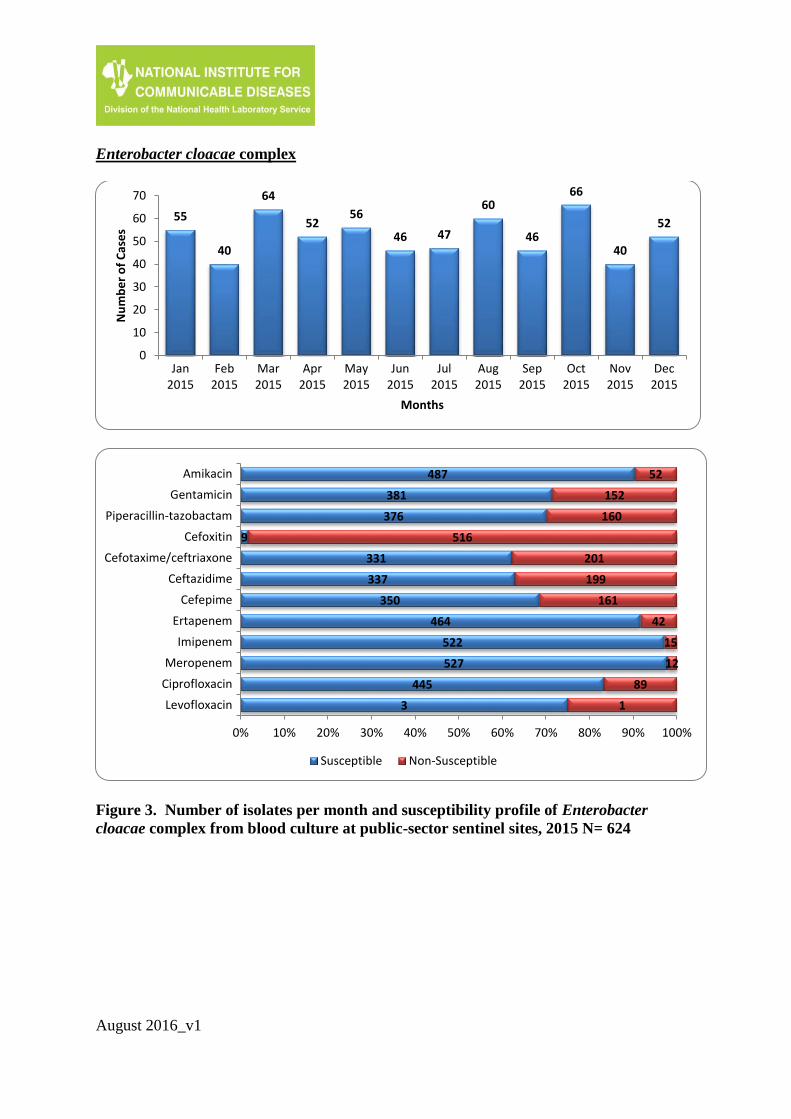
Enterobacter cloacae complex
Figure 3. Number of isolates per month and susceptibility profile of Enterobacter
cloacae complex from blood culture at public-sector sentinel sites, 2015 N= 624
55
40
64
5256
46 47
60
46
66
40
52
0
10
20
30
40
50
60
70
Jan2015
Feb2015
Mar2015
Apr2015
May2015
Jun2015
Jul2015
Aug2015
Sep2015
Oct2015
Nov2015
Dec2015
Nu
mb
er
of
Cas
es
Months
487
381
376
9
331
337
350
464
522
527
445
3
52
152
160
516
201
199
161
42
15
12
89
1
0% 10% 20% 30% 40% 50% 60% 70% 80% 90% 100%
Amikacin
Gentamicin
Piperacillin-tazobactam
Cefoxitin
Cefotaxime/ceftriaxone
Ceftazidime
Cefepime
Ertapenem
Imipenem
Meropenem
Ciprofloxacin
Levofloxacin
Susceptible Non-Susceptible
August 2016_v1
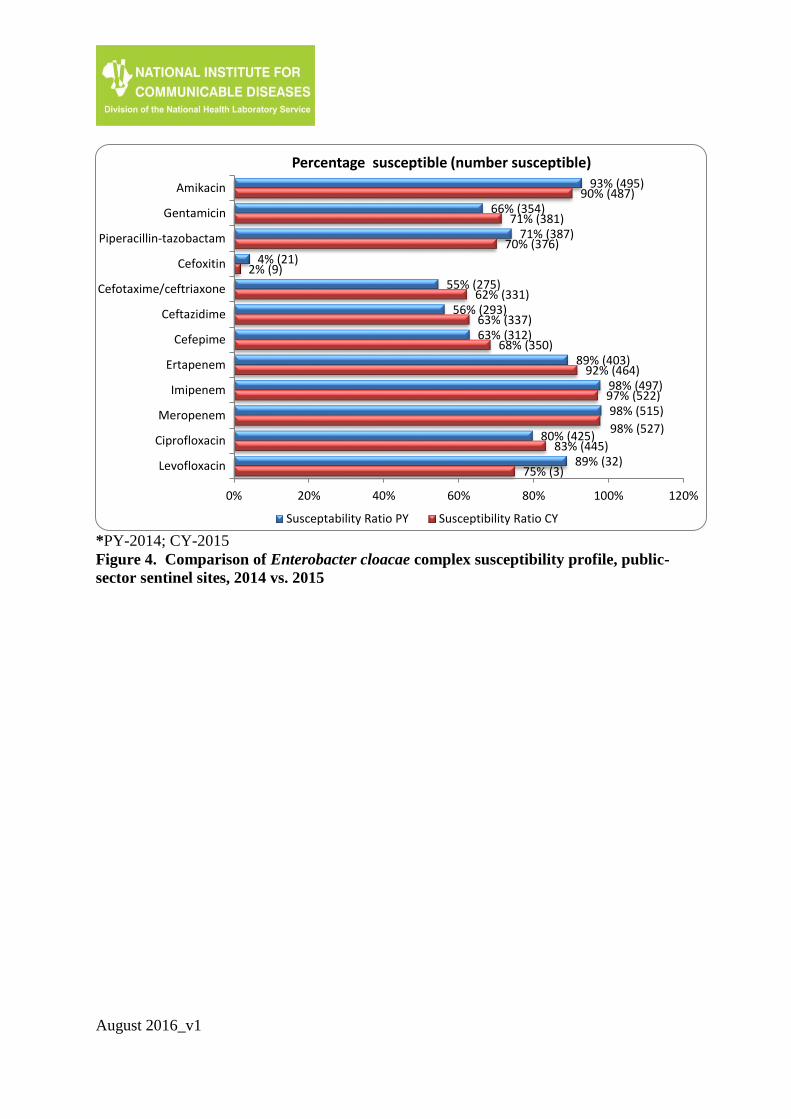
*PY-2014; CY-2015
Figure 4. Comparison of Enterobacter cloacae complex susceptibility profile, public-
sector sentinel sites, 2014 vs. 2015
93% (495)
66% (354)
71% (387)
4% (21)
55% (275)
56% (293)
63% (312)
89% (403)
98% (497)
98% (515)
80% (425)
89% (32)
90% (487)
71% (381)
70% (376)
2% (9)
62% (331)
63% (337)
68% (350)
92% (464)
97% (522)
98% (527)
83% (445)
75% (3)
0% 20% 40% 60% 80% 100% 120%
Amikacin
Gentamicin
Piperacillin-tazobactam
Cefoxitin
Cefotaxime/ceftriaxone
Ceftazidime
Cefepime
Ertapenem
Imipenem
Meropenem
Ciprofloxacin
Levofloxacin
Percentage susceptible (number susceptible)
Susceptability Ratio PY Susceptibility Ratio CY
August 2016_v1
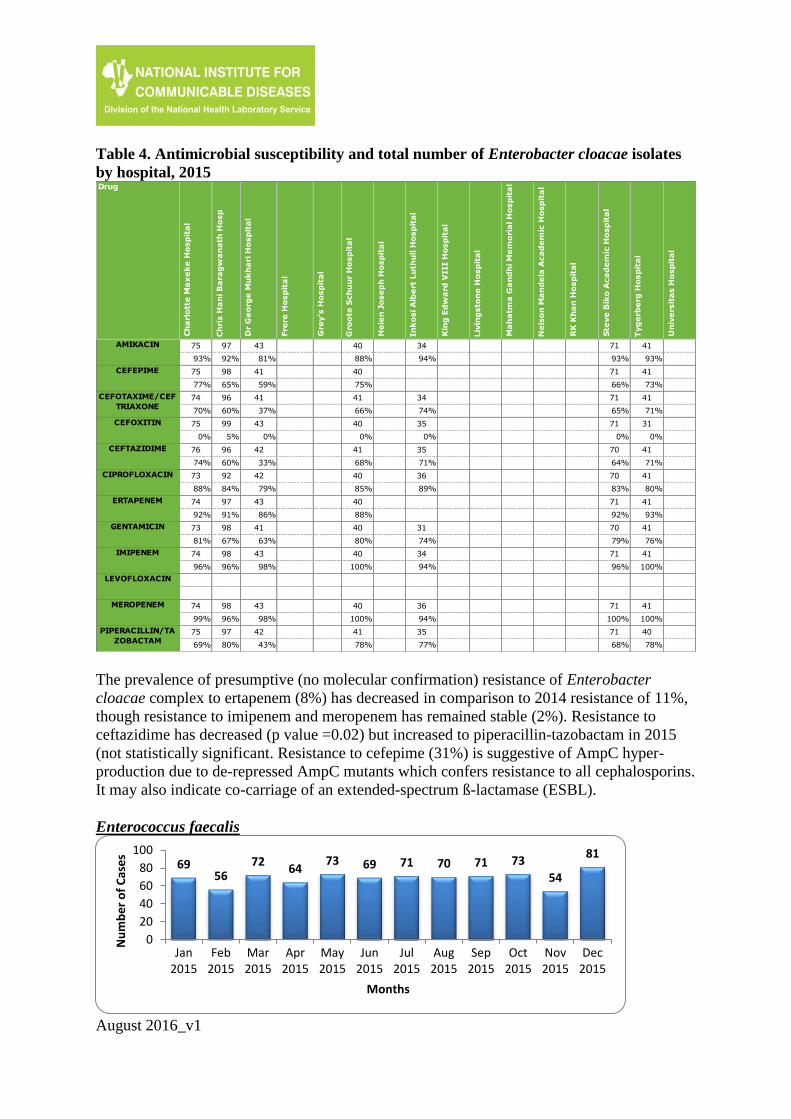
Table 4. Antimicrobial susceptibility and total number of Enterobacter cloacae isolates
by hospital, 2015
The prevalence of presumptive (no molecular confirmation) resistance of Enterobacter
cloacae complex to ertapenem (8%) has decreased in comparison to 2014 resistance of 11%,
though resistance to imipenem and meropenem has remained stable (2%). Resistance to
ceftazidime has decreased (p value =0.02) but increased to piperacillin-tazobactam in 2015
(not statistically significant. Resistance to cefepime (31%) is suggestive of AmpC hyper-
production due to de-repressed AmpC mutants which confers resistance to all cephalosporins.
It may also indicate co-carriage of an extended-spectrum ß-lactamase (ESBL).
Enterococcus faecalis
Ch
ris H
an
i B
ara
gw
an
ath
Ho
sp
Gro
ote
Sch
uu
r H
osp
ita
l
In
ko
si A
lbe
rt L
uth
uli H
osp
ita
l
Liv
ing
sto
ne
Ho
sp
ita
l
Ne
lso
n M
an
de
la A
ca
de
mic
Ho
sp
ita
l
Tyg
erb
erg
Ho
sp
ita
l
97 40 34 41
92% 88% 94% 93%
98 40 41
65% 75% 73%
96 41 34 41
60% 66% 74% 71%
99 40 35 31
5% 0% 0% 0%
96 41 35 41
60% 68% 71% 71%
92 40 36 41
84% 85% 89% 80%
97 40 41
91% 88% 93%
98 40 31 41
67% 80% 74% 76%
98 40 34 41
96% 100% 94% 100%
98 40 36 41
96% 100% 94% 100%
97 41 35 40
80% 78% 77% 78%
DrugC
ha
rlo
tte
Ma
xe
ke
Ho
sp
ita
l
Dr
Ge
org
e M
uk
ha
ri H
osp
ita
l
Fre
re H
osp
ita
l
Gre
y's
Ho
sp
ita
l
He
len
Jo
se
ph
Ho
sp
ita
l
Kin
g E
dw
ard
VIII H
osp
ita
l
Ma
ha
tma
Ga
nd
hi M
em
ori
al H
osp
ita
l
RK
Kh
an
Ho
sp
ita
l
Ste
ve
Bik
o A
ca
de
mic
Ho
sp
ita
l
Un
ive
rsit
as H
osp
ita
l
AMIKACIN 75 43 71
93% 81% 93%
CEFEPIME 75 41 71
77% 59% 66%
CEFOTAXIME/CEF
TRIAXONE74 41 71
70% 37% 65%
CEFOXITIN 75 43 71
0% 0% 0%
CEFTAZIDIME 76 42 70
74% 33% 64%
CIPROFLOXACIN 73 42 70
88% 79% 83%
ERTAPENEM 74 43 71
92% 86% 92%
GENTAMICIN 73 41 70
81% 63% 79%
IMIPENEM 74 43 71
96% 98% 96%
LEVOFLOXACIN
MEROPENEM 74 43 71
99% 98% 100%
PIPERACILLIN/TA
ZOBACTAM75 42 71
69% 43% 68%
6956
7264
73 69 71 70 71 73
54
81
0
20
40
60
80
100
Jan2015
Feb2015
Mar2015
Apr2015
May2015
Jun2015
Jul2015
Aug2015
Sep2015
Oct2015
Nov2015
Dec2015
Nu
mb
er
of
Cas
es
Months
August 2016_v1
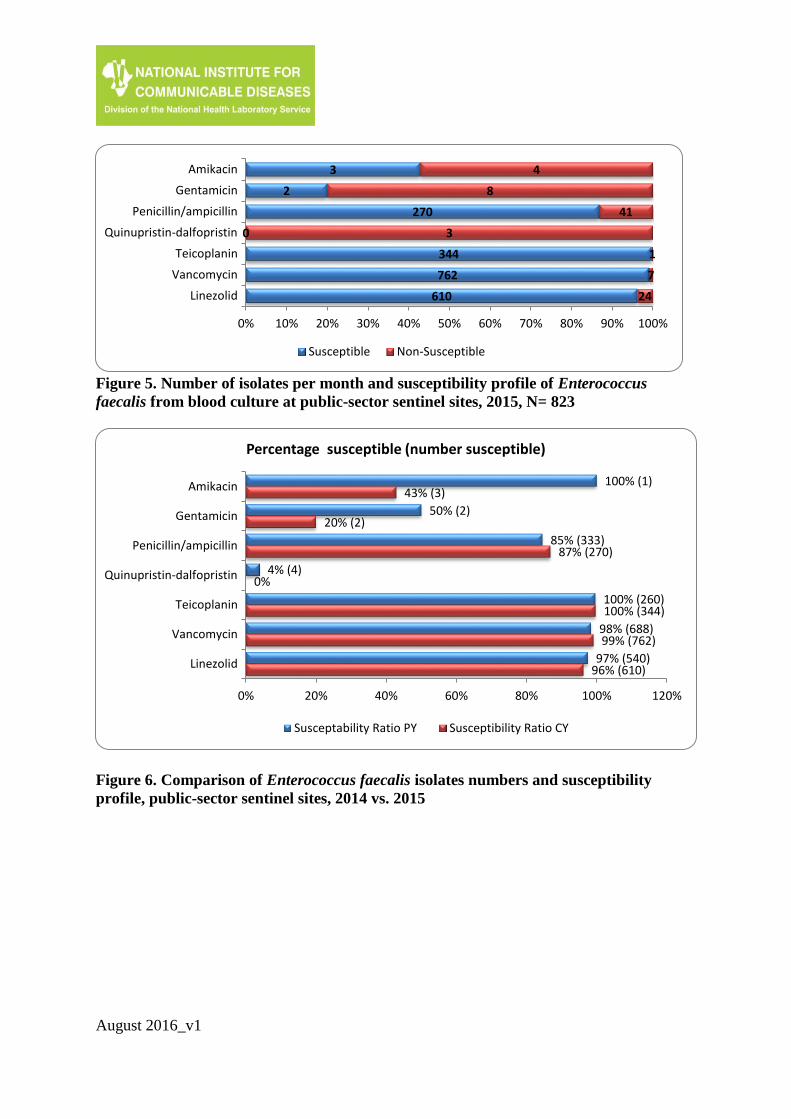
Figure 5. Number of isolates per month and susceptibility profile of Enterococcus
faecalis from blood culture at public-sector sentinel sites, 2015, N= 823
Figure 6. Comparison of Enterococcus faecalis isolates numbers and susceptibility
profile, public-sector sentinel sites, 2014 vs. 2015
3
2
270
0
344
762
610
4
8
41
3
1
7
24
0% 10% 20% 30% 40% 50% 60% 70% 80% 90% 100%
Amikacin
Gentamicin
Penicillin/ampicillin
Quinupristin-dalfopristin
Teicoplanin
Vancomycin
Linezolid
Susceptible Non-Susceptible
100% (1)
50% (2)
85% (333)
4% (4)
100% (260)
98% (688)
97% (540)
43% (3)
20% (2)
87% (270)
0%
100% (344)
99% (762)
96% (610)
0% 20% 40% 60% 80% 100% 120%
Amikacin
Gentamicin
Penicillin/ampicillin
Quinupristin-dalfopristin
Teicoplanin
Vancomycin
Linezolid
Percentage susceptible (number susceptible)
Susceptability Ratio PY Susceptibility Ratio CY
August 2016_v1
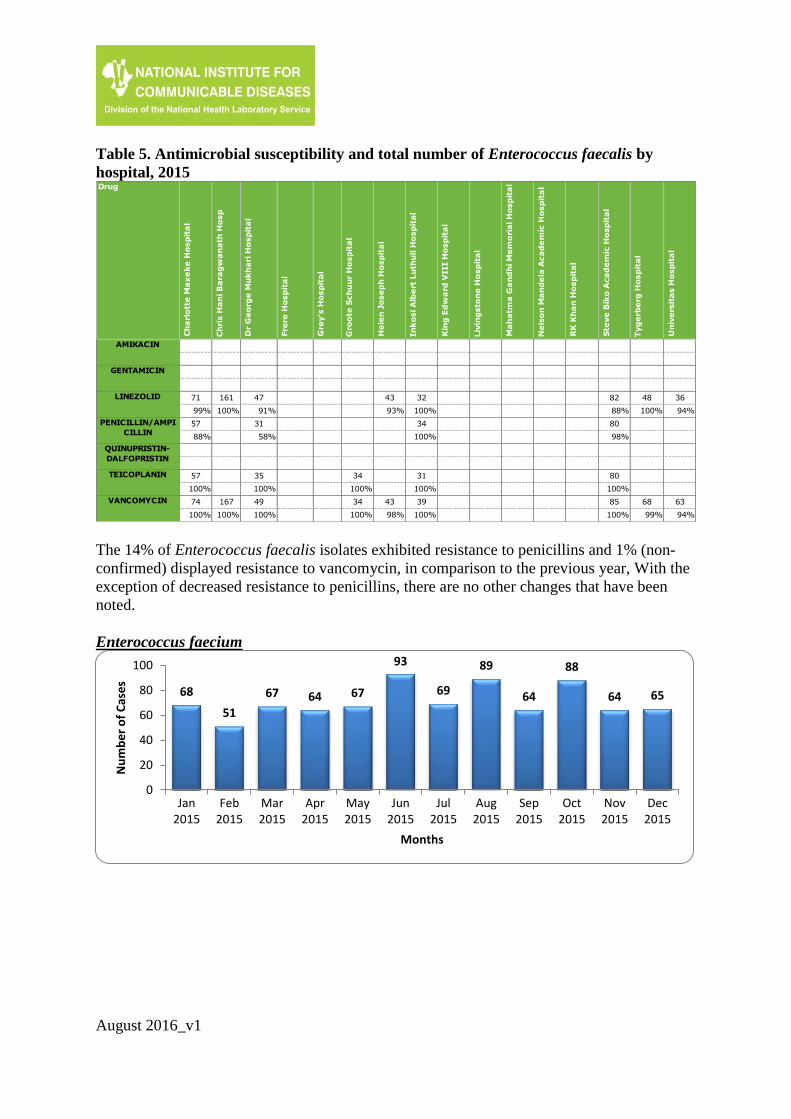
Table 5. Antimicrobial susceptibility and total number of Enterococcus faecalis by
hospital, 2015
The 14% of Enterococcus faecalis isolates exhibited resistance to penicillins and 1% (non-
confirmed) displayed resistance to vancomycin, in comparison to the previous year, With the
exception of decreased resistance to penicillins, there are no other changes that have been
noted.
Enterococcus faecium
Ch
ris H
an
i B
ara
gw
an
ath
Ho
sp
Gro
ote
Sch
uu
r H
osp
ita
l
In
ko
si A
lbe
rt L
uth
uli H
osp
ita
l
Liv
ing
sto
ne
Ho
sp
ita
l
Ne
lso
n M
an
de
la A
ca
de
mic
Ho
sp
ita
l
Tyg
erb
erg
Ho
sp
ita
l
161 32 48
100% 100% 100%
34
100%
34 31
100% 100%
167 34 39 68
100% 100% 100% 99%
DrugC
ha
rlo
tte
Ma
xe
ke
Ho
sp
ita
l
Dr
Ge
org
e M
uk
ha
ri H
osp
ita
l
Fre
re H
osp
ita
l
Gre
y's
Ho
sp
ita
l
He
len
Jo
se
ph
Ho
sp
ita
l
Kin
g E
dw
ard
VIII H
osp
ita
l
Ma
ha
tma
Ga
nd
hi M
em
ori
al H
osp
ita
l
RK
Kh
an
Ho
sp
ita
l
Ste
ve
Bik
o A
ca
de
mic
Ho
sp
ita
l
Un
ive
rsit
as H
osp
ita
l
AMIKACIN
GENTAMICIN
LINEZOLID 71 47 43 82 36
99% 91% 93% 88% 94%
PENICILLIN/AMPI
CILLIN57 31 80
88% 58% 98%
QUINUPRISTIN-
DALFOPRISTIN
TEICOPLANIN 57 35 80
100% 100% 100%
VANCOMYCIN 74 49 43 85 63
100% 100% 98% 100% 94%
68
51
67 64 67
93
69
89
64
88
64 65
0
20
40
60
80
100
Jan2015
Feb2015
Mar2015
Apr2015
May2015
Jun2015
Jul2015
Aug2015
Sep2015
Oct2015
Nov2015
Dec2015
Nu
mb
er
of
Cas
es
Months
August 2016_v1
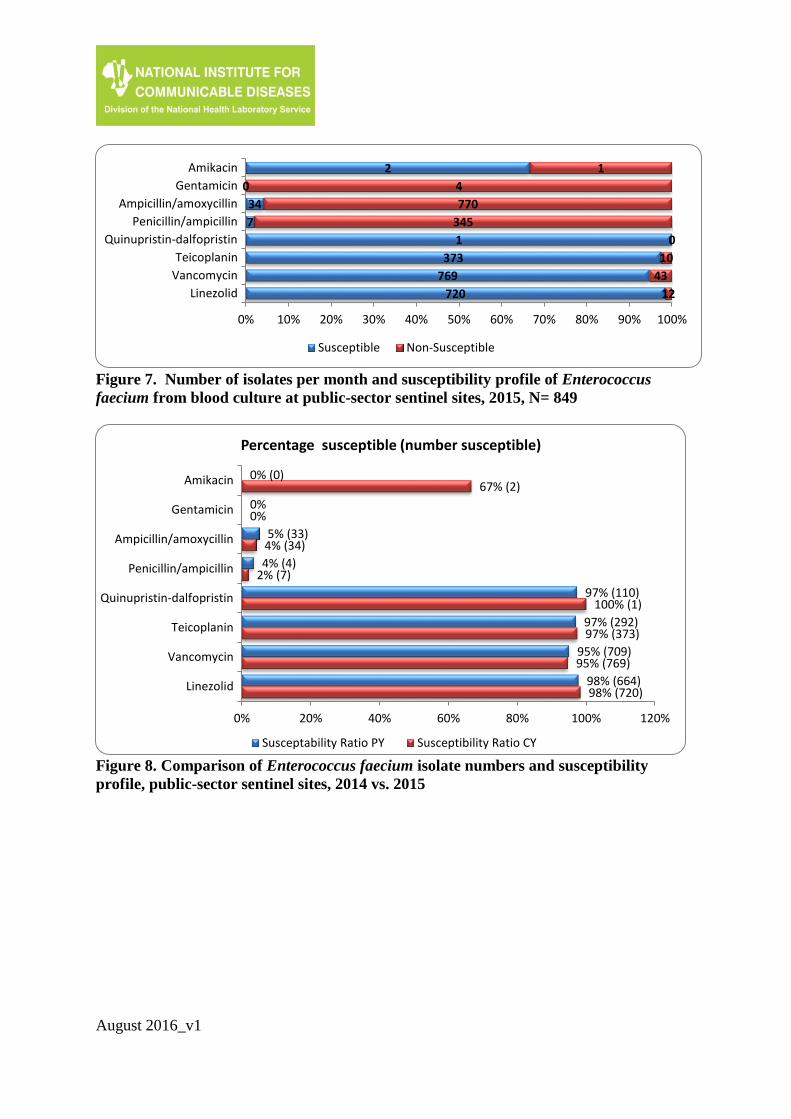
Figure 7. Number of isolates per month and susceptibility profile of Enterococcus
faecium from blood culture at public-sector sentinel sites, 2015, N= 849
Figure 8. Comparison of Enterococcus faecium isolate numbers and susceptibility
profile, public-sector sentinel sites, 2014 vs. 2015
2
0
34
7
1
373
769
720
1
4
770
345
0
10
43
12
0% 10% 20% 30% 40% 50% 60% 70% 80% 90% 100%
Amikacin
Gentamicin
Ampicillin/amoxycillin
Penicillin/ampicillin
Quinupristin-dalfopristin
Teicoplanin
Vancomycin
Linezolid
Susceptible Non-Susceptible
0% (0)
0%
5% (33)
4% (4)
97% (110)
97% (292)
95% (709)
98% (664)
67% (2)
0%
4% (34)
2% (7)
100% (1)
97% (373)
95% (769)
98% (720)
0% 20% 40% 60% 80% 100% 120%
Amikacin
Gentamicin
Ampicillin/amoxycillin
Penicillin/ampicillin
Quinupristin-dalfopristin
Teicoplanin
Vancomycin
Linezolid
Percentage susceptible (number susceptible)
Susceptability Ratio PY Susceptibility Ratio CY
August 2016_v1
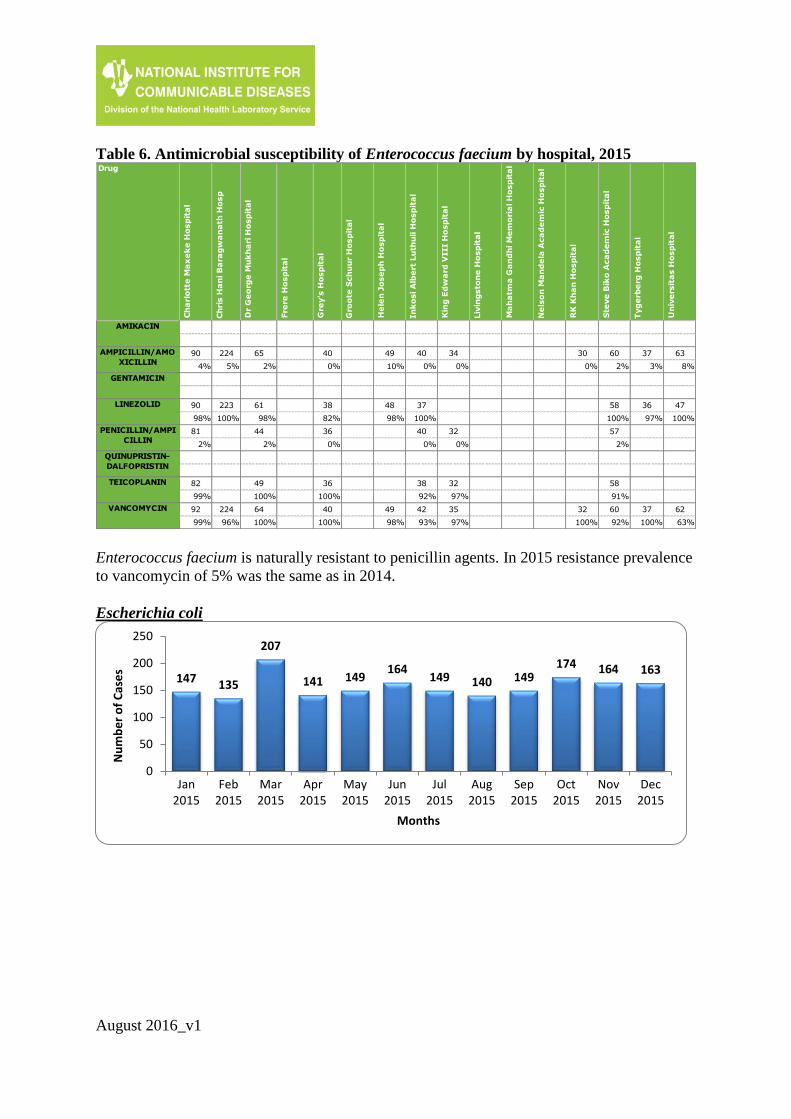
Table 6. Antimicrobial susceptibility of Enterococcus faecium by hospital, 2015
Enterococcus faecium is naturally resistant to penicillin agents. In 2015 resistance prevalence
to vancomycin of 5% was the same as in 2014.
Escherichia coli
Ch
ris H
an
i B
ara
gw
an
ath
Ho
sp
Gro
ote
Sch
uu
r H
osp
ita
l
In
ko
si A
lbe
rt L
uth
uli H
osp
ita
l
Liv
ing
sto
ne
Ho
sp
ita
l
Ne
lso
n M
an
de
la A
ca
de
mic
Ho
sp
ita
l
Tyg
erb
erg
Ho
sp
ita
l
224 40 37
5% 0% 3%
223 37 36
100% 100% 97%
40
0%
38
92%
224 42 37
96% 93% 100%
Drug
Ch
arl
ott
e M
ax
ek
e H
osp
ita
l
Dr
Ge
org
e M
uk
ha
ri H
osp
ita
l
Fre
re H
osp
ita
l
Gre
y's
Ho
sp
ita
l
He
len
Jo
se
ph
Ho
sp
ita
l
Kin
g E
dw
ard
VIII H
osp
ita
l
Ma
ha
tma
Ga
nd
hi M
em
ori
al H
osp
ita
l
RK
Kh
an
Ho
sp
ita
l
Ste
ve
Bik
o A
ca
de
mic
Ho
sp
ita
l
Un
ive
rsit
as H
osp
ita
l
AMIKACIN
AMPICILLIN/AMO
XICILLIN90 65 40 49 34 30 60 63
4% 2% 0% 10% 0% 0% 2% 8%
GENTAMICIN
LINEZOLID 90 61 38 48 58 47
98% 98% 82% 98% 100% 100%
PENICILLIN/AMPI
CILLIN81 44 36 32 57
2% 2% 0% 0% 2%
QUINUPRISTIN-
DALFOPRISTIN
TEICOPLANIN 82 49 36 32 58
99% 100% 100% 97% 91%
VANCOMYCIN 92 64 40 49 35 32 60 62
99% 100% 100% 98% 97% 100% 92% 63%
147 135
207
141 149164
149 140 149174 164 163
0
50
100
150
200
250
Jan2015
Feb2015
Mar2015
Apr2015
May2015
Jun2015
Jul2015
Aug2015
Sep2015
Oct2015
Nov2015
Dec2015
Nu
mb
er
of
Cas
es
Months
August 2016_v1
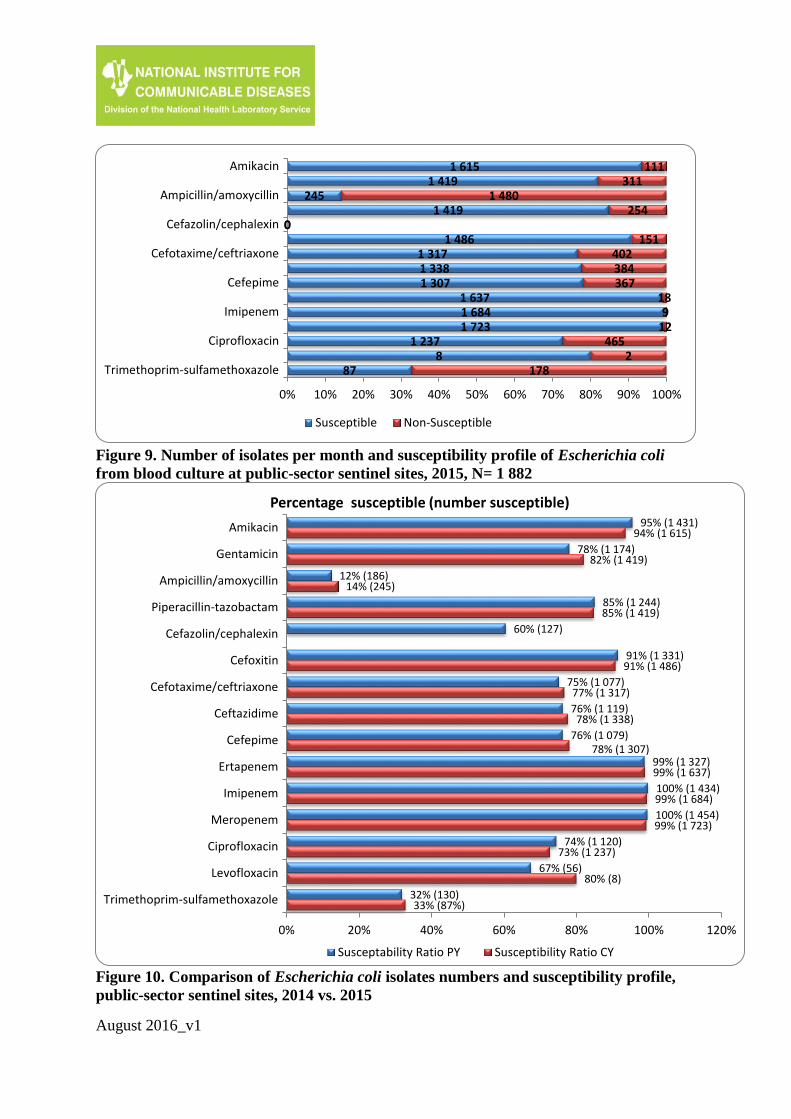
Figure 9. Number of isolates per month and susceptibility profile of Escherichia coli
from blood culture at public-sector sentinel sites, 2015, N= 1 882
Figure 10. Comparison of Escherichia coli isolates numbers and susceptibility profile,
public-sector sentinel sites, 2014 vs. 2015
1 6151 419
2451 419
01 486
1 3171 3381 307
1 6371 6841 723
1 2378
87
111311
1 480254
0151
402384367
189
12465
2178
0% 10% 20% 30% 40% 50% 60% 70% 80% 90% 100%
Amikacin
Ampicillin/amoxycillin
Cefazolin/cephalexin
Cefotaxime/ceftriaxone
Cefepime
Imipenem
Ciprofloxacin
Trimethoprim-sulfamethoxazole
Susceptible Non-Susceptible
95% (1 431)
78% (1 174)
12% (186)
85% (1 244)
60% (127)
91% (1 331)
75% (1 077)
76% (1 119)
76% (1 079)
99% (1 327)
100% (1 434)
100% (1 454)
74% (1 120)
67% (56)
32% (130)
94% (1 615)
82% (1 419)
14% (245)
85% (1 419)
91% (1 486)
77% (1 317)
78% (1 338)
78% (1 307)
99% (1 637)
99% (1 684)
99% (1 723)
73% (1 237)
80% (8)
33% (87%)
0% 20% 40% 60% 80% 100% 120%
Amikacin
Gentamicin
Ampicillin/amoxycillin
Piperacillin-tazobactam
Cefazolin/cephalexin
Cefoxitin
Cefotaxime/ceftriaxone
Ceftazidime
Cefepime
Ertapenem
Imipenem
Meropenem
Ciprofloxacin
Levofloxacin
Trimethoprim-sulfamethoxazole
Percentage susceptible (number susceptible)
Susceptability Ratio PY Susceptibility Ratio CY
August 2016_v1
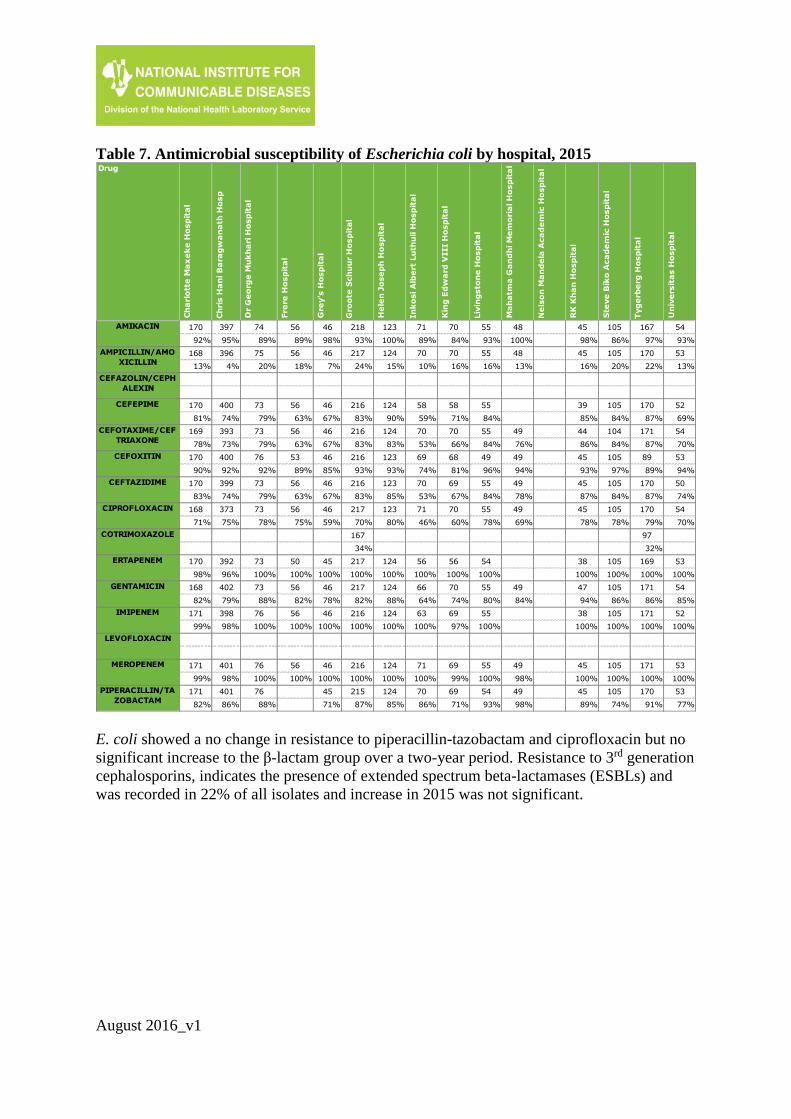
Table 7. Antimicrobial susceptibility of Escherichia coli by hospital, 2015
E. coli showed a no change in resistance to piperacillin-tazobactam and ciprofloxacin but no
significant increase to the β-lactam group over a two-year period. Resistance to 3rd generation
cephalosporins, indicates the presence of extended spectrum beta-lactamases (ESBLs) and
was recorded in 22% of all isolates and increase in 2015 was not significant.
Ch
ris H
an
i B
ara
gw
an
ath
Ho
sp
Gro
ote
Sch
uu
r H
osp
ita
l
In
ko
si A
lbe
rt L
uth
uli H
osp
ita
l
Liv
ing
sto
ne
Ho
sp
ita
l
Ne
lso
n M
an
de
la A
ca
de
mic
Ho
sp
ita
l
Tyg
erb
erg
Ho
sp
ita
l
397 218 71 55 167
95% 93% 89% 93% 97%
396 217 70 55 170
4% 24% 10% 16% 22%
400 216 58 55 170
74% 83% 59% 84% 87%
393 216 70 55 171
73% 83% 53% 84% 87%
400 216 69 49 89
92% 93% 74% 96% 89%
399 216 70 55 170
74% 83% 53% 84% 87%
373 217 71 55 170
75% 70% 46% 78% 79%
167 97
34% 32%
392 217 56 54 169
96% 100% 100% 100% 100%
402 217 66 55 171
79% 82% 64% 80% 86%
398 216 63 55 171
98% 100% 100% 100% 100%
401 216 71 55 171
98% 100% 100% 100% 100%
401 215 70 54 170
86% 87% 86% 93% 91%
Drug
Ch
arl
ott
e M
ax
ek
e H
osp
ita
l
Dr
Ge
org
e M
uk
ha
ri H
osp
ita
l
Fre
re H
osp
ita
l
Gre
y's
Ho
sp
ita
l
He
len
Jo
se
ph
Ho
sp
ita
l
Kin
g E
dw
ard
VIII H
osp
ita
l
Ma
ha
tma
Ga
nd
hi M
em
ori
al H
osp
ita
l
RK
Kh
an
Ho
sp
ita
l
Ste
ve
Bik
o A
ca
de
mic
Ho
sp
ita
l
Un
ive
rsit
as H
osp
ita
l
AMIKACIN 170 74 56 46 123 70 48 45 105 54
92% 89% 89% 98% 100% 84% 100% 98% 86% 93%
AMPICILLIN/AMO
XICILLIN168 75 56 46 124 70 48 45 105 53
13% 20% 18% 7% 15% 16% 13% 16% 20% 13%
CEFAZOLIN/CEPH
ALEXIN
CEFEPIME 170 73 56 46 124 58 39 105 52
81% 79% 63% 67% 90% 71% 85% 84% 69%
CEFOTAXIME/CEF
TRIAXONE169 73 56 46 124 70 49 44 104 54
78% 79% 63% 67% 83% 66% 76% 86% 84% 70%
CEFOXITIN 170 76 53 46 123 68 49 45 105 53
90% 92% 89% 85% 93% 81% 94% 93% 97% 94%
CEFTAZIDIME 170 73 56 46 123 69 49 45 105 50
83% 79% 63% 67% 85% 67% 78% 87% 84% 74%
CIPROFLOXACIN 168 73 56 46 123 70 49 45 105 54
71% 78% 75% 59% 80% 60% 69% 78% 78% 70%
COTRIMOXAZOLE
ERTAPENEM 170 73 50 45 124 56 38 105 53
98% 100% 100% 100% 100% 100% 100% 100% 100%
GENTAMICIN 168 73 56 46 124 70 49 47 105 54
82% 88% 82% 78% 88% 74% 84% 94% 86% 85%
IMIPENEM 171 76 56 46 124 69 38 105 52
99% 100% 100% 100% 100% 97% 100% 100% 100%
LEVOFLOXACIN
MEROPENEM 171 76 56 46 124 69 49 45 105 53
99% 100% 100% 100% 100% 99% 98% 100% 100% 100%
PIPERACILLIN/TA
ZOBACTAM171 76 45 124 69 49 45 105 53
82% 88% 71% 85% 71% 98% 89% 74% 77%
August 2016_v1
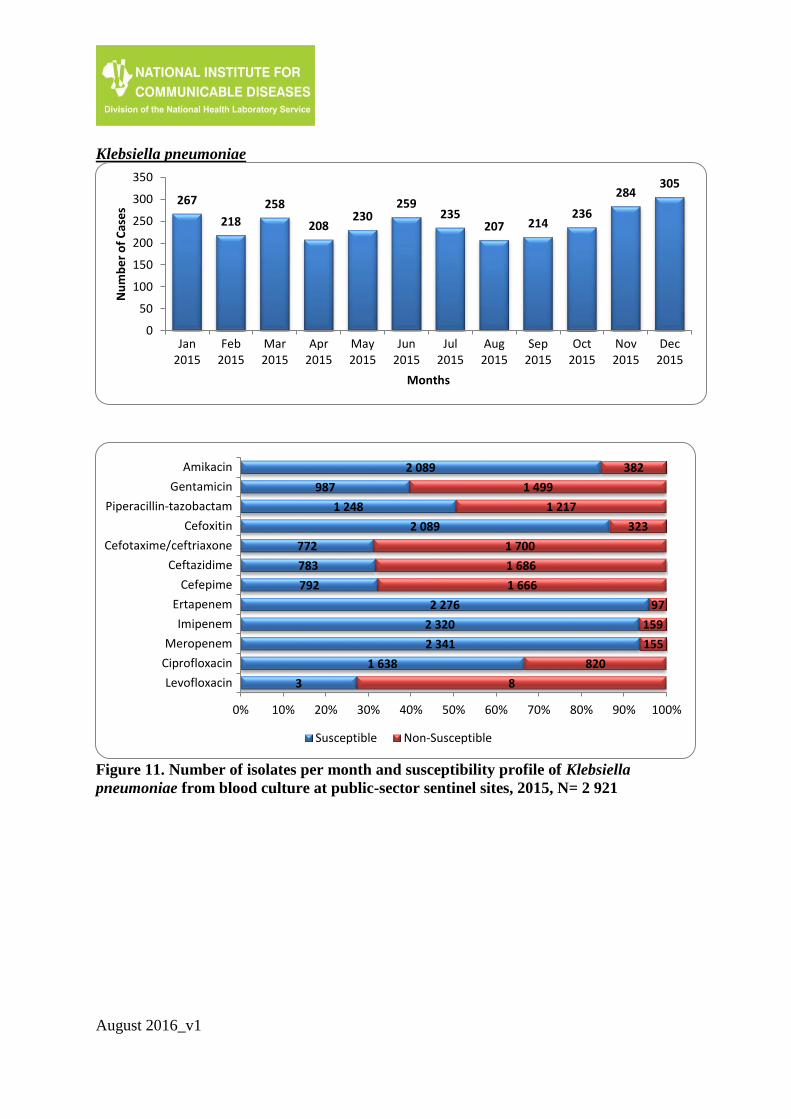
Klebsiella pneumoniae
Figure 11. Number of isolates per month and susceptibility profile of Klebsiella
pneumoniae from blood culture at public-sector sentinel sites, 2015, N= 2 921
267
218
258
208230
259235
207 214236
284305
0
50
100
150
200
250
300
350
Jan2015
Feb2015
Mar2015
Apr2015
May2015
Jun2015
Jul2015
Aug2015
Sep2015
Oct2015
Nov2015
Dec2015
Nu
mb
er
of
Cas
es
Months
2 089
987
1 248
2 089
772
783
792
2 276
2 320
2 341
1 638
3
382
1 499
1 217
323
1 700
1 686
1 666
97
159
155
820
8
0% 10% 20% 30% 40% 50% 60% 70% 80% 90% 100%
Amikacin
Gentamicin
Piperacillin-tazobactam
Cefoxitin
Cefotaxime/ceftriaxone
Ceftazidime
Cefepime
Ertapenem
Imipenem
Meropenem
Ciprofloxacin
Levofloxacin
Susceptible Non-Susceptible
August 2016_v1
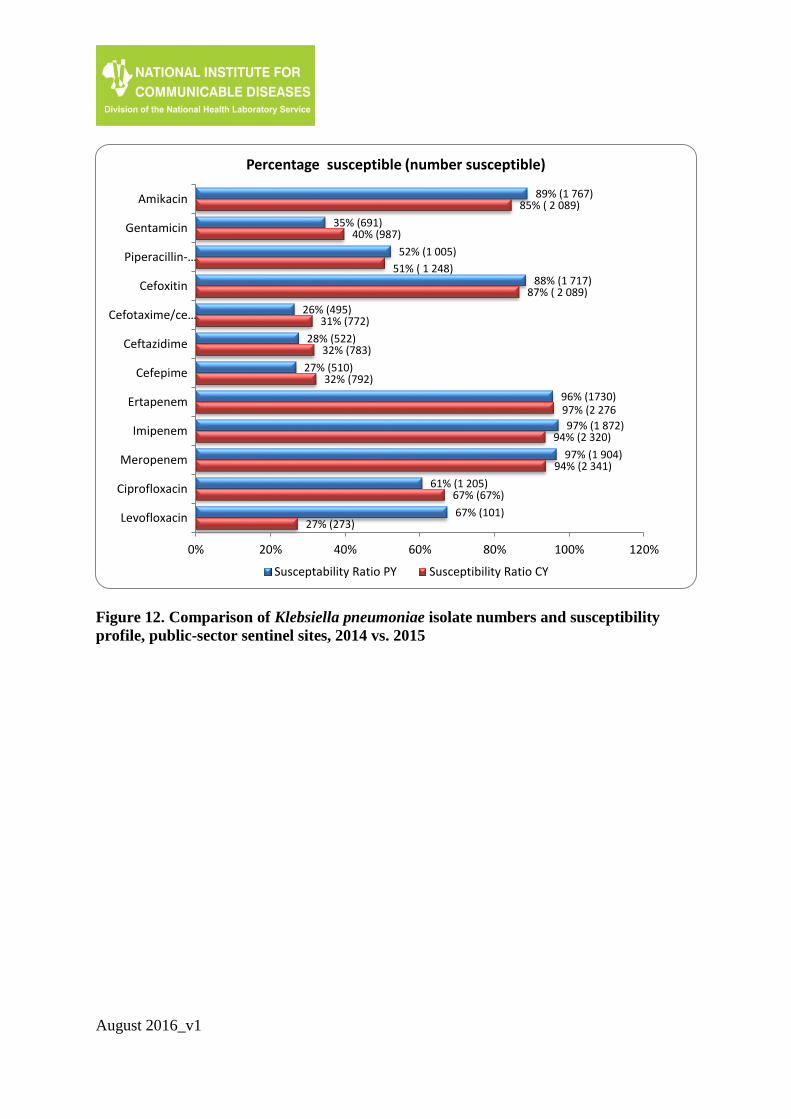
Figure 12. Comparison of Klebsiella pneumoniae isolate numbers and susceptibility
profile, public-sector sentinel sites, 2014 vs. 2015
89% (1 767)
35% (691)
52% (1 005)
88% (1 717)
26% (495)
28% (522)
27% (510)
96% (1730)
97% (1 872)
97% (1 904)
61% (1 205)
67% (101)
85% ( 2 089)
40% (987)
51% ( 1 248)
87% ( 2 089)
31% (772)
32% (783)
32% (792)
97% (2 276
94% (2 320)
94% (2 341)
67% (67%)
27% (273)
0% 20% 40% 60% 80% 100% 120%
Amikacin
Gentamicin
Piperacillin-…
Cefoxitin
Cefotaxime/ce…
Ceftazidime
Cefepime
Ertapenem
Imipenem
Meropenem
Ciprofloxacin
Levofloxacin
Percentage susceptible (number susceptible)
Susceptability Ratio PY Susceptibility Ratio CY
August 2016_v1
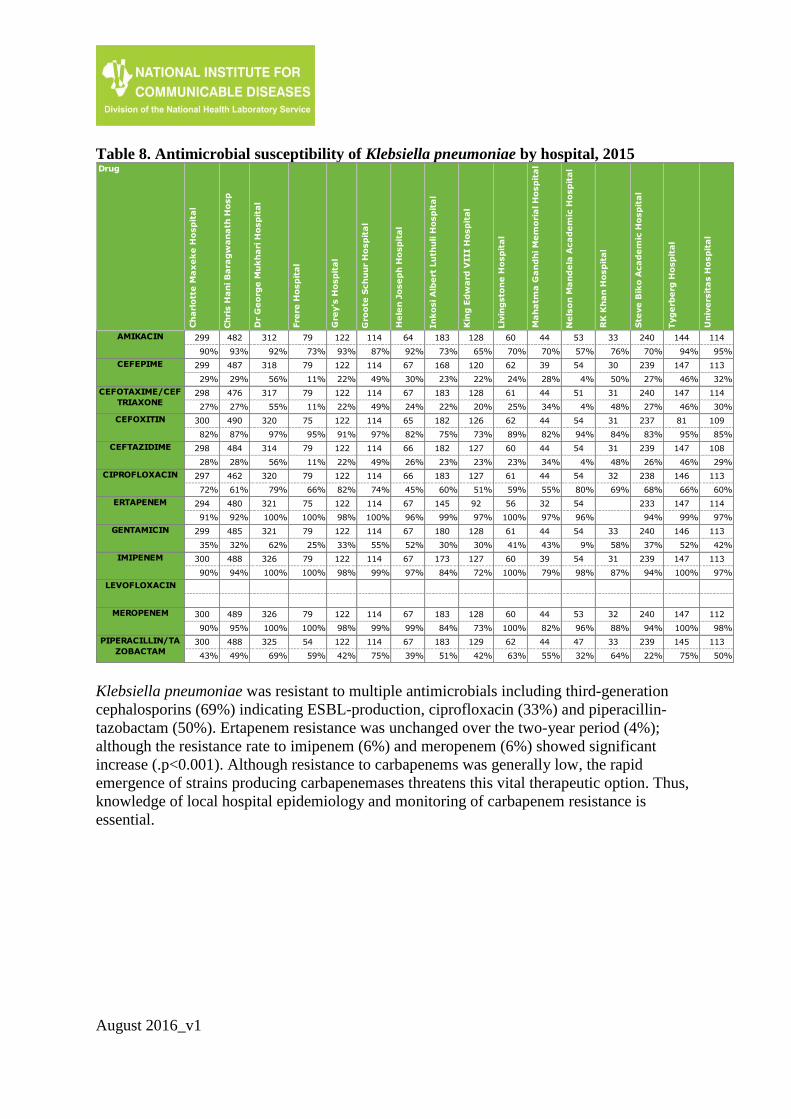
Table 8. Antimicrobial susceptibility of Klebsiella pneumoniae by hospital, 2015
Klebsiella pneumoniae was resistant to multiple antimicrobials including third-generation
cephalosporins (69%) indicating ESBL-production, ciprofloxacin (33%) and piperacillin-
tazobactam (50%). Ertapenem resistance was unchanged over the two-year period (4%);
although the resistance rate to imipenem (6%) and meropenem (6%) showed significant
increase (.p<0.001). Although resistance to carbapenems was generally low, the rapid
emergence of strains producing carbapenemases threatens this vital therapeutic option. Thus,
knowledge of local hospital epidemiology and monitoring of carbapenem resistance is
essential.
Ch
ris H
an
i B
ara
gw
an
ath
Ho
sp
Gro
ote
Sch
uu
r H
osp
ita
l
In
ko
si A
lbe
rt L
uth
uli H
osp
ita
l
Liv
ing
sto
ne
Ho
sp
ita
l
Ne
lso
n M
an
de
la A
ca
de
mic
Ho
sp
ita
l
Tyg
erb
erg
Ho
sp
ita
l
482 114 183 60 53 144
93% 87% 73% 70% 57% 94%
487 114 168 62 54 147
29% 49% 23% 24% 4% 46%
476 114 183 61 51 147
27% 49% 22% 25% 4% 46%
490 114 182 62 54 81
87% 97% 75% 89% 94% 95%
484 114 182 60 54 147
28% 49% 23% 23% 4% 46%
462 114 183 61 54 146
61% 74% 60% 59% 80% 66%
480 114 145 56 54 147
92% 100% 99% 100% 96% 99%
485 114 180 61 54 146
32% 55% 30% 41% 9% 52%
488 114 173 60 54 147
94% 99% 84% 100% 98% 100%
489 114 183 60 53 147
95% 99% 84% 100% 96% 100%
488 114 183 62 47 145
49% 75% 51% 63% 32% 75%
Drug
Ch
arl
ott
e M
ax
ek
e H
osp
ita
l
Dr
Ge
org
e M
uk
ha
ri H
osp
ita
l
Fre
re H
osp
ita
l
Gre
y's
Ho
sp
ita
l
He
len
Jo
se
ph
Ho
sp
ita
l
Kin
g E
dw
ard
VIII H
osp
ita
l
Ma
ha
tma
Ga
nd
hi M
em
ori
al H
osp
ita
l
RK
Kh
an
Ho
sp
ita
l
Ste
ve
Bik
o A
ca
de
mic
Ho
sp
ita
l
Un
ive
rsit
as H
osp
ita
l
AMIKACIN 299 312 79 122 64 128 44 33 240 114
90% 92% 73% 93% 92% 65% 70% 76% 70% 95%
CEFEPIME 299 318 79 122 67 120 39 30 239 113
29% 56% 11% 22% 30% 22% 28% 50% 27% 32%
CEFOTAXIME/CEF
TRIAXONE298 317 79 122 67 128 44 31 240 114
27% 55% 11% 22% 24% 20% 34% 48% 27% 30%
CEFOXITIN 300 320 75 122 65 126 44 31 237 109
82% 97% 95% 91% 82% 73% 82% 84% 83% 85%
CEFTAZIDIME 298 314 79 122 66 127 44 31 239 108
28% 56% 11% 22% 26% 23% 34% 48% 26% 29%
CIPROFLOXACIN 297 320 79 122 66 127 44 32 238 113
72% 79% 66% 82% 45% 51% 55% 69% 68% 60%
ERTAPENEM 294 321 75 122 67 92 32 233 114
91% 100% 100% 98% 96% 97% 97% 94% 97%
GENTAMICIN 299 321 79 122 67 128 44 33 240 113
35% 62% 25% 33% 52% 30% 43% 58% 37% 42%
IMIPENEM 300 326 79 122 67 127 39 31 239 113
90% 100% 100% 98% 97% 72% 79% 87% 94% 97%
LEVOFLOXACIN
MEROPENEM 300 326 79 122 67 128 44 32 240 112
90% 100% 100% 98% 99% 73% 82% 88% 94% 98%
PIPERACILLIN/TA
ZOBACTAM300 325 54 122 67 129 44 33 239 113
43% 69% 59% 42% 39% 42% 55% 64% 22% 50%
August 2016_v1
Pseudomonas aeruginosa
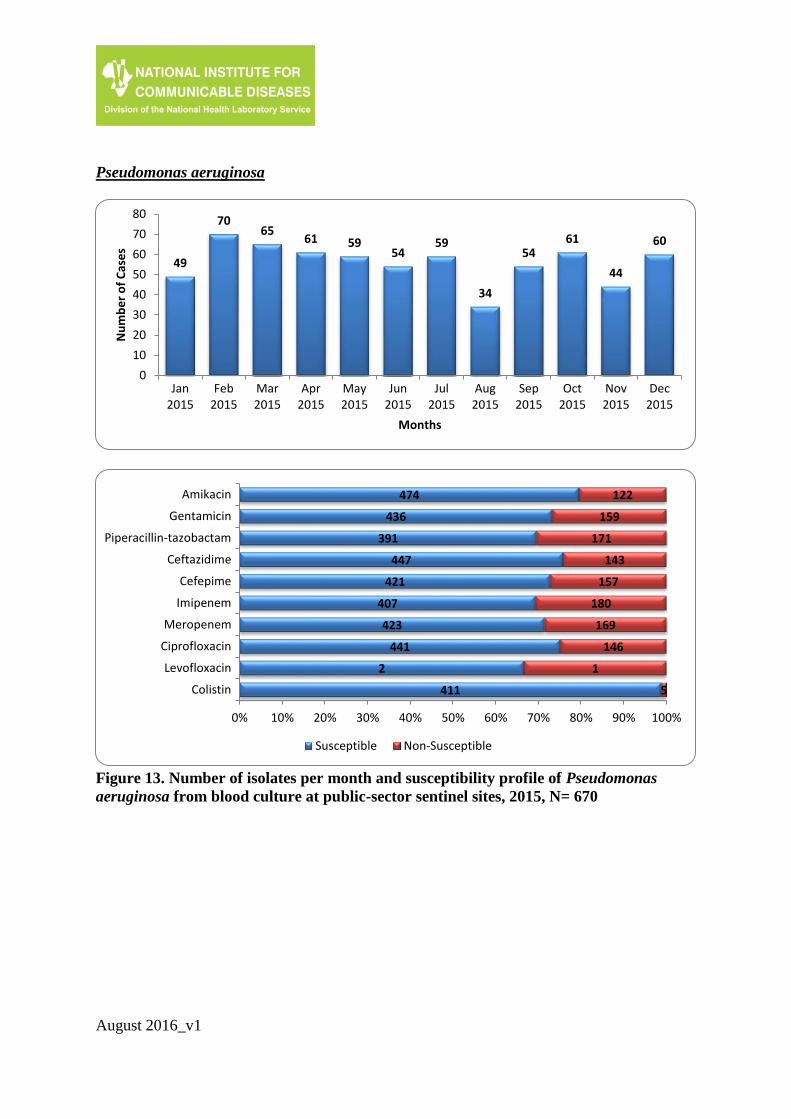
Figure 13. Number of isolates per month and susceptibility profile of Pseudomonas
aeruginosa from blood culture at public-sector sentinel sites, 2015, N= 670
49
7065
61 5954
59
34
5461
44
60
0
10
20
30
40
50
60
70
80
Jan2015
Feb2015
Mar2015
Apr2015
May2015
Jun2015
Jul2015
Aug2015
Sep2015
Oct2015
Nov2015
Dec2015
Nu
mb
er
of
Cas
es
Months
474
436
391
447
421
407
423
441
2
411
122
159
171
143
157
180
169
146
1
5
0% 10% 20% 30% 40% 50% 60% 70% 80% 90% 100%
Amikacin
Gentamicin
Piperacillin-tazobactam
Ceftazidime
Cefepime
Imipenem
Meropenem
Ciprofloxacin
Levofloxacin
Colistin
Susceptible Non-Susceptible
August 2016_v1
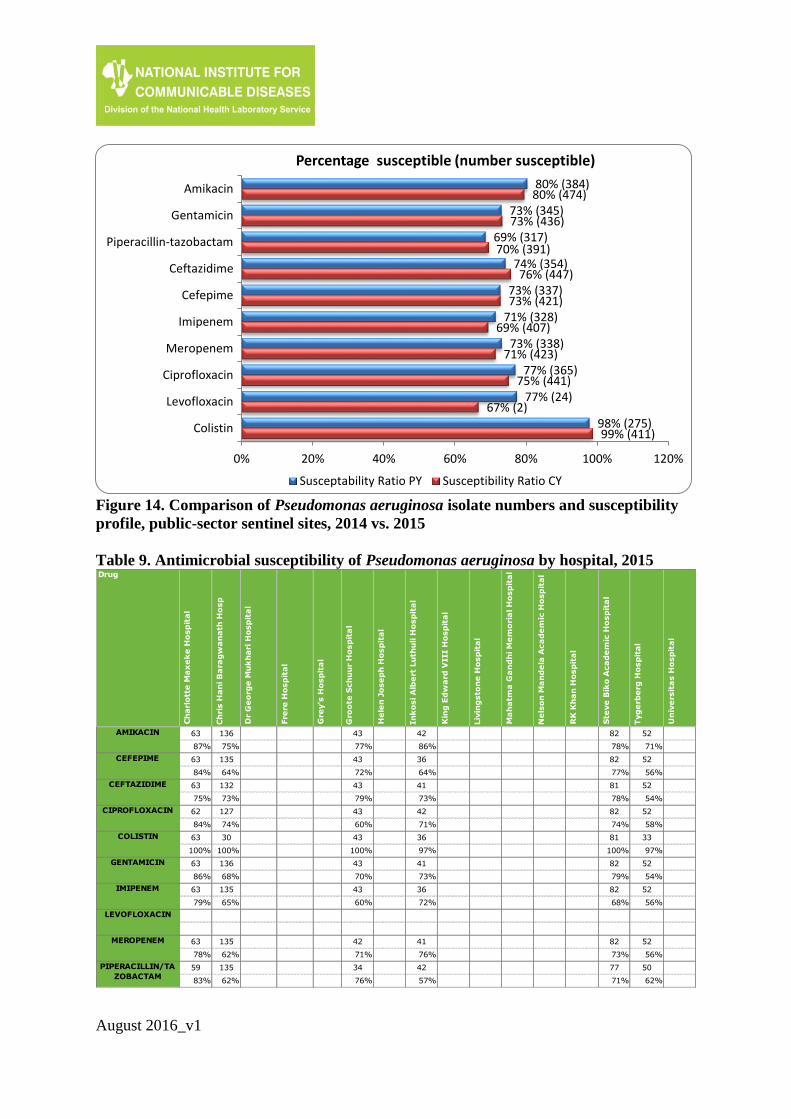
Figure 14. Comparison of Pseudomonas aeruginosa isolate numbers and susceptibility
profile, public-sector sentinel sites, 2014 vs. 2015
Table 9. Antimicrobial susceptibility of Pseudomonas aeruginosa by hospital, 2015
80% (384)
73% (345)
69% (317)
74% (354)
73% (337)
71% (328)
73% (338)
77% (365)
77% (24)
98% (275)
80% (474)
73% (436)
70% (391)
76% (447)
73% (421)
69% (407)
71% (423)
75% (441)
67% (2)
99% (411)
0% 20% 40% 60% 80% 100% 120%
Amikacin
Gentamicin
Piperacillin-tazobactam
Ceftazidime
Cefepime
Imipenem
Meropenem
Ciprofloxacin
Levofloxacin
Colistin
Percentage susceptible (number susceptible)
Susceptability Ratio PY Susceptibility Ratio CY
Ch
ris H
an
i B
ara
gw
an
ath
Ho
sp
Gro
ote
Sch
uu
r H
osp
ita
l
In
ko
si A
lbe
rt L
uth
uli H
osp
ita
l
Liv
ing
sto
ne
Ho
sp
ita
l
Ne
lso
n M
an
de
la A
ca
de
mic
Ho
sp
ita
l
Tyg
erb
erg
Ho
sp
ita
l
136 43 42 52
75% 77% 86% 71%
135 43 36 52
64% 72% 64% 56%
132 43 41 52
73% 79% 73% 54%
127 43 42 52
74% 60% 71% 58%
30 43 36 33
100% 100% 97% 97%
136 43 41 52
68% 70% 73% 54%
135 43 36 52
65% 60% 72% 56%
135 42 41 52
62% 71% 76% 56%
135 34 42 50
62% 76% 57% 62%
Drug
Ch
arl
ott
e M
ax
ek
e H
osp
ita
l
Dr
Ge
org
e M
uk
ha
ri H
osp
ita
l
Fre
re H
osp
ita
l
Gre
y's
Ho
sp
ita
l
He
len
Jo
se
ph
Ho
sp
ita
l
Kin
g E
dw
ard
VIII H
osp
ita
l
Ma
ha
tma
Ga
nd
hi M
em
ori
al H
osp
ita
l
RK
Kh
an
Ho
sp
ita
l
Ste
ve
Bik
o A
ca
de
mic
Ho
sp
ita
l
Un
ive
rsit
as H
osp
ita
l
AMIKACIN 63 82
87% 78%
CEFEPIME 63 82
84% 77%
CEFTAZIDIME 63 81
75% 78%
CIPROFLOXACIN 62 82
84% 74%
COLISTIN 63 81
100% 100%
GENTAMICIN 63 82
86% 79%
IMIPENEM 63 82
79% 68%
LEVOFLOXACIN
MEROPENEM 63 82
78% 73%
PIPERACILLIN/TA
ZOBACTAM59 77
83% 71%
August 2016_v1
Thirty percent of Pseudomonas aeruginosa isolates were resistant to piperacillin-tazobactam
and 27% resistant to cefepime. Colistin resistance was low (1%); however this was not
confirmed by reference or molecular methods.
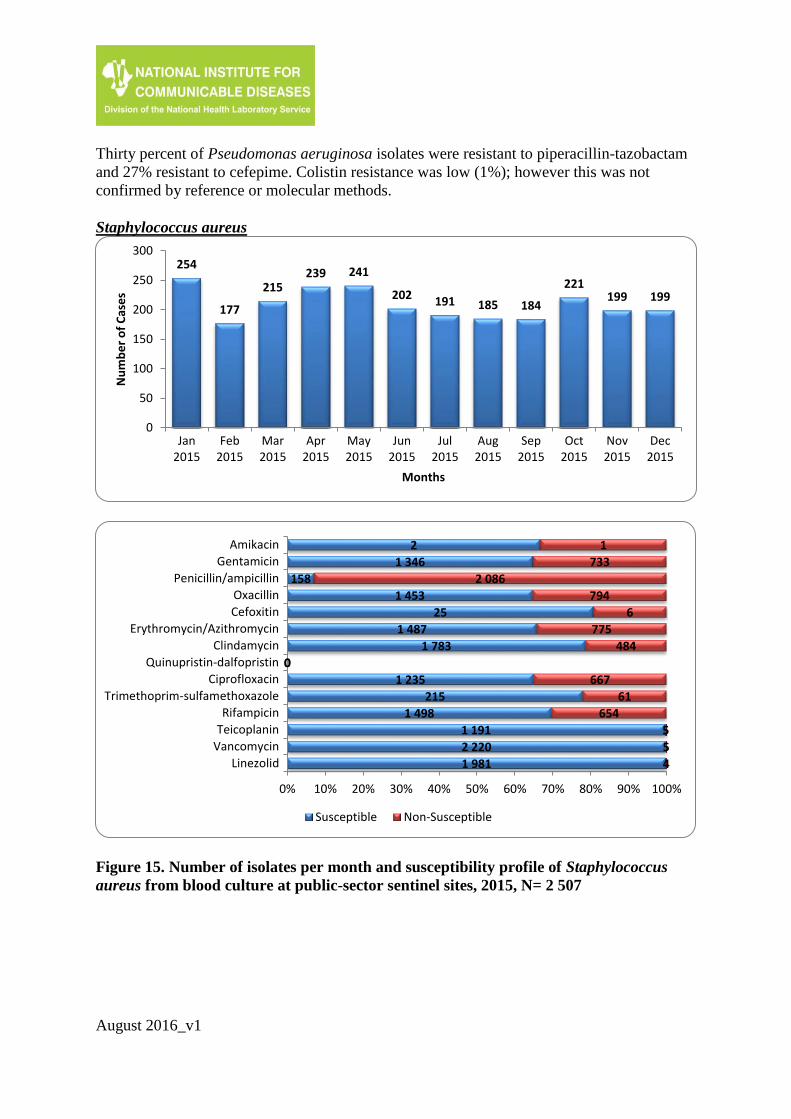
Staphylococcus aureus
Figure 15. Number of isolates per month and susceptibility profile of Staphylococcus
aureus from blood culture at public-sector sentinel sites, 2015, N= 2 507
254
177
215239 241
202 191 185 184
221199 199
0
50
100
150
200
250
300
Jan2015
Feb2015
Mar2015
Apr2015
May2015
Jun2015
Jul2015
Aug2015
Sep2015
Oct2015
Nov2015
Dec2015
Nu
mb
er
of
Cas
es
Months
2
1 346
158
1 453
25
1 487
1 783
0
1 235
215
1 498
1 191
2 220
1 981
1
733
2 086
794
6
775
484
0
667
61
654
5
5
4
0% 10% 20% 30% 40% 50% 60% 70% 80% 90% 100%
Amikacin
Gentamicin
Penicillin/ampicillin
Oxacillin
Cefoxitin
Erythromycin/Azithromycin
Clindamycin
Quinupristin-dalfopristin
Ciprofloxacin
Trimethoprim-sulfamethoxazole
Rifampicin
Teicoplanin
Vancomycin
Linezolid
Susceptible Non-Susceptible
August 2016_v1
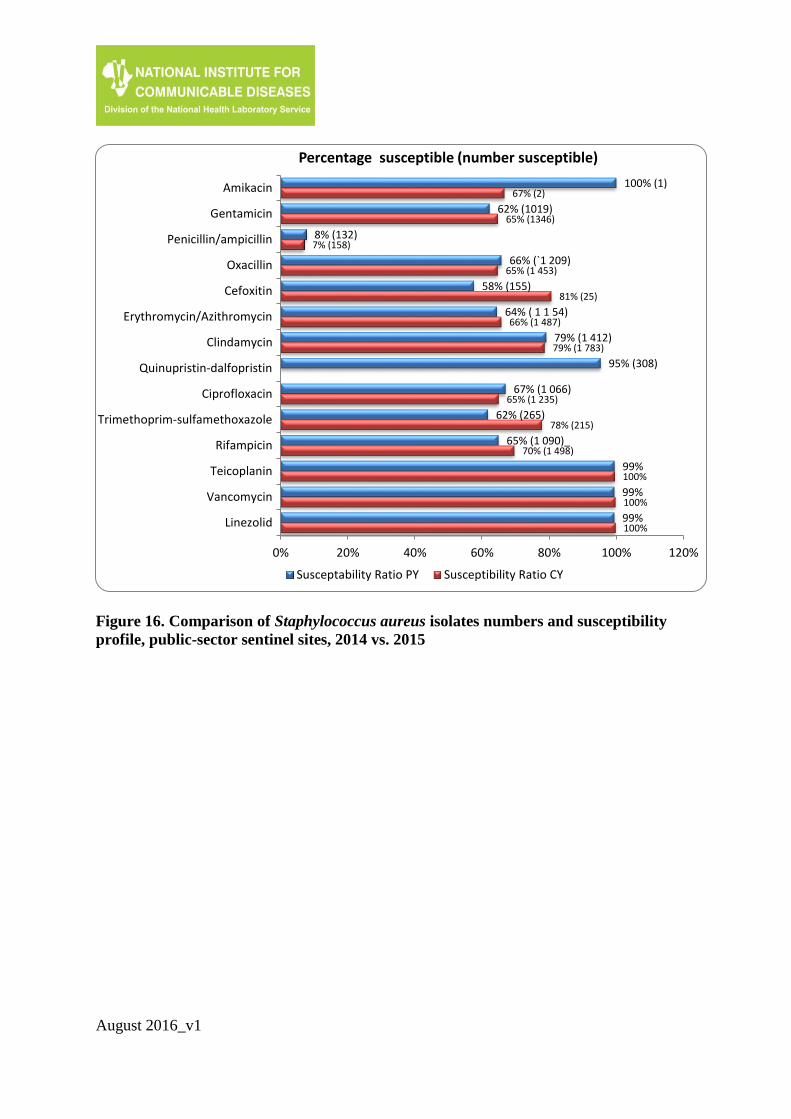
Figure 16. Comparison of Staphylococcus aureus isolates numbers and susceptibility
profile, public-sector sentinel sites, 2014 vs. 2015
100% (1)
62% (1019)
8% (132)
66% (`1 209)
58% (155)
64% ( 1 1 54)
79% (1 412)
95% (308)
67% (1 066)
62% (265)
65% (1 090)_
99%
99%
99%
67% (2)
65% (1346)
7% (158)
65% (1 453)
81% (25)
66% (1 487)
79% (1 783)
65% (1 235)
78% (215)
70% (1 498)
100%
100%
100%
0% 20% 40% 60% 80% 100% 120%
Amikacin
Gentamicin
Penicillin/ampicillin
Oxacillin
Cefoxitin
Erythromycin/Azithromycin
Clindamycin
Quinupristin-dalfopristin
Ciprofloxacin
Trimethoprim-sulfamethoxazole
Rifampicin
Teicoplanin
Vancomycin
Linezolid
Percentage susceptible (number susceptible)
Susceptability Ratio PY Susceptibility Ratio CY
August 2016_v1
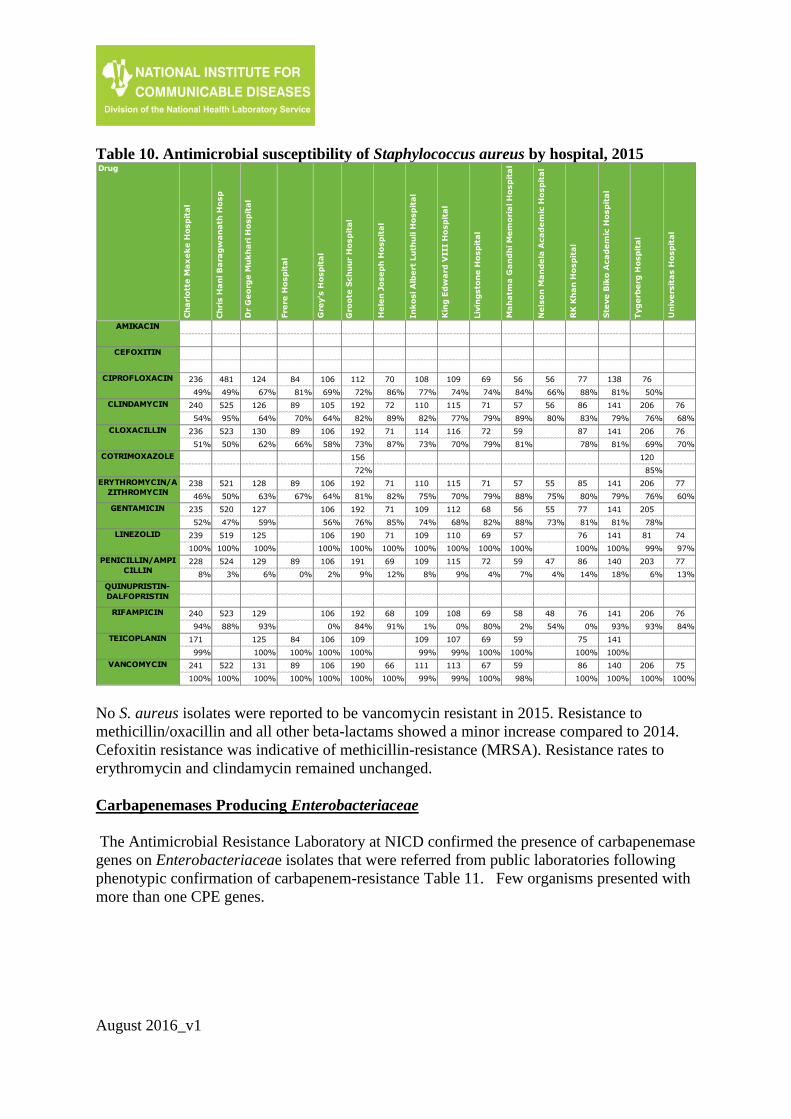
Table 10. Antimicrobial susceptibility of Staphylococcus aureus by hospital, 2015
No S. aureus isolates were reported to be vancomycin resistant in 2015. Resistance to
methicillin/oxacillin and all other beta-lactams showed a minor increase compared to 2014.
Cefoxitin resistance was indicative of methicillin-resistance (MRSA). Resistance rates to
erythromycin and clindamycin remained unchanged.
Carbapenemases Producing Enterobacteriaceae
The Antimicrobial Resistance Laboratory at NICD confirmed the presence of carbapenemase
genes on Enterobacteriaceae isolates that were referred from public laboratories following
phenotypic confirmation of carbapenem-resistance Table 11. Few organisms presented with
more than one CPE genes.
Ch
ris H
an
i B
ara
gw
an
ath
Ho
sp
Gro
ote
Sch
uu
r H
osp
ita
l
In
ko
si A
lbe
rt L
uth
uli H
osp
ita
l
Liv
ing
sto
ne
Ho
sp
ita
l
Ne
lso
n M
an
de
la A
ca
de
mic
Ho
sp
ita
l
Tyg
erb
erg
Ho
sp
ita
l
481 112 108 69 56 76
49% 72% 77% 74% 66% 50%
525 192 110 71 56 206
95% 82% 82% 79% 80% 76%
523 192 114 72 206
50% 73% 73% 79% 69%
156 120
72% 85%
521 192 110 71 55 206
50% 81% 75% 79% 75% 76%
520 192 109 68 55 205
47% 76% 74% 82% 73% 78%
519 190 109 69 81
100% 100% 100% 100% 99%
524 191 109 72 47 203
3% 9% 8% 4% 4% 6%
523 192 109 69 48 206
88% 84% 1% 80% 54% 93%
109 109 69
100% 99% 100%
522 190 111 67 206
100% 100% 99% 100% 100%
Drug
Ch
arl
ott
e M
ax
ek
e H
osp
ita
l
Dr
Ge
org
e M
uk
ha
ri H
osp
ita
l
Fre
re H
osp
ita
l
Gre
y's
Ho
sp
ita
l
He
len
Jo
se
ph
Ho
sp
ita
l
Kin
g E
dw
ard
VIII H
osp
ita
l
Ma
ha
tma
Ga
nd
hi M
em
ori
al H
osp
ita
l
RK
Kh
an
Ho
sp
ita
l
Ste
ve
Bik
o A
ca
de
mic
Ho
sp
ita
l
Un
ive
rsit
as H
osp
ita
l
AMIKACIN
CEFOXITIN
CIPROFLOXACIN 236 124 84 106 70 109 56 77 138
49% 67% 81% 69% 86% 74% 84% 88% 81%
CLINDAMYCIN 240 126 89 105 72 115 57 86 141 76
54% 64% 70% 64% 89% 77% 89% 83% 79% 68%
CLOXACILLIN 236 130 89 106 71 116 59 87 141 76
51% 62% 66% 58% 87% 70% 81% 78% 81% 70%
COTRIMOXAZOLE
ERYTHROMYCIN/A
ZITHROMYCIN238 128 89 106 71 115 57 85 141 77
46% 63% 67% 64% 82% 70% 88% 80% 79% 60%
GENTAMICIN 235 127 106 71 112 56 77 141
52% 59% 56% 85% 68% 88% 81% 81%
LINEZOLID 239 125 106 71 110 57 76 141 74
100% 100% 100% 100% 100% 100% 100% 100% 97%
PENICILLIN/AMPI
CILLIN228 129 89 106 69 115 59 86 140 77
8% 6% 0% 2% 12% 9% 7% 14% 18% 13%
QUINUPRISTIN-
DALFOPRISTIN
RIFAMPICIN 240 129 106 68 108 58 76 141 76
94% 93% 0% 91% 0% 2% 0% 93% 84%
TEICOPLANIN 171 125 84 106 107 59 75 141
99% 100% 100% 100% 99% 100% 100% 100%
VANCOMYCIN 241 131 89 106 66 113 59 86 140 75
100% 100% 100% 100% 100% 99% 98% 100% 100% 100%
August 2016_v1
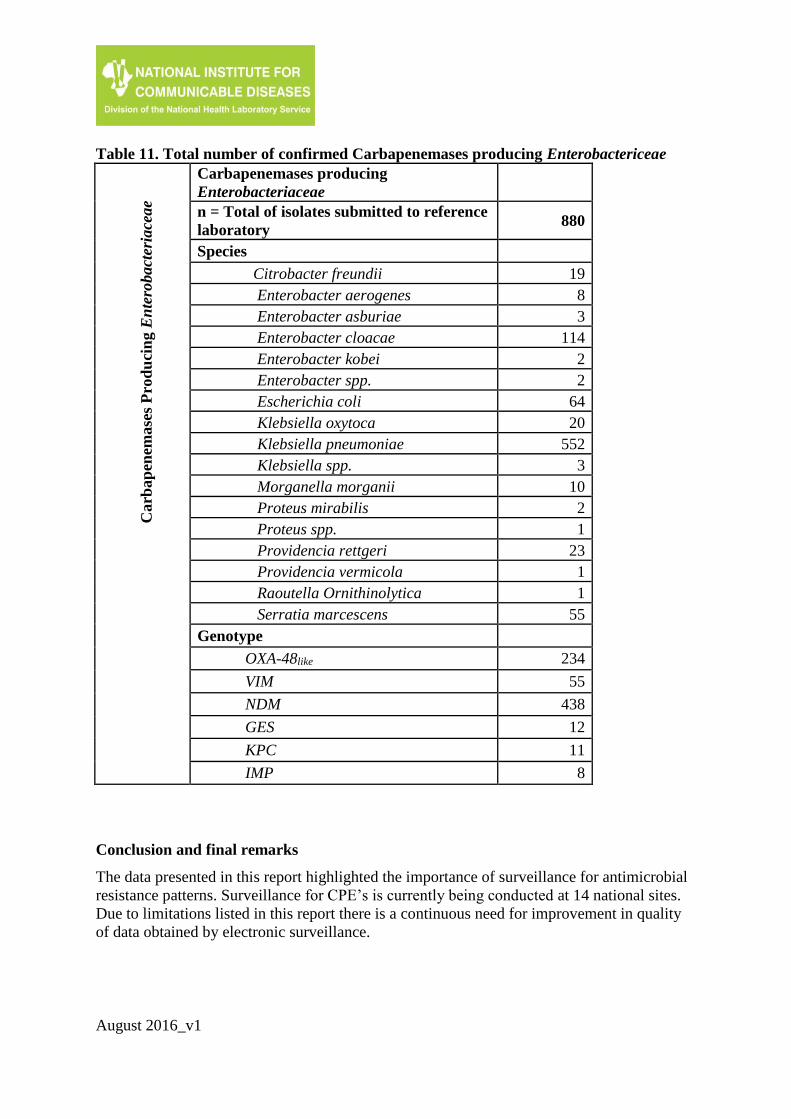
Table 11. Total number of confirmed Carbapenemases producing Enterobactericeae C
arb
ap
enem
ase
s P
rod
uci
ng E
nte
robact
eria
ceae
Carbapenemases producing
Enterobacteriaceae
n = Total of isolates submitted to reference
laboratory 880
Species
Citrobacter freundii 19
Enterobacter aerogenes 8
Enterobacter asburiae 3
Enterobacter cloacae 114
Enterobacter kobei 2
Enterobacter spp. 2
Escherichia coli 64
Klebsiella oxytoca 20
Klebsiella pneumoniae 552
Klebsiella spp. 3
Morganella morganii 10
Proteus mirabilis 2
Proteus spp. 1
Providencia rettgeri 23
Providencia vermicola 1
Raoutella Ornithinolytica 1
Serratia marcescens 55
Genotype
OXA-48like 234
VIM 55
NDM 438
GES 12
KPC 11
IMP 8
Conclusion and final remarks
The data presented in this report highlighted the importance of surveillance for antimicrobial
resistance patterns. Surveillance for CPE’s is currently being conducted at 14 national sites.
Due to limitations listed in this report there is a continuous need for improvement in quality
of data obtained by electronic surveillance.
August 2016_v1
Disclaimer
Data are reported as received through the CDW. No demographic, epidemiological, clinical
or molecular data were available to distinguish between hospital-associated and community
acquired infections.
Acknowledgements
We wish to thank the following:
- NHLS CDW Sue Candy and her team for cleaning the data and preparing the tables
and figures.
- PhD scientist: Ashika Singh-Moodley for CPE genes identification
- SASCM editorial committee for comments and suggestions.
References
1. Langmuir AD. The surveillance of communicable diseases of national importance. N
Engl J Med, 1963; 268: 182-92.
2. Garner JS, et al. CDC definitons for nosocomial infections. Am J Infect Control, 1988;
16: 128-140.
3. Performance Standards for Antimicrobial Susceptibility Testing. Clinical and Laboratory
Standards Institute (CLSI), 2016; M 100-S26