anticipating restructuring in the european defence industry
TRANSCRIPT

December 13&14, 2007
© BIPE 2007
Anticipating restructuring in the European defence industry
Overview of the studycoordinated by Dr. E. Waelbroeck-Rocha
at BIPE, with contributions fromProfessor Dr. H. Wulf, Dr. P. Wilke,
Mr. O. Bergstrom, Mr. D. Sellier, Mr. F. Bruggeman and J. Ganczewski

Final report overview2© BIPE 2007
Outline
Developments during the past decade and present industry structureDefining the defence industryOverview of demand trends: budgets, procurement, R&D expenditure, trade, competitiveness and market access conditionsTrend in employmentOrganisation of supply and changes therein: activities covered, key European defence producers, production location and country specialisations, trend in M&A, ownership structure, cross-border collaboration
ChallengesOutlook
Key factors influencing the futurePossible future scenarios
Anticipating change: examples of innovative practices

Final report overview3© BIPE 2007
Defining the defence industry
The defence sector is not a clearly defined industrial branch:In the literature, “defence” companies are said to produce “weapon systems”, “defence products”, “military equipment”, “arms” or “dual-use goods”, as well as components of these products and associated servicesThe term “dual-use” indicates that the defence sector borders with other sectors (civil aviation, vehicles, ship building, electronics, IT and others)
As illustrated on the next page, companies can be prime contractors (lead system integrators, platform producers and producers of weapon systems), sub-contractors (producers of sub-systems or major components) and third tier contractors (producers of components), usually SMEs, often producing dual-use goodsSMEs involved in defence produce small arms and ammunitions, low calibre artillery, military vehicles, small ships, military electronics, subsystems for weapons and componentsMany defence producers – mainly large but also some small - are involvedat several levels of the supply chain

Final report overview4© BIPE 2007
Organisation of the supply chain: the defence industry’s tier structure
LEAD SYSTEM INTEGRATORSAeronautics
System developersand platformassemblers
Engines / propulsion
manufacturers
Specialised systems producers(electronics, …)
Space & missilesSystem developers
and platformassemblers
Land defenceSystem developers
and platformassemblers
Naval industrySystem developers
and platformassemblers
Complete sub-systemsproducers & assemblers
Electrical & electronicequipment
Mechanicalengineering
Metal working, casts & moulds Etc…
Commoditysuppliers
General servicesuppliers
Basic economicinfrastructure
Prime contractors
Tier 1contractors
Tier 2contractors
Tier 3contractors

Final report overview5© BIPE 2007
There are several tiers of contractors
Prime contractors produce weapon systems:These are mainly large companies specialised on defence production and servicesSome are Lead System Integrators, i.e. assemble defence systems from several defence domains (ex: aircraft carrier), others are specialised in only one area (aerospace for example)Examples in the EU are BAE Systems (UK), EADS (Netherlands), Thales (France) and Finmeccanica (Italy), the later specialised in helicopters and armoured vehicles, and Saab (Sweden) for fighter aircraft, Nexter (France) and Krauss-Maffei-Wegmann(Germany) in major battle tanks, Thyssen Krupp (Germany), Fincantieri (Italy) and DCNS (France) in naval vessels.
Tier 1 contractors produce complete sub-systems or major components. Often, these are also risk sharing partners:
These are often specialized firms (engines, electronics,…), subcontracted by the prime contractors. Examples are Rolls Royce (UK), Groupe Safran (France), MTU (Germany) and Indra(Spain)
Tier 2 contractors produce components and supply servicesUsually small and medium enterprises (SME) or subsidiaries of the major defence producers (prime contractors and sub-contractors), these often produce dual-use goods or services These companies are not always listed as defence producers since they operate at the margin of the defence sector
Tier 3 contractors are commodity suppliers or supply generalist services. This levelalso includes all providers of « general economic infrastructure » services (transport network and services, communications, externalised training, etc.)

Final report overview6© BIPE 2007
Many sectors and sub-sectors are involvedalong the supply chain. Some are highlyspecialised, others are commodity producers
The example of an aeronautics clusterAssemblage etConstructionaéronautique
Fabrication demoteurs et turbines
Fabrication et rechapage depneumatiques
Colles, adhésifs
CaoutchoucNaturel et
synthétique
Aluminium
Servicesaéroportuaires
Matériauxd’emballage
Infrastructures deTransport
PRODUITSSERVICES CLES
MACHINES ETEQUIPEMENTS
PRODUITS INTERMEDIAIRES
INDUSTRIESDE BASE
INDUSTRIES ETSERVICES DESUPPORT
INFRASTRUCTUREÉCONOMIQUE DEBASE
Composantsaéronautiques
Pompes,Compresseur,
Syst. hydrauliques
Transformation dematières plastiques
Industrie textile/confection
Métaux ferreux
Marketing/Publicité
Universités,centres de formation
Peintures,Vernis
Rénovation(Niveau 6)
Fabricationde verre plat et de
fibres de verre
Industrie du bois
Forge,emboutissage,
estampage
Design, R&D
Laboratoires derecherche
Produitsd’entretien
Robots,Machines outils
Entretienmaintenance
Fabrication de Céramiques
avancées
Production desPlastiques de base
Laminage,Profilage,tréfilage
Distributiontransport
Fédérationsprofessionnelles,
syndicats
Huiles,Lubrifiants
Equip. électriqueset électroniques
Injection deplastiques
Ferro-alliages
Evironnementinstitutionnel
Equipement delevage
manutention
Cables, tuyaux,Petit matériel
Services financiers
Bureaux d’étude LogistiqueServices de transport
Services auxentreprises

Final report overview7© BIPE 2007
The risk-sharing partner concept
« Risk- and revenue-sharing » is a system whereby the developmentcosts of new systems or equipments is distributed across the prime contractor and its « partners »Under this system, prime contractors delegate the responsibility for conceptualising, designing, developing and producing the new system, as well as the responsibility for financing the development costsThe associated expenditures are, by nature, investment costs, yet in accounting terms these are considered to be operating costs (there are activation methods)The costs are paid back by the prime contractor to the risk-sharing partners as sales are realised: the partnership, therefore, also impliescommercial risk sharingFor the partner, the depreciation (and reimbursement) of expenses istherefore uncertain, both in terms of the amount of pay-back and in terms of the duration of the financingFor major defence projects, development costs are typically financed by Governments

Final report overview8© BIPE 2007
Outline
Developments during the past decade and present industry structureDefining the defence industryOverview of demand trends: budgets, procurement, R&D expenditure, trade, competitiveness and market access conditionsTrend in employmentOrganisation of supply and changes therein: activities covered, key European defence producers, production location and country specialisations, trend in M&A, ownership structure, cross-border collaboration
ChallengesOutlook
Key factors influencing the futurePossible future scenarios
Anticipating change: examples of innovative practices

Final report overview9© BIPE 2007
On the demand side, the key factors of influence are both European and global
European:Changing role of force new demand mixStagnant or declining overall defence budgets within the EUShrinking national defence procurementComparatively low spending on R&D
Global:Lack of dynamism of world market demandDifficult entry conditions in the more dynamic markets

Final report overview10© BIPE 2007
The past trends in military budgets
The past trend in military expenditures has shaped the present structure of the European defence industry and the restructuring process that took place during the last decade and a half in the EU:
As a result of the ‘peace dividend’ in the first half of the 1990s, the defence industry suffered from the reduction of procurement orders (both national procurement as well as arms exports). World military expenditure decreased from a total of over 1 trillion US $ at the end of the Cold War to less than 800 billion US $ in the mid 1990sThe eastern European countries also suffered from the break-up of the Warsay TreatyAfter an adjustment period, world military budgets have constantly increased. They reached 1.2 trillion US $ in 2006.
Combined EU MS’ military expenditures amount to below €200 billion annually, of which more than €80 billion worth of procurement, R&D and maintenance expenditureIn contrast to the United States, procurement expenditure in the EU has remained fairly stable in recent years. The increase of procurement budgets in Europe between 2000 and 2006 was minimalThe US military budget amounts to US $550 billion, more than double the combined defence budget of the 27 EU countries

Final report overview11© BIPE 2007
World military budgets
0
200
400
600
800
1000
1200
1985 1990 1995 2000 2006
World totalEU
in billion US $ (constant)
Source: SIPRI

Final report overview12© BIPE 2007
Trend in procurement budgets
0
20
40
60
80
100
120
140
2000 2001 2002 2003 2004 2005 2006
USA NATO-Europe
in billion US $ (2005 prices and exchange rates)
Source: SIPRI
Note:
NATO-Europe is not a single entity, hence the trend illustrated reflectsthe sum of national budgets

Final report overview13© BIPE 2007
Overview of 2005 shares of worlddefence budgets
31%Rest of the world(165 countries, includingChina, Russia, Indiaand Japan)
42522%EU
1 38347%US
Defence expenditureper capita (in US$)
Budget share of world total defence budgets

Final report overview14© BIPE 2007
In the future, the EU-27 defence budgets willgrow between 0.5 and 2% per year in real terms
Possible trend in the EU-27 total defence budgets between 2006 and 2015, in billion € at constant 2006 prices
-
50
100
150
200
250
300
2006 2015
+ 0,5%
+ 2,0%
Based on constant defence budget shares
Based on trend-defence budget shares
Source: national statistics, BIPE forecast

Final report overview15© BIPE 2007
The defence budget shares currentlyvary susbstantially across the EU-27
0
0.5
1
1.5
2
2.5
3
3.5
4
4.5
Greece
United Kingdom
France
Bulgaria
Portugal
TOTALRomania Ital
yPolan
dDenmark
Czech Republic
Slovakia
Latvia
Netherl
andsSwedenHungarySloven
iaEsto
niaGerm
anyFinlan
dCyprus
LithuaniaSpain
Belgium
Austria
LuxemburgMaltaIrel
and
Share of GDP in 2006 Share of GDP in 2015 - no change Share of GDP in 2015 - trend growth in budget
Defence budget as a % of GDP per country, in 2006 and two assumptions for 2015
Source: national statistics, BIPE forecast

Final report overview16© BIPE 2007
At best, the defence budgets will amountto 255 billion € in 2015, at 2006 prices
By 2015, depending on the trends in national budget spending, the share of expenditures on defence will bebetween 1.6% and 2.1% of total EU-27 GDPThis is equivalent to an annual growth of total defencebudgets between 0.5% and 2% in real termsThe total value of 2015 budget at 2006 prices will at most be250 billion €A figure of 221 billion €, barely 5% above the 2006 level in real terms, is, however, also possible

Final report overview17© BIPE 2007
Trend in RTD expenditures
RTD expenditures are an investment into the futureR&T expenditures are a subset of R&D spent which apply to expenditure for basic research, applied research and technology demonstration for defence purposes
In 2005, the EU countries spent approximately € 2.2 billion on defence RTD. In 2006, the figure increased to € 2.5 billion This amounts to one-sixth of the US RTD expenditure on defence On average, the EU Member States allocate 1.14% of their military budget to RTD expenditures, compared with 3.31% in the United States

Final report overview18© BIPE 2007
International comparison of R&T spent
Source: EDA

Final report overview19© BIPE 2007
Comparison of European and US R&T expenditure
Note that the EU is not a single entity but composed of 27 separate markets – which increases the gap with the USA

Final report overview20© BIPE 2007
Trend in world arms trade
European companies play a major role in world trade: combined EU exports of all MS (before correction for intra-EU trade) presently account for close to 25/% of the world totalThe global arms trade dropped considerably after the end of the ColdWarThe western European countries were not affected to the same extent as other producers, especially from the former Soviet Union and eastern Europe. The latter countries suffered both from the decline in world trade and from the collapse of the Warsaw PactTotal arms transfers fluctuated in the mid 1990s and early 2000s. Since 2002, the trend is again clearly upward oriented.Based on official sources1, the value of arms exports was over 15 billion US $ in 2005 (the last year of reporting).
1: EU Member States governments

Final report overview21© BIPE 2007
Trends in arms exports by the main EU producing countries (Germany, France, UK, Netherlands, Italy, Sweden, Spain)
0
5
10
15
20
25
30
35
40
1988
1990
1992
1994
1996
1998
2000
2002
2004
2006
globalEU
SIPRI data refer to actual deliveries, allowing for comparisons between transfers of different weapons. SIPRI uses a trend-indicator value and not the actual financial value of a transfer.
SIPRI trend indicator, in million US $ (major conventional weapons only)
Note: the EU is not a single entity. EU data applies to the sum of country figures

Final report overview22© BIPE 2007
Global arms transfers : world market shares (2002-2006 – major conventional weapons)
30%
29%
31%
10%
USARussiaEUOthers
The shares in world markets (including sale of used weapons) of the US, Russia and the EU Member States are of comparable size

Final report overview23© BIPE 2007
Value of arms exports by the major EU producers
970831480Italy
8912
419
682
925
1630
3016
3711
2005
845624Spain
95559938EU total
808406Netherlands
1129780Sweden
11641129Germany
23842975UK*
39786952France
20062004In million €
Source: Official Journal of the EU: 7th, 8th and 9th Annual Report on Arms Exports•For the UK = value of licenses; all others : value of exports•http://www.consilium.europa.eu/cms3_fo/showPage.asp?id=408&lang=en&mode=g#exp4

Final report overview24© BIPE 2007
The EU competitiveness status
One indication of the relative competitiveness of EU-based defence producers is the origin of imports of major equipmentAn analysis of the origin of imports of three categories of major conventional weapons (naval vessels, combat aircraft and major battle tanks) shows that US companies have a technological dominance in certain areas of the defence sector, but not in allThe European Defence Technology Industrial Base (EDTIB) seeks to address some of those concernsIt is not only the technological dominance of the US industry which is responsible for the imbalance in transatlantic trade. It is also due to trade restrictions in the United States (US Buy America Act) which make entry into the largest defence market of the world difficult for foreign firmsThe US dominance is also reflected in the fact that European companies have captured only a small margin of the US procurement market, while US companies won about one quarter of the European market

Final report overview25© BIPE 2007
Sources of imported military equipment
89
EUNon-EU
52
102
EUNon-EU
2
779
EUNon-EU
Naval Vessels Combat Aircraft Major Battle Tanks
From 2001 to 2006, more than half of the imported naval vessels (national production not included), two-thirds of all imported combat aircraft and only 2 of a
total of 781 major battle tanks were imported from non-EU countries.

Final report overview26© BIPE 2007
The changes in market accessconditions within the EU
A range of political and legal guidelines have been designed, and institutions founded, to improve coordination, internationalise procurement and encourage competition:
In 1991, the Maastricht Treaty laid the ground for an Intergovernmental Arms Agency, OCCAR was createdMore recently, the EDA has been formed
The joint efforts to coordinate procurement, increase competition and overcome protectionism have included, among others:
the Letter of Intent (LoI), the Framework Agreement, the Harmonisation of Military Requirements (HMR), the European Headline Goalsthe creation of a joint 55 million € Joint Investment Programme on Force ProtectionThe Code of Conduct to establish a voluntary, non-binding intergovernmental regime
However, despite all efforts, one is far from a Single European Defence MarketStill less than one fifths of procurement is spent in collaboration projects in which at least two EU members participate.

Final report overview27© BIPE 2007
The conditions of Article 296
Article 296 TEC allows Member States to derogate from Internal Market rules when their essential security interests are at stake:
Article 296(1)(b) allows for measures "connected with the production of or trade in arms, munitions and war material", specified in a list. According to a court ruling Article 296(1)(b) TEC "is not intended to apply to activities relating to products other than the military products identified on [that] list".
As a result, Europe's defence sector remains fragmented at national level, with 27 different customers and 27 different regulatory frameworks.Article 296 creates extra costs and inefficiencies, and thus has a negative impact on the competitiveness of Europe's Defence Industrial and Technological Base as well as on Member States' efforts to equip their armed forces adequately.

Final report overview28© BIPE 2007
Outline
Developments during the past decade and present industry structureDefining the defence industryOverview of demand trends: budgets, procurement, R&D expenditure, trade, competitiveness and market access conditionsTrend in employmentOrganisation of supply and changes therein: activities covered, key European defence producers, production location and country specialisations, trend in M&A, ownership structure, cross-border collaboration
ChallengesOutlook
Key factors influencing the futurePossible future scenarios
Anticipating change: examples of innovative practices

Final report overview29© BIPE 2007
Different categories of employment have to distinguished – all of which are related to defence industries
Direct employmentin prime contractors,
exclusivelyrelated to
defence activities
Direct employmentin tier 1 contractors,exclusively related to
defence activities
Part of employmentin tier 2 contractors,
linked to thedefence contracts
Direct employmentin prime contractors,In civilian activities
Direct employmentin tier 1 contractors,In civilian activities
Otheremployment
in tier 2contractors
Indirect employment = employment in related (tier 3 and higher) industries

Final report overview30© BIPE 2007
Estimates of direct employment vary between350 000 and 750 000. Including indirect employment, 1 640 000 persons are concerned
In 2003, the direct employment in defence industries in the EU-27 was estimated at approximately 750,000 employees, less than half theemployment level at the end of the Cold War (1.5 million in 1993) The ASD estimates total employment in aerospace (incl. civilian aeronautics), and defence at 594 000 in the EU-27 in 2005. This, however, mainly covers the prime and tier 1 contractors.In the Defence Communication, the EC quotes 300,000 employees, based on the ASD estimate, of which 98 000 are employed in land defence industries; 63,000 in the naval industries and 150 000 in military aeronautics industriesBottom-up calculations indicate that the above numbers underestimate employment in subcontractor and related industries. For example:
In the UK, official figures indicate 170 000 direct jobs in defence industries, plus 140 000 indirect jobs, totalling 310 000 jobs in 2005In the Midi-Pyrénées region of France, there are more than 1,000 industrial SMEs working as subcontractors. Of the 94 000 jobs in the region, 50 000 are subcontracted jobs.In the Navantia shipyard (Ferrol), in Spain, there are 2 500 jobs in companies subcontracted by Navantia, which itself counts 5,560 jobs in 2005, a ratio of 1 to 2.

Final report overview31© BIPE 2007
Estimates of direct employment vary between350 000 and 750 000. Including indirect employment, 1 640 000 persons are concerned
The next side shows the estimated number of jobs directly or indirectly concerned by trends in the defence industry.The figures are bottom-up estimates and subject to revisions, given the difficulty in allocating employment between defence and civilian activities within a given companyIn summary, one estimates that there are approximately 405 000 jobs in prime and tier 1 defence companies that are directly involved in the production of defence industry products, and 418 000 jobs in the civilanpart of the prime and tier 1 companies.There is likely to be another 350 000 jobs in tier 2 companies, i.e. working on the production of goods and services used by Tier 1 and primecontractors, and close to 470 000 additional employments in related industries (essentially commodity goods and services producers). In total, 1 644 000 persons are concerned, directly or indirectly, by trends in defence markets and European defence production
Use of I-O tables indicates an average employment multiplier of 0.45 in equipment goods producing industries, used to estimate the employment estimate in Tier 2 and higher companiesTier 2 employment directly related to defence production is based on an multiplier of 0.4, and that in civilian activites of 0.45. The figure are consistent with estimates for France and the UK.

Final report overview32© BIPE 2007
Estimated employment by type of activity in EU-27
Direct employmentin prime contractors,
defence only:211 500
Direct employmentin tier 1 contractors,
defence only:193 500
Employmentin tier 2 contractors,
linked to defence:162 000
Direct employmentin prime contractors’
civil production:160 700
Direct employmentin tier 1 contractors,in civil production:
256 500
Otheremployment
in tier 2Contractors:
188 000
Indirect employment = employment in related (tier 3 and higher) industries470 000

Final report overview33© BIPE 2007
Trends in employment by country
Based on the BICC data, the decline in employment was particularly pronounced in the second half of the 1990s. The process has slowed down considerably in recent years: reductions are now due to efficiency gains in the production processDifferent groups of countries can be distinguished:
1st block : relatively stable employment levels between 1993-2003
Greece, Finland, Denmark2d block: major drop in employment between 1993-1998, followed by further reductions between 1998 and 2003
This block includes the LoI countries (except Sweden), plus Belgium3d block: continuous reduction in employment throughout the period:
In the eastern European countries, employment in the defence industries decreased in the range of 50-90 %Poland, Slovakia and Estonia were the worst hit

Final report overview34© BIPE 2007
Change in employment levels acrosscountries, base 1993=100
0102030405060708090
100France
United Kingdom
Germany
Italy
Spain
Sweden
Belgium
Bulgaria
Romania
HungaryCzech Republic
Estonia
Slovakia
Poland
Netherlands
Portugal
Austria
Denmark
Finland
Greece
199319982003

Final report overview35© BIPE 2007
151515Greece
151830Czech Republic
182660Romania
202550Spain
252775Bulgaria
252634Sweden
263550Italy
5070120Poland
8095160Germany
200280380UnitedKingdom
240266345France
200319981993
7729711522
n. a.: Cyprus, Ireland, Malta, Latvia, Lithuania, Luxemburg, Slovenia
227Hungary
334Austria
555Denmark
559Portugal
6815Belgium
72075Slovakia
101018Netherlands
101010Finland
102560Estonia
200319981993
Estimated workforce, in thousands
* All countries listed are members of the EU in 2007. Source: BICC Conversion Survey 2005, pp. 167-168
Despite the uncertainty on the exact employment levels, the overall trend has always been downward oriented

Final report overview36© BIPE 2007
In the UK, official statistics estimate indirect employment as 0.82% of total direct employment in the defence industries
1997/98 2000/01 2001/02 2002/03 2003/04 2004/05Total employment:Direct Indirect
340 160 180
300 155 145
295 155 140
305 165 140
315 170 145
310 170 140
Employment from MoD equipment expenditure: Direct Indirect
145 70 75
135 70 65
140 75 65
160 85 75
155 85 70
150 80 70
Employment from MoD Non-equipment expenditure: Direct Indirect
95 50 45
95 55 40
95 55 40
85 50 35
95 55 40
90 55 35
Employment from defence exports: Direct Indirect
110 45 65
70 30 35
60 30 30
60 30 30
65 30 30
65 35 35
Source: MoD/DASA (2006). Defence Statistics 2006, TSO, London
Employment in UK defence industries, in thousand

Final report overview37© BIPE 2007
In most countries, the fall in employment in defence industries was much more pronouncedthat that of total manufacturing employment
60
70
80
90
100
110
1993 1994 1995 1996 1997 1998 1999 2000 2001 2002 2003 2004
Defence Industry in FranceMetal-working industries in FranceIndustry total (excl. Energy)
Trend in employment in France – 1993 = 100

Final report overview38© BIPE 2007
Other issues related to employment
Skill shortages are starting to develop in the easternEuropean countries, due to ageing of the workforce and emigration patternsThe age structure of workers in industry is skewed to the right, as for other manufacturing sectors: there will be a highnumber of departures for retirement The defence sector employs a comparatively high share of technical and high-skills level, which are also in short supplydue to overall socio-demographic changes and relative lack of attractiveness of industrial sectors compared to services

Final report overview39© BIPE 2007
0%
5%
10%
15%
20%
25%
30%
35%
0-25 25-35 35-45 45-55 55-65
Age structure in industry, in total and by skill type – the case of France in 2005
Engineers &white collarworkers
Blue-collarworkers
% of workforce
Total salaried employment
Source: based on the Labour Force Surveys, INSEE

Final report overview40© BIPE 2007
Defence industries employ personnel with comparatively high skill levels
Graduates, engineers, managers etc.; 28%
Manual workers; 38%
Others; 34%
Source: ASD
Composition of employment in aeronautics and defence, by skill level

Final report overview41© BIPE 2007
Outline
Developments during the past decade and present industry structureDefining the defence industryOverview of demand trends: budgets, procurement, R&D expenditure, trade, competitiveness and market access conditionsTrend in employmentOrganisation of supply and changes therein: activities covered, key European defence producers, production location and country specialisations, trend in M&A, ownership structure, cross-border collaboration
ChallengesOutlook
Key factors influencing the futurePossible future scenarios
Anticipating change: examples of innovative practices

Final report overview42© BIPE 2007
On the supply side, the key factors of influence are :
The large variety, high technicity and rapidly rising production cost of defence equipment and systemsThe dominance of (often national) champions, highlydependent on trends in national procurement budgetsThe high dependence of certain regions on defence activitiesThe transition phase which the industry in eastern Europe isgoing through(Past and future) M & A patternsThe growing concentration of the industryThe particular ownership structure (with governments as major shareholder in France and Italy)Mixed experiences with cooperation

Final report overview43© BIPE 2007
A large range of activities
The defence sector is very diverseThe companies are engaged in the production of:
small arms/ammunitionartilleryaircraftselectronicsenginesmissilesmilitary vehiclesshipsspaceservices (incl. support, training, …)Etc.
… plus all the inputs (products and services) and equipments (machinery, buildings, infrastructure) that are used at some stage during the productionprocess

Final report overview44© BIPE 2007
The main EU defence producers in a global perspective
There are 30 EU based companies amongst the top 100 arms producing companies in the world (excluding Chinese companies)With a turnover of approximately US $ 84 billion in 2005, the 30 largest EU companies accounted for 29% of the total turnover of about US $ 290 billion of the top 100 companies.Among the top 10 arms producing companies there are four EU-based companies: BAE Systems (UK), Finmeccanica(Italy), EADS (headquartered in The Netherlands) and Thales (France).

Final report overview45© BIPE 2007
Ranking of EU companies among the top 100 defence producers
Ranking in top 100 Number of EU-based companies
1 – 10 411 – 25 526 – 50 651 – 100 15
Final report overview46© BIPE 2007
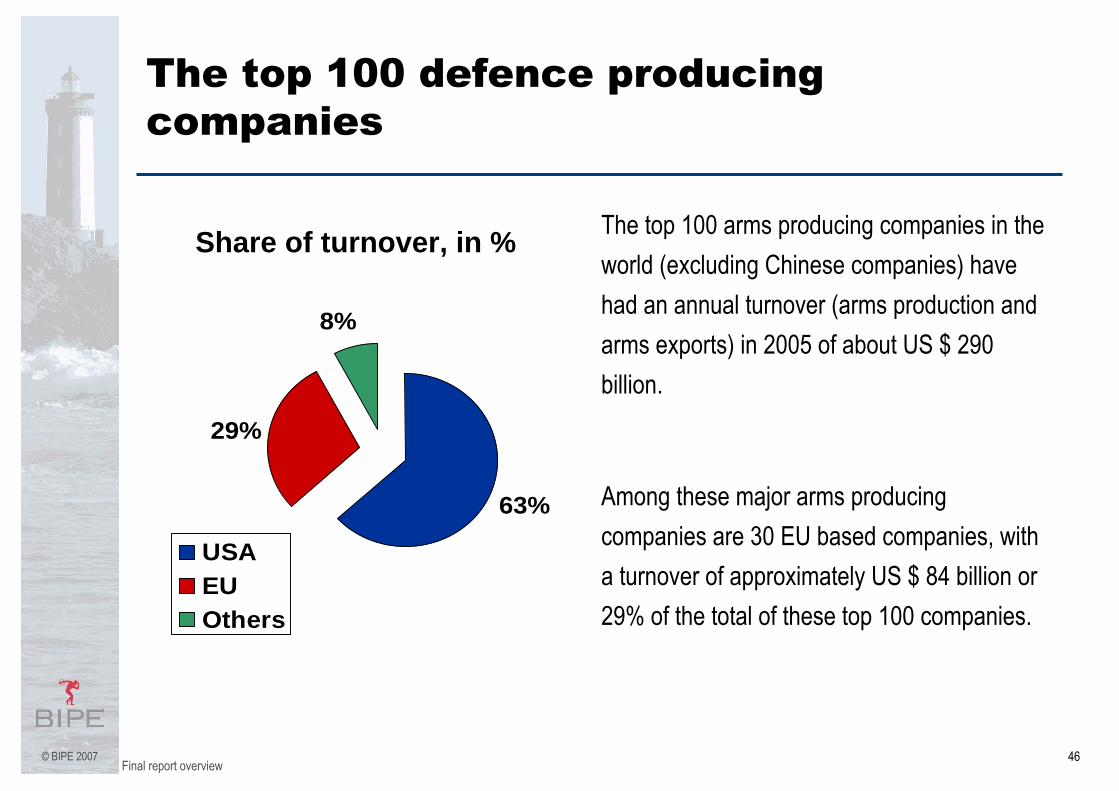
The top 100 defence producing companies
63%
29%
8%
USAEUOthers
Share of turnover, in % The top 100 arms producing companies in the world (excluding Chinese companies) have had an annual turnover (arms production and arms exports) in 2005 of about US $ 290 billion.
Among these major arms producing companies are 30 EU based companies, with a turnover of approximately US $ 84 billion or 29% of the total of these top 100 companies.

Final report overview47© BIPE 2007
Defence activities typically account for a high share of the total turnover of the largest EU producers
0 20 40 60 80 100
RheinmetallSaab
DassaultSAFRAN
Rolls RoyceDCNS
ThalesEADS
FinmeccanicaBAE Systems
Defence sales 2005 - Source SIPRI
Among the top ten EU defence producers, only DCNS has no civil production; the other companies (BAE Systems, Finmeccanica, Thales, Dassault and Saab) have a share of
defence production of over 50%.

Final report overview48© BIPE 2007
Role of EU companies
Two principal conclusions can be drawn from company statistics:
(1) EU based defence production is of global importance(2) The high percentage of arms sales of the 40 US companies (63% of the total) highlights the US dominance in the defence sector.
In addition to the major defence producers, there are literally hundreds of companies engaged in defence production, with location throughout the EU

Final report overview49© BIPE 2007
(UK) 34,980 m.$
(France) 25,870 m.$
(Spain) 1,640 m.$
(Sweden) 2,110 m.$
(Netherland) 14,620 m.$(Germany) 6,520 m.$
(Italy) 18,240 m.$
Source: SIPRI Data base
Arms Sales of Major EU Companies(in million US $, at 2005 prices and exchange rates)
weiter

Final report overview50© BIPE 2007
460Meggitt
490Ultra Electronics
610Babcock International Group
740GKN
800Devonport Management (KBR)
1010Cobham
1170VT Group
1450Smiths
1550QinetiQ
3470Rolls Royce
23230BAE SYSTEMS
34,980
back
Major Arms Producing Companies in the UKarms sales of top companies, m. US$
Military expenditure in the UK(in million US $ at constant 2005 prices and exchange rates)
2.7 %592135094948276
Share of GDP in 2006200620021997
Defence Industry Employment in the UK(1993 – 2003)* workforce in thousands
200280380
200319981993

Final report overview51© BIPE 2007
380Areva (CEA)
410SMA (SAFRAN)
910Nexter Industries (formerly GIAT)
1710CEA
2120Eurocopter Group (EADS)
2210Dassault Aviation Groupe
2707SAFRAN (consolidated, March 2006)
3520DCN
8940Thales
25,870
back
Major Arms Producing Companies in Francearms sales of top companies, m. US$
Military expenditure in France(in million US $ at constant 2005 prices and exchange rates)
2.5 %530915125751926
Share of GDP in 2006200620021997
Defence Industry Employment in France(1993 – 2003)* workforce in thousands
240266345
200319981993

Final report overview52© BIPE 2007 back
18,240390Oto Melara (Finmeccanica)
410MBDA Italia (MBDA Europe)
470Selex Sistemi Integrati (Finmeccanica)
530Avio
610Fincantieri
680Selex Communications (Finmeccanica)
1120Alenia Aeronautica (Finmeccanica)
1380Selex Sensors & Airborne Systems (Finmeccanica)
2850Agusta Westland (Finmeccanica)
9800Finmeccanica
Major Arms Producing Companies in Italyarms sales of top companies, m. US$
Military expenditure in Italy(in million US $ at constant 2005 prices and exchange rates)
1.9 %298913445929781
Share of GDP in 2006200620021997
Defence Industry Employment in Italy(1993 – 2003)* workforce in thousands
263550
200319981993

Final report overview53© BIPE 2007 back
14,620
960EADS Space (EADS, Netherlands)
4080MBDA (BAE Systems, UK/EADS, W. Eur.,/Finmeccanica, Italy)
9580EADS
Major Arms Producing Companies in the Netherlandsarms sales of top companies, m. US$
Military expenditure in the Netherlands (in million US $ at constant 2005 prices and exchange rates)
1.5 %975193449147
Share of GDP in 2006200620021997
Defence Industry Employment in the Netherlands(1993 – 2003)* workforce in thousands
101018
200319981993

Final report overview54© BIPE 2007 back
6,520
460MAN
500MTU Friedrichshafen (DC)
500DaimlerChrysler, DC
610MTU Aero Engines
720Diehl
750Krauss-Maffei Wegmann
1240ThyssenKrupp
1740Rheinmetall
Major Arms Producing Companies in Germanyarms sales of top companies, m. US$
Military expenditure in Germany(in million US $ at constant 2005 prices and exchange rates)
1.4 %369844060440854
Share of GDP in 2006200620021997
Defence Industry Employment in Germany(1993 – 2003)* workforce in thousands
8095160
200319981993

Final report overview55© BIPE 2007 back
1,640
670Indra
970Navantia
Major Arms Producing Companies in Spainarms sales of top companies, m. US$
Military expenditure in Spain(in million US $ at constant 2005 prices and exchange rates)
1.1 %123281148310599
Share of GDP in 2006200620021997
Defence Industry Employment in Spain(1993 – 2003)* workforce in thousands
202550
200319981993

Final report overview56© BIPE 2007 back
2,110
2110Saab
Major Arms Producing Companies in Swedenarms sales of top companies, m. US$
Military expenditure in Sweden(in million US $ at constant 2005 prices and exchange rates)
1.5 %527158335780
Share of GDP in 2006200620021997
Defence Industry Employment in Sweden(1993 – 2003)* workforce in thousands
252634
200319981993

Final report overview57© BIPE 2007
Industry organisation in the easternEuropean member states (1)
Defence industries in the eastern European countries have distinct features
Before 1990, defence industries in EE countries were direct elements of military strategy of the Warsaw Treaty,The location of production and tasks of the individual producers, factories and industries were defined in the frame of the Warsaw Treaty’s military strategyThis resulted in a high level of country specialisation in the production of elements of final products and systems, divided and distributed across factories and countriesEconomic factors and market aspects did not play a primarily role

Final report overview58© BIPE 2007
Industry organisation in the easternEuropean member states (2)
Since the, the main problems of defence industries in the eastern European member states have been:
difficulties in adapting to the new political and economic context after the break-up of the Warsaw Treatylack of internal EE countries experience in conducting restructuring and privatisation changes on such large scalethe consequences of actions by international competitors perceived at attempting to eliminate potential internal and international competition
The restructuring process is not yet completed. The eastern European countries’ defence industries are still in “transformation shock”

Final report overview59© BIPE 2007
The situation in Poland
The Polish defence industry was the most important producer amongst the EE countriesAll the factors previously mentioned influenced the present situation of the Polish defence industry
Employment in the sector decreased by approximately 60% during the 1990sThe first years of restructuring and the privatisation process led to important decreases in production, increased unemployment and social problems
As elsewhere, the restructuring and privatisation process is not completed:Over the past years, several future industry concepts and organisation structures were evaluated by various industrial and professionalorganisations, and by administrative bodiesDiscussions led to the recent publication of the Strategy of consolidation and support of development of Polish defence industry in 2007-2012, approved by the Polish government on 31.08.2007.

Final report overview60© BIPE 2007
The Polish government strategyobjectives (1)
The objectives are to:Ensure that the state security requirements in the sphere of armament, army equipment and weapons defined within the framework of the national security strategy and taking into account EU membership obligations, can be metSecure the participation of the national defence industry in R&DprogramsIncrease exports to the world markets, and achieve a significantposition in the future European defence industry

Final report overview61© BIPE 2007
The Polish government strategyobjectives (2)
In the short term, this implies the following objectives:adjusting defence production capacity and R&D work to national and export potentialIncreasing the diversity of supply of modern army equipment and weaponsFinancial and technological reinforcement of the defence industryStrengthening the position of Polish producers on internal and international markets as well as in relation with financial institutionsModernizing the technology and the defence productsCo-ordinated policies with respect to defence R&D workMoving up the value added chain (increasing the value of defence industry exports)Co-ordination of commercial and marketing activities,Rationalisation of production costs Stabilising employment

Final report overview62© BIPE 2007
Quantified objectives have been set
Target export value between 360 to 520 million €Value of R&D work : between 125-130 million €Target share of deliveries of army equipment and weapons produced in Poland in total purchases by the Polish Ministry of Defence : 59% in 2006, coming down to 34% in 2012. The decrease is due to the execution of international agreements on deliveries already signed by the MinistryIncrease in the number of factories consolidated within the frame of BUMAR GROUP (the national champion) : from 15 entities at present to 36 by 2012. This denotes a strong consolidation trend.

Final report overview63© BIPE 2007
The national champion’s dependence on national procurement budgets
The size and diversification of the defence industry in the EU is clearly a reflection of the size of the military budgets:
The United Kingdom has the largest defence budget among the EU countries, closely followed by FranceIn Germany, the third largest spender on defence in the EU, the budget is considerably smallerThe fourth largest spender is Italy
These four countries account for two thirds of the EU’sdefence budgets

Final report overview64© BIPE 2007
Diversification and regional distributionof production across the EU
Many small and mediums sized companies are engaged in defence production, both in the main producing countries and in other EU countries such as Austria, Belgium, Czech Republic, Denmark, Finland, Greece, Poland and PortugalThese companies produce small arms and ammunition, low calibre artillery, military vehicles, small ships, military electronics, and subsystems for weapons and components. Often they are not classified as defence producers since they are usually diversified companies with non-defence (dual-) production.A similar pattern of concentration as with the largest defence producers appears in the regional distribution of the different defence sectors in Europe. The four top producing countries, UK, France, Italy and Germany, are the home base for companies from all sectors of defence: small arms/ammunition; artillery; aircraft; engines; electronics; military vehicles; missiles and ships. However, a large number of SME are engaged in all sectors of defence production; they operate from countries across the EU.

Final report overview65© BIPE 2007
An example of the regional distribution of production
The example of the helicopter production sites of Eurocopter and Agusta Westland illustrates the diversity and distribution of production sites and employment.
Source: Fondation pour la Recherche Stratégique

Final report overview66© BIPE 2007
Trend in mergers and acquisitions
A general process of consolidation is under way:In contrast to other industrial branches, M&As took place primarily at national level during the early 1990s. National champions were formed in several EU countries.Typical of this process of consolidation largely along national lines in the EU, is the land defence sector, as well as naval industry.
Acquisition activity has recently accelerated in the EU, at a time when it has slowed down in the United States. The primary reason for theacquisition of defence companies during the early phase in the 1990s was their uncertain future as a result of the end of the Cold War and the reduced budgets.In the US, the consolidation process started earlier. Wall Street played an instrumental role in the restructuring process. Big companies (Northrop Grumman and Lockheed Martin) were formed.

Final report overview67© BIPE 2007
Consequences on industry structure
As a result of mergers and acquisitions along national lines, the leading producers offer equipment that is not necessarily standardised, since each pursues its own technology lines.
There are too many and too small companies to survive. For example, after the commercial failure of the Leclerc tank and drastic reduction in orders by the French government, GIAT (France) cut its staff by 85% over 15 years (from 18,000 employees in 1990 to 2500 in 2006). The situation, which had become a financial disaster for the state, was sorted out in 2006.
Some European states are turning to foreign countries to satisfy their munitions needs. Financial difficulties of firms has allowed U.S. industry and financial investors to acquire several outstanding companies of the ground weapons industry at low prices (Bofors, Mowag, Santa Barbara).

Final report overview68© BIPE 2007
Major pan-European companies have nevertheless emerged, through differentapproaches
The first European corporations were formed during the second half of the 1990s. Typical examples are:
EADS = Aérospatiale-Matra, DASA, CASA and a number of smaller companies. The merger was made possible by an agreement between the French and German governments, which encouraged the mergerThales = Thomson CSF, Racal, Signaal in addition to a number of companies from the US, UK, Canada, South Korea, South Africa, Australia, Brazil and West European countries: this is a model of growth through acquisitionBAE followed a different approach, centered on the US market
It is of interest that not only companies based in the EU were acquired, but from a wide range of countries.

Final report overview69© BIPE 2007
Example: the formation of EADS1985-2005
1985 1986 1987 1988 1989 1990 1991
1992 1993 1994 1995 1996 1997 1998 1999 2000 2001 2002 2003 2004 2005Matra Haute Technologie (France)Aerospatiale (France)
Aerospatiale Matra (France)
Siemens Defence Electronics (Germany)MBB/GermanyAEG/GermanyDornier/GermanyMTU/Germany
DASA (Germany)
CASA (Spain)
EADS
Patria Industries, 27 % (Finland)Astrium (UK)Siemens Unit (Germany)Racal Instruments (USA)Nokias professional mobile radio buisness (Finnland)
Source: SIPRI Yearbook 2006

Final report overview70© BIPE 2007
The formation of Thales1987 - 2005
Source: SIPRI Yearbook 2006
1987 1988 1989 1990 1991 1992 1993 1994 1995 1996 1997 1998 1999 2000 2001 2002 2003 2004 2005TDA Amemenis (Western Europe)Arieem (France)Racal (UK)
Samsung Electronics detence unit, 50 % (South Korea)Pillington Optronics, 10 % (UK)Shorts Missiles Systems (Canada)ADI, 50 % (Australia)African Defense Systems (South Africa)Sextant in-Flight Systems (USA)Avimo, 25 % (UK)Embraer, 6% (Brazil)Pilkington Opironica, 40 % (UK)Dassault Electronique (France)Aerosperlic´s military electronics units (France)Sectant Avionique, 50 % (France)Signaal HSA (Netherlands)Pilkington Opironics, 50 % (UK)Link-Miles (UK)Radilon MEL (UK)Wiloc Electric (USA)GE/RCA (USA)
Thomson SA Thales

Final report overview71© BIPE 2007
BAE´s Alternative Approach
BAE Systems (UK) chose a different approach: The company pursued a strategy of a forceful entry into the US defence market by acquiring US defence producing companies. BAE Systems now employs 35,000 people in the United Sates. By far the largest acquisition in the defence sector in 2005 was that of United Defence (USA) by BAE Systems, a deal worth US $ 4192 million. This was the largest acquisition of a US defence company by a non-US buyer.
As a result, this British company is now the sixth-largest contractor of the US Department of Defence
One should, however, note that BAE is a defence specialist ,whereasEADS and Boeing have a mix of military and civil business

Final report overview72© BIPE 2007
The formation of BAE Systems1977 - 2005
Source: SIPRI Yearbook 2006
1977 1987 1988 1989 1990 1991 1992 1993 1994 1995 1996 1997 1998 1999 2000 2001 2002 2003 2004 2005
Siemens Plessey Systems (Germany)
Saab, 35 % (Sweden)
BAeSEMA (UK)
STN Atlas Elekt., 49 % (Germany)
LFK, 15 % (Germany)
AWADI (Australia)
British Aircraft Corp. (UK) Heckler & Koch (Germany, divested in 2002)
Hawker Siddeley Av. (UK) Roval Ordnance (UK)
Hawker Siddeley Dy. (UK) Reflectone (UK)
Scottisch Avierlion (UK) SD-Scicon (UK)
British Aerospace BAE Systems
Marconi Electronic Systems (UK)
Lockheed Martin Control Systems (USA)
Lockheed Martin AES (USA)
Watkins Johnson (USA)
Ferntornierics (USA)
Condor Pacifics (USA)
Piper Group (UK)
Advanced Power Tech. (USA)
MEVATEC (USA)
Alphatech (USA)
Commercials electronics unit of Boeing (USA)
Digital Nierl Holdings (USA)
Practical Imagineering (USA)
STI Government Systems (USA)
Alvis (UK)
Aerosystems International (UK)
United Defense (USA)
Y

Final report overview73© BIPE 2007
Four factors explain the acceleration in M&A activity in the 1990s
1. Governments in the EU have encouraged mergers in certain cases (EADS and its family of companies); in other cases governments try to prevent foreign (non-EU) investment.
2. There is a trend to invest in expanding sectors. This is particularly the case in areas which are affected by the outsourcing and privatisation strategies of traditional military functions, such as services, logistics, information technology and the so called network-centric programmes: to increase market shares, companies seek to acquired smaller specialized companies.
3. There is a desire of non-US companies to access the lucrative US market by acquiring US-producing companies. This has proved more successful than the direct export of military goods to the United States. The reverse process also takes place. US-based companies have been actively acquiring EU-based companies.
4. Private equity groups (financial investors) have begun to purchase defence producing companies. There are several outstanding examples. In 2005 the private equity group EQT (Sweden) bought MTU Friedrichshafen (Germany) from DaimlerChrysler (Germany). This transaction has been a source of political tension in Germany. It included also the Off-Highway Division of Detroit Diesel (USA) and was valued at approximately US $ 1.9 billion.

Final report overview74© BIPE 2007
List of recent mergers within Western Europe (1)
…Nokia (Finland)Professional Mobile Radio businessEADS (W. Europe)
…Royal Philips (Netherlands)Philips Aerospace Electronics(Netherlands)
Avio Group (Italy)
2…Graphics Research (UK)QinetiQ (UK)
156RAC (UK)Lex Vehicle Solutions (UK)VT Group (UK)
18ECI Partners (UK)Hotel and Catering Training Company(UK)
VT Group (UK)
825Alcatel (France)Alcatel´s satellite unit (France)Thales (France)
550Ericsson (Sweden)Ericsson Microwave Systems (Sweden)
Saab (Sweden)
…Saab (Sweden)Nammo (Norway)Norwegian Governmenand Patria (Finland)
……Navtek (Norway)Kongsberg (Norway)
3 400Carlyle Group (USA)Avio (Italy)Cinven (W. Europe)
Deal value($ m.)
Seller company(country)
Acquired company(country)
Buyer Company(country/region)
Source: SIPRI Yearbooks 2006 and 2007

Final report overview75© BIPE 2007
List of recent mergers within Western Europe (2)
172BAE SystemsAtlas Elektronik (Germany)ThyssenKrupp Technologies (Germany) and EADS (W. Europe)
…EADS (W. Europe)TDA Armements (W. Europe)Thales (France)
……Sagem (France)Snecma (France)
31…Farran Technology (Ireland)Smiths Group (UK)
……Arges (Austria)Rheinmetall (Germany)
…EADS (W. Europe)LFK (Germany)MBDA (W. Europe)
…MAN-Technologies (Germany)MAN-Mobile Bridges (Germany)Krauss-Maffei Wegmann (Germany)
171…Datamat SpA (Italy)Finmeccanica (Italy)
1 900DaimlerCrysler (Germany)MTU Friedrichshafen (Germany) and the off-highway division of Detroit Diesel Corporation (USA)
EQT (Sweden)
Deal value($ m.)
Seller company(country)
Acquired company(country)
Buyer Company(country/region)
Source: SIPRI Yearbooks 2006 and 2007

Final report overview76© BIPE 2007
List of transatlantic mergers (1)
Source: SIPRI Yearbooks 2006 and 2007
……Alcoa´s Aerospace ServiceBusiness (USA)
ThyssenKrupp Service(Germany)
59SAIC (USA)Data Systems & Solutions(USA)
Rolls Royce (UK)
……Firearms Training Systems(USA)
Meggit (UK)
…Carlyle Group (USA)Stellex Aerostructures (USA)GKN (UK)
9…National Sensor Systems (USA)BAE Systems (UK)
26…Cube Corporation (USA)VT Group (UK)
60Privately heldAudiopack (USA)Ultra Electronics (UK)
42…Planning Systems Inc. (USA)QinetiQ (UK)
288…Apogen Technoligies (USA)QinetiQ (UK)
26…Gallium Software (Canada)Kongsberg (Norway)
……Talon InstrumentsEADS (W. Europe)
260Remec. Inc. Defense & Space unitChelton Microwave Corporation(UK)
4 192…United Defense (USA)BAE Systems (UK)
Deal value($ m.)
Seller company(country)
Acquired company(country)
Buyer Company(country/region)
West European acquisitions of companies based in North America

Final report overview77© BIPE 2007
List of transatlantic mergers (2)
Source: SIPRI Yearbooks 2006 and 2007
169…TRL Electronics (UK)L-3 Communications (USA)
65Nautronix Holdings (UK)Nautronix Defence Group (UK)L-3 Communications (USA)
……Magnet-Motor (Germany)L-3 Communications (USA)
……Advanced Systems Architectures(UK)
L-3 Communications (USA)
…Privately heldHMT Vehicles (UK)Lockheed Martin (USA)
59Cobham (UK)Wallop Defence Systems (UK)Esterline Technologics (USA)
47…Automotive Technik (UK)Stewart & StevensonServices (USA)
22Northrop Grumman (USA)Teldix (Germany)Rockwell Collins (USA)
……INSYS Group Limited (UK)Lockheed Martin (USA)
150…SAM Electronics (Germany)L-3 Communikations (USA)
270Cobham (UK)Aerospace fluid and air divisionEaton Corporation (USA)
54Reinhold Industries (UK)NP Aerospace (UK)Carlyle Group (USA)
Deal value($ m.)
Seller company(country)
Acquired company(country)
Buyer Company(country/region)
North American acquisitions of West European-based companies

Final report overview78© BIPE 2007
As a result of the consolidation process, the degree of concentration has significantly increased
0102030405060708090
1990 1995 2000 2005
top 20top 15top 10top 5
Share of arms’ sales of the top 100 defence producers
The result of this concentration process can also be seen in the turnover of companies. In 1990 the top 5 defence producing companies of the world accounted for 22% of the total arms sales of the top 100 companies. This figure has doubled now to exactly 44

Final report overview79© BIPE 2007
In several countries, public ownershipstill dominates
This is the case in particular in France, Italy and SpainElsewhere, governments are progressively reducing theirstake in the defence companiesPrivate funds have entered the sectorUS companies have also increased their presence in Europe through acquisitions

Final report overview80© BIPE 2007
What will be the fate of public ownership in France?
(*) Etat: 75% à partir de début 2007
% CA Défense 2006 Effectif 2006
100%100%
12 4592 491
50% 68 000
20% 61 357
25,4% 116 848
38% 12 086
(*)
46,5% 4 2964 719

Final report overview81© BIPE 2007
What will be the Fate of Public Ownership in Italy and Spain?
Source: Fondation pour la Recherche Stratégique

Final report overview82© BIPE 2007
The European collaboration record ismixed
A few projects have been highly successful. However they have often been used to pursue national procurement or industrial aims. A few positive and negative examples are listed below.The juste retour principle, often applied in collaborative projects, leads to inefficiencies and higher cost, since the placement of a procurement orders is largely based on the percentage of finances in the project of the participating countries rather than selection of the most economic or technically most competent supplier.
Positive collaboration seems to happen:in helicopters with the NH 90 and Tiger, and with the Anglo-French helicopter packagein missiles with the Meteor and, to a lesser extent, PAAMSin transport aircraft with the A400Min satellites with the Galileo

Final report overview83© BIPE 2007
The NH-90 helicopter : an example of European cooperation
EADS/Eurocopter, EADS/Eurocopter Deutschland, Augusta (Italy) Fokker (Netherlands) and OGMA Portugal) cooperate in development and production.
Source: Fondation pour la Recherche Stratégique

Final report overview84© BIPE 2007
Poor collaboration examples also exist
Often, the stage of collaboration is not reached and national programs prevail
The number of duplications (with higher cost and inefficiencies) of weapon systems is high:
Four main battle tanks are being built,
There are 16 national programmes for armoured fighting vehicles (AFV),
Three combat aircraft programs are being pursued, despite heavy competition from the USA
Duplications in development are particularly frequent in IT-and Command and Control Systems

Final report overview85© BIPE 2007
Example: number of systems produced in the EU and the USA

Final report overview86© BIPE 2007
There are three competing combat aircraft programs in Europe
The combat aircraft sector illustrates the failure in European cooperation. The lack of joint political will and the dominance of national ambitions lead to multiple programs (Gripen,
Eurofighter, Rafale) and diffused R&D spending. The results are increased program costs, slipping deadlines, export sales difficulties.
Source: Fondation pour la Recherche Stratégique

Final report overview87© BIPE 2007
Can the A400M transport aircraft be a model?

Final report overview88© BIPE 2007
Outline of the situation by segment
The following slides present a summary of the situation across the key segments of defence industries:
AerospaceNaval industryLand / ground forces
Of which: armoured vehiclesOf which : munitions
Missiles and electronics

Final report overview89© BIPE 2007
The aerospace industry covers both civil and military production
The aircraft/space industry is the most Europeanized industry segment.The consolidation process has taken place over many years and was accelerated by financial needs.However, looking at the non-military (Airbus, space) and the military sector (fighter aircraft, missiles, military electronics) it becomes clear that the civil part is more European than the defence part. Despite present problems in the structure of Airbus Industries and its production process, Airbus has established itself on the basis of reimbursable aid from the member states as a competitive producer of a family of civilian aircraft. The question is: can Airbus serve as a model?

Final report overview90© BIPE 2007
The military segment of aerospace is veryspecific, but consolidation at EU-level is already well advanced
There are some distinct differences in the arms ‘market’: defence is not really a market, products are essentially sold domestically by one supplier to one customerGovernments are customers and shareholders in the enterpriseseconomic considerations are often overruled by political interests (although this is to some extent the case in Airbus Industry as well) state protectionism has often favoured national programsthe civilian aircraft market has constantly grown; defence has experienced fluctuations in demand

Final report overview91© BIPE 2007
The different activity segments in military aerospace
Source: Fondation pour la Recherche Stratégique

Final report overview92© BIPE 2007
The naval industry remains organised along national lines
Although the naval sector is undergoing significant technological changes, the concentration process has largely proceeded along national lines : about two dozen shipyards are engaged in the design, development and production of military vessels.Four major groups of national champions have emerged in UK, France, Germany and Spain.In contrast to the United States, where vertical groups (integration of platform and systems producers) have been formed, the shipyards in Europe operate horizontally at the national level. Cooperative programs in the EU exist on bi- or tripartite levels (Fremm, CVF/PA2 and others). A typical example of a most recent national decision is the procurement of four frigates Type 125 in 2007 for a value of 2.6 billion € in Germany. A European solution, possibly along the lines of Airbus or EADS in the aerospace sector, is not on the agenda, neither is there a development of transnational programs which involve more than two or three countries.

Final report overview93© BIPE 2007
There is a need for consolidation at EU level in the naval industry
Financial constraints might accelerate the need for consolidation
This seems within the realm of possibility: not long ago, a joint British-French aircraft carrier – a symbol of the states’sovereignty – would have been inconceivable
Similarly, rationalisation is required to reduce overcapacities:The capabilities to develop and produce naval vessels are larger than actual demand. It is both difficult and costly to retain such facilities during gaps in development and production

Final report overview94© BIPE 2007
Overview of the naval sector in the EU
BAE Systems
E A D S
Atlas Electronics
Thales UnderwaterSystems THALES
100%
100%
ThyssenKrupp HDW
ETMarinesystème
50%
50%
TNF
MOPA2
DCN
100%25%
FlagshipTraining
37%
Fleet Support
50%
Rolls-Royce
Vosper Thornycroft
50%37%
Babcock Borsig
Preussag
Saab
RDM
FRANCE
SWEDENGERMANY
UK
Daimler-Chrysler
Abeking&Rasmussen
Kochums
35%
75%
CMN
Armaris
Babcok Rosyth
Devonport
Lürssen
Celsius
MTU
MAN
Siemens
Technicatome
WärtsiläAker Yards JeumontSchneider
SEMT Pielstick
100%
FincantieriFinmeccanica
AMSWASS100%
ITALY
TNN (Signaal)Royal Schelde
eld
100%NL
SPAINNAVANTIASEPI
100%
TKMS100%
OEP25%
B&V
100%
National Champions
INDRA systemas
Source: Alpha

Final report overview95© BIPE 2007
Further consolidation is also expected in the land defence industry
The structure of the producers of equipment for the ground forces is similar to the naval industry. Governments often opted for national solutions to retain advanced technologies in this sector, and secure jobs. The development and production on the national level of major battle tanks, armoured vehicles, artillery and small arms and ammunitions was affordable in large EU countries.There is a clear lack of Europeanization of industry and lack ofcooperative projects. Procurement of armoured vehicles has slowed down in recent years and the industry is in economic difficulties. There are too many and too small companies to survive. Major companies exist in France, Germany (2), Italy and the UK.

Final report overview96© BIPE 2007
Mergers and acquisitions in the armoured vehicles segment
Breda Meccania
Oto MelaraItaly
Panhard
GIATFrance
ArgesAustria
KUKA
IWKA
Krupp MAK
Thyssen Henschel
Rheinmetall
Wegmann
Krauss MaffeiGermany
VSEL
Royal Ordnance
Vickers
GKN
AlvisUnited Kingdom
Hägglunds
BoforsSweden
United DefenseUSA
Oto Melara (Finmeccania)
GIAT
BAE Systems
Krauss-Maffei Wegmann
RheinmetallLandsysteme GmbH

Final report overview97© BIPE 2007
Several joint programs and cooperation at the industry level take place in the munitions industry
Source: Fondation pour la Recherche Stratégique

Final report overview98© BIPE 2007
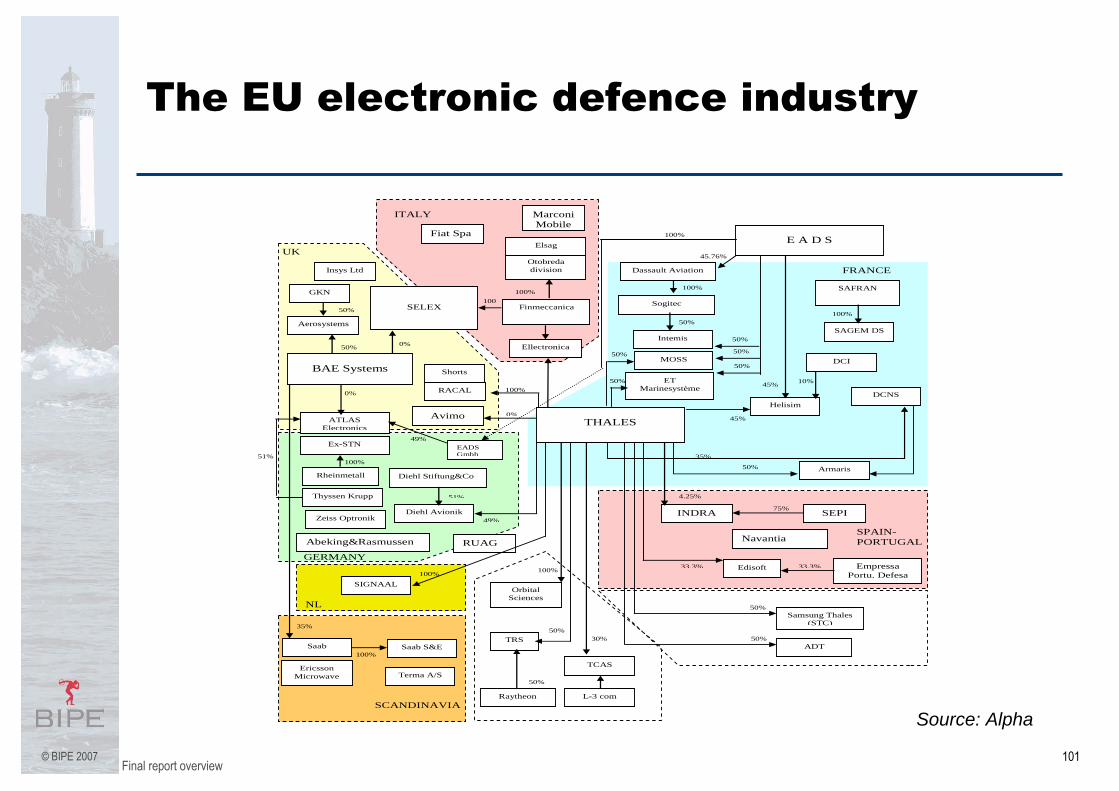
The missile and electronic industry
Similar to the area of aerospace, the defence electronics and the missile/propulsion industry is more EuropeanizedCross-border mergers and bi- and multilateral joint ventureshave facilitated the Europeanization process

Final report overview99© BIPE 2007
The EU missile and propulsion industry
ALLEMAGNE
Finmeccanica
BAE Systems
LFK
Rheinmetall
Saab
37.5%
100%
25%
35%
37.5%
EMEO 40%
Bodenseewerk
20%
TDA
Taurus Systems
67%
100%
SME
50%
NEXTER CTA 50%
RGR 33%
Nitrochemie Wimmis 51%
Dynamit Nobel
Diehl Stiftung&Co
80%
10%
100%Oerliken Contraves
100%
Otobreda division
WASS
100%
Nammo Sweden AB
Empressa Portu. Defesa Spel SA 50.9%
Kongsberg Gruppen ASA
Raufoss Technology
15%
Patria Industrie
26.8%
45% 27.5%
27.5%
SIG Arms International AG RUAG
49%
50%
Indra 75%
40%
50%
33%
10%
R.O.
100%SAGEM
Nexplo Indus. 60%
40%
6%
United Defense Bofors Defense AB Akers Krutbruk
Selex
100%
0%
Eurosam 33%
33%
33%
Euromissile
100%
Bayern Chemie / Protac
0% 100%
FRANCE
ITALY
UK
SPAN - PORTUGAL
SCANDINAVIA
E A D S
Italie UKams
THALES
Europaams
33% 66%
Euro-Art
SAFRAN R.O. rocket motor
MBDA
Roxel
SEPI
SNPE
Eurenco
60,2%
19,9%19,9%
GERMANY
ASTRIUM
THALES UK
100%
Source: Alpha

Final report overview100© BIPE 2007
The EU’s leading missile producer
Source: Fondation pour la Recherche Stratégique
Final report overview101© BIPE 2007
The EU electronic defence industry
Finmeccanica
Dassault Aviation
SELEX
E A D S
ATLAS Electronics
Diehl Avionik
Rheinmetall
Saab
Ellectronica
Samsung Thales (STC)
Edisoft
ADT
100
45.76%
0%
100%
49%
35%
50%
33.3%
SAFRAN
0%
TCAS
30%
L-3 com
TRS
Raytheon
Helisim
50%
Sogitec
100%
45%
DCI
10%
Insys Ltd
Zeiss Optronik
Diehl Stiftung&Co
51%
SEPI INDRA 75%
4.25%
Navantia
Otobreda division
Elsag
100%
Fiat Spa
Ericsson Microwave
Saab S&E 100%
Empressa Portu. Defesa
33.3%
RUAG
50%
50%
DCNS
Intemis
50%
50%
Abeking&Rasmussen
Avimo 0%
Orbital Sciences
RACAL
Shorts
100%
100%
THALES
45%
GKN
BAE Systems
Aerosystems
50%
50%
Terma A/S
ITALY
UK
SPAIN- PORTUGAL
SCANDINAVIA
GERMANY
Marconi Mobile
MOSS 50%
ET Marinesystème
50%
50%
50%
SIGNAAL
NL
100%
Ex-STN
Armaris
FRANCE
35%
50%
SAGEM DS
100%
EADS Gmbh
100%
Thyssen Krupp
51%
49%
Source: Alpha

Final report overview102© BIPE 2007
Outline
Developments during the past decade and present industry structureDefining the defence industryOverview of demand trends: budgets, procurement, R&D expenditure, trade, competitiveness and market access conditionsTrend in employmentOrganisation of supply and changes therein: activities covered, key European defence producers, production location and country specialisations, trend in M&A, ownership structure, cross-border collaboration
ChallengesOutlook
Key factors influencing the futurePossible future scenarios
Anticipating change: examples of innovative practices

Final report overview103© BIPE 2007
Summary of the analysis of the presentsituation
Persistent primarily national procurement strategies : although in principle in favour of joint procurement – national procurement authorities often favour national entrepreneursStrict national rules hindered or prohibited foreign ownership of defence companiesThe juste retour principle in collaborative projects results in suboptimal procurementDifferences in arms exports complicates marketingSecuring jobs at home is used to legitimize cost-inefficient procurementThe management of cross-border collaboration projects is cumbersome, which leads to cost and time overrunsThe frequent recourse to Art. 296 has de facto prevented the implementation of the Single Market in the defence sector

Final report overview104© BIPE 2007
Yet …
The creation of the Regime on Defence Procurement and adoption of the EDTIB Strategy are important steps towards the creation of the European Defence Equipment Market and the strengthening of the European defence industry

Final report overview105© BIPE 2007
Summary of the key challenges for the future (1)
• Continued downward pressure on defence budgets (due to perceived trade-offswith social welfare expenditures)Rising input cost of equipment, and rising cost of R&D for new weapon systemsRising input costs for military personnel for an AVFThere has been a major change in the security situation, leading to a new required equipment mixAt the political level, despite intensive efforts, there is still no integrated or unified European defence marketThe EU member states do not have the financial means to sustain the full spectrum of a defence technology industrial base. This means continueddownward pressure on defence budgets (due to a preference for social welfarespending)At the industrial level, the defence industry is – with a few outstanding exceptions, most notably EADS and BAE Systems – still geared towards national procurementAt the technical level, the defence technology and research base is inadequate in most defence sectors to allow for national solutions. The new security risks have accelerated the race for innovations, resulting in increased demand for R&D resources.

Final report overview106© BIPE 2007
Summary of the key challenges for the future (2)
At the social level, the defence sector has experienced drastic reductions in employment. This process has slowed down in recent years. Additional job losses are, however, expected given the changing overall context.At the legal level, a range of political and legal guidelines have been designed and institutions were founded to improve coordination, to internationalise procurement and encourage competition. Art. 296 allows Member to derogate from general EU rules on a case-by-case basis when their essential security interests are at stake. The frequent recourse to Art. 296 has de facto prevented the implementation of the Single Market in the defence sector.In Eastern Europe, specific challenges are linked to the breakdown of supply chains afterthe fall of the Berlin Wall, and the new national defence strategies which put priority on national autonomy and restoring supply chainsNew technology will be coming on stream over the coming 25 yearsSupply-side changes are underway: mergers, privatisation, outsourcing, growth of servicesmarkets, etc.Competitive threat from US and emerging competition from China, Japan, Russia, Korea, India (both primes and suppliers), and IsraëlEC/EDA Policy on development of a EDEM and on EDTIB calls for major changesEDA debate on ways to mitigate adverse impact of offsets on fair competition in the EDEM, and EDTIBRisk of new threats

Final report overview107© BIPE 2007
Consequences of the fragmented European market
Duplication of research and development effortsUnnecessary duplication of capacities in the defence industry, hence inadequate utilization of the potential for rationalizationLack of standardization of military equipment, resulting in avoidable costsInefficiency and increased cost resulting from limited competitionA weak Europe in global markets

Final report overview108© BIPE 2007
Risks for the future (1)
Despite recent restructuring, the concentration and consolidation process in the EU is incomplete. Continued duplication of capacities and duplication of weapon programs leads to inefficienciesIf concentration continues on the national (or the bi-lateral) level, protected industries will become uncompetitiveThe collaboration experience is mixedFurther restructuring will imply social costs (notably job losses)
Result: difficult choices must be made

Final report overview109© BIPE 2007
Risks for the future (2)
Further consolidation increases the risk of domestic (national or EU) monopolies, oligopolies or duopolies with the consequences on the rate of dependence, inefficiencies and higher costsGovernment control will be reduced through outsourcing of traditional military functions The financial logic and shareholder value concept raise questions regarding the reliability of the delivery of defence products Governments remain torn between national and EU preferences on one side (with possibly higher cost but job security) and competition (with dependence on outside suppliers and job losses at home)

Final report overview110© BIPE 2007
Consequences for employment
The consequences for employment – and in particular for employment at local level – vary depending on the future development of the industryEmployment in the defence industries is often located in areas that are highly dependent upon it. The location of plants has usually been determined historically by security concerns and kept away from urban centres. Thus, local communities can heavily depend on developments in the activity in defence facilities and factoriesEmployment is also often highly skilled, very specialised. In particular one finds a higher proportion of engineers and scientists and higher levels of qualification than on average for industry. Although past experience indicates that most persons find a new job relatively easily after having been made redundant, this is not the case for all. For those who do find another job, this may not be an equivalent job (lower pay for example), entailing costs in terms of purchasing power and/or quality of life.To assess the social costs, it is essential to take into account the possible inter-changeability of workforce between the defence, security and civilian sectors and to compare blue and white collar workforce ratios in the various sectors (land, aerospace, naval)Increased geographical mobility of the workforce may also be required as a result of the restructuring and consolidation process.

Final report overview111© BIPE 2007
Outline
Developments during the past decade and present industry structure
Defining the defence industryOverview of demand trends: budgets, procurement, R&D expenditure, trade, competitiveness and market access conditionsTrend in employmentOrganisation of supply and changes therein: activities covered, key European defence producers, production location and country specialisations, trend in M&A, ownership structure, cross-border collaboration
ChallengesOutlook
Key factors influencing the futurePossible future scenarios

Final report overview112© BIPE 2007
The nine steps of the scenario building exercise
1. Definition of “underlying structural trends”2. Identification of key stakeholders3. Identification of structuring variables for the future4. Identification of the possible objectives of the stakeholders5. Rank the objectives for each stakeholder6. List shared objective and identify areas of conflict7. Map the influences / dependencies between players8. Analyse results9. Identify key questions for the future, and discuss their consequences

Final report overview113© BIPE 2007
The key stakeholders in European defenceindustries
Governments of major producing (exporting) countriesGovernments of client (=importing) countriesLocal governmentsUS GovernmentGovernments of competing producing countries (Russia, Japan, China, India)NATOEuropean organisations and regulators:
EC, EDA, OCCAR, LoI, etc.Private financial investorsForeign investors, with regulatory controlSystem integratorsPlatform producers and assemblersSpecialised subcontractorsCommodity contractorsWorkers’ representatives, trade unions

Final report overview114© BIPE 2007
The key factors that will influence the future
Common foreign and security policy (CFSP)European Industrial policy for defence industriesNational industrial policies for defence industriesValue and trend in (intra- and extra-EU) defence procurementAccess conditions to non-EU marketsCompetitor strategies (risks related to new entrants)Ownership, control and conditions of access to key technologiesAccess to key competencies (HR)Structure of the industry portfolio (civil vs defence)Degree of aversion to risk of (private) financial investors (venture capital, restructuring funds, pension funds,...)Financial investors' time horizon and expected rate of return on investmentOvercapacity problems / restructuringEfficiency (and amount) of R&D expenditureLabour market trends, risk of skill depletion/shortage, attractivenessproblems, etc.

Final report overview115© BIPE 2007
The assumptions common to all scenarios (1)
Geo-political:No major crisis, civil war or other in the worldContinued unrest in Middle and Far East regionsEurope continues to intervene in crisis prevention, but with a progressively growing share of civilian means
European CFSP/ESDP stance:Accepted by all nations but not necessarily fully in place over forecast horizon (5-7 years)
General macro-economic assumptions:Single assumption on world growth, exchange rate, oil prices, demographic growth in Europe

Final report overview116© BIPE 2007
The assumptions common to all scenarios (2)
General macro-economic assumptions (cont.):Government budgets remain under constraint due to ageingand social agendasThere are increased concerns over homeland securityLabour markets become tenseThe effective age of retirement in industry remains below the legal retirement ageSkill shortages develop in certain areas; immigration does not address all the needs:
Across countries: workforce ageing in eastern Europe is a major source of concernAcross skills : a high retirement rate is expected in all industrialsectors need for skills when size of cohorts falls

Final report overview117© BIPE 2007
In most of the new Member States, the population of working age will shrink over the coming decades
Trend in labour force - 2005-2035, in %
-30 -25 -20 -15 -10 -5 0
BulgariaLettoniaSlovenia
RoumaniaEstonia
Czech RepublicHungary
LatviaPoland
Slovakia

Final report overview118© BIPE 2007
The assumptions common to all scenarios (3)
Assumptions specific to DefenceDefence budgets and the value of European defence procurement fall as a share of GDP Budgetary pressures lead to increased outsourced services; Increased emphasis on securityNew equipment mix Equipment costs grow rapidlyNo significant growth in defence export markets, due to growing competitionon the world scene and the relocation of some activitiesThere are a number of regions of US influence which remain difficult to penetrate for European producersInvestment in new markets is mainly taking place through partnershipsEnd of the « revolving door » policy between the defence industry and defence (or other) ministries
Result : budgetary pressures and rising equipment costs lead to heigthenedintra-EU and extra-EU competition

Final report overview119© BIPE 2007
A variety of stakeholder objectives can beidentified, yet stakeholders do not pursue the same objectives
Achieve European security of supply through acquisition of majority or golden share of strategic supplier companiesAchieve national security of supply through acquisition of majority or golden share of strategic supplier companiesEstablish rules for European defence procurementAchieve security of supply through location of production facilities in "friendly" zonesFight for national autonomy with respect to choice of investments, programmes and procurement expenditureDefend the national champions' status of strategic companies (majority or full government ownership)
Examples of objectives:

Final report overview120© BIPE 2007
Influence – dependence matrixDirect influence only – preliminary resultsMajor producers are more dominant than indicated in certain countries
Expl
aini
ngth
e Pr
esen
t
Deg
ree
of in
fluen
ce
Dominant actor Relay actor
DependentactorNeutral actor
Degree of dependenceLow High
Low
Hig
h
0
5
10
15
20
25
0 5 10 15 20 25 30
Govt or primarilyProducing country
Govt of aPrimarilyClient country Local Gvt
Intl Orga.
US Govt
EuropeanFinancialInvestor
Major producerSpec. contractor
Capa. contractor
Trade unions
Govt of competitor countries

Final report overview121© BIPE 2007
Consequences of the present positioningof the key players on the objectives
National strategies dominate in terms of industrial organisationDuplication of capacity, inefficiency of overall R&D spentCommodity contractors are not the key focus of (national or EU) public policiesSmall role of workers unions and local government
Overcapacity and loss of technology race loss in competitiveness, lossin mkt share vis-à-vis US counteracted by delocalisation of selectedactivities and high compensations to be paid to get contracts abroad, reduction in production, plant closure etc.Need for some positions / priorities to change, new alliances to be builtScenarios will be differentiated based on which alliances are built, and how the relative positioning of the key players changes
Expl
aini
ngth
e Pr
esen
t

Final report overview122© BIPE 2007
The scenario framework
Various entry levels are possible :Demand trends and procurement policiesChanges in the organisation of supplyChanges in shareholding structuresDegree of « anticipation » and preparation of change versus «real-time » crisis management
We focus on scenarios which reflect different strategies –actions - of the stakeholders

Final report overview123© BIPE 2007
The chosen scenario framework
National procurementcontinues to dominate
No an
ticip
atio
n of
chan
ge / r
eal t
ime
crisi
sman
agem
ent
Antic
ipat
ion
Early shift to harmonisedEuropean procurement
Direct employment effect
Indirect employment effect
Direct employment effect
Indirect employment effect
Direct employment effect
Indirect employment effect
Direct employment effect
Indirect employment effect

Final report overview124© BIPE 2007
Scenario 1 key assumptions: Early move to harmonised European procurementand set-up of a voluntary industrial policy (1)
A Single European Procurement Agency is created, which:Coordinates European procurement (as an interim step to a longer termapproach of centralised European defence procurement, for several types of expenditures)Simplifies controls on intra-EU equipment circulationDefines a harmonised EU framework for, and regulates, offsets Is complemented by a European Small Business Act or an equivalent to this, which succeeds in achieving increased concentration at Tier 2 and higherlevelsGrants European preference:
To retain specialised know-howTo avoid too rapid internationalisation of capital (from US, China, …)For security of supply reasons
Indirectly (or directly?) fosters the extension of dual firms by opening accessto contracts to companies primarily in civilian area
This goes along with a re-organisation of armed forces at EU level, lowering the overall equipment needs of a coordinated EU defence force

Final report overview125© BIPE 2007
Scenario 1 key assumptions: Early move to harmonised European procurementand set-up of a voluntary industrial policy (2)
Regions play an increasing role in industrial development, through decentralisationand the subsidiary principleInnovative financing of capital investments are put in place which facilitate mergersat lower tier levelsEU policy centres on promoting a pooling of technological capabilities between the major producing countries, in order to:
Ensure that synergies are developed between national defence R&T spendingGenerate economies of scale in development and production through dual-use technologies and applications
Coordinated R&D efforts mean:Reduction in overall financial spent (no duplication of efforts) This allows for the development of new programs, and to the allocation of part of the saving to other (non-R&D related) purposes (such as training, or financial assistance to industrial redeployment in affected regions, …)The reduction in overall amount of R&D spent implies a rationalisation of the test and expertise centres

Final report overview126© BIPE 2007
Scenario 1 results: Early move to harmonised European procurementand set-up of a voluntary industrial policy
Acceleration of restructuring along pan-European lines:Mainly in the naval and land defence sectors, but also in electronics and aerospace (future of Finmeccanica, for example), including at lower tier levels
Progressive Europeanisation of ownership leading to redeployment of activities alongnational lines, through market driven changes in regional and country specialisations:
Emergence or strengthening of regional defence « clusters », their strength depending on the degreeof anticipation and supportWeakening of others, requiring transformation
Improved ability to negotiate better transatlantic defence trade cooperation and technologytransfer conditions, leading to a slower decline or an improvement in European producers’world market sharesR&D efforts are re-deployed: less duplication of programmes, less waste of resourcesImproved transatlantic cooperation, including through JV, partnerships or acquisitions
This is especially true if improved conditions for transatlantic defence trade are put in place (history shows that because of the persistence of national strategies, US and other non-EU producers were able to increase their presence in Europe and increase competition for EU producers in other countries)
The ability to reap economies of scale in development and production increases the pricecompetitiveness of equipment, which improves Europe’s world market shareComplementarity between civilian and defence markets (becomes) developsYet, there is no shortening of development cycles, and no major change in terms of the cyclicality of demand

Final report overview127© BIPE 2007
Scenario 1 results - Variant 1No anticipation – real time crisis management
Employment in the EU defence industries fallsThere is a risk of skill depletion, which goes against the objectives of the Single European Procurement Agency and overall policy objectivesNational governments’ efforts are redeployedAlliances between the trade unions and regions are needed in order to minimise the negative consequences at local level

Final report overview128© BIPE 2007
Scenario 1 results - Variant 2Anticipation and preparation of change
Budgetary savings are oriented towards training, facilitating mobility, supporting new business creation, R&D etc. Employment declines, but anticipatory action increases the likelihood for workers that were made redundant to find another job or start a new businessThe risk of skill depletion is much less than in the first variantOne foresees an important role of the trade unions and/or regionalgovernments to enhance the attractiveness of regions for «industrialdefence and/or high tech clusters», and support the transformation of regions in declineThe defence producers have more autonomy and control of the value chain: they become relay agents (note: this is already the situation in the UK, but it develops elsewhere)

Final report overview129© BIPE 2007
Positioning of the stakeholders in the European Procurement Scenario
0
5
10
15
20
25
0 5 10 15 20 25 30
Gvt producer
Gvt client
Local Gvt
Intl Orga.
US Gvt
LendersEquity owners
Major producerSpec. contractor
Capa. contractor
Trade unions
Competitor Gvt
Dominant actor Relay actor
DependentactorNeutral actor
Degree of dependence
Degr
eeof
influ
ence
0
5
10
15
20
25
0 5 10 15 20 25 30
Gvt producer
Gvt client
Local Gvt
Intl Orga.
US Gvt
LendersEquity owners
Major producerSpec. contractor
Capa. contractor
Trade unions
Competitor Gvt
Dominant actor Relay actor
DependentactorNeutral actor
Degree of dependence
Degr
eeof
influ
ence
Low High
Low
Hig
h

Final report overview130© BIPE 2007
Scenario 2 key assumption: National Procurement strategies continue
Budgetary pressures and rising equipment costs lead to heigthened pricecompetitionCompetition between mainly exporting and mainly importing countries leads to intense intra-EU competition amongst defence producers, and heightened competition with non-EU producersThe EU market penetration of non-EU producers increases. Offsets are granted to the client countries, adding to existing overcapacititesRestructuring continues to be organised primarily along national linesDuplication of R&D efforts and new programmes continuesEventually, some capacities are closed and markets become more Europeanised, but with higher penetration of non-EU capitalMarket failures in labour markets lead to state intervention to ‘correct’ such failures

Final report overview131© BIPE 2007
Scenario 2 results: National Procurement strategies continue
Under pressure from their clients, the large (tier 1) producerstransfer some of the pressure onto their suppliers:
Delegation of R&D responsibilities (and associated risk)Increase in payments delay, fragilisation of the financialsituation of tiers 2 and higherNew funding resources are sought for : the capital of firms isopened to private investors; the penetration of foreign capital increases(Financial) markets drive the restructuring of the European defence industry base in the mainly importing countriesGovernments resist in the mainly producing countries, leadingto a persistence of overcapacities and increased spreadbetween companies at different tier levels

Final report overview132© BIPE 2007
Scenario 2 results - Variant 1No anticipation – real time crisis management
Employment fallsRisk of skill depletionLimited room for manœuvre for national governments to redeploy their efforts due to intense price-competition and high cost of sustaining national defence industryThe role of financial investors rises, starting from the (mainlyimporting) countries, and from high tier levels, movingprogressively up the value chain : this leads to a search for financial efficiency and increased cost effectiveness: activitiesare relocated in non-EU countries, leading to further falls in employment

Final report overview133© BIPE 2007
Scenario 2 results - Variant 2Anticipation and preparation of change
Employment declines, but anticipatory action increases the likelihood for workers made redundant to find another job or start a new businessThe risk of skill depletion persists but is less than in previousscenarioOne sees trade unions and regional governments playing an important role in this scenario, in order to enhance the attractiveness of regions for «defence clusters» and to support transformation of regions in declineFinancial players also see their role increased : this leads to a search for financial efficiency, cost effectiveness, and a globalisation of production sites : some (non sensitive) capacities are relocated in non-EU countries, but less than in the previous scenario

Final report overview134© BIPE 2007
Positioning of the stakeholders in the National Procurement Scenario
0
5
10
15
20
25
0 5 10 15 20 25 30
Gvt producer
Gvt client
Local Gvt
Intl Orga.
US Gvt
US fundsEquity owners
Major producerSpec. contractor
Capa. contractor
Trade unions
Competitor Gvt
Dominant actor Relay actor
DependentactorNeutral actor
Degree of dependence
Degr
eeof
influ
ence
0
5
10
15
20
25
0 5 10 15 20 25 30
Gvt producer
Gvt client
Local Gvt
Intl Orga.
US Gvt
US fundsEquity owners
Major producerSpec. contractor
Capa. contractor
Trade unions
Competitor Gvt
0
5
10
15
20
25
0 5 10 15 20 25 30
Gvt producer
Gvt client
Local Gvt
Intl Orga.
US Gvt
US fundsEquity owners
Major producerSpec. contractor
Capa. contractor
Trade unions
Competitor Gvt
Dominant actor Relay actor
DependentactorNeutral actor
Degree of dependence
Degr
eeof
influ
ence
Dominant actor Relay actor
DependentactorNeutral actor
Degree of dependence
Degr
eeof
influ
ence

Final report overview135© BIPE 2007
Comparison of the trend in employment in the different scenarios : possible outcomes
EPC, no anticipation
time2007 2007+4-5 years 2007+8-10 years
Total defence and civil-related industrialemployment, direct and indirect, in 000
-30%
2007+2-3 years
EPC = European ProcurementConvergence
1 640

Final report overview136© BIPE 2007
Comparison of the trend in employment in the different scenarios : possible outcomes
EPC, anticipation
EPC, no anticipation
time2007 2007+4-5 years 2007+8-10 years
Total defence and civil-related industrialemployment, direct and indirect, in 000
-30%
2007+2-3 years
EPC = European ProcurementConvergence
1 640

Final report overview137© BIPE 2007
Comparison of the trend in employment in the different scenarios : possible outcomes
Natl proc, no anticipation
EPC, no anticipation
EPC, anticipation
time2007 2007+4-5 years 2007+8-10 years
Total defence and civil-related industrialemployment, direct and indirect, in 000
-30%
2007+2-3 years
-50%
EPC = European ProcurementConvergence
1 640

Final report overview138© BIPE 2007
Comparison of the trend in employment in the 4th scenario with anticipation
Natl proc, no anticipation
EPC, no anticipation
EPC, anticipation
time2007 2007+4-5 years 2007+8-10 years
Total defence and civil-related industrialemployment, direct and indirect, in 000
-30%
2007+2-3 years
-50%
EPC = European ProcurementConvergence
1 640
Natl proc with anticipation

Final report overview139© BIPE 2007
Outline
Developments during the past decade and present industry structureDefining the defence industryOverview of demand trends: budgets, procurement, R&D expenditure, trade, competitiveness and market access conditionsTrend in employmentOrganisation of supply and changes therein: activities covered, key European defence producers, production location and country specialisations, trend in M&A, ownership structure, cross-border collaboration
ChallengesOutlook
Key factors influencing the futurePossible future scenarios
Anticipating change: examples of innovative practices

Final report overview140© BIPE 2007
Anticipating change : how can the social effects of restructuring be minimised ?
Various instruments are available to help preparerestructuringsThe next section outlines some of these, and presentsexamples of « good practices » of anticipation, to fuel the discussionAlthough there are clear national features that need to betaken account of, the examples show that there are somecommonalities of measures, and a number of ideas worthbuilding onMeasures also involve different stakeholdersPreparation of anticipation needs concerted efforts and coordinated actions : this will be the objective of the nextmonths

Final report overview141© BIPE 2007
Anticipating restructuring requires differenttypes of actions at difference times (1)
Anticipatory actions, designed to prepare the changes to comeDevelopment of a permanent ability to changeImprovement of forecasting abilitySocial dialogue
Preventive actions, designed to reduce risks and limit damage whenchanges occur
Early warning and transparency of decisions takenDecisions on the number of people and types of skills concerned by restructuringSelection of employees impacted by the decisions/measures takenPreventive management of the effects of lay-offs on persons and regions

Final report overview142© BIPE 2007
Anticipating restructuring requires differenttypes of actions at difference times (2)
Curative actions, aimed at helping actors to manage the residual consequences of change
Repair actions, to eliminate the dangers to which individualsand regions are exposed to after dismissal (ex post):
Support actions aimed at individualsRedeployment actions for the affected regions
Evaluative actions, aimed at measuring the results obtainedand organising exchanges between stakeholders, to favourlearning
Norm-referenced assessments as results measurementQuantitative and qualitative assessments, as piloting toolsFeedback as learning tools

Final report overview143© BIPE 2007
Restructuring can take different forms, each requiring different responses
Among the causes of restructuring are:MergersPlant or research centre closureShift in technology or product
Companies are not identical in the face of restructuring:Differences in size, resources, sectors, independence or dependence on companies at other levels of the supply chainall influence the way the social consequences of a given event

Final report overview144© BIPE 2007
Different stakeholders are involved
Stakeholders potentially impacted by restructuring are:The company’s employees and managersThe employees of companie up- or down-stream from the company, since these can also be at risk
Stakeholders that need to be involved in the anticipation of restructuring include all of the above, plus:
Trade unionsTraining centres and the education systemRegional authorities….

Final report overview145© BIPE 2007
Anticipating change in the defenceindustry: learning from experience
The objective of anticipatory action is to achieve constant readiness for change. This involves developing what isneeded for/maintain ability to/ adapt to change whenrestructuring occurs :
Trust, mutual knowledge, actors’ networks, coordination between actors, regional and local development strategies, employability, aids to small businesses to increase theirresistance to change
Many of the « good practices » in this area are schemeswhich were not originally designed to anticipate change, but which have nevertheless proved to be extremely useful to minimise the consequences of restructuring.

Final report overview146© BIPE 2007
Examples of anticipatory actions
The UK Union Learning Representatives (LRS) experience, aimed at enhancing employabilityThe Swedish Validation Centre Experience, to acknowledgeskills and competencies
Other approaches include the « recognitiion od work-derivedexperience » in France (Validation des Acquis de l’Expérience –VAE), and the lifelong learning approach privileged in the UK
Work time arrangements and changes in work organisation, to reduce the negative effects of business cyclesFinancial support schemesThe German Working Time Accounts’ scheme, to retainskilled employees

Final report overview147© BIPE 2007
Preventive actions
The objective of preventive action is to prevent risks for companies, workers and regions or territories that are relatedto the consequences of the restructuring announcementExamples of good practices in this area include:
The Luton partnership committee experience in dealing withclosureThe Cap Compétences experience in managing change and contractors
These experiences show that creative and voluntary actions are useful to reduce negative spill-over or ex post effects of restructuring

Final report overview148© BIPE 2007
Curative actions
The objective of curative actions is to manage the consequences of restructuring.Different schemes exist across the EU:
Transfer companies in GermanyForem reconversion units in BelgiumJob security councils in SwedenTransitional professional contracts and Redeployment contracts in FranceOutplacement units, in most EU member states
Among these, two are quite innovative:The Swedish Job Security Council experience to deal withoutplacement at sectoral levelThe French redeployment contracts which limits the spill-over effectsof restructuring on a territory

Final report overview149© BIPE 2007
Evaluative actions
There is a clear lack of information on the effectiveness and efficiency of the different schemesThis is an obvious area of improvement

Final report overview150© BIPE 2007
Company schemes
Two examples of innovative schemes at company level are ground breaking and inspiring:
The Thales AgreementThe Saab experience
These schemes are more appropriate for large, integrated, groupsTheir extension to multi-country settings remains to be testedTheir application to smaller companies probably implies the involvement of other stakeholders, such as regionalauthorities, training structures etc.

Final report overview151© BIPE 2007
The 2006 Thales AgreementJoint agreement on anticipation of employmentevolution, professional careers and training
The Agreement covers 3 main themes:Retirement for older workersAnticipation of changeManaging change
The rationale for the Agreement is as follows:Business climate and companies or markets change require qualitative and quantitative adjustments in terms of employment. Anticipation of thesechanges, development of social dialog, employees’ disposal to securetheir job course. The very notion of prevention is a major axis of thisagreement. Anticipating change is to commit oneself to identify possible danters, to prevent their consequences and to seize opportunities whenappearing. Therefore, being on anticipation entails allowing everyone to prepare for his or her future career by a better information, mobilitypromotion and access to training enhancement.

Final report overview152© BIPE 2007
Anticipation of change at Thales (1)
Set-up of a commission of 10 trade union representatives and 10 representatives of management, responsible for:
Mapping of group employment by trade and social categoryProspective (3-year) analysis of HR needs by professionalfamily, based on an outline of group strategy and industrialchoicesList of units, local labour markets and activities under threat for the coming 3-yearsLong-term analysis of technological changes, ages pyramids by trade and list of trades (business segments) which needadaptation plansIdentification of bridges between trades

Final report overview153© BIPE 2007
Anticipation of change at Thales (2)
Anticipatory measures include:Voluntary participation to training schemes, and annualprofessional development meetingsProvision of career audits after 5-years in the company, every10 yearsSkill audits for employees at times of changeMobility enhancement measuresFoster professional mobility through the skills audits, training, work derived experience validation and guardians to help employees during their move

Final report overview154© BIPE 2007
Anticipation of change at Thales (3)
Increased worker adaptability through active employmentmanagement:
The third chapters details what has to be done when economicproblems are forecast or when technological change entailschange in employment and skillsTwo mains types of tools are described:
Information and consultation proceduresMeasures that may be chosen by the employees on a voluntary basis
The objective is to avoid social plans and reduce the negativesocial consequences of restructuring

Final report overview155© BIPE 2007
Lessons from the Thales experience
Although it is too early to draw conclusions on the degree of effectiveness of the agreement…Lessons learned include:
The importance of permanent social dialogueMutual trust needed to allow transparency in information sharingAnticipation therefore requires both technical skills and expertise, and the use of social dialogue as a tool to developshared diagnose and shared responses, thereby increasingtheir acceptability by the various interests represented.

Final report overview156© BIPE 2007
The Saab Microwave Systems experience
A major competence shift was required in 2003 in order to adapt to changing markets, due to the downward trend in defence markets and the high potential of civil productionThis implied a need to develop new skills and a need to hireworkers with new competencies, while workers with obsoleteskills were to be phased outThe objective was that 200 workers would voluntarily leavethe company (10% of the total workforce). Eventually, the number of resignations increased to 500, while 100 recruitments took place.

Final report overview157© BIPE 2007
The processs at Saab Microwaveinvolved:
Information of all workers, on the need for change and objectives of the programmeTraining of the managers, to help them to move from a directive management style to a leadership style involving coaching
The objective of coaching was to get employees to make their ownchoicesManagers were explicitly told not to point out any employee
Organisation of eight bilateral meetings between each employee and his/her manager, over a five months periodDevelopment, by each employee, of an action plan (to be completed at the latest 3 months after the last meeting), covering:
The conclusions of the previous conversations with the managersThe individual’s choice for the future

Final report overview158© BIPE 2007
Results of the Saab Microwave approach
Around 400 employees chose to leave the company:60 were offered early retirement, 42 accepted it18 of the employees leaving the company were considered to be« key contributors »: a quarantine agreement was reached to preventthem from starting competing activities in the first 2 yearsOthers were offered a 12 months programme with full salary and preparation to take another job
Management estimates that the costs were 25% below what wouldotherwise have been the caseTrade unions were not directly involved in the process, but invited to provide feedback on employees’ concerns and opinions on the processAgain, trust and extensive pre-paration was needed to achieve results

Final report overview159© BIPE 2007
Conclusions & recommendations
There is a need for more precise data on employment levels in defence industries, by tier level, in all EU-27 countries, as well as a mapping of employmentconcentrationsThere is also a need for up-to-date (i.e. frequently updated) estimates of future Europe-based employment levels in the defence companies, based on announcedrestructuring and reorganisation plansThere is a need for a continuous monitoring of the social consequences of restructuring, through the development of ad hoc indicators on:
What is the transition period?Which skills are transferable and which are non-transferable? What share of displaced workers find a new job within 3 months, 6 months, 1 year, etc.?Is the qualification level in the new job equivalent?What are the wages in alternative occupations/jobs? What is the share of persons moving to civil versus other defence activities?Etc. :
An appropriate typology has to be developed, based on past experience)……in order to be better able to assess the effectiveness of different approaches of anticipation and managing change, and the associated costs

www.bipe.com