anti-inflammatory treatment in ad mice protects against ... cortex of app transgenic mice at 18...
TRANSCRIPT
Experimental Neurology 223 (2010) 377–384
Contents lists available at ScienceDirect
Experimental Neurology
j ourna l homepage: www.e lsev ie r.com/ locate /yexnr
Anti-inflammatory treatment in AD mice protects against neuronal pathology
Ji-Kyung Choi a,1, Bruce G. Jenkins a,1, Isabel Carreras b,c, Sukru Kaymakcalan b,d, Kerry Cormier b,d,Neil W. Kowall b,d, Alpaslan Dedeoglu a,b,d,⁎a Department of Radiology, Massachusetts General Hospital and Harvard Medical School, Boston, MA 02114, USAb Department of Veterans Affairs, VA Boston Healthcare System, Boston, MA 02130, USAc Department of Biochemistry Boston University School of Medicine, Boston, MA 02118, USAd Department of Neurology Boston University School of Medicine, Boston, MA 02118, USA
⁎ Corresponding author. Geriatric Research EducationBedford Veterans Affairs Medical Center, 200 Springs RFax: 617 687 3515.
E-mail address: [email protected] (A. Dedeoglu).1 Contributed equally to the study.
0014-4886/$ – see front matter. Published by Elsevierdoi:10.1016/j.expneurol.2009.07.032
a b s t r a c t
a r t i c l e i n f oArticle history:Received 7 April 2009Revised 17 July 2009Accepted 23 July 2009Available online 10 August 2009
Keywords:A-BetaAlzheimer's diseaseAmyloidCelecoxibIbuprofenMagnetic resonance spectroscopyMicePlaquesPresenilin
Prior studies suggest that non-steroidal anti-inflammatory drugs (NSAIDs) may lower the incidence ofAlzheimer's disease (AD) and delay onset or slow progression of symptoms in mouse models of AD. Weexamined the effects of chronic NSAID treatment in order to determine which elements of the pathologicalfeatures might be ameliorated. We compared the effects of the NSAIDs ibuprofen and celecoxib onimmunohistological and neurochemical markers at two different ages in APPxPS1 mice using measurementsof amyloid plaque deposition, Aβ peptide levels, and neurochemical profiles using magnetic resonancespectroscopy (MRS). At 6 months of age, few neurochemical changes were observed between PSAPP miceand WT mice using MRS. Ibuprofen, but not celecoxib, treatment significantly decreased the Aβ42/40 ratio infrontal cortex at 6 months, but overall amyloid plaque burden was unchanged. Consistent with prior findingsin mouse models, at 17 months of age, there was a decrease in the neuronal markers NAA and glutamate andan increase in the astrocytic markers glutamine and myo-inositol in AD mice compared to WT. Ibuprofenprovided significant protection against NAA and glutamate loss. Neither of the drugs significantly affectedmyo-inositol or glutamine levels. Both ibuprofen and celecoxib lowered plaque burden without a significanteffect on Aβ1–42 levels. NAA levels significantly correlated with plaque burden. These results suggest thatselective NSAIDs (ibuprofen and possibly celecoxib) treatment can protect against the neuronal pathology.
Published by Elsevier Inc.
Introduction
Definitive diagnosis of Alzheimer's disease (AD) can be establishedonly through postmortem examination of brain tissue. Developmentof markers to diagnose AD thus represents a major challenge.Advances on this front will also have critical implications for testingpotential therapeutics. Finding markers that can reliably monitorprogression of the disease with high sensitivity will be useful to getpatients earlier in the disease process as well as to obtain goodstatistical power in a shorter period of time. Finding potential markershas been rendered more efficient through development of mousemodels of AD. Development of mouse models makes it possible towork on the mechanisms of disease as well as to efficiently testtherapeutics. A number of different mouse models of AD have beendeveloped based upon genes associated with human familial AD(reviewed in McGowan et al., 2006). These mice replicate variousfeatures of the human disease including senile plaques and cognitive
and Clinical Center, Unit 182B,oad, Bedford, MA 01730, USA.
Inc.
deficits and tau pathology, thus providing the potential to investigatevarious potential markers for these elements of the pathology.
Magnetic resonance spectroscopy (MRS) is a noninvasive tech-nique that permits the quantification of metabolic biomarkers in vivoand in vitro and has been used to characterize Alzheimer's disease(Kantarci et al., 2000; Shonk et al., 1995). Studies in humans showdecreasedN-acetylaspartate (NAA, a marker for neuronal number andhealth) and increasedmyo-inositol, which may either be a marker forosmotic stress or astrogliosis in AD (Valenzuela and Sachdev, 2001).The myo-inositol/NAA ratio was proposed, with some success, as ameans for distinguishing between AD and other dementias (Shonk etal., 1995). We previously reported that the metabolic profile ofAPPTg2576 transgenic mice is altered (Dedeoglu et al., 2004). Taurine isincreased and NAA, glutamate, and glutathione are decreased in thecerebral cortex of APP transgenic mice at 18 months of age when betaamyloid (Aβ) deposits are widespread. T2 images of the brainssuggest that ventricular size is increased. Other studies in doubletransgenic Alzheimer mouse models that express both APP andhuman presenilin show parallel findings: decreased NAA andglutamate (Marjanska et al., 2005; von Kienlin et al., 2005) andincreased myo-inositol (Marjanska et al., 2005).
Many studies suggest that non-steroidal anti-inflammatory drugs(NSAIDs) may either delay onset or slow progression of Alzheimer's

378 J.-K. Choi et al. / Experimental Neurology 223 (2010) 377–384
disease (in t' Veld et al., 2001; Jantzen et al., 2002; Kopito, 2000;Weggen et al., 2001) and reduce Aβ deposition in transgenic miceoverexpressing human amyloid precursor protein (APPTg2576)(Dedeoglu et al., 2004; Kopito, 2000; McGeer and McGeer, 2007).Ibuprofen reduces the generation of Aβ1–42, the most toxic Aβ species,in addition to its well-known role as a cyclooxygenase (COX) inhibitor(Weggen et al., 2001). We recently found that ibuprofen reduces Aβand hyperphosphorylated tau in a triple transgene AD model (McKeeet al., 2008).
Fig. 1. Representativepictures from6-and18-month-oldPSAPPmice. Front plane: the sections tsections per brain were used for quantification of plaque burden. Most anterior section was at tapproximately 0.6-mm thickness. This area is comparable to the cortex that we dissected out
In spite of extensive study of ADusing bothhistologicalmethods andmagnetic resonance spectroscopy, there are little data relating the twomodalities. This study was, therefore, designed to examine therelationship between cortical levels of neurochemicals detected byMRS (i.e., NAA, myo-inositol) and with neuropathological changes(amyloid plaque burden detected by immunohistochemistry andmeasured by morphometric methods) and Aβ1–40 and Aβ1–42 levelsdetected by ELISA. We then examined the effects of ibuprofen andcelecoxib treatment on these parameters. Brain tissue was collected
hat are immunostainedwithAβ1–40. Backplane: sections stainedwithAβ1–42. Three 50-μmhe bregma level (anterior commissure) and 0.3 and 0.6 mm posterior to bregma coveringfor in vitro MRS and ELISA for neurochemical profiling and Aβ measurements.

Fig. 2. Effects of NSAID treatments onAβ and plaque levels. (A) Plaque burden (expressed as a fraction or cortical areas) at 16–18monthsmeasured as a function of NSAID treatment. Bothcelecoxib and ibuprofen were significantly different from untreated animals. (B) Effects of NSAID treatment on Aβ as measured using ELISA—there were no effects of treatment.
Table 1Neurochemical concentrations in frontal cortex in the WT, AD, and AD-treated mice.
Chemical WT(n=10)
AD Reg(n=10)
AD Cel(n=9)
AD Ibu(n=9)
Significance
Alanine 0.79±0.06 0.79±0.03 0.55±0.07 0.63±0.07 c,d,eAspartate 0.87±0.11 0.88±0.14 0.79±0.08 0.94±0.12 NSCholine 1.21±0.05 1.30±0.04 1.22±0.04 1.39±0.07 NSCreatine 8.26±0.29 8.03±0.21 8.15±0.22 8.41±0.27 NSGABA 2.71±0.37 2.62±0.27 2.98±0.35 3.33±0.51 NSGlutamate 7.78±0.20 6.78±0.22 6.71±0.33 7.53±0.31 a,cGlutamine 4.12±0.22 4.84±0.20 5.06±0.28 5.15±0.24 a,b,cGlutathione 0.96±0.15 1.12±0.15 1.20±0.11 1.27±0.14 NSGlycine 1.92±0.20 1.79±0.11 1.92±0.11 1.96±0.11 NSLactate 9.55±1.14 9.26±0.44 8.50±0.48 9.46±0.22 NSmyo-Inositol
4.89±0.23 5.82±0.14 5.67±0.13 5.87±0.19 a,b,c
NAA 4.90±0.10 4.21±0.07 4.58±0.06 4.54±0.08 a,b,c,d,eSuccinate 0.85±0.05 0.81±0.04 0.80±0.05 0.90±.04 NSScyllo-inositol
0.09±.01 0.11±0.01 0.13±0.02 0.11±0.01 NS
Taurine 8.54±0.17 8.53±0.14 8.35±0.16 8.67±0.20 NS
All concentrations reported as μmol/g wet weight.Reg, regular diet; Cel, celecoxib-fed; Ibu, ibuprofen-fed.Significance (Tukey's HSD): a, Reg different than WT; b, Ibu different than WT; c, Celdifferent thanWT; d, Reg diff than cel; e, Reg different than ibu; f, Cel different than ibu.
379J.-K. Choi et al. / Experimental Neurology 223 (2010) 377–384
from the samemouse for histopathology, Aβ levels, and in vitroMRS foraccurate correlations.
Materials and Methods
Mice
Heterozygous transgenic male mice overexpressing the human Aβwith the Swedish mutation (Hsiao et al., 1996), APPTg2576 werecrossbred with homozygous transgenic female mice expressingmutant human presenilin-1 (PS-1M146V) to generate double trans-genic mice heterozygous for APP and PS-1 (PSAPP). Littermates wildtype for APP and heterozygous for PS-1 were used as control andreferred to as wild type (WT) throughout the manuscript. Mice werestudied at either 6months of age or between 16 and 18months of age.The average ages of the animals were WT n=10, 580±11 days;celecoxib n=9, 500±6 days; ibuprofen n=9, 536±3 days; regulardiet n=10, 540±10 days of age.
Diet and drug protocol
Ibuprofen (Sigma, 375 ppm) or celecoxib (120 ppm) wasformulated into animal diets (Research Diets Inc., NJ, USA). Bothdrug treatments were started at 1 month of age. Mice weremonitoredfor general well being and had weekly body weights and daily foodconsumption measured.
Tissue collection
Mice were euthanized, and brains were removed. The lefthemisphere was post-fixed with the periodate–lysine–paraformalde-hyde solution for 24 h and cryoprotected in a graded series of 10% and20% glycerol/2% DMSO solution for histological analysis. The righthemisphere was dissected coronally at the bregma level and 1 mm ofcortical tissue, anterior to bregma was saved for the ELISA assay, and1 mm thick posterior to bregma was saved for in vitro MRS.
Histology/Immunohistochemistry
Brains were serially cut at 50 μm on a freezing microtome andwere immunostained for Aβ1–40 and Aβ1–42 to define Aβ deposits.Immunohistochemical procedures were performed as previouslydescribed (Kowall et al., 2000). In brief, free-floating sections wereincubated overnight in primary antibody followed by PBS washes andincubation in peroxidase-conjugated secondary antibody followed bydevelopment using DAB as a chromagen.
Quantitative analysis of Aβ deposits
Three serial sections per mouse brain were analyzed blindlyusing Stereo Investigator v. 6.55 (MicroBrightField Inc.) at 40×magnification. The most rostral section analyzed was at the anteriorcommisure level (≈0.1 mm anterior to bregma), and eachsuccessive section was at 0.3 mm increments caudal to the first. Ineach section, the cortex was manually traced and then plaques overa threshold diameter of 7.6 μm were traced automatically aftermanual verification. Cortex area, total plaque area, plaque areafraction, and plaque count were then exported to Microsoft Excel foreach section using Neurolucida Explorer v. 4.50.4 (MicroBrightFieldInc.) and custom software.
ELISA assay
Dissected cortical brain tissue was homogenized with 8:1 (vol:mass) in cold 5M guanidine HCl/50 mM Tris–HCl and diluted 1:1500with Dulbecco's phosphate-buffered saline (DPBS) containing 5% BSAand 0.03% Tween-20 supplemented with Protease Inhibitor Cocktail(Calbiochem) and a solid phase sandwich ELISA for Aβ40 and Aβ42 was

380 J.-K. Choi et al. / Experimental Neurology 223 (2010) 377–384
performed following the manufacturer's instructions (BioSource).Briefly, homogenized samples were added into the wells of a 96-wellplate precoated with a monoclonal antibody specific to the NH2-terminus of Hu Aβ to capture APP and all Aβ processed forms. Sampleswere then mixed with a cleavage-specific antibody to either Aβ40 orAβ42. After overnight incubation at 4 °C, plates were washed andincubated with the secondary antibody for 30 minutes at 25 °C.Washed wells were developed by the addition of a substrate. Thesubstrate reaction was then stopped and color intensity wasmeasured at 450 nm.
MR spectroscopy and imaging
MR of the mice was performed at 9.4T (Bruker, Billerica MA)using dual concentric surface coils of diameter 5 cm for transmit and1.5 cm for receive. Animals were kept warm with a 38 °C circulatingwater blanket. Animals were anesthetized using 1.5% halothane inan NO2/O2 mixture. T2-weighted RARE spin echo MR images (TR5000; effective TE 100 ms; RARE factor 8) were collected withspatial resolution of 0.15 mm in plane and consecutive 0.6 mmslices. MR spectroscopy was performed as previously reported(Dedeoglu et al., 2004; Jenkins et al., 2000). Briefly, voxels wereplaced centered over the hippocampus (subiculum). Voxel sizeswere tailored to the size of the brain. The average voxel size was2×2.2×2 mm (ca. 10 μL). Spectra were recorded using a PRESStechnique with a TR of 2.2 s and TE values of 15 and 144 ms. Datawere processed using curve fitting of the spectra, and intensitieswere integrated. Resonance integrals were normalized to thecreatine peak. Collection of the two TE values allowed for correctionsin the T2s of the metabolites that might occur because of differencesbetween the transgenic and wild-type animals. In vitro MRS
Fig. 3. Effects of NSAID treatment on MRS measures. (A) Plots of the effects of NSAID treatmNAA measured in vivo. (C) Typical in vitro MRS spectrum in WT and AD regular diet mice
measurements were made from PCA brain extracts of corticalbrain tissue and were run on a 14-T Bruker spectrometer. Sampleswere prepared in 99.9% D2O (pH 7.2) and run at 26 °C and 3-trimethylsilylpropane sulfonic acid (DSS; 0.5 mM) was used as aninternal standard. Spectra were analyzed as previously published(Dedeoglu et al., 2004; Jenkins et al., 2000).
Data analysis
We performed ANOVA factorial analysis for comparisons of thedifferent animal groups and the various metabolite, biochemical, andhistological measures. The Tukey (honest significant difference, HSD)test was used for post hoc analysis of the variables when the omnibusgroup one-way ANOVA was significant. We constructed receiveroperator curves to determine which of the various spectroscopicmarkers generated optimal sensitivity for discrimination between thegroups. We also performed linear discriminant analysis to determinethe ability of the markers to differentiate between the groups. Thesedata were subjected to holdout analysis. In addition, we performed aseries of regression analyses and Pearson product moment correla-tions to compare the different metabolite and histopathologicalvariables.
All studies were conducted in accordance with local and nationalstandards for treatment of laboratory animals.
Results and Discussion
Young mice at 6 months of age
At 6 months of age, when there is small but significant plaqueaccumulation in the PS1xAPP mice (see Fig. 1), there were no
ent on NAA, glutamate, glutamine, and myo-inositol. (B) Effects of NSAID treatment onat 18 months of age. ⁎pb0.05 by ANOVA.
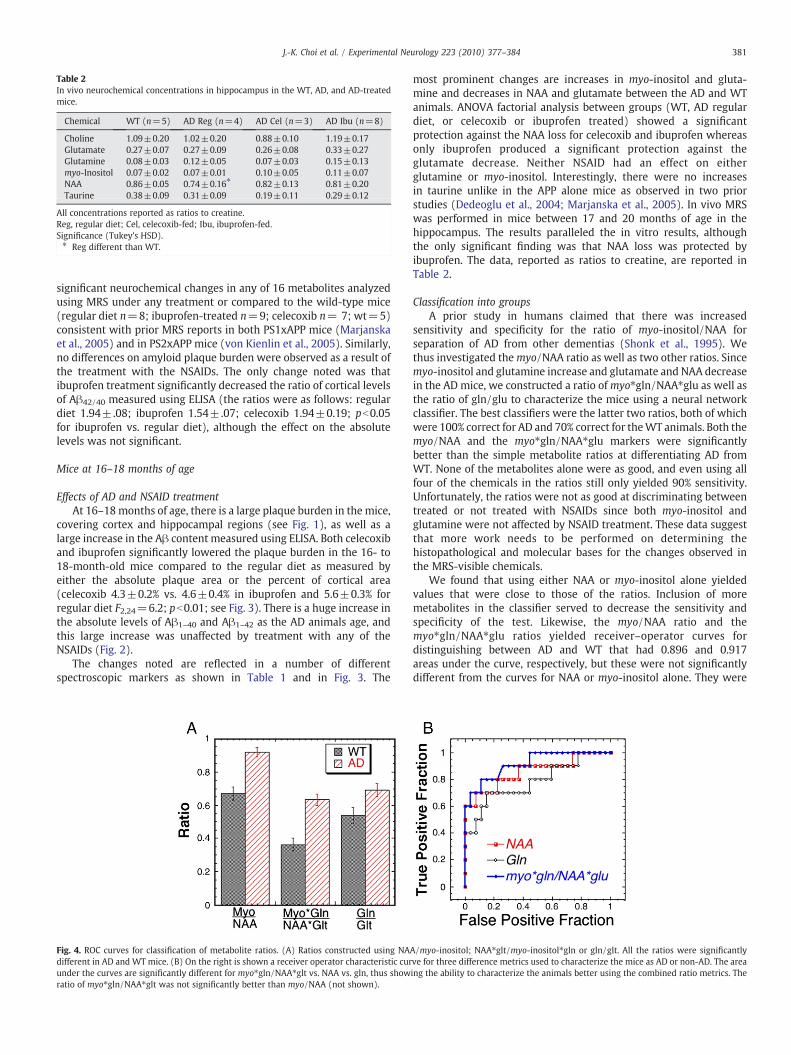
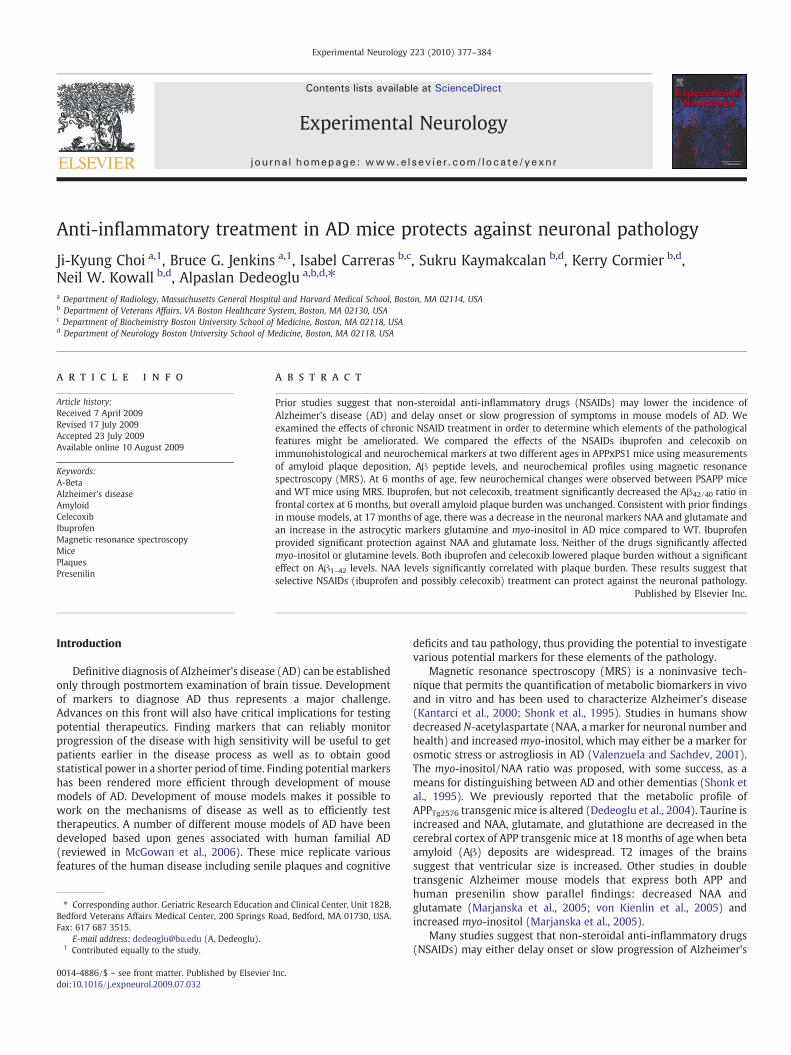
Table 2In vivo neurochemical concentrations in hippocampus in the WT, AD, and AD-treatedmice.
Chemical WT (n=5) AD Reg (n=4) AD Cel (n=3) AD Ibu (n=8)
Choline 1.09±0.20 1.02±0.20 0.88±0.10 1.19±0.17Glutamate 0.27±0.07 0.27±0.09 0.26±0.08 0.33±0.27Glutamine 0.08±0.03 0.12±0.05 0.07±0.03 0.15±0.13myo-Inositol 0.07±0.02 0.07±0.01 0.10±0.05 0.11±0.07NAA 0.86±0.05 0.74±0.16⁎ 0.82±0.13 0.81±0.20Taurine 0.38±0.09 0.31±0.09 0.19±0.11 0.29±0.12
All concentrations reported as ratios to creatine.Reg, regular diet; Cel, celecoxib-fed; Ibu, ibuprofen-fed.Significance (Tukey's HSD).⁎ Reg different than WT.
381J.-K. Choi et al. / Experimental Neurology 223 (2010) 377–384
significant neurochemical changes in any of 16 metabolites analyzedusing MRS under any treatment or compared to the wild-type mice(regular diet n=8; ibuprofen-treated n=9; celecoxib n= 7; wt=5)consistent with prior MRS reports in both PS1xAPP mice (Marjanskaet al., 2005) and in PS2xAPP mice (von Kienlin et al., 2005). Similarly,no differences on amyloid plaque burden were observed as a result ofthe treatment with the NSAIDs. The only change noted was thatibuprofen treatment significantly decreased the ratio of cortical levelsof Aβ42/40 measured using ELISA (the ratios were as follows: regulardiet 1.94±.08; ibuprofen 1.54±.07; celecoxib 1.94±0.19; pb0.05for ibuprofen vs. regular diet), although the effect on the absolutelevels was not significant.
Mice at 16–18 months of age
Effects of AD and NSAID treatmentAt 16–18months of age, there is a large plaque burden in the mice,
covering cortex and hippocampal regions (see Fig. 1), as well as alarge increase in the Aβ content measured using ELISA. Both celecoxiband ibuprofen significantly lowered the plaque burden in the 16- to18-month-old mice compared to the regular diet as measured byeither the absolute plaque area or the percent of cortical area(celecoxib 4.3±0.2% vs. 4.6±0.4% in ibuprofen and 5.6±0.3% forregular diet F2,24=6.2; pb0.01; see Fig. 3). There is a huge increase inthe absolute levels of Aβ1–40 and Aβ1–42 as the AD animals age, andthis large increase was unaffected by treatment with any of theNSAIDs (Fig. 2).
The changes noted are reflected in a number of differentspectroscopic markers as shown in Table 1 and in Fig. 3. The
Fig. 4. ROC curves for classification of metabolite ratios. (A) Ratios constructed using NAdifferent in AD and WT mice. (B) On the right is shown a receiver operator characteristic curunder the curves are significantly different for myo⁎gln/NAA⁎glt vs. NAA vs. gln, thus showratio of myo⁎gln/NAA⁎glt was not significantly better than myo/NAA (not shown).
most prominent changes are increases in myo-inositol and gluta-mine and decreases in NAA and glutamate between the AD and WTanimals. ANOVA factorial analysis between groups (WT, AD regulardiet, or celecoxib or ibuprofen treated) showed a significantprotection against the NAA loss for celecoxib and ibuprofen whereasonly ibuprofen produced a significant protection against theglutamate decrease. Neither NSAID had an effect on eitherglutamine or myo-inositol. Interestingly, there were no increasesin taurine unlike in the APP alone mice as observed in two priorstudies (Dedeoglu et al., 2004; Marjanska et al., 2005). In vivo MRSwas performed in mice between 17 and 20 months of age in thehippocampus. The results paralleled the in vitro results, althoughthe only significant finding was that NAA loss was protected byibuprofen. The data, reported as ratios to creatine, are reported inTable 2.
Classification into groupsA prior study in humans claimed that there was increased
sensitivity and specificity for the ratio of myo-inositol/NAA forseparation of AD from other dementias (Shonk et al., 1995). Wethus investigated themyo/NAA ratio as well as two other ratios. Sincemyo-inositol and glutamine increase and glutamate and NAA decreasein the AD mice, we constructed a ratio ofmyo⁎gln/NAA⁎glu as well asthe ratio of gln/glu to characterize the mice using a neural networkclassifier. The best classifiers were the latter two ratios, both of whichwere 100% correct for AD and 70% correct for theWT animals. Both themyo/NAA and the myo⁎gln/NAA⁎glu markers were significantlybetter than the simple metabolite ratios at differentiating AD fromWT. None of the metabolites alone were as good, and even using allfour of the chemicals in the ratios still only yielded 90% sensitivity.Unfortunately, the ratios were not as good at discriminating betweentreated or not treated with NSAIDs since both myo-inositol andglutamine were not affected by NSAID treatment. These data suggestthat more work needs to be performed on determining thehistopathological and molecular bases for the changes observed inthe MRS-visible chemicals.
We found that using either NAA or myo-inositol alone yieldedvalues that were close to those of the ratios. Inclusion of moremetabolites in the classifier served to decrease the sensitivity andspecificity of the test. Likewise, the myo/NAA ratio and themyo⁎gln/NAA⁎glu ratios yielded receiver–operator curves fordistinguishing between AD and WT that had 0.896 and 0.917areas under the curve, respectively, but these were not significantlydifferent from the curves for NAA or myo-inositol alone. They were
A/myo-inositol; NAA⁎glt/myo-inositol⁎gln or gln/glt. All the ratios were significantlyve for three difference metrics used to characterize the mice as AD or non-AD. The areaing the ability to characterize the animals better using the combined ratio metrics. The

Fig. 5. Classification of groups using linear discriminant analysis. (A) Classification of groups using just the plaque areas and ELISA Ab 40 + 42 values. Using holdout analysisindicated 48% correct classification. (B) Classification using five MRS chemicals (NAA, glt, gln, myo-inositol, alanine). There was 69% correct classification. Alanine adds significantpower to discriminate between NSAID treated and untreated. (C) Linear discriminant analysis of the transgenic AD mice combining the MRS and histopathology data. The variablesincluded weremyo-inositol, glutamine, glutamate, NAA, alanine (MRS), Aβ40, and Aβ42 levels using ELISA and the plaque burden expressed as the fraction of cortical area. There wasexcellent separation between the three different treatment groups (Wilk's lambda for functions 1 and 2 was 0.077 and 0.334, respectively; pb0.001). All the discriminant plots arenormalized to one standard deviation.
382 J.-K. Choi et al. / Experimental Neurology 223 (2010) 377–384
better than an ROC constructed using, for instance, just gln (seeFig. 4).
We also performed linear discriminant analysis using eithermetabolites alone or combinations of metabolites and pathologicaldata. Shown in Fig. 5 are the results. We used the five metabolitesmyo-inositol, glutamine, glutamate, NAA, and alanine. The latterwas included since it shows a large difference between the NSAIDtreated and other animals, although no apparent effects of AD (seeTable 1). If one uses all the metabolites, there are too manyvariables for the number of experimental points. Nonetheless, wefound that the classification (using holdout analysis) went from84% with all the metabolites to 79% using just the five metabolitesabove. Furthermore, removing alanine changes the classificationfrom 79% to 63%. Use of just the pathology data (ELISA and plaquefraction of cortex) allowed correct classification of just 48% of theanimals (Fig. 5B). Combining the five metabolites and twopathological variables together allowed for classification of 93%.Clearly, larger numbers of animals will be needed to put thesetypes of classifiers on a surer footing, but combining just five MRSmarkers and two pathological markers provided significantly betterclassification than using either alone—this was especially true forthe pathology data. Since ELISA showed no effects of treatment,
Fig. 6. Correlations between NAA and plaque areas for all animals except WT. (A) Plot of thsignificant correlation that seems to have a threshold at around 5% plaque area. (B) Plot ofsignificant.
then it is likely that it is not adding much in the way ofclassification accuracy.
Relations between neurochemicals and neuropathologyFor all the animals, there was a reasonable correlation between
NAA and plaque burden that was highly significant for both the invitro and in vivo data (see Fig. 6). It would appear, however, from thein vitro data, that this is largely the result of a threshold-like eventwhere NAA decreases after the plaque burden reaches 5%. Interest-ingly, a similar 5% threshold can be seen in the data collected fromAPPxPS2 mice (von Kienlin et al., 2005). The correlation of myo-inositol with plaque burden was not significant.
There was a significant (though not very compelling) correlationbetween NAA and myo-inositol (Fig. 7A). This likely reflects onlythe fact that, at 18 months, both myo-inositol and NAA reflect theprogression of the disease—even though these two metaboliteslikely reflect different pathological processes. Data from individualswith Down's syndrome suggest that the increase in myo-inositolprecedes the decrease in NAA (Shonk and Ross, 1995). Myo-inositolis also elevated in patients with mild cognitive impairment, oftenconsidered a precursor to AD (Kantarci et al., 2000). There was ahighly significant inverse correlation between glutamate and
e plaque area as a fraction of cortex vs. NAA from the in vitro data. There is a weak butplaque area as a fraction of cortex vs. NAA from the in vivo data. The correlation is also

Fig. 7. Relations between MRS markers for all animals. (A) Plot of NAA vs.myo-inostiol—there is a weak but significant inverse correlation. (B) Plot of glutamate vs. glutamine, againshowing an inverse correlation. (C) Plot of glutamate vs. aspartate. There is a positive correlation.
383J.-K. Choi et al. / Experimental Neurology 223 (2010) 377–384
glutamine (Fig. 7B). This is driven by the fact that there was anincrease in glutamine and a decrease in glutamate in the AD mice at18 months of age. This pattern is similar to what we have observedin Huntington's disease mice (Jenkins et al., 2000) as well as singletransgenic APP mice (Dedeoglu et al., 2004) and to that seen intoxin models of neurodegeneration (Tkac et al., 2001). The changereflects altered glial/neuronal cycling as well as, potentially, a shiftin the glial/neuronal volume balance (Choi et al., 2007). There wasalso a very strong correlation between glutamate and aspartate (Fig.7C), which may reflect the fact that both of these are excitatoryneurotransmitters. Interestingly, aspartate showed no alterations inthe AD models. Studies from cultured neurons and astrocytesindicate that astrocytes have nearly undetectable levels of NAAwhereas neurons have nearly undetectable levels of myo-inositol(Brand et al., 1993; Urenjak et al., 1992; Zwingmann et al., 2000).Likewise, in cultured astrocytes, there is about 2× more glutaminethan in neurons whereas for glutamate there is 3–4× more inneurons than astrocytes.
These data suggest that ibuprofen and possibly celecoxib canprotect against some of the neuronal pathology in these mice. Thisfact is evidenced by the protection of NAA and glutamate loss byibuprofen and the protection of NAA loss by celecoxib. Neithercompound protects against the increases in myo-inositol orglutamine.
There are a few caveats to our data. First, there was a small butsignificant difference in age between the celecoxib and regular dietanimals (500 days vs. 540, respectively, p=0.02), that was not truefor ibuprofen treated animals (536 days mean). Since our datasuggest a weak correlation between plaque area and age between 16and 18 months of age (based upon comparisons in 16 AD miceregular diet between 470 and 590 days of age, there was 1.6% perday increase in plaque areas as a fraction of cortex, R=.50;p=0.05), this would tend to favor celexcoxib as far as showingprotection against plaque build up. Data from Marjanska et al.(2005) show little change in NAA in this age range so it may be thatcelecoxib does protect the NAA loss. Other studies in AD mice haveshown inconclusive effects using celecoxib (reviewed in McGeer andMcGeer (2007)). Another limitation of our study for both the in vivoand in vitro studies was the relatively large voxels sampled. Sincethe pattern of plaque deposition is not necessarily uniform (forinstance, there is more plaque in cingulate than other areas of cortex(see Fig. 1)), it would be advantageous to use smaller samplingvolumes. Nonetheless, these data show that the combination of MRSand pathology can provide excellent markers for following diseaseprogression.
Acknowledgments
This work was supported by Merit Review grants from theDepartment of Veterans Affairs (AD) and by the NIH (grantsAG13846-NWK and AD) and Alzheimer Association New InvestigatorAward (NIRG 02 3563-AD).
References
Brand, A., Richter-Landsberg, C., Leibfritz, D., 1993. Multinuclear NMR studieson the energy metabolism of glial and neuronal cells. Dev. Neurosci. 15,289–298.
Choi, J.K., Dedeoglu, A., Jenkins, B.G., 2007. Application of MRS to mouse models ofneurodegenerative illness. NMR Biomed. 20, 216–237.
Dedeoglu, A., Choi, J.K., Cormier, K., Kowall, N.W., Jenkins, B.G., 2004. Magneticresonance spectroscopic analysis of Alzheimer's disease mouse brain thatexpress mutant human APP shows altered neurochemical profile. Brain Res.1012, 60–65.
Hsiao, K., Chapman, P., Nilsen, S., Eckman, C., Harigaya, Y., Younkin, S., Yang, F., Cole, G.,1996. Correlative memory deficits, Abeta elevation, and amyloid plaques intransgenic mice. Science 274, 99–102.
in t' Veld, B.A., Ruitenberg, A., Hofman, A., Launer, L.J., van Duijn, C.M., Stijnen, T.,Breteler, M.M., Stricker, B.H., 2001. Nonsteroidal antiinflammatory drugs and therisk of Alzheimer's disease. N. Engl. J. Med. 345, 1515–1521.
Jantzen, P.T., Connor, K.E., DiCarlo, G., Wenk, G.L., Wallace, J.L., Rojiani, A.M., Coppola, D.,Morgan, D., Gordon, M.N., 2002. Microglial activation and beta-amyloid depositreduction caused by a nitric oxide-releasing nonsteroidal anti-inflammatory drugin amyloid precursor protein plus presenilin-1 transgenic mice. J. Neurosci. 22,2246–2254.
Jenkins, B.G., Klivenyi, P., Kustermann, E., Andreassen, O.A., Ferrante, R.J., Rosen, B.R.,Beal, M.F., 2000. Nonlinear decrease over time in N-acetyl aspartate levels in theabsence of neuronal loss and increases in glutamine and glucose in transgenicHuntington's disease mice. J. Neurochem. 74, 2108–2119.
Kantarci, K., Jack Jr., C.R., Xu, Y.C., Campeau, N.G., O'Brien, P.C., Smith, G.E., Ivnik, R.J.,Boeve, B.F., Kokmen, E., Tangalos, E.G., Petersen, R.C., 2000. Regional metabolicpatterns in mild cognitive impairment and Alzheimer's disease: a 1H MRS study.Neurology 55, 210–217.
Kopito, R.R., 2000. Aggresomes, inclusion bodies and protein aggregation. Trends CellBiol. 10, 524–530.
Kowall, N.W., Hantraye, P., Brouillet, E., Beal, M.F., McKee, A.C., Ferrante, R.J., 2000.MPTP induces alpha-synuclein aggregation in the substantia nigra of baboons.NeuroReport 11, 211–213.
Marjanska, M., Curran, G.L., Wengenack, T.M., Henry, P.G., Bliss, R.L., Poduslo, J.F., Jack Jr.,C.R., Ugurbil, K., Garwood, M., 2005. Monitoring disease progression in transgenicmouse models of Alzheimer's disease with proton magnetic resonance spectros-copy. Proc. Natl. Acad. Sci. U. S. A. 102, 11906–11910.
McGeer, P.L., McGeer, E.G., 2007. NSAIDs and Alzheimer disease: epidemiological,animal model and clinical studies. Neurobiol. Aging 28, 639–647.
McGowan, E., Eriksen, J., Hutton, M., 2006. A decade of modeling Alzheimer's disease intransgenic mice. Trends Genet. 22, 281–289.
McKee, A.C., Carreras, I., Hossain, L., Ryu, H., Klein, W.L., Oddo, S., LaFerla, F.M., Jenkins,B.G., Kowall, N.W., Dedeoglu, A., 2008. Ibuprofen reduces Abeta, hyperpho-sphorylated tau and memory deficits in Alzheimer mice. Brain Res. 1207,225–236.
Shonk, T., Ross, B.D., 1995. Role of increased cerebral myo-inositol in the dementia ofDown syndrome. Magn. Reson. Med. 33, 858–861.

384 J.-K. Choi et al. / Experimental Neurology 223 (2010) 377–384
Shonk, T.K., Moats, R.A., Gifford, P., Michaelis, T., Mandigo, J.C., Izumi, J., Ross, B.D., 1995.Probable Alzheimer disease: diagnosis with proton MR spectroscopy [seecomments]. Radiology 195, 65–72.
Tkac, I., Keene, C.D., Pfeuffer, J., Low, W.C., Gruetter, R., 2001. Metabolic changes inquinolinic acid-lesioned rat striatum detected non-invasively by in vivo (1)H NMRspectroscopy. J. Neurosci. Res. 66, 891–898.
Urenjak, J., Williams, S.R., Gadian, D.G., Noble, M., 1992. Specific expression ofN-acetylaspartate in neurons, oligodendrocyte-type-2 astrocyte progenitors,and immature oligodendrocytes in vitro. J. Neurochem. 59, 55–61.
Valenzuela, M.J., Sachdev, P., 2001. Magnetic resonance spectroscopy in AD. Neurology56, 592–598.
von Kienlin, M., Kunnecke, B., Metzger, F., Steiner, G., Richards, J.G., Ozmen, L., Jacobsen,H., Loetscher, H., 2005. Altered metabolic profile in the frontal cortex of PS2APPtransgenic mice, monitored throughout their life span. Neurobiol. Dis. 18, 32–39.
Weggen, S., Eriksen, J.L., Das, P., Sagi, S.A., Wang, R., Pietrzik, C.U., Findlay, K.A., Smith,T.E., Murphy, M.P., Bulter, T., Kang, D.E., Marquez-Sterling, N., Golde, T.E., Koo, E.H.,2001. A subset of NSAIDs lower amyloidogenic Abeta42 independently ofcyclooxygenase activity. Nature 414, 212–216.
Zwingmann, C., Richter-Landsberg, C., Brand, A., Leibfritz, D., 2000. NMR spectroscopicstudy on the metabolic fate of [3-(13)C]alanine in astrocytes, neurons, andcocultures: implications for glia-neuron interactions in neurotransmitter metab-olism. Glia 32, 286–303.