antenna tilt control in cdma networks
TRANSCRIPT

8/2/2019 Antenna Tilt Control in CDMA Networks
http://slidepdf.com/reader/full/antenna-tilt-control-in-cdma-networks 1/5
Antenna Tilt Control in CDMA Networks
ABSTRACTThis paper presents a real-time utility based procedure for antennatilt control in cellular networks. The method’s convergence to
Nash equilibrium is guaranteed by the concave dependence
between utility function and tilt angle. The solution was verified
using a CDMA motion simulator with real path-loss data
collected in downtown Delhi. The simulations show a significantreduction in dropped calls when the tilt is adapted to changes in
traffic. This solution can be realized on systems that install remote
control antennas.
Categories and Subject DescriptorsC.4 [Performance of systems] Design studies, Fault tolerance,
Measurement techniques, Modeling techniques, Performance
attributes, Reliability, availability, and serviceability
General TermsAlgorithms, Measurement, Performance.
KeywordsCDMA, Antenna tilt, Game theory.
1. INTRODUCTIONThe initial deployment of a cellular system is based on extensive
drive tests and computer simulations. Later on, the system
parameters are fine tuned based on collected statistics and faultreports taken in the field. Unfortunately, this approach does not
cope with real-time changes in traffic and propagation conditions.
The effects of adjusting the antenna height and tilt in cellular
networks are well known, in radio network planning and
optimization. In [1] the authors show significant reductions in path-loss, delay spread, transmitted power, and system
interference when suitable height and antenna tilt are selected for
a static system. The tradeoff between coverage and capacity using
dynamic optimization of an ideal four-cell model of a 3G cellular
network is presented in [2]. The authors show that even with
uniform traffic the optimization provides a set of network configurations with a larger capacity-coverage tradeoff. The
effect of electrical and mechanical antenna down-tilting in UMTS
networks is presented in [3]. In this paper the authors demonstrate
the need for adapting antenna settings to the expected traffic
distribution and cell size. Using simulations, the authors show thatthe smaller the cell size the larger the antenna down-tilt should be,
and the higher the traffic load the higher the antenna down-tilt
should be to improve performance. The analysis of antenna tilting
in cellular networks is the subject of other recent papers [4-9].
Fewer papers though present algorithms for down-tilt control. In
[10] the authors using real path-loss data, collected from urbanand suburban environments, show through computer simulations
that the capacity increases when an optimal tilt angle is used.They use a global optimization algorithm that finds the optimal
tilt in a cell by maximizing network capacity while keeping the
other antennas’ tilt angle constant. The algorithm is stopped onceall of the optimal tilts are found. Unfortunately, none of the above
papers offer a real-time solution that adapts the antenna tilt based
on the actual traffic and propagation conditions in the field. These
conditions usually differ from the initial measurements and data
used in computer simulation. Only a real-time adaptive control of
antenna’s tilt can provide an increase in capacity and a reductionin the number of call drops under large variations in traffic and
channel propagation.
In this paper we propose a new approach for antenna tilt
optimization based on real time data collected in a CDMA
network. The proposed method is based on distributedoptimization of cells’ utility functions, and implements the tilt
changes in a distributed asynchronous manner.
2. COVERAGE vs. PILOT POLLUTIONInterference and lack of coverage are the two main reasons for
call failures (call drops). Co-channel interference in the cellular
systems is usually associated with poor antenna design/orientation
or improper pilot power levels. The optimum values for antennatilt and orientation obtained through simulation or provided by
local experts are implemented in the network and afterward rarely
modified. This approach often degrades under daily traffic
variations or seasonal changes in the propagation environment.
These changes equate to an increased fraction of call failures or
poor RF coverage. For instance, Figure 1 shows the normalizedtraffic and call drop variations during a day in a typical cellular
system.
Permission to make digital or hard copies of all or part of this work for
personal or classroom use is granted without fee provided that copies are
not made or distributed for profit or commercial advantage and that
copies bear this notice and the full citation on the first page. To copy
otherwise, or republish, to post on servers or to redistribute to lists,
requires prior specific permission and/or a fee.
WICON’06, The 2nd Annual International Wireless Internet
Conference, August 2-5, 2006, Boston, MA, United States
©2006 ACM 1-59593-514-2/06/08…$5.00

8/2/2019 Antenna Tilt Control in CDMA Networks
http://slidepdf.com/reader/full/antenna-tilt-control-in-cdma-networks 2/5
Figure 1 - Hourly Normalized Traffic and Dropped Call
Variations
A poor antenna orientation causes additional inter-cellinterference, which leads to call failures even in the area
relatively close to the serving base station. A common form of
inter-cell interference is the so called pilot pollution, when thenumber of pilots/cells seen at the mobile is larger than the number
of rake receiver fingers. In these situations, there are a number of
parasite pilots that do not contribute to successful signal decodingand act as interference. In other variations in pilot polluted areas
candidate pilots so quickly pass active set that a saving handoff
can not be performed. The pilot strength at a receiver in CDMA
networks can be expressed as
N A P A P P h
A P
I
E j PL
jG jtr
PL
G pil tr
PL
G pil
o
c
1010)(
10
0
0
000
00
where
jG j pil jtr PLh A P P ,,,, 0 and N represent total transmitted
power, the pilot power in cell j, antenna gain corresponding the
receiver location, orthogonality factor, pathloss between thereceiver and base station j, and respectively the noise. There are
two main variables in the pilot strength formula pilot power andantenna gain. Both impact the cell radius (service area), the
quality of coverage intra-cell and the level of extra-cell
interference. Cell breathing represents the change of the cell
radius under traffic load fluctuation. When number of active users
increases the cell radius decreases and when the number of active
users decreases the cell radius increases. This phenomenonreduces the sensitivity of the cell radius with respect to pilot
power changes. Therefore the key parameters associated with
antenna gain remain important control variables for interference
reduction and capacity increase [2].
3. ANTENNA TILTAntenna gain of base station for a specific user depends onantenna pattern, antenna orientation (azimuth and tilt) and user’s
coordinates with respect to base station.
Figure 2 Antenna orientation geometry
In Figure 2 point M represents an arbitrary receiver, AB antenna
boresight (minimum attenuation), ,
represent the angle of
receiver location with respect to boresight and respectively the
antenna tilt angle with respect to horizontal plane and ,
represent the horizontal and the vertical angles with respect
to the boresight in the antenna reference system. The coordinates
of the receiver in the antenna reference system are obtained by a
simple translation along z axis and a rotation with tilt angle of the
horizontal plane. If the user is located at the distance r from the
origin and angle from x axis, and the base station antenna has aheight h, the vertical and horizontal angles in antenna reference
are:
sincoscos
sinarctan
sincoscos
cossincos
arctan
r
h
r
hr
h
The angles
and
then can be used to estimate antenna
attenuation),( A
from 3D antenna pattern. If only 2D projections of the antenna pattern are available, the antenna gain
is obtained from the horizontal)( H
and the vertical)( V
antenna patterns as:
)()(),( V H A dB Or from a parabolic approximation of the antenna’s main
lobe
max
2
3
2
3
,12min),( A AdBdB
dB
Antenna
Vertical
M
M’
M”
B
A
Antenna
Horizontal Tilted
8/2/2019 Antenna Tilt Control in CDMA Networks
http://slidepdf.com/reader/full/antenna-tilt-control-in-cdma-networks 3/5
Where dBdB 33 , are the angles in degrees from the
antenna boresight for 3dB attenuation, and Amax is the ultimate
antenna attenuation.
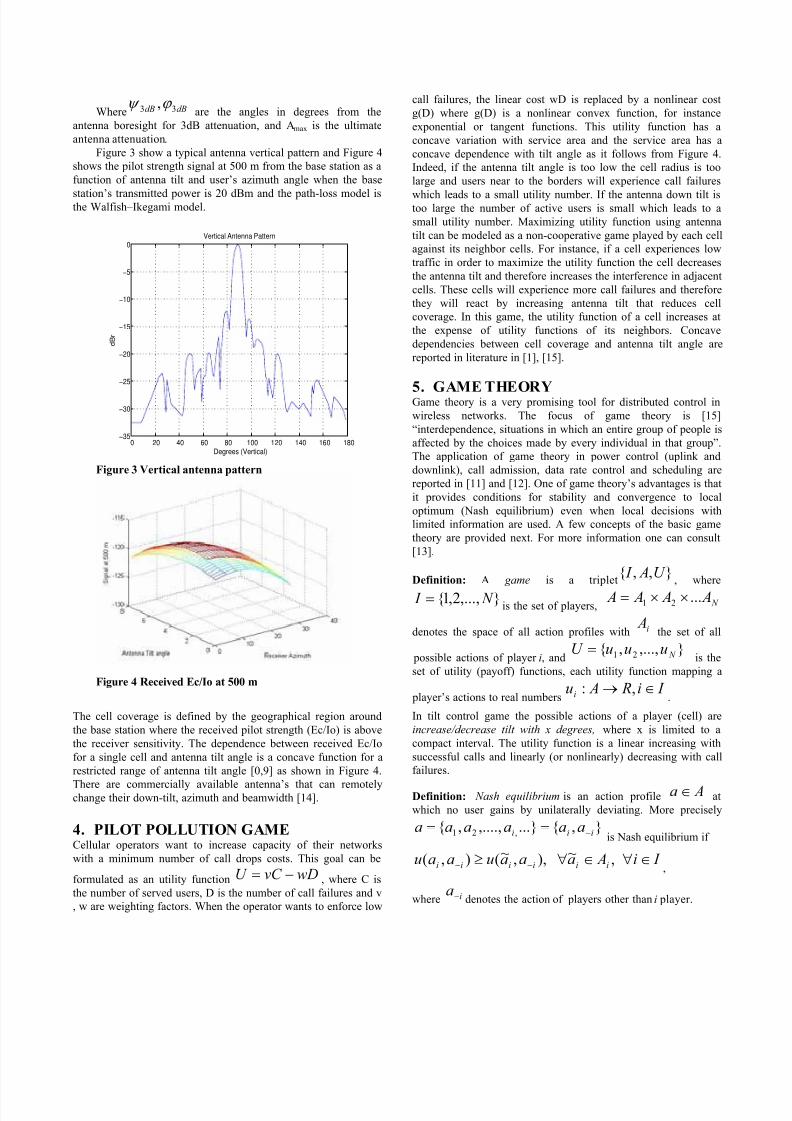
Figure 3 show a typical antenna vertical pattern and Figure 4shows the pilot strength signal at 500 m from the base station as a
function of antenna tilt and user’s azimuth angle when the base
station’s transmitted power is 20 dBm and the path-loss model isthe Walfish–Ikegami model.
0 20 40 60 80 100 120 140 160 180−35
−30
−25
−20
−15
−10
−5
0
Degrees (Vertical)
d B r
Vertical Antenna Pattern
Figure 3 Vertical antenna pattern
Figure 4 Received Ec/Io at 500 m
The cell coverage is defined by the geographical region around
the base station where the received pilot strength (Ec/Io) is above
the receiver sensitivity. The dependence between received Ec/Io
for a single cell and antenna tilt angle is a concave function for a
restricted range of antenna tilt angle [0,9] as shown in Figure 4.
There are commercially available antenna’s that can remotelychange their down-tilt, azimuth and beamwidth [14].
4. PILOT POLLUTION GAMECellular operators want to increase capacity of their networks
with a minimum number of call drops costs. This goal can be
formulated as an utility function wDvC U , where C is
the number of served users, D is the number of call failures and v, w are weighting factors. When the operator wants to enforce low
call failures, the linear cost wD is replaced by a nonlinear cost
g(D) where g(D) is a nonlinear convex function, for instance
exponential or tangent functions. This utility function has a
concave variation with service area and the service area has a
concave dependence with tilt angle as it follows from Figure 4.Indeed, if the antenna tilt angle is too low the cell radius is too
large and users near to the borders will experience call failures
which leads to a small utility number. If the antenna down tilt istoo large the number of active users is small which leads to a
small utility number. Maximizing utility function using antenna
tilt can be modeled as a non-cooperative game played by each cellagainst its neighbor cells. For instance, if a cell experiences low
traffic in order to maximize the utility function the cell decreases
the antenna tilt and therefore increases the interference in adjacent
cells. These cells will experience more call failures and therefore
they will react by increasing antenna tilt that reduces cellcoverage. In this game, the utility function of a cell increases at
the expense of utility functions of its neighbors. Concave
dependencies between cell coverage and antenna tilt angle are
reported in literature in [1], [15].
5. GAME THEORYGame theory is a very promising tool for distributed control in
wireless networks. The focus of game theory is [15]
“interdependence, situations in which an entire group of people is
affected by the choices made by every individual in that group”.The application of game theory in power control (uplink and
downlink), call admission, data rate control and scheduling are
reported in [11] and [12]. One of game theory’s advantages is that
it provides conditions for stability and convergence to local
optimum (Nash equilibrium) even when local decisions withlimited information are used. A few concepts of the basic game
theory are provided next. For more information one can consult
[13].
Definition: A game is a triplet},,{ U A I
, where
},...,2,1{ N I is the set of players, N A A A A ...21
denotes the space of all action profiles with i Athe set of all
possible actions of player i, and},...,,{ 21 N uuuU
is the
set of utility (payoff) functions, each utility function mapping a
player’s actions to real numbers I i R Aui ,:
.
In tilt control game the possible actions of a player (cell) are
increase/decrease tilt with x degrees, where x is limited to a
compact interval. The utility function is a linear increasing with
successful calls and linearly (or nonlinearly) decreasing with callfailures.
Definition: Nash equilibrium is an action profile Aa at
which no user gains by unilaterally deviating. More precisely
},{...},....,,{ ,21 iii aaaaaa is Nash equilibrium if
I i Aaaauaau iiiiii ,~),,~(),(,
where ia denotes the action of players other than i player.

8/2/2019 Antenna Tilt Control in CDMA Networks
http://slidepdf.com/reader/full/antenna-tilt-control-in-cdma-networks 4/5
Consider a two cells scenario where each cell tries to increase its
utility function u. When cell A, for instance, increases its tilt it
maximizes its utility function and it forces cell B to decrease its
tilt. The action pairs (increase x, decrease y) and respectively
(decrease x, increase y) are Nash equilibrium points in our tiltgame when the traffic conditions do not change.
Theorem [1] Compact, quasi-concave, and continuous strategic
form games have a pure strategy equilibrium. In other words, if
the payoff functions I i R Aui ,:
are quasi-concave andcontinuous and each Ai is compact, the game has a pure strategy
Nash equilibrium.
In the distributed tilt game the existence of Nash equilibrium
results as corrolary of above theorem and the concavity of utilityfunction with respect to tilt angle.
The existence of the Nash equilibrium does not guarantee the
convergence of the game. In order to analyze the convergence of the game players’ response function must be considered. In this
paper the game of tilt control is a discrete-time gradient play [16].
Upon observing it own utility function each base station estimates
at each stage (k) the gradient [16] of its own utility function U
using an approximation of its
gradient(W):
0)),()((1
)()1(
k W k U k
k W k W The
action (i.e. the tilt change))(k
at stage k is proportional to
the logit function of the gradient [16] as follows:
0,0
)),()(()((1
)(
k W k U k U k
Theorem
4.1 in [16] guarantees the local stability of Nash equilibrium points when the gradient approach is used. In practice the change
in tilt is limited by a fixed amount 00 and the tilt angle is
limited to a compact interval.
At each moment player’s action consists in increase or decrease
of its antenna tilt angle. In our method the utility function is
estimated using call data reports from cell users over a finite time
interval. The cell’s active calls are those calls that report the cell
in their active or candidate lists. The cell’s call drops are thefailed calls that recently reported the cell in one of their lists
active, candidate, or neighbors. This definition of call drops
captures better the pilot pollution effect in the neighboring cells.
The utility function is evaluated for each cell from call data
collected in the cell and its first tier of neighbors.
The tilt control algorithm proposed in this paper consists in thefollowing steps:
a. For each cell, collect call data logs (CDL) over a time
interval T1 (sliding window of time or amount of call
activity).
b. For each cell, estimate the call traffic in the cell’s cluster. A
cluster cell is formed by a cell and its first tier neighbor cells.
c. Find the number of active reports and call failures in each
cluster. The active reports keep track of how many times
each cell was reported in the active list of the call in the last
T1 second interval. A cell is reported in the active list when
its Pilot Strength is above a fixed threshold. Normalize the
active reports to the total number of occurrences of the cell
in active, candidate, and neighbor list. Normalize the number of call failures to the total number of calls.
d. Estimate the utility function and its gradient.
e. Modify the tilt based on the utility’s gradient using a tilt
change limit (2 degree) and a total tilt limit of 9 degrees.
f. Evaluate the uplink and downlink quality and balance thelinks.
g. Repeat steps b to f until the utility function does not change
significantly.
6. SIMULATION RESULTSThe proposed algorithm was tested in a simulated environment
using the CDMA Motion Simulator (CMS) and path-loss datacollected in New Delhi, India. The simulated system had 66 cells
and it used real data for path-loss, antenna patterns, antenna
heights, orientations, cell radius, and radiated power. Figure 4
shows the RF coverage data collected in drive test and used in thesimulations.
Figure 5 RF coverage in downtown Delhi
The scenarios considered had 300, 400 and 500 mobile users. Thetilt angle of each antenna was constrained between 0 and 10
degrees in order to assure concavity. In our simulations we
used1,1,1
and the tilt step changes were
limited to 20 degree. The number of normalized active
list reports was used as measure of served users for a particular base station. A base station is reported by a mobile phone in its
active list if the received pilot strength is above a prescribed
threshold. We then normalized the number of the active reports tothe total number of base station’s occurrences in active, candidate
and neighbor lists. The tilt control in a particular cell was
triggered by call drops change while the magnitude of change wascomputed using the gradient of the utility function. The reduction
in dropped calls with respect to statistics collected from the
operational network was obtained using various user densities and
various random seeds. The results for each user density averaged
over 10 random seeds are presented in Table 1.

8/2/2019 Antenna Tilt Control in CDMA Networks
http://slidepdf.com/reader/full/antenna-tilt-control-in-cdma-networks 5/5
Number
of
mobiles
Dropped Call
Reduction
(Mean)
Dropped Call
Reduction (Std
Dev.)
300 18.45% 5.8%
400 19.68% 5.75%
500 7.8% 3.1%
Table 1 Calls dropped reduction after tilt control
The algorithm shows a significant reduction in the calls dropped,
which are normally at 1-2% of the total calls in the case of 300
and 400 users. Because in our simulations we used a mechanical
down tilt, it is expected that an electrical tilt will provide even better results due to decreased inter-cell interference.
7. CONCLUSIONSOur paper offers an iterative approach for antenna tilt control to
reduce the interference and increase the RF coverage. Our
approach removes the need for drive testing, which can involveexpensive and time-consuming path-loss tuning; the algorithm
does not need location accuracy or predictive SNR values. Using
this approach the cellular network could adapt near real time totraffic variations and fluctuations in RF propagation conditions.
The approach of remote control of antenna properties (azimuthand tilt) is a very cost effective solution to op-ex and
capacity/coverage solution.
8. REFERENCES[1] E. Benner and A. Sesay, Effects of Antenna Height, Antenna
Gain and Pattern Downtilting for Cellular Mobile Radio,
IEEE Tr. On Vehicular technology, Vol. 45, No 2, May 1996
[2] G. Hampel, K.L. Clarkson, J. D. Hobby and P. Polakos, The
Tradeoff between Coverage and Capacity in Dynamic
Optimization of 3G Cellular Networks, VTC 2003
[3] I. Forkel, A. Kemper, P. Pabst and Hermans , The Effect of Electrical and Mechanical Antenna Down-tilting in UMTS
Networks, 3 G Mobile Communication Technologies, 8-10
May, 2002, pp 86-90
[4] S. Bundy, Antenna Downtilt Effects on CDMA Cell-Site
Capacity, Radio and Wireless Conference, 1999. RAWCON
99. 1999 IEEE , 1-4 Aug. 1999 , Pages:99 – 102
[5] M.E. Maragoudakis, Antenna Pattern Considerations in
Optimizing Cellular RF Designs, 8081 Proceedings of the
National Communications Forum, 45 (1991) Sep. 30/Oct. 2,
Chicago, IL, pp. 624-630.
[6] Wu, J. et al. , Antenna Downtilt Performance in Urban
Environments, IEEE Milcom 1996 Conference Proceedings,
vol. 3, No. 15, Oct. 21-24, 1996, McLean, VA, pp. 739-744.
[7] Wu Jianhui et al., Antenna Downtilt Performance in Urban
Environments, Aug. 1996, Military Communication
Conference (MILCOM '96), vol. 3, pp. 739-744.
[8] Wu, Jung-Shyr, et al., Hot-Spot Traffic Relief with a Tilted
Antenna in CDMA Cellular Networks, IEEE Transactions on
Vehicular Technology, vol. 47, Feb. 1998; pp. 1-9.
[9] Niemela, J. and Lempiainen, J., Impact of mechanical
antenna downtilt on performance of WCDMA cellular
network , Vehicular Technology Conference, 2004, VTC
2004-Spring. 2004 IEEE 59th, Volume: 4, 17-19 May 2004 ,
Pages: 2091 - 2095 Vol.4
[10] A. Wacker, K. Sipila and A. Kuurne, Automated and
Remotely Optimization of Antenna Subsystem based on
Radio Network Performance , 2002, pp 752-756
[11] A. MacKenzie and S. Wicker, Game Theory and Design of
Self-Configuring, Adaptive Wireless Networks , IEEE
Communication Magazine, November 2001, Pages: 126-131
[12] F. Kelly, A. Maulloo and D. Tan, Rate control in
communication networks: shadow prices, proportional
fairness and stability, Journal of the Operational Research
Society 49 (1998) 237-252.
[13] R. Myerson, Game Theory: Analysis of Conflict , Harvard
University Press; Reprint edition, September, 1997
[14] http://www.kmwinc.com/eng/products/new0.htm
[15] Prajit Dutta, Strategy and Games, Theory and Practice, The
MIT Press, 1999[16] G. Arslan, J.S. Shamma, Distributed Convergence to Nash
Equilibria with Local utility Measurements, 43rd IEEE
Conference on Decision and Control, 2004, pp1538-1543