ansvar insurance annual financial report - amazon web …… · 2017-08-16 · ansvar insurance...
TRANSCRIPT

Ansvar InsuranceAnnual FinancialReport2008


Ansvar Insurance LimitedAnnual Report 2008
Contents
Directors’ Report 2
Auditors’ independence declaration 6
Directors’ Declaration 9
Income Statement 10
Balance Sheet 11
Statement of Changes in Equity 12
Cash Flow Statement 13
Notes to the Financial Statements 14-56

2
Directors’ report
The directors of Ansvar Insurance Limited submit herewith the annual financial report for the financial year ended 31 December 2008. In order to comply with the provisions of the Corporations Act 2001, the directors report as follows:
The names and particulars of the directors of the company during or since the end of the financial year are:
Mr Murray BairdB.Arts, LLB Chairman
Murray was appointed to the Board in 2002 and became the Chairman in January 2006. Murray has been senior partner and chairman of Moores Legal, Melbourne, Australia since 1985. His professional practice includes advising in corporations law and governance. He is a member of the Australian Institute of Company Directors, has been a director of a number of non listed public companies and is a regular writer, speaker and consultant on Corporate Governance issues for the Not for Profit sector.
Mr Bruce HarrisCA, CPA, ACIS Director
Bruce was appointed to the Board in 2005. Bruce is a former insurance executive director with experience in financial management, strategy, governance, compliance and risk management and has been a director of a number of non listed public companies. He is currently Executive Officer of Ridley Melbourne Mission & Ministry College and involved at board level in the not for profit sector.
Mr David HarrisonFNZIM Director
David has been a Board Member since 2001. David joined the New Zealand Board of Ansvar Insurance in 1997, becoming Chairman in 2000. David has extensive experience in insurance. He is the former Chairman and Chief Executive of Marsh Ltd in New Zealand and the Pacific Islands and a member of the international team of Managing Directors, is Chairman of Aviation Co-operating Underwriters Pacific Ltd and has extensive interest at board level in the Charitable and Not for Profit sectors.
Dr Bronwyn HughesB.Arts, Dip Ed, Dip Mgt, D.B.A. Director
Bronwyn became a Director in 2006. She has worked in both secular and Christian media for over 20 years including as a producer for ABC Radio National, as a presenter with FM103.2 and as Director of the Anglican Radio Unit. Bronwyn has also worked as the Communications Director with NCLS Research and as National Director for Mission Research and Development with the Bible Society. Currently she is employed as Leadership Research Fellow with Macquarie University Graduate School of Management, is the outgoing Chairman of the Willow Creek Association Australia and is Deputy Chair, Board of Management, Radio FM103.2.
Mr John PeberdyANZIIF (Snr Assoc) CIP Director
John has been a Board member since 1997. John is the CEO of Ansvar Insurance Ltd in Australia and New Zealand. He commenced with the company in Adelaide in 1973 and has held various senior management roles in Ansvar Insurance since 1986. He was appointed CEO in May 1999. John is a Senior Associate of the Australian and New Zealand Institute of Insurance and Finance. He is a director of Global Interaction Australia and the Insurance Council of Australia.
Mr George PrescottB.Arts, FCA Director
George was appointed to the Board in 1999. George works for Ecclesiastical Group plc, originally appointed as Executive Director in 1995 and then in 2005 was appointed the Deputy Group Chief Executive. He has worked in the group for over 20 years and is primarily responsible for the Group’s investment and accounting activities. He is a Director of Mapfre Re (Spain) and JP Morgan Cazenove Pension Trustee Limited.
Mr William Graham ShearnB.Arts, FCII Director
Graham has been on the Board since 2006. He is the Group Development Director of Ecclesiastical Insurance Group plc and has been closely involved with Ansvar Insurance since its acquisition by Ecclesiastical in 1998. Graham has worked in the insurance industry throughout his professional career and is a Chartered Insurer and Fellow of the Chartered Insurance Institute.
Ansvar Insurance LimitedAnnual Report 2008
3
Mr Jeffrey ThomasB.Ec, M.B.A.,FCA. Director
Jeffrey has been a Board Member since 2004. He has been the Chairman of Jeffrey Thomas & Partners, Chartered Accountants, since 1981. His professional time is principally related to providing strategic and organisational advice to a wide range of businesses. He has held board positions previously with a diverse range of businesses and organisations, including an insurance broker.
Mr Michael TrippB.Sc., ARCS, FIA Director Group Chief Executive
Michael has been on the Board since 2007. He is the Group Chief Executive, Ecclesiastical Group plc based at the Head Office in Gloucester, UK. Prior to commencing with Ecclesiastical, Michael was a partner with the global professional services practice, Ernst & Young and Watson Wyatt. A qualified actuary, he has more than 30 years experience in the insurance industry
The 9 above named directors held office during and since the end of the financial year unless otherwise stated.
Principal activities
The Group’s principal activities in the course of the financial year consisted of insurance underwriting and investment.
There have been no significant changes in the activities of the consolidated entity during the year ended 31 December 2008.
Review of operations
Despite the doom and gloom in the economy, Ansvar Insurance is pleased to report an increase in profit after tax on a consolidated basis from $5.9m in 2007 to $8.7m in 2008. The conservative investment policy adopted by our Board delivered a record investment result to more than offset the deterioration in underwriting performance.
Gross Written Premium increased by 7.8% from $131.7m to $142.0m. This is particularly pleasing given the softness of the market for much of the year. At the same time, claims expense increased by 12.4% from $95.3m to $107.1m. This tested the robustness of our reinsurance purchase. The quality of our program enabled us to achieve one of our major reinsurance goals which is to reduce volatility.
The synergy in strategy within the Ecclesiastical Group has further developed during 2008. All parts of the Group are now engaged in the development of specialist products in the core customer segments of faith, education, care, community service organisations and heritage properties.
We have undertaken significantly more customer and distribution partner research this year to better understand the needs of supply chain for our products. This has provided us with new insights into the expectations of those who purchase and distribute our products.
APRA changes to capital charges on reinsurance and investments have been introduced during 2008. Management and the Board have worked to ensure we manage through this change effectively.
We also fulfilled our goal to assist in the development of the youth of Australia and New Zealand through the provision of Community Education Program grants. This program was formalised in New Zealand in 2008, assisted by a generous grant to our major customer group from the ultimate owner of the Ecclesiastical Group, All Churches Trust Ltd (UK).
The landscape at the end of 2008 looked very different to the start. The world faces many challenges as it works its way through a very stormy financial crisis. The role of insurance at such times becomes even more important.
Ansvar Insurance is a long term participant in the marketplace and is well placed to deal with the difficulties currently at hand through adopting prudent policies and practices in the past. The maintenance of a sound capital base has been at the forefront of our practices and this will stand us in good stead.

4
Directors’ report (continued)
Changes in state of affairs
During the financial year there was no significant change in the state of affairs of the consolidated entity other than that referred to in the financial statements or notes thereto.
Subsequent Events
There has not been any matter or circumstance, other than that referred to in the financial statements or notes thereto, that has arisen since the end of the financial year, that has significantly affected, or may significantly affect, the operations of the consolidated entity, the results of those operations, or the state of affairs of the consolidated entity in future financial years.
Future Developments
Disclosure of information regarding likely developments in the operations of the consolidated entity in future financial years and the expected results of those operations is likely to result in unreasonable prejudice to the consolidated entity. Accordingly, this information has not been disclosed in this report.
Dividends
In respect of the financial year ended 31 December 2008, the directors have recommended the payment of a dividend of $3.123 million to the parent entity (2007: $2.995 million).
Directors’ meetings
The following table sets out the number of directors’ meetings (including meetings of committees of directors) held during the financial year and the number of meetings attended by each director (while they were a director or committee member). During the financial year, 5 board meetings, 5 audit committee meetings, 5 investment committee meetings, 1 community education program grants meeting and 5 nominations and remuneration committee meetings were held.
Directors’ meetings
Directors’ Board
Audit, Risk & Compliance
CommitteeInvestment Committee
Nominations and Remuneration
Committee
Community Education
Program Grants Committee
Held Attended Held Attended Held Attended Held Attended Held Attended
Dr B E Hughes 5 5 - - - - 5 4 1 1Mr B G Harris 5 5 5 5 - - - - 1 1Mr M H Tripp 5 4 - - - - 5 4 - -Mr G A Prescott 5 4 - - 5 4 - - - -Mr M P Baird 5 5 5 4 - - 5 5 1 1Mr J R Peberdy 5 5 - - 5 5 - - - -Mr D J Harrison 5 5 - - 5 5 - - - -Mr W G Shearn 5 4 - - - - - - - -Mr J O Thomas 5 4 5 5 5 5 - - - -
Ansvar Insurance LimitedAnnual Report 2008
5
Indemnification of officers and auditors
During the financial year, the company paid a premium in respect of a contract insuring the directors of the company (as named above), the company secretary and all executive officers of the company and of any related body corporate against a liability incurred as such a director, secretary or executive officer to the extent permitted by the Corporations Act 2001. The contract of insurance prohibits disclosure of the nature of the liability and the amount of the premium.
The company has not otherwise, during or since the financial year, indemnified or agreed to indemnify an officer or auditor of the company or of any related body corporate against a liability incurred as such as officer or auditor.
Auditors’ Independence Declaration
The auditors’ independence declaration is included on page 6 of the financial report.
Rounding Off Of Amounts
The company is a company of the kind referred to in ASIC Class Order 98/0100, dated 10 July 1998, and in accordance with that Class Order amounts in the directors’ report and the financial report are rounded off to the nearest thousand dollars.
Signed in accordance with a resolution of the directors made pursuant to s.298(2) of the Corporations Act 2001.
On behalf of the Directors
M.P. BairdChairman
B.G. HarrisDirector
Melbourne, 23 April 2009

6
Ansvar Insurance LimitedAnnual Report 2008
7
8
Ansvar Insurance LimitedAnnual Report 2008
9
Directors’ declaration
The directors declare that:
a. in the director’s opinion, there are reasonable grounds to believe that the company will be able to pay its debts as and when they become due and payable;
b. in the director’s opinion, the attached financial statements and notes thereto are in accordance with the Corporations Act 2001, including compliance with accounting standards and giving a true and fair view of the financial position and the performance of the consolidated entity.
Signed in accordance with a resolution of the directors made pursuant to s.295(5) of the Corporations Act 2001.
On behalf of the Directors
M.P. BairdChairman
B.G. HarrisDirector
Melbourne, 23 April 2009
10
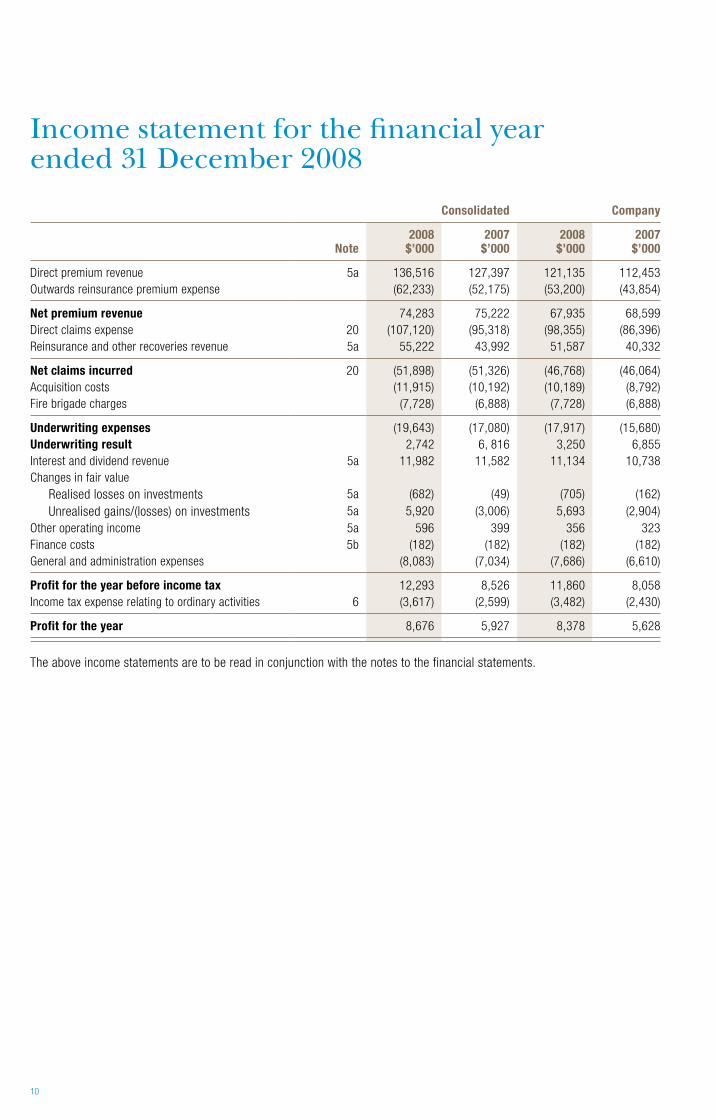
Income statement for the financial year ended 31 December 2008
Consolidated Company
Note2008
$’0002007
$’0002008
$’0002007
$’000
Direct premium revenue 5a 136,516 127,397 121,135 112,453Outwards reinsurance premium expense (62,233) (52,175) (53,200) (43,854)
Net premium revenue 74,283 75,222 67,935 68,599Direct claims expense 20 (107,120) (95,318) (98,355) (86,396)Reinsurance and other recoveries revenue 5a 55,222 43,992 51,587 40,332
Net claims incurred 20 (51,898) (51,326) (46,768) (46,064)Acquisition costs (11,915) (10,192) (10,189) (8,792)Fire brigade charges (7,728) (6,888) (7,728) (6,888)
Underwriting expenses (19,643) (17,080) (17,917) (15,680)Underwriting result 2,742 6, 816 3,250 6,855Interest and dividend revenue 5a 11,982 11,582 11,134 10,738Changes in fair value
Realised losses on investments 5a (682) (49) (705) (162) Unrealised gains/(losses) on investments 5a 5,920 (3,006) 5,693 (2,904)
Other operating income 5a 596 399 356 323Finance costs 5b (182) (182) (182) (182)General and administration expenses (8,083) (7,034) (7,686) (6,610)
Profit for the year before income tax 12,293 8,526 11,860 8,058Income tax expense relating to ordinary activities 6 (3,617) (2,599) (3,482) (2,430)
Profit for the year 8,676 5,927 8,378 5,628
The above income statements are to be read in conjunction with the notes to the financial statements.
Ansvar Insurance LimitedAnnual Report 2008
11
Consolidated Company
Note2008
$’0002007
$’0002008
$’0002007
$’000
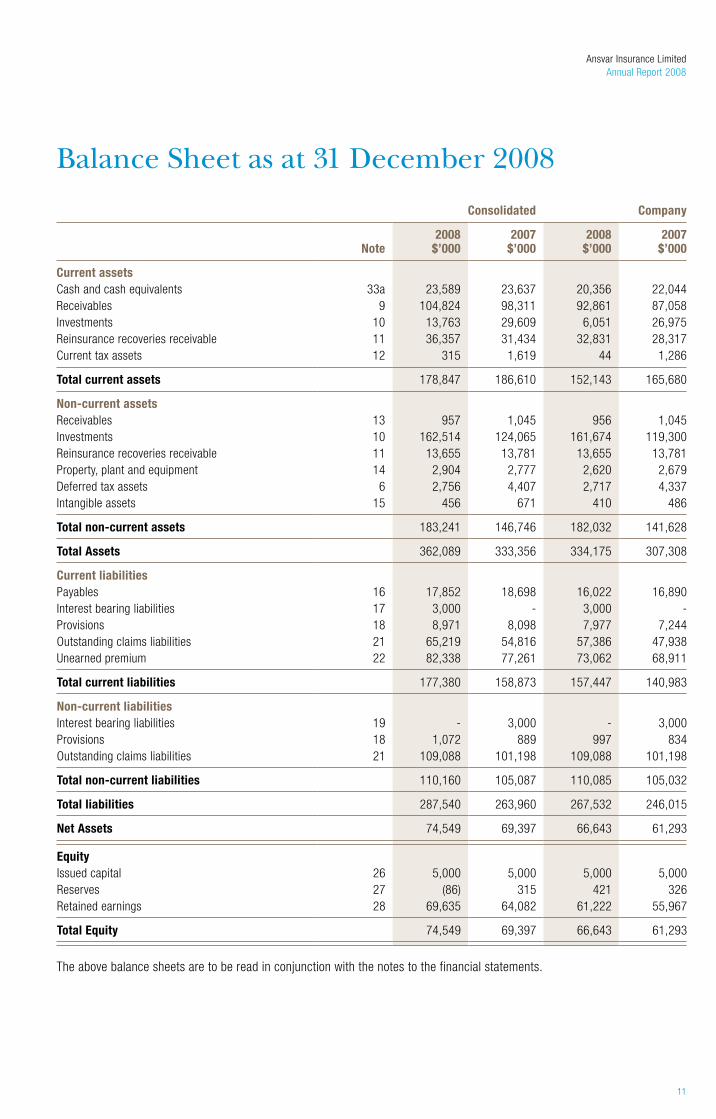
Current assetsCash and cash equivalents 33a 23,589 23,637 20,356 22,044Receivables 9 104,824 98,311 92,861 87,058Investments 10 13,763 29,609 6,051 26,975Reinsurance recoveries receivable 11 36,357 31,434 32,831 28,317Current tax assets 12 315 1,619 44 1,286
Total current assets 178,847 186,610 152,143 165,680
Non-current assets Receivables 13 957 1,045 956 1,045Investments 10 162,514 124,065 161,674 119,300Reinsurance recoveries receivable 11 13,655 13,781 13,655 13,781Property, plant and equipment 14 2,904 2,777 2,620 2,679Deferred tax assets 6 2,756 4,407 2,717 4,337Intangible assets 15 456 671 410 486
Total non-current assets 183,241 146,746 182,032 141,628
Total Assets 362,089 333,356 334,175 307,308
Current liabilities Payables 16 17,852 18,698 16,022 16,890Interest bearing liabilities 17 3,000 - 3,000 -Provisions 18 8,971 8,098 7,977 7,244Outstanding claims liabilities 21 65,219 54,816 57,386 47,938Unearned premium 22 82,338 77,261 73,062 68,911
Total current liabilities 177,380 158,873 157,447 140,983
Non-current liabilities Interest bearing liabilities 19 - 3,000 - 3,000Provisions 18 1,072 889 997 834Outstanding claims liabilities 21 109,088 101,198 109,088 101,198
Total non-current liabilities 110,160 105,087 110,085 105,032
Total liabilities 287,540 263,960 267,532 246,015
Net Assets 74,549 69,397 66,643 61,293
Equity Issued capital 26 5,000 5,000 5,000 5,000Reserves 27 (86) 315 421 326Retained earnings 28 69,635 64,082 61,222 55,967
Total Equity 74,549 69,397 66,643 61,293
The above balance sheets are to be read in conjunction with the notes to the financial statements.
Balance Sheet as at 31 December 2008
12
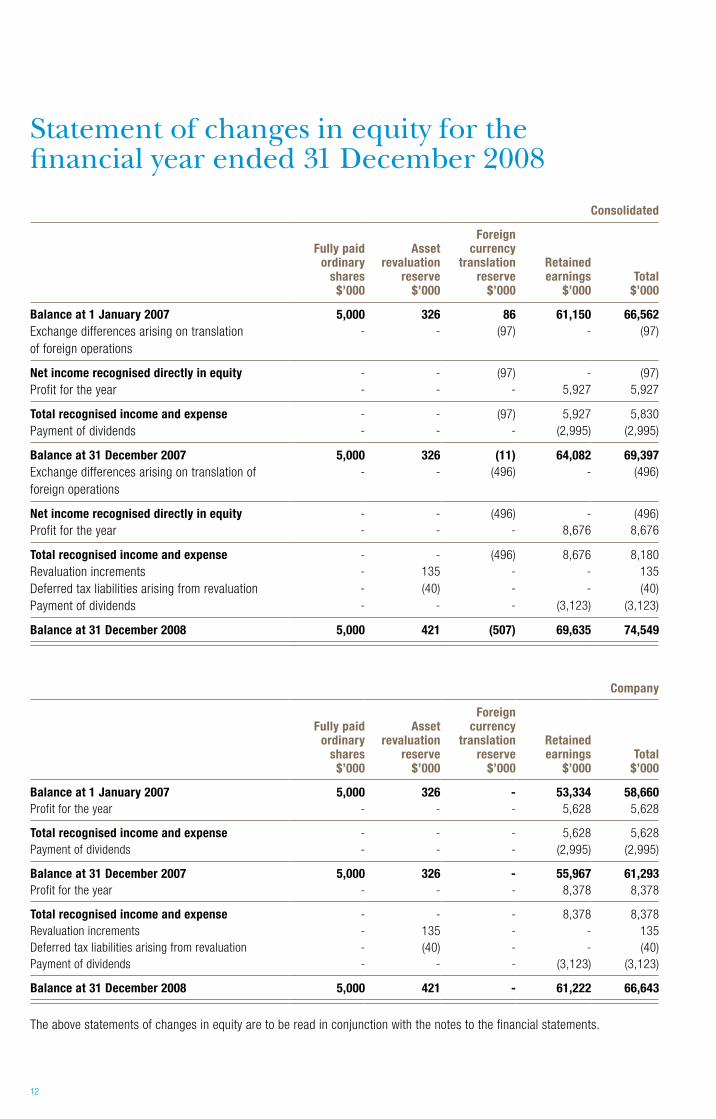
Statement of changes in equity for the financial year ended 31 December 2008
Consolidated
Fully paid ordinary
shares$’000
Asset revaluation
reserve$’000
Foreign currency
translation reserve
$’000
Retained earnings
$’000Total
$’000
Balance at 1 January 2007 5,000 326 86 61,150 66,562Exchange differences arising on translation of foreign operations
- - (97) - (97)
Net income recognised directly in equity - - (97) - (97)Profit for the year - - - 5,927 5,927
Total recognised income and expense - - (97) 5,927 5,830Payment of dividends - - - (2,995) (2,995)
Balance at 31 December 2007 5,000 326 (11) 64,082 69,397Exchange differences arising on translation of foreign operations
- - (496) - (496)
Net income recognised directly in equity - - (496) - (496)Profit for the year - - - 8,676 8,676
Total recognised income and expense - - (496) 8,676 8,180Revaluation increments - 135 - - 135Deferred tax liabilities arising from revaluation - (40) - - (40)Payment of dividends - - - (3,123) (3,123)
Balance at 31 December 2008 5,000 421 (507) 69,635 74,549
Company
Fully paid ordinary
shares$’000
Asset revaluation
reserve$’000
Foreign currency
translation reserve
$’000
Retained earnings
$’000Total
$’000
Balance at 1 January 2007 5,000 326 - 53,334 58,660Profit for the year - - - 5,628 5,628
Total recognised income and expense - - - 5,628 5,628Payment of dividends - - - (2,995) (2,995)
Balance at 31 December 2007 5,000 326 - 55,967 61,293Profit for the year - - - 8,378 8,378
Total recognised income and expense - - - 8,378 8,378Revaluation increments - 135 - - 135Deferred tax liabilities arising from revaluation - (40) - - (40)Payment of dividends - - - (3,123) (3,123)
Balance at 31 December 2008 5,000 421 - 61,222 66,643
The above statements of changes in equity are to be read in conjunction with the notes to the financial statements.
Ansvar Insurance LimitedAnnual Report 2008
13
Consolidated Company
Note2008
$’0002007
$’0002008
$’0002007
$’000
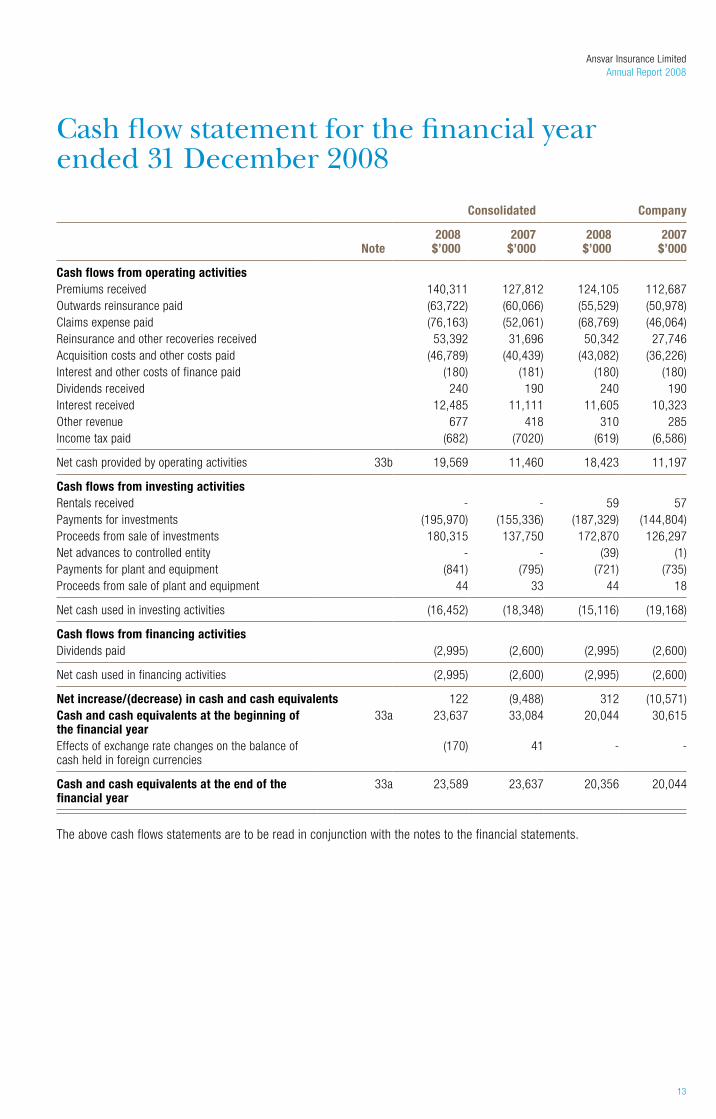
Cash flows from operating activitiesPremiums received 140,311 127,812 124,105 112,687Outwards reinsurance paid (63,722) (60,066) (55,529) (50,978)Claims expense paid (76,163) (52,061) (68,769) (46,064)Reinsurance and other recoveries received 53,392 31,696 50,342 27,746Acquisition costs and other costs paid (46,789) (40,439) (43,082) (36,226)Interest and other costs of finance paid (180) (181) (180) (180)Dividends received 240 190 240 190Interest received 12,485 11,111 11,605 10,323Other revenue 677 418 310 285Income tax paid (682) (7020) (619) (6,586)
Net cash provided by operating activities 33b 19,569 11,460 18,423 11,197
Cash flows from investing activities Rentals received - - 59 57Payments for investments (195,970) (155,336) (187,329) (144,804)Proceeds from sale of investments 180,315 137,750 172,870 126,297Net advances to controlled entity - - (39) (1)Payments for plant and equipment (841) (795) (721) (735)Proceeds from sale of plant and equipment 44 33 44 18
Net cash used in investing activities (16,452) (18,348) (15,116) (19,168)
Cash flows from financing activities Dividends paid (2,995) (2,600) (2,995) (2,600)
Net cash used in financing activities (2,995) (2,600) (2,995) (2,600)
Net increase/(decrease) in cash and cash equivalents 122 (9,488) 312 (10,571)Cash and cash equivalents at the beginning of the financial year
33a 23,637 33,084 20,044 30,615
Effects of exchange rate changes on the balance of cash held in foreign currencies
(170) 41 - -
Cash and cash equivalents at the end of the financial year
33a 23,589 23,637 20,356 20,044
The above cash flows statements are to be read in conjunction with the notes to the financial statements.
Cash flow statement for the financial year ended 31 December 2008
14
Notes to the financial statements for the financial year ended 31 December 2008
1. Significant accounting policies
Statement of Compliance
The financial report is a general purpose financial report which has been prepared in accordance with the Corporations Act 2001, Accounting Standards and Interpretations, and complies with other requirements of the law.
Accounting Standards include Australian equivalents to International Financial Reporting Standards (‘A-IFRS’). Compliance with the A-IFRS ensures that the consolidated financial statements and notes of the consolidated entity comply with International Financial Reporting Standards (‘IFRS’).
The financial report includes separate financial statements of the company and the consolidated financial statements of the Group. The financial statements were authorised for issue by the directors on 23 April 2009.
Basis of Preparation
The financial report has been prepared on the basis of historical cost, except for the revaluation of certain non-current assets and financial instruments. Cost is based on the fair values of the consideration given in exchange for assets.
All amounts are presented in Australian dollars. The company is a company of the kind referred to in ASIC Class Order 98/0100, dated 10 July 1998, and in accordance with that Class Order amounts in the financial report are rounded off to the nearest thousand dollars, unless otherwise indicated.
Accounting policies are selected and applied in a manner which ensures that the resulting financial information satisfies the concepts of relevance and reliability, thereby ensuring that the substance of the underlying transactions or other events is reported.
The following significant accounting policies have been adopted in the preparation and presentation of the financial report:
a. Principles of general insurance business
An insurance contract is defined as a contract under which one party (the insurer) accepts significant insurance risk from another party (the policyholder) by agreeing to compensate the policyholder if a specified uncertain future event (the insured event) adversely affects the policyholder.
b. Premium revenue
Direct premium comprises amounts charged to the policyholder or insurers including fire service levies, but excluding stamp duties collected on behalf of third parties. The earned portion of premiums received and receivable, including unclosed business, is recognised as revenue. Premium is treated as earned from the date of attachment of risk. Premiums on unclosed business are brought to account by reference to the previous year’s premium processing delays with due allowance for any changes in the pattern of new business and renewals.
The pattern of recognition of income over the policy period is based on time, which closely approximates the pattern of risks underwritten. Unearned premium is determined by apportioning the premiums written in the year, after deducting reinsurance.
c. Claims
Claims expense and a liability for outstanding claims are recognised in respect of all business written. The liability covers claims reported but not yet paid, incurred but not reported claims (“IBNR”) and the anticipated direct and indirect costs of settling those claims. Claims outstanding are assessed by reviewing individual claim files and estimating changes in the ultimate cost of settling claims with IBNRs and settlement costs using statistics based on past experience and trends.

Ansvar Insurance LimitedAnnual Report 2008
15
No discounting has been applied to outstanding claims for ‘short tail’ classes as the impact is not significant. The liability for outstanding claims for ‘long-tail’ classes is measured as the present value of the expected future payments. These payments are estimated on the basis of the ultimate cost of settling claims, which is affected by factors arising during the period to settlement such as normal and ‘superimposed’ inflation. The expected future payments are discounted to present value at the balance date using risk free rates.
d. Outwards reinsurance
Premium ceded to reinsurers is recognised as an expense in accordance with the pattern of reinsurance service received. Accordingly, a portion of outwards reinsurance premium is treated at the balance date as a prepayment.
e. Reinsurance and other recoveries receivable
Reinsurance and other recoveries receivable on paid claims, reported claims not yet paid and IBNRs are recognised as revenue. Recoveries receivable are assessed in a manner similar to the assessment of outstanding claims.
f. Acquisition costs
Acquisition costs incurred in obtaining insurance contracts are deferred and recognised as assets where they can be reliably measured and where it is probable that they will give rise to revenue that will be recognised in the Income Statement in subsequent reporting periods. Deferred acquisition costs are measured at the lower of cost and recoverable amount. Deferred acquisition costs are amortised systematically in accordance with the expected pattern of the incidence of risk under the general insurance contracts to which they relate. This pattern of amortisation corresponds to the earning pattern of the corresponding premium revenue.
g. Fire brigade and other charges
A liability for fire brigade and other charges is recognised on business written to the balance date. Levies and charges payable by the company are expensed on the same basis as the recognition of premium revenue, with the portion relating to unearned premium being recorded as a prepayment.
h. Unearned premium liabilities
Unearned premium liability is determined by apportioning the premium written over the period from date of attachment of risk to the expiry of the policy term.
Liability adequacy testing is performed in order to recognise any deficiencies in the Income Statement arising from the carrying amount of the unearned premium liability less any related deferred acquisition costs and intangible assets not meeting the estimated future claims under current insurance contracts.
The estimated future claims under current insurance contracts are measured using the present value of the expected cash flows relating to future claims and associated expenses (discounted using a risk free discount rate) plus an additional fair value risk margin to reflect the inherent uncertainty of those estimated cash flows.
Liability adequacy testing is performed at the level of a portfolio of contracts that are subject to broadly similar risks and are managed together as a single portfolio.
16
1. Significant accounting policies (continued)
i. Financial Assets
In accordance with AASB 1023 General Insurance Contracts, the consolidated entity is required to measure financial assets held to fund insurance provisions at fair value through profit or loss.
AASB 139 Financial Instruments: Recognition and Measurement has an option to measure all financial assets at fair value through profit or loss. Shareholders’ funds constitute a group of financial assets which are managed, and their performance evaluated, on a fair value basis in accordance with the consolidated entity’s documented investment strategy. Information prepared on this basis is provided to the consolidated entity’s senior management. The consolidated entity has therefore elected to measure all financial assets that do not fund insurance provisions at fair value through profit or loss upon initial recognition and at the date of transition to AIFRS.
Fair value is determined by reference to the closing bid price of the instrument at balance sheet day.
Loans and receivables
Loans and receivables are measured at amortised cost using the effective interest method less impairment.
j. Financial instruments issued by the company
Debt and equity instruments
Debt and equity instruments are classified as either liabilities or as equity in accordance with the substance of the contractual arrangement.
Transaction costs on the issue of equity instruments
Transaction costs arising on the issue of equity instruments are recognised directly in equity as a reduction of the proceeds of the equity instruments to which the costs relate. Transaction costs are the costs that are incurred directly in connection with the issue of those equity instruments and which would not have been incurred had those instruments not been issued.
Interest and dividends
Interest and dividends are classified as expenses or as distributions of profit consistent with the balance sheet classification of the related debt or equity instruments.
k. Property, plant and equipment
Owner occupied land and buildings are measured at fair value. Fair value is determined on the basis of an independent valuation prepared by external valuation experts, based on discounted cash flows or capitalisation of net income (as appropriate). The independent valuation is carried out every three years. The fair values are recognised in the financial statements of the consolidated entity and are reviewed at the end of each reporting period to ensure that the carrying value of land and buildings is not materially different from their fair values.
Any revaluation increase arising on the revaluation of land and buildings is credited to the asset revaluation reserve, except to the extent that it reverses a revaluation decrease for the same asset previously recognised as an expense in profit or loss, in which case the increase is credited to the income statement to the extent of the decrease previously charged. A decrease in carrying amount arising on the revaluation of land and buildings is charged as an expense in profit or loss to the extent that it exceeds the balance, if any, held in the asset revaluation reserve relating to a previous revaluation of that asset.
Depreciation on revalued buildings is charged to profit or loss. On the subsequent sale or retirement of a revalued property, the attributable revaluation surplus remaining in the asset revaluation reserve, net of any related deferred taxes, is transferred directly to retained earnings.
Notes to the financial statements for the financial year ended 31 December 2008
Ansvar Insurance LimitedAnnual Report 2008
17
Plant and equipment and leasehold improvements are stated at cost less accumulated depreciation and impairment. Cost includes expenditure that is directly attributable to the acquisition of the item. In the event that settlement of all or part of the purchase consideration is deferred, cost is determined by discounting the amounts payable in the future to their present value as at the date of acquisition.
Depreciation is provided on property, plant and equipment, including freehold buildings but excluding land. Depreciation is calculated on a straight line basis so as to write off the net cost or other revalued amount of each asset over its expected useful life to its estimated residual value. Leasehold improvements are depreciated over the period of the lease or estimated useful life, whichever is the shorter, using the straight line method. The estimated useful lives, residual values and depreciation method is reviewed at the end of each annual reporting period.
The following estimated useful lives are used in the calculation of depreciation:
Buildings 20-30 years Leasehold improvements Length of lease Motor vehicles 5-7 years Office furniture and fittings 3-15 years Computer hardware 3-5 years
l. Employee benefits
Provision is made for benefits accruing to employees in respect of wages and salaries, annual leave, long service leave, and sick leave when it is probable that settlement will be required and they are capable of being measured reliably.
Provisions made in respect of employee benefits expected to be settled within 12 months, are measured as the amount unpaid at the reporting date at current pay rates in respect of employees’ services up to that date.
Provisions made in respect of employee benefits are not expected to be settled within 12 months and are measured as the present value of the expected future cash outflows to be made by the economic entity in respect of services provided by employees up to the reporting date. Consideration is given to expected future wage and salary levels, experience of employee departures and periods of service. Expected future payments are discounted using interest rates on national government guaranteed securities with terms to maturity that match, as closely as possible, the estimated future cash outflows.
Defined contribution plans
Contributions to defined contribution superannuation plans are expensed when incurred.
m. Foreign currency
Foreign currency transactions
All foreign currency transactions during the financial year are brought to account using the exchange rate in effect at the date of the transaction. Foreign currency monetary items at reporting date are translated at the exchange rate existing at reporting date. Non-monetary assets and liabilities carried at fair value that are denominated in foreign currencies are translated at the rates prevailing at the date when the fair value was determined.
Foreign operations
Assets and liabilities of the controlled entity in New Zealand have been translated into Australian currency at year-end rates of exchange, while revenue and expenses of this controlled entity have been translated at the average of rates ruling during the year. As these foreign operations are all self sustaining, profits and losses arising on translation have been brought to account directly to the foreign currency translation reserve and have not been taken to the statement of financial performance.
18
1. Significant accounting policies (continued)
n. Borrowings
Borrowings are recorded initially at fair value, net of transaction costs.
Subsequent to initial recognition, borrowings are measured at amortised cost with any difference between the initial recognised amount and the redemption value being recognised in profit and loss over the period of the borrowing using the effective interest rate method.
o. Cash and cash equivalents
Cash and cash equivalents comprise cash on hand, cash in banks and investments in money market instruments, net of outstanding bank overdrafts. Bank overdrafts are shown within borrowings in current liabilities in the balance sheet.
Cash equivalents are held for the purpose of meeting short-term cash commitments rather than for investment purposes; these are money market instruments with short maturities (three months or less from the date of acquisition) which are readily convertible to a known amount of cash and are subject to an insignificant risk of changes in value.
p. Goods and Services Tax
Revenues, expenses and assets are recognised net of the amount of goods and services tax (GST), except:
i. where the amount of GST incurred is not recoverable from the taxation authority, it is recognised as part of the cost of acquisition of an asset or as part of an item of expense; or
ii. for receivables and payables which are recognised inclusive of GST.
The net amount of GST recoverable from, or payable to, the taxation authority is included as part of receivables or payables.
Cash flows are included in the statement of cash flows on a gross basis. The GST component of cash flows arising from investing and financing activities which is recoverable from, or payable to, the taxation authority is classified as operating cash flows.
q. Impairment of Assets
At each reporting date, the consolidated entity reviews the carrying amounts of its tangible and intangible assets to determine whether there is any indication that those assets have suffered an impairment loss. If any such indication exists, the recoverable amount of the asset is estimated in order to determine the extent of the impairment loss (if any). Where the asset does not generate cash flows that are independent from other assets, the consolidated entity estimates the recoverable amount of the cash-generating unit to which the asset belongs. Intangible assets with indefinite useful lives and intangible assets not yet available for use are tested for impairment annually and whenever there is an indication that the asset may be impaired.
Recoverable amount is the higher of fair value less costs to sell and value in use. In assessing value in use, the estimated future cash flows are discounted to their present value using a pre-tax discount rate that reflects current market assessments of the time value of money and the risks specific to the asset for which the estimates of future cash flows have not been adjusted.
If the recoverable amount of an asset (or cash-generating unit) is estimated to be less than its carrying amount, the carrying amount of the asset (or cash-generating unit) is reduced to its recoverable amount. An impairment loss is recognised in profit or loss immediately, unless the relevant asset is carried at fair value, in which case the impairment loss is treated as a revaluation decrease.
Where an impairment loss subsequently reverses, the carrying amount of the asset (or cash-generating unit) is increased to the revised estimate of its recoverable amount, but only to the extent that the increased carrying amount does not exceed the carrying amount that would have been determined had no impairment loss been recognised for the asset (or cash-generating unit) in prior years. A reversal of an impairment loss is recognised in profit or loss immediately, unless the relevant asset is carried at fair value, in which case the reversal of the impairment loss is treated as a revaluation increase.
Notes to the financial statements for the financial year ended 31 December 2008
Ansvar Insurance LimitedAnnual Report 2008
19
r. Income Tax
Current tax
Current tax is calculated by reference to the amount of income taxes payable or recoverable in respect of the taxable profit or tax loss for the period. It is calculated using tax rates and tax laws that have been enacted or substantively enacted by reporting date. Current tax for current and prior periods is recognised as a liability (or asset) to the extent that it is unpaid (or refundable).
Deferred tax
Deferred tax is accounted for using the comprehensive balance sheet liability method in respect of temporary differences arising from differences between the carrying amount of assets and liabilities in the financial statements and the corresponding tax base of those items.
In principle, deferred tax liabilities are recognised for all taxable temporary differences. Deferred tax assets are recognised to the extent that it is probable that sufficient taxable amounts will be available against which deductible temporary differences or unused tax losses and tax offsets can be utilised. However, deferred tax assets and liabilities are not recognised if the temporary differences giving rise to them arise from the initial recognition of assets and liabilities (other than as a result of a business combination) which affects neither taxable income nor accounting profit.
Deferred tax liabilities are recognised for taxable temporary differences arising on investments in subsidiaries, branches, associates and joint ventures except where the consolidated entity is able to control the reversal of the temporary differences and it is probable that the temporary differences will not reverse in the foreseeable future. Deferred tax assets arising from deductible temporary differences associated with these investments and interests are only recognised to the extent that it is probable that there will be sufficient taxable profits against which to utilise the benefits of the temporary differences and they are expected to reverse in the foreseeable future.
Deferred tax assets and liabilities are measured at the tax rates that are expected to apply to the period(s) when the asset and liability giving rise to them are realised or settled, based on tax rates (and tax laws) that have been enacted or substantively enacted by reporting date. The measurement of deferred tax liabilities and assets reflects the tax consequences that would follow from the manner in which the consolidated entity expects, at the reporting date, to recover or settle the carrying amount of its assets and liabilities.
Current and deferred tax for the period
Current and deferred tax is recognised as an expense or income in the income statement, except when it relates to items credited or debited directly to equity, in which case the deferred tax is also recognised directly in equity, or where it arises from the initial accounting for a business combination, in which case it is taken into account in the determination of goodwill or excess.
s. Intangible assets
Other intangible assets are non-monetary assets other than goodwill with no physical substance, which are separately identifiable, controlled by the consolidated entity and have future economic benefits.
Where the intangible asset is deemed to have indefinite life, it is not amortised but tested for impairment at least on an annual basis. If it is deemed to have finite useful life, it is to be amortised over its useful life and tested for impairment whenever there is an indication that the asset may be impaired.
20
1. Significant accounting policies (continued)
t. Leased assets
Leases are classified as finance leases whenever the terms of the lease transfer substantially all the risks and rewards of ownership to the lessee. All other leases are classified as operating leases.
Group as lessee
Operating lease payments are recognised as an expense on a straight-line basis over the lease term, except where another systematic basis is more representative of the time pattern in which economic benefits from the leased asset are consumed.
u. Payables
Payables are recognised when the company becomes obliged to make future payments resulting from the purchase of goods and services.
v. Principles of consolidation
The consolidated financial statements incorporate the financial statements of the company and entities controlled by the Company (its subsidiaries) referred to as “the Group” in these financial statements. Control is achieved where the company has the power to govern the financial and operating policies of an entity so as to obtain benefits from its activities.
The consolidated financial statements include the information and results of each controlled entity from the date on which the company obtains control and until such time as the company ceases to control such entity.
Consistent accounting policies are employed in the preparation and presentation of the consolidated financial statements.
In preparing the consolidated financial statements, all intercompany balances and transactions, and unrealised profits arising within the economic entity are eliminated in full.
w. Comparative amounts
When the presentation or classification of items in the financial report is amended, comparative amounts are reclassified, unless the reclassification is impracticable.
Notes to the financial statements for the financial year ended 31 December 2008
Ansvar Insurance LimitedAnnual Report 2008
21
2. Critical accounting estimates and judgements
In the application of A-IFRS management is required to make judgments, estimates and assumptions about carrying values of assets and liabilities that are not readily apparent from other sources. The estimates and associated assumptions are based on historical experience and various other factors that are believed to be reasonable under the circumstance, the results of which form the basis of making the judgments. Actual results may differ from these estimates. The estimates and underlying assumptions are reviewed on an ongoing basis. Revisions to accounting estimates are recognised in the period in which the estimate is revised if the revision affects only that period or in the period of the revision and future periods if the revision affects both current and future periods.
Key sources of estimation uncertainty
Judgments made by management in the application of A-IFRS that have significant effects on the financial statements and estimates with a significant risk of material adjustments in the next year are disclosed, where applicable, in the relevant notes to the financial statements.
Significant estimates and judgements are made by the Group to arrive at certain key asset and liability amounts disclosed in the financial statements. These estimates and judgements are continually being evaluated and are based on historical experience, as well as enhancements to actuarial modelling techniques.
The key areas of significant estimates and judgements and the methodologies used to determine key assumptions are set out below.
a. Uncertainty over estimate of ultimate liability arising from claims made under general insurance contracts
Provision is made at the year end for the estimated cost of claims incurred but not settled at the balance sheet date, including the cost of claims incurred but not reported to the consolidated entity.
The estimation of outstanding claim liabilities is based largely on the assumption that past developments are an appropriate predictor of the future and involves a variety of actuarial techniques that analyse experience, trends and other relevant factors. The process commences with the actuarial projection of the future claim payments and claim handling costs incurred to the reporting date. Each class of business is usually examined separately and some or all of the following will be considered for each class in projecting future claim payments:
i. Historical trends in the development and incidence of the number of claims reported, number of claims finalised, claim payments and reported incurred costs;
ii. Exposure details, including policy counts, sums insured, earned premiums and policy limits;
iii. Claim frequencies and average claim sizes;
iv. The legislative framework, legal and court environments and social and economic factors that may impact upon each class of business;
v. Historical and likely future trends in standard inflationary pressures relating to commodity prices and wages;
vi. Historical and likely future trends of inflationary pressures in addition to price or wage inflation, termed superimposed inflation;
vii. Historical and likely future trends of expenses associated with managing claims to finalisation;
viii. Reinsurance recoveries available under contracts entered into by the insurer;
ix. Historical and likely future trends of recoveries from sources such as subrogation and third party actions; and
x. Insurer specific, relevant industry data and more general economic data is utilised in the estimation process.
Projected future claim payments and associated claim handling costs are discounted to a present value as required using appropriate risk free discount rates. A projection of future claims payments, both gross and net of reinsurance and other recoveries, is undertaken.
22
2. Critical accounting estimates and judgements (continued)
This projection is typically made without bias toward over or under estimation. As such, the resulting estimate is considered to be a net central estimate of outstanding claims liabilities that has an approximately equal chance of proving adequate as not. Where possible and appropriate, multiple actuarial methods will be applied to project future claim payments. This assists in providing a greater understanding of the trends inherent in the past data. The projections obtained from various methods also assist in setting the range of possible outcomes. The most appropriate method, or even a blend of methods, is selected taking into account the characteristics of the class of business and the extent of the development of each past accident period.
Large claims impacting each relevant business class are generally assessed separately, being measured on a case by case basis or projected separately in order to allow for the possible distortive effect of the development and incidence of these large claims.
As an estimate of future outcomes, the net central estimate of outstanding claims liabilities is subject to uncertainty. This uncertainty may consist of one or more of the following components:
Modelling
The process of managing and finalising claims is a complex one. Actuarial models represent a simplification of this complex process giving rise to the possibility that the actual future outcomes may depart from the modelled outcome.
Assumption selection
Even with the perfect model, assumptions about future claim payment experience must be drawn from limited past data and are subject to sampling error.
Evolution of assumptions
Some assumptions will be subject to changes over time due to external sources, such as changes to the legislative environment and the economic environment, or internal sources such as claim management practices.
Random variation
There is a certain amount of residual randomness that drives differences between actual and expected outcomes.
Uncertainty from the above sources is examined for each class of business and expressed as a volatility of the net central estimate. The volatility for each class is derived after consideration of stochastic modelling and benchmarking to industry analysis.
The long tail classes of liability have the highest volatilities of the insurance classes as the longer average time to settle provides a greater opportunity for sources of uncertainty to emerge. Short tail classes such as Motor, Home and Contents and Property have lower levels of volatility.
As the volatility for each class of business is partially correlated with other classes, when combined across the entire company, the overall volatility will be less than the sum of the individual classes.
With an estimate of the overall volatility for general insurance business, a range of risk margins associated with a probability of the total net provision for outstanding claims liabilities proving adequate may be produced.
b. Assets arising from reinsurance contracts
Assets arising from reinsurance contracts are also computed using the above methods. In addition, the recoverability of these assets is assessed on a periodic basis to ensure that the balance is reflective of the amounts that will ultimately be received, taking into consideration factors such as counterparty and credit risk. Impairment is recognised where there is objective evidence that the company may not receive amounts due to it and these amounts can be reliably measured.
Notes to the financial statements for the financial year ended 31 December 2008
Ansvar Insurance LimitedAnnual Report 2008
23
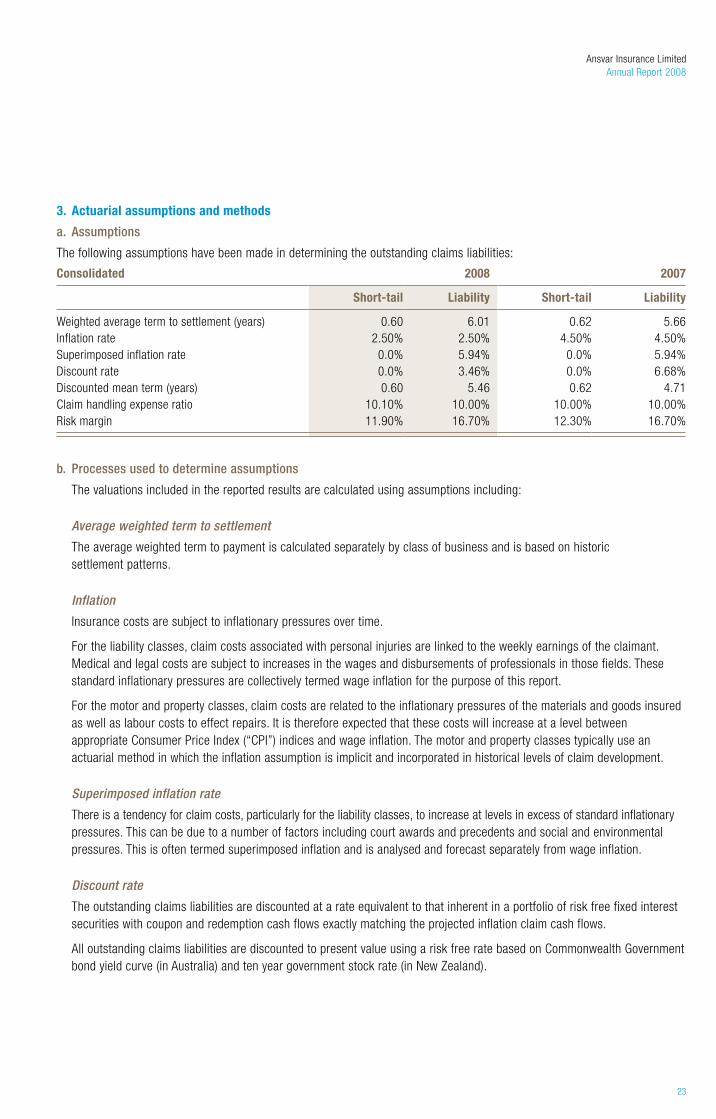
3. Actuarial assumptions and methods
a. Assumptions
The following assumptions have been made in determining the outstanding claims liabilities:
Consolidated 2008 2007
Short-tail Liability Short-tail Liability
Weighted average term to settlement (years) 0.60 6.01 0.62 5.66Inflation rate 2.50% 2.50% 4.50% 4.50%Superimposed inflation rate 0.0% 5.94% 0.0% 5.94%Discount rate 0.0% 3.46% 0.0% 6.68%Discounted mean term (years) 0.60 5.46 0.62 4.71Claim handling expense ratio 10.10% 10.00% 10.00% 10.00%Risk margin 11.90% 16.70% 12.30% 16.70%
b. Processes used to determine assumptions
The valuations included in the reported results are calculated using assumptions including:
Average weighted term to settlement
The average weighted term to payment is calculated separately by class of business and is based on historic settlement patterns.
Inflation
Insurance costs are subject to inflationary pressures over time.
For the liability classes, claim costs associated with personal injuries are linked to the weekly earnings of the claimant. Medical and legal costs are subject to increases in the wages and disbursements of professionals in those fields. These standard inflationary pressures are collectively termed wage inflation for the purpose of this report.
For the motor and property classes, claim costs are related to the inflationary pressures of the materials and goods insured as well as labour costs to effect repairs. It is therefore expected that these costs will increase at a level between appropriate Consumer Price Index (“CPI”) indices and wage inflation. The motor and property classes typically use an actuarial method in which the inflation assumption is implicit and incorporated in historical levels of claim development.
Superimposed inflation rate
There is a tendency for claim costs, particularly for the liability classes, to increase at levels in excess of standard inflationary pressures. This can be due to a number of factors including court awards and precedents and social and environmental pressures. This is often termed superimposed inflation and is analysed and forecast separately from wage inflation.
Discount rate
The outstanding claims liabilities are discounted at a rate equivalent to that inherent in a portfolio of risk free fixed interest securities with coupon and redemption cash flows exactly matching the projected inflation claim cash flows.
All outstanding claims liabilities are discounted to present value using a risk free rate based on Commonwealth Government bond yield curve (in Australia) and ten year government stock rate (in New Zealand).

24
3. Actuarial assumptions and methods (continued)
b. Processes used to determine assumptions (continued)
Expense allowance
An estimate of outstanding claims liabilities will typically incorporate an allowance for the future cost of administering the claims. This allowance is determined after analysing claim related expenses incurred by the classes of business.
Risk margin
The overall risk margin is determined allowing for diversification between classes of business and the relative uncertainty of the outstanding claims estimate for each class.
The assumptions regarding uncertainty for each class are applied to the net central estimates and the results are aggregated, allowing for diversification, in order to arrive at an overall net provision that is intended to have an 80% probability of sufficiency.
Ultimate loss ratio
This is the ratio of incurred losses to earned premium (both net of reinsurance) inherent in actual experience to date plus outstanding payments.
Effects of changes in actuarial assumptions from 31 December 2007 to 31 December 2008
Discount rates Short tail: no changeLiability: 6.75% to 3.50%
11,239
Claims inflation Short tail: no changeLiability: 10.5% to 8.5%
(3,620)
Claims handling expense ratio No change -Risk margin No change -
Specific short tail class assumptions (Australia) 147ICD assumptions 39Minimum loss ratio
Specific liability class assumptions (Australia)Claim numbers (106)PPCI assumptions (2,297)PCE assumptions 261Reinsurance (206)Changes from PPCI to PCE for 2000 Accident Year (1,137)Removal of Minimum loss ratio for 2004 (5,300)Changes in Minimum lass ratio for other years (5,077)Special issues claims (1,366)Recognition of Large Claim 687
Specific short tail class assumptions (New Zealand):ICD assumptions (55)
Specific liability class assumptions (New Zealand):Loss ratio (234)
Notes to the financial statements for the financial year ended 31 December 2008

Ansvar Insurance LimitedAnnual Report 2008
25
c. Sensitivity analysis
The consolidated entity conducts sensitivity analyses to quantify the exposure to the risk of changes in the underlying assumptions used in the financial statements.
The sensitivity of the Group’s profit and equity to key valuation assumptions is tabulated on the next page (the assumed tax rate is 30%):
Net profit $’000
Equity $’000
Recognised amounts in the financial statements 8,676 74,549
Variable Movement in variableMovement in amount
$’000
Average weighted term to settlement +1 year - 1 year
(2,206) 2,284
(2,206)2,284
Claims inflation rate 1.00% - 1.00%
3,585 (3,398)
3,585 (3,398)
Discount rate 1.00% - 1.00%
(3,398) 3,585
(3,398) 3,585
Minimum loss ratio 1.00% - 1.00%
502 (502)
502 (502)
Claims handling expenses ratio 1.00% - 1.00%
727 (727)
727 (727)

26
Notes to the financial statements for the financial year ended 31 December 2008
4. Risk management
The financial condition and operations of the consolidated entity are affected by a number of key risks including insurance risk, interest rate risk, currency risk, credit risk, market risk, liquidity risk, financial risk, compliance risk, fiscal risk and operational risk. Notes on the consolidated entity’s policies and procedures in respect of managing these risks are set out in this note.
a. Objectives in managing risks arising from insurance contracts and policies for mitigating those risks
The consolidated entity has an objective to control insurance risk thus minimising substantial unexpected losses that would expose the consolidated entity to an adverse financial capital loss.
In accordance with Prudential Standards GPS 220 Risk Management and GPS 230 Reinsurance Management issued by the Australian Prudential Regulation Authority (APRA), the Board and senior management of the Group has developed, implemented and maintain a sound and prudent Risk Management Strategy (RMS) and a Reinsurance Management Strategy (REMS).
The RMS and REMS identify the Group’s policies and procedures, processes and controls that comprise its risk management and control systems. These systems address all material risks, financial and non-financial, likely to be faced by the Group. Annually, the Board certifies to APRA that adequate strategies have been put in place to monitor those risks, that the Group has systems in place to ensure compliance with legislative and prudential requirements and that the Board has satisfied itself as to the compliance with the RMS and REMS.
The RMS and REMS have been approved by the Board and lodged with APRA. Key aspects of the processes established in the RMS to mitigate risks include:
• Themaintenanceanduseofsophisticatedmanagementinformationsystems,whichprovideuptodate,reliabledataonthe risks to which the business is exposed at any point in time.
• Actuarialmodels,usinginformationfromthemanagementinformationsystems,areusedtocalculatepremiumsandmonitor claims patterns. Past experience and statistical methods are used as part of the process.
• Documentedproceduresarefollowedforunderwritingandacceptinginsurancerisks.
• ReinsuranceisusedtolimittheGroup’sexposuretolargesingleclaimsandcatastrophes.
• Themixofassetsinvestedinisdrivenbythenatureandtermofinsuranceliabilities.Themanagementofassetsandliabilities is closely monitored to attempt to match the maturity dates of assets with the expected pattern of claim payments.
• Thediversificationofbusinessoverclasseswithinthereinsuranceportfolio,separategeographicalsegmentsandlargenumbers of uncorrelated individual risks seeks to reduce variability in loss experience.
b. Interest rate risk
None of the financial assets or liabilities arising from insurance or reinsurance contracts entered into by the Group are directly exposed to interest rate risk.
Insurance and reinsurance contracts are entered into annually. At the time of entering into the contract, all terms and conditions are negotiable or, in the case of renewals, renegotiable.
The Group is exposed to interest rate risk as the entities in the Group invest funds in fixed interest securities of various maturities. This exposure is closely monitored by Investment Committee. Assets and liabilities are appropriately matched in terms of type, duration and currency. At least two non executive directors and the Managing Director are elected as members of the Investment Committee. The Committee’s functions include reviewing the effectiveness of the company’s investment strategy, recommending specific investment action, reviewing the investment risk management statement and recommending any changes of this statement to the Board of Directors.

Ansvar Insurance LimitedAnnual Report 2008
27
c. Credit risk
Financial assets or liabilities arising from insurance and reinsurance contracts are stated in the balance sheet at the amount that best represents the maximum credit risk exposure at balance date. There are no significant concentrations of credit risk.
d. Terms and conditions of insurance business
The terms and conditions attaching to insurance contracts affect the level of insurance risk accepted by the Group. There are no special terms and conditions in any non standard contracts that have a material impact on the financial statements. The Group’s exposure is diversified across Australia and New Zealand. Insurance contracts written in Australia and New Zealand are subject to substantially the same terms and conditions.
e. Concentration of insurance risk
The Group’s exposure to concentrations of insurance risk is mitigated by a portfolio diversified into different classes of business comprising personal and commercial markets and short and long tail classes of risk written out of Australia and New Zealand. The portfolio is controlled and monitored by the Group’s Risk Management Strategy and Audit and Risk Committee. The Committee’s role includes identifying and mitigating the high-level risks.
f. Terms and conditions of reinsurance contracts
The Group reinsures a portion of the risks it underwrites in order to control exposure to losses, stabilise earnings, protect capital resources and ensure efficient control and spread of underwriting risk.
The financial probity of reinsurers is determined by the UK based group reinsurance security committee which decides annually which reinsurers the group will utilise. This decision is based on the nominated reinsurers meeting a desired credit rating and performance criteria. There is flexibility for individual business units in particular circumstances to present a case to the committee to move outside this band of reinsurers.
g. Changes of interest rate in different territories
The asset/liability matching process also matches the currency of related assets and liabilities. The Group’s assets and liabilities are affected by the different interest rates of the territories in which the Group operates – Australia and New Zealand. Those assets, which are interest bearing and not 100% matched, are therefore subject to the interest rate fluctuations for a number of different currencies in different proportions.
28
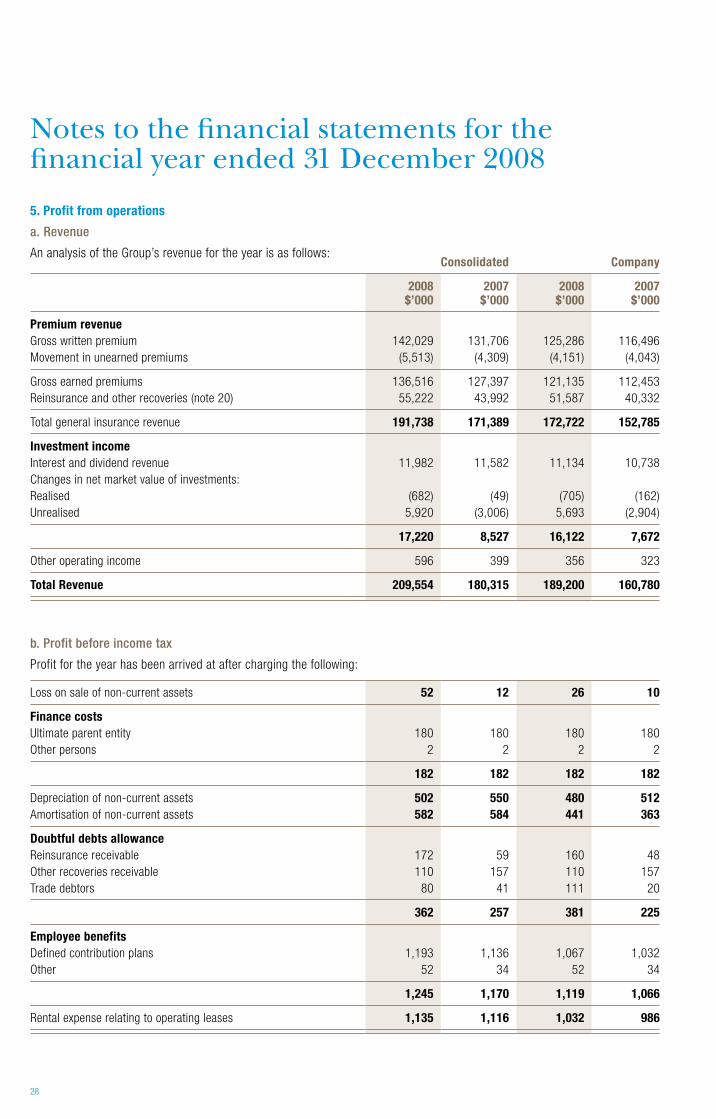
5. Profit from operations
a. Revenue
An analysis of the Group’s revenue for the year is as follows:Consolidated Company
2008 $’000
2007 $’000
2008 $’000
2007 $’000
Premium revenueGross written premium 142,029 131,706 125,286 116,496Movement in unearned premiums (5,513) (4,309) (4,151) (4,043)
Gross earned premiums 136,516 127,397 121,135 112,453Reinsurance and other recoveries (note 20) 55,222 43,992 51,587 40,332
Total general insurance revenue 191,738 171,389 172,722 152,785
Investment income Interest and dividend revenue 11,982 11,582 11,134 10,738Changes in net market value of investments: Realised (682) (49) (705) (162)Unrealised 5,920 (3,006) 5,693 (2,904)
17,220 8,527 16,122 7,672
Other operating income 596 399 356 323
Total Revenue 209,554 180,315 189,200 160,780
b. Profit before income tax
Profit for the year has been arrived at after charging the following:
Loss on sale of non-current assets 52 12 26 10
Finance costs
Ultimate parent entity 180 180 180 180Other persons 2 2 2 2
182 182 182 182
Depreciation of non-current assets 502 550 480 512Amortisation of non-current assets 582 584 441 363
Doubtful debts allowanceReinsurance receivable 172 59 160 48Other recoveries receivable 110 157 110 157Trade debtors 80 41 111 20
362 257 381 225
Employee benefitsDefined contribution plans 1,193 1,136 1,067 1,032Other 52 34 52 34
1,245 1,170 1,119 1,066
Rental expense relating to operating leases 1,135 1,116 1,032 986
Notes to the financial statements for the financial year ended 31 December 2008
Ansvar Insurance LimitedAnnual Report 2008
29
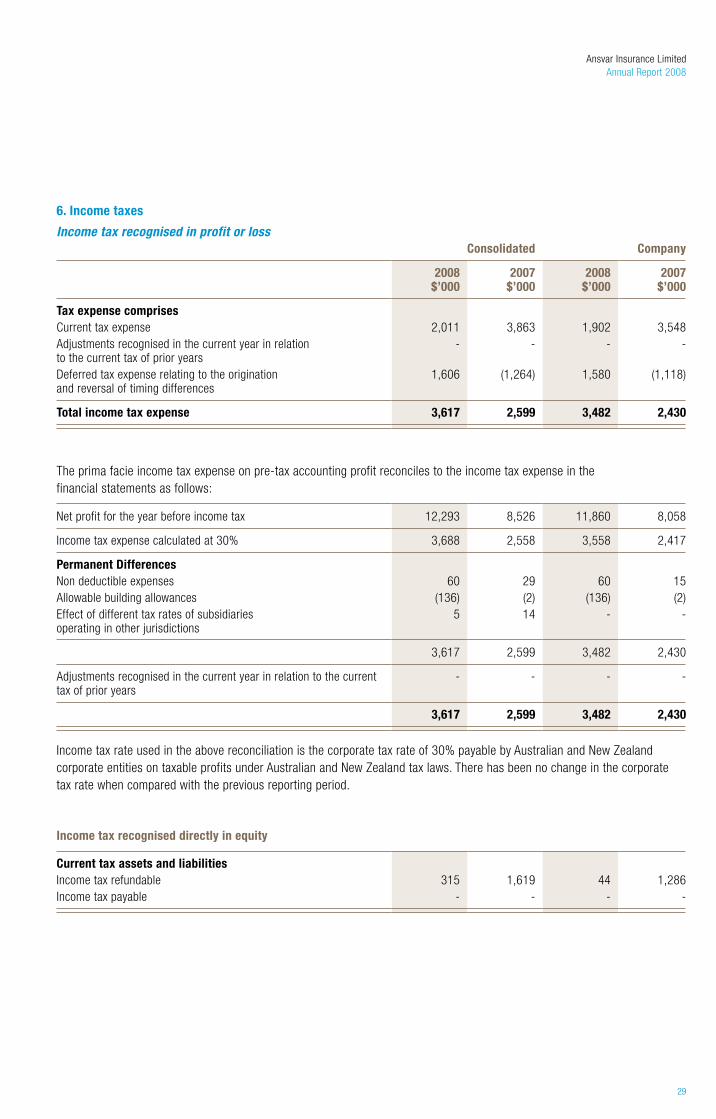
6. Income taxes
Income tax recognised in profit or lossConsolidated Company
2008 $’000
2007 $’000
2008 $’000
2007 $’000
Tax expense comprisesCurrent tax expense 2,011 3,863 1,902 3,548Adjustments recognised in the current year in relation to the current tax of prior years
- - - -
Deferred tax expense relating to the origination and reversal of timing differences
1,606 (1,264) 1,580 (1,118)
Total income tax expense 3,617 2,599 3,482 2,430
The prima facie income tax expense on pre-tax accounting profit reconciles to the income tax expense in the financial statements as follows:
Net profit for the year before income tax 12,293 8,526 11,860 8,058
Income tax expense calculated at 30% 3,688 2,558 3,558 2,417
Permanent Differences
Non deductible expenses 60 29 60 15Allowable building allowances (136) (2) (136) (2)Effect of different tax rates of subsidiaries operating in other jurisdictions
5 14 - -
3,617 2,599 3,482 2,430
Adjustments recognised in the current year in relation to the current tax of prior years
- - - -
3,617 2,599 3,482 2,430
Income tax rate used in the above reconciliation is the corporate tax rate of 30% payable by Australian and New Zealand corporate entities on taxable profits under Australian and New Zealand tax laws. There has been no change in the corporate tax rate when compared with the previous reporting period.
Income tax recognised directly in equity
Current tax assets and liabilitiesIncome tax refundable 315 1,619 44 1,286Income tax payable - - - -

30
6. Income taxes (continued) Temporary Differences
Taxable and deductible temporary differences arise from the following:
2008 Consolidated
Opening balance
$’000
Charged to income
$’000
Charged to equity $’000
Closing balance
$’000
Gross deferred tax liabilitiesRevenue receivable (800) 214 - (586)Deferred acquisition costs - - - -Property (140) - (40) (180)Unrealised gain on fixed interest securities - (969) - (969)
Total (940) (755) (40) (1,735)
Gross deferred tax assetsProvisions 1,224 (164) 1,060Doubtful debts allowance 114 27 141Indirect claims settlement costs 2,428 204 (548) 2,084Unexpired risk liability 129 56 185Purchased interest 612 (261) - 351Unrealised loss on fixed interest securities 1,372 (710) - 662Property, plant & equipment deductions 11 (3) 8
Total 5,890 (851) (548) 4,491
Presented in the balance sheet as follows:Deferred tax liability -Deferred tax asset 2,756
2,756
2007 Consolidated
Opening balance
$’000
Charged to income
$’000
Charged to equity
$’000
Closing balance
$’000
Gross deferred tax liabilitiesRevenue receivable (732) (68) - (800)Deferred acquisition costs (462) (81) - (543)Property (140) - - (140)Unrealised gain on fixed interest securities - - - -
Total (1,334) (149) - (1,483)
Gross deferred tax assetsProvisions 1,007 217 - 1,224Doubtful debts allowance 54 60 - 114Indirect claims settlement costs 2,097 331 - 2,428Unexpired risk liability 248 (119) - 129Purchased interest 398 214 - 612Unrealised loss on fixed interest securities 660 712 - 1,372Property, plant & equipment deductions 13 (2) - 11
Total 4,477 1,413 - 5,890
Presented in the balance sheet as follows:Deferred tax liability -Deferred tax asset 4,407
4,407
Notes to the financial statements for the financial year ended 31 December 2008
Ansvar Insurance LimitedAnnual Report 2008
31
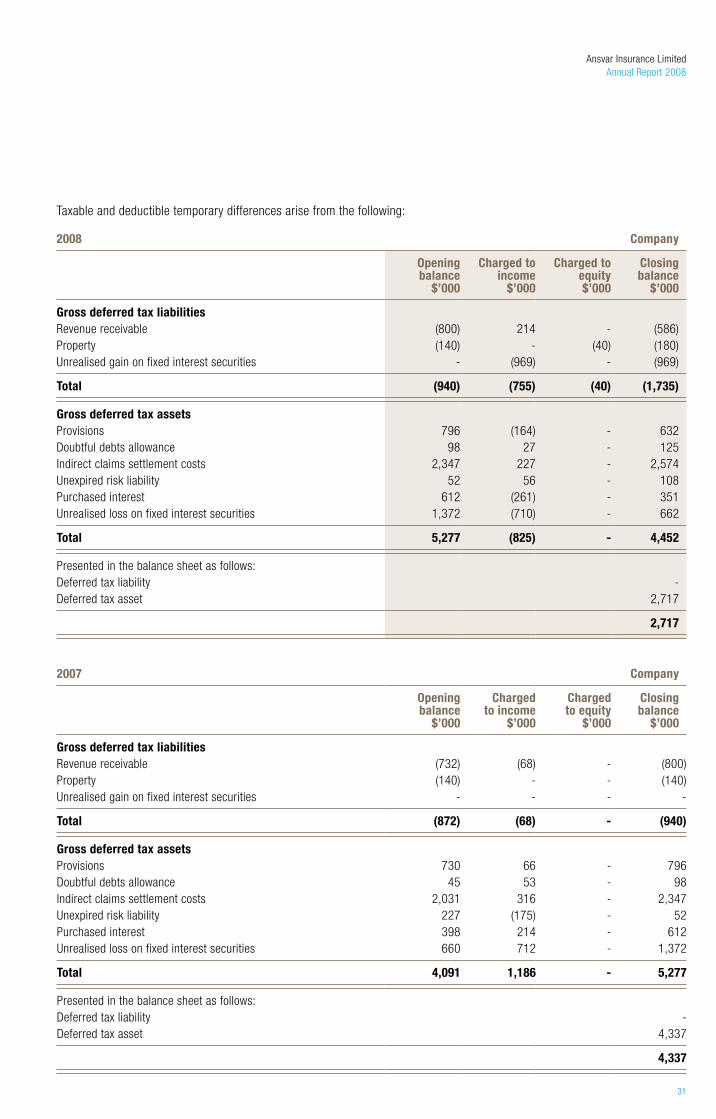
Taxable and deductible temporary differences arise from the following:
2008 Company
Opening balance
$’000
Charged to income
$’000
Charged to equity $’000
Closing balance
$’000
Gross deferred tax liabilitiesRevenue receivable (800) 214 - (586)Property (140) - (40) (180)Unrealised gain on fixed interest securities - (969) - (969)
Total (940) (755) (40) (1,735)
Gross deferred tax assetsProvisions 796 (164) - 632Doubtful debts allowance 98 27 - 125Indirect claims settlement costs 2,347 227 - 2,574Unexpired risk liability 52 56 - 108Purchased interest 612 (261) - 351Unrealised loss on fixed interest securities 1,372 (710) - 662
Total 5,277 (825) - 4,452
Presented in the balance sheet as follows:Deferred tax liability -Deferred tax asset 2,717
2,717
2007 Company
Opening balance
$’000
Charged to income
$’000
Charged to equity
$’000
Closing balance
$’000
Gross deferred tax liabilitiesRevenue receivable (732) (68) - (800)Property (140) - - (140)Unrealised gain on fixed interest securities - - - -
Total (872) (68) - (940)
Gross deferred tax assetsProvisions 730 66 - 796Doubtful debts allowance 45 53 - 98Indirect claims settlement costs 2,031 316 - 2,347Unexpired risk liability 227 (175) - 52Purchased interest 398 214 - 612Unrealised loss on fixed interest securities 660 712 - 1,372
Total 4,091 1,186 - 5,277
Presented in the balance sheet as follows:Deferred tax liability -Deferred tax asset 4,337
4,337

32
6. Income taxes (continued) Tax Consolidation System
Legislation to allow groups, comprising a parent entity and its Australian resident wholly-owned entities, to elect to consolidate and be treated as a single entity for income tax purposes was substantively enacted on 21 October 2002. This legislation, which includes both mandatory and elective elements, is applicable to the company.
The company and its wholly-owned Australian resident entity are eligible to consolidate for tax purposes under this legislation and have elected to be taxed as a single entity from 1 January 2004. The head entity within the tax-consolidated group for the purposes of the tax consolidation system is Ansvar Insurance Limited. No tax-sharing agreement has been entered into, and there is no financial effect of this consolidation on the group.
7. Key management personnel compensation
a. The directors of Ansvar Insurance Limited during the year were: Mr M.P Baird, Mr B.G. Harris, Mr D.J. Harrison, Dr B.E. Hughes, Mr J. R. Peberdy, Mr G.A. Prescott, Mr. W.G. Shearn, Mr J.O. Thomas and Mr M. H. Tripp.
b. Key executives:
Chief Financial Officer D. Muscari Operations Manager P. Atkinson (resigned 12 March 2008) Operations Manager D. Mullen (appointed 16 June 2008) National Claims Manager W. Goodall Human Resource Manager S. Hogan (resigned 24 December 2008) IT Manager D. Green Marketing Manager M. Hurley Manager for New Zealand D. Leather
c. The aggregate compensation of the directors and the executives specified above, being the key management personnel of the Group and the company is set out below:
Consolidated
2008 $’000
2007 $’000
Short-term employee benefits 1,909 1,909Other long-term benefits 222 252
2,131 2,161
8. Remuneration of auditorsConsolidated Company
2008 $
2007 $
2008 $
2007 $
Auditor of the parent entityAudit the financial report 134,470 124,165 86,767 80,930
Other services (i) 79,219 75,842 67,774 65,715
213,689 200,007 154,541 146,645
(i) included tax services, engagements required by regulator and other services.
Notes to the financial statements for the financial year ended 31 December 2008
Ansvar Insurance LimitedAnnual Report 2008
33
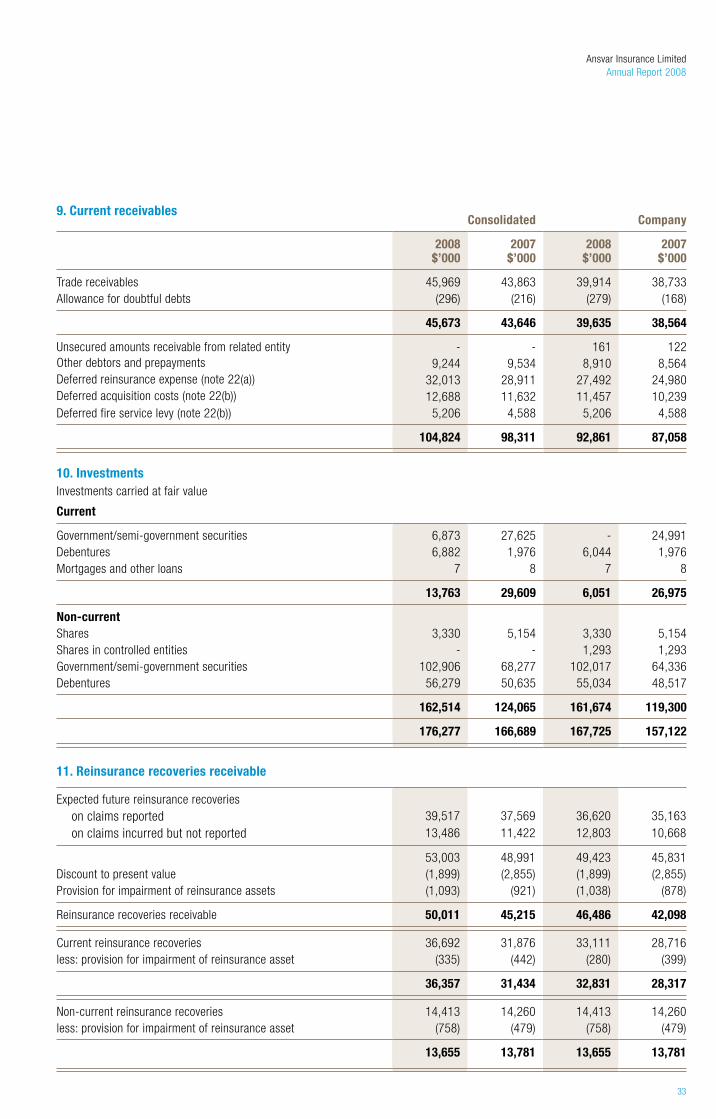
9. Current receivablesConsolidated Company
2008 $’000
2007 $’000
2008 $’000
2007 $’000
Trade receivables 45,969 43,863 39,914 38,733Allowance for doubtful debts (296) (216) (279) (168)
45,673 43,646 39,635 38,564
Unsecured amounts receivable from related entity - - 161 122Other debtors and prepayments 9,244 9,534 8,910 8,564Deferred reinsurance expense (note 22(a)) 32,013 28,911 27,492 24,980Deferred acquisition costs (note 22(b)) 12,688 11,632 11,457 10,239Deferred fire service levy (note 22(b)) 5,206 4,588 5,206 4,588
104,824 98,311 92,861 87,058
10. Investments Investments carried at fair value
Current
Government/semi-government securities 6,873 27,625 - 24,991Debentures 6,882 1,976 6,044 1,976Mortgages and other loans 7 8 7 8
13,763 29,609 6,051 26,975
Non-current Shares 3,330 5,154 3,330 5,154Shares in controlled entities - - 1,293 1,293Government/semi-government securities 102,906 68,277 102,017 64,336Debentures 56,279 50,635 55,034 48,517
162,514 124,065 161,674 119,300
176,277 166,689 167,725 157,122
11. Reinsurance recoveries receivable
Expected future reinsurance recoveries on claims reported 39,517 37,569 36,620 35,163on claims incurred but not reported 13,486 11,422 12,803 10,668
53,003 48,991 49,423 45,831Discount to present value (1,899) (2,855) (1,899) (2,855)Provision for impairment of reinsurance assets (1,093) (921) (1,038) (878)
Reinsurance recoveries receivable 50,011 45,215 46,486 42,098
Current reinsurance recoveries 36,692 31,876 33,111 28,716less: provision for impairment of reinsurance asset (335) (442) (280) (399)
36,357 31,434 32,831 28,317
Non-current reinsurance recoveries 14,413 14,260 14,413 14,260less: provision for impairment of reinsurance asset (758) (479) (758) (479)
13,655 13,781 13,655 13,781
34
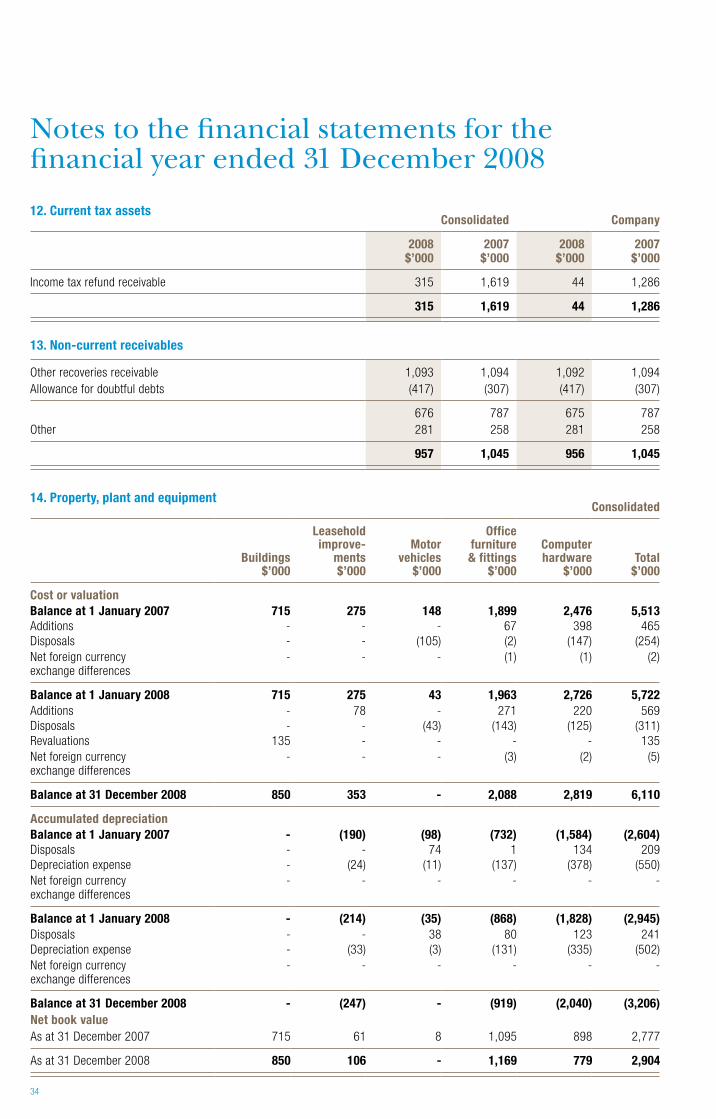
12. Current tax assetsConsolidated Company
2008 $’000
2007 $’000
2008 $’000
2007 $’000
Income tax refund receivable 315 1,619 44 1,286
315 1,619 44 1,286
13. Non-current receivables
Other recoveries receivable 1,093 1,094 1,092 1,094Allowance for doubtful debts (417) (307) (417) (307)
676 787 675 787Other 281 258 281 258
957 1,045 956 1,045
14. Property, plant and equipmentConsolidated
Buildings $’000
Leasehold improve-
ments $’000
Motor vehicles
$’000
Office furniture
& fittings $’000
Computer hardware
$’000Total
$’000
Cost or valuationBalance at 1 January 2007 715 275 148 1,899 2,476 5,513Additions - - - 67 398 465Disposals - - (105) (2) (147) (254)Net foreign currency exchange differences
- - - (1) (1) (2)
Balance at 1 January 2008 715 275 43 1,963 2,726 5,722Additions - 78 - 271 220 569Disposals - - (43) (143) (125) (311)Revaluations 135 - - - - 135Net foreign currency exchange differences
- - - (3) (2) (5)
Balance at 31 December 2008 850 353 - 2,088 2,819 6,110
Accumulated depreciationBalance at 1 January 2007 - (190) (98) (732) (1,584) (2,604)Disposals - - 74 1 134 209Depreciation expense - (24) (11) (137) (378) (550)Net foreign currency exchange differences
- - - - - -
Balance at 1 January 2008 - (214) (35) (868) (1,828) (2,945)Disposals - - 38 80 123 241Depreciation expense - (33) (3) (131) (335) (502)Net foreign currency exchange differences
- - - - - -
Balance at 31 December 2008 - (247) - (919) (2,040) (3,206)Net book valueAs at 31 December 2007 715 61 8 1,095 898 2,777
As at 31 December 2008 850 106 - 1,169 779 2,904
Notes to the financial statements for the financial year ended 31 December 2008
Ansvar Insurance LimitedAnnual Report 2008
35
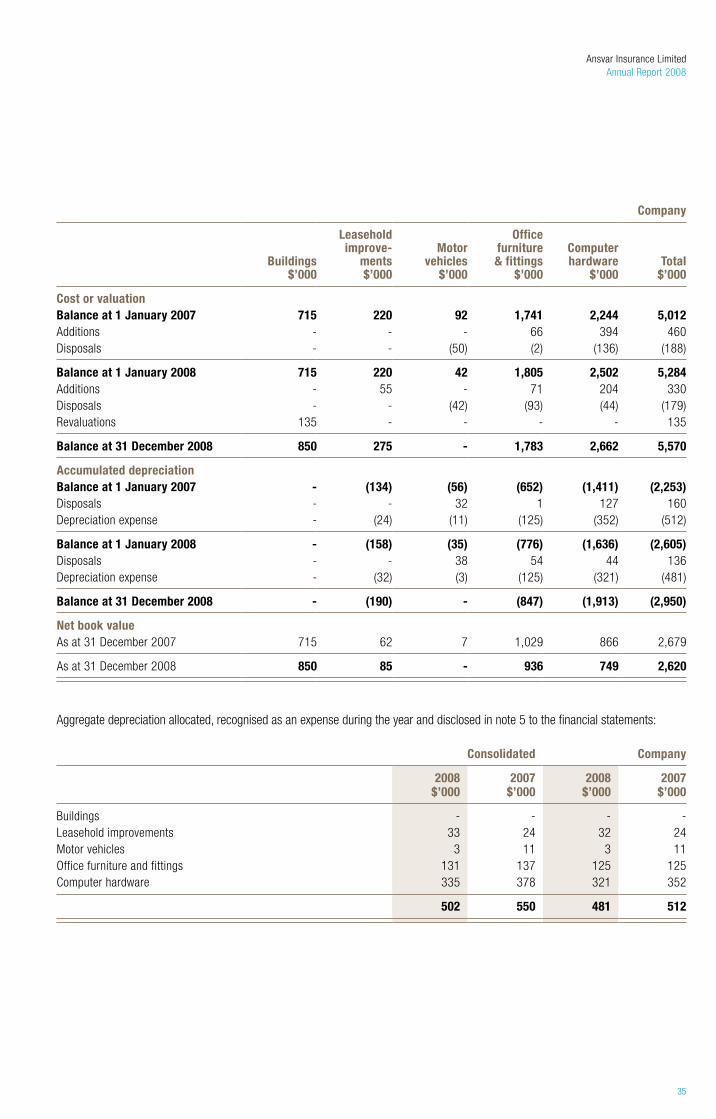
Company
Buildings $’000
Leasehold improve-
ments $’000
Motor vehicles
$’000
Office furniture
& fittings $’000
Computer hardware
$’000Total
$’000
Cost or valuationBalance at 1 January 2007 715 220 92 1,741 2,244 5,012Additions - - - 66 394 460Disposals - - (50) (2) (136) (188)
Balance at 1 January 2008 715 220 42 1,805 2,502 5,284Additions - 55 - 71 204 330Disposals - - (42) (93) (44) (179)Revaluations 135 - - - - 135
Balance at 31 December 2008 850 275 - 1,783 2,662 5,570
Accumulated depreciationBalance at 1 January 2007 - (134) (56) (652) (1,411) (2,253)Disposals - - 32 1 127 160Depreciation expense - (24) (11) (125) (352) (512)
Balance at 1 January 2008 - (158) (35) (776) (1,636) (2,605)Disposals - - 38 54 44 136Depreciation expense - (32) (3) (125) (321) (481)
Balance at 31 December 2008 - (190) - (847) (1,913) (2,950)
Net book valueAs at 31 December 2007 715 62 7 1,029 866 2,679
As at 31 December 2008 850 85 - 936 749 2,620
Aggregate depreciation allocated, recognised as an expense during the year and disclosed in note 5 to the financial statements:
Consolidated Company
2008 $’000
2007 $’000
2008 $’000
2007 $’000
Buildings - - - -Leasehold improvements 33 24 32 24Motor vehicles 3 11 3 11Office furniture and fittings 131 137 125 125Computer hardware 335 378 321 352
502 550 481 512
36
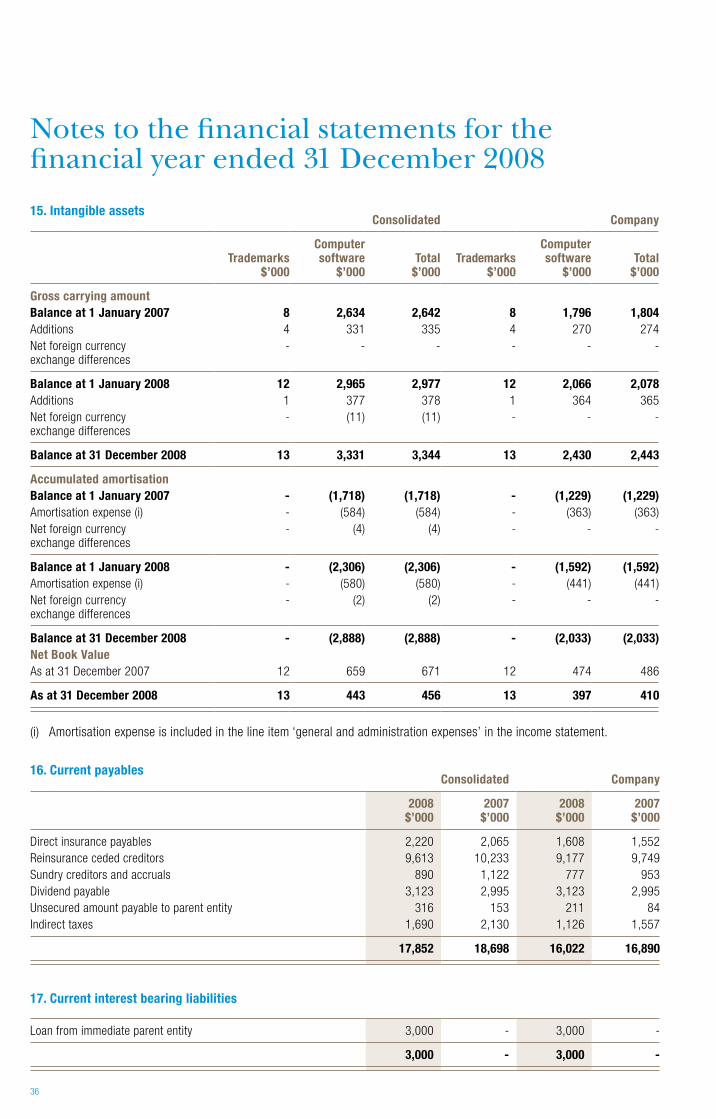
15. Intangible assetsConsolidated Company
Trademarks $’000
Computer software
$’000Total
$’000Trademarks
$’000
Computer software
$’000Total
$’000
Gross carrying amountBalance at 1 January 2007 8 2,634 2,642 8 1,796 1,804Additions 4 331 335 4 270 274Net foreign currency exchange differences
- - - - - -
Balance at 1 January 2008 12 2,965 2,977 12 2,066 2,078Additions 1 377 378 1 364 365Net foreign currency exchange differences
- (11) (11) - - -
Balance at 31 December 2008 13 3,331 3,344 13 2,430 2,443
Accumulated amortisationBalance at 1 January 2007 - (1,718) (1,718) - (1,229) (1,229)Amortisation expense (i) - (584) (584) - (363) (363)Net foreign currency exchange differences
- (4) (4) - - -
Balance at 1 January 2008 - (2,306) (2,306) - (1,592) (1,592)Amortisation expense (i) - (580) (580) - (441) (441)Net foreign currency exchange differences
- (2) (2) - - -
Balance at 31 December 2008 - (2,888) (2,888) - (2,033) (2,033)Net Book ValueAs at 31 December 2007 12 659 671 12 474 486
As at 31 December 2008 13 443 456 13 397 410
(i) Amortisation expense is included in the line item ‘general and administration expenses’ in the income statement.
16. Current payablesConsolidated Company
2008 $’000
2007 $’000
2008 $’000
2007 $’000
Direct insurance payables 2,220 2,065 1,608 1,552Reinsurance ceded creditors 9,613 10,233 9,177 9,749Sundry creditors and accruals 890 1,122 777 953Dividend payable 3,123 2,995 3,123 2,995Unsecured amount payable to parent entity 316 153 211 84Indirect taxes 1,690 2,130 1,126 1,557
17,852 18,698 16,022 16,890
17. Current interest bearing liabilities
Loan from immediate parent entity 3,000 - 3,000 -
3,000 - 3,000 -
Notes to the financial statements for the financial year ended 31 December 2008
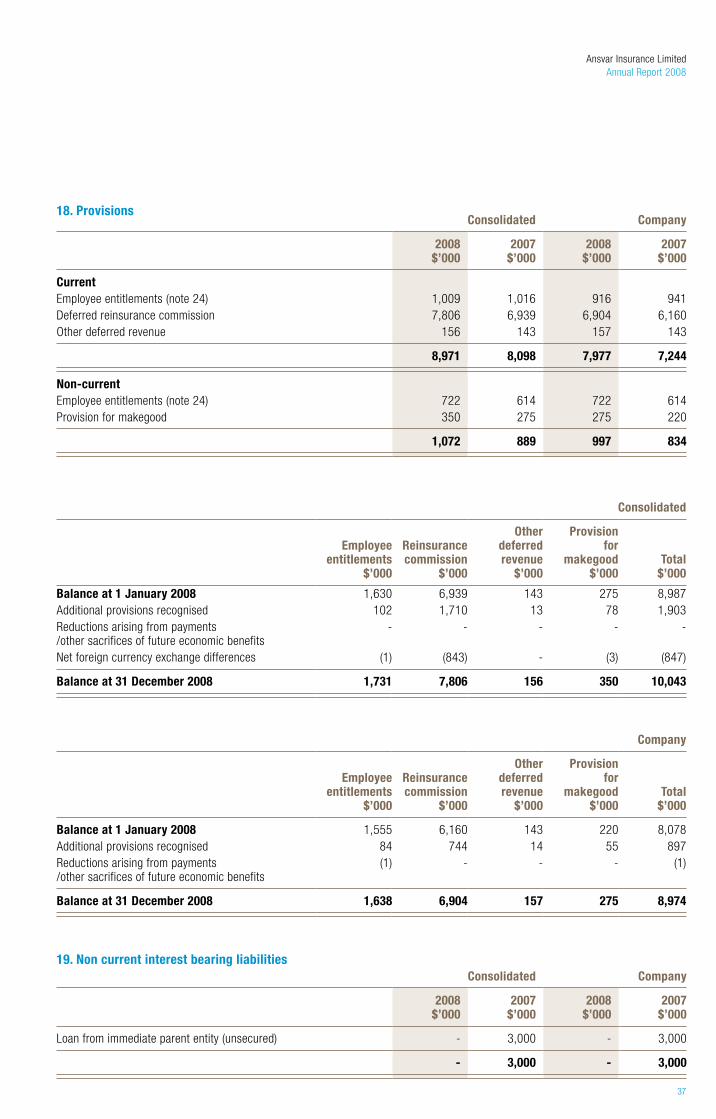
Ansvar Insurance LimitedAnnual Report 2008
37
18. ProvisionsConsolidated Company
2008 $’000
2007 $’000
2008 $’000
2007 $’000
CurrentEmployee entitlements (note 24) 1,009 1,016 916 941Deferred reinsurance commission 7,806 6,939 6,904 6,160Other deferred revenue 156 143 157 143
8,971 8,098 7,977 7,244
Non-current Employee entitlements (note 24) 722 614 722 614Provision for makegood 350 275 275 220
1,072 889 997 834
Consolidated
Employee entitlements
$’000
Reinsurance commission
$’000
Other deferred revenue
$’000
Provision for
makegood $’000
Total $’000
Balance at 1 January 2008 1,630 6,939 143 275 8,987Additional provisions recognised 102 1,710 13 78 1,903Reductions arising from payments /other sacrifices of future economic benefits
- - - - -
Net foreign currency exchange differences (1) (843) - (3) (847)
Balance at 31 December 2008 1,731 7,806 156 350 10,043
Company
Employee entitlements
$’000
Reinsurance commission
$’000
Other deferred revenue
$’000
Provision for
makegood $’000
Total $’000
Balance at 1 January 2008 1,555 6,160 143 220 8,078Additional provisions recognised 84 744 14 55 897Reductions arising from payments /other sacrifices of future economic benefits
(1) - - - (1)
Balance at 31 December 2008 1,638 6,904 157 275 8,974
19. Non current interest bearing liabilitiesConsolidated Company
2008 $’000
2007 $’000
2008 $’000
2007 $’000
Loan from immediate parent entity (unsecured) - 3,000 - 3,000
- 3,000 - 3,000
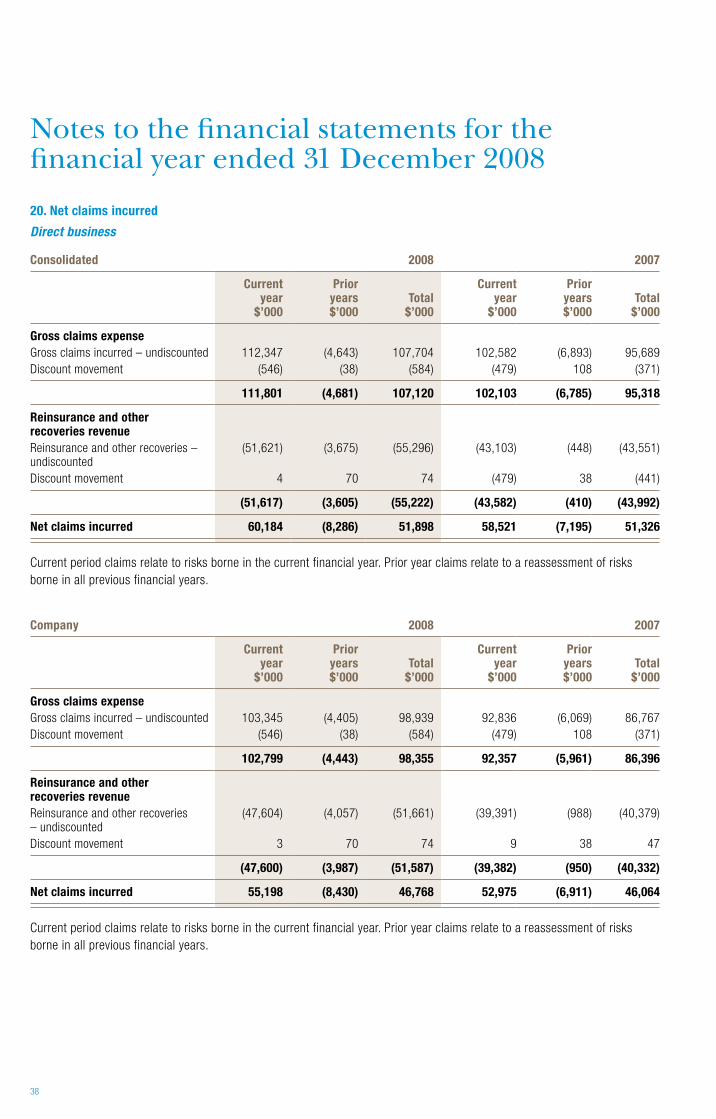
38
20. Net claims incurred
Direct business
Consolidated 2008 2007
Current year $’000
Prior years $’000
Total $’000
Current year $’000
Prior years $’000
Total $’000
Gross claims expenseGross claims incurred – undiscounted 112,347 (4,643) 107,704 102,582 (6,893) 95,689Discount movement (546) (38) (584) (479) 108 (371)
111,801 (4,681) 107,120 102,103 (6,785) 95,318
Reinsurance and other recoveries revenueReinsurance and other recoveries – undiscounted
(51,621) (3,675) (55,296) (43,103) (448) (43,551)
Discount movement 4 70 74 (479) 38 (441)
(51,617) (3,605) (55,222) (43,582) (410) (43,992)
Net claims incurred 60,184 (8,286) 51,898 58,521 (7,195) 51,326
Current period claims relate to risks borne in the current financial year. Prior year claims relate to a reassessment of risks borne in all previous financial years.
Company 2008 2007
Current year $’000
Prior years $’000
Total $’000
Current year $’000
Prior years $’000
Total $’000
Gross claims expenseGross claims incurred – undiscounted 103,345 (4,405) 98,939 92,836 (6,069) 86,767Discount movement (546) (38) (584) (479) 108 (371)
102,799 (4,443) 98,355 92,357 (5,961) 86,396
Reinsurance and other recoveries revenueReinsurance and other recoveries – undiscounted
(47,604) (4,057) (51,661) (39,391) (988) (40,379)
Discount movement 3 70 74 9 38 47
(47,600) (3,987) (51,587) (39,382) (950) (40,332)
Net claims incurred 55,198 (8,430) 46,768 52,975 (6,911) 46,064
Current period claims relate to risks borne in the current financial year. Prior year claims relate to a reassessment of risks borne in all previous financial years.
Notes to the financial statements for the financial year ended 31 December 2008
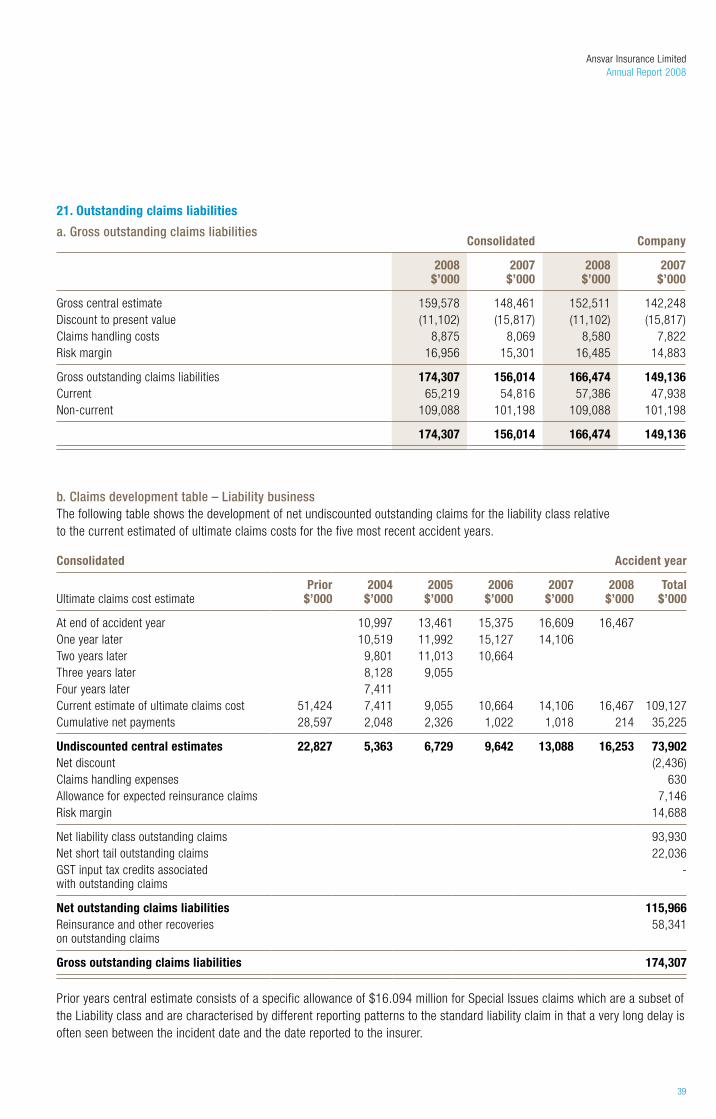
Ansvar Insurance LimitedAnnual Report 2008
39
21. Outstanding claims liabilities
a. Gross outstanding claims liabilitiesConsolidated Company
2008 $’000
2007 $’000
2008 $’000
2007 $’000
Gross central estimate 159,578 148,461 152,511 142,248Discount to present value (11,102) (15,817) (11,102) (15,817)Claims handling costs 8,875 8,069 8,580 7,822Risk margin 16,956 15,301 16,485 14,883
Gross outstanding claims liabilities 174,307 156,014 166,474 149,136Current 65,219 54,816 57,386 47,938Non-current 109,088 101,198 109,088 101,198
174,307 156,014 166,474 149,136
b. Claims development table – Liability businessThe following table shows the development of net undiscounted outstanding claims for the liability class relative to the current estimated of ultimate claims costs for the five most recent accident years.
Consolidated Accident year
Ultimate claims cost estimatePrior
$’0002004
$’0002005
$’0002006
$’0002007
$’0002008
$’000Total
$’000
At end of accident year 10,997 13,461 15,375 16,609 16,467One year later 10,519 11,992 15,127 14,106Two years later 9,801 11,013 10,664Three years later 8,128 9,055Four years later 7,411Current estimate of ultimate claims cost 51,424 7,411 9,055 10,664 14,106 16,467 109,127Cumulative net payments 28,597 2,048 2,326 1,022 1,018 214 35,225
Undiscounted central estimates 22,827 5,363 6,729 9,642 13,088 16,253 73,902Net discount (2,436)Claims handling expenses 630Allowance for expected reinsurance claims 7,146Risk margin 14,688
Net liability class outstanding claims 93,930Net short tail outstanding claims 22,036GST input tax credits associated with outstanding claims
-
Net outstanding claims liabilities 115,966Reinsurance and other recoveries on outstanding claims
58,341
Gross outstanding claims liabilities 174,307
Prior years central estimate consists of a specific allowance of $16.094 million for Special Issues claims which are a subset of the Liability class and are characterised by different reporting patterns to the standard liability claim in that a very long delay is often seen between the incident date and the date reported to the insurer.
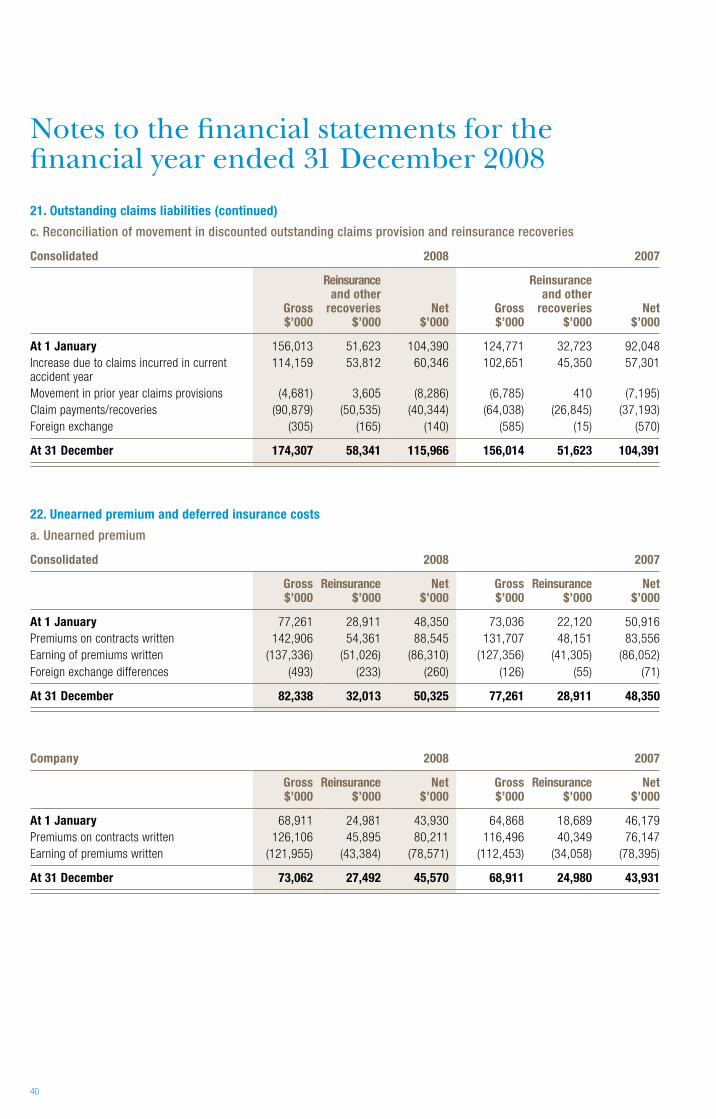
40
Notes to the financial statements for the financial year ended 31 December 2008
21. Outstanding claims liabilities (continued)
c. Reconciliation of movement in discounted outstanding claims provision and reinsurance recoveries
Consolidated 2008 2007
Gross $’000
Reinsurance and other
recoveries $’000
Net $’000
Gross $’000
Reinsurance and other
recoveries $’000
Net $’000
At 1 January 156,013 51,623 104,390 124,771 32,723 92,048Increase due to claims incurred in current accident year
114,159 53,812 60,346 102,651 45,350 57,301
Movement in prior year claims provisions (4,681) 3,605 (8,286) (6,785) 410 (7,195)Claim payments/recoveries (90,879) (50,535) (40,344) (64,038) (26,845) (37,193)Foreign exchange (305) (165) (140) (585) (15) (570)
At 31 December 174,307 58,341 115,966 156,014 51,623 104,391
22. Unearned premium and deferred insurance costs
a. Unearned premium
Consolidated 2008 2007
Gross $’000
Reinsurance $’000
Net $’000
Gross $’000
Reinsurance $’000
Net $’000
At 1 January 77,261 28,911 48,350 73,036 22,120 50,916Premiums on contracts written 142,906 54,361 88,545 131,707 48,151 83,556Earning of premiums written (137,336) (51,026) (86,310) (127,356) (41,305) (86,052)Foreign exchange differences (493) (233) (260) (126) (55) (71)
At 31 December 82,338 32,013 50,325 77,261 28,911 48,350
Company 2008 2007
Gross $’000
Reinsurance $’000
Net $’000
Gross $’000
Reinsurance $’000
Net $’000
At 1 January 68,911 24,981 43,930 64,868 18,689 46,179Premiums on contracts written 126,106 45,895 80,211 116,496 40,349 76,147Earning of premiums written (121,955) (43,384) (78,571) (112,453) (34,058) (78,395)
At 31 December 73,062 27,492 45,570 68,911 24,980 43,931
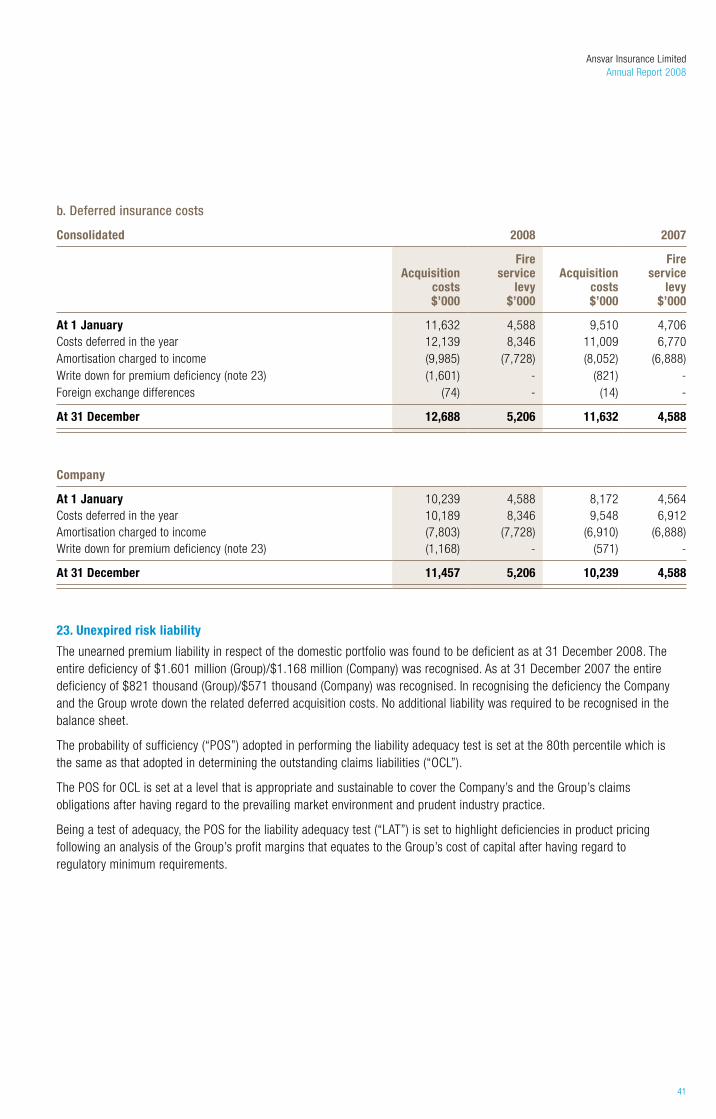
Ansvar Insurance LimitedAnnual Report 2008
41
b. Deferred insurance costs
Consolidated 2008 2007
Acquisition costs $’000
Fire service
levy $’000
Acquisition costs $’000
Fire service
levy $’000
At 1 January 11,632 4,588 9,510 4,706Costs deferred in the year 12,139 8,346 11,009 6,770Amortisation charged to income (9,985) (7,728) (8,052) (6,888)Write down for premium deficiency (note 23) (1,601) - (821) -Foreign exchange differences (74) - (14) -
At 31 December 12,688 5,206 11,632 4,588
Company
At 1 January 10,239 4,588 8,172 4,564Costs deferred in the year 10,189 8,346 9,548 6,912Amortisation charged to income (7,803) (7,728) (6,910) (6,888)Write down for premium deficiency (note 23) (1,168) - (571) -
At 31 December 11,457 5,206 10,239 4,588
23. Unexpired risk liability
The unearned premium liability in respect of the domestic portfolio was found to be deficient as at 31 December 2008. The entire deficiency of $1.601 million (Group)/$1.168 million (Company) was recognised. As at 31 December 2007 the entire deficiency of $821 thousand (Group)/$571 thousand (Company) was recognised. In recognising the deficiency the Company and the Group wrote down the related deferred acquisition costs. No additional liability was required to be recognised in the balance sheet.
The probability of sufficiency (“POS”) adopted in performing the liability adequacy test is set at the 80th percentile which is the same as that adopted in determining the outstanding claims liabilities (“OCL”).
The POS for OCL is set at a level that is appropriate and sustainable to cover the Company’s and the Group’s claims obligations after having regard to the prevailing market environment and prudent industry practice.
Being a test of adequacy, the POS for the liability adequacy test (“LAT”) is set to highlight deficiencies in product pricing following an analysis of the Group’s profit margins that equates to the Group’s cost of capital after having regard to regulatory minimum requirements.

42
23. Unexpired risk liability (continued)Consolidated Company
Calculation of deficiency 2008 $’000
2007 $’000
2008 $’000
2007 $’000
Unearned premium liability relating to insurance contracts issued 19,959 18,146 17,694 15,994Related reinsurance asset - - - -Related deferred acquisition costs (3,978) (3,514) (3,328) (2,890)
15,981 14,632 14,366 13,104
Central estimate of present value of expected future cash flows arising from future claims on insurance contracts issued
16,129 14,189 14,081 12,411
Risk margin of 9.01% (Group)/10.32% (Company) 1,453 1,264 1,453 1,264Present value of expected future cash flows arising from reinsurance recoveries on future claims
- - - -
17,582 15,453 15,534 13,675
Net deficiency (1,601) (821) (1,168) (571)
Add back reinsurance element of present value of expected future cash flows for future claims
- - - -
Gross deficiency (1,601) (821) (1,168) (571)
The liability test has identified a surplus for other portfolios of contracts that are subject to broadly similar risks that are managed together as a single portfolio.
The process of determining the overall risk margin, including the way in which diversification for risks has been allowed for is discussed in note 3.
24. Employee benefits
The aggregate employee benefits recognised and included in the financial statements is as follows:
Current provision for employee benefits (note 18) 1,009 1,016 916 941Non-current provision for employee benefits (note 18) 722 614 722 614
Aggregate employee benefits 1,731 1,630 1,638 1,555
Number of employees at end of financial year 155 142 131 117
25. Commitments
Operating lease commitments:
Not later than one year 1034 972 872 865Later than one year and not later than five years 2,569 1,394 1,952 1,372Later than five years - - - -
3,603 2,366 2,824 2,237
Notes to the financial statements for the financial year ended 31 December 2008
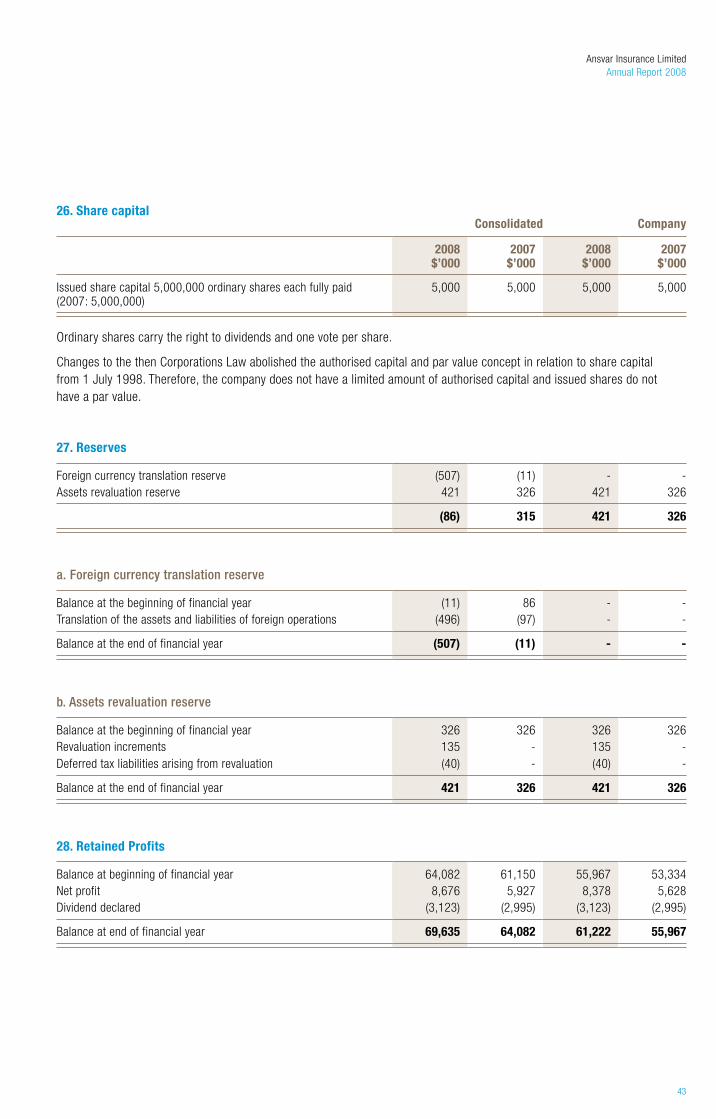
Ansvar Insurance LimitedAnnual Report 2008
43
26. Share capitalConsolidated Company
2008 $’000
2007 $’000
2008 $’000
2007 $’000
Issued share capital 5,000,000 ordinary shares each fully paid (2007: 5,000,000)
5,000 5,000 5,000 5,000
Ordinary shares carry the right to dividends and one vote per share.
Changes to the then Corporations Law abolished the authorised capital and par value concept in relation to share capital from 1 July 1998. Therefore, the company does not have a limited amount of authorised capital and issued shares do not have a par value.
27. Reserves
Foreign currency translation reserve (507) (11) - -Assets revaluation reserve 421 326 421 326
(86) 315 421 326
a. Foreign currency translation reserve
Balance at the beginning of financial year (11) 86 - -Translation of the assets and liabilities of foreign operations (496) (97) - -
Balance at the end of financial year (507) (11) - -
b. Assets revaluation reserve
Balance at the beginning of financial year 326 326 326 326Revaluation increments 135 - 135 -Deferred tax liabilities arising from revaluation (40) - (40) -
Balance at the end of financial year 421 326 421 326
28. Retained Profits
Balance at beginning of financial year 64,082 61,150 55,967 53,334Net profit 8,676 5,927 8,378 5,628Dividend declared (3,123) (2,995) (3,123) (2,995)
Balance at end of financial year 69,635 64,082 61,222 55,967
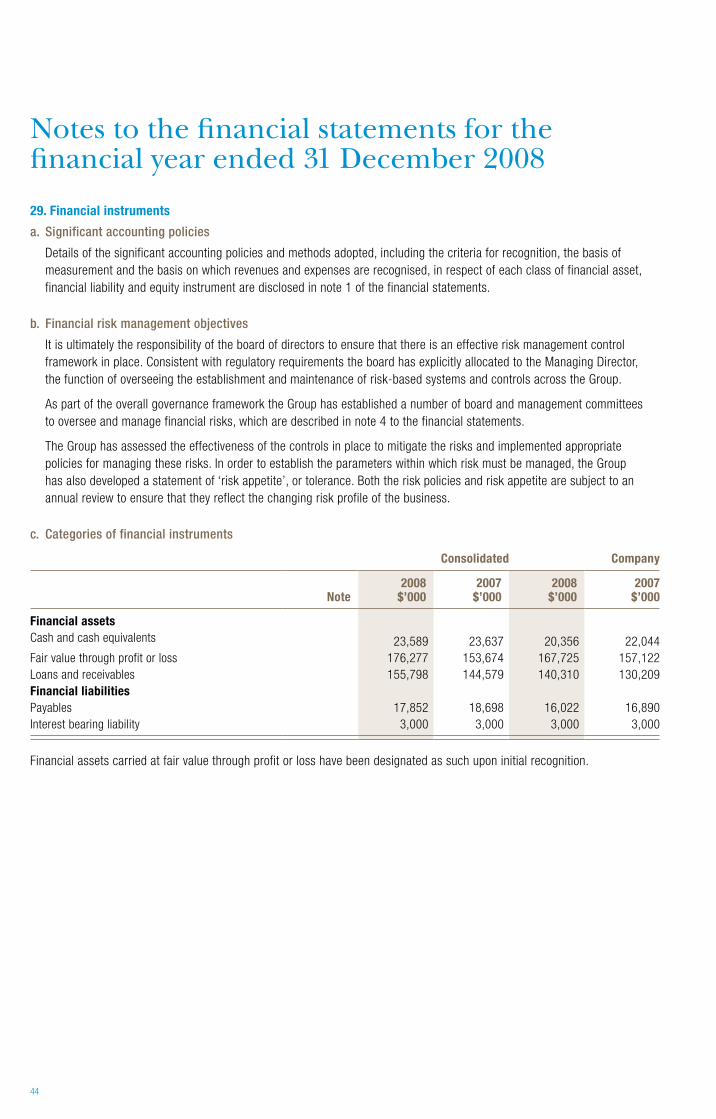
44
29. Financial instruments
a. Significant accounting policies
Details of the significant accounting policies and methods adopted, including the criteria for recognition, the basis of measurement and the basis on which revenues and expenses are recognised, in respect of each class of financial asset, financial liability and equity instrument are disclosed in note 1 of the financial statements.
b. Financial risk management objectives
It is ultimately the responsibility of the board of directors to ensure that there is an effective risk management control framework in place. Consistent with regulatory requirements the board has explicitly allocated to the Managing Director, the function of overseeing the establishment and maintenance of risk-based systems and controls across the Group.
As part of the overall governance framework the Group has established a number of board and management committees to oversee and manage financial risks, which are described in note 4 to the financial statements.
The Group has assessed the effectiveness of the controls in place to mitigate the risks and implemented appropriate policies for managing these risks. In order to establish the parameters within which risk must be managed, the Group has also developed a statement of ‘risk appetite’, or tolerance. Both the risk policies and risk appetite are subject to an annual review to ensure that they reflect the changing risk profile of the business.
c. Categories of financial instruments
Consolidated Company
Note2008
$’0002007
$’0002008
$’0002007
$’000
Financial assetsCash and cash equivalents 23,589 23,637 20,356 22,044Fair value through profit or loss 176,277 153,674 167,725 157,122Loans and receivables 155,798 144,579 140,310 130,209Financial liabilitiesPayables 17,852 18,698 16,022 16,890Interest bearing liability 3,000 3,000 3,000 3,000
Financial assets carried at fair value through profit or loss have been designated as such upon initial recognition.
Notes to the financial statements for the financial year ended 31 December 2008

Ansvar Insurance LimitedAnnual Report 2008
45
d. Credit risk
Credit risk refers to the risk that a counterparty will default on its contractual obligations resulting in financial loss to the company. The Group has adopted the policy of only dealing with creditworthy counterparties and obtaining sufficient collateral or other security where appropriate, as a means of mitigating the risk of financial loss from defaults. The policies and procedures in place to mitigate the Group’s exposure to credit risk are described in note 4 of this financial report.
The Group does not have any significant credit risk exposure to any single counterparty or any group of counterparties having similar characteristics. The table below shows the maximum exposure to credit risk for the components of the balance sheet. The maximum exposure is shown gross, before the effect of mitigation through the use of master netting or taking account of the value of any collateral or other security obtained.
Financial assets Consolidated Company
Note2008
$’0002007
$’0002008
$’0002007
$’000
Financial assetsCash and cash equivalents (excluding bank overdraft)
33a 23,689 23,637 20,356 22,044
Financial assets at fair value through profit or loss Government/semi-government securities 10 109,779 95,901 102,017 89,327Debentures 10 63,161 52,611 61,078 50,493Equities 3,330 5,154 3,330 5,154
Loans and receivables Premiums receivable 9 45,673 43,646 39,635 38,564Other debtors and prepayments 9 13,043 9,534 12,709 8,564Receivable from related party 9 - - 161 122Mortgages and loans 10 7 8 7 8Reinsurance assets 11 46,212 45,215 42,687 42,098Other insurance receivables 9,13 50,863 46,175 45,111 40,852
Total 355,757 323,882 327,090 297,227
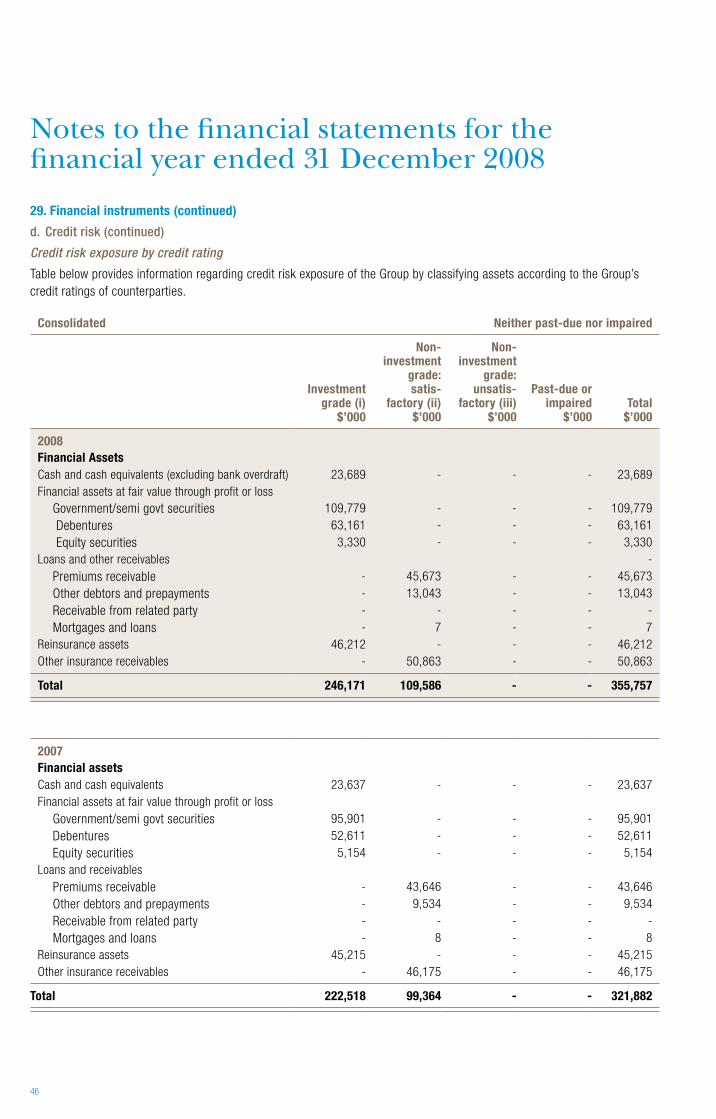
46
29. Financial instruments (continued)
d. Credit risk (continued)
Credit risk exposure by credit rating
Table below provides information regarding credit risk exposure of the Group by classifying assets according to the Group’s credit ratings of counterparties.
Consolidated Neither past-due nor impaired
Investment grade (i)
$’000
Non-investment
grade: satis-
factory (ii) $’000
Non-investment
grade: unsatis-
factory (iii) $’000
Past-due or impaired
$’000Total
$’000
2008Financial AssetsCash and cash equivalents (excluding bank overdraft) 23,689 - - - 23,689 Financial assets at fair value through profit or loss
Government/semi govt securities 109,779 - - - 109,779 Debentures 63,161 - - - 63,161 Equity securities 3,330 - - - 3,330
Loans and other receivables -Premiums receivable - 45,673 - - 45,673 Other debtors and prepayments - 13,043 - - 13,043 Receivable from related party - - - - -Mortgages and loans - 7 - - 7
Reinsurance assets 46,212 - - - 46,212Other insurance receivables - 50,863 - - 50,863
Total 246,171 109,586 - - 355,757
2007Financial assetsCash and cash equivalents 23,637 - - - 23,637Financial assets at fair value through profit or loss
Government/semi govt securities 95,901 - - - 95,901Debentures 52,611 - - - 52,611Equity securities 5,154 - - - 5,154
Loans and receivablesPremiums receivable - 43,646 - - 43,646Other debtors and prepayments - 9,534 - - 9,534Receivable from related party - - - - -Mortgages and loans - 8 - - 8
Reinsurance assets 45,215 - - - 45,215Other insurance receivables - 46,175 - - 46,175
Total 222,518 99,364 - - 321,882
Notes to the financial statements for the financial year ended 31 December 2008

Ansvar Insurance LimitedAnnual Report 2008
47
Company Neither past-due nor impaired
Investment grade (i)
$’000
Non-investment
grade: satis-
factory (ii) $’000
Non-investment
grade: unsatis-
factory (iii) $’000
Past-due or impaired
$’000Total
$’000
2008Financial AssetsCash and cash equivalents 20,356 - - - 20,356 Financial assets at fair value through profit or loss 0 Government/semi govt securities 102,017 - - - 102,017 Debentures 61,078 - - - 61,078 Equity securities 3,330 - - - 3,330 Loans and other receivables 0 Premiums receivable - 39,635 - - 39,635 Other debtors and prepayments - 12,709 - - 12,709 Receivable from related party - 161 - - 161 Mortgages and loans - 7 - - 7 Reinsurance assets 42,687 - - - 42,687 Other insurance receivables - 45,111 - - 45,111
Total 229,468 97,623 - - 327,091
2007Financial assetsCash and cash equivalents 20,044 - - - 20,044Financial assets at fair value through profit or loss Government/semi govt securities 89,327 - - - 89,327 Debentures 50,493 - - - 50,493 Equity Securities 5,154 - - - 5,154Loans and receivables Premiums receivable - 38,564 - - 38,564 Other debtors and prepayments - 8,564 - - 8,564 Receivable from related party 122 - - - 122 Mortgages and loans - 8 - - 8Reinsurance assets 42,098 - - - 42,098Other insurance receivables - 40,852 - - 40,852
Total 207,238 87,988 - - 295,226
(i) The Group and the company classify all assets with Standard and Poors credit ratings of AAA to BBB as investment grade.
(ii) Non-investment grade (satisfactory) assets include assets that fall outside the rage of AAA to BBB Standard and Poors credit rating as well as non-rated assets that are within the risk parameters outlined by the Group’s risk management policy.
(ii) Non-investment grade (unsatisfactory) assets include assets that fall outside the risk parameters outlined by the Group’s risk management policy and assets that would otherwise be past due or impaired whose terms have been renegotiated.

48
29. Financial instruments (continued)
e. Liquidity risk
Liquidity risk is the risk that an entity will encounter difficulty in meeting obligations associated with financial instruments. Ultimate responsibility for liquidity risk management rests with the board of directors, that has built a liquidity risk management framework for the management of the Group’s short, medium and long-term funding and liquidity management requirements. The Group manages liquidity risk by maintaining adequate reserves and by continuously monitoring forecast and actual cash flows and matching the maturity profiles of assets and liabilities. As required by APRA Prudential Standard GPS 220, the Group has developed and implemented a Risk Management Strategy, which is described in note 4. The Group’s overall strategy in liquidity risk management remains unchanged from 2007. The Group and the company have no significant concentration of liquidity risk.
The following tables summarise the maturity profile of the company’s and the Group’s financial liabilities. The tables have been drawn up based on the undiscounted cash flows of financial liabilities based on the earliest date on which the Group can be required to pay, except for outstanding claims liabilities, where maturity profiles are determined on the discounted estimated timing of net cash outflows.
The tables include both interest and principal cash flows. The adjustment column represents the possible future cash flows attributable to the instrument included in the maturity analysis which are not included in the carrying amount of the financial liability on the balance sheet.
Consolidated
Weighted average
interest rate %
Less than 1 year $’000
1-5 years $’000
5+ years $’000
Adjustment $’000
Total $’000
2008Financial liabilitiesOutstanding claims liabilities 72,049 59,805 42,453 - 174,307Non-interest bearing: Payables 17,852 - - 17,852Interest bearing: Interest bearing liability 6.00 180 3,090 - (270) 3,000 Bank Overdraft (100) - - - (100)
90,181 62,895 42,453 (270) 195,259
2007Financial liabilitiesOutstanding claims liabilities 54,816 56,243 44,445 - 155,504Non-interest bearing: Payables 18,698 - - - 18,698Interest bearing: Interest bearing liability 6.00 180 3,090 - (270) 3,000
73,694 59,333 44,445 (270) 177,202
Notes to the financial statements for the financial year ended 31 December 2008
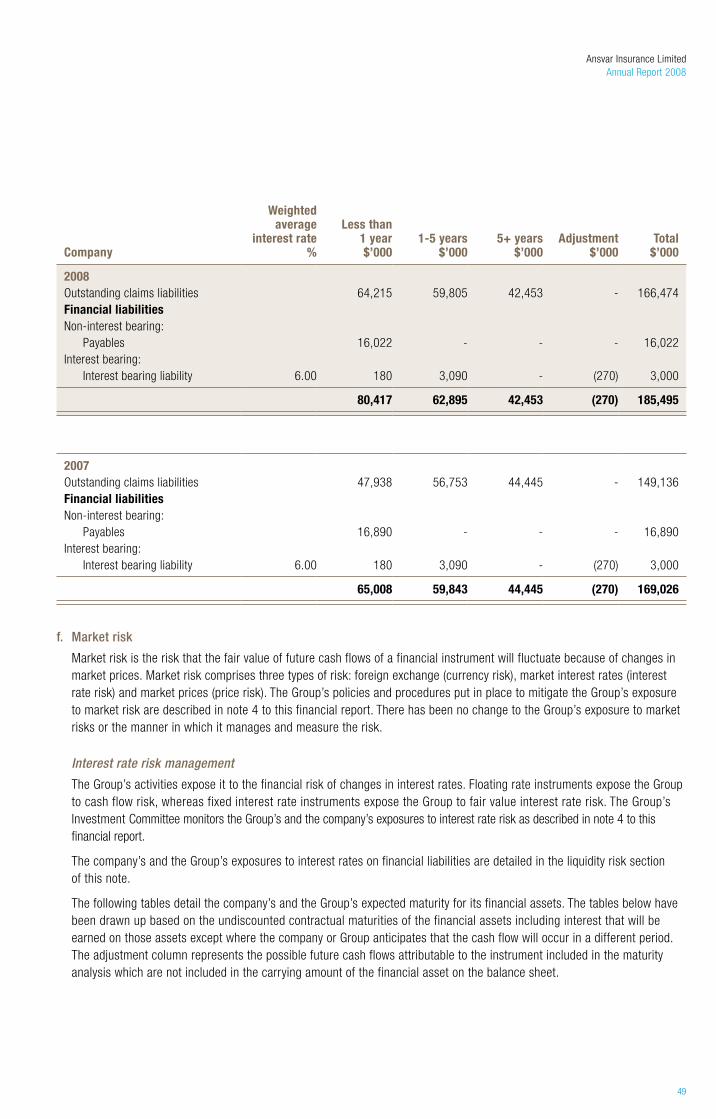
Ansvar Insurance LimitedAnnual Report 2008
49
Company
Weighted average
interest rate %
Less than 1 year $’000
1-5 years $’000
5+ years $’000
Adjustment $’000
Total $’000
2008Outstanding claims liabilities 64,215 59,805 42,453 - 166,474Financial liabilitiesNon-interest bearing: Payables 16,022 - - - 16,022 Interest bearing: Interest bearing liability 6.00 180 3,090 - (270) 3,000
80,417 62,895 42,453 (270) 185,495
2007Outstanding claims liabilities 47,938 56,753 44,445 - 149,136Financial liabilitiesNon-interest bearing: Payables 16,890 - - - 16,890Interest bearing: Interest bearing liability 6.00 180 3,090 - (270) 3,000
65,008 59,843 44,445 (270) 169,026
f. Market risk
Market risk is the risk that the fair value of future cash flows of a financial instrument will fluctuate because of changes in market prices. Market risk comprises three types of risk: foreign exchange (currency risk), market interest rates (interest rate risk) and market prices (price risk). The Group’s policies and procedures put in place to mitigate the Group’s exposure to market risk are described in note 4 to this financial report. There has been no change to the Group’s exposure to market risks or the manner in which it manages and measure the risk.
Interest rate risk management
The Group’s activities expose it to the financial risk of changes in interest rates. Floating rate instruments expose the Group to cash flow risk, whereas fixed interest rate instruments expose the Group to fair value interest rate risk. The Group’s Investment Committee monitors the Group’s and the company’s exposures to interest rate risk as described in note 4 to this financial report.
The company’s and the Group’s exposures to interest rates on financial liabilities are detailed in the liquidity risk section of this note.
The following tables detail the company’s and the Group’s expected maturity for its financial assets. The tables below have been drawn up based on the undiscounted contractual maturities of the financial assets including interest that will be earned on those assets except where the company or Group anticipates that the cash flow will occur in a different period. The adjustment column represents the possible future cash flows attributable to the instrument included in the maturity analysis which are not included in the carrying amount of the financial asset on the balance sheet.

50
29. Financial instruments (continued)
f. Market risk (continued)
Consolidated
Weighted average
interest rate %
Less than 1 year $’000
1-5 years $’000
5+ years $’000
Adjustment $’000
Total $’000
2008Non-interest bearing: Cash 4 - - - 4 Net trade debtors 45,017 - - - 45,017 Mortgages and loans 7 - - - 7 Equity securities 3,330 - - - 3,330 Variable interest rate instruments: 0 Cash 3.91 19,353 - - - 19,353 Fixed interest rate instruments: 0 Short term bills and notes 7.79 4,338 - - (5) 4,333 Government/semi govt securities 4.58 4,606 107,657 12,769 (15,254) 109,778 Debentures 6.10 3,421 68,089 - (8,348) 63,162 Interest bearing Interest bearing liability 6.00 (3,090) - - 90 (3,000)Bank Overdraft (100) - - - (100)
76,886 175,746 12,769 (23,517) 241,884
2007Non-interest bearing: Cash - - - - - Net trade debtors 43,456 - - - 43,456 Mortgages and loans 8 - - - 8 Equity Securities 5,154 - - - 5,154Variable interest rate instruments: Cash 6.45 12,622 - - - 12,622Fixed interest rate instruments: Short term bills and notes 8.33 14,580 - - (1,565) 13,015 Government/semi govt securities 7.20 33,620 73,608 - (11,326) 95,902 Debentures 8.53 6,456 58,007 - (11,852) 52,611Interest bearing Interest bearing liability 6.00 (180) (3,329) - 509 (3,000)
115,716 128,286 - (24,234) 219,768
Notes to the financial statements for the financial year ended 31 December 2008
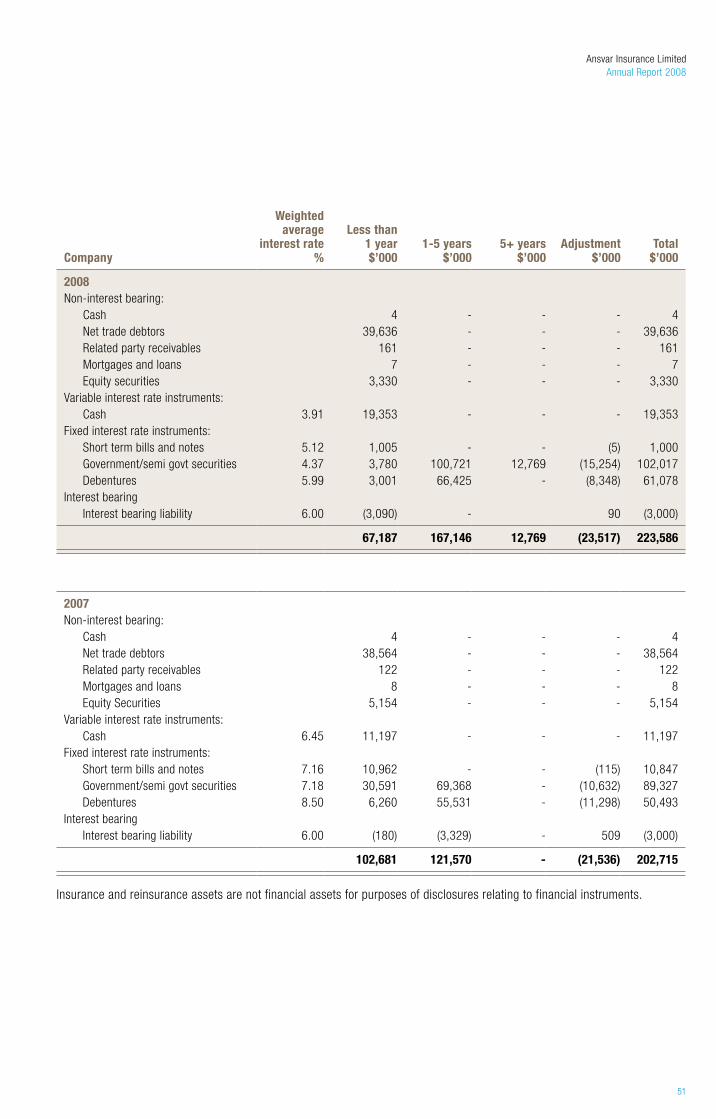
Ansvar Insurance LimitedAnnual Report 2008
51
Company
Weighted average
interest rate %
Less than 1 year $’000
1-5 years $’000
5+ years $’000
Adjustment $’000
Total $’000
2008Non-interest bearing: Cash 4 - - - 4 Net trade debtors 39,636 - - - 39,636 Related party receivables 161 - - - 161 Mortgages and loans 7 - - - 7 Equity securities 3,330 - - - 3,330Variable interest rate instruments: Cash 3.91 19,353 - - - 19,353Fixed interest rate instruments: Short term bills and notes 5.12 1,005 - - (5) 1,000 Government/semi govt securities 4.37 3,780 100,721 12,769 (15,254) 102,017 Debentures 5.99 3,001 66,425 - (8,348) 61,078Interest bearing Interest bearing liability 6.00 (3,090) - 90 (3,000)
67,187 167,146 12,769 (23,517) 223,586
2007Non-interest bearing: Cash 4 - - - 4 Net trade debtors 38,564 - - - 38,564 Related party receivables 122 - - - 122 Mortgages and loans 8 - - - 8 Equity Securities 5,154 - - - 5,154Variable interest rate instruments: Cash 6.45 11,197 - - - 11,197Fixed interest rate instruments: Short term bills and notes 7.16 10,962 - - (115) 10,847 Government/semi govt securities 7.18 30,591 69,368 - (10,632) 89,327 Debentures 8.50 6,260 55,531 - (11,298) 50,493Interest bearing Interest bearing liability 6.00 (180) (3,329) - 509 (3,000)
102,681 121,570 - (21,536) 202,715
Insurance and reinsurance assets are not financial assets for purposes of disclosures relating to financial instruments.
52
29. Financial instruments (continued)
f. Market risk (continued)
Interest rate sensitivity
The sensitivity analyses below have been determined based on the exposure to interest rates at the reporting date and the stipulated change taking place at the beginning of the financial year and held constant throughout the reporting period. A 50 basis point increase or decrease is used when reporting interest rate risk internally to key management personnel and represents management’s assessment of the possible change in interest rates.
At reporting date, if interest rates had been 50 basis points higher or lower and all other variables were held constant, the Group’s:
• netprofitwouldincrease/decreaseby$1.260million(2007:decrease/increaseby$750thousand).Thisismainlyattributable to the Group’s exposure to interest rates on its variable rate borrowings. All other equity reserves would have been unaffected.
Foreign currency risk management
Foreign currency risk is the risk that the fair value of future cash flows of a financial instrument will fluctuate because of changes in foreign exchange rates.
The Group is mainly exposed to New Zealand dollars via its subsidiary in New Zealand. The Group’s financial assets are primarily denominated in the same currencies as its insurance contract liabilities, which mitigates the foreign currency exchange risk for the overseas operations in New Zealand. Exchange rate exposure is managed in line with the Group’s Risk Management Statement as described in note 4. The Group’s overall strategy in foreign currency risk management remains unchanged from 2007.
Other price risks
The Group is exposed to equity price risks arising from equity investments. Equity investments are held for strategic rather than trading purposes. The Group does not actively trade these investments.
Equity price sensitivity
The sensitivity analyses below have been determined based on the exposure to equity price risks at the reporting date.
At reporting date, if the inputs to the valuation model had been 25% higher/lower while all other variables were held constant:
• netprofitwouldincrease/decreaseby$582thousandasaresultofthechangesinfairvalueofequitiesdesignated as at ‘fair value through profit or loss’;
• otherequityreserveswouldhavebeenunaffected.
Notes to the financial statements for the financial year ended 31 December 2008
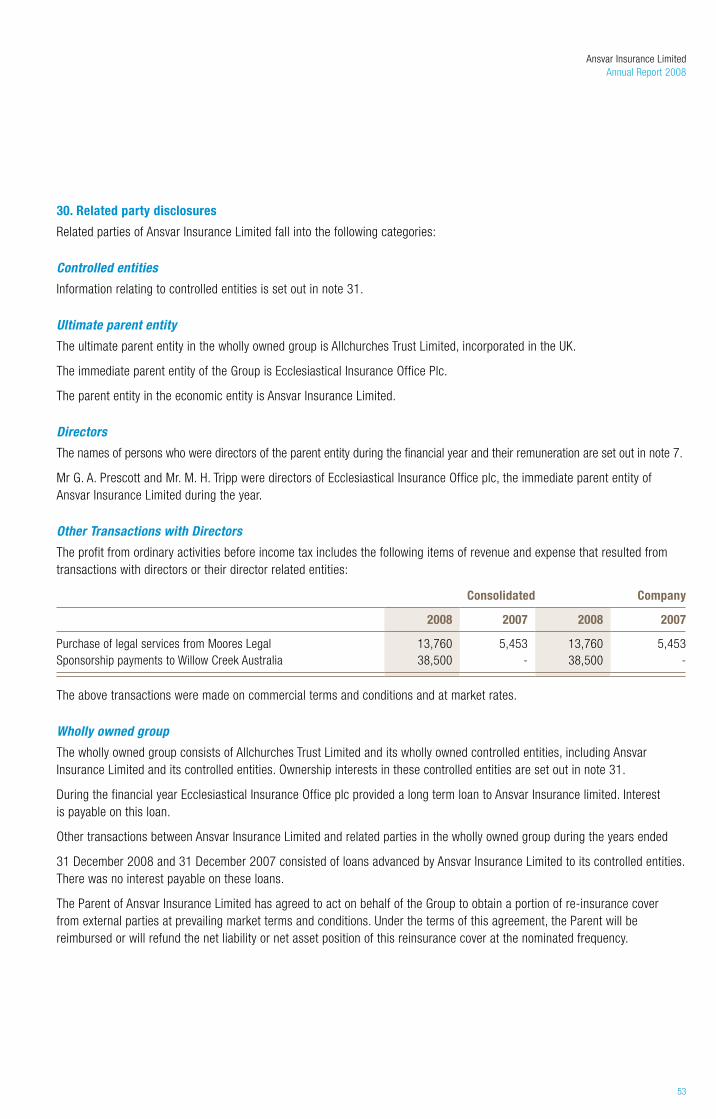
Ansvar Insurance LimitedAnnual Report 2008
53
30. Related party disclosures
Related parties of Ansvar Insurance Limited fall into the following categories:
Controlled entities
Information relating to controlled entities is set out in note 31.
Ultimate parent entity
The ultimate parent entity in the wholly owned group is Allchurches Trust Limited, incorporated in the UK.
The immediate parent entity of the Group is Ecclesiastical Insurance Office Plc.
The parent entity in the economic entity is Ansvar Insurance Limited.
Directors
The names of persons who were directors of the parent entity during the financial year and their remuneration are set out in note 7.
Mr G. A. Prescott and Mr. M. H. Tripp were directors of Ecclesiastical Insurance Office plc, the immediate parent entity of Ansvar Insurance Limited during the year.
Other Transactions with Directors
The profit from ordinary activities before income tax includes the following items of revenue and expense that resulted from transactions with directors or their director related entities:
Consolidated Company
2008 2007 2008 2007
Purchase of legal services from Moores Legal 13,760 5,453 13,760 5,453Sponsorship payments to Willow Creek Australia 38,500 - 38,500 -
The above transactions were made on commercial terms and conditions and at market rates.
Wholly owned group
The wholly owned group consists of Allchurches Trust Limited and its wholly owned controlled entities, including Ansvar Insurance Limited and its controlled entities. Ownership interests in these controlled entities are set out in note 31.
During the financial year Ecclesiastical Insurance Office plc provided a long term loan to Ansvar Insurance limited. Interest is payable on this loan.
Other transactions between Ansvar Insurance Limited and related parties in the wholly owned group during the years ended
31 December 2008 and 31 December 2007 consisted of loans advanced by Ansvar Insurance Limited to its controlled entities. There was no interest payable on these loans.
The Parent of Ansvar Insurance Limited has agreed to act on behalf of the Group to obtain a portion of re-insurance cover from external parties at prevailing market terms and conditions. Under the terms of this agreement, the Parent will be reimbursed or will refund the net liability or net asset position of this reinsurance cover at the nominated frequency.
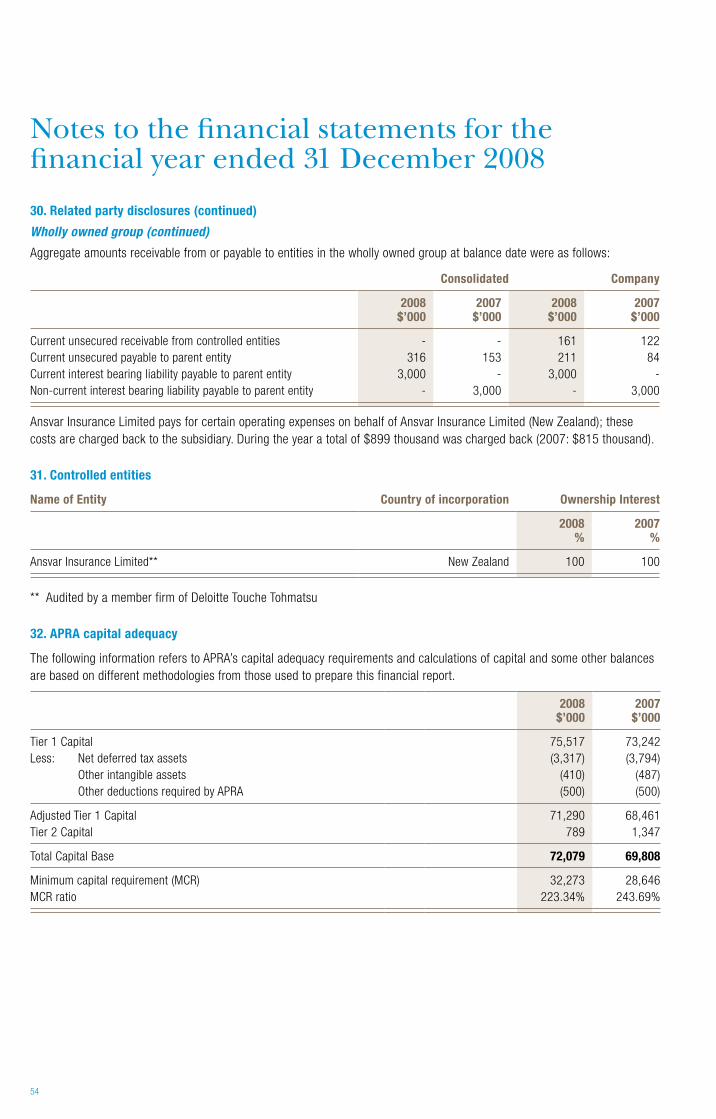
54
30. Related party disclosures (continued)
Wholly owned group (continued)
Aggregate amounts receivable from or payable to entities in the wholly owned group at balance date were as follows:
Consolidated Company
2008 $’000
2007 $’000
2008 $’000
2007 $’000
Current unsecured receivable from controlled entities - - 161 122Current unsecured payable to parent entity 316 153 211 84Current interest bearing liability payable to parent entity 3,000 - 3,000 -Non-current interest bearing liability payable to parent entity - 3,000 - 3,000
Ansvar Insurance Limited pays for certain operating expenses on behalf of Ansvar Insurance Limited (New Zealand); these costs are charged back to the subsidiary. During the year a total of $899 thousand was charged back (2007: $815 thousand).
31. Controlled entities
Name of Entity Country of incorporation Ownership Interest
2008 %
2007 %
Ansvar Insurance Limited** New Zealand 100 100
** Audited by a member firm of Deloitte Touche Tohmatsu
32. APRA capital adequacy
The following information refers to APRA’s capital adequacy requirements and calculations of capital and some other balances are based on different methodologies from those used to prepare this financial report.
2008 $’000
2007 $’000
Tier 1 Capital 75,517 73,242Less: Net deferred tax assets (3,317) (3,794) Other intangible assets (410) (487) Other deductions required by APRA (500) (500)
Adjusted Tier 1 Capital 71,290 68,461Tier 2 Capital 789 1,347
Total Capital Base 72,079 69,808
Minimum capital requirement (MCR) 32,273 28,646MCR ratio 223.34% 243.69%
Notes to the financial statements for the financial year ended 31 December 2008

Ansvar Insurance LimitedAnnual Report 2008
55
33. Notes to the cash flow statement
a. Reconciliation of cash and cash equivalents
For the purposes of the cash flow statement, cash includes cash on hand and in banks and investments in money market instruments, net of outstanding bank overdrafts. Cash and cash equivalents at the end of the financial year as shown in the cash flow statement is reconciled to the related items in the balance sheet as follows:
Consolidated Company
2008 $’000
2007 $’000
2008 $’000
2007 $’000
Cash 9,711 12,622 9,711 11,197Add: short term deposits (i) 13,978 11,015 10,645 8,847Less: bank overdraft (100) - - -
23,589 23,637 20,356 20,044
(i) money market instruments that qualify as cash equivalents under the Group’s accounting policies: have short maturities (three months or less from the date of acquisition), are readily convertible to a known amount of cash and are subject to an insignificant risk of changes in value.
b. Reconciliation of profit for the year to net cash flows from operating activities
Profit for the year 8,676 5,927 8,378 5,628Depreciation and amortisation 1,084 1,134 921 876Doubtful debts 362 257 381 225Changes in fair value of investments (5,238) 3,055 (4,988) 3,066Dividends Received (240) (190) (240) (190)Rentals received - - (59) (57)Loss on sale of assets 52 12 26 10
Decrease in current tax liabilities - (1,753) - (1,753)Decrease in current tax assets (315) (1,619) (44) (1,286)Decrease/(increase) in deferred tax balances 1,651 (1,188) 1,620 (1,118)
Changes in operating assets and liabilities: Increase in trade debtors (2,106) (3,808) (1,181) (3,809)Increase in reinsurance recoveries receivable (1,169) (16,302) (749) (14,950)Increase in other debtors (3,131) (1,865) (3,787) (1,284)Increase in deferred insurance costs (4,777) (8,794) (4,348) (8,382)Increase/(decrease) in net amount due to related entities for operating activities
163 (288) 88 (267)
Decrease in sundry creditors and accruals (232) (706) (176) (684)Increase in unearned premiums 5,077 4,225 4,151 4,043Increase in outstanding claims 18,293 31,243 17,338 28,815Increase in provision for employee benefits 101 210 83 194Increase/(decrease) in direct insurance payables 182 (292) 56 (308)Increase/(decrease) in reinsurance ceded creditors 620 (540) 572 (295)(Decrease)/increase in indirect taxes (440) 29 (431) 130Increase in deferred reinsurance and other revenue 881 2,713 758 2,594Increase in other operating provisions 75 - 55 -
Net cash flow from operating activities 19,569 11,460 18,423 11,197
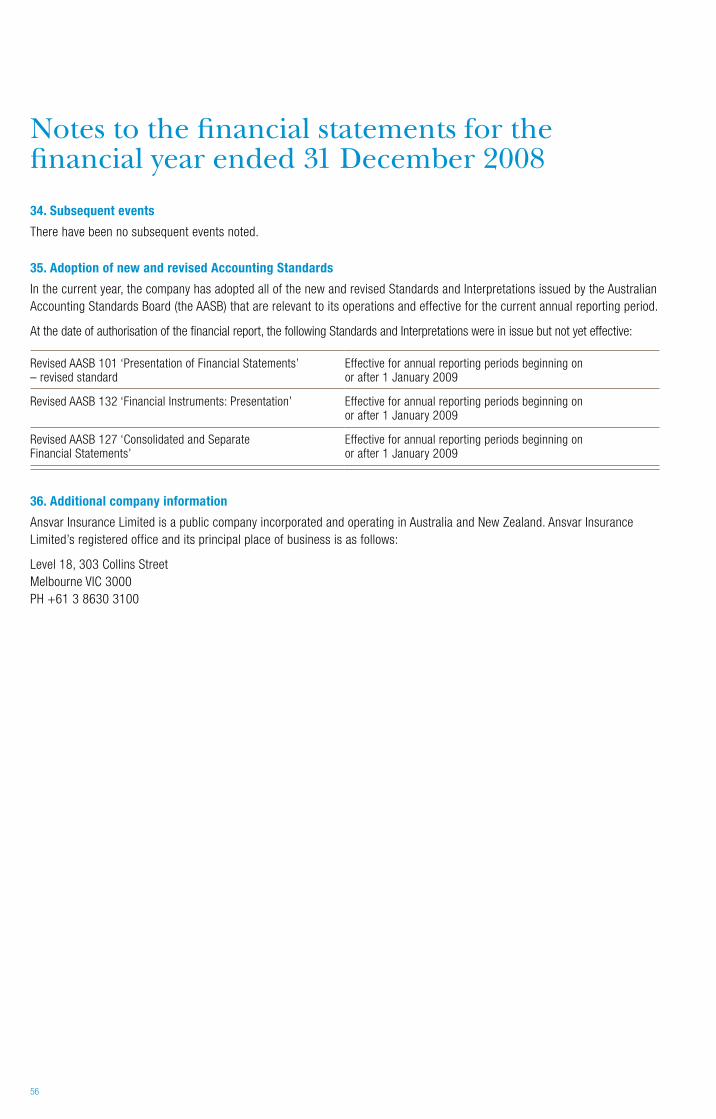
56
34. Subsequent events
There have been no subsequent events noted.
35. Adoption of new and revised Accounting Standards
In the current year, the company has adopted all of the new and revised Standards and Interpretations issued by the Australian Accounting Standards Board (the AASB) that are relevant to its operations and effective for the current annual reporting period.
At the date of authorisation of the financial report, the following Standards and Interpretations were in issue but not yet effective:
Revised AASB 101 ‘Presentation of Financial Statements’ – revised standard
Effective for annual reporting periods beginning on or after 1 January 2009
Revised AASB 132 ‘Financial Instruments: Presentation’ Effective for annual reporting periods beginning on or after 1 January 2009
Revised AASB 127 ‘Consolidated and Separate Financial Statements’
Effective for annual reporting periods beginning on or after 1 January 2009
36. Additional company information
Ansvar Insurance Limited is a public company incorporated and operating in Australia and New Zealand. Ansvar Insurance Limited’s registered office and its principal place of business is as follows:
Level 18, 303 Collins Street Melbourne VIC 3000 PH +61 3 8630 3100
Notes to the financial statements for the financial year ended 31 December 2008

Australia 1300 650 540 ansvar.com.au
New Zealand 0800 123 344 ansvar.co.nz
ABN 21 007 216 506 ACN 007 216 506 AFSL 237826 Member of the Ecclesiastical Insurance GroupAnnual report for the financial year ended 31 December 2008
ARFINS 8185 0509
Victoria AD GPO Box 1655 Melbourne 3001 PH +61 3 8630 3100 FX +61 3 9614 1545 EM [email protected]
New South Wales AD PO Box 1410 Parramatta 2124 FX +61 2 9687 9564 EM [email protected]
Queensland AD GPO Box 747 Brisbane 4001 FX +61 7 3011 8999 EM [email protected]
South Australia AD PO Box 630 Fullarton 5063 FX +61 8 8338 1920 EM [email protected]
Western Australia AD PO Box 840 West Perth 6872 FX +61 8 9324 2013 EM [email protected]
Tasmania AD PO Box 330 Launceston 7250 FX +61 3 9614 1545 EM [email protected] New Zealand AD PO Box 7042 Wellesley St Auckland 1036 FX +64 9 366 6107 EM [email protected]
This report is printed on Envirocare 100% Recycled. Envirocare 100% Recycled is an uncoated paper manufactured entirely from waste paper.