another tale of another two cities: liverpool and …
TRANSCRIPT

ANOTHER TALE OF ANOTHER TWO CITIES:
LIVERPOOL AND LONDON MARKETS IN THE
MID-19TH CENTURY
by
Donald G. Patersonand
Ronald A. ShearerDepartment of Economics
The University of British Columbia
July 2001
Discussion Paper No.: 01-19
DEPARTMENT OF ECONOMICSTHE UNIVERSITY OF BRITISH COLUMBIA
VANCOUVER, CANADA V6T 1Z1
http://www.econ.ubc.ca
Paterson/Shearer Liverpool May 2001 page 0
Another Tale of Another Two Cities:
Liverpool and London Markets in the Mid–19th Century1
Donald G. Paterson & Ronald A. ShearerDepartment of Economics
University of British Columbia
Abstract: This is a study of British prices and the degree of commodity market integrationbetween Liverpool, the bulk commodity port of mid-19th century, and London. A new wholesalecommodity price index is presented for Liverpool and this is compared with the Klovland-Sauerbeck index. Second, specific tests are made with identically described goods in bothLiverpool and London using indexes and a vector correction model. Third, wheat and flour pricesin the two markets are examined. In all cases it is found that the markets were very highlyintegrated and that shocks in one caused a swift reaction in the other and that the adjustmentwas complete in a relatively short period of time – much shorter than assumed by the standardliterature.
Keywords: Liverpool, London, prices indexes, markets, commodities, bulk trade, 19th century,wheat, flour.
JEL Codes: N13, N73, E31.
1 We wish to thank the research assistants who have worked with us and our colleagues of the Economic History workshop at the
University of British Columbia. Specific comments by W. Erwin Diewert were most helpful. We would also like to thank Jan ToreKlovland, James MacKinnon and Gordon Sparks for helpful assistance. Financial aid from the SSHRCC and UBC Small Grantsfunded much of this work.

Paterson/Shearer Liverpool May 2001 page 1
Another Tale of Another Two Cities:Liverpool and London Markets in the Mid–19th Century
Donald G. Paterson & Ronald A. Shearer
The importance of the port of Liverpool was its growth to dominance in the overseas bulk trades
in the first half of the 19th century. By transactions volume at mid-century the largest trades were in raw
cotton, timber and grains with the two latter growing rapidly. By 1859 the wheat and flour trade rivalled
that of timber.2 Liverpool was also the key export port of mid-century.
According to Francis Hyde it
accounted for about 45 per cent of all British exports in 1857 with its nearest rival, London, far behind at
23 per cent. Although the port continued its absolute growth, by the late 1860s, the relative trade volumes
and values through of Liverpool were in decline both with respect to London and British ports as a whole.3
Yet at mid-century, and beyond, Liverpool prices were particularly important ones in the North Atlantic
trades and invariably the ones reported in the North American press as the key British prices.
Market integration and the spatial convergence of prices are now familiar themes in the history of
the late 19th century Atlantic economy. Particular attention has been paid to the declining transport costs
separating the various markets with both the direct evidence of freight rates and the indirect evidence of
the declining price differences between specific locations over time. Most recent histories of international
price convergence are drawn from the years after 1870 and are based on the trends in prices using
annual observations. Unfortunately the use of annual price information permits only statements about the
trends in market activity – which are certainly useful – but mask any short-run dynamics of price
adjustments.4 In addition the literature tends to concentrate on a few specific commodities, principally
wheat and flour. Depending on how the annual price is defined this may cause further difficulty by
generalising over two harvest seasons or by inappropriate weighting of the underlying observations. In
the context of markets in Britain, the bulk import trades were all ones in commodities with seasonal
patterns. This imposed the usual harvest time price adjustments. At one extreme was the timber trade.
Because of the cessation of shipments for part of the year from the major supply regions commodity
arbitrage within Britain could only be conducted from existing stocks. Trade between Britain and the Baltic
region or the region of the Great Lakes or St. Lawrence River in North America was severely restricted
due to the icing up of ports.5
The first task of this study of this study is to construct a price index for the port of Liverpool - the
bulk trades port of mid-19th century Britain. Second we document the components of the index in order to
examine whether the short-run macroeconomic instability of the period was narrowly or widely based.
2 Williams (1989) pp. 8 – 25.3 Liverpool, in 1857, accounted for approximately 45% of all the British exports trade (London, Hull and Glasgow for 23%, 13% and
4% respectively) and one-third of the British import trade by value. Hyde (1971) p. 97.4 Even in the 20th century the differential between the Liverpool and Manitoba price of wheat varied on a seasonal basis. Snodgrass
(1926) pp. 177 – 202.5 The first shipments of Baltic and North American timber typically arrived at British ports in late May and June. The last shipments
usually arrived in mid to late November. Certain BNA Atlantic colonies, such as Nova Scotia, did have ice-free ports but were nottimber shipping ports.

Paterson/Shearer Liverpool May 2001 page 2
Third, this new price evidence is used to test the sensitivity of the prices between the Liverpool and
London market.
Although the mid to late-19th century is thought to be an important period in the creation of
‘national markets’ in Britain there has been, in practise, little historical evaluation of the claim. The
exception is the literature on grain prices during the Irish famine period of the 1840s. There is also
evidence that implies that markets within Britain were highly regional in nature.6 The same claim has also
been made of France: that French agricultural markets were fragmented in the 19th century. Ejrnaes and
Persson [(2000), 149 –173] recently showed that this was not the case. By about 1850 nearby French
markets adjusted rapidly to shocks in the other and while more distant markets adjusted more slowly they
did so with increasing speed through the third quarter of the 19th century. The mid-19th century in Britain
and elsewhere in the North Atlantic economies is a key period in the history of commodity arbitrage for
two reasons. First, in Britain the 1850s was the first decade in which the new technology of the electric
telegraph and the railways linked all the main regional centres. Changes in transport provided an
alternative to the coastal and canal trades for many bulk commodities. The near instant communication of
prices by telegraph reduced transaction costs by substantially reducing price uncertainty in commodity
arbitrage. Second, the mid-19th century is of interest because of the major gyrations in world prices
associated with the great Victorian boom of the mid-1850s and the episode of the US Civil War of
the1860s.
Our understanding of the general British price level at mid-19th century stems from three basic
sources. The Gayer-Schwartz-Rostow price index ends in 1850 and because of its coverage sheds only
limited light on the mid-19th century price behaviour [Gayer et.al. (1953)]. The Sauerbeck index extends
from 1846 onward and the Rousseaux price index covers the period 1840 – 1896 [Mitchell (1962)]. The
first of these is weighted but the latter two are not. All are annual indices. However, a major addition to
the price history of the period has been made recently by Klovland. He returned to the original sources
and recalculated the Sauerbeck index to provide monthly observations [Klovland (1993)]. It is primarily a
London-based price index. Apart from its use for analysis of many microeconomic issues of the period the
monthly index is superior to the annual ones for insight into mid 19th century macroeconomic instability.
This is especially so as many of the mid-century price shocks were of external origin and quite
unprecedented in both their dimension and the method of their transmission. For the open economies
with which Britain traded these shocks were transmitted from British markets, either directly or through
linked markets, by movements in the prices of traded goods – the terms of trade. Of course not all shocks
originated in Britain.
The Price Data
The price index for Liverpool covers the years 1850 to 1871 and is based on the prices of goods
that entered into the North Atlantic trade in a major way. In all 36 commodities are included although not
6 Latham (1967) claims that Liverpool timber and lumber were seldom shipped more than 100 mile and Perren (1990 pp. 420 – 437
makes the same argument about the low distances of domestic flour shipment (25 miles).

Paterson/Shearer Liverpool May 2001 page 3
all commodities originated in the North Atlantic economies. Items such as tea and spices, for example,
were important commodities in the Liverpool trade from a re-export point-of-view. Both British exports and
imports are represented in the index and their appearance in the bundle of goods treated here is justified
by the traffic between Liverpool and the combined St. Lawrence River ports of Quebec City and Montreal.
Montreal was the principal port of entry of goods into Canada and Quebec City was the major North
American timber port. Shipping and British customs data do not always permit a clear distinction between
the various British North American colonies however.7 In 1853/5 British North American imports
represented 16 to 17 % of Liverpool trade by volume.8 The Liverpool – St Lawrence River trade is likely
representative of all trade between Britain and North America in terms of the variety of goods and but not
necessarily the volume of transactions. Naturally there was no trade in raw cotton with the St. Lawrence
River economy but there was a substantial export of cotton cloth to Canada and the other British North
America colonies. Liverpool raw cotton prices are thus added to the overall price index. While this reflects
Liverpool imports of raw cotton it will tend to overstate the price of the shipment of textiles from the port.
Textile prices tended to vary less than the basic raw cotton prices.9 although consistent evidence of this is
hard to substantiate at high frequency levels. British North America was also important to Liverpool. For
instance, of the timber flowing into Liverpool the largest volume came from British North America. In 1850
this amounted to 81.6% of the total while Baltic shipments accounted for only 6.0% [Williams (1989), p.
11].
The frequency of the price index is monthly and the prices are the low quotations for the third
Thursday in each month. In the absence of a Thursday price quotation the nearest dated price is taken.
Where the price is listed as ‘nominal’ or when no trade took place the last prevailing price is taken, which
was, in practise, only infrequently the case. The prices are wholesale ones mainly from the ‘Wholesale
Prices Current’ – see Table 1 for the list of commodities and the sources of information. All prices are in
index form with the average of 1850 prices equal 100.0. Both an overall price index and sub-indices are
presented. Although biased toward towards goods that entered into international trade many of the sub-
indices also are representative of sectoral prices in Britain. For instance, the metals price index covers
seven commodities of British manufacture. Timber and lumber prices are also highly representative of
domestic prices because of the overall importance of imported wood in domestic consumption (although
later we shall draw attention to some important distinctions between the Liverpool and London markets in
this commodity).
The overall price index and all sub-indices are geometric means of all the commodities in the
group. Since some commodities or their close substitutes appear in the index more than once, such as
three types of raw cotton or three types of wheat and flour, this is a weighted index. The weights are
given in Table 2. Later in this study comparison is made with London prices. The London prices used
7 Canada here refers to the Province of Canada as it existed between 1841 and 1867. It does not include the separate British North
American colonies of New Brunswick, Nova Scotia, Prince Edward Island and Newfoundland. The first two of these joined with theProvince of Canada in 1867 to become the Dominion of Canada.8 Williams (1989), p. 13.
Paterson/Shearer Liverpool May 2001 page 4
here are based on a similar dating and quotation basis as those for Liverpool. They differ from Klovland’s
collection of London prices although in some cases they share the same sources.10
Duties. Newspapers and brokers’ circulars of the period normally quoted both Liverpool and
London prices exclusive of duty paid where the commodities were held in bonded warehouses or in
special holding areas. All the duties of the period that are relevant were specific duties. Here the main
price indices are presented inclusive of duty as is done now. The duty is added to individual pre-duty
prices to give market prices. As is well known the tariff structure of Britain change radically at mid
century with important tariff reductions in the 1840s and the early 1850s. There was, however, one
important exception for the 1850s. This was the remnants of the Baltic Timber duties which in various
forms existed from 180411
and were designed to confer a competitive advantage to forest products
from British North America by discriminating against shipments from Baltic Europe. Although the
highest level of discrimination had been reduced by 1850 in that year the duties still stood at 20/- per
load (50 cubic feet) when timber was imported from the Baltic but only 2/- when imported from British
North America.12
The degree of discrimination was reduced several times and finally done away with
in May 1866. For the later years of the period to 1871 the duties on most commodities were either
abolished or negligible and applied only to a narrow range of commodities. The latter included
‘tropical products’ such as tea, sugar, spices and spirits.
Liverpool and The Price Index
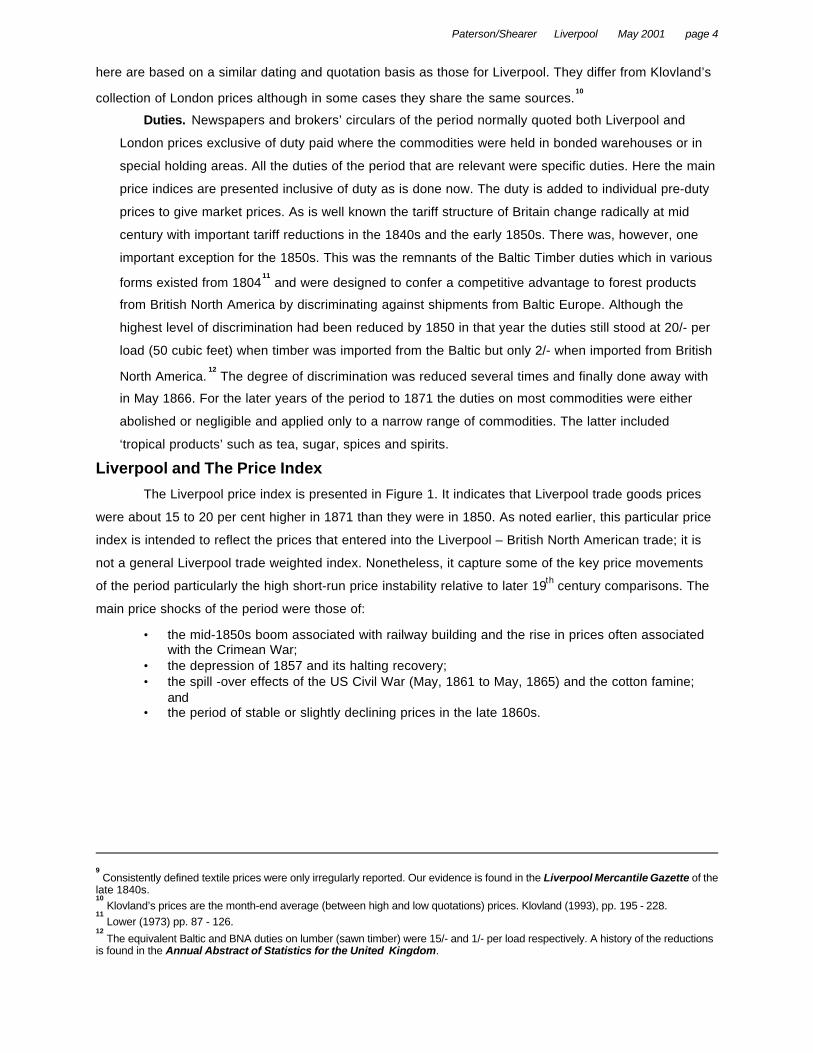
The Liverpool price index is presented in Figure 1. It indicates that Liverpool trade goods prices
were about 15 to 20 per cent higher in 1871 than they were in 1850. As noted earlier, this particular price
index is intended to reflect the prices that entered into the Liverpool – British North American trade; it is
not a general Liverpool trade weighted index. Nonetheless, it capture some of the key price movements
of the period particularly the high short-run price instability relative to later 19th century comparisons. The
main price shocks of the period were those of:
• the mid-1850s boom associated with railway building and the rise in prices often associatedwith the Crimean War;
• the depression of 1857 and its halting recovery;• the spill -over effects of the US Civil War (May, 1861 to May, 1865) and the cotton famine;
and• the period of stable or slightly declining prices in the late 1860s.
9 Consistently defined textile prices were only irregularly reported. Our evidence is found in the Liverpool Mercantile Gazette of the
late 1840s.10
Klovland’s prices are the month-end average (between high and low quotations) prices. Klovland (1993), pp. 195 - 228.11
Lower (1973) pp. 87 - 126.12
The equivalent Baltic and BNA duties on lumber (sawn timber) were 15/- and 1/- per load respectively. A history of the reductionsis found in the Annual Abstract of Statistics for the United Kingdom.

Paterson/Shearer Liverpool May 2001 page 5
TABLE 1. LIVERPOOL PRICE INDEX, MONTHLY, 1850 = 100.
Agricultural Commodities1. Canadian and US salted beef in barrels of 304 lbs.(tierce) in shillings2. Canadian and US salted pork in barrels of 200 lbs. in shillings3. Argentinean leather -salted ox hide- in pence per lb4. Maryland leaf imported US tobacco in pence per lb.5. domestic English wheat new, red - in shillings per 70 lbs6. domestic English barley in shillings per 60 lbs7. domestic English and Scotch oats in shillings per 45 lbs8. Canadian wheat described as mixed and red - in shillings per 100 lbs9. Canadian flour described as Canadian sweet - in shillings per barrel of 196 lbs.
Processed Foodstuffs and Oil1. Havana No. 8 or 10 brown sugar (in bond) in shilling per cwt.2. molasses (foreign clayed) shillings per cwt.3. Jamaica strong rum (in bond) in shillings per gallon4. Rio coffee, low to good ordinary (in bond) in shillings per cwt.5. black Malabar pepper (in bond) in pence per lb.6. Souchong tea (in bond) in pence per lb.7. salt (rough common) in shillings of per ton8. linseed oil in pounds per cwt
Lumber and Timber and Naval Stores1. potash (Montreal first pots) in shillings per cwt.2. yellow pine timber (Quebec) in shillings per cu. ft3. oak timber (Canadian) in shillings per cu. ft.4. yellow pine deals (Quebec) in £s per standard hundred,5. spruce deals (Quebec) in £s per standard hundred,6. first quality standard staves (Canadian) in £s per load7. fir timber (Baltic- Riga) in shillings per cubic foot8. crown pipe staves (Baltic-Dantzic and Memel) in £s per 1200 pieces9. Manilla hemp in £s per ton
Iron and Other Metals1. bar iron (Welsh), in £s per ton of 2240 lbs.2. nail rods, £s per ton of 2240 lbs.3. hoop iron, £s per ton of 2240 lbs.4. iron sheets, £s per ton of 2240 lbs.5. sheet lead, £s per ton of 2240 lbs.6. tin (English block), £s per ton of 2240 lbs.7. charcoal tin plate (IC), in shillings in boxes of 225 sheets
Raw Cotton1. US raw cotton (Uplands – “fair” quality) in pence per 100lbs.2. US raw cotton (New Orleans – “fair” quality) in pence per 100lbs.3. Egyptian raw cotton (“fair” quality) in pence per 100lbs.
Sources: (I) The Liverpool Mercantile Gazette; (ii) Willmer and Smith’s European Times whose last date ofpublication was August 1868; (iii) The Liverpool Journal of Commerce; (iii) The Liverpool Mercantile Gazette andMyer’s Mercantile Advertiser especially for the years 1852, 1857 and 1867, and Sept. 1868 to Dec. 1871. Theseprices represent the market wholesale prices on large quantities (or the lowest traded price) of the goods on the thirdFriday of each month - or the nearest reporting date. The cotton prices from 1868 are from the Economist.

Paterson/Shearer Liverpool May 2001 page 6
TABLE 2. IMPLICIT WEIGHTS OF THE LIVERPOOL PRICE INDEX.
Agricultural Commodities 25.0Cereals 13.9
Wheat and Flour 8.3Processed Foodstuffs and Oil 22.2Lumber and Timber 25.0
Deals 5.6Timber 8.3
Iron and Other Metals 19.4Raw Cotton Raw Cotton 8.3
Comparison with the Klovland-Sauerbeck Weights
Liverpool LondonTrade Based General Wholesale
Vegetable Foodstuffs 13.9 17.8Animal Foodstuffs 5.6 15.5Tropical Products 16.7 8.9Metals 19.4 15.6Textiles 8.3 17.8
Wood Products 22.3Other Raw Materials Salt 5.6 36.1 24.4
Other* 8.3
*Includes leather, rope and linseed oil.
The price behaviour of the Liverpool index in the early 1850s is of particular significance as it
shows a rapid rise in prices beginning in January 1852, long before the Crimean War or its anticipation
brought pressure to bear on the markets. Only the later part of the great surge in prices is due to the
anticipated disruption of markets as pre-war posturing inhibited the flow of the south Russian grain
harvest to market in the autumn 1853.
Great excitement prevailed at Mark Lane this morning, caused partly by the warlike aspectof affairs in the East and partly by the very unfavourable report from almost all quarters ofthe kingdom in regard to the acreage yield. 26th September 1853, Mark Lane Express andAgricultural Journal.
By the actual declaration of war in April 1854 the market prices of wheat and flour had in fact reached
their highest level along with those of almost all other commodities. This is evident in the commodity
group sub-index for agricultural goods – see Figure 3. What is also evident about the early stages of the
boom of the 1850s is how important the rise in prices of construction materials was to the overall inflation.
Metal prices Increased followed by a rise in timber/lumber prices. There then followed a three-peaked
price pattern of the mid-1850s expansion – a characteristic also evident in North American monthly prices

90
100
110
120
130
140
50 52 54 56 58 60 62 64 66 68 70
Figure 1. Liverpool (Trade-Based) Wholesale Price Index, Monthly, 1850 - 1871.
Ave
rgae
of 1
850
= 10
0.0
0
100
200
300
400
500
50 52 54 56 58 60 62 64 66 68 70
US Civil War
Figure 2. Liverpool Raw Cotton Price Index, Monthly, 1850 - 1871.
Ave
rage
of 1
850
= 10
0
Paterson/Shearer Liverpool May 2001 page 8
although not obviously in the annual price indices usually used.13
The depression of the late 1850s began
in September of 1857. Starting originally as a financial crisis in the US grain market, and then quickly
transmitted to Britain, it quickly developed into a widespread real depression that affected most
commodity markets.14
As the economic crisis developed many commodity prices tumbled particularly
those of timber and lumber. The trough of Liverpool trade prices was in late 1858.
The slow upward movement of the Liverpool price index was initially led by the rising price of
breadstuffs, itself a product of the smaller than normal British grain harvests for three years.15
A
substantial arbitrage opportunity drew in record imports of grain particularly from North America - see
later. Wheat and flour prices started falling in February 1862. By then, with the opening of the US Civil
War in the spring of 1861 the well-documented rise of cotton prices began that contributed to the overall
rise in Liverpool prices in the years from 1862 for the rest of the war period. By 1863 metal prices also
contributed to the overall rise but only briefly. The years 1864 and 1865 witnessed the greatest reversal of
Liverpool prices for the entire period. The sharp saw-toothed movement of prices was led by the price of
cotton that declined sharply to December 1864 but then rebounded as the war in the US dragged on into
the spring of the next year.16
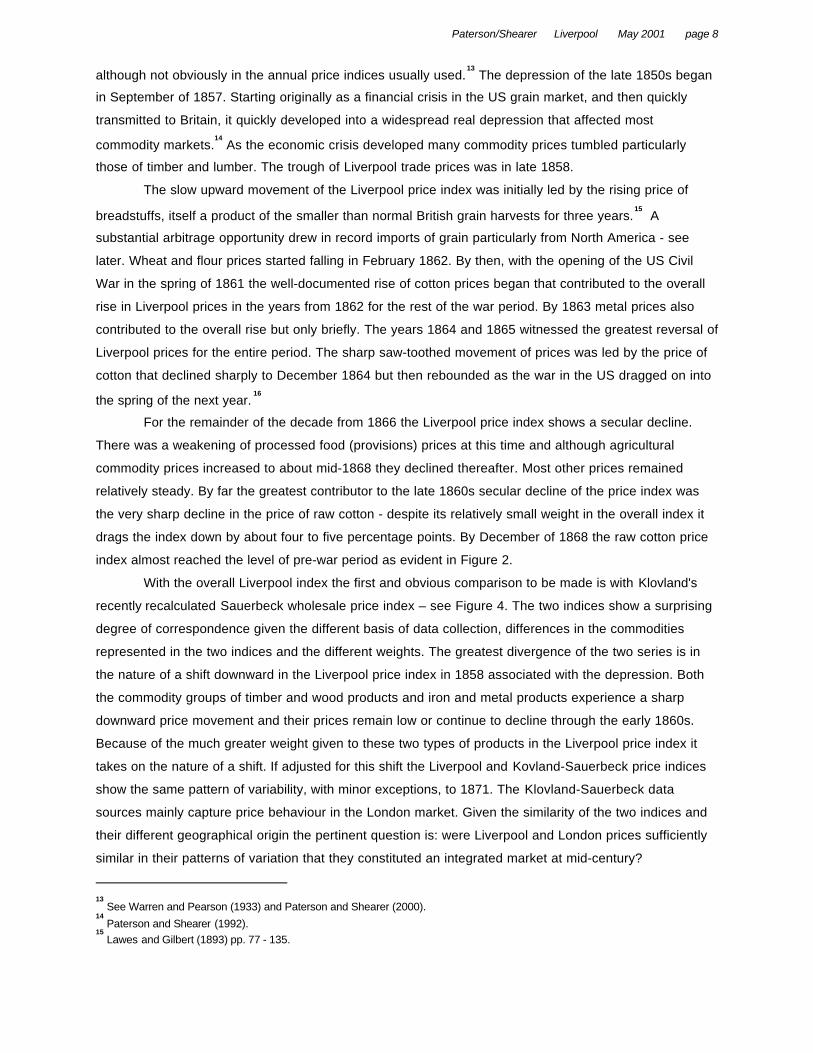
For the remainder of the decade from 1866 the Liverpool price index shows a secular decline.
There was a weakening of processed food (provisions) prices at this time and although agricultural
commodity prices increased to about mid-1868 they declined thereafter. Most other prices remained
relatively steady. By far the greatest contributor to the late 1860s secular decline of the price index was
the very sharp decline in the price of raw cotton - despite its relatively small weight in the overall index it
drags the index down by about four to five percentage points. By December of 1868 the raw cotton price
index almost reached the level of pre-war period as evident in Figure 2.
With the overall Liverpool index the first and obvious comparison to be made is with Klovland's
recently recalculated Sauerbeck wholesale price index – see Figure 4. The two indices show a surprising
degree of correspondence given the different basis of data collection, differences in the commodities
represented in the two indices and the different weights. The greatest divergence of the two series is in
the nature of a shift downward in the Liverpool price index in 1858 associated with the depression. Both
the commodity groups of timber and wood products and iron and metal products experience a sharp
downward price movement and their prices remain low or continue to decline through the early 1860s.
Because of the much greater weight given to these two types of products in the Liverpool price index it
takes on the nature of a shift. If adjusted for this shift the Liverpool and Kovland-Sauerbeck price indices
show the same pattern of variability, with minor exceptions, to 1871. The Klovland-Sauerbeck data
sources mainly capture price behaviour in the London market. Given the similarity of the two indices and
their different geographical origin the pertinent question is: were Liverpool and London prices sufficiently
similar in their patterns of variation that they constituted an integrated market at mid-century?
13
See Warren and Pearson (1933) and Paterson and Shearer (2000).14
Paterson and Shearer (1992).15
Lawes and Gilbert (1893) pp. 77 - 135.

60
80
100
120
140
160
180
60
80
100
120
140
160
180
50 52 54 56 58 60 62 64 66 68 70
Ave
rage
of 1
850
= 10
0Figure 3. Liverpool Commodity-Group Price Indices, Monthly, 1850 - 1871.
RHS: Processed Food & Oil
LHS: Agricultural Commodities
60
80
100
120
140
160
180
60
80
100
120
140
160
180
50 52 54 56 58 60 62 64 66 68 70
RHS: Timber & Wood Products
LHS: Iron & Metal Products
Ave
rage
of 1
850
= 10
0

90
100
110
120
130
140
150
50 52 54 56 58 60 62 64 66 68 70
Figure 4. Liverpool Price Index and the Klovland-SauerbeckPrice Index, Monthly, 1850 - 1871.
Ave
rage
of 1
850
= 10
0Klovland-Sauerbeck
Liverpool

Paterson/Shearer Liverpool May 2001 page 11
Liverpool and London Market Adjustments
What was the extent of the national market in Britain by the mid-19th century? While we cannot
answer this question directly there is enough evidence to examine the relationship between the two
important markets of Liverpool and London. As noted the new technology meant that information about
prices was communicated cheaply, rapidly and frequently between Liverpool and London and, in addition,
was widely distributed. The growing railway network ensured the efficient movement of goods. For
instance, the spoilage of perishable commodities had been a problem for the long distance shipment of
flour by canal and had been a barrier, according to Perren, to the creation of a national market in this
commodity. Contrary evidence is the fact that both Canada and the United States regularly shipped flour
to both Liverpool and London and that is was regarded by the market as a relatively high quality
commodity. Lower costs and speedier commodity movement would tend to reduce uncertainty costs for
which an implicit risk premium would be built into the offer price.17
In order to examine the extent of the market integration between Liverpool and London the prices
of the same commodity are selected in the two markets. Fourteen commodities from the Liverpool price
index satisfy the condition of having an apparent exact London counterpart price. Three price indices are
constructed for each of the following markets: processed foods and oil (provisions), timber and lumber,
iron and other metal products. The commodities are given in Table 3. The indices are geometric means.
TABLE 3. LONDON COMMODITY COMPARISONS.
Processed Foods and Oil1. Havana No. 8 or 10 brown sugar (in bond) in shilling per cwt.2. Jamaica rum strong (in bond) in shillings per gallon3. Rio coffee, low to good ordinary (in bond) in shillings per cwt.4. Souchong tea (in bond) in pence per lb.5. linseed oil in £s per cwt
Timber and Lumber1. yellow pine timber (Quebec) in shillings per cu. ft.2. oak timber (Canadian) in shillings per cu. ft.3. yellow pine deals (Quebec) in £s per standard hundred,4. spruce deals (Quebec) in £s per standard hundred,5. first quality standard staves (Canadian) in £s per load
Iron and Other Metals1. Bar iron (Welsh), in £s per ton of 2240 lbs.2. nail rods, in £s per ton of 2240 lbs.3. hoop iron, in £s per ton of 2240 lbs.4. iron sheets, in £s per ton of 2240 lbs.
Sources: Mark Lane Express and Agricultural Journal (1850 –71), London, The Economist (1850 – 1871),London, The Times (1850 – 1871), London.
17
Futures markets in certain commodities may have existed although the evidence for them in the commercial press is sparce.

60
80
100
120
140
160
180
50 52 54 56 58 60 62 64 66 68 70
Liverpool
London
Figure 5. Liverpool and London Prices of Selected Metals,Monthly, 1850 - 1871.
Four Commodities:Welsh bar iron, nail rods, hoop iron, sheet iron
Ave
rage
of 1
850
= 10
0
60
80
100
120
140
160
180
50 52 54 56 58 60 62 64 66 68 70
Liverpool
London
Figure 6. Liverpool and London Prices of SelectedTimber and Lumber Products, Monthly, 1850 - 1871.
Five Commodities, All Imports from BNA:Yellow Pine Square Timber, Oak Square Timber;Yellow Pine Sawn Lumber; Red Pine Sawn Timber;Barrel Staves.
Ave
rage
of 1
850
= 10
0

60
80
100
120
140
160
180
50 52 54 56 58 60 62 64 66 68 70
Liverpool
London
Figure 7. Liverpool and London Prices of SelectedProcesed Foodstuffs and Oil, Monthly, 1850 - 1871.
Five Commodities:Coffee (Rio); Brown (Havana) Sugar, Jamaica Rum;Chinese (Souchong) Tea; Linseed Oil
Ave
rage
of 1
850
= 10
0

Paterson/Shearer Liverpool May 2001 page 14
There are several issues of concern when comparing prices in the two markets. First, the
agricultural component of the Liverpool index has few commodities that have an exact London equivalent.
Among those that do have a counterpart are wheat and flour and they are considered separately in a later
section of this study.18
Second, there is no assurance that the overseas goods prices cited in the
Liverpool and London markets were actually imported at their own ports. Indeed, if commodity arbitrage
was working well we should expect shipments from one market to the other and perhaps even the cross-
shipment of goods. Third, in terms of the overseas trade, each port had developed different capabilities.
In timber and lumber, for instance, the method of selling lumber was very different in the two ports.
Lumber at Liverpool had to be cleared from the docks within forty-eight hours by the importing agent
whereas in London it was actually stored on the Surrey docks. Square timber at Liverpool was often
floated into the ‘pool’, a practise that often made purchasers cautious in the quality evaluation.19
While
Liverpool handled a greater volume of timber and lumber than the port of London the latter regularly
handled a greater variety. For the entire period 1850 – 71 there are more timber and lumber prices
regularly quoted for the London market than the market at Liverpool which of course reflected the fact that
most Baltic wood products entered Britain through London. Liverpool specialised in the North Atlantic
timber trade and the import of some tropical woods. Fourth, raw cotton invariably was shipped to
Liverpool and the standard London reporting was of the Liverpool price of this good. No separate London
market exists in this commodity. Fifth, there were often quality differences between the same good in the
two markets, even although they were both described as similar by the market reports. In several
instances, in the timber and lumber markets, the same commodity was reported sold in different units
(and the underlying prices have to be adjusted appropriately).20
As seen in Figures 5, 6, and 7 the pair-wise comparison of the Liverpool – London prices indicate
a high degree of coherence. However, there were some differences. One was due to timing and stemmed
from institutional differences of how markets in Liverpool and London were organised. For instance, the
Liverpool Timber Exchange typically traded once each week at a meeting of the wholesale buyers and
the importing agents – in the Great Eastern Hotel. The London market meetings were less frequent,
sometimes only once fortnight during the season of May to November. Out-of-season meetings were
often even less frequent.21
Indeed, this characteristic likely accounted for the relatively unchanged prices
for periods of several months especially evident in Figure 6. There are a few divergent price movements
but they are rare. London timber and lumber prices do not seem to respond to the increase registered at
Liverpool for the in late 1861 and early in 1862. The same is the case in 1866. This is most likely a result
of the fact that the index only records the prices of British North American wood. The close substitutes of
18
An example of the incompatibility is salted beef and pork that is quoted in both Liverpool and London but which varied in qualitywith the age of the commodity and we cannot be sure of the vintage of sales. Substantial amounts of salted beef and pork wereimported from North America. See Willmer and Smith’s19
Latham (1967) pp. 9 - 12 .20
Timber and lumber in the London market generally conformed to Baltic shipping measures whereas that in the Liverpool marketwas generally in North American shipping dimensions..21
Passingham (n.d) pp. 252-61.

Figure 8. Impulse Responses to Shocks.
0
2
4
6
8
2 4 6 8 10 12 14 16 18
Liverpool - Iron London - Iron
Response of Liverpool - Iron to One S.D. Innovations
0
2
4
6
8
2 4 6 8 10 12 14 16 18
Liverpool - Iron London - Iron
Response of London - Iron to One S.D. Innovations
0
1
2
3
4
2 4 6 8 10 12 14 16 18
Liverpool - Wood London - Wood
Response of Liverpool - Wood to One S.D. Innovations
0
1
2
3
4
2 4 6 8 10 12 14 16 18
Liverpool - Wood London - Wood
Response of London - Wood to One S.D. Innovations
0.0
0.5
1.0
1.5
2.0
2.5
3.0
2 4 6 8 10 12 14 16 18
Liverpool - Proc. Food London - Proc. Food
Response of Liverpool - Proc. Food to One S.D. Innovations
0.0
0.5
1.0
1.5
2.0
2.5
3.0
2 4 6 8 10 12 14 16 18
Liverpool - Proc. Food London - Proc. Food
Response of London - Proc. Food to One S.D. Innovations

Paterson/Shearer Liverpool May 2001 page 16
Baltic wood were less frequently found in the Liverpool market. There is a slight divergent drift in the last
years in a few of the pairs but this largely disappears by the terminal date of 1871.
How did the markets in these commodity bundles react when there was a price shock? ‘Impulse
tests’ trace the shock of one standard deviation on current and future values of the endogenous variables
when the relationship between the two markets is specified as a Vector Error Correction model – see
Appendix for details. The impulse tests for the Liverpool - London commodity group price indices are
given in the Figure 8 for an adjustment period of 18 months. In all three cases the adjustment in one
market to price shocks in the other was rapid. First, adjustment began immediately. Second, within a very
few number of periods the adjustment to a standard deviation shock is about 75% complete in the other
market. The cases differed somewhat in the speed of adjustment. For instance, in processed foodstuffs
and oil (provisions) the adjustment is extremely rapid with 75% of the adjustment taking only two months.
All of the items in this bundle are imported and relatively low bulk and high value commodities - a
characteristic that should encourage speedy reaction in the form of commodity arbitrage. In the other
cases of wood products and iron products the adjustment is slightly slower.
The Liverpool and London Markets in Wheat and Flour. The most frequently cited price of
British wheat for study of 19th century international markets is the Gazette price of wheat. This is an
unweighted weekly average of wheat in a variety different markets throughout Britain. The number of
underlying observations that make up any particular Gazette price varied as all markets did not
necessarily report or record transactions every period.22
Therefore, while the Gazette price of wheat gives
a general impression of the price of wheat in Britain its usefulness for studying the integration of markets
is strictly limited. For instance, the main wheat varieties traded on London’s Corn Exchange in Mark Lane
normally traded below the Gazette price. The two main locations from which London drew domestic
supplies of wheat were Essex-Kent (described as ‘white’) and Norfolk (described as ‘red’). The latter also
included shipments from Lincolnshire and Yorkshire. The average overstatement of the Gazette price with
respect to the Essex-Kent one is 4 ½ d. per bushel of 60 lbs. or about 6.25 per cent.23
For the purposes of comparing the Liverpool and London markets we use several wheat and flour
prices. Figure 9 shows the actual prices of ‘red’ wheat in Liverpool and London for the mid-century period.
The grades are ‘English red’ and ‘Norfolk (Lincolnshire, Yorkshire) red’ in Liverpool and London
respectively. Both prices are in shillings per bushel (60lbs.).24
There was a very close correspondence
between Liverpool and London prices and the latter were always greater. This may reflect a quality
difference in the grains in the two markets. Or, it may reflect the spatial hierarchy of prices. There are two
departures from an otherwise stable relationship. The first is at the height of the 1850s boom and the
22
The Gazette prices of grains were reported at the end of the week and were a regular feature of the trade paper that served theLondon Corn Exchange. Later corrections were made from time to time as markets which did not report on time were added. Seethe Mark Lane Express and Agricultural Journal.23
There are two interesting anomalies. During the height of the 1850s boom the Gazette price substantially underestimates theLondon price of Essex-Kent wheat whereas during the sharp rise in grain prices in 1861 – 2 it overstates the price.24
Grain in the London market was reported in imperial quarters of 480 lbs. (8 bushels) whereas Liverpool sales were usuallyreported per sack of 70 lbs. or occasionally per sack of 100lbs. Flour was most frequently quoted in sacks (240 lbs.).

0
2
4
6
8
10
12
50 52 54 56 58 60 62 64 66 68 70
Figure 9. Liverpool and London Prices of 'Red' Wheat,Per Bushel (60 lbs.), Monthly, 1850 - 1871.
London
Liverpool
Liverpool: 'Best' English Red WheatLondon: Norfolk, Lincolnshie and Yorkshire Red Wheat
Shi
lling
s pe
r Bus
hel (
60 lb
s.)
3
4
5
6
7
8
20
30
40
50
60
70
50 52 54 56 58 60 62 64 66 68 70
Figure 10. The Prices of London-Milled Flour andLiverpool 'Red' Wheat, Monthly, 1850 - 1871.
RHSLondon Flour
LHSLiverpool Wheat
Shillings per 196 lbs. (barrel) of Flour
Shi
lling
s pe
r Bus
hel (
60 lb
s.)

Figure 11. Impulse Response Shocks
0.0
0.1
0.2
0.3
0.4
2 4 6 8 10 12 14 16 18
L i v e r p o o l R e d W h e a t L o n d o n - N o r f o l k R e d W h e a t
Response of Liverpool Red Wheat Price to One S.D. Innovations
0.0
0.1
0.2
0.3
0.4
2 4 6 8 10 12 14 16 18
L i v e r p o o l R e d W h e a t L o n d o n - N o r f o l k R e d W h e a t
Response of London - Norfolk Red Wheat Price to One S.D. Innovations
0.0
0.1
0.2
0.3
0.4
2 4 6 8 10 12 14 16 18
L i v e r p o o l R e d W h e a t L o n d o n - M i l l e d F l o u r
Response of Liverpool Red Wheat Price to One S.D. Innovations
1.0
1.2
1.4
1.6
1.8
2.0
2.2
2 4 6 8 10 12 14 16 18
L i v e r p o o l R e d W h e a t L o n d o n - M i l l e d F l o u r
Response of London-Milled Flour Price to One S.D. Innovations

Paterson/Shearer Liverpool May 2001 page 19
other at the height of the wheat price rise in the autumn of 1861. There is no obvious explanation for
these anomalies although they may be related to quality differences emerging in stressed markets. Using
the same technique as before – also see Appendix A - the adjustment of the Liverpool price of wheat to a
price shock of one standard deviation in the London price is very rapid. Most of the adjustment took place
within a month. That is, the impulse function shown in Figure 10 becomes flat within two periods with
more than 75 per cent of the adjustment happening in the first month.
In his study of British flour milling Perren argues that at mid-century most flour consumed was
shipped a very short distance from the mills. The milling industry was atomistic and twenty-five miles was
usually the limit of flour shipments.25
Yet shipments of flour did travel great distances and reached both
Liverpool and London from North America although from a British perspective the amounts were relatively
small. The price of US flour was regularly quoted in London and that of Canadian flour in Liverpool. US
‘sweet’ flour in barrels of 196 lbs. was discounted about 9/3 per on average [s.d. = 5.54] over the best
London-milled flour throughout the period. The mean price of the London flour was 37/4 for an equivalent
amount. Perren’s observation requires that the main commodity arbitrage in breadstuffs was by the
shipment of wheat not flour and that shipments of flour constituted small marginal adjustments.26
We can
ask then how speedily the Liverpool price of wheat adjusted to changes in the London price of flour? First,
these are integrated markets (confirmed by a cointegration relationship – see Appendix A). Second, when
the price of ‘best London-milled’ flour changed there was a very quick response in the price Liverpool’s
‘English red’ wheat. Again the impulse shock suggest that about 75 per cent of a shock of one standard
deviation was absorbed within two months.
Conclusions
A new price index for Liverpool is presented. Not intended as a general price index, nonetheless,
it follows the Klovland – Sauerbeck general wholesale price index very closely – most likely because of
the large weights given to agricultural goods. The component sub-indices give more details of the price
history and show which of the commodities contributed to the overall price instability. London and
Liverpool markets were integrated in the commodities studied here. That is, the two cities markets were
linked by a stable long-run price relationship. The short-run price responsiveness suggests rapid price
adjustments in four commodity groups (metal products, wood products, processed food and oil, and
wheat and flour). The most rapid adjustment took place in the markets for wheat and flour. This is
consistent with the finding of Ejrnaes and Persson (2000) for France of the mid-19th century. While this is
not evidence for the existence of national markets in these commodities it is deeply suggestive. A
surprisingly high degree of integration between the two markets of Liverpool and London is a finding that
is important because of the strategic importance of Liverpool in the North Atlantic trades. It is also
25
Perren (1990) pp. 422 - 423.26
The three flour prices noted above are all series with unit roots but we reject any cointegration relationship. This is a slightlysurprising find. It may be due to measurement error, changes in the quality of flour or that North American flour was sufficientlydifferent that it was effectively traded in a different market.

Paterson/Shearer Liverpool May 2001 page 20
important because it helps focus the debate about integrated markets deeper into the 19th century and
suggests that we might look even deeper still. The conclusions also suggest some questions. First, would
higher frequency data provide additional insight into the speed of response in the markets? Second, do
similar degrees of integration link other important British markets such as Liverpool and Glasgow? Third,
what is the degree of market integration between Liverpool and London, on one hand, and, on the other,
the key ports of the North Atlantic trade such as Montreal and New York?
Bibliography
Burton, Valerie, ed. (1989), Liverpool Shipping, Trade And Industry : Essays on the Maritime History ofMerseyside, 1780-1860, Liverpool: National Museums and Galleries on Merseyside.
Capper, Charles (1862), The Port and Trade of London, Smith, Elder and Co., London.
Ejrnaes, Mette and Persson, Karl Gunnar (2000), “Market Integration and Transport Costs in France 1825 – 1903: AThreshold Error Correction Approach to the Law of One Price”, Explorations in Economic History, 37, 149– 173.
Harley. C. Knick, ed. (1996), The Integration of the World Economy, 1850-1914, Cheltenham. Edward Elgar.
Harris, R. J. editor (1969), Liverpool And Merseyside: Essays In The Economic And Social History of A PortAnd Its Hinterland, Manchester.
Henderson, William Otto (1935), The American Chamber of Commerce for the Port of Liverpool, 1801-1908,Liverpool reprinted from: Transactions of the Historic Society of Lancashire and Cheshire, vol. 85, 1935
Hyde, Francis E. (1971), Liverpool and the Mersey : an Economic History of a Port, 1700-1970 , David andCharles. Newton Abbot, UK.
Klovland, Jan Tore (1993), "Zooming in on Sauerbeck: Monthly Wholesale Prices in Britain, 1845 - 1890",Explorations in Economic History, 30, (No. 2), 195 - 228.
Klovland, Jan Tore (1998), "A Reassessment of the United Kingdom Business Cycle Chronology", in Trevor J. O.Dick (ed.), Business Cycles Since 1820, New International Perspectives from Historical Evidence,Edward Elgar Publishing, (Cheltenham, U.K.), pp. 49-90.
Latham, Frank Alexander 1(967), Timber Town ... A History Of The Liverpool Timber Trade, Liverpool: LiverpoolBranch, Institute of Wood Science.
Lawes, J.B. and Gilbert, J.K. (1893), "On The Home Produce, Imports, Consumption, And Price Of Wheat, Over FortyHarvest Years, 1852-3 To 1891-92", Journal Of The Royal Agricultural Society Of England, Volume 4,1893. 77 - 135.
Lower, A. R. M. (1973), Great Britain's Woodyard, McGill – Queen’s University Press, Montreal.
MacKinnon, James G. (1994), "Approximate Asymptotic Distribution Functions For Unit-Root And CointegrationTests," Journal of Business and Economic Statistics, 12, 167-176.
MacKinnon, James G. (1994), (1996), "Numerical Distribution Functions For Unit Root And Cointegration Tests,"Journal of Applied Econometrics, 11, 601-618.
Neal, F. (1969), "Liverpool Shipping in the Early Nineteenth Century" in Harris, (1969), pp. 12 –25.
O’Rourke, Kevin and Williamson, Jeffrey G. (2000), Globilization and and History, The Evolution of aNineteenth-Century Atlantic Economy, The MIT Press, Cambrifge, Mass.
O’Rourke, Kevin (1994), “The Repeal of the Corn Laws and Irish Emigration”, Explorations in Economic History,31, No. 1, 120 -138.
O’Rourke, Kevin (1997), “The European Grain Invasion, 1870 – 1913”, Journal of Economic History, 57, No. 4, 775– 801.
Passingham, W. J. (n.d.), London’s Markets; Their Origin and History, Sampson Low, Martin and Co.London.

Paterson/Shearer Liverpool May 2001 page 21
Paterson, Donald G. and Shearer, Ronald A. (2000), “ Price Levels in Canada and the North Atlantic Economy of theMid-19th Century: A New Canadian Wholesale Price Index”, Presented to the World Congress of Cliometrics,Montreal.
Paterson, Donald G. and Shearer, Ronald A. (1993), “A Tael Of Two Cities: When The Gold Standard Did NotWork”, UBC Discussion Paper Series.
Perren, Richard (1990), “Structural Change and Market Growth in the Food industry: Flour Milling in Britain, Europe,and America, 1850 – 1914”, Economic History Review, 2nd Ser., XLIII, 3, 420 – 437.
S. McKee (1940), "Canada's Bid for the Traffic of the Middle-West", Report of the Canadian HistoricalAssociation, Toronto.
Snodgrass, Katherine (1926), “Price Spreads and Shipment Costs in the Wheat Export Trade of Canada”, WheatStudies, II, No. 5, 177 – 202.
Statistical Abstract for the United Kingdom (1852 – 1872), H.M.S.O., London.
Warren, George F. and Frank A. Pearson (1933), Prices, John Wiley and Sons, New York.
Williams, David M. (1989 ), “Bulk Trades and the Development of the Port Of Liverpool in the First Half of theNineteenth Century“, in Burton (1989), pp. 8 – 25.
Newspaper and Trade Circulars
Belfast Linen Trade Circular, (1853 – 1871), Belfast,Mark Lane Express and Agricultural Journal (1850 –71), London,Myer’s Mercantile Advertiser (1852 – 1871), Liverpool,The Economist (1850 – 1871), London.The Liverpool Journal of Commerce (various years), Liverpool,The Liverpool Mercantile Gazette (1850 – 1871), Liverpool,The Times (1850 – 1871), London andWillmer and Smith’s,European Times (1850 –1868), Liverpool.
Appendix ATests for market integration are conducted here using the three similarly defined price (sub)
indices for each of the Liverpool and London markets. For the fourth market test the actual prices wheat
and flour are used. It is important to remember that the prices here are prices prevailing on one day of the
month (the third Thursday or nearest date) and not average for the month. Since the concern is the
adjustment of markets to price variation the data definition allows us to judge how much of the adjustment
had taken place by that date. All the historical Liverpool and London price indices are described by the
autoregressive structure AR(1):
Yt = α + ϕYt-1 + e t
There is the possibility that unit roots exist in the time series. Unit roots occur when ϕ = 1. This means
that there is no tendency of the price series to return to mean or trend values when a price shock is
delivered. The standard Augmented Dickey-Fuller test statistics for the rejection of the unit root null
hypothesis are given in below. In all cases the possibility of unit roots cannot be rejected. The series are
non-stationary. The presence of unit roots indicates that any OLS regression using two price series, such
as the typical specification for the test of the Law of One Price, is likely to produce spurious results. If the

Paterson/Shearer Liverpool May 2001 page 22
price series does not conform to a random walk [that is, -1 < ϕ < 1] the stationarity suggests that there
are commodity arbitrage possibilities that are not being exploited. The AR(1) time series that are non-
stationary are stationary in their first differences:
∆Y t = α + ρ Yt-1 + e t
where ρ = 1 − ϕ
If two price series have unit roots but some linear combination of them is stationary then the series are
cointegrated and there is an equilibrium long run relationship between them. Alternatively, if the series are
not cointegrated then the equilibrium error will have a trend and become increasing large over time.
Appendix A Table 2 gives the results of the Johansen cointegration test for the Liverpool and London
prices taken pair-wise. In all the pair-wise cases there is at least one cointegration equation at the one per
cent level of confidence. That is we can state that the Liverpool and London commodity markets were
linked by some long run equilibrium relationship in each of the three commodity groups and in wheat and
flour during the time period 1850 – 1871.
While the link between the two markets is confirmed in all cases the cointegration gives no direct
information about the short-run dynamics or degrees of responsiveness of one market to the other. In
order to test how quickly the market prices respond to one another a Vector Error Correction model (VEC)
is specified. The VEC is a restricted Vector Autocorrelation Regression (VAR) that restricts the
endogenous variables to converge to their cointegrating relationship while allowing for a variety of short-
run dynamics. Here a two period lag and no trend are specified. The VEC takes the form:
∆Yt = α + λe t-1 + γ0 ∆Yt-1 + γ1∆Yt-2 + ω0 ∆X t-1 + ω1 ∆X t-2 + εt
where λe t-1 is the equilibrium error term.
The resulting VEC equations permit 'impulse tests'. The impulse test traces the shock of one
standard deviation to one of the innovations (shocks) on current and future values of the endogenous
variables. The impulse tests for the Liverpool - London commodity group price indices are given in Figure
8 and for wheat and flour in Figure 11 for an adjustment period of 18 months. In all four cases the
adjustment in one market to price shocks in the other was rapid. As noted in the body of the paper,
adjustment began immediately. The impulse response diagrams are interpreted by inspection of how long
it takes for the tested variable to become flat.

Paterson/Shearer Liverpool May 2001 page 23
APPENDIX A TABLE 1. AUGMENTED DICKEY -FULLER UNIT ROOT TESTS.
ADF TestStatistic
Comparable Commodity GroupsLiverpool - Processed Food & Oil -2.7125London - Processed Food & Oil -2.5372Liverpool - Timber -3.3972London - Timber -2.4886Liverpool - Iron -2.0337London - Iron -3.2265
Comparable CommoditiesLiverpool – English Red Wheat -2.2364London – Norfolk (Linc. & Yorkshire Red Wheat -2.4042London – Best-London Milled Flour -2.2468
The critical values are calculated from MacKinnon (1996). They are: -3.4572 (1 % level of confidence) and -2.8728(5% level of confidence) for 259 observations after endpoint adjustment.
APPENDIX A TABLE 2. JOHANSEN COINTEGRATION TESTS OF LIVERPOOL – LONDON PRICES,
MONTHLY, 1850 – 1871.
Price Indices # of Cointegration Eigenvalue Likelihood Critical ValueEquations Ratio 5 Per Cent 1 Per Cent
London - TimberLiverpool - Timber
None 0.065923 24.54732 15.41 20.04At least one 0.026231 6.884502 3.76 6.65
London - IronLiverpool - Iron
None 0.043348 18.98623 15.41 20.04At least one 0.028574 7.508563 3.76 6.65
London - Proc. FoodstuffLiverpool - Proc. Foodstuff
None 0.03646 16.39488 15.41 20.04At least one 0.02582 6.77528 3.76 6.65
London – Norfolk Red WheatLiverpool - English Red Wheat
None 0.09588 20.40325 15.41 20.04At least one 0.02135 5.90451 3.76 6.65
London – Best London-Milled FlourLiverpool – English Red Wheat
None 0.07624 25.81042 15.41 20.04At least one 0.02014 5.2699 3.76 6.65
Lags = 1,4. Estimated with intercept and no trend with 259 observations after endpoint adjustment.

Paterson/Shearer Liverpool Prices May 2001 Page 24
Appendix B. The Liverpool Price Index, Monthly, 1850 – 1871.Average of 1850 =100
[1] All Commodities [2] Agricultural Commodities [3] Processed Foodstuffs and Oil[4] Timber, Lumber & Naval Stores [5] Metal Products [6] Raw Cotton
[1] [2] [3] [4] [5] [6]
Jan-50 100.37 99.19 98.99 101.76 105.03 90.29Feb-50 99.71 98.89 99.10 99.55 105.03 89.40Mar-50 98.56 96.67 98.81 98.09 105.03 86.94Apr-50 99.22 97.54 97.78 99.12 105.03 93.57May-50 100.04 100.29 96.12 99.55 105.03 97.73Jun-50 99.75 100.33 95.51 98.91 105.03 97.73Jul-50 99.67 102.36 100.20 99.64 93.97 106.83Aug-50 99.98 101.31 100.02 101.06 93.97 111.83Sep-50 99.43 99.74 101.11 100.29 93.97 107.64Oct-50 99.92 100.21 103.34 100.03 93.97 106.83Nov-50 99.57 100.28 103.35 99.43 93.97 102.66Dec-50 101.56 100.97 103.69 101.51 98.48 108.44Jan-51 101.69 102.00 103.80 101.16 99.24 104.36Feb-51 101.83 101.62 103.69 103.04 100.33 96.89Mar-51 101.54 104.29 99.44 103.23 99.38 99.35Apr-51 100.83 104.51 98.99 102.88 98.21 93.43May-51 99.17 106.06 96.80 100.92 97.14 80.25Jun-51 98.91 107.66 94.07 101.33 96.06 81.90Jul-51 98.98 111.89 93.46 100.15 96.06 69.58Aug-51 96.95 104.81 92.66 99.54 94.99 71.24Sep-51 96.83 104.43 91.81 99.33 94.53 75.34Oct-51 95.21 103.26 89.29 97.89 94.33 70.37Nov-51 94.61 103.45 88.04 99.09 92.42 68.75Dec-51 94.74 105.62 86.91 98.87 92.88 67.09Jan-52 94.17 110.57 82.61 98.49 94.17 65.44Feb-52 94.92 115.48 81.15 98.49 93.69 67.91Mar-52 95.16 114.35 82.24 98.72 93.10 71.22Apr-52 95.64 117.72 81.21 98.49 93.65 71.22May-52 97.14 120.29 83.09 98.04 94.90 76.14Jun-52 98.37 122.59 83.54 98.04 96.97 79.51Jul-52 98.94 119.77 86.21 98.72 98.45 79.51Aug-52 99.39 118.26 84.77 99.52 102.43 81.97Sep-52 100.80 118.38 84.96 99.24 110.11 81.97Oct-52 103.47 121.29 85.09 99.83 118.86 83.63Nov-52 106.19 124.66 86.60 101.75 122.78 81.16Dec-52 109.78 129.24 86.95 101.54 140.49 77.85Jan-53 115.96 128.05 93.69 110.08 156.61 78.66Feb-53 115.46 128.09 93.19 110.88 150.85 81.97Mar-53 115.84 123.55 94.69 113.18 153.99 80.31Apr-53 115.49 124.57 95.18 115.34 142.68 86.15May-53 114.10 123.89 92.80 115.80 139.44 83.66Jun-53 114.12 125.14 92.75 116.27 135.64 86.94Jul-53 114.82 130.81 91.59 115.80 133.91 86.94Aug-53 114.94 130.14 90.52 115.65 139.87 82.00Sep-53 119.39 138.35 90.60 123.59 142.95 84.49Oct-53 126.24 151.68 93.55 137.26 142.95 83.66Nov-53 128.04 153.39 96.01 140.00 143.43 83.66Dec-53 129.61 152.85 98.02 141.63 147.60 83.66Jan-54 131.94 162.97 99.97 139.21 148.11 85.29Feb-54 132.18 160.25 101.43 139.85 147.69 82.84Mar-54 133.08 153.61 101.76 143.94 149.75 82.82Apr-54 135.89 159.56 102.18 146.29 150.39 81.97May-54 136.54 162.04 100.55 148.55 150.39 82.82Jun-54 133.87 162.27 96.88 143.79 152.40 82.82Jul-54 130.98 152.65 94.97 140.30 157.11 82.82Aug-54 128.59 149.84 97.87 130.19 155.79 81.16Sep-54 125.54 145.04 96.26 127.47 152.81 79.51Oct-54 126.46 150.40 97.32 126.61 150.85 79.51Nov-54 127.74 158.88 99.87 124.61 146.70 79.51Dec-54 125.04 161.72 97.53 119.91 142.86 74.54Jan-55 123.59 157.59 97.95 119.91 140.65 70.41Feb-55 121.78 160.92 96.88 117.30 133.36 72.06Mar-55 120.16 161.23 97.51 115.33 130.89 70.41
[1] [2] [3] [4] [5] [6]
Apr-55 120.49 161.31 98.10 115.33 130.89 72.06May-55 121.24 166.44 95.06 116.24 126.09 82.82Jun-55 122.33 166.99 95.91 114.53 130.90 92.76Jul-55 124.55 166.63 101.66 115.84 133.65 91.95Aug-55 123.85 164.74 105.99 112.98 130.08 91.11Sep-55 124.49 165.25 109.89 112.98 130.08 85.22Oct-55 129.94 168.39 114.48 114.86 147.02 80.25Nov-55 131.01 172.19 115.81 116.10 145.48 79.45Dec-55 129.29 170.09 111.44 116.44 143.29 80.31Jan-56 128.49 171.55 104.47 120.52 142.66 77.85Feb-56 126.50 163.90 99.69 119.66 147.10 82.84Mar-56 127.71 164.09 99.49 124.44 147.10 86.09Apr-56 128.62 164.28 102.34 123.62 147.10 89.46May-56 127.63 165.75 100.24 121.56 147.10 87.74Jun-56 127.37 165.59 103.21 118.30 147.10 85.32Jul-56 127.84 167.78 105.09 118.30 142.12 90.29Aug-56 127.49 163.11 105.69 119.74 142.12 90.29Sep-56 126.90 154.82 107.93 119.72 142.12 92.72Oct-56 128.33 158.15 106.41 123.64 142.11 94.43Nov-56 126.75 152.79 104.68 123.34 142.11 95.23Dec-56 126.75 153.28 108.26 119.34 142.11 95.23Jan-57 129.65 163.50 115.42 112.99 144.56 101.81Feb-57 129.39 161.37 114.97 111.68 145.37 109.29Mar-57 129.41 164.63 114.37 110.11 145.56 108.49Apr-57 130.48 164.63 118.00 110.78 145.74 107.57May-57 132.67 166.49 117.62 117.50 144.70 110.89Jun-57 132.54 172.02 116.58 115.22 142.97 109.33Jul-57 132.34 172.87 117.11 111.58 143.27 114.30Aug-57 131.53 173.57 114.97 110.26 144.90 113.46Sep-57 130.34 172.70 109.18 109.96 145.23 124.24Oct-57 128.38 170.25 105.27 109.45 143.77 123.40Nov-57 116.75 155.90 98.58 95.89 137.64 91.11Dec-57 115.25 152.24 97.53 95.12 137.31 87.79Jan-58 116.32 143.08 96.85 105.11 142.73 91.11Feb-58 113.68 139.59 97.62 101.66 132.40 98.57Mar-58 113.63 138.62 97.59 103.21 132.40 94.43Apr-58 113.80 141.96 95.75 105.89 127.64 95.26May-58 113.98 141.00 98.76 104.68 126.55 96.89Jun-58 112.08 136.60 99.17 102.19 124.70 95.26Jul-58 111.02 137.46 98.93 98.76 123.24 97.69Aug-58 111.55 137.50 98.34 100.98 123.24 98.49Sep-58 111.32 135.99 98.14 101.66 121.97 101.05Oct-58 110.95 135.48 96.55 101.77 122.51 98.49Nov-58 109.45 130.62 94.72 101.77 122.95 96.89Dec-58 108.58 129.65 95.12 99.15 123.48 94.43Jan-59 107.85 132.74 90.65 98.73 123.65 94.30Feb-59 107.72 134.31 92.96 95.73 123.65 91.92Mar-59 109.46 133.75 93.40 100.34 123.65 99.18Apr-59 110.29 139.72 93.56 99.35 123.79 98.49May-59 113.60 156.01 93.12 100.34 123.77 97.62Jun-59 112.14 150.23 94.73 97.02 121.94 104.94Jul-59 111.89 147.27 96.22 97.12 121.94 103.14Aug-59 111.47 142.04 99.72 96.60 121.96 101.62Sep-59 109.62 137.29 96.93 94.45 125.25 100.07Oct-59 109.95 137.48 97.41 94.94 124.17 103.52Nov-59 112.74 146.37 94.70 102.74 123.61 97.75Dec-59 112.83 145.54 96.86 102.42 124.31 94.43Jan-60 112.72 139.15 100.49 103.24 123.77 96.03Feb-60 114.83 148.57 101.88 104.39 123.51 90.58Mar-60 116.56 152.30 104.05 104.68 123.12 95.23Apr-60 117.03 154.52 104.94 104.28 122.81 95.23May-60 117.40 157.18 103.32 104.48 122.81 98.49Jun-60 116.93 157.08 103.32 104.04 122.00 96.83

Paterson/Shearer Liverpool Prices May 2001 Page 25
[1] [2] [3] [4] [5] [6]
Jul-60 116.50 155.37 103.88 104.24 121.30 94.30Aug-60 116.61 160.18 104.06 101.32 121.30 94.30Sep-60 116.21 157.25 103.80 101.93 122.39 92.76Oct-60 115.88 157.90 102.30 102.12 122.09 96.08Nov-60 117.51 155.86 102.35 106.91 121.83 100.20Dec-60 116.12 152.60 100.62 107.79 120.90 98.49Jan-61 116.48 154.95 97.22 109.46 121.17 101.01Feb-61 114.34 152.94 96.03 107.71 117.55 95.26Mar-61 112.68 151.28 94.04 105.97 116.23 100.20Apr-61 113.10 152.67 93.47 106.29 118.05 98.49May-61 115.35 152.38 97.65 107.71 118.74 110.99Jun-61 112.86 147.71 95.46 104.02 117.85 113.48Jul-61 111.06 146.87 95.46 99.67 116.57 112.61Aug-61 110.25 141.17 95.86 99.68 115.43 118.43Sep-61 110.33 145.15 95.06 97.05 111.71 138.34Oct-61 112.49 148.85 96.28 95.86 113.11 162.36Nov-61 112.61 150.22 95.58 94.15 113.25 168.99Dec-61 115.11 156.10 95.24 100.31 113.64 162.35Jan-62 115.99 154.49 95.16 100.97 113.64 182.21Feb-62 116.05 149.32 93.84 105.74 113.32 183.83Mar-62 115.13 146.56 94.51 105.32 113.32 173.13Apr-62 114.28 143.91 94.70 103.23 111.76 183.83May-62 113.81 139.97 95.88 103.38 112.91 176.35Jun-62 113.17 137.34 94.91 103.18 111.19 190.46Jul-62 112.61 133.53 94.68 99.04 111.83 232.89Aug-62 113.06 132.80 95.32 97.51 111.49 271.63Sep-62 117.54 132.78 96.11 104.21 112.64 351.23Oct-62 117.81 130.17 97.88 101.30 116.93 370.87Nov-62 116.81 128.88 96.95 103.91 116.36 331.08Dec-62 116.16 122.04 100.73 105.16 115.26 348.58Jan-63 117.34 127.28 99.59 105.60 114.92 344.35Feb-63 116.59 126.59 100.47 105.17 113.84 322.86Mar-63 115.73 124.70 99.81 104.04 113.95 324.65Apr-63 115.56 122.56 100.68 103.88 114.37 324.65May-63 116.46 125.13 102.36 103.92 114.17 319.71Jun-63 115.46 122.20 102.15 103.55 114.24 311.40Jul-63 114.67 119.72 101.67 101.50 116.81 311.40Aug-63 116.55 120.42 101.69 103.09 119.51 324.65Sep-63 116.81 117.39 101.26 102.37 124.09 361.16Oct-63 119.17 116.18 102.11 106.25 127.06 390.99Nov-63 119.73 118.46 103.05 105.95 128.13 369.45Dec-63 118.92 117.82 100.87 106.24 128.13 354.53Jan-64 121.11 114.68 100.92 107.97 137.45 374.41Feb-64 121.39 117.52 98.66 108.70 136.96 374.41Mar-64 125.62 124.77 100.75 116.22 135.70 366.11Apr-64 124.19 122.06 103.68 111.05 134.86 367.78May-64 123.44 121.43 102.42 111.99 132.23 367.78Jun-64 123.39 121.73 104.30 109.56 129.80 395.96Jul-64 123.32 126.88 102.17 106.83 126.56 432.38Aug-64 122.06 125.26 99.07 106.81 127.38 424.07Sep-64 117.37 122.86 95.19 102.42 126.41 384.31Oct-64 115.26 121.87 91.87 102.25 125.98 337.91Nov-64 114.73 120.19 90.83 102.27 123.84 371.05Dec-64 114.79 119.59 90.63 103.72 123.02 371.05Jan-65 113.45 122.48 86.49 104.47 120.04 328.02Feb-65 112.46 122.81 86.17 106.24 119.61 268.21Mar-65 110.30 121.82 85.46 103.53 119.93 231.94Apr-65 109.57 122.36 85.06 103.09 120.36 205.33May-65 111.07 121.54 86.71 105.38 119.50 218.59Jun-65 111.22 122.24 86.62 101.17 119.28 260.74Jul-65 111.37 122.65 86.59 101.19 119.68 260.10Aug-65 113.77 128.03 90.67 100.71 119.68 246.85Sep-65 115.36 127.22 92.95 103.12 119.00 270.98Oct-65 120.54 131.64 92.46 110.11 121.26 334.65Nov-65 121.99 135.95 94.45 111.84 123.60 285.73Dec-65 125.32 135.01 95.02 122.19 124.25 301.51Jan-66 126.13 144.71 96.75 116.87 124.25 279.98Feb-66 125.88 142.99 96.91 119.10 123.34 266.69Mar-66 128.06 145.52 99.73 122.10 121.82 278.25
[1] [2] [3] [4] [5] [6]
Apr-66 124.68 144.19 97.59 118.49 122.40 218.59May-66 119.95 143.54 95.95 111.03 121.37 195.24Jun-66 121.49 148.33 94.28 114.44 118.71 195.24Jul-66 118.30 145.75 82.56 114.55 118.71 207.03Aug-66 117.27 145.53 83.25 110.27 118.29 207.03Sep-66 118.96 149.14 84.84 110.58 119.79 203.72Oct-66 118.73 153.29 79.17 112.13 118.53 223.61Nov-66 120.11 155.26 83.43 113.01 117.54 209.45Dec-66 118.99 150.62 83.10 113.69 115.98 210.35Jan-67 118.97 159.81 84.02 107.91 111.62 221.98Feb-67 119.88 158.16 84.69 111.06 115.06 200.40Mar-67 119.44 159.94 83.80 110.19 115.25 193.49Apr-67 119.59 164.26 83.42 111.03 113.50 178.81May-67 120.01 165.00 87.21 110.66 113.50 158.49Jun-67 119.92 164.56 86.70 109.66 113.50 170.44Jul-67 118.12 166.27 84.79 104.29 112.58 172.17Aug-67 117.82 166.90 84.77 103.88 112.09 168.96Sep-67 116.59 167.70 84.85 104.20 112.23 135.81Oct-67 115.58 168.95 84.72 104.11 112.01 114.21Nov-67 115.66 170.80 84.76 101.59 112.18 125.87Dec-67 114.29 171.08 82.51 102.41 112.39 107.68Jan-68 114.46 168.45 81.85 105.85 110.13 110.99Feb-68 115.99 169.89 81.86 106.16 109.58 137.50Mar-68 117.42 172.92 83.68 106.15 110.19 142.44Apr-68 121.11 175.59 88.60 107.80 109.58 175.61May-68 120.02 172.87 87.52 107.68 109.58 168.96Jun-68 117.01 161.48 86.32 106.30 109.05 167.26Jul-68 115.13 158.69 85.74 101.93 109.46 167.26Aug-68 113.64 157.15 83.10 101.94 109.32 157.31Sep-68 116.20 165.89 83.01 104.57 112.14 149.07Oct-68 116.49 165.01 82.77 104.94 112.87 155.70Nov-68 115.83 160.58 82.68 104.81 113.82 155.70Dec-68 115.93 158.40 85.21 104.57 113.76 150.75Jan-69 115.44 154.44 81.53 107.47 114.17 159.87Feb-69 115.63 152.93 81.82 107.56 114.17 168.96Mar-69 115.37 146.92 84.23 107.27 114.76 172.27Apr-69 116.08 145.33 87.15 107.27 114.24 178.90May-69 114.64 142.87 85.20 106.35 113.96 177.20Jun-69 114.17 143.34 84.76 106.48 113.96 163.00Jul-69 112.79 137.44 83.69 106.60 113.46 167.32Aug-69 113.10 138.45 83.65 107.16 112.25 168.96Sep-69 116.27 150.05 84.38 108.29 112.44 173.95Oct-69 115.56 148.88 84.56 107.40 112.66 160.70Nov-69 116.71 148.69 83.09 108.37 119.41 155.70Dec-69 115.92 147.89 81.26 108.18 120.03 154.07Jan-70 113.34 135.73 81.81 107.99 118.56 154.90Feb-70 112.28 132.03 81.95 107.79 118.06 151.62Mar-70 112.90 132.03 84.48 107.40 119.19 149.51Apr-70 112.71 134.58 82.53 106.96 120.56 149.51May-70 112.68 136.47 81.25 107.60 120.30 145.78Jun-70 112.20 136.11 80.23 107.45 121.34 136.68Jul-70 111.16 133.67 80.08 107.87 122.82 119.97Aug-70 114.02 136.65 79.42 110.39 122.26 162.33Sep-70 112.28 138.35 78.20 109.14 122.17 130.87Oct-70 115.64 145.91 82.16 114.78 122.36 115.96Nov-70 117.35 148.25 84.14 115.51 122.77 122.15Dec-70 117.57 154.03 83.26 115.51 122.03 113.48Jan-71 119.60 163.22 84.70 115.41 122.18 110.99Feb-71 118.53 159.21 84.55 116.20 122.05 105.95Mar-71 118.63 163.22 85.08 114.35 121.72 103.87Apr-71 116.91 160.09 83.83 113.51 121.72 98.57May-71 116.10 156.98 83.40 112.50 121.69 104.37Jun-71 115.78 150.81 82.63 113.05 122.47 115.44Jul-71 115.47 147.90 81.85 114.20 122.00 120.93Aug-71 115.52 146.73 82.08 113.52 123.81 119.27Sep-71 117.75 146.24 83.87 115.86 127.37 126.74Oct-71 118.21 140.99 84.83 117.42 131.56 127.56Nov-71 119.57 147.05 85.87 115.98 132.05 128.80Dec-71 122.79 146.46 86.32 119.51 144.03 133.68