annuity market trends and...
TRANSCRIPT

5/1/2012
1
Joseph Montminy Assistant Vice President, LIMRA
Chris Raham
Senior Actuarial Advisor, Ernst & Young
This publication is a benefit of LIMRA membership. No part may be shared with other organizations
or reproduced in any form without LIMRA’s written permission.
Annuity Market – Trends and
Opportunities
© LL Global, Inc.SM
• Individual Annuity Market Trends
• Sales by product type
• Distribution Channels
• Drivers of Sales
• Who is Buying Guaranteed Lifetime Income products
• Annuity Assets
• Sales Forecast
Agenda
2

5/1/2012
2
© LL Global, Inc.SM 3
Annuity Sales
© LL Global, Inc.SM
Total Individual Annuity Sales Rebound
111 117 130 133 137 160
184 156
128 141 159
74
103 89 88 79
78
73 109
111 82
81 $185
$220 $219 $221 $216
$239
$257 $265
$239
$222
$240
2001 2002 2003 2004 2005 2006 2007 2008 2009 2010 2011
Fixed Variable
Source: LIMRA, U.S. Individual Annuities survey.
Do
lla
rs in
Bil
lio
ns
4
5/1/2012
3
© LL Global, Inc.SM
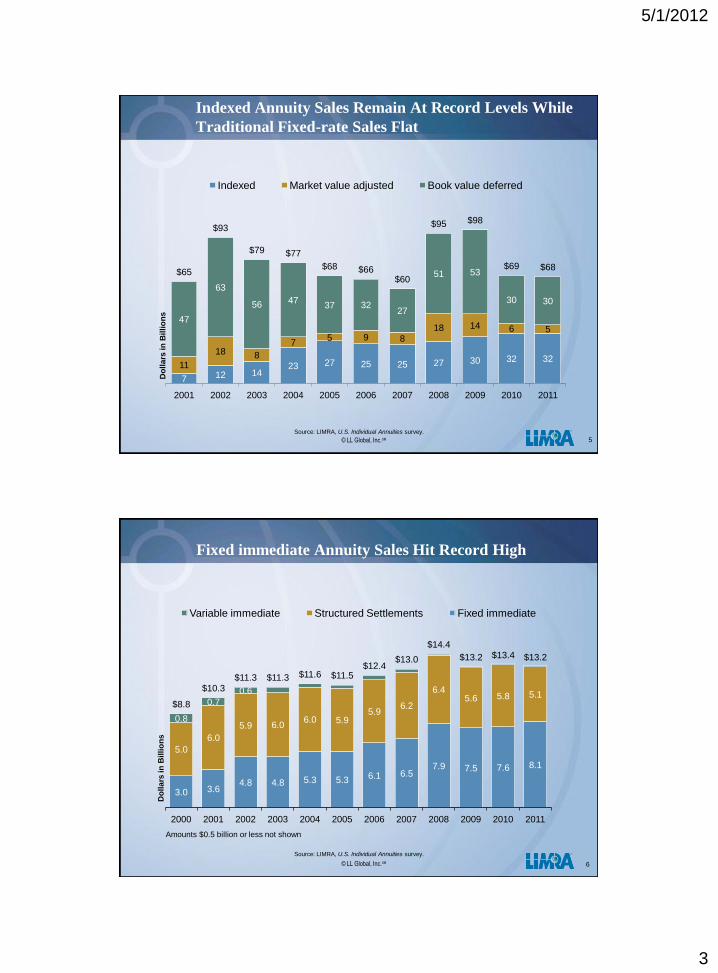
Indexed Annuity Sales Remain At Record Levels While
Traditional Fixed-rate Sales Flat
7 12 14 23 27 25 25 27 30 32 32
11
18 8
7 5 9 8
18 14 6 5 47
63
56 47 37 32
27
51 53
30 30
$65
$93
$79 $77
$68 $66 $60
$95 $98
$69 $68
2001 2002 2003 2004 2005 2006 2007 2008 2009 2010 2011
Indexed Market value adjusted Book value deferred
Source: LIMRA, U.S. Individual Annuities survey.
Do
lla
rs in
Billi
on
s
5
© LL Global, Inc.SM
Fixed immediate Annuity Sales Hit Record High
3.0 3.6 4.8 4.8 5.3 5.3 6.1 6.5
7.9 7.5 7.6 8.1
5.0
6.0
5.9 6.0 6.0 5.9
5.9 6.2
6.4 5.6 5.8 5.1
0.8
0.7
0.6
$8.8
$10.3 $11.3 $11.3 $11.6 $11.5
$12.4 $13.0
$14.4
$13.2 $13.4 $13.2
2000 2001 2002 2003 2004 2005 2006 2007 2008 2009 2010 2011
Variable immediate Structured Settlements Fixed immediate
Source: LIMRA, U.S. Individual Annuities survey.
Do
lla
rs in
Billi
on
s
6
Amounts $0.5 billion or less not shown

5/1/2012
4
© LL Global, Inc.SM 7
Distribution Channels
© LL Global, Inc.SM
Independent B-Ds Retain Market Share Among VA
Distribution Channels
29% 31% 32% 33% 33%
21% 18% 18% 18% 19%
14% 12% 10% 11% 12%
21% 23% 24% 24% 24%
9% 10% 12% 12% 11%
0%
20%
40%
60%
80%
100%
2007 2008 2009 2010 2011
Independent B-D Full Service Nat'l B-D Banks
Career Independent Agents Direct
Source: LIMRA, U.S. Individual Annuities survey.
8
5/1/2012
5
© LL Global, Inc.SM
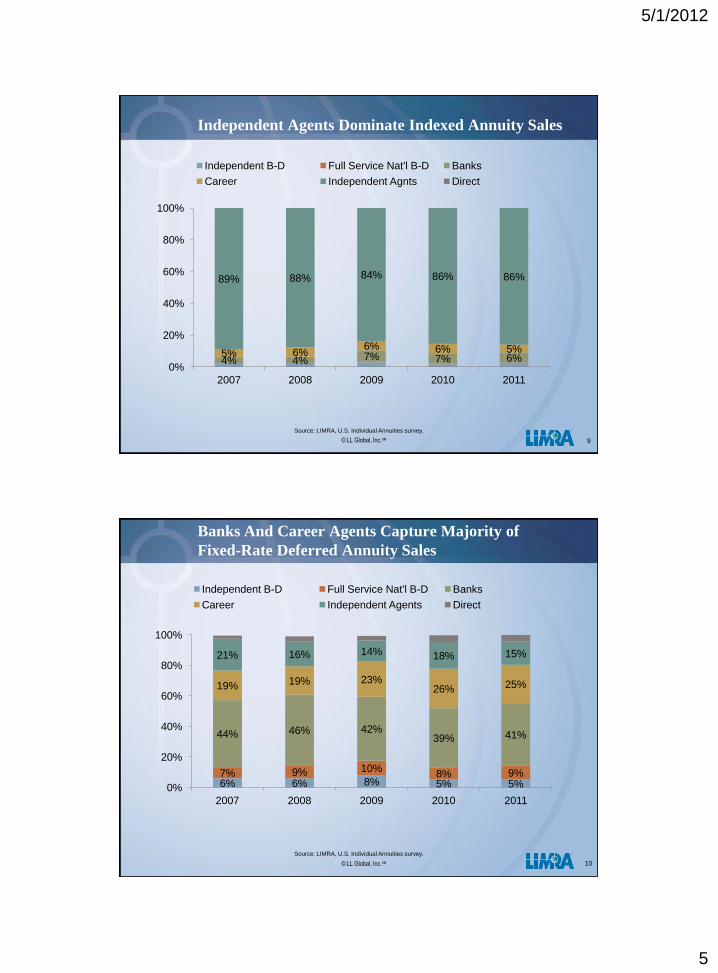
Independent Agents Dominate Indexed Annuity Sales
4% 4% 7% 7% 6% 5% 6% 6% 6% 5%
89% 88% 84% 86% 86%
0%
20%
40%
60%
80%
100%
2007 2008 2009 2010 2011
Independent B-D Full Service Nat'l B-D Banks
Career Independent Agnts Direct
Source: LIMRA, U.S. Individual Annuities survey.
9
© LL Global, Inc.SM
Banks And Career Agents Capture Majority of
Fixed-Rate Deferred Annuity Sales
6% 6% 8% 5% 5% 7% 9% 10%
8% 9%
44% 46% 42% 39% 41%
19% 19% 23% 26% 25%
21% 16% 14% 18% 15%
0%
20%
40%
60%
80%
100%
2007 2008 2009 2010 2011
Independent B-D Full Service Nat'l B-D Banks
Career Independent Agents Direct
Source: LIMRA, U.S. Individual Annuities survey.
10

5/1/2012
6
© LL Global, Inc.SM
Full Service National Broker-Dealers Gain
Immediate Annuity Market Share
6% 9% 10% 8% 8%
12% 10% 15% 19% 22% 8% 9%
14% 14% 15% 26%
30%
34% 32% 31%
35% 33%
19% 21% 19%
0%
20%
40%
60%
80%
100%
2007 2008 2009 2010 2011
Independent B-D Full Sevice Nat'l B-D Banks
Career Independent Agents Direct
Source: LIMRA, U.S. Individual Annuities survey.
11
© LL Global, Inc.SM 12
Drivers of Sales

5/1/2012
7
© LL Global, Inc.SM
GLBs Drive VA Sales
2011 VA New Sales
In Billions
Source: LIMRA, Variable Annuity Guaranteed Living Benefit Election Tracking Survey.
GLB Not Available
$13 B 11%
GLB Not Elected $13 B 12%
GLB Elected $96 B 88%
GLB Available $109 B
89%
VA GLB Election Rates
(When Any GLB Available)
25% 29% 25%
15% 17% 17% 17% 18% 16% 17% 22% 27% 26%
57% 55%
59%
69% 64% 64% 64% 65% 65% 65%
61% 57% 59%
89% 90% 89% 89% 87% 87% 88% 89% 87% 88% 88% 88% 90%
4Q '08
1Q '09
2Q '09
3Q '09
4Q '09
1Q '10
2Q '10
3Q '10
4Q '10
1Q '11
2Q '11
3Q '11
4Q '11
Hybrid GLB GMWB GMAB GMIB GLWB
13
© LL Global, Inc.SM
Indexed GLWB Election Rates Are Strong
Source: LIMRA, Indexed Annuity Guaranteed Lifetime Withdrawal Benefit Elections Survey.
Indexed Annuity GLWB Election Rates
(when available)
GLWB Not Available
$3.1 B 13%
GLWB Available - Not Elected
$7.3 B 34%
GLWB Available -
GLB Elected $14.0 B
66%
GLWB Available $21.3 B
87%
2011 Indexed New Sales
In Billions
14
69%
67%
62%
64%
70%
Q4 2010 Q1 2011 Q2 2011 Q3 2011 Q4 2011
Data is based on survey results from 21 companies representing 71 percent of industry sales.
5/1/2012
8
© LL Global, Inc.SM
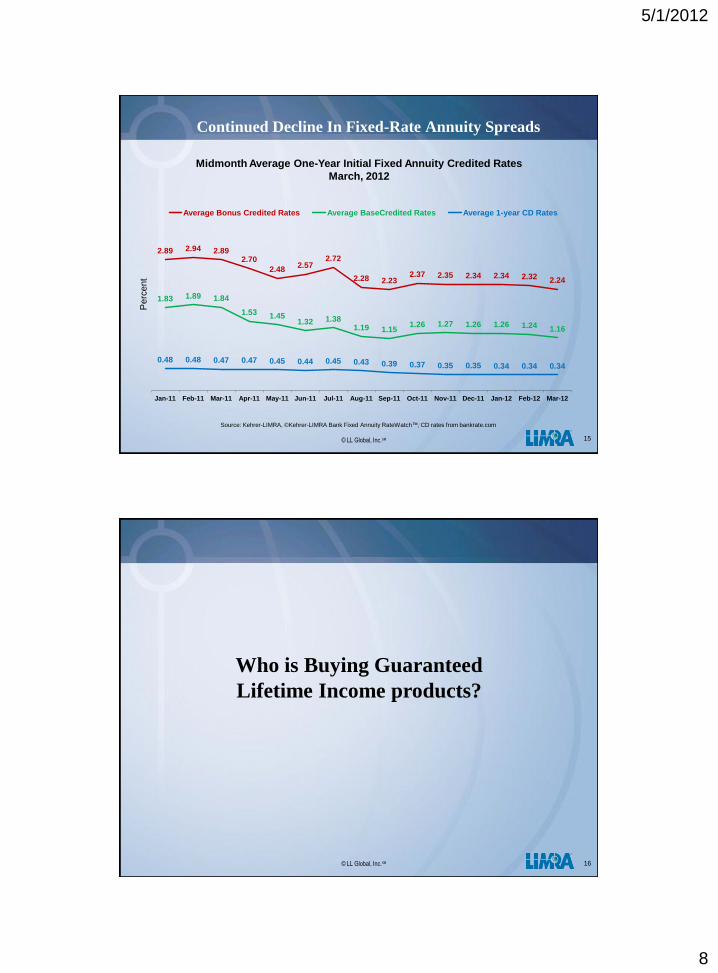
Continued Decline In Fixed-Rate Annuity Spreads
2.89 2.94 2.89 2.70
2.48 2.57
2.72
2.28 2.23 2.37 2.35 2.34 2.34 2.32 2.24
1.83 1.89 1.84
1.53 1.45 1.32 1.38
1.19 1.15 1.26 1.27 1.26 1.26 1.24 1.16
0.48 0.48 0.47 0.47 0.45 0.44 0.45 0.43 0.39 0.37 0.35 0.35 0.34 0.34 0.34
Jan-11 Feb-11 Mar-11 Apr-11 May-11 Jun-11 Jul-11 Aug-11 Sep-11 Oct-11 Nov-11 Dec-11 Jan-12 Feb-12 Mar-12
Average Bonus Credited Rates Average BaseCredited Rates Average 1-year CD Rates
Perc
ent
Source: Kehrer-LIMRA, ©Kehrer-LIMRA Bank Fixed Annuity RateWatch™; CD rates from bankrate.com
Midmonth Average One-Year Initial Fixed Annuity Credited Rates
March, 2012
15
© LL Global, Inc.SM 16
Who is Buying Guaranteed
Lifetime Income products?

5/1/2012
9
© LL Global, Inc.SM
0.0%
1.0%
2.0%
3.0%
4.0%
5.0%
6.0%
Age 30 35 40 45 50 55 60 65 70 75 80 85
Age of Buyer
GLWB GMIB GMWB GMAB
Note: Based on 392,827 GLWB contracts,128,683 GMIB contracts, 12,642 GMWB contracts and 36,217 GMAB contracts issued in 2010 and still in force at the end of the year.
17
Percent of buyers by age
% of buyers under age 65
GLWB 70%
GMIB 75%
GMWB 58%
GMAB 85%
VA GLWBs And GMIBs Have Similar Buyer Profiles
Source: Guaranteed Living Benefit Utilization Study – 2010 Data, LIMRA 2012.
© LL Global, Inc.SM
GLWBs And Income Annuities – Two Separate Markets
0.0%
2.0%
4.0%
6.0%
30 35 40 45 50 55 60 65 70 75 80 85 90 95
Age of Buyer
VA w/ GLWB
Income Annuity
Source: Guaranteed Living Benefit Utilization Study – 2010 Data, LIMRA 2012
Based on GLWB contracts issued in 2010
Average Age:
VA w/ GLWB 61
Income Annuity 73
Percentage of GLWB and Immediate Income Buyers by Age
Pe
rce
nt
of
bu
ye
rs
18
5/1/2012
10
© LL Global, Inc.SM
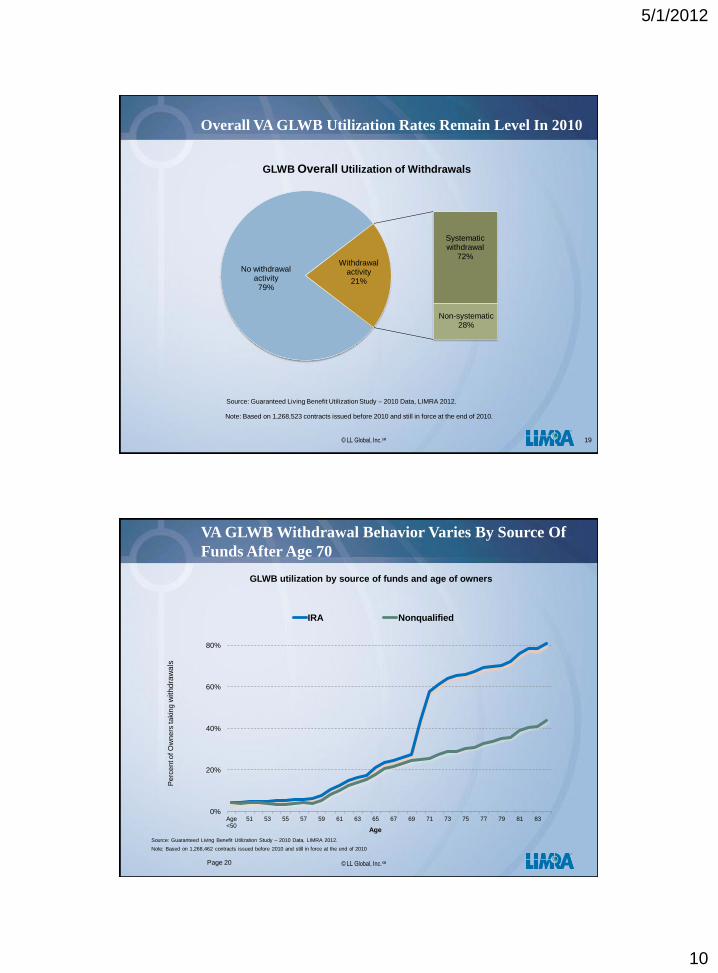
Overall VA GLWB Utilization Rates Remain Level In 2010
19
No withdrawal activity 79%
Systematic withdrawal
72%
Non-systematic 28%
Withdrawal activity 21%
Note: Based on 1,268,523 contracts issued before 2010 and still in force at the end of 2010.
GLWB Overall Utilization of Withdrawals
Source: Guaranteed Living Benefit Utilization Study – 2010 Data, LIMRA 2012.
© LL Global, Inc.SM Page 20
0%
20%
40%
60%
80%
Age <50
51 53 55 57 59 61 63 65 67 69 71 73 75 77 79 81 83
Age
IRA Nonqualified
VA GLWB Withdrawal Behavior Varies By Source Of
Funds After Age 70
GLWB utilization by source of funds and age of owners
Note: Based on 1,268,462 contracts issued before 2010 and still in force at the end of 2010
Pe
rce
nt o
f O
wn
ers
ta
kin
g w
ith
dra
wa
ls
Source: Guaranteed Living Benefit Utilization Study – 2010 Data, LIMRA 2012.
5/1/2012
11
© LL Global, Inc.SM 21
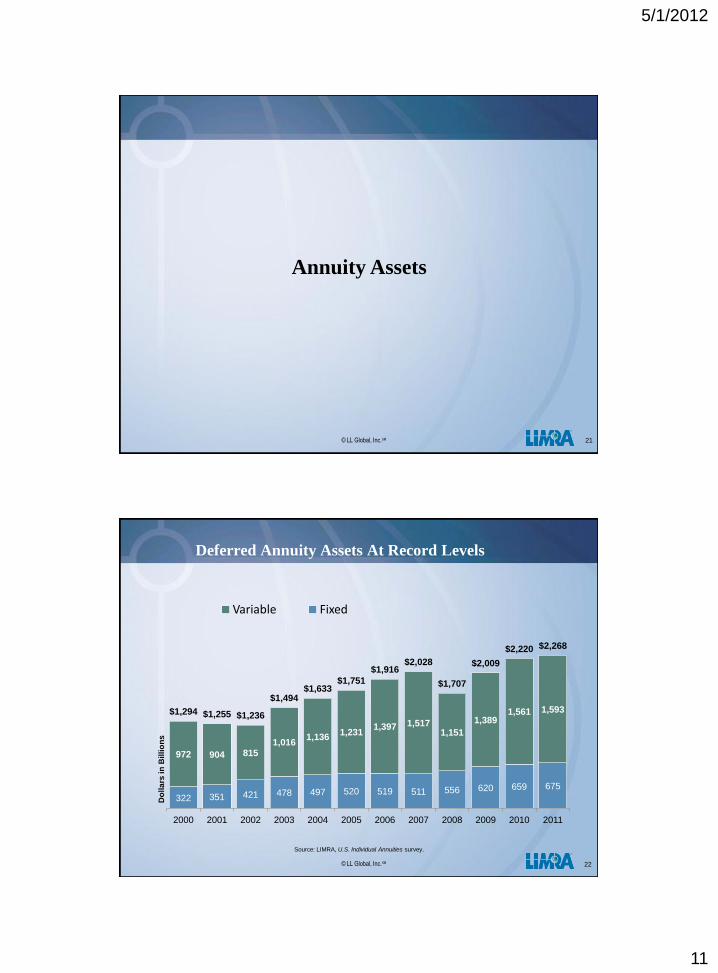
Annuity Assets
© LL Global, Inc.SM
322 351 421 478 497 520 519 511 556 620 659 675
972 904 815 1,016
1,136 1,231
1,397 1,517 1,151
1,389 1,561 1,593 $1,294 $1,255 $1,236
$1,494 $1,633
$1,751
$1,916 $2,028
$1,707
$2,009
$2,220 $2,268
2000 2001 2002 2003 2004 2005 2006 2007 2008 2009 2010 2011
Variable Fixed
Do
lla
rs in
Bil
lio
ns
Source: LIMRA, U.S. Individual Annuities survey.
Deferred Annuity Assets At Record Levels
22

5/1/2012
12
© LL Global, Inc.SM
Annuity Surrenders Decreasing Or Flat
7.5%
7.2%
5.9%
7.6%
8.2%
5.1%
7.1%
7.8%
5.6%
4%
5%
6%
7%
8%
9%
Q1 '09 Q2 '09 Q3 '09 Q4 '09 Q1 '10 Q2 '10 Q3 '10 Q4 '10 Q1 '11 Q2 '11 Q3 '11 Q4 '11
Variable Indexed Book-value/MVA
Source: LIMRA, U.S. Annuity Persistency.
23
Annualized Contract Surrender Rates
Note: Results based on a constant group of 55 companies.
© LL Global, Inc.SM
GLWB Surrender Rates Are The Lowest Among All GLBs
Source: LIMRA, Variable Annuity Guaranteed Living Benefit Election
Tracking Survey.
$272
$425 $454
$386
$476
$527 $521
$470
$570 $579
$439
$575
GLB assets Non-GLB assets Employer plan assets
2008 2009 2010 2011
CAGR= 29% CAGR= 1% CAGR= 8%
VA Assets by Types In Billions
VA Surrender Rates In 2010
24
Note: Surrender rates are based on contracts issued before 2010.
9.4%
4.1%
2.6%
3.9%
5.6%
8.8%
Non-GLB
With GLB
GLWB GMIB GMWB GMAB
Source: Guaranteed Living Benefit Utilization Study – 2010 Data,
LIMRA 2012.
5/1/2012
13
© LL Global, Inc.SM 25
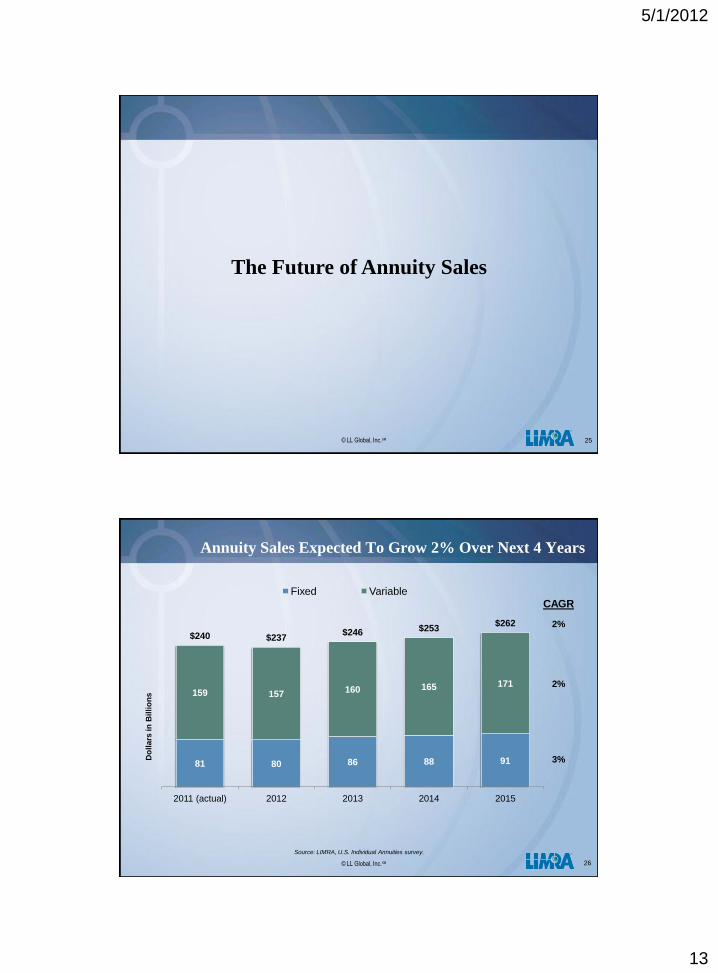
The Future of Annuity Sales
© LL Global, Inc.SM
81 80 86 88 91
159 157 160 165 171
$240 $237 $246 $253
$262
2011 (actual) 2012 2013 2014 2015
Fixed Variable
Do
lla
rs in
Bil
lio
ns
26
Annuity Sales Expected To Grow 2% Over Next 4 Years
CAGR
2%
2%
3%
Source: LIMRA, U.S. Individual Annuities survey.
