annual summary of oil and hazardous substance … and hazardous substance releases fiscal year 2009...
TRANSCRIPT

Annual Summary ofOil and Hazardous Substance ReleasesFiscal Year 2009 (July 1, 2008-June 30, 2009)
Significant Responses
Spring FloodingLocation: Yukon and Kuskokwim RiversReport Date: May 2009Product: variousQuantity: unknownCause: flooding
In May 2009, heavy snow melt and ice dams caused flooding in com-munities along the Yukon and Kuskokwim river systems, impacting several communities, damaging many homes, businesses, and public infrastructure. Many public and private drinking water systems were impacted by the flooding, as well as wastewater disposal systems, and landfills.
The primary public health and safety issues were bacteria, viruses, protozoa, and/or petroleum products in flood waters that pose a threat to drinking water wells; flooded on-site sewer systems that backed up into homes or onto the ground surface; home heating fuel tanks, propane tanks, barrels, and small fuel containers that can shift, fall, or float away and cause spills; and hazardous materials contained in flood debris.
In addition to DEC spill response personnel, staff from the Drinking Water, Waste Water, and Solid Waste programs coordinated emer-gency response actions with the Alaska Department of Military and Veterans Affairs, Division of Homeland Security and Emergency Man-agement. DEC staff and contractors recovered more than 90 drums of potential contaminants and removed at least 13,500 gallons of used oil and oily water from drums and tanks. More than 6,000 gallons of oily water was sent for disposal in Anchorage. 1400 gallons of home heating oil was filtered and returned to residents. Sorbent booms were place in drainages to the river and 7,500 gallons of used oil was distributed to communities for used oil burners.
Kuparuk DS 1L Well 22 Produced Water SpillLocation: 1L Pad, Well #22, KuparukReport Date: December 25, 2008Product: produced water, trace amount crude oilQuantity: 94,920 gallonsCause: line failure due to internal corrosion
On December 25, 2008 oil field workers witnessed an anomaly in the drill site 1L surveillance system. Upon investigation, the workers dis-covered that a quantity of produced water had spilled from a 6” water
injection well line to the reserve pit and gravel pad. The water injection well line was immediately shut in and the source was isolated.
Two teams consisting of a total of 23 spill response personnel re-sponded to the spill including the Kuparuk Spill Response Team (SRT) and Alaska Clean Seas (ACS). The SRT workers used vacuum trucks and heavy equipment to recover the produced water from the gravel pad and reserve pit. A total of 2.95 acres of snow-covered tundra and 1.83 acres of gravel pad was lightly misted with the produced water. Workers removed the contaminated snow and ice. In addition, 319 yards of contaminated gravel was trimmed from the pad surface and hauled to the grind and inject facility in Prudhoe Bay.
M/V Monarch SinkingLocation: Granite Point Platform in Central Cook InletReport Date: January 15, 2009Product: diesel, lube oilQuantity: unknownCause: vessel sinking due to hull breach caused by sea ice
When making a delivery to the Granite Point Platform, the M/V Mon-arch was pinned to the platform by sea ice and sank with approximate-ly 35,000 gallons of diesel fuel, and an unknown volume of hydraulic and lube oils. Equipment was pre-staged for response to recoverable amounts of oil that may seep from the sunken vessel. The sunken vessel was monitored using sonar until weather conditions permitted divers to assess its condition and assess other issues that may affect recovery of the vessel. As of June 13, nearly 1,000 gallons of diesel fuel has been recovered.
F/V Mar-Gun Grounding St. George IslandLocation: St. George IslandReport Date: March 5, 2009Product: dieselQuantity: unknown (approximately 18,371 gallons of fluids were re-
moved from the vessel)Cause: grounding
On March 5, 2009, the 112-foot trawler F/V Mar-Gun ran aground with five people aboard. Prior to leaving the vessel, the crew was able to transfer nearly all the diesel fuel from the double bottoms to the wing tanks. In addition, the crew was able to plug the vessel’s fuel tanks. DEC responders and the USCG Pacific Strike Team, along with a ma-rine salvage contractor responded to the incident. Response focused on removing fuel from the vessel and repairing damage to the vessel’s hull. By March 13, most of the fuel had been removed. After several delays due to weather and sea ice, the vessel was refloated May 13 and towed to Dutch Harbor. Subsistence sampling was conducted by members of the community under the guidance of Polaris Applied Sci-ences personnel.
Drift River Terminal CoordinationLocation: Drift River Terminal, West side Cook InletReport Date: March 22, 2009Product: crude oilQuantity: potential releaseCause: volcanic eruption/flooding
Mount Redoubt initially erupted on March 22, 2009 at 10:38 PM, fol-
Alaska Department of Environmental Conservation Division of Spill Prevention and Response October 2009
Spring flooding in Eagle.
continued on p. 3

2
Annual Summary of Oil and Hazardous Substance Releases (July 1, 2008-June 30, 2009)
Nikiski
Akutan
Valdez
Cook Inlet
NewhalenIliamna
PrudhoeMilne PointKuparukDeadhorse
NuiqsutAtqasuk
Chatham Strait
Chignik
Delta Junction
Eielson AFB
MP 179 Parks Hwy
Kaktovik
Kongiganak
KotzebuePS 4
WasillaMoquawkieGlennallen
Large Spills, July 1, 2008-June 30,2009
Spill Date Spill Name Location Product Total Released12/25/08 DS 1L Well 22 Kuparuk Produced Water 94,920 gal
11/03/08 DS-11, Wells 7, 8, & 38 Seawater Release Prudhoe Bay Seawater 61,626 gal07/17/08 Agrium Ammonia Nikiski Ammonia (Anhydrous) 40,013 lbs03/08/09 Teck, Pogo Mine Drainage Water Delta Junction Other 40,000 gal05/14/09 Tesoro SO2 Nikiski Sulfur (Dioxide) 33,000 lbs01/12/09 Milne Point CFP Produced Water Spill Milne Point Produced Water 24,444 gal
05/13/09 Tesoro SO2 Nikiski Sulfur (Dioxide) 20,000 lbs05/15/09 Tesoro SO2 Nikiski Sulfur (Dioxide) 14,000 lbs10/30/08 Crowley Jet Fuel Tank Failure Newhalen Kerosene 13,630 gal09/28/08 Aurora Gas Moquawkie #4 Drilling Mud West Kenai Peninsula Drilling Muds 11,000 gal07/10/08 Tesoro Refinery SO2 Nikiski Sulfur (Dioxide) 10,226 lbs12/26/08 Eielson prearranged dump zone Eielson AFB Diesel 9,500 gal03/22/09 DS-1L, Well 16 Produced Water Release Kuparuk Produced Water 9,450 gal05/22/09 Tesoro SO2 Nikiski Sulfur (Dioxide) 9,000 lbs07/21/08 Trident Seafoods Chignik Facility Fire Chignik Ammonia (Anhydrous) 8,000 lbs02/03/09 Effluent Water Injection Leak Kuparuk Process Water 6,900 gal12/04/08 Ooogaruk 6720 Drilling Mud Release North Slope Drilling Muds 6,720 gal01/15/09 M/V Monarch Sinking Cook Inlet Diesel 6,000 gal07/19/08 Agrium Shutdown P/R Nikiski Ammonia (Anhydrous) 5,900 lbs07/20/08 Agrium Shutdown P/R Nikiski Ammonia (Anhydrous) 5,900 lbs02/25/09 Tesoro Sulfur Recovery Unit Nikiski Sulfur (Dioxide) 5,855 lbs09/07/08 DS-18, Well 5 Brine Spill Prudhoe Bay Process Water 5,544 gal08/18/08 Methane Release Parks Hwy, near MP 179 Other 4,800 gal12/30/08 Big State Pup Rollover, MP 205 Richardson Hwy MP 205 Diesel 4,000 gal05/04/09 Delta Junction Sodium Cyanide 3,600 lbs01/14/09 Tesoro 01/09 SO2 release Nikiski Sulfur (Dioxide) 3,400 lbs01/02/09 Pump Station 4 Halon 3,400 lbs
Large Spills

3
Alaska Department of Environmental Conservation
Large Spills (continued)
lowed by several other eruptions, with the most significant occur-ring on April 4, 2009. The resultant lahars (or volcanic mudflows) caused extensive flooding at the Drift River Oil Terminal (DROT). However, no oil or hazardous substance releases occurred from either of the two operational tanks. No damage to the protective tertiary dike system or the individual tank secondary containment systems occurred during these significant lahar flooding events.
On April 6, 2009 the T/V Seabulk Arctic completed the transfer of approximately 60% of the crude oil from the two tanks in service at the DROT facility. Both operational tanks were ballasted with seawater as a precaution to keep the tanks from floating, if a significant flood should occur at the facility. On April 30, more crude oil was removed from the DROT tanks; and, following ad-ditional measurements and confirmation by a third party it was determined that approximately 841,860 gallons (20,040 barrels) of crude oil remained at the terminal, approximately 13% of the original volume of 6.2 million gallons.
Milne Point Module 54 Produced Water SpillLocation: Milne Point Central Facilities Pad, North SlopeReport Date: January 12, 2009Product: Produced water and crude oilQuantity: 24,444 gallonsCause: overflow of sand slurry tank when automated flow control
system failed
On January 12, 2009, Vessel 5417 at the Central Facilities Pad
in the Milne Point Unit overflowed causing produced water and crude oil to spill into secondary containment and onto the gravel pad. The sand slurry tank was manually isolated and the source controlled. All free product from the containment was removed by responders using a vacuum truck. Temporary snow berms were constructed around the spill area to reduce the possibility of offsite migration of the product. A team consisting of 9 spill response technicians, including Alaska Clean Seas personnel, responded to the spill. Vacuum trucks and heavy equipment were used to recover the produced water and crude oil from the gravel pad.
Spill Date Spill Name Location Product Total Released08/25/08 MDC 6200 gal spill Delta Junction Propylene Glycol 3,000 gal03/23/09 Tesoro SO2 Nikiski Sulfur (Dioxide) 2,769 lbs02/25/09 F/V ICY MIST grounding NW Akutan Island Akutan Diesel 2,700 gal05/28/09 Tesoro SO2 release Nikiski Sulfur (Dioxide) 2,468 lbs08/06/08 D Pad Well 22 Diesel Release Prudhoe Bay Diesel 2,310 gal09/16/08 Kaktovik Underground Piping Release Kaktovik Gasoline 2,000 gal01/30/09 M/V Lituya Grounding Chatham Strait Diesel 2,000 gal05/16/09 Tesoro SO2 Nikiski Sulfur (Dioxide) 2,000 lbs05/02/09 Millsite Kotzebue Process Water 2,000 gal01/15/09 M/V Monarch Sinking Cook Inlet Other 1,705 gal08/20/08 Atqasuk Power Plant Heating Loop Atqasuk Ethylene Glycol 1,500 gal01/23/09 1,500 gal fuel truck diesel spill Kongiganak Diesel 1,500 gal06/06/09 Pile Bay Rd Tanker Spill Iliamna Diesel 1,400 gal01/22/09 MDC Missile Field#1 1200 Gal Glycol spill Delta Junction Propylene Glycol 1,200 gal04/29/09 Nuiqsut Diesel 1,200 gal06/23/09 Pioneer Ice Damage to Dry Drill Products Prudhoe Bay Other 1,200 lbs05/15/09 Mud Cutting Containment Cel North Slope Drilling Muds 1,008 gal12/28/08 PetroStar Refinery Fire Valdez Glycol, Other 1,000 gal07/18/08 Illegal Dumping MP 49.5 Parks Hwy Wasilla Used Oil (all types) 1,000 gal07/15/08 Anadarko DS-2P Drill Mud spill Kuparuk Drilling Muds 1,000 lbs01/07/09 Veritas Deadhorse Diesel Spill Deadhorse Diesel 1,000 gal05/24/09 MI Drilling Fluids (Swatco) Pump Station 4 Sodium Bromide 1,000 lbs
Significant Responses - continued from p. 1
4
Annual Summary of Oil and Hazardous Substance Releases (July 1, 2008-June 30, 2009)
Number of Spills by Cause
Number of Spills by Size Class
Number of Spills by Facility Category
Number of Spills by Product
KEY TO ABBREVIATIONS
HUM Human FactorsACC AccidentUNK UnknownOTH OtherSTR/MECH Structural/MechanicalSTO StorageTRA TransportationVES VesselOTH/UNK Other/Unknown
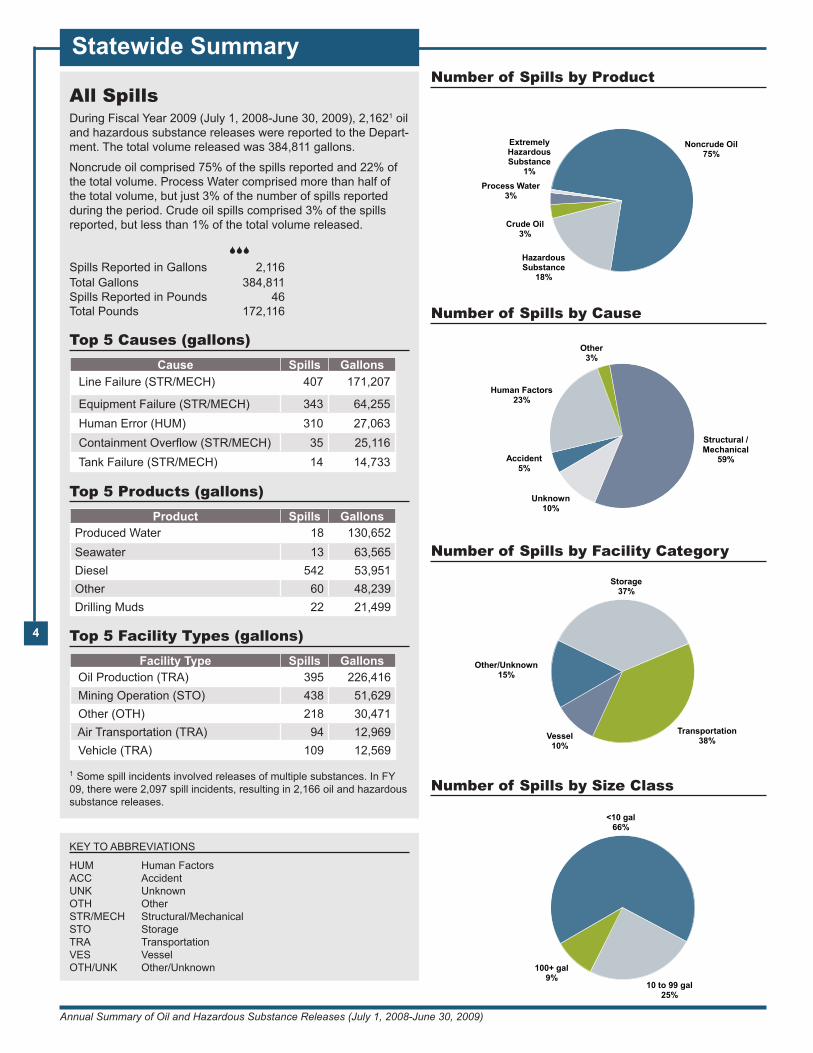
All SpillsDuring Fiscal Year 2009 (July 1, 2008-June 30, 2009), 2,1621 oil and hazardous substance releases were reported to the Depart-ment. The total volume released was 384,811 gallons.
Noncrude oil comprised 75% of the spills reported and 22% of the total volume. Process Water comprised more than half of the total volume, but just 3% of the number of spills reported during the period. Crude oil spills comprised 3% of the spills reported, but less than 1% of the total volume released.
Spills Reported in Gallons 2,116Total Gallons 384,811 Spills Reported in Pounds 46Total Pounds 172,116
Top 5 Causes (gallons)Cause Spills Gallons
Line Failure (STR/MECH) 407 171,207
Equipment Failure (STR/MECH) 343 64,255 Human Error (HUM) 310 27,063 Containment Overflow (STR/MECH) 35 25,116 Tank Failure (STR/MECH) 14 14,733
Top 5 Products (gallons)Product Spills Gallons
Produced Water 18 130,652 Seawater 13 63,565 Diesel 542 53,951 Other 60 48,239 Drilling Muds 22 21,499
Top 5 Facility Types (gallons)Facility Type Spills Gallons
Oil Production (TRA) 395 226,416 Mining Operation (STO) 438 51,629 Other (OTH) 218 30,471 Air Transportation (TRA) 94 12,969 Vehicle (TRA) 109 12,569
1 Some spill incidents involved releases of multiple substances. In FY 09, there were 2,097 spill incidents, resulting in 2,166 oil and hazardous substance releases.
FY09_pie.xlsx/pie_size_ALL
<10 gal66%
10 to 99 gal25%
100+ gal9%
FY09_pie.xlsx/pie_product_ALL
Noncrude Oil75%
Hazardous Substance
18%
Crude Oil3%
Process Water3%
Extremely Hazardous Substance
1%
FY09_pie.xlsx/pie_facility_ALL
Other/Unknown15%
Storage37%
Transportation38%Vessel
10%
FY09_pie.xlsx/pie_cause_ALL
Accident5%
Human Factors23%
Other3%
Structural / Mechanical
59%
Unknown10%
Statewide Summary

5
Alaska Department of Environmental Conservation
Spills by Subarea
Spills by Fiscal Year
KEY TO ABBREVIATIONS
AL AleutianBB Bristol BayCI Cook InletIN InteriorKI Kodiak IslandNS North SlopeNW Northwest ArcticPW Prince William SoundSE Southeast AlaskaWE Western Alaska
Statewide Summary (continued)
FY09_trend.xlsx/trend_FY_ct
0
500
1,000
1,500
2,000
2,500
3,000
1996 1997 1998 1999 2000 2001 2002 2003 2004 2005 2006 2007 2008 2009
Cou
nt
Average Count
FY09_trend.xlsx/trend_FY_gal
0
200,000
400,000
600,000
800,000
1,000,000
1,200,000
1,400,000
1996 1997 1998 1999 2000 2001 2002 2003 2004 2005 2006 2007 2008 2009
Gal
lons
Average Gallons
FY09_subarea.xlsx/trend_Subarea_ALL_ct
0
100
200
300
400
500
600
AL BB CI IN KI NS NW PW SE WE
Cou
nt
Average FY 2009
FY09_subarea.xlsx/trend_Subarea_ALL_gal
0
50,000
100,000
150,000
200,000
250,000
AL BB CI IN KI NS NW PW SE WE
Gal
lons
Average FY 2009
• The number of spills in FY 2009 (2,1621)was slightly higher than in FY 2008 (2,114).
• Total volume released in FY 2009 was 384,811 gallons, 41,809 less than the previous FY (436,620 gallons).
• The North Slope (25%) and Southeast Alaska (25%) subareas had the most spills. However, the volume released within the North Slope subarea (237,253 gallons) comprised 62% of the total statewide volume (384,811 gallons).
• Process water comprised more than half of the statewide volume released. More than 99% of the total volume of Process Water was released in the North Slope subarea. Process water comprised approximately 87% of the total volume released in the North Slope subarea, but only 6% of the spills.
• More than 80% of the spills reported during the year were due to Structural/Mechanical (59%) or Human Factors (23%) causes.
• Three-quarters (75%) of the releases occurred at Transportation (38%) or Storage (38%) facilities.
• Approximately 66% of the releases dur-ing FY 2009 were less than 10 gallons in volume. Nearly a third of these occurred in the Southeast Alaska subarea. Spills under 10 gallons at mining facilities were the most common, representing 23% of the statewide total.
1 Some spill incidents involved releases of multiple substances. In FY 09, there were 2,097 spill incidents, resulting in 2,166 oil and hazard-ous substance releases.

6
Annual Summary of Oil and Hazardous Substance Releases (July 1, 2008-June 30, 2009)
KEY TO ABBREVIATIONS
HUM Human FactorsACC AccidentUNK UnknownOTH OtherSTR/MECH Structural/MechanicalSTO StorageTRA TransportationVES VesselOTH/UNK Other/Unknown
Number of Spills by Cause
Number of Spills by Size Class
Number of Spills by Facility Category
Number of Spills by ProductNoncrude Oil• A little more than two-thirds (68%) of the noncrude spills were
under 10 gallons.
• Diesel comprised approximately 34% of the total number of noncrude spills and more than 60% of the total noncrude volume released during FY 2009.
• Hydraulic Oil spills were the most frequent noncrude oil releases (36%), but comprised only 6% of the total noncrude oil volume.
Spills Reported in Gallons 1,586Total Gallons 84,957Spills Reported in Pounds 4Total Pounds 110
Top 5 Causes (gallons)Cause Spills Gallons
Tank Failure (STR/MECH) 13 14,733 Rollover/Capsize (ACC) 43 11,767 Human Error (HUM) 232 11,559 Intentional Release (HUM) 15 11,452 Line Failure (STR/MECH) 349 6,179
Top 5 Products (gallons)Product Spills Gallons
Diesel 542 53,951 Kerosene 10 13,708 Hydraulic Oil 572 5,246 Gasoline 49 3,817 Used Oil (all types) 79 2,259
Top 5 Facilities (gallons)Product Spills Gallons
Other (OTH) 183 24,747 Air Transportation (TRA) 89 12,727 Vessel (VES) 199 10,593 Vehicle (TRA) 87 7,604 Oil Production (TRA) 184 5,836
FY09_pie.xlsx/pie_size_REF
<10 gal68%
10 to 99 gal25%
100+ gal7%
FY09_pie.xlsx/pie_facility_REF
Other/Unknown15%
Storage40%
Transportation32%Vessel
13%
FY09_pie.xlsx/pie_cause_REF
Accident5%
Human Factors25%
Other3%
Structural / Mechanical
59%
Unknown8%
Statewide Summary (continued)
FY09_pie.xlsx/bar_product_REF
572542
12879
6349
422826
141110
Hydraulic OilDiesel
Engine Lube OilUsed Oil (all types)
Aviation FuelGasoline
Transmission OilBilge Oil
OtherGrease
Turbine FuelKerosene
(10 or more spills reported)

7
Alaska Department of Environmental Conservation
Spills by Subarea
Spills by Fiscal Year
KEY TO ABBREVIATIONS
AL AleutianBB Bristol BayCI Cook InletIN InteriorKI Kodiak IslandNS North SlopeNW Northwest ArcticPW Prince William SoundSE Southeast AlaskaWE Western Alaska
Statewide Summary (continued)
FY09_trend.xlsx/trend_FY_REF_ct
0
500
1,000
1,500
2,000
2,500
1996 1997 1998 1999 2000 2001 2002 2003 2004 2005 2006 2007 2008 2009
Cou
nt
Average Count
FY09_trend.xlsx/trend_FY_REF_gal
0
100,000
200,000
300,000
400,000
500,000
600,000
1996 1997 1998 1999 2000 2001 2002 2003 2004 2005 2006 2007 2008 2009
Gal
lons
Average Gallons
FY09_subarea.xlsx/trend_Subarea_REF_ct
050
100150200250300350400450500
AL BB CI IN KI NS NW PW SE WE
Cou
nt
Average FY 2009
FY09_subarea.xlsx/trend_Subarea_REF_gal
05000
100001500020000250003000035000400004500050000
AL BB CI IN KI NS NW PW SE WE
Gal
lons
Average FY 2009
• Noncrude oil releases comprised 75% of the spills reported during FY 2009 and 22% of the total volume.
• The Southeast Alaska subarea had the greatest number of noncrude oil spills (467), representing 29% of the total number of noncrude spills statewide, but only 9% of the statewide volume. The Interior Alaska subarea had the great-est volume (21,030 gallons), 25% of the statewide total.
• Hydraulic Oil was the most common noncrude oil released (572), with more than half (293) occurring at Mining facilt-ies.
• Nearly 60% of the noncrude spills were due to Structural/Mechanical causes.
• Nearly three-quarters of the noncrude spills during FY 2009 occurred at Stor-age (40%) or Transportation facilities (32%).

8
Annual Summary of Oil and Hazardous Substance Releases (July 1, 2008-June 30, 2009)
Number of Spills by Cause
Number of Spills by Size Class
Number of Spills by Facility Category
KEY TO ABBREVIATIONS
HUM Human FactorsACC AccidentUNK UnknownOTH OtherSTR/MECH Structural/MechanicalSTO StorageTRA TransportationVES VesselOTH/UNK Other/Unknown
Crude Oil• About 85% of the Crude Oil spills occurred at Oil Production
facilities.
• Valve Failure and Human Error were the primary causes based on total volume released.
• Over half of all Crude Oil spills were less than 10 gallons.
Spills Reported 66Total Gallons 3,171
Top 5 CausesCause Spills Gallons
Valve Failure (STR/MECH) 3 860 Human Error (HUM) 10 748 Equipment Failure (STR/MECH) 8 509 Overfill (HUM) 2 242 Corrosion (STR/MECH) 3 215
Top 5 FacilitiesProduct Spills Gallons
Oil Production (TRA) 56 2,050 Crude Oil Terminal (STO) 4 580 Refinery Operation (STO) 5 317 Transmission Pipeline (TRA) 1 224
FY09_pie.xlsx/pie_size_CRU
<10 gal53%
10 to 99 gal35%100+ gal
12%
FY09_pie.xlsx/pie_facility_CRU
Storage14%
Transportation86%
FY09_pie.xlsx/pie_cause_CRU
Human Factors20%
Other6%
Structural / Mechanical
59%
Unknown15%
Statewide Summary (continued)

9
Alaska Department of Environmental Conservation
Spills by Subarea
Spills by Fiscal Year
KEY TO ABBREVIATIONS
AL AleutianBB Bristol BayCI Cook InletIN InteriorKI Kodiak IslandNS North SlopeNW Northwest ArcticPW Prince William SoundSE Southeast AlaskaWE Western Alaska
Statewide Summary (continued)
FY09_trend.xlsx/trend_FY_CRU_ct
0
20
40
60
80
100
120
1996 1997 1998 1999 2000 2001 2002 2003 2004 2005 2006 2007 2008 2009
Cou
nt
Average Count
FY09_trend.xlsx/trend_FY_CRU_gal
0
50,000
100,000
150,000
200,000
250,000
300,000
350,000
1996 1997 1998 1999 2000 2001 2002 2003 2004 2005 2006 2007 2008 2009
Gal
lons
Average Gallons
FY09_subarea.xlsx/trend_Subarea_CRU_ct
0
10
20
30
40
50
60
AL BB CI IN KI NS NW PW SE WE
Cou
nt
Average FY2009
FY09_subarea.xlsx/trend_Subarea_CRU_gal
-
5,000
10,000
15,000
20,000
25,000
30,000
AL BB CI IN KI NS NW PW SE WE
Gal
lons
Average FY2009
• The number of crude oil spills increased slightly in FY 2009 (66) compared to the prior FY (63); however, the total volume was substantially lower, 3,171 gallons in FY 2009 compared to 9,996 in FY 2008.
• More than 75% of the crude oil spills, representing more than 70% of the spilled volume in FY 2009, occurred in the North Slope subarea.

10
Annual Summary of Oil and Hazardous Substance Releases (July 1, 2008-June 30, 2009)
KEY TO ABBREVIATIONS
HUM Human FactorsACC AccidentUNK UnknownOTH OtherSTR/MECH Structural/MechanicalSTO StorageTRA TransportationVES VesselOTH/UNK Other/Unknown
Number of Spills by Cause
Number of Spills by Size Class
Number of Spills by Facility Category
Number of Spills by ProductHazardous Substances• More than 65% of the Hazardous Substance spills in FY 2009
were less than 10 gallons.
• Oil Production facilities had more Hazardous Substance re-leases; however, Mining facilities had the highest total volume released.
Spills Reported in Gallons 389Total Gallons 83,292Spills Reported in Pounds 24Total Pounds 8,417
Top 5 Causes (gallons)Cause Spills Gallons
Equipment Failure (STR/MECH) 72 48,725 Human Error (HUM) 54 13,390 Well Blow-Out (ACC) 1 11,000 Line Failure (STR/MECH) 44 2,645 Rollover/Capsize (ACC) 10 1,818
Top 5 Products (gallons)Product Spills Gallons
Other 34 47,207 Drilling Muds 22 21,499 Propylene Glycol 25 5,219 Ethylene Glycol (Antifreeze) 82 4,366 Glycol, Other 53 2,822
Top 5 Facilities (gallons)Product Spills Gallons
Mining Operation (STO) 60 41,841 Oil Production (TRA) 117 12,198 Natural Gas Production (TRA) 4 11,244 Other (OTH) 32 5,308 Vehicle (TRA) 21 4,965
FY09_pie.xlsx/pie_size_HS
<10 gal68%
10 to 99 gal20%
100+ gal12%
FY09_pie.xlsx/pie_facility_HS
Other/Unknown20%
Storage26%
Transportation52%
Vessel2%
FY09_pie.xlsx/pie_cause_HS
Accident5%
Human Factors18%
Other1%
Structural / Mechanical
56%
Unknown20%
Statewide Summary (continued)
FY09_pie.xlsx/bar_product_HS
82
73
53
34
34
32
25
22
13
Ethylene Glycol …
Unknown
Glycol, Other
Methyl Alcohol …
Other
Corrosion …
Propylene Glycol
Drilling Muds
Mill Slurry
(10 or more spills reported)

11
Alaska Department of Environmental Conservation
Spills by Subarea
Spills by Fiscal Year
KEY TO ABBREVIATIONS
AL AleutianBB Bristol BayCI Cook InletIN InteriorKI Kodiak IslandNS North SlopeNW Northwest ArcticPW Prince William SoundSE Southeast AlaskaWE Western Alaska
Statewide Summary (continued)
FY09_trend.xlsx/trend_FY_HS_ct
050
100150200250300350400450
1996 1997 1998 1999 2000 2001 2002 2003 2004 2005 2006 2007 2008 2009
Cou
nt
Average Count
FY09_trend.xlsx/trend_FY_HS_gal
0
50,000
100,000
150,000
200,000
250,000
300,000
1996 1997 1998 1999 2000 2001 2002 2003 2004 2005 2006 2007 2008 2009
Gal
lons
Average Gallons
FY09_subarea.xlsx/trend_Subarea_HS_ct
020406080
100120140160180
AL BB CI IN KI NS NW PW SE WE
Cou
nt
Average FY2009
FY09_subarea.xlsx/trend_Subarea_HS_gal
0 5,000
10,000 15,000 20,000 25,000 30,000 35,000 40,000 45,000 50,000
AL BB CI IN KI NS NW PW SE WE
Gal
lons
Average FY2009
• More than half of the Hazardous Sub-stances releases during FY 2009 were due to Structural/Mechanical Failure (56%).
• Approximately 50% of the total volume of hazardous substances released during the period occurred at Mining facilities.
• Ethylene Glycol (82 spills) was the prod-uct most frequently released.
• Most hazardous substance releases occurred within the North Slope subarea (155 spills). The greatest total volume released occurred in the Interior Alaska subarea (46,055 gallons).

12
Annual Summary of Oil and Hazardous Substance Releases (July 1, 2008-June 30, 2009)
KEY TO ABBREVIATIONS
HUM Human FactorsACC AccidentUNK UnknownOTH OtherSTR/MECH Structural/MechanicalSTO StorageTRA TransportationVES VesselOTH/UNK Other/Unknown
Number of Spills by Cause
Number of Spills by Size Class
Number of Spills by Facility Category
Number of Spills by ProductExtremely Hazardous Substances• 89% of the Extremely Hazardous Substance (EHS) releases
in FY 2009 were 100 pounds or more.
• Sulfur Dioxide was the most commonly released EHS and comprised 63% of the total pounds released.
Spills Reported in Gallons 20Total Gallons 3,675Spills Reported in Pounds 18Total Pounds 163,589
Top 5 Causes (pounds)Cause Spills Pounds
Other (OTH) 8 94,624 Intentional Release (HUM) 4 62,039 Equipment Failure (STR/MECH) 3 6,745 Line Failure (STR/MECH) 1 170 Corrosion (STR/MECH) 1 6
Top Products (pounds)Product Spills Pounds
Sulfur Dioxide 11 103,595 Anhydrous Ammonia 7 59,994
Top 5 Facility Types (pounds)Product Spills Pounds
Refinery Operation (STO) 11 103,595 Other (OTH) 1 40,013 Chemical Manufacturing (STO) 2 11,800 Cannery (STO) 4 8,181
NOTE: Extremely Hazardous Substances (EHS) are designated by the US Environmental Protection Agency in federal regula-tions (40 CFR part 355, Emergency Planning and Notification).
FY09_pie.xlsx/pie_size_EHS
<10 lbs11%
100+ lbs89%
FY09_pie.xlsx/pie_cause_EHS
Human Factors22%
Other45%
Structural / Mechanical
33%
Statewide Summary (continued)
(spills reported in pounds)
(spills reported in pounds)
(spills reported in pounds)
FY09_pie.xlsx/bar_product_EHS
11
7
Sulfur (Dioxide)
Ammonia (Anhydrous)
FY09_pie.xlsx/pie_facility_EHS
Other/Unknown6%
Storage94%

13
Alaska Department of Environmental Conservation
Spills by Subarea
Spills by Fiscal Year
KEY TO ABBREVIATIONS
AL AleutianBB Bristol BayCI Cook InletIN InteriorKI Kodiak IslandNS North SlopeNW Northwest ArcticPW Prince William SoundSE Southeast AlaskaWE Western Alaska
Statewide Summary (continued)
FY09_trend.xlsx/trend_FY_EHS_ct
0
20
40
60
80
100
120
1996 1997 1998 1999 2000 2002 2003 2004 2005 2006 2007 2008 2009
Cou
nt
Average Count
FY09_trend.xlsx/trend_FY_EHS_lbs
0
20,000
40,000
60,000
80,000
100,000
120,000
140,000
160,000
180,000
1996 1997 1998 1999 2000 2002 2003 2004 2005 2006 2007 2008 2009
Poun
dsAverage Pounds
FY09_subarea.xlsx/trend_Subarea_EHS_ct
0
2
4
6
8
10
12
14
16
AL BB CI IN KI NS NW PW SE WE
Cou
nt
Average FY2009
FY09_subarea.xlsx/trend_Subarea_EHS_lbs
0
20,000
40,000
60,000
80,000
100,000
120,000
140,000
160,000
AL BB CI IN KI NS NW PW SE WE
Poun
ds
Average FY2009
• Most EHS releases occurred at Refiner-ies during FY 2009.
• The Cook Inlet subarea had the greatest number of EHS releases and also the greatest total pounds.
(spills reported in pounds)
(spills reported in pounds)

14
Annual Summary of Oil and Hazardous Substance Releases (July 1, 2008-June 30, 2009)
KEY TO ABBREVIATIONS
HUM Human FactorsACC AccidentUNK UnknownOTH OtherSTR/MECH Structural/MechanicalSTO StorageTRA TransportationVES VesselOTH/UNK Other/Unknown
Number of Spills by Cause
Number of Spills by Size Class
Number of Spills by Facility Category
Number of Spills by ProductProcess Water1
• Process Water releases comprised 55% of the total volume released during FY 2009, but only 3% of the spills.
• 42% of Process Water releases were 100 gallons or more in volume.
• Most of the Process Water volume released during FY 2009 was due to Line Failure.
• Most Process Water spills occurred at Oil Production facilities.
Spills Reported in Gallons 55Total Gallons 209,717
Top 5 Causes (gallons)Cause Spills Gallons
Line Failure (STR/MECH) 5 158,701 Containment Overflow (STR/MECH) 3 24,524 Equipment Failure (STR/MECH) 12 10,948 Corrosion (STR/MECH) 5 6,998 Unknown (UNK) 5 5,600
Top Products (gallons)Product Spills Gallons
Produced Water 18 130,652 Seawater 13 63,565 Process Water 23 15,486 Source Water 1 14
Top 5 Facility Types (gallons)Product Spills Gallons
Oil Production (TRA) 32 206,328 Mining Operation (STO) 13 2,585 Other (OTH) 1 400 Non-Crude Terminal (STO) 1 336 Refinery Operation (STO) 4 51
1See Glossary, p. 16
FY09_pie.xlsx/pie_size_PW
<10 gal16%
10 to 99 gal42%
100+ gal42%
FY09_pie.xlsx/pie_cause_PW
Human Factors22%
Other4%
Structural / Mechanical
65%
Unknown9%
Statewide Summary (continued)
FY09_pie.xlsx/bar_product_PW
23
18
13
1
Process Water
Produced Water
Seawater
Source Water
FY09_pie.xlsx/pie_facility_PW
Other/Unknown4%
Storage34%
Transportation62%

15
Alaska Department of Environmental Conservation
Spills by Subarea
Spills by Fiscal Year
KEY TO ABBREVIATIONS
AL AleutianBB Bristol BayCI Cook InletIN InteriorKI Kodiak IslandNS North SlopeNW Northwest ArcticPW Prince William SoundSE Southeast AlaskaWE Western Alaska
Statewide Summary (continued)
FY09_trend.xlsx/trend_FY_PW_ct
0
20
40
60
80
100
120
1996 1997 1998 1999 2000 2001 2002 2003 2004 2005 2006 2007 2008 2009
Cou
nt
Average Count
FY09_trend.xlsx/trend_FY_PW_gal
0
200,000
400,000
600,000
800,000
1,000,000
1,200,000
1996 1997 1998 1999 2000 2001 2002 2003 2004 2005 2006 2007 2008 2009
Gal
lons
Average Gallons
FY09_subarea.xlsx/trend_Subarea_PW_ct
0
5
10
15
20
25
30
35
40
CI IN NS NW PW SE
Cou
nt
Average FY2009
FY09_subarea.xlsx/trend_Subarea_PW_gal
0
50,000
100,000
150,000
200,000
250,000
CI IN NS NW PW SE
Gal
lons
Average FY2009
• Process Water spills made up 3% of the total number of spills, but more than half of the total volume released during the period.
• Most Process Water spills, and the greatest volume released, occurred in the North Slope subarea.

16
Annual Summary of Oil and Hazardous Substance Releases (July 1, 2008-June 30, 2009)
EmergencyTowingSystemIn August 2008, a second DEC-sponsored training exercise was held in Unalaska to train personnel on the Aleutian Island Emergency Towing System (ETS) and determine if modifications to the system were needed. The two exercises resulted in the development of a helicopter plan-ning matrix, which will help determine load and distance capacities for the USCG and Air National Guard helicopters. In addi-tion, ETS mobilization checklists were developed for both helicopter and vessel deployment tactics to ensure all needed equipment is mobilized to the proper de-ployment locations. The new revised ETS manual was published in January 2009.
In August 2008, ADEC purchased and stored a 10-inch ETS at the USCG Air Station Kodiak. C-130s and helicopters maintained at the base will help facilitate a quick mobilization and deployment to a distressed vessel anywhere in Alaska.
AleutianIslandsRiskAssessmentA commercial vessel accident and large oil spill in 2004 focused public attention on the risks inherent in commercial ship-ping in the region. The court settlement resulting from this accident established funding for a comprehensive risk assess-ment and directed the U.S. Coast Guard to take actions necessary to conduct this assessment.
In 2007, the Transportation Research Board (TRB) within the National Acade-mies impaneled the Committee for Risk of Vessel Accidents and Spills in the Aleutian Islands: a study to design a comprehen-sive assessment. The committee included individuals with expertise in risk assess-ment methods and practices. Their efforts culminated with the completion of their report titled: Risk of Vessel Accidents and Spills in the Aleutian Islands - Designing a Comprehensive Risk Assessment. The TRB delivered an advance copy of the report to a public audience in Anchorage
on July 17, 2008.
The second phase of the project, conduct-ing the Aleutian Islands Risk Assessment in accordance with the TRB design, is now underway.
www.aleutiansriskassessment.com/
SoutheastPPORProjectPlaces of Potential Refuge (PPOR) documents are designed to identify pos-sible locations to move a vessel needing assistance where actions can be taken to stabilize and/or repair the vessel, in order to protect human life, reduce hazards to navigation, and/or protect natural re-sources and other uses of an area. The documents contain maps, aerial photos, and information on site considerations, operational characteristics, and local knowledge. A project to develop new PPOR documents for the Southeast Alaska Subarea was initiated in October 2008. Meetings were held in Juneau and Ketchikan and several sites were selected by work group members. The first phase of this project was completed in June 2009 with PPOR maps developed for four of the nine response zones in Southeast Alaska. The PPOR maps for the remain-ing five zones will be completed in FY 10.
CleanMarinasProjectThe Clean Harbors initiative in Alaska is jointly sponsored by ADEC and the Cook Inlet Regional Citizens Advisory Council (CIRCAC) and is partially funded by a grant from Conoco Phillips. Homer Harbor is serving as a pilot project for launching the initiative in Alaska. This program is based on Clean Marinas, a program promoted by NOAA and others which encourages marina operators and recreational boaters to protect coastal water quality by engaging in environmen-tally sound operating and maintenance practices.
A work group has been established that is comprised of representatives from ADEC,
CIRCAC, City of Homer Port Administra-tion, Cook Inlet Keeper, USCG, Alaska Sea Grant, Kachemak Bay Research Reserve, and the Harbormasters Associa-tion. Working with a contractor, the work group drafted an Alaska Clean Harbors Guidebook that includes Best Manage-ment Practices for harbors in Alaska.
CommercialPassengerVesselEnvi-ronmentalComplianceProgramLicensed marine engineers are hired each year for this program as Ocean Rangers (OR) to monitor operations on large cruise ships to ensure they are in compliance with the state law and regulations. To aid in the reporting of oil discharges by the OR, ADEC developed a visual oil pollu-tion guide which included photographs of various types of oil discharges, written descriptions of various type of discharges, and instructions on how to determine the size and thickness of oil on the water. The guide also included a brief review of the state law as it applied to oil spills to water. ADEC staff also provided training to the OR on oil spill reporting via video conference.
DrillsADEC staff also participated in ap-proximately 30 spill drills and exercises including major drills such as the Valdez Marine Terminal Drill; Tesoro PWS Tanker Drill (Nikiski and Homer); Canada-United States Dixon Entrance (CANUSDIX ’08) trans-boundary exercise; Polar Tankers Prince William Sound Tanker Drill; several Trans Alaska Pipeline System Combined Resources Exercises; the 2009 Southeast Alaska Area Exercise; and the Ketchikan Mass Rescue Exercise. ADEC staff also participated in smaller drills.
For more information go to: www.dec.state.ak.us/spar/perp
Special Projects
Process Water (Oil Exploration and Production Opera-tions): Process water includes seawater (and occasionally freshwater) and produced water. Seawater is injected into a formation to pressurize the reservoir and force the oil toward the oil production wells. Gelled water is seawater and fresh-water that is mixed with a gelling substance to increase the viscosity of the fluid for a number of purposes. Seawater is also used to maintain the existing wells or to detect leaks in pipelines. Produced water is the water mixture consisting of oil, gas, and sand that is pumped from oil production wells. The percentage of crude oil occurring in process water can
vary somewhat based on the source of the spill.
Process Water (Mining Operations): Process water for min-ing operations includes water taken from tailing ponds for the milling process (reclaim water), water that has been through the water treatment plant but not the sand filter (process water), water that has been through both the water treatment and sand filter (discharge water), water mixed with ground ore materials (slurry) or water used in the milling and product recovery process (process solution water).
Glossary