annual shareholders’ meeting on april 17, 2012 - … · · 2016-08-16annual shareholders’...
TRANSCRIPT
___
Welcome | Bienvenue | Benvenuti | Bienvenido | Willkommen | Welcome | Bienvenue | Benvenuti
Bienvenue | Benvenuti | Bienvenido | Willkommen | Welcome | Bienvenue | Benvenuti | BienvenidWillkommen | Welcome | Bienvenue | Benvenuti | Bienvenido | Willkommen | Welcome | Bienvenue
Annual Shareholders’ Meeting on April 17, 2012
Joachim KreuzburgChairman of the Board and CEO
April 17, 2012 | Aubagne
Seite 2
This presentation contains statements concerning the Sartorius and Sartorius Stedim Biotech Groups’future performance. These statements are based on assumptions and estimates. Although we are convinced that these forward-looking statements are realistic, we cannot guarantee that they will actually materialize. This is because our assumptions harbor risks and uncertainties that could lead to actual results diverging substantially from the expected ones. It is not planned to update our forward-looking statements.
Throughout this presentation, differences may be apparent as a result of rounding during addition.
Disclaimer

Page 3
1
2
3
4
2011 Full-Year Results and Outlook 2012
New Products 2011
Strategy Update
Key Projects 2011
Agenda
Page 4
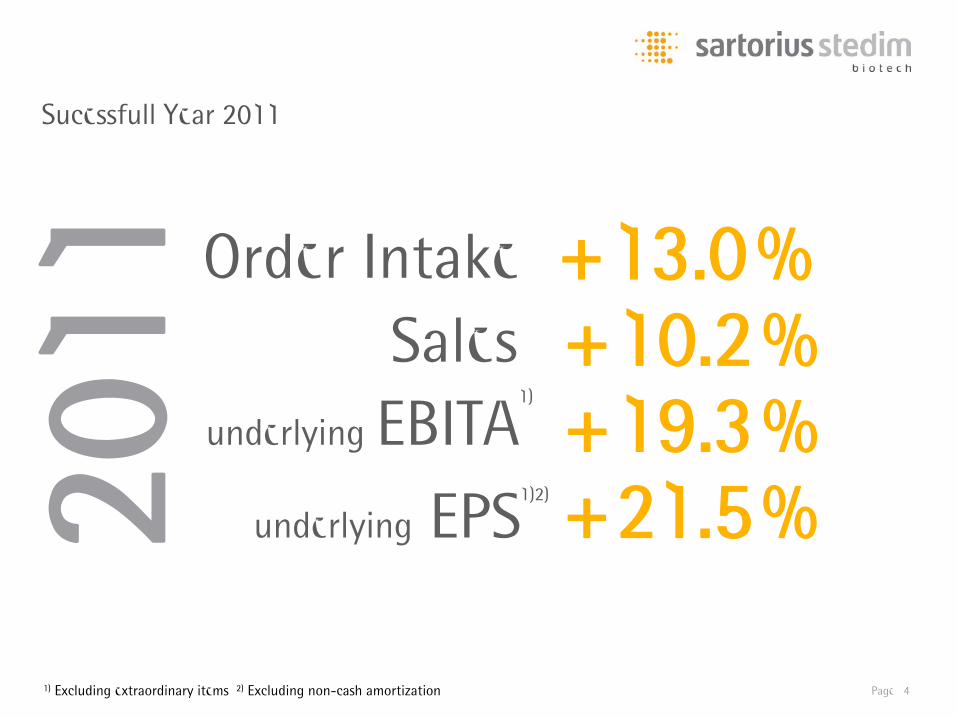
Sucessfull Year 2011
Sales +10.2%
underlying EPS
+13.0%
2011 Order Intake
underlying EBITA
+21.5%+19.3%
1) Excluding extraordinary items 2) Excluding non-cash amortization
1)
1)2)
Page 5
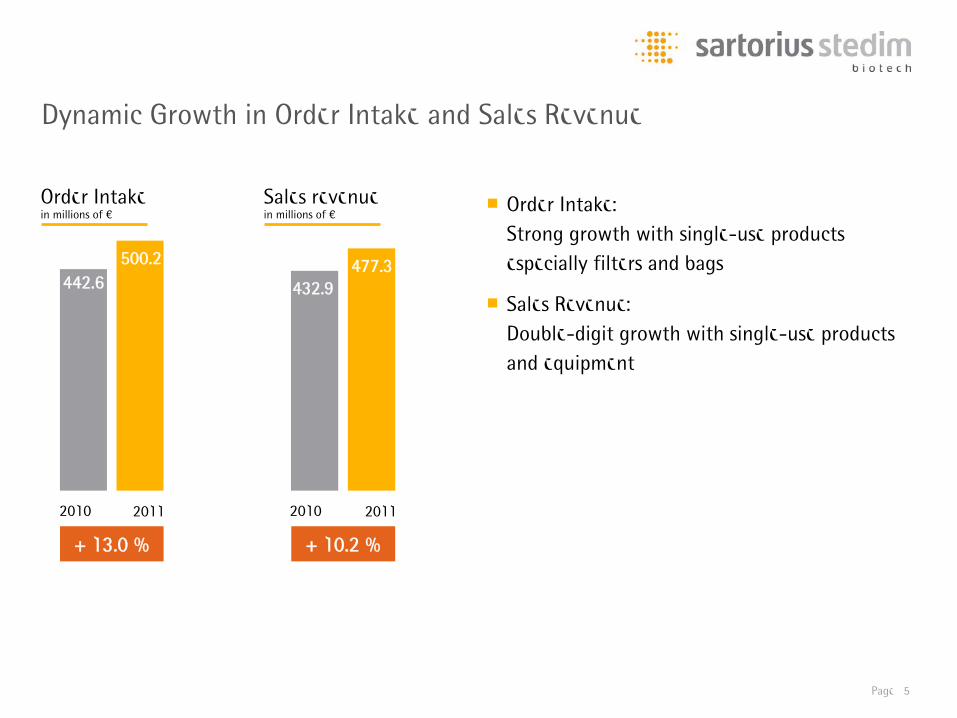
Dynamic Growth in Order Intake and Sales Revenue
■ Order Intake: Strong growth with single-use products, especially filters and bags
■ Sales Revenue: Double-digit growth with single-use products and equipment
+ 13.0 %
2010 2011
Order Intakein millions of €
+ 10.2 %
2010 2011
500.2442.6 432.9
477.3
Sales revenuein millions of €
Page 6
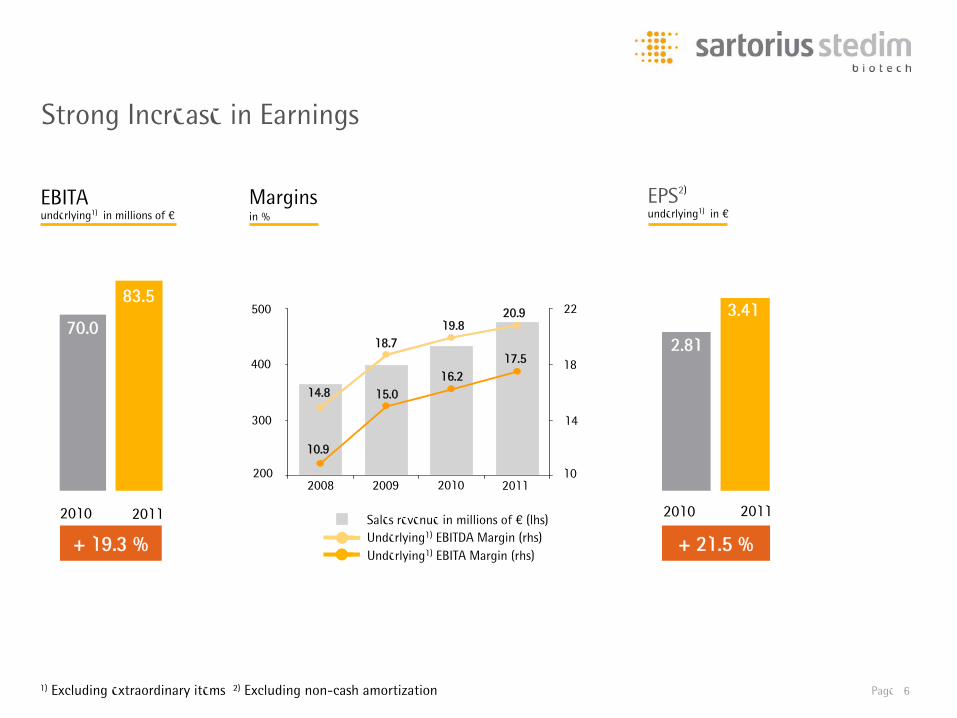
Strong Increase in Earnings
EBITAunderlying1), in millions of €
EPS2)
underlying1), in €
+ 21.5 %
2010 2011
+ 19.3 %
2010 2011
70.0
83.5
2.81
3.41
Marginsin %
200
500
300
400
10
14
18
22
16.217.5
19.820.9
18.7
15.014.8
10.9
20102009 20112008
Sales revenue in millions of € (lhs)Underlying1) EBITDA Margin (rhs)
1) Excluding extraordinary items 2) Excluding non-cash amortization
Underlying1) EBITA Margin (rhs)
Page 7
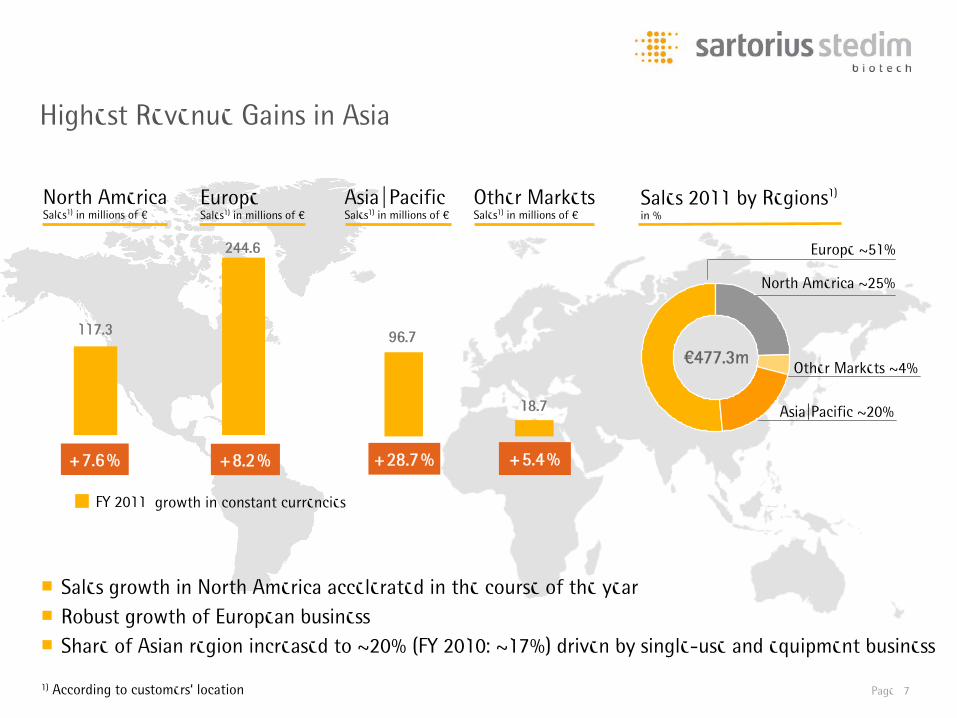
Highest Revenue Gains in Asia
1) According to customers‘ location
+7.6% +8.2% +28.7% +5.4%
FY 2011
EuropeSales1) in millions of €
North AmericaSales1) in millions of €
Asia|PacificSales1) in millions of €
Other MarketsSales1) in millions of €
117.3
244.6
96.7
18.7
Sales 2011 by Regions1)
in %
, growth in constant currencies
North America ~25%
Europe ~51%
Other Markets ~4%
Asia|Pacific ~20%
€477.3m
■ Sales growth in North America accelerated in the course of the year■ Robust growth of European business■ Share of Asian region increased to ~20% (FY 2010: ~17%) driven by single-use and equipment business
Page 8
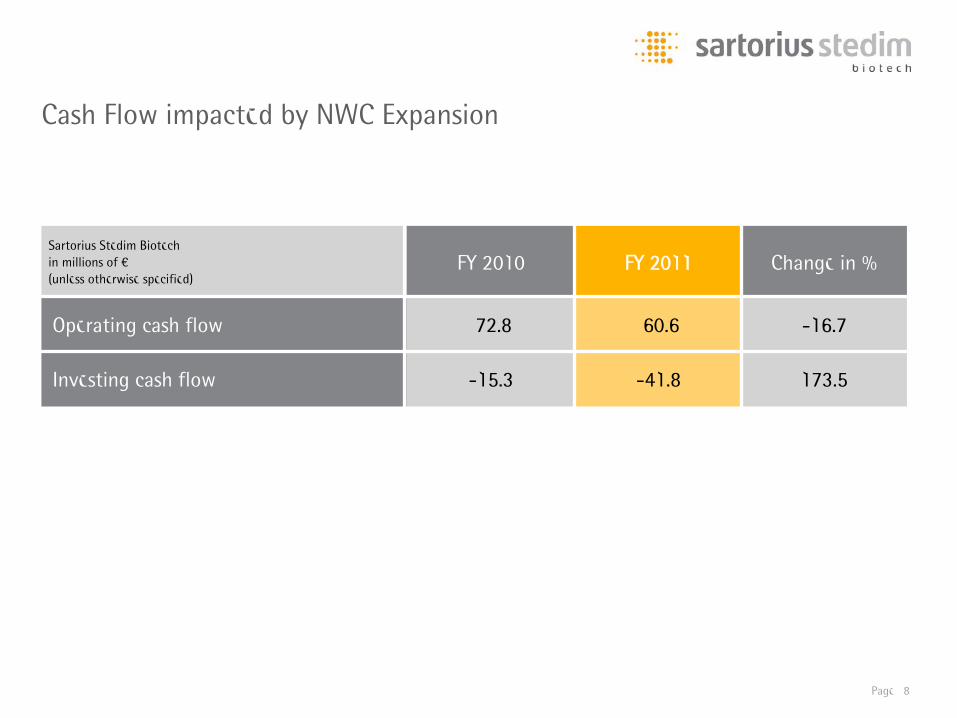
Cash Flow impacted by NWC Expansion
173.5-41.8-15.3Investing cash flow
-16.760.672.8Operating cash flow
Change in %FY 2011FY 2010Sartorius Stedim Biotechin millions of €(unless otherwise specified)
Page 9
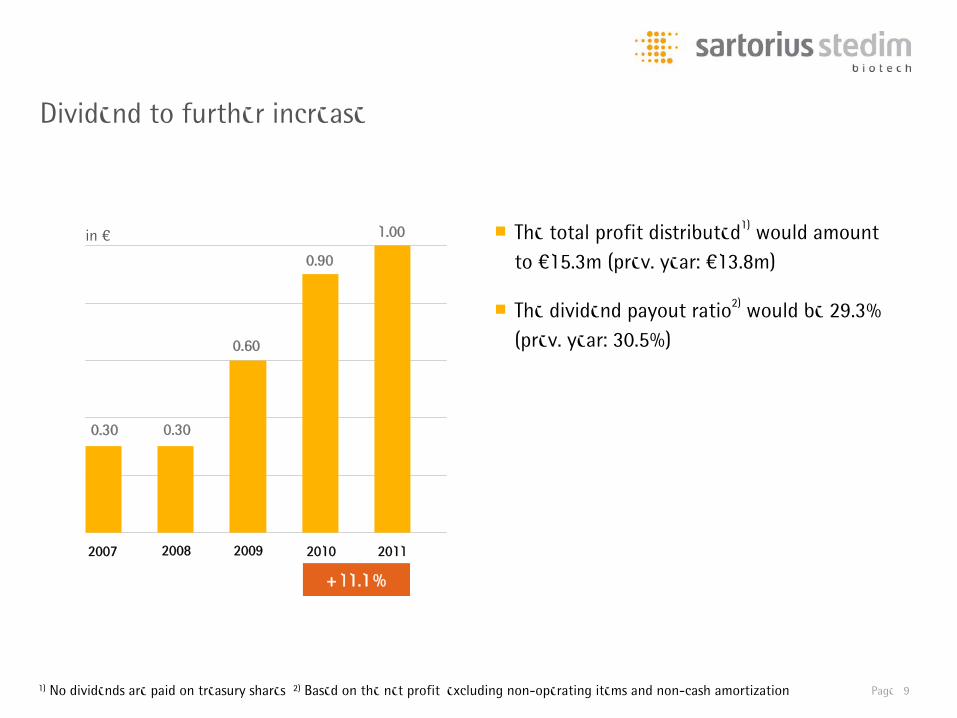
Dividend to further increase
1) No dividends are paid on treasury shares 2) Based on the net profit, excluding non-operating items and non-cash amortization
■ The total profit distributed1) would amount to €15.3m (prev. year: €13.8m)
■ The dividend payout ratio2) would be 29.3%(prev. year: 30.5%)
20102007 2008 20112009
0.30 0.30
0.60
0.90
1.00
+11.1%
in €
Page 10
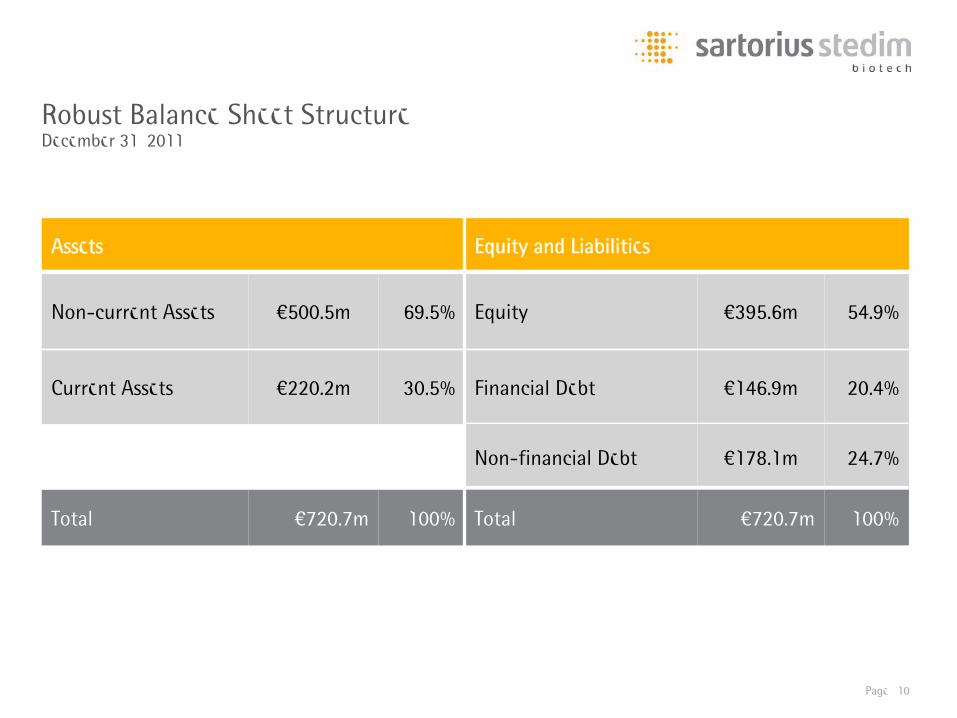
100% 100%€720.7m€720.7m
24.7%
20.4%
54.9%
30.5%
69.5%
€220.2m
€500.5m
Total
Non-financial Debt
Financial Debt
Equity
Equity and Liabilities
Total
Current Assets
Non-current Assets
Assets
€178.1m
€146.9m
€395.6m
Robust Balance Sheet StructureDecember 31, 2011
Page 11
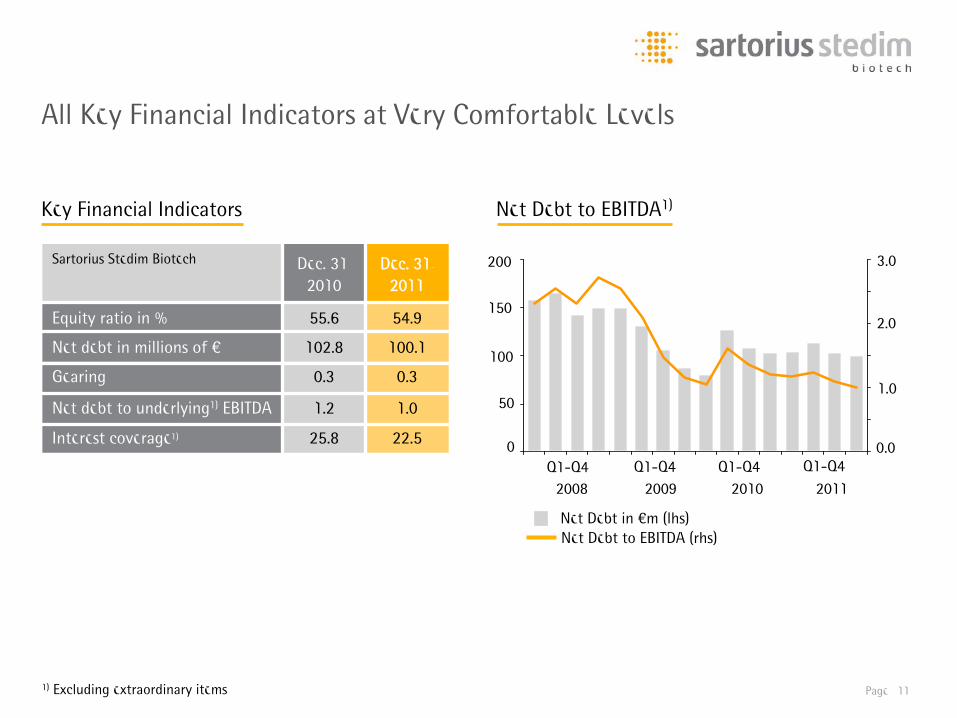
All Key Financial Indicators at Very Comfortable Levels
Net Debt to EBITDA1)
0
100
150
200
0.0
1.0
2.0
3.0
50
1) Excluding extraordinary items
0.30.3Gearing
1.01.2Net debt to underlying1) EBITDA
22.525.8Interest coverage1)
54.955.6Equity ratio in %
100.1102.8Net debt in millions of €
Dec. 31,2011
Dec. 31,2010
Sartorius Stedim Biotech
Key Financial Indicators
Q1-Q4 Q1-Q4201120102009
Q1-Q4 Q1-Q42008
Net Debt in €m (lhs) Net Debt to EBITDA (rhs)
Page 12
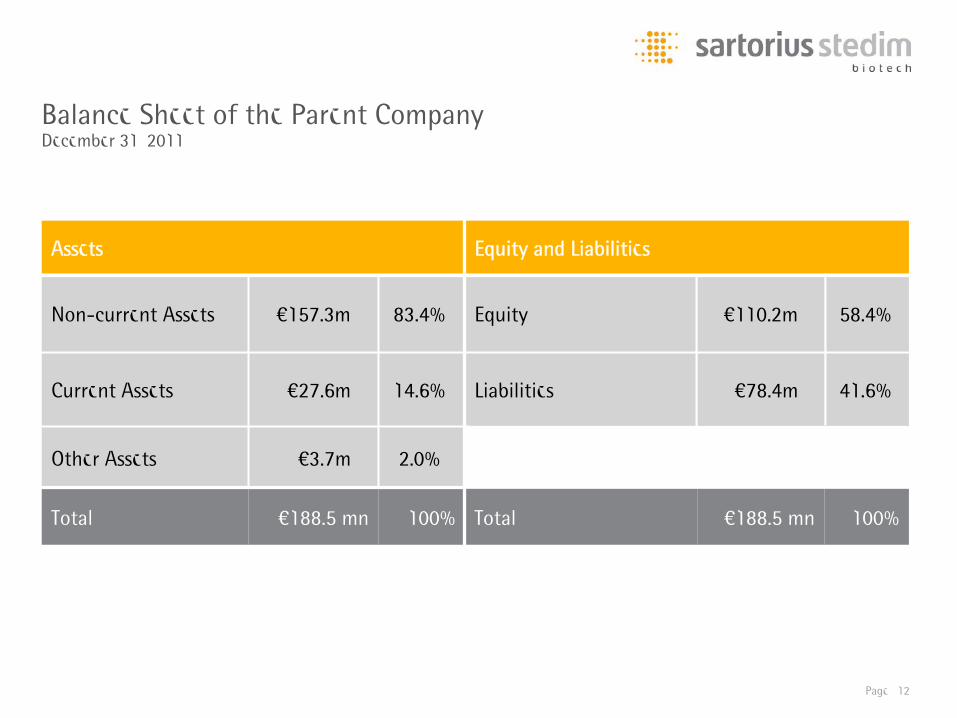
100% 100%€188.5 mn€188.5 mn
41.6%
58.4%
2.0%
14.6%
83.4%
€3.7m
€27.6m
€157.3m
Total
Liabilities
Equity
Equity and Liabilities
Total
Other Assets
Current Assets
Non-current Assets
Assets
€78.4m
€110.2m
Balance Sheet of the Parent CompanyDecember 31, 2011
Page 13
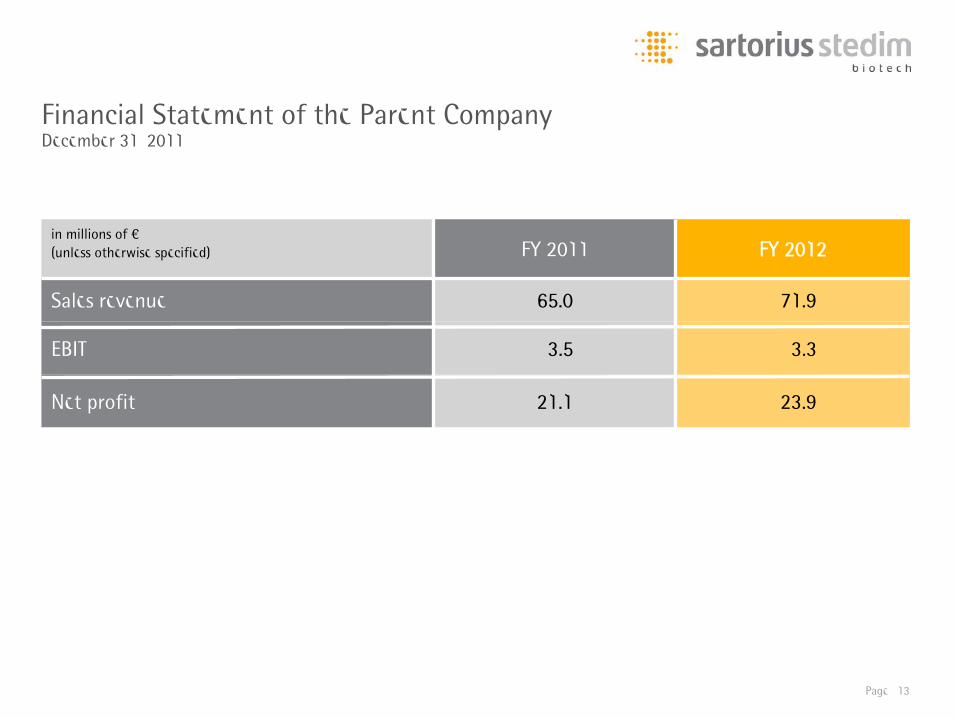
Financial Statement of the Parent CompanyDecember 31, 2011
3.33.5EBIT
23.921.1Net profit
71.965.0Sales revenue
FY 2012FY 2011in millions of €(unless otherwise specified)
Page 14
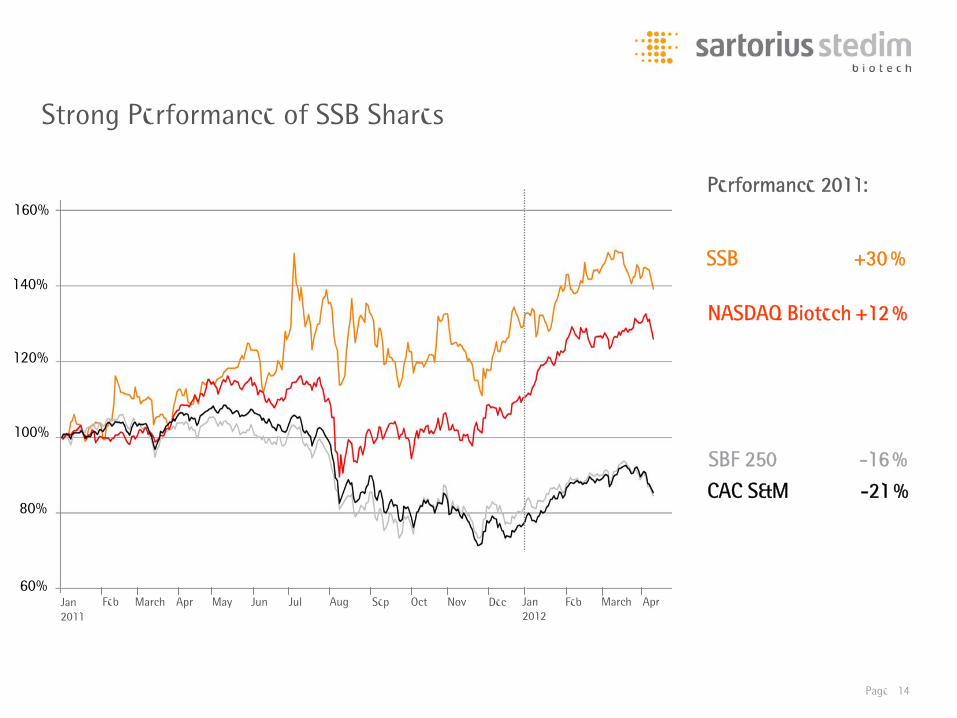
Strong Performance of SSB Shares
CAC S&M -21%
SSB +30%
SBF 250 -16%
NASDAQ Biotech +12%
Performance 2011:
60%
80%
100%
120%
140%
160%
Jan 2011
Jan 2012
Feb March Apr May Jun Jul Aug Sep Oct Nov Dec Feb March Apr
Page 15
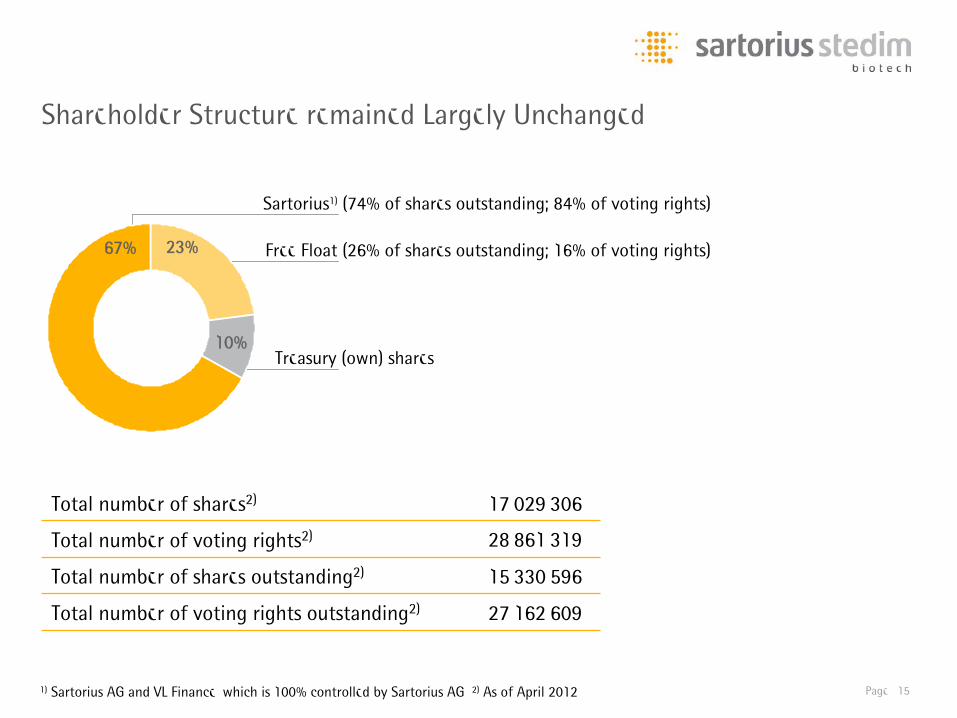
Shareholder Structure remained Largely Unchanged
27,162,609Total number of voting rights outstanding2)
15,330,596
28,861,319
17,029,306
Total number of voting rights2)
Total number of shares outstanding2)
Total number of shares2)
1) Sartorius AG and VL Finance, which is 100% controlled by Sartorius AG 2) As of April 2012
Treasury (own) shares
Free Float (26% of shares outstanding; 16% of voting rights)
Sartorius1) (74% of shares outstanding; 84% of voting rights)
67% 23%
10%
Page 16
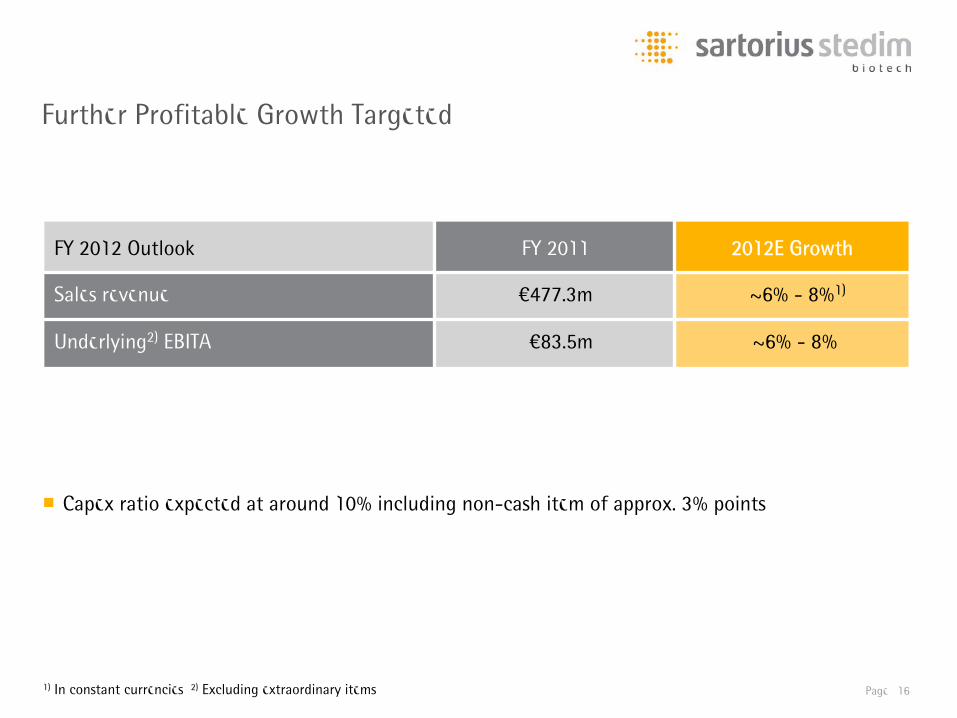
Further Profitable Growth Targeted
~6% - 8%€83.5mUnderlying2) EBITA
~6% - 8%1)€477.3mSales revenue
2012E GrowthFY 2011FY 2012 Outlook
■ Capex ratio expected at around 10% including non-cash item of approx. 3% points
1) In constant currencies 2) Excluding extraordinary items
Page 17
1
2
3
4
2011 Full-Year Results and Outlook 2012
New Products 2011
Strategy Update
Key Projects 2011
Agenda
Page 18
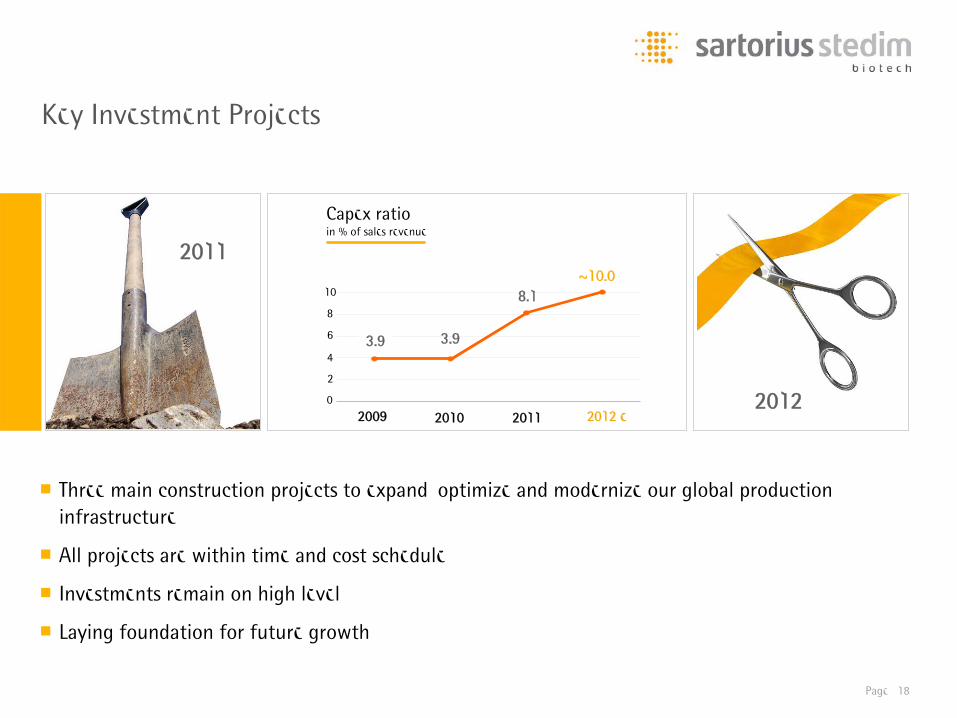
Key Investment Projects
■ Three main construction projects to expand, optimize and modernize our global production infrastructure
■ All projects are within time and cost schedule
■ Investments remain on high level
■ Laying foundation for future growth
2012
Capex ratioin % of sales revenue
2009 2010 2011 2012e0
2
6
4
8
3.9
8.1
3.9
2009 2010 2011
2011~10.0
2012 e
10
2012
Page 19
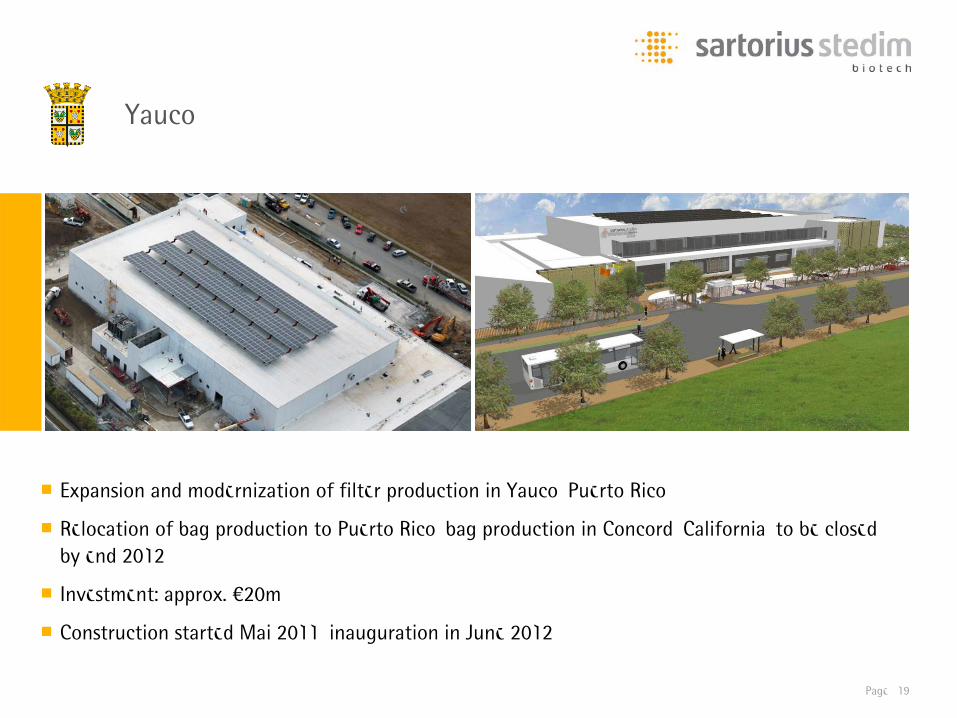
Yauco
■ Expansion and modernization of filter production in Yauco, Puerto Rico
■ Relocation of bag production to Puerto Rico, bag production in Concord, California, to be closed by end 2012
■ Investment: approx. €20m
■ Construction started Mai 2011, inauguration in June 2012
Page 20
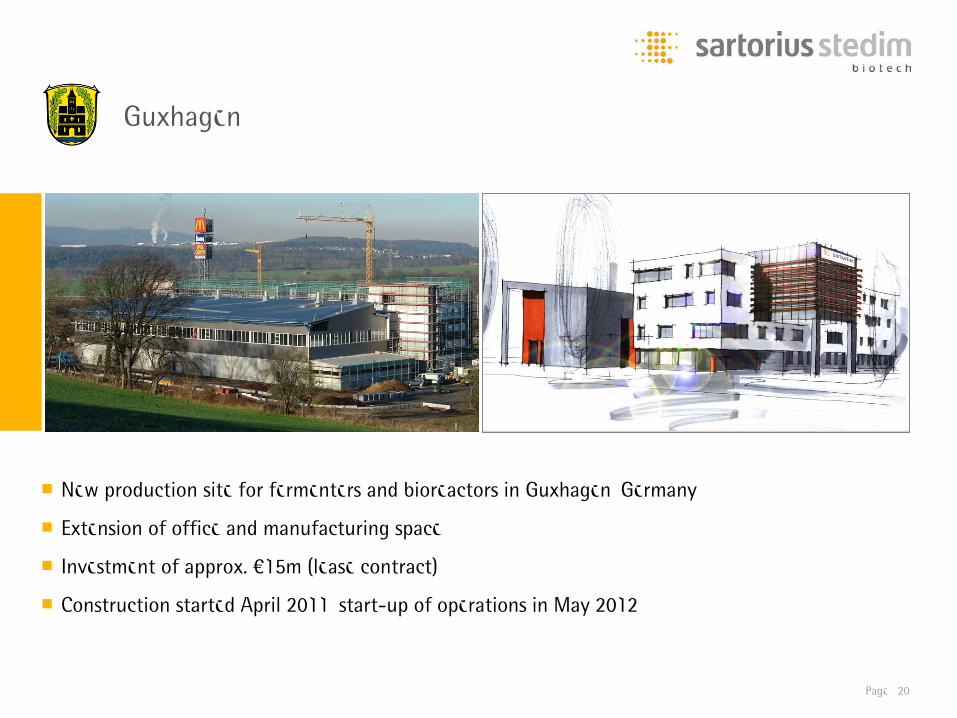
■ New production site for fermenters and bioreactors in Guxhagen, Germany
■ Extension of office and manufacturing space
■ Investment of approx. €15m (lease contract)
■ Construction started April 2011, start-up of operations in May 2012
Guxhagen
Page 21
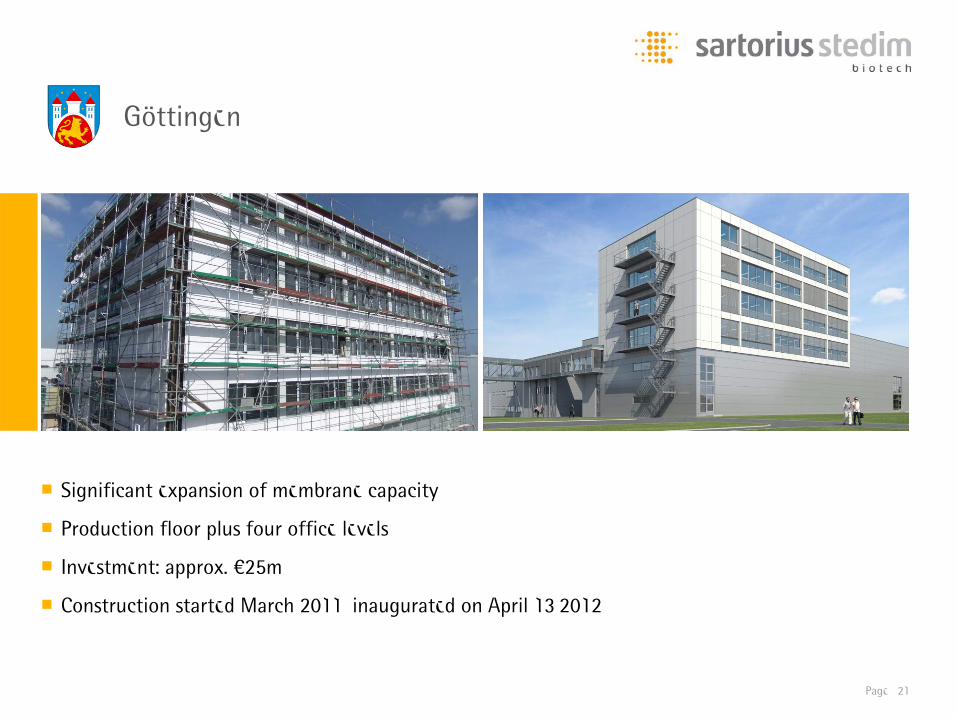
■ Significant expansion of membrane capacity
■ Production floor plus four office levels
■ Investment: approx. €25m
■ Construction started March 2011, inaugurated on April 13,2012
Göttingen
Page 22
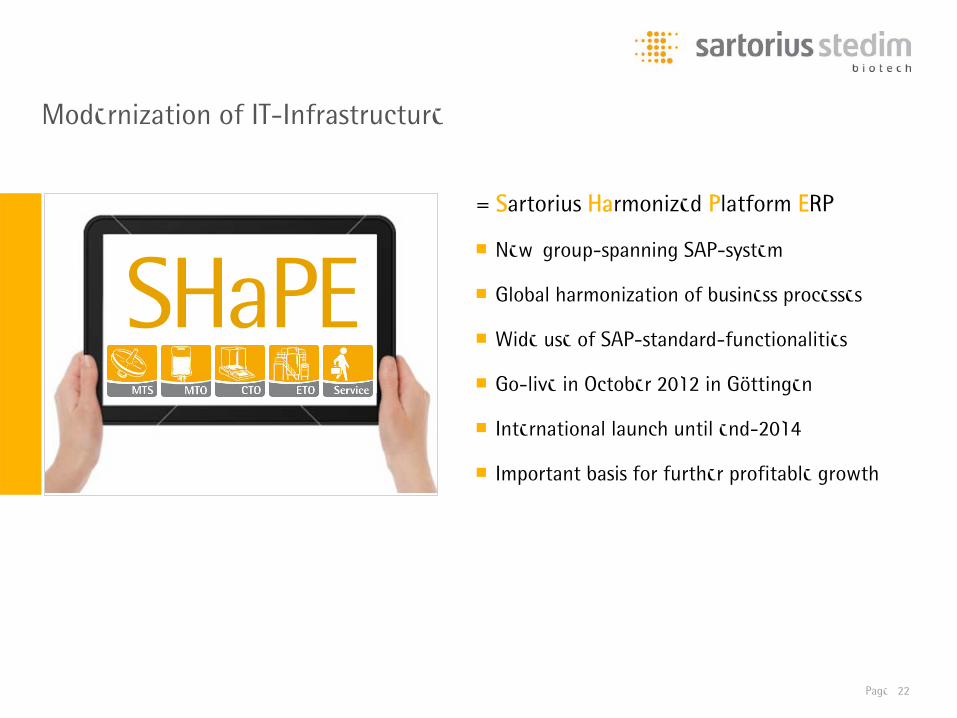
Modernization of IT-Infrastructure
= Sartorius Harmonized Platform ERP
■ New, group-spanning SAP-system
■ Global harmonization of business processes
■ Wide use of SAP-standard-functionalities
■ Go-live in October 2012 in Göttingen
■ International launch until end-2014
■ Important basis for further profitable growth
Page 23
1
2
3
4
2011 Full-Year Results and Outlook 2012
New Products 2011
Strategy Update
Key Projects 2011
Agenda
Page 24
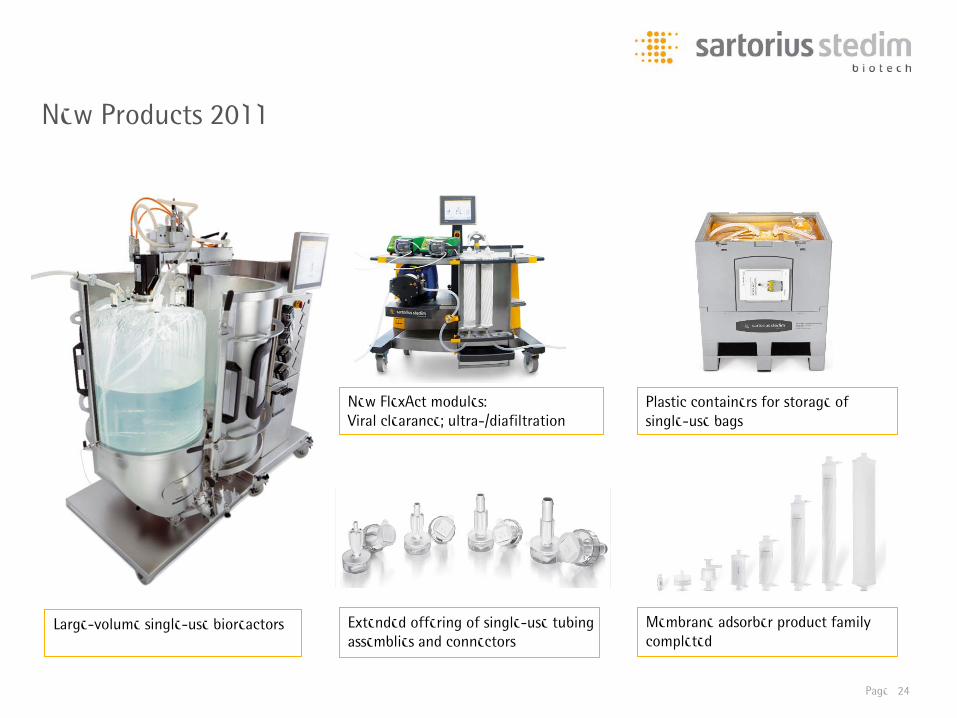
New Products 2011
New FlexAct modules:Viral clearance; ultra-/diafiltration
Large-volume single-use bioreactors
Plastic containers for storage of single-use bags
Extended offering of single-use tubingassemblies and connectors
Membrane adsorber product family completed
Page 25
1
2
3
4
2011 Full-Year Results and Outlook 2012
New Products 2011
Strategy Update
Key Projects 2011
Agenda
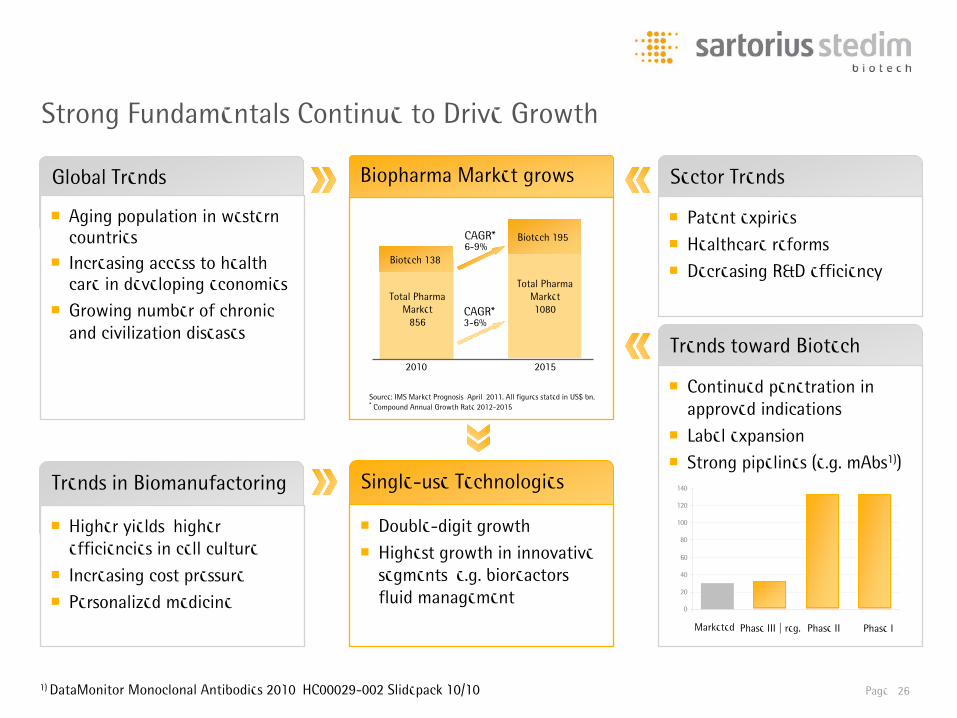
Strong Fundamentals Continue to Drive Growth
Global Trends Sector Trends
Patent expiries
Healthcare reforms Decreasing R&D efficiency
Trends in Biomanufactoring
Higher yields, higher efficiencies in cell culture
Increasing cost pressure Personalized medicine
Single-use Technologies
Double-digit growth Highest growth in innovative
segments, e.g. bioreactors, fluid management
Global Trends
Aging population in western countries
Increasing access to health care in developing economies
Growing number of chronic and civilization diseases
Trends toward Biotech
Continued penetration in approved indications
Label expansion Strong pipelines (e.g. mAbs1))
Phase III | reg. Phase II Phase IMarketed
0
20
40
60
80
100
120
140
1) DataMonitor Monoclonal Antibodies 2010, HC00029-002 Slidepack 10/10
Biopharma Market grows
Total Pharma Market
856
Total Pharma Market 1080
2010 2015
CAGR*3-6%
CAGR*6-9%
Biotech 195
Source: IMS Market Prognosis, April, 2011. All figures stated in US$ bn. * Compound Annual Growth Rate 2012-2015
Biotech 138
Page 26
Page 27
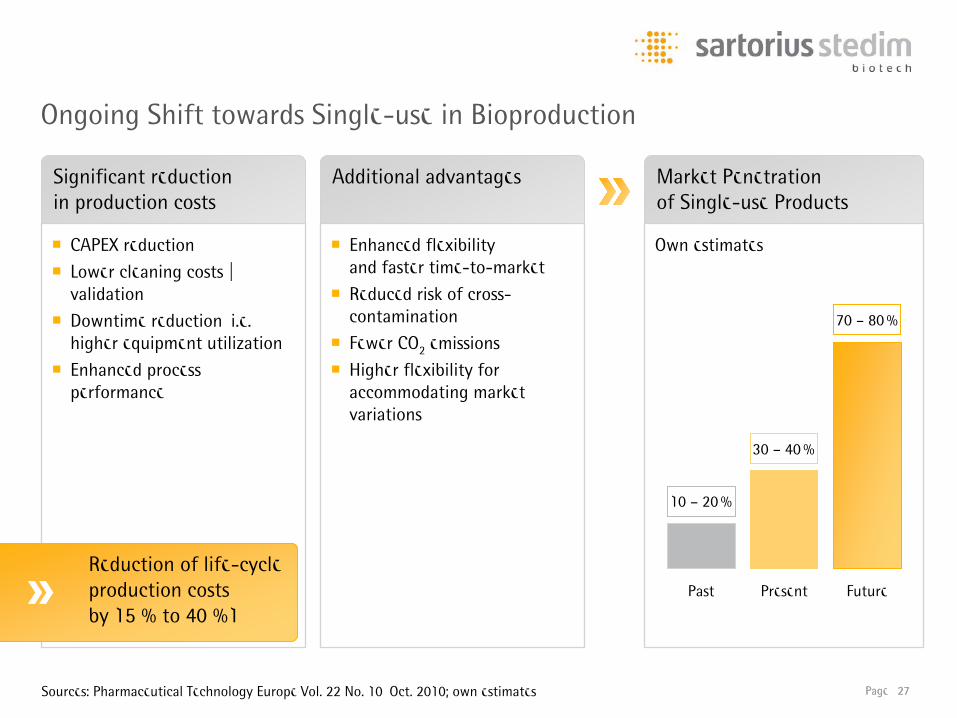
Ongoing Shift towards Single-use in Bioproduction
Significant reductionin production costs
CAPEX reduction Lower cleaning costs |
validation Downtime reduction, i.e.
higher equipment utilization
Enhanced process performance
Additional advantages
Enhanced flexibility and faster time-to-market
Reduced risk of cross-contamination
Fewer CO2 emissions
Higher flexibility for accommodating market variations
Market Penetration of Single-use Products
Reduction of life-cycle production costs by 15 % to 40 %1
Sources: Pharmaceutical Technology Europe Vol. 22 No. 10, Oct. 2010; own estimates
Own estimates
Past Present Future
Page 27
10 – 20%
30 – 40%
70 – 80%
Page 28
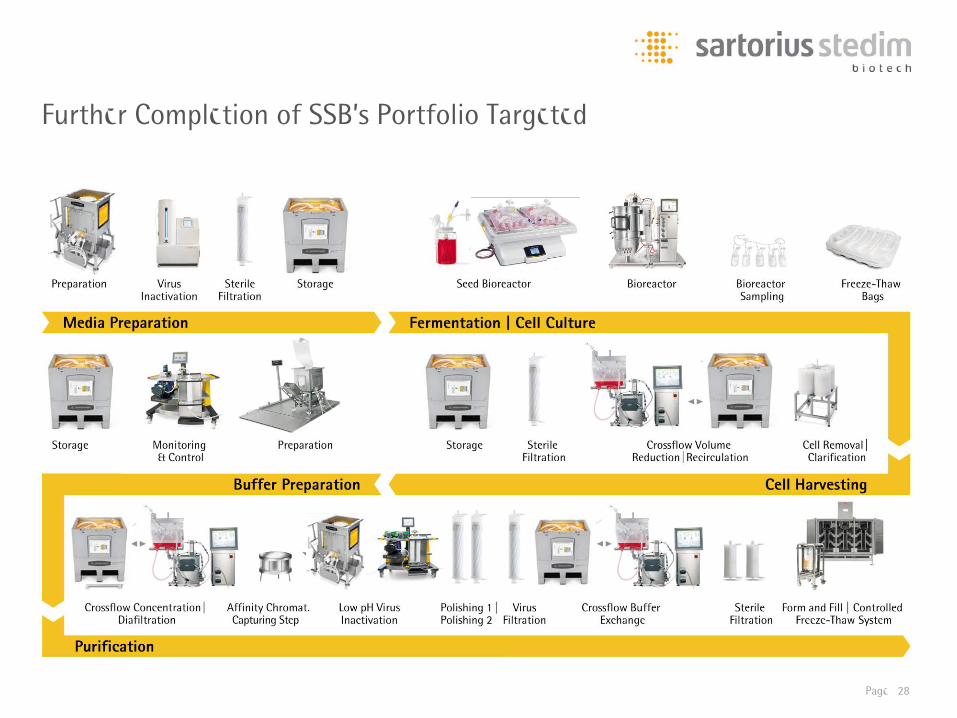
Further Completion of SSB’s Portfolio Targeted
Page 29
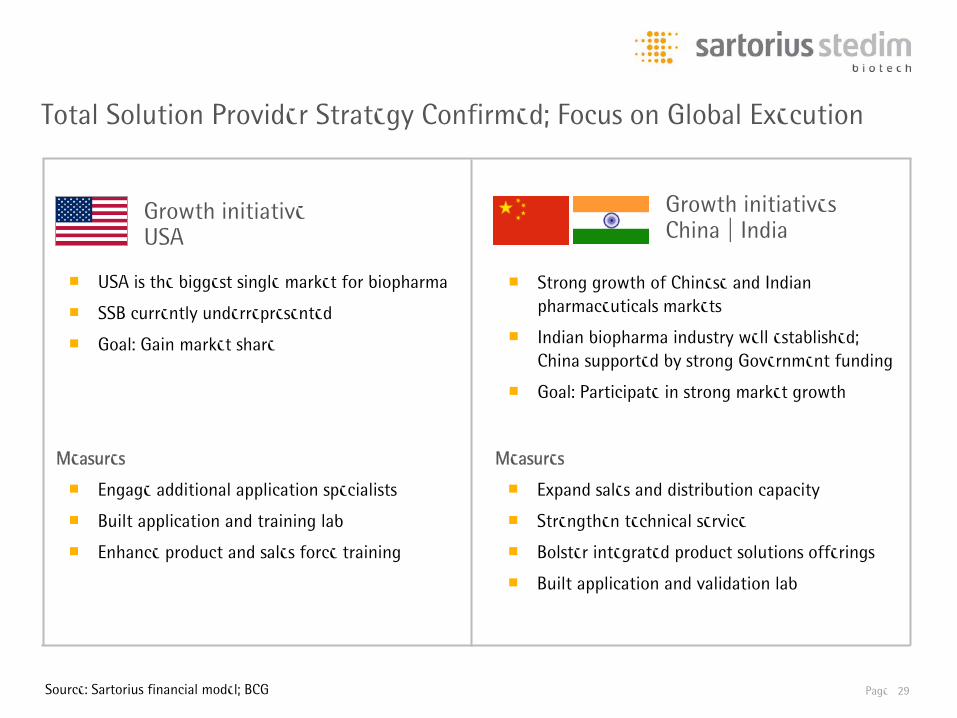
Total Solution Provider Strategy Confirmed; Focus on Global Execution
■ USA is the biggest single market for biopharma
■ SSB currently underrepresented
■ Goal: Gain market share
Growth initiative USA
■ Strong growth of Chinese and Indian pharmaceuticals markets
■ Indian biopharma industry well established; China supported by strong Government funding
■ Goal: Participate in strong market growth
■ Engage additional application specialists
■ Built application and training lab
■ Enhance product and sales force training
■ Expand sales and distribution capacity
■ Strengthen technical service
■ Bolster integrated product solutions offerings
■ Built application and validation lab
Measures Measures
Growth initiativesChina | India
Source: Sartorius financial model; BCG
Page 30
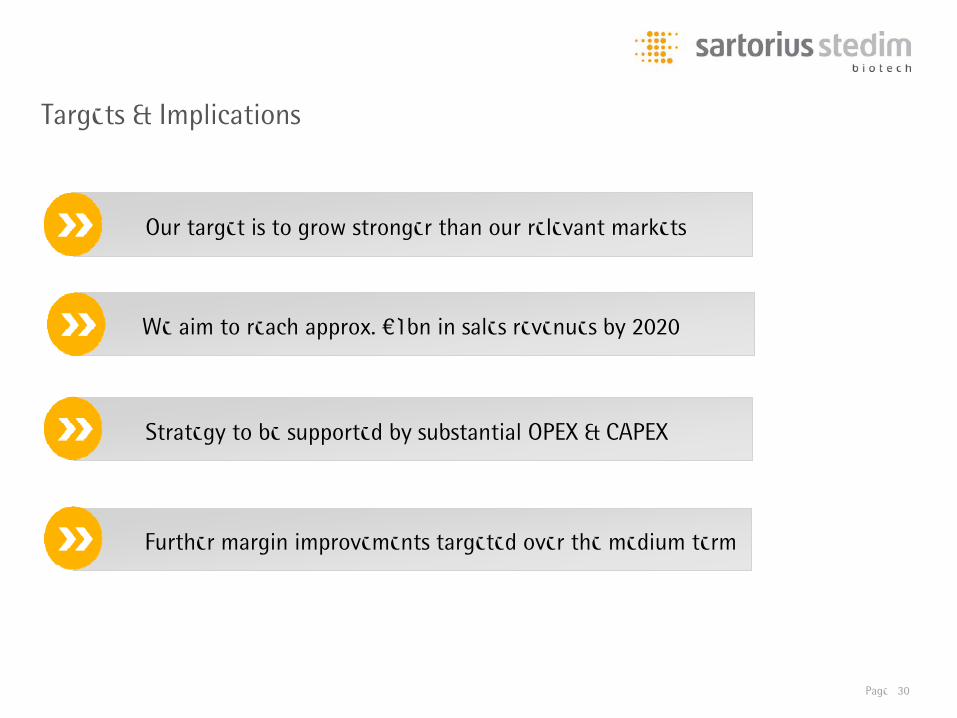
Targets & Implications
Our target is to grow stronger than our relevant markets
Strategy to be supported by substantial OPEX & CAPEX
Further margin improvements targeted over the medium term
We aim to reach approx. €1bn in sales revenues by 2020
___
Annual Shareholders‘ Meeting of Sartorius Stedim Biotech S.A. | April 17, 2012 | Aubagne |Annual
Shareholders‘ Meeting of Sartorius Stedim Biotech S.A. | April 17, 2012 | Aubagne | Annual Shareholders‘Meeting of Sartorius Stedim Biotech S.A. | April 17, 2012 | Aubagne | Annual Shareholders‘ Meeting of Sa
Thank you very much for your attention.
Joachim KreuzburgChairman of the Board and CEO
April 17, 2012, Aubagne