general shareholders’ meeting 30 april 2014 - cie automotive
TRANSCRIPT
Grupo industrial especializado en la gestión de procesos de alto valor añadido 1
General Shareholders’ Meeting
30 April 2014
Grupo industrial especializado en la gestión de procesos de alto valor añadido 2
INDEX
2013 Full Year Results
Strategic Thinking 2013-2017:“REAFIRMING OUR STRATEGY”
Results 31 March 2014

Grupo industrial especializado en la gestión de procesos de alto valor añadido 3
INDEX
2013 Full Year Results

4Industrial Group specialized in Managing High Value Added Processes
(Millones de euros)
31 Marzo 2009
31 Marzo 2010
• Net Income considering same exchange rate effect is higher by 6% comparing same period of previous year. Exchange rate effect reduces by € 3,6 mill net income
• Such Net Income is, basically, the recurrent of the Group, given that in 2013 non recurrent positive a nd negative effects have been offset in Profit and Los s statement: two negative effects 1) impairment of assets clasified as held-for-sale of Biofuel manufa cturing and 2) effect of liquidation of agreement included as consequence of reverse merger carried o ut in 2011 year. Positive effect is mainly due to tax credit activation
• Financial costs increase, that has partially offset operative improvement, is mainly due to: higher deb t in Autometal for purchases in 4Q2012 and 4Q2013; fi nancial costs increase in Brasil due to differentia l retribution assets/liabilities and investment liqui dation in brasilian real to reduce exposure because of currency risk
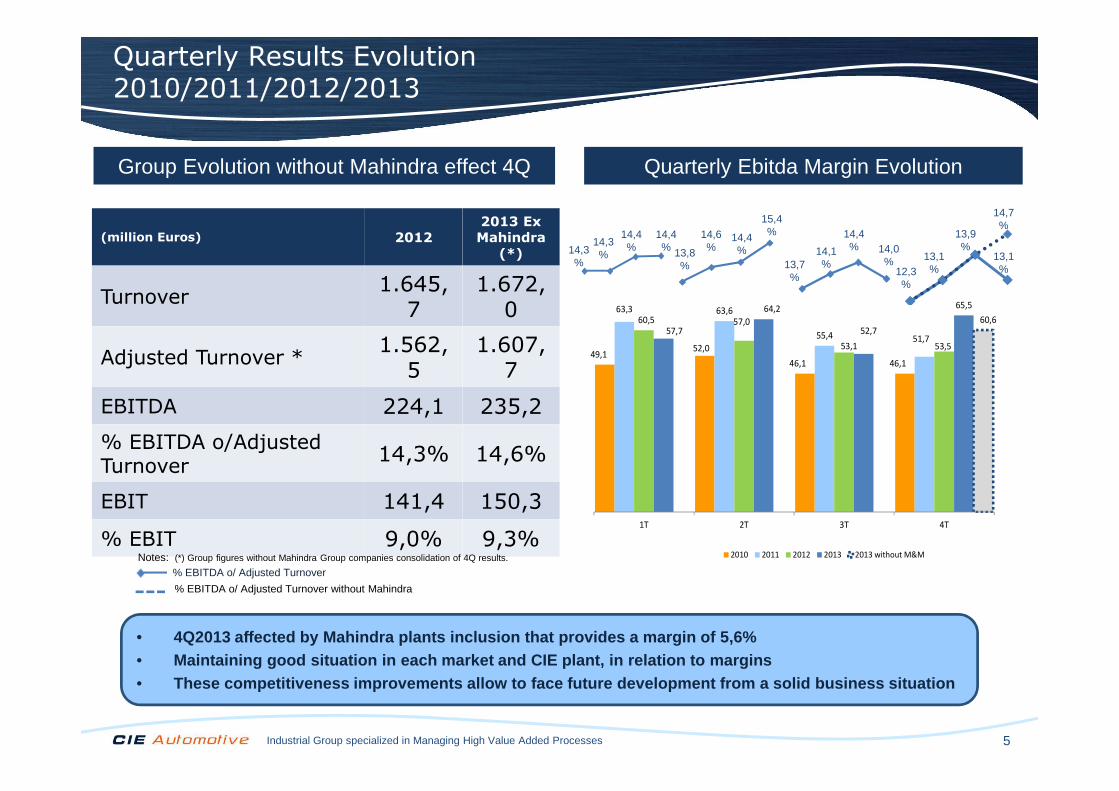
(million Euros) 2012 2013
Turnover 1.645,7 1.760,3
Adjusted Turnover * 1.562,5 1.696,0
EBITDA 224,1 240,1
% EBITDA o/ Adjusted Turnover 14,3% 14,2%
EBIT 141,4 150,4
% EBIT o/ Adjusted Turnover 9,0% 8,9%
Profit for the year 76,0 77,9
Net Income 61,0 60,1
8,5%
-1,5%
7,2%
6,4%
Notas: (*) Proforma value calculated by deducting turnover of diesel oil used for blending
EBITDA: Net Operating Income + Depreciation, EBIT: Net Operating Income; EBT: Profit before taxes from continuous activities; Net Income: Profit attributable to the company´sshareholders
CIE Automotive Group Results 2013
5Industrial Group specialized in Managing High Value Added Processes
49,152,0
46,1 46,1
63,3 63,6
55,4 51,7
60,5 57,0
53,1 53,5
57,7
64,2
52,7
65,5
60,6
1T 2T 3T 4T
2010 2011 2012 2013 2013 without M&M
• 4Q2013 affected by Mahindra plants inclusion that p rovides a margin of 5,6%• Maintaining good situation in each market and CIE p lant, in relation to margins• These competitiveness improvements allow to face fu ture development from a solid business situation
13,7%
14,1%
14,4%
13,1%12,3
%
13,9%
Quarterly Results Evolution2010/2011/2012/2013
13,8%
14,4%
14,6%
15,4%
14,3%
14,4%
14,4% 14,0
% 13,1%
14,3%
14,7%
Group Evolution without Mahindra effect 4Q Quarterly Ebitda Margin Evolution
(million Euros) 2012
2013 Ex
Mahindra
(*)
Turnover1.645,
71.672,
0
Adjusted Turnover *1.562,
51.607,
7
EBITDA 224,1 235,2
% EBITDA o/AdjustedTurnover
14,3% 14,6%
EBIT 141,4 150,3
% EBIT 9,0% 9,3%Notes: (*) Group figures without Mahindra Group companies consolidation of 4Q results.
% EBITDA o/ Adjusted Turnover without Mahindra
% EBITDA o/ Adjusted Turnover
6Industrial Group specialized in Managing High Value Added Processes
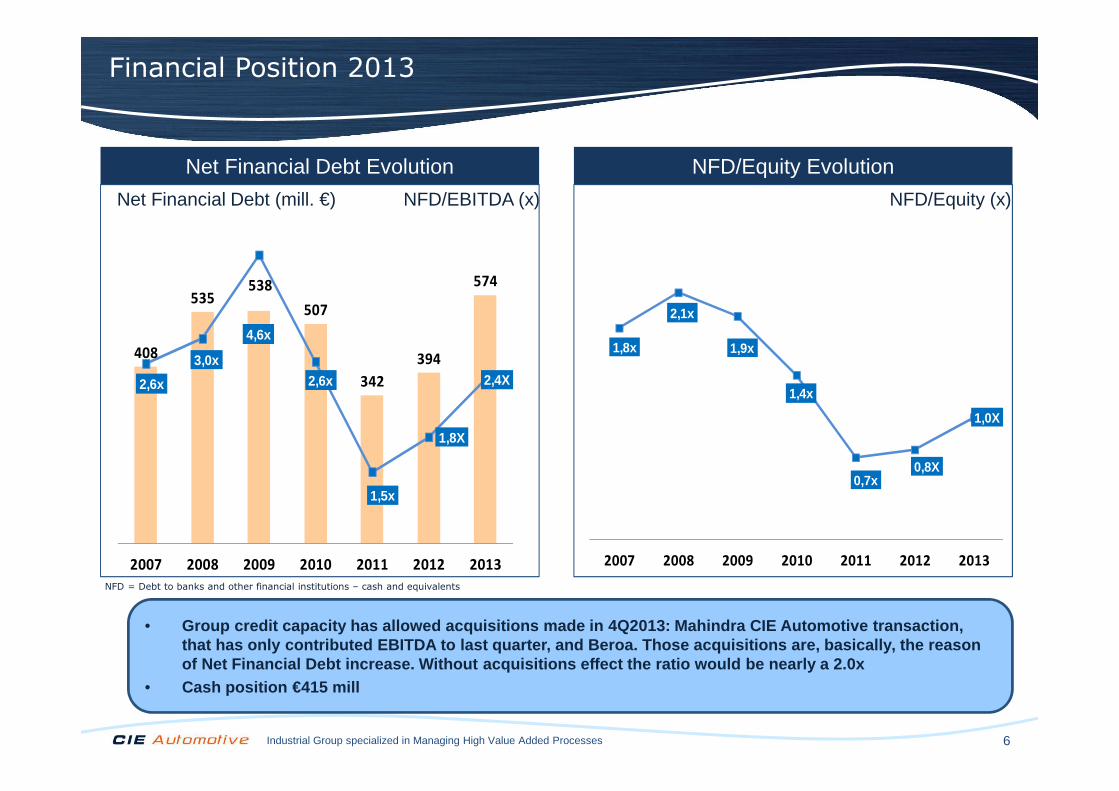
1,8x
2,1x
1,9x
1,4x
0,7x0,8X
1,0X
2007 2008 2009 2010 2011 2012 2013
408
535538
507
342
394
574
2,6x
3,0x
4,6x
2,6x
1,5x
1,8X
2,4X
1,0X
2,0X
4,0X
2007 2008 2009 2010 2011 2012 2013
.
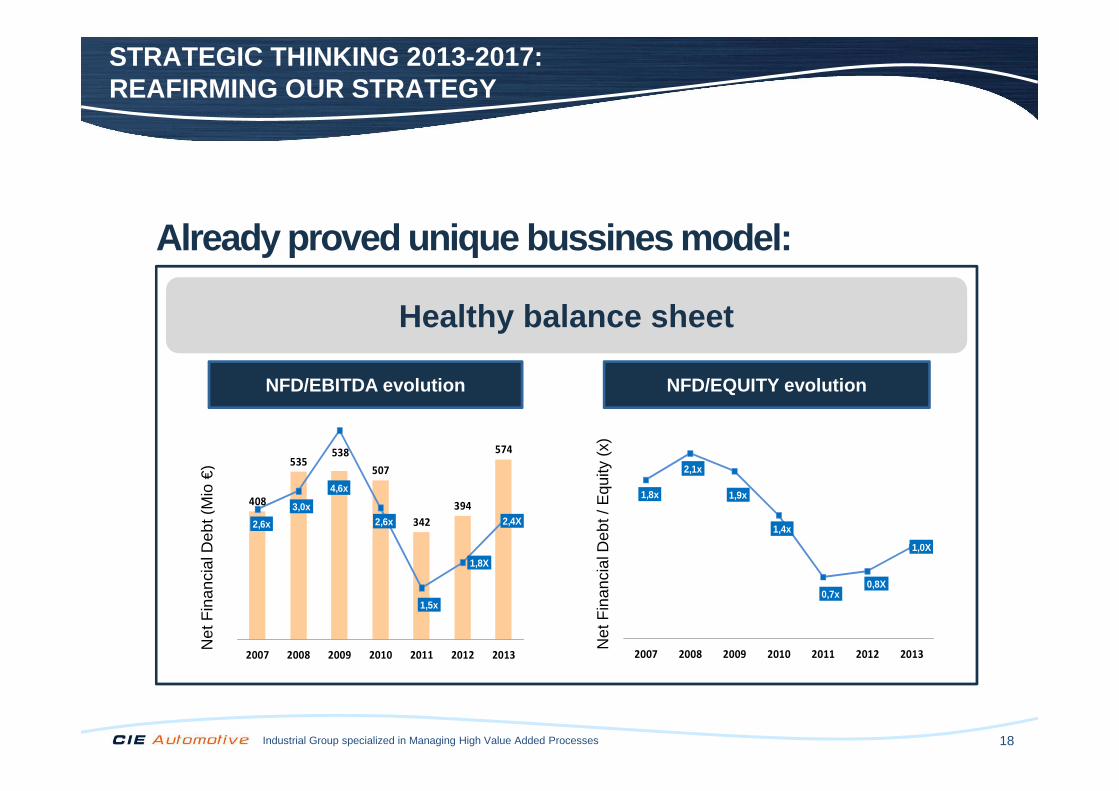
• Group credit capacity has allowed acquisitions made in 4Q 2013: Mahindra CIE Automotive transaction,that has only contributed EBITDA to last quarter, a nd Beroa. Those acquisitions are, basically, the re ason of Net Financial Debt increase. Without acquisition s effect the ratio would be nearly a 2.0x
• Cash position €415 mill
Net Financial Debt Evolution
NFD/EBITDA (x)Net Financial Debt (mill. €)
NFD/Equity Evolution
NFD/Equity (x)
NFD = Debt to banks and other financial institutions – cash and equivalents
Financial Position 2013
7Industrial Group specialized in Managing High Value Added Processes
Automotive: Continue margin improvements in Europe and good operating margin behavior in Brazil and Nafta
8Industrial Group specialized in Managing High Value Added Processes
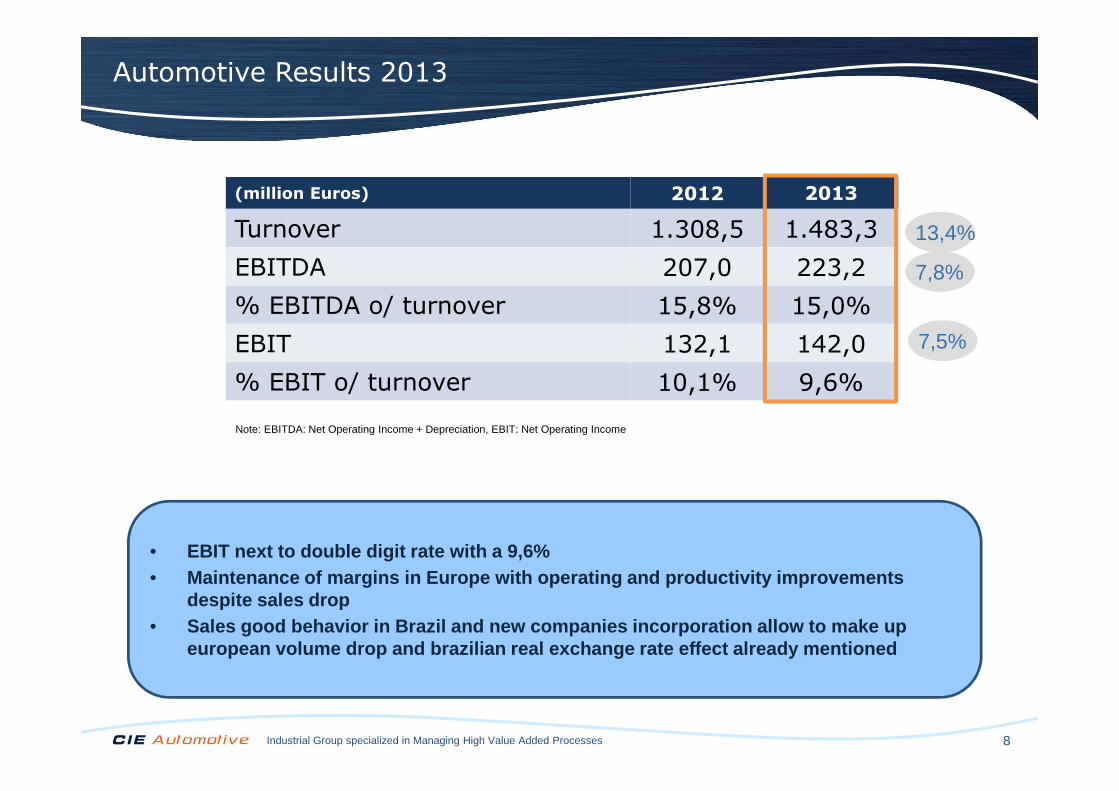
Note: EBITDA: Net Operating Income + Depreciation, EBIT: Net Operating Income
(Millones de euros)31 Marzo
2009(million Euros) 2012 2013
Turnover 1.308,5 1.483,3
EBITDA 207,0 223,2
% EBITDA o/ turnover 15,8% 15,0%
EBIT 132,1 142,0
% EBIT o/ turnover 10,1% 9,6%
• EBIT next to double digit rate with a 9,6%• Maintenance of margins in Europe with operating and productivity improvements
despite sales drop• Sales good behavior in Brazil and new companies inc orporation allow to make up
european volume drop and brazilian real exchange ra te effect already mentioned
13,4%
7,8%
7,5%
Automotive Results 2013

9Industrial Group specialized in Managing High Value Added Processes
(million Euros) 2012 2013
Turnover 641,0 889,6
EBITDA 108,0 123,7
% EBITDA 16,8% 13,9%
EBIT 85,0 91,7
% EBIT 13,3% 10,3%
(million Euros) 2012 2013
Turnover 667,5 593,6
EBITDA 99,1 99,5
% EBITDA 14,8% 16,8%
EBIT 47,0 50,3
% EBIT 7,0% 8,5%
• Americas: In Brazil margins improvement compared to
• Despite mentioned effects, EBIT margin continues above 10%
• Americas: In Brazil margins improvement compared to previous year; In NAFTA motor vehicle production market growth of 5% vs. previous year; Additional growth due to Century and Nanjing incorporation with margins below average that makes average global margins be lower
• Europe and India: CIE Forging companies results integration in 2S2013, as well as those new companies from Mahindra CIE Group with still low margins that decrease the global average margin
• Exchange rate to Euro has a negative impact in the comparison of this period of €10,9 mill approximately in EBITDA
• Despite mentioned effects, EBIT margin continues above 10%
Ex - Autometal
Autometal
• Sales volume drop due to exit of CIE Forging companies fromthe scope of consolidation in 2S2013
• Sales level maintenance compared to same period and 2012 same scope of consolidation aligned with market behavior
• Continue growing margins due to operating improvement and productivity. EBITDA and EBIT improvements vs. 2012
• European plants in a high operating profitability level ready to face market recovery
Automotive Results 2013
10Industrial Group specialized in Managing High Value Added Processes
0,00
0,50
1,00
1,50
2,00
Mil
lon
ve
híc
les/
mo
nth
Europe Brazil NAFTA India Mix CIE
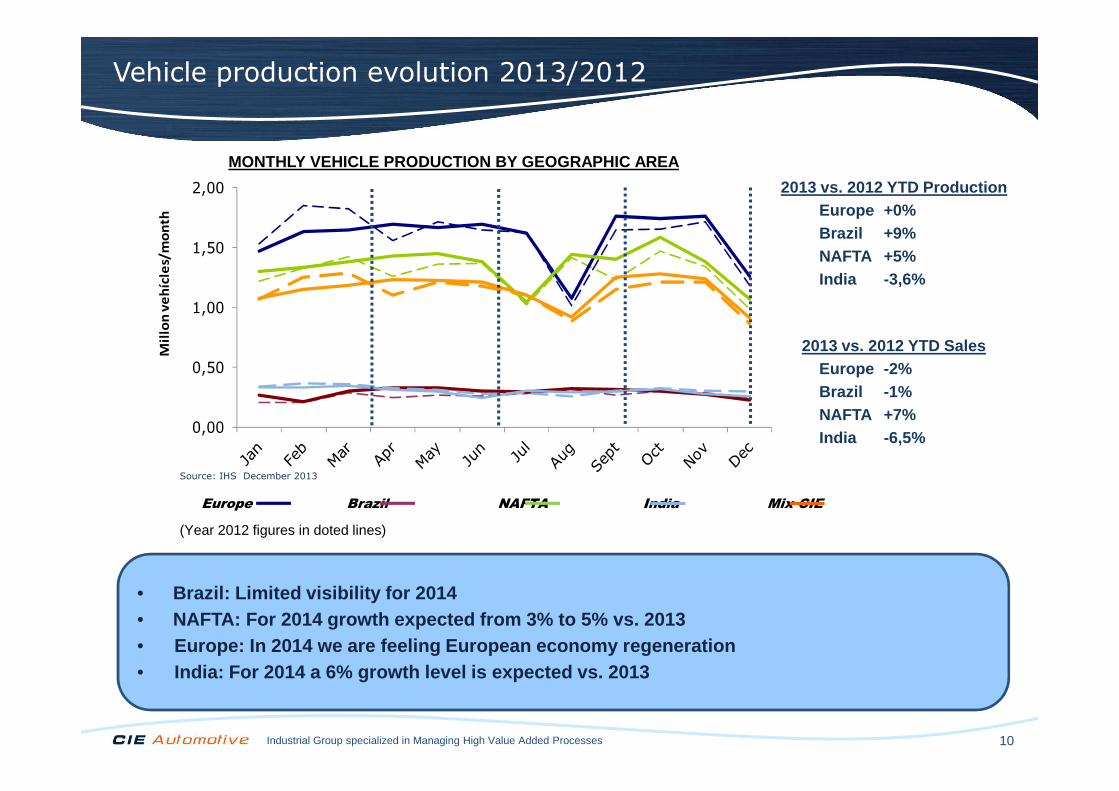
• Brazil: Limited visibility for 2014• NAFTA: For 2014 growth expected from 3% to 5% vs. 2 013• Europe: In 2014 we are feeling European economy reg eneration• India: For 2014 a 6% growth level is expected vs. 2 013
(Year 2012 figures in doted lines)
2013 vs. 2012 YTD SalesEurope -2%Brazil -1%NAFTA +7%India -6,5%
2013 vs. 2012 YTD ProductionEurope +0%Brazil +9%NAFTA +5%India -3,6%
MONTHLY VEHICLE PRODUCTION BY GEOGRAPHIC AREA
Source: IHS December 2013
Vehicle production evolution 2013/2012

11Industrial Group specialized in Managing High Value Added Processes
Dominion and Biofuels
12Industrial Group specialized in Managing High Value Added Processes
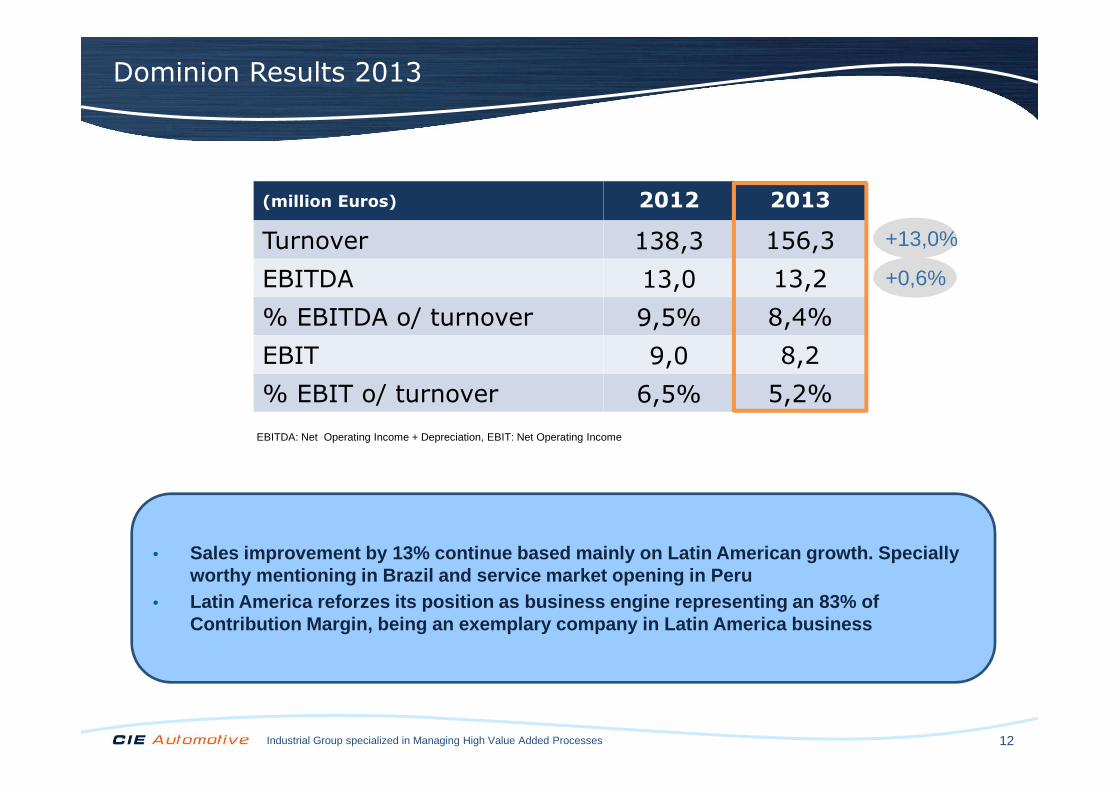
EBITDA: Net Operating Income + Depreciation, EBIT: Net Operating Income
31 Marzo 2009
31 Marzo 2010
• Sales improvement by 13% continue based mainly on L atin American growth. Specially worthy mentioning in Brazil and service market open ing in Peru
• Latin America reforzes its position as business eng ine representing an 83% of Contribution Margin, being an exemplary company in Latin America business
(million Euros) 2012 2013
Turnover 138,3 156,3
EBITDA 13,0 13,2
% EBITDA o/ turnover 9,5% 8,4%
EBIT 9,0 8,2
% EBIT o/ turnover 6,5% 5,2%
+13,0%
+0,6%
Dominion Results 2013

13Industrial Group specialized in Managing High Value Added Processes
(Millones de euros)
Notes: (*) Proforma value calculated by deducting turnover of diesel oil used for blending
EBITDA: Net Operating Income + Depreciation, EBIT: Net Operating Income
31 Marzo 2009
31 Marzo 2010
• Focusing on recycled oils segments searching for ef ficiency and profitability through biofuels commercialitation, production from recycle d oils and oils collection
• Complicated regulatory situation in sector and comm ercial uncertainty will maintain business in a low activity level
(million Euros) 2012 2013
Turnover 198,9 120,7
Adjusted Turnover* 115,7 56,4
EBITDA 3,9 3,7
EBIT 0,3 0,2
-51,2%
-6,0%
Biofuels Results 2013
14Grupo industrial especializado en la gestión de procesos de alto valor añadido
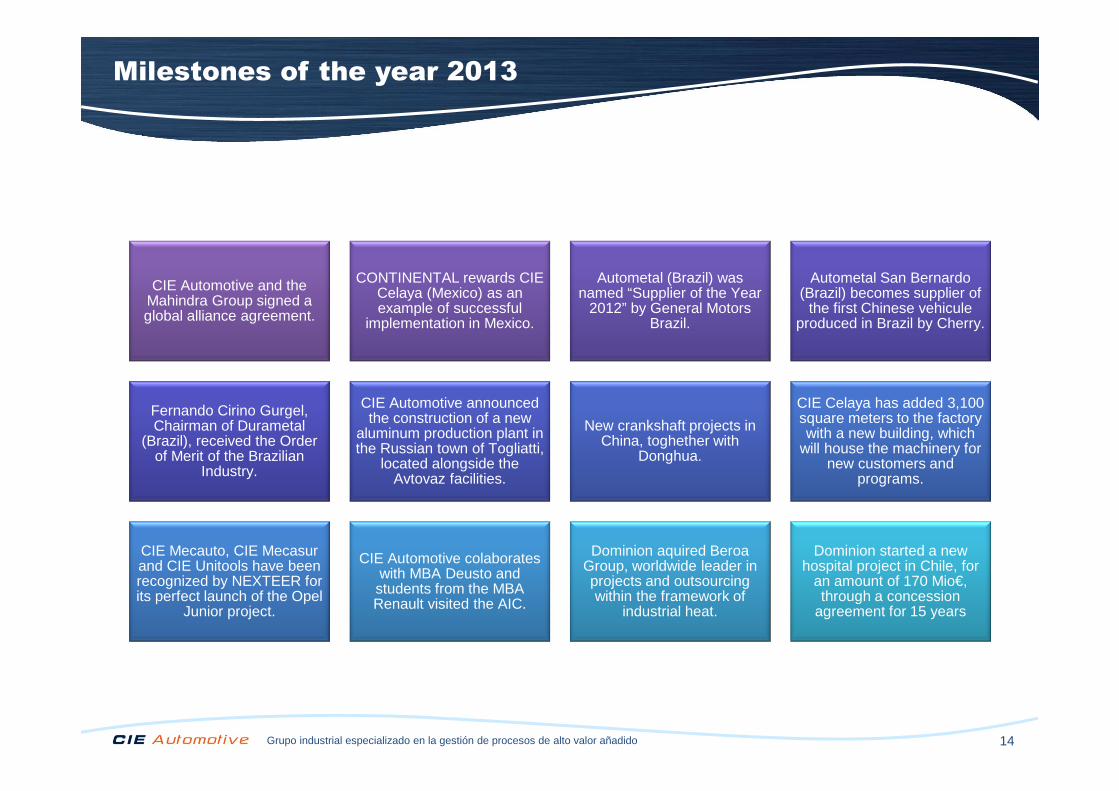
Milestones of the year 2013
CIE Automotive and the Mahindra Group signed a global alliance agreement.
CONTINENTAL rewards CIE Celaya (Mexico) as an example of successful
implementation in Mexico.
Autometal (Brazil) was named “Supplier of the Year
2012” by General Motors Brazil.
Autometal San Bernardo (Brazil) becomes supplier of
the first Chinese vehicule produced in Brazil by Cherry.
Fernando Cirino Gurgel, Chairman of Durametal
(Brazil), received the Order of Merit of the Brazilian
Industry.
CIE Automotive announced the construction of a new
aluminum production plant in the Russian town of Togliatti,
located alongside the Avtovaz facilities.
New crankshaft projects in China, toghether with
Donghua.
CIE Celaya has added 3,100 square meters to the factory with a new building, which
will house the machinery for new customers and
programs.
CIE Mecauto, CIE Mecasur and CIE Unitools have been recognized by NEXTEER for its perfect launch of the Opel
Junior project.
CIE Automotive colaborates with MBA Deusto and students from the MBA Renault visited the AIC.
Dominion aquired Beroa Group, worldwide leader in projects and outsourcing within the framework of
industrial heat.
Dominion started a new hospital project in Chile, for
an amount of 170 Mio€, through a concession
agreement for 15 years

Grupo industrial especializado en la gestión de procesos de alto valor añadido 15
INDEX
Strategic Thinking 2013-2017: “REAFIRMING OUR STRATEGY”

Grupo industrial especializado en la gestión de procesos de alto valor añadido 16
2013-2017 we analyzed CIE and its environment
In t
he
Str
ate
gic
Pla
n Automotive industry is undergoing a fast transformation in order toadapt itself to main trends of the Sector…
Increasingimportance of Asian Market
Great concentration in few big players
Industry drivers: Consumption and
emissions reduction / Security / Confort
STRATEGIC THINKING 2013-2017: REAFIRMING OUR STRATEGY
…while the digitalization process world wide continues

Industrial Group specialized in Managing High Value Added Processes 17
Already proved unique bussines model:
Sustainable and profitable growth history
SALES evolution (Mio€) EBITDA evolution (Mio€)
STRATEGIC THINKING 2013-2017: REAFIRMING OUR STRATEGY
481
1.696
2002 2003 2004 2005 2006 2007 2008 2009 2010 2011 2012 2013
53
240
2002 2003 2004 2005 2006 2007 2008 2009 2010 2011 2012 2013
Industrial Group specialized in Managing High Value Added Processes 18
Already proved unique bussines model:
NFD/EBITDA evolution
Net
Fin
anci
al D
ebt (
Mio
€)
NFD/EQUITY evolution
STRATEGIC THINKING 2013-2017: REAFIRMING OUR STRATEGY
408
535538
507
342
394
574
2,6x
3,0x
4,6x
2,6x
1,5x
1,8X
2,4X
1,0X
2,0X
4,0X
2007 2008 2009 2010 2011 2012 2013
1,8x
2,1x
1,9x
1,4x
0,7x0,8X
1,0X
2007 2008 2009 2010 2011 2012 2013
Healthy balance sheet
Net
Fin
anci
al D
ebt /
Equ
ity (
x)

Industrial Group specialized in Managing High Value Added Processes 19
2013-2017 we set the following overall goals:
In t
he
Str
ate
gic
Pla
n Sales evolution (Mio€)
0
500
1000
1500
2000
2500
3000
3500
EBITDA evolution (Mio€)
50100150200250300350400450500
STRATEGIC THINKING 2013-2017: REAFIRMING OUR STRATEGY
TARGET >3 BIL€
TARGET ≈ 14%
20172017

Industrial Group specialized in Managing High Value Added Processes 20
2013-2017 we set the following overall goals:
In t
he
Str
ate
gic
Pla
n % EBIT evolution % RONA evolution
0,0%1,0%2,0%3,0%4,0%5,0%6,0%7,0%8,0%9,0%
10,0%
STRATEGIC THINKING 2013-2017: REAFIRMING OUR STRATEGY
0,0%
5,0%
10,0%
15,0%
20,0%
25,0%
2017 2017TARGET ≈20%
TARGET >9%
20172017

Industrial Group specialized in Managing High Value Added Processes 21
…a realityToday these strategic objectives are…
STRATEGIC THINKING 2013-2017: REAFIRMING OUR STRATEGY
Strategic Plan aims the profitable growth of the Group, generating high value for shareholder
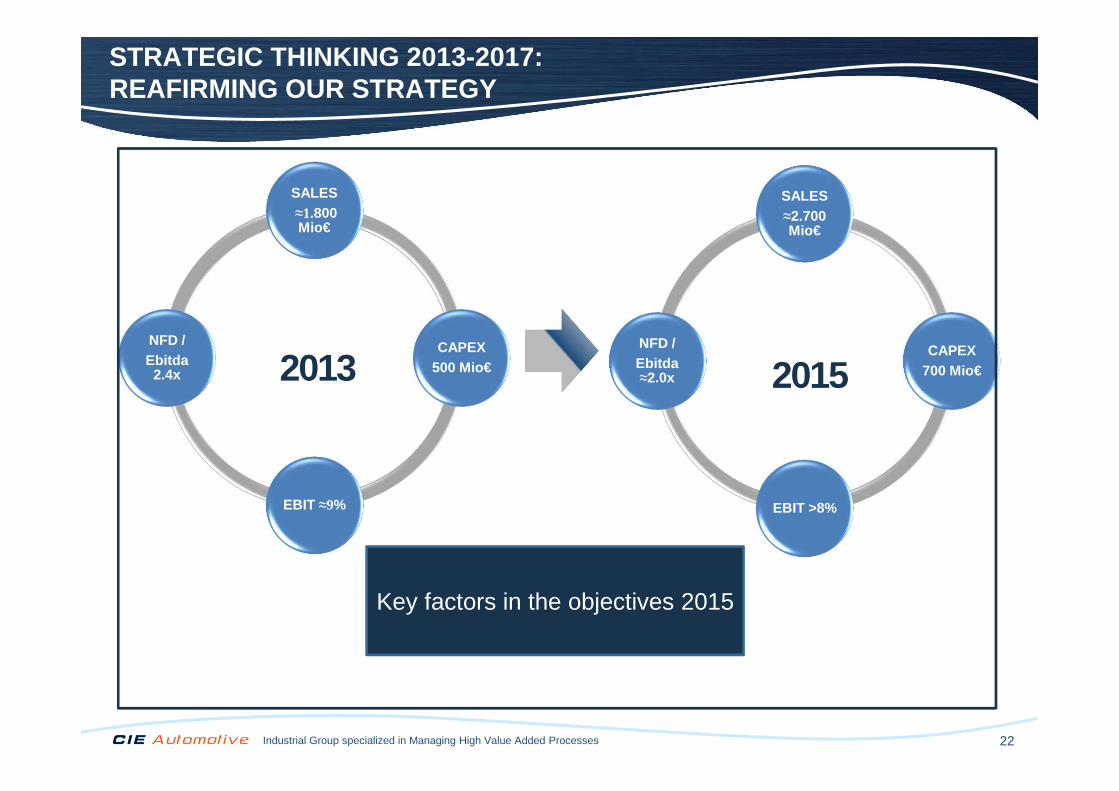
Industrial Group specialized in Managing High Value Added Processes 22
SALES≈1.800 Mio€
CAPEX500 Mio€
EBIT ≈9%
NFD / Ebitda
2.4x
SALES≈2.700 Mio€
CAPEX700 Mio€
EBIT >8%
NFD / Ebitda≈2.0x
STRATEGIC THINKING 2013-2017: REAFIRMING OUR STRATEGY
2013 2015
Key factors in the objectives 2015
Industrial Group specialized in Managing High Value Added Processes 23
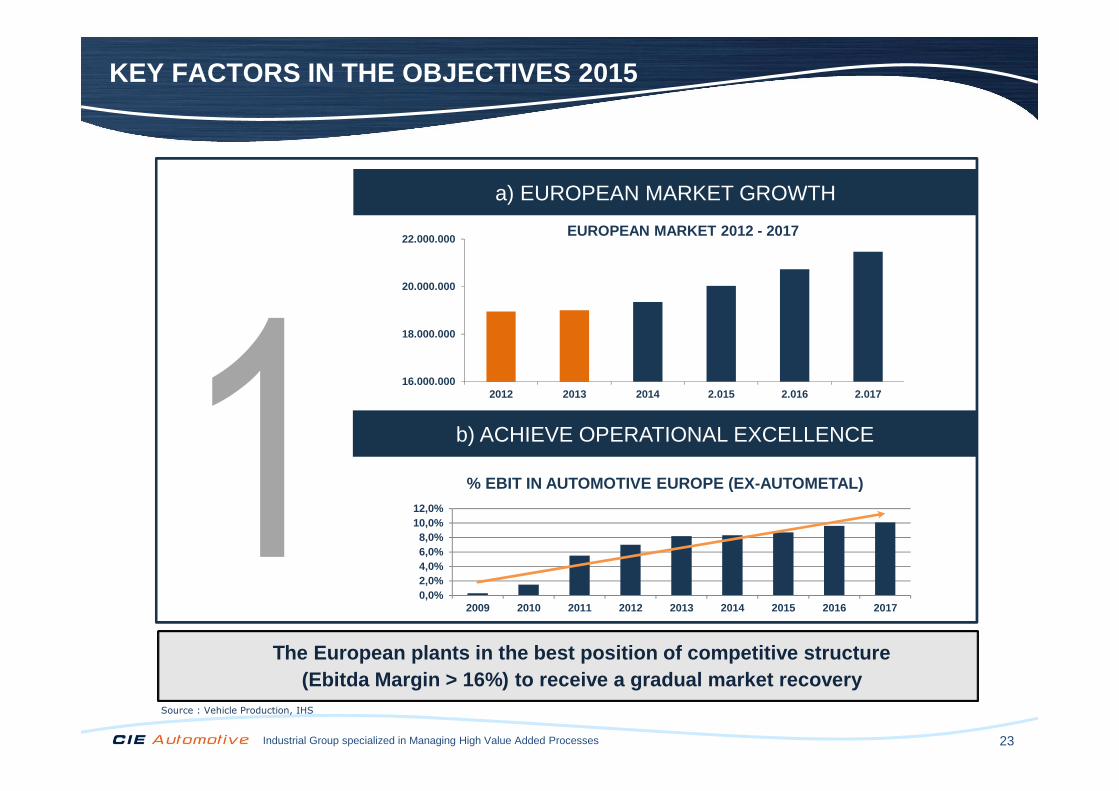
KEY FACTORS IN THE OBJECTIVES 2015
a) EUROPEAN MARKET GROWTH
The European plants in the best position of competi tive structure(Ebitda Margin > 16%) to receive a gradual market re covery
16.000.000
18.000.000
20.000.000
22.000.000
2012 2013 2014 2.015 2.016 2.017
EUROPEAN MARKET 2012 - 2017
Source : Vehicle Production, IHS
b) ACHIEVE OPERATIONAL EXCELLENCE
0,0%2,0%4,0%6,0%8,0%
10,0%12,0%
2009 2010 2011 2012 2013 2014 2015 2016 2017
% EBIT IN AUTOMOTIVE EUROPE (EX-AUTOMETAL)
Industrial Group specialized in Managing High Value Added Processes 24
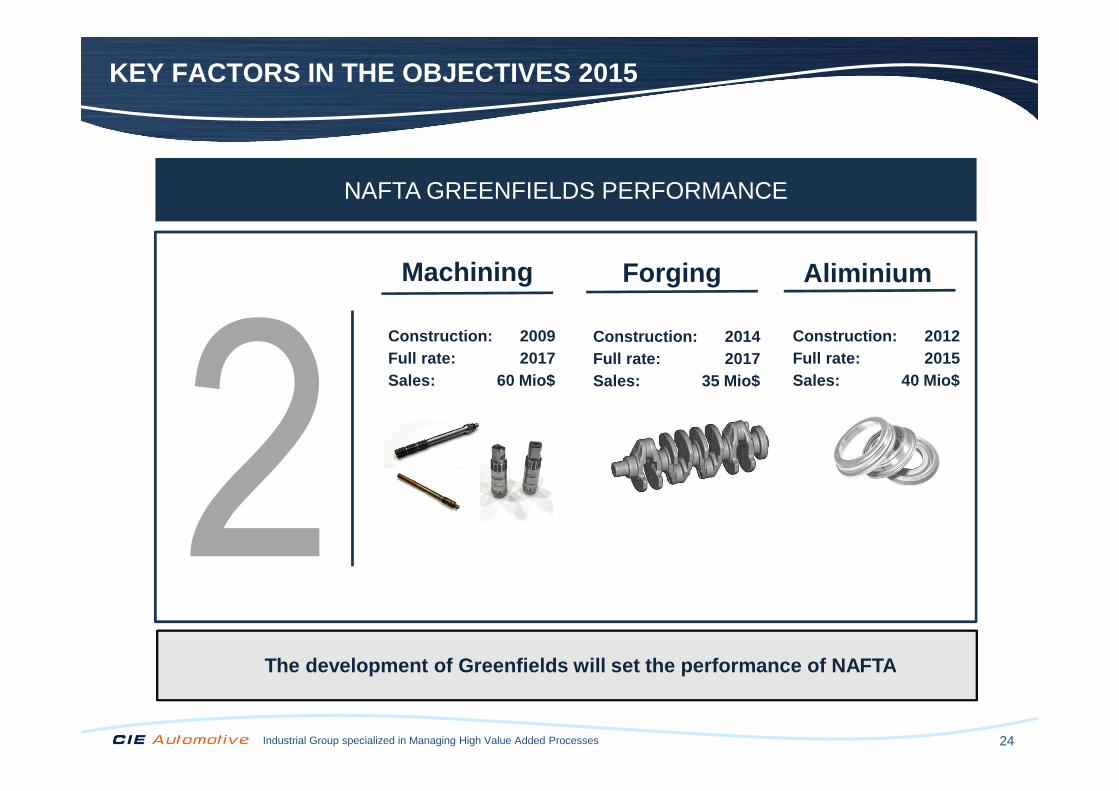
KEY FACTORS IN THE OBJECTIVES 2015
NAFTA GREENFIELDS PERFORMANCE
The development of Greenfields will set the perform ance of NAFTA
Machining Forging
Construction: 2009Full rate: 2017Sales: 60 Mio$
Construction: 2014Full rate: 2017Sales: 35 Mio$
Aliminium
Construction: 2012Full rate: 2015Sales: 40 Mio$

Industrial Group specialized in Managing High Value Added Processes 25
KEY FACTORS IN THE OBJECTIVES 2015
ACTION PLAN RESULTS IN GERMANY
The ambitious Action Plan defined for German Forges begins to show results in the 1Q2014 and will provide additional improvements in coming quarters
with a commitment to improve EBITDA in 30 Mio €, without expecting high growth in
demand
The new management team of MFE have defined: a) Optimization of flows and increase production efficiencyb) Outsourcing of non-core processes c) Automate processes d) Agree on new prices with Daimler
-4,0%
1,0%
6,0%
2013 2014 2015 2016
% EBIT MAHINDRA EUROPE

Industrial Group specialized in Managing High Value Added Processes 26
KEY FACTORS IN THE OBJECTIVES 2015
GRADUAL IMPROVEMENT IN INDIA
The 1Q2014 already reflects part of the expected gr adual improvement. Indian plants are expecting market growth while continuing to operational optimization
TOTAL INDIA 2014
Source : Vehicle Production, IHS
� Operational
optimization
� Use of CIE
resources
(commercial
network,
engineering, etc.)
� Introduction in
CIE Culture
0
1.000.000
2.000.000
3.000.000
4.000.000
5.000.000
6.000.000
2012 2013 2014 2.015 2.016 2.017
INDIAN MARKET 2012 - 2017
0,0%2,0%4,0%6,0%8,0%
10,0%12,0%
2013 2014 2015 2016 2017
% EBIT MAHINDRA INDIA

Industrial Group specialized in Managing High Value Added Processes 27
KEY FACTORS IN THE OBJECTIVES 2015
PRODUCTIVE MEANS ADAPTATION IN BRAZIL
The country circumstances and the uncertainties of the economy, with a possible drop in volumes, and a requirement of competitivene ss improve; the challenge
will focus on maintaining margins
0
1.000.000
2.000.000
3.000.000
4.000.000
5.000.000
2012 2013 2014 2.015 2.016 2.017
BRAZILIAN MARKET 2012 - 2017
Source : Vehicle Production, IHS
Industrial Group specialized in Managing High Value Added Processes 28
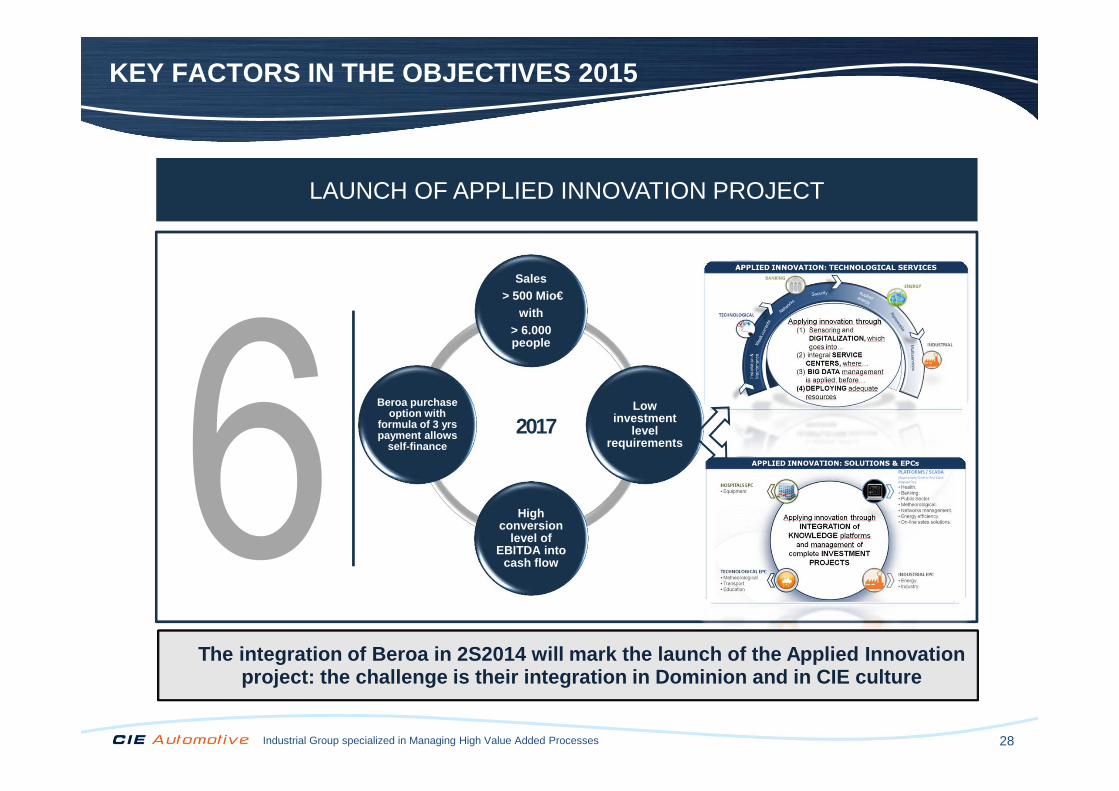
KEY FACTORS IN THE OBJECTIVES 2015
LAUNCH OF APPLIED INNOVATION PROJECT
Sales> 500 Mio€
with > 6.000 people
Lowinvestment
levelrequirements
High conversion
level of EBITDA into
cash flow
Beroa purchase option with
formula of 3 yrs payment allows
self-finance
2017
The integration of Beroa in 2S2014 will mark the la unch of the Applied Innovation project: the challenge is their integration in Domi nion and in CIE culture
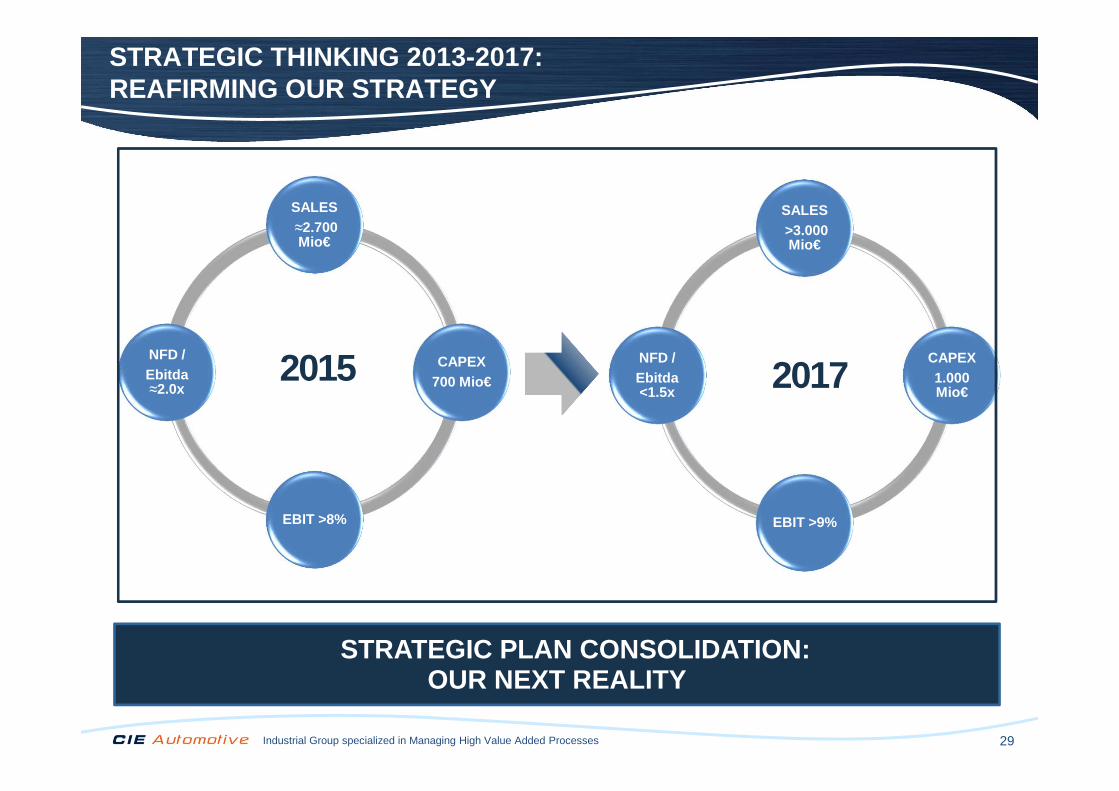
Industrial Group specialized in Managing High Value Added Processes 29
SALES≈2.700 Mio€
CAPEX700 Mio€
EBIT >8%
NFD / Ebitda≈2.0x
SALES>3.000 Mio€
CAPEX1.000 Mio€
EBIT >9%
NFD / Ebitda<1.5x
STRATEGIC PLAN CONSOLIDATION:OUR NEXT REALITY
STRATEGIC THINKING 2013-2017: REAFIRMING OUR STRATEGY
2015 2017
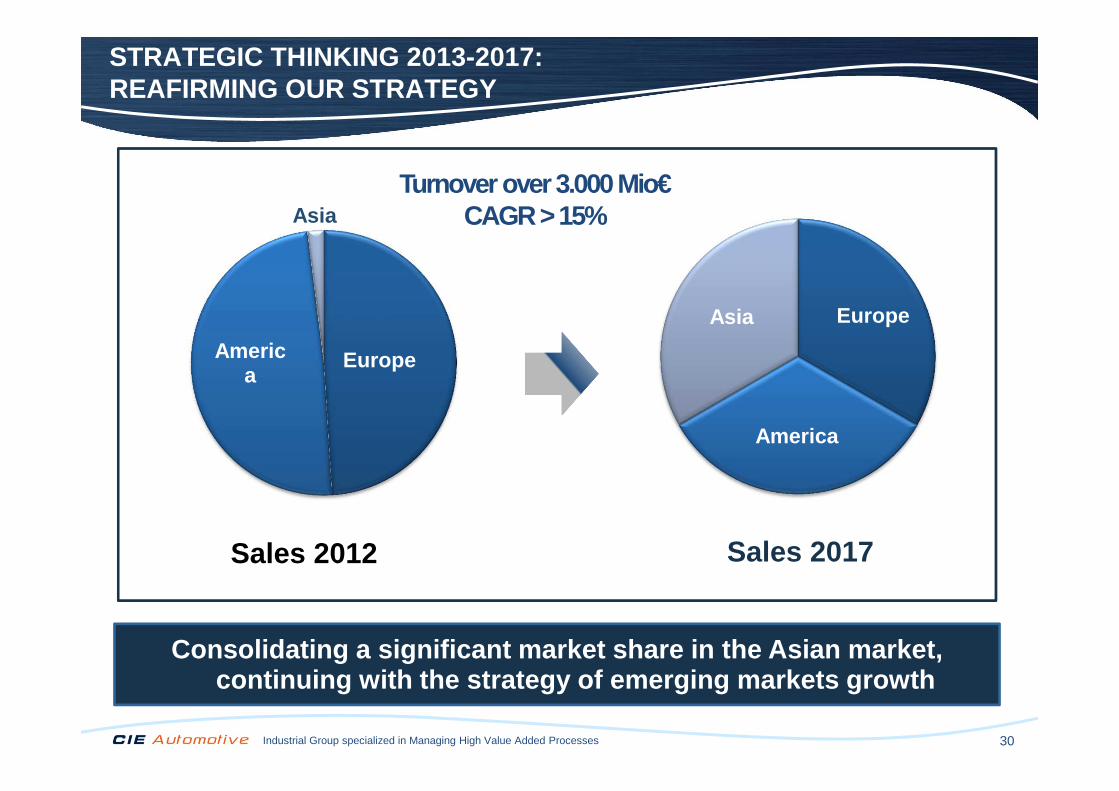
Industrial Group specialized in Managing High Value Added Processes 30
EuropeAmerica
Asia
Sales 2012
Europe
America
Asia
Sales 2017
Consolidating a significant market share in the Asi an market, continuing with the strategy of emerging markets gr owth
Turnover over 3.000 Mio€CAGR > 15%
STRATEGIC THINKING 2013-2017: REAFIRMING OUR STRATEGY
Grupo industrial especializado en la gestión de procesos de alto valor añadido 31
INDEX
Results 31 March 2014

32Industrial Group specialized in Managing High Value Added Processes
CIE Automotive – Results 31 March 2014
33Industrial Group specialized in Managing High Value Added Processes
(Millones de euros)
31 Marzo2009
31 Marzo2010
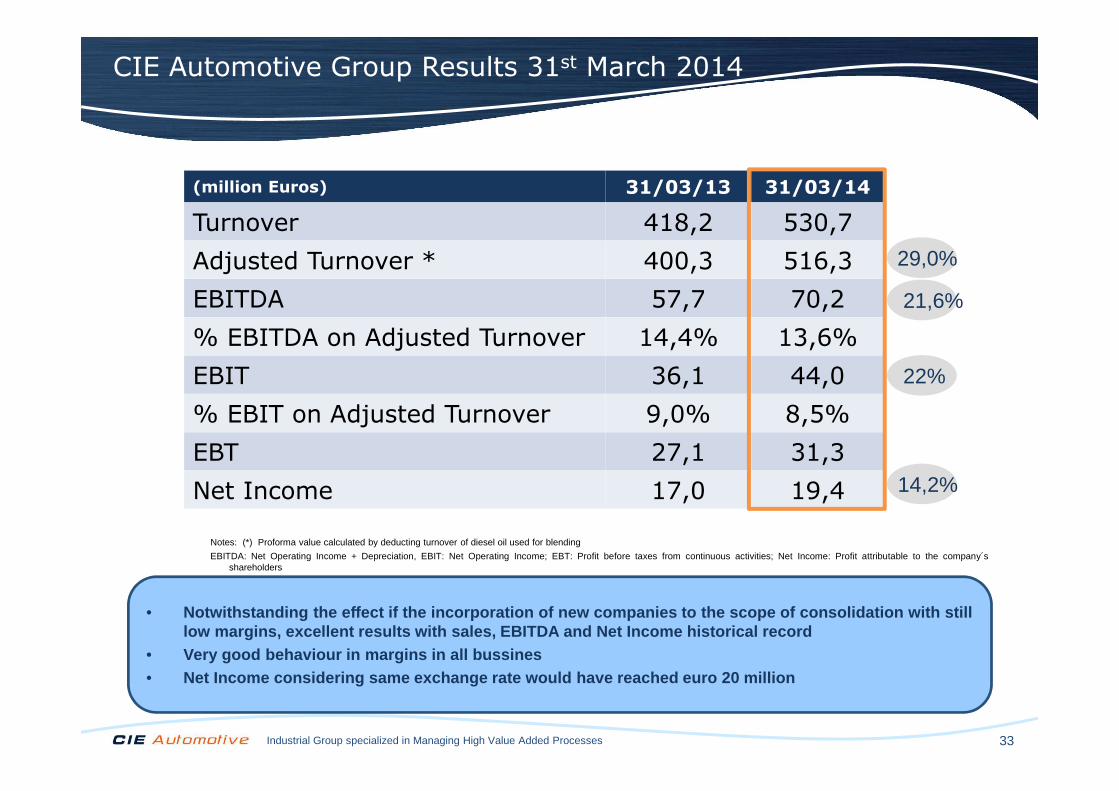
• Notwithstanding the effect if the incorporation of new companies to the scope of consolidation with st ill low margins, excellent results with sales, EBITDA a nd Net Income historical record
• Very good behaviour in margins in all bussines• Net Income considering same exchange rate would hav e reached euro 20 million
Notes: (*) Proforma value calculated by deducting turnover of diesel oil used for blending
EBITDA: Net Operating Income + Depreciation, EBIT: Net Operating Income; EBT: Profit before taxes from continuous activities; Net Income: Profit attributable to the company´sshareholders
CIE Automotive Group Results 31st March 2014
(million Euros) 31/03/13 31/03/14
Turnover 418,2 530,7
Adjusted Turnover * 400,3 516,3
EBITDA 57,7 70,2
% EBITDA on Adjusted Turnover 14,4% 13,6%
EBIT 36,1 44,0
% EBIT on Adjusted Turnover 9,0% 8,5%
EBT 27,1 31,3
Net Income 17,0 19,4
29,0%
14,2%
21,6%
22%
34Industrial Group specialized in Managing High Value Added Processes
63,3 63,6
55,4 51,7
60,5 57,0
53,1 53,5
57,7
64,2
52,7
65,570,2
61,1
1T 2T 3T 4T
2011 2012 2013 2014 Sin M&M
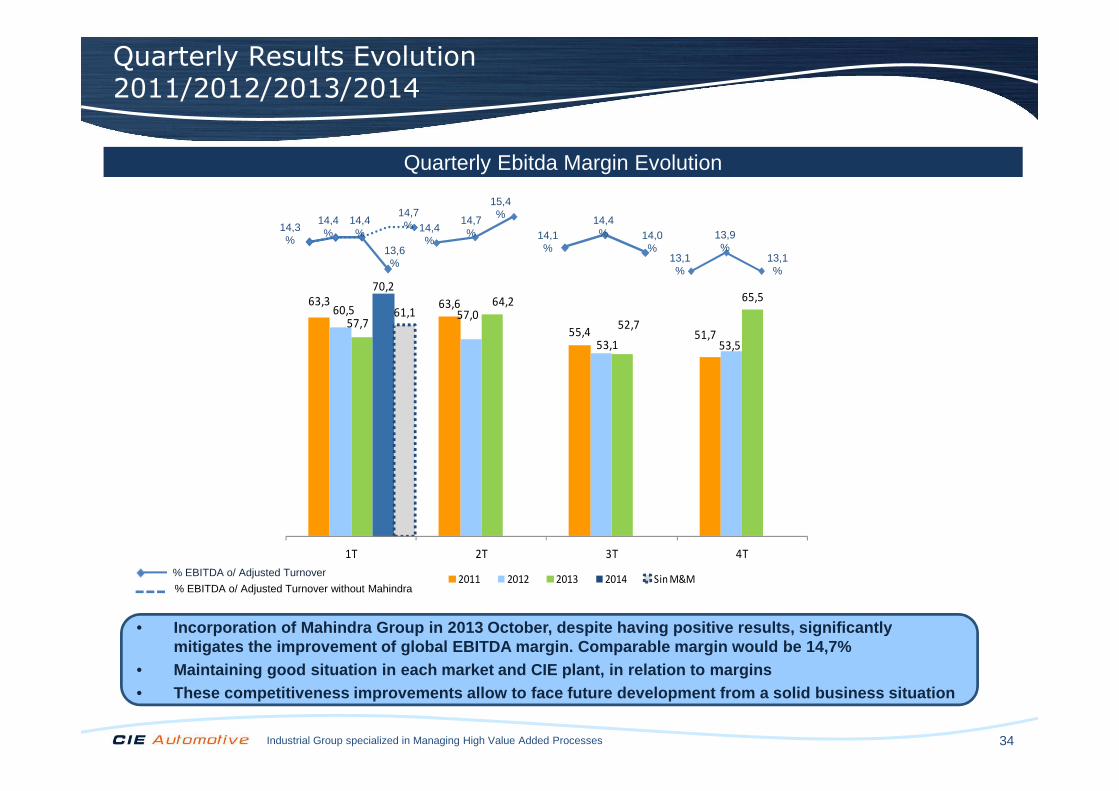
• Incorporation of Mahindra Group in 2013 October, de spite having positive results, significantly mitigates the improvement of global EBITDA margin. Comparable margin would be 14,7%
• Maintaining good situation in each market and CIE p lant, in relation to margins• These competitiveness improvements allow to face fu ture development from a solid business situation
Quarterly Results Evolution2011/2012/2013/2014
Quarterly Ebitda Margin Evolution
% EBITDA o/ Adjusted Turnover without Mahindra
% EBITDA o/ Adjusted Turnover
14,3%
14,4%
14,7%
15,4%
14,1%
14,4% 14,0
%13,9%
13,1%
13,1%
14,4%
14,7%
13,6%
14,4%
35Industrial Group specialized in Managing High Value Added Processes
Automotive: Market and margins improvement in Europe and good behavior in Nafta
36Industrial Group specialized in Managing High Value Added Processes
Note: EBITDA: Net Operating Income + Depreciation, EBIT: Net Operating Income
(Millones de euros)31 Marzo
2009
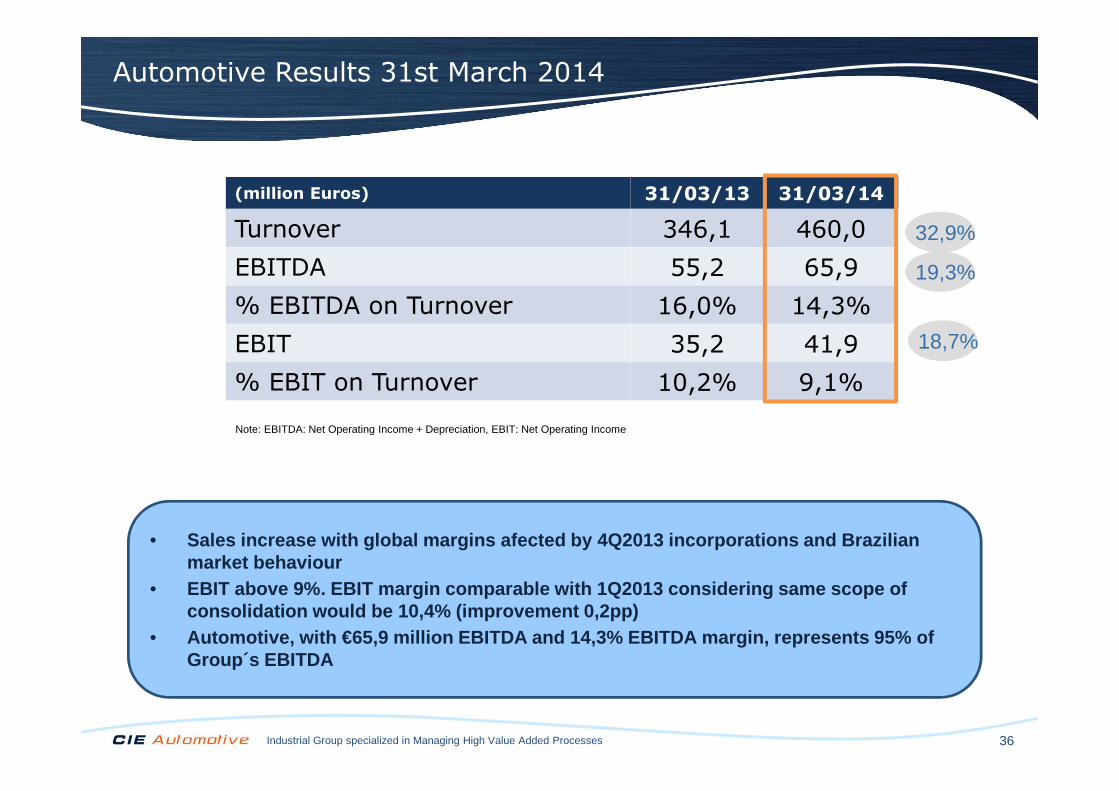
• Sales increase with global margins afected by 4Q201 3 incorporations and Brazilian market behaviour
• EBIT above 9%. EBIT margin comparable with 1Q2013 c onsidering same scope of consolidation would be 10,4% (improvement 0,2pp)
• Automotive, with €65,9 million EBITDA and 14,3% EBI TDA margin, represents 95% of Group´s EBITDA
Automotive Results 31st March 2014
(million Euros) 31/03/13 31/03/14
Turnover 346,1 460,0
EBITDA 55,2 65,9
% EBITDA on Turnover 16,0% 14,3%
EBIT 35,2 41,9
% EBIT on Turnover 10,2% 9,1%
32,9%
19,3%
18,7%
37Industrial Group specialized in Managing High Value Added Processes
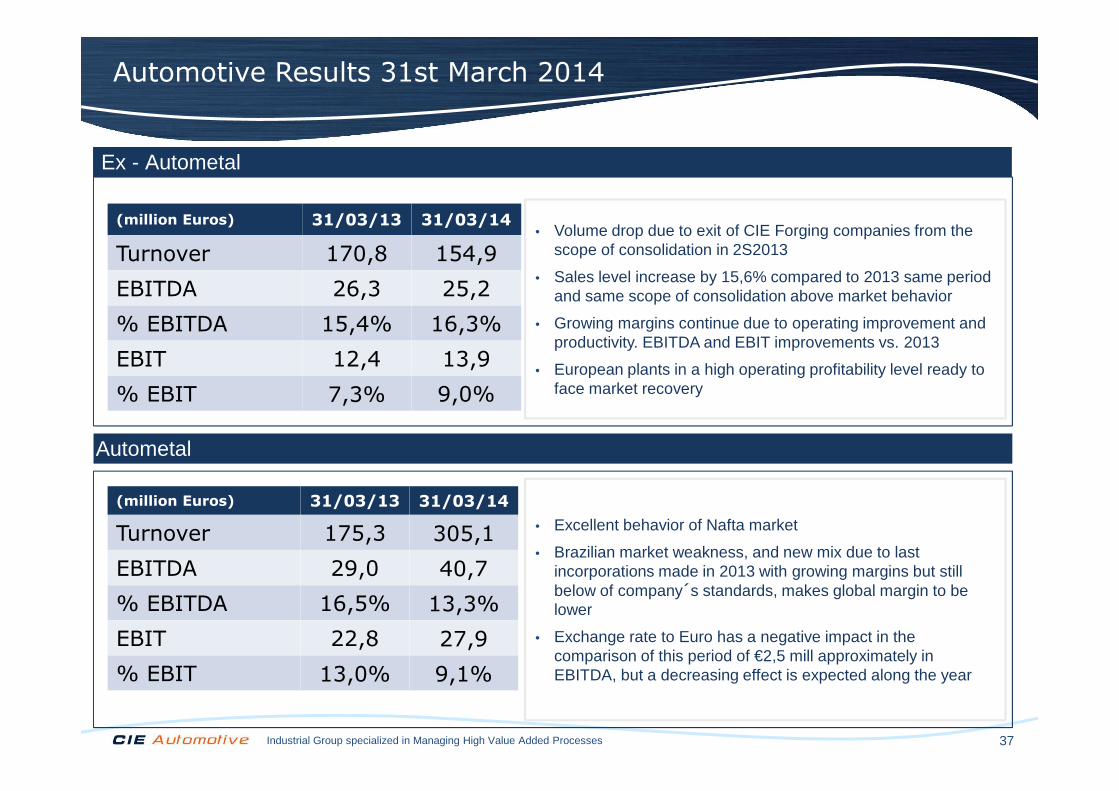
• Excellent behavior of Nafta market
• Brazilian market weakness, and new mix due to last incorporations made in 2013 with growing margins but still below of company´s standards, makes global margin to be lower
• Exchange rate to Euro has a negative impact in the comparison of this period of €2,5 mill approximately in EBITDA, but a decreasing effect is expected along the year
Ex - Autometal
Autometal
• Volume drop due to exit of CIE Forging companies from the scope of consolidation in 2S2013
• Sales level increase by 15,6% compared to 2013 same period and same scope of consolidation above market behavior
• Growing margins continue due to operating improvement and productivity. EBITDA and EBIT improvements vs. 2013
• European plants in a high operating profitability level ready to face market recovery
Automotive Results 31st March 2014
(million Euros) 31/03/13 31/03/14
Turnover 170,8 154,9
EBITDA 26,3 25,2
% EBITDA 15,4% 16,3%
EBIT 12,4 13,9
% EBIT 7,3% 9,0%
(million Euros) 31/03/13 31/03/14
Turnover 175,3 305,1
EBITDA 29,0 40,7
% EBITDA 16,5% 13,3%
EBIT 22,8 27,9
% EBIT 13,0% 9,1%
38Industrial Group specialized in Managing High Value Added Processes
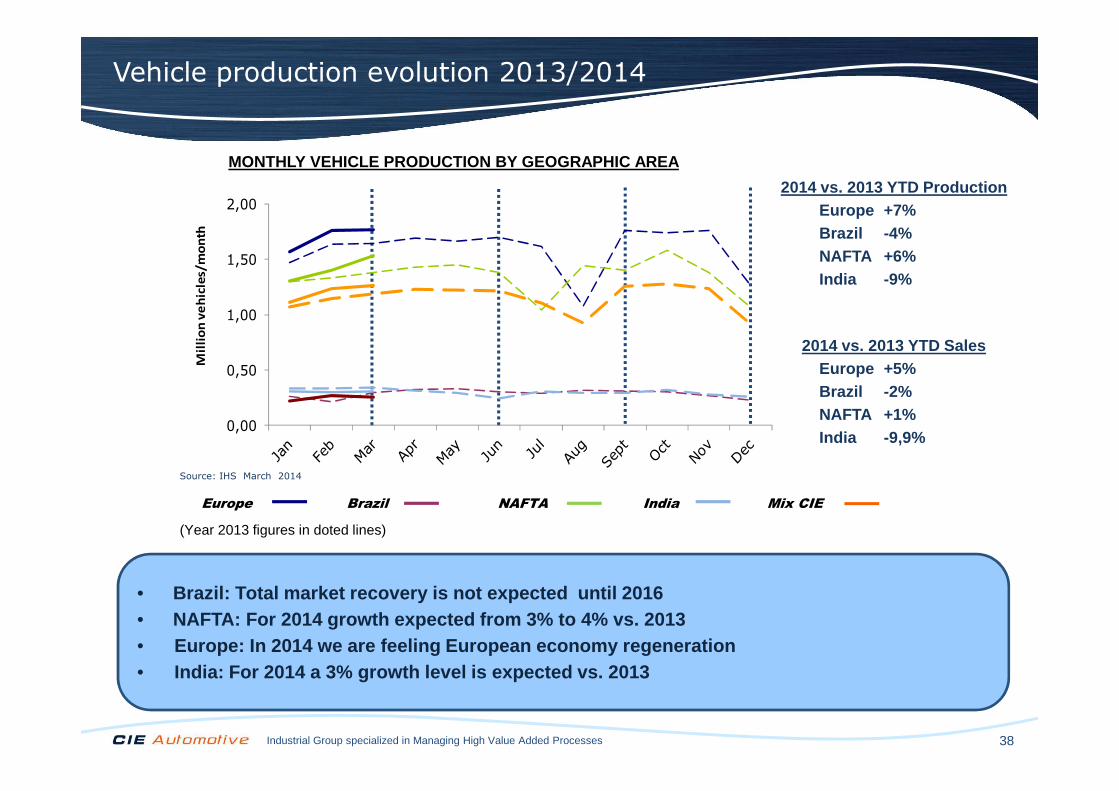
Europe Brazil NAFTA India Mix CIE
• Brazil: Total market recovery is not expected unti l 2016• NAFTA: For 2014 growth expected from 3% to 4% vs. 2 013• Europe: In 2014 we are feeling European economy reg eneration• India: For 2014 a 3% growth level is expected vs. 2 013
(Year 2013 figures in doted lines)
2014 vs. 2013 YTD SalesEurope +5%Brazil -2%NAFTA +1%India -9,9%
2014 vs. 2013 YTD ProductionEurope +7%Brazil -4%NAFTA +6%India -9%
MONTHLY VEHICLE PRODUCTION BY GEOGRAPHIC AREA
Source: IHS March 2014
Vehicle production evolution 2013/2014
0,00
0,50
1,00
1,50
2,00M
illi
on
ve
hic
les/m
on
th

39Industrial Group specialized in Managing High Value Added Processes
Dominion and Biofuels

40Industrial Group specialized in Managing High Value Added Processes
EBITDA: Net Operating Income + Depreciation, EBIT: Net Operating Income
31 Marzo 2009
31 Marzo 2010
• Sales improvement by 15% and by 55% EBITDA continue based mainly on Latin American growth. Specially worthy mentioning organi c growth in Mexico and in EPC´s integration in Honduras and Chile
• Latin America (México, Brazil, Perú, Chile, Hondura s) reforzes its position as business engine representing a percentage higher than 85% o f Contribution Margin of total Dominion
Dominion Results 31st March 2014
(million Euros) 31/03/13 31/03/14
Turnover 33,9 39,2
EBITDA 2,2 3,5
% EBITDA on Turnover 6,6% 8,8%
EBIT 1,4 2,1
% EBIT on Turnover 4,2% 5,5%
+15,3%
+55,2%

41Industrial Group specialized in Managing High Value Added Processes
(Millones de euros)
Notes: (*) Proforma value calculated by deducting turnover of diesel oil used for blending
EBITDA: Net Operating Income + Depreciation, EBIT: Net Operating Income
31 Marzo 2009
31 Marzo 2010
• CIE Automotive enviromental commitment; Focusing on recycled oils segments searching for efficiency and profitability through biofuels c ommercialitation, production from recycled oils and oils collection
• Minimum planned investment, associated with growth. EBIT near to nil that will allow assets recovery
Biofuels Results 31st March 2014
(millones de euros) 31/03/13 31/03/14
Turnover 38,2 31,5
Adjusted Turnover* 20,2 17,2
EBITDA 0,3 0,8
EBIT (0,6) 0
42Industrial Group specialized in Managing High Value Added Processes
Delisting Autometal
43Industrial Group specialized in Managing High Value Added Processes
Delisting Autometal: Main Details
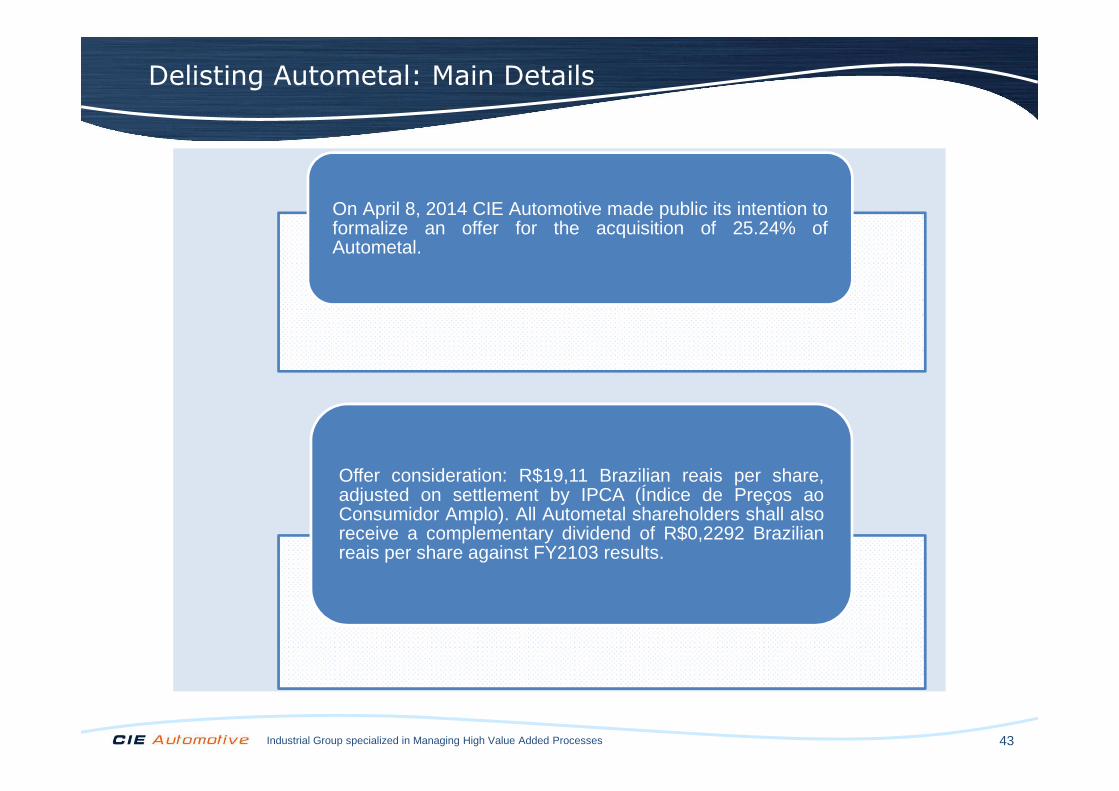
On April 8, 2014 CIE Automotive made public its intention toformalize an offer for the acquisition of 25.24% ofAutometal.
Offer consideration: R$19,11 Brazilian reais per share,adjusted on settlement by IPCA (Índice de Preços aoConsumidor Amplo). All Autometal shareholders shall alsoreceive a complementary dividend of R$0,2292 Brazilianreais per share against FY2103 results.
44Industrial Group specialized in Managing High Value Added Processes
Delisting Autometal: Main Details
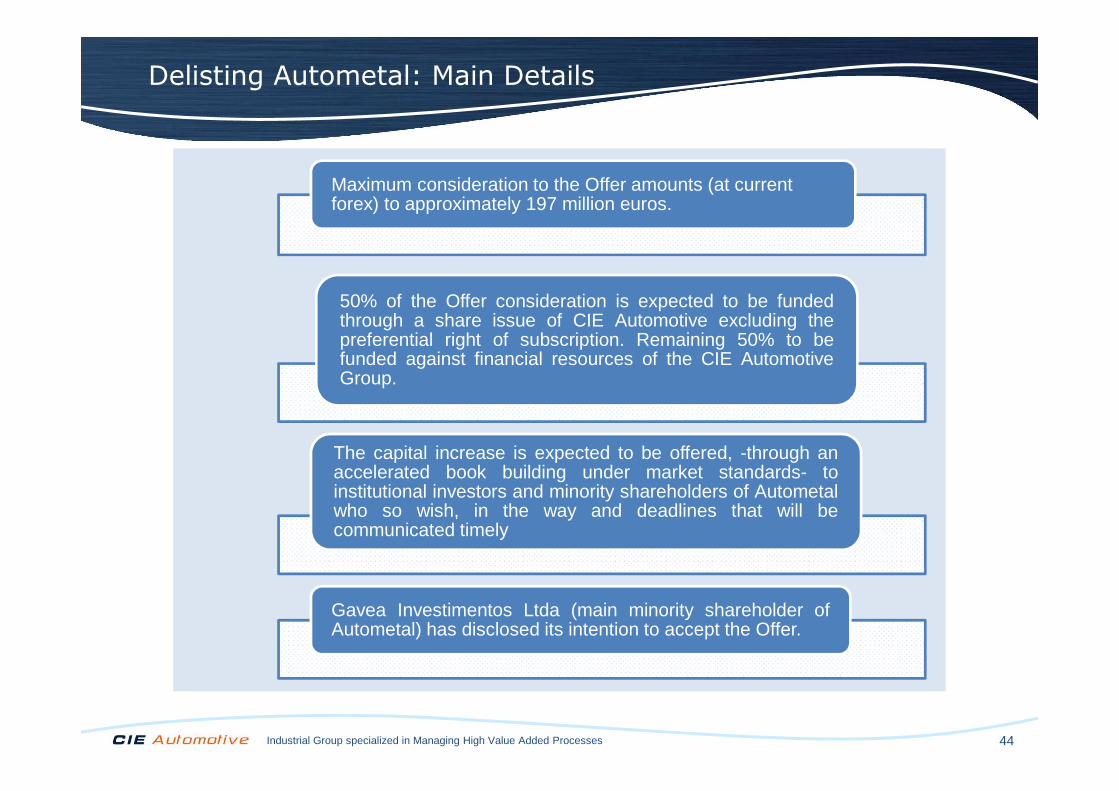
Maximum consideration to the Offer amounts (at current forex) to approximately 197 million euros.
50% of the Offer consideration is expected to be fundedthrough a share issue of CIE Automotive excluding thepreferential right of subscription. Remaining 50% to befunded against financial resources of the CIE AutomotiveGroup.
The capital increase is expected to be offered, -through anaccelerated book building under market standards- toinstitutional investors and minority shareholders of Autometalwho so wish, in the way and deadlines that will becommunicated timely
Gavea Investimentos Ltda (main minority shareholder ofAutometal) has disclosed its intention to accept the Offer.
45Industrial Group specialized in Managing High Value Added Processes
Delisting Autometal: Milestones
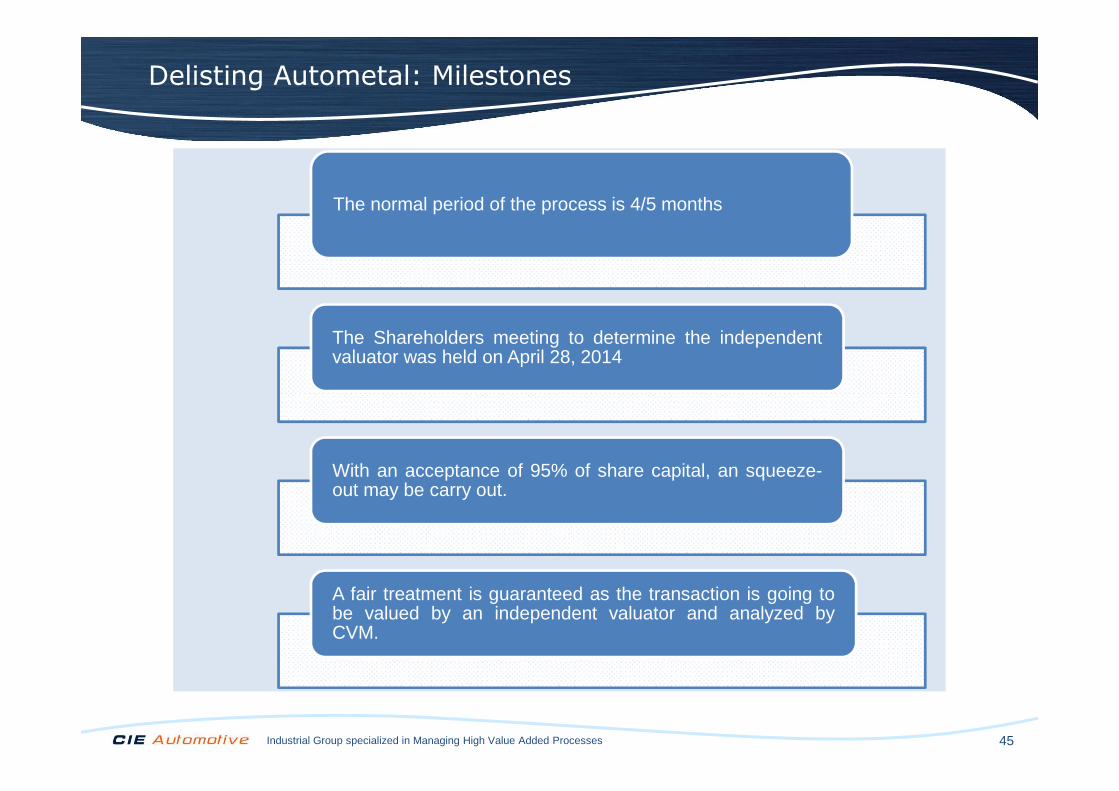
The normal period of the process is 4/5 months
The Shareholders meeting to determine the independentvaluator was held on April 28, 2014
With an acceptance of 95% of share capital, an squeeze-out may be carry out.
A fair treatment is guaranteed as the transaction is going tobe valued by an independent valuator and analyzed byCVM.

46Industrial Group specialized in Managing High Value Added Processes
Due to all of the foregoing: we confirm our commitment 2013-2017

Industrial Group specialized in Managing High Value Added Processes 47
EuropeAmerica
Asia
Sales 2012
Europe
America
Asia
Sales 2017
Consolidating a significant market share in the Asi an market, continuing with the strategy of emerging markets growth
Strategic ThinkingValue creation
Turnover over 3.000 Mio€CAGR > 15%
Industrial Group specialized in Managing High Value Added Processes 48
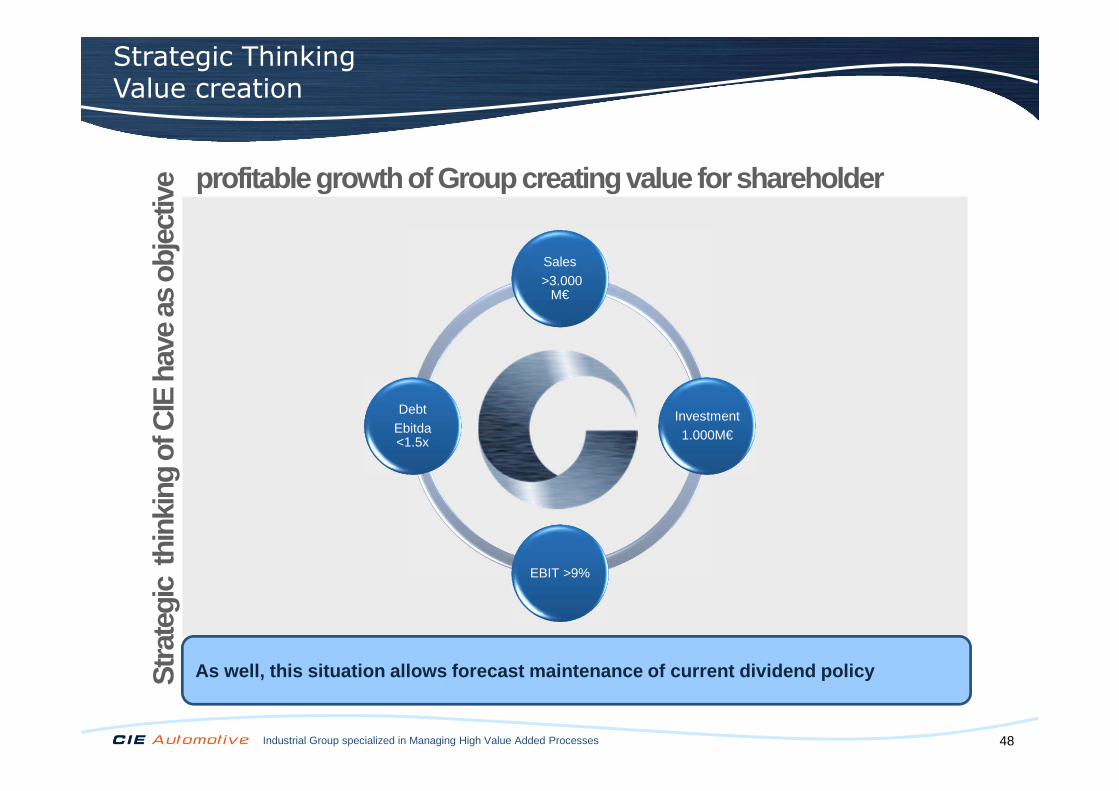
Sales>3.000
M€
Investment1.000M€
EBIT >9%
Debt Ebitda<1.5x
Strategic ThinkingValue creation
profitable growth of Group creating value for share holderS
trate
gic
thin
king
of C
IE h
ave
as o
bjec
tive
As well, this situation allows forecast maintenance of current dividend policy

Industrial Group specialized in Managing High Value Added Processes 49
Sales≈2.700
M€
Investment700M€
EBIT >8%
Debt Ebitda ≈2x
Strategic ThinkingValue creation
…we will be very near to 2013-2017 commitmentIn
a s
horte
r per
iod,
in 2
015
year
…
50Industrial Group specialized in Managing High Value Added Processes
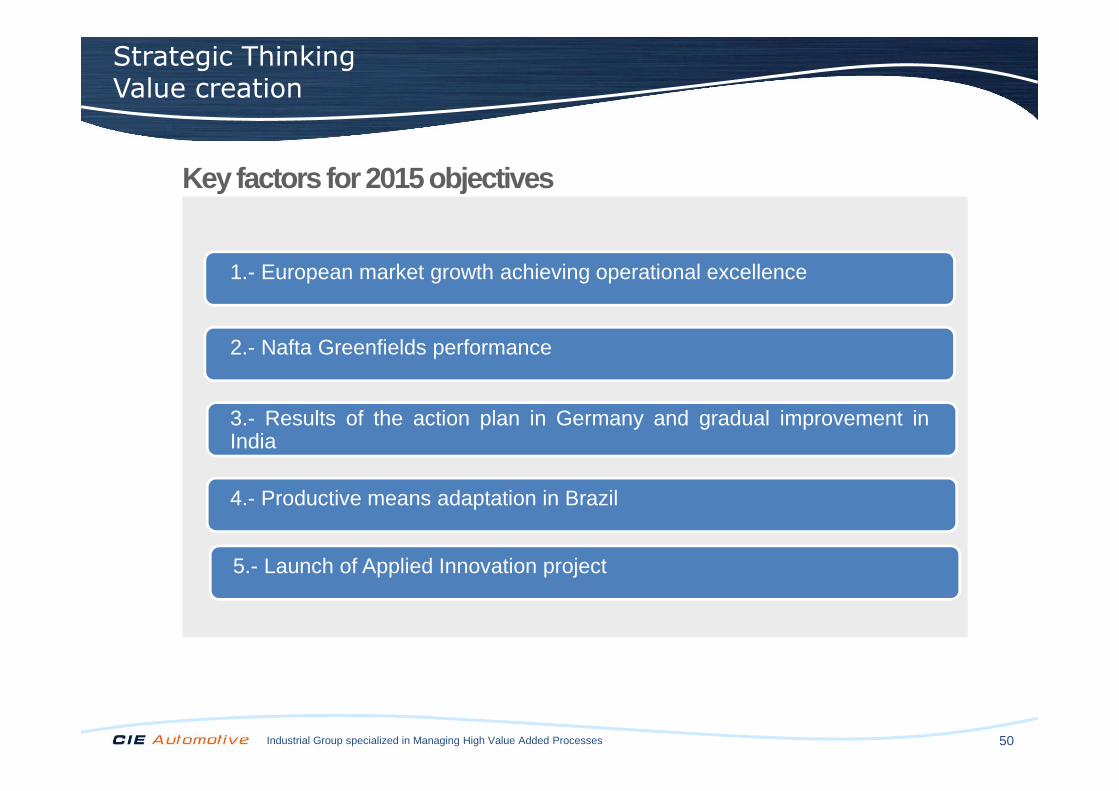
Strategic ThinkingValue creation
1.- European market growth achieving operational excellence
Key factors for 2015 objectives
2.- Nafta Greenfields performance
3.- Results of the action plan in Germany and gradual improvement inIndia
4.- Productive means adaptation in Brazil
5.- Launch of Applied Innovation project

Industrial Group specialized in Managing High Value Added Processes 51
THANK YOU