annual school report 2008
TRANSCRIPT
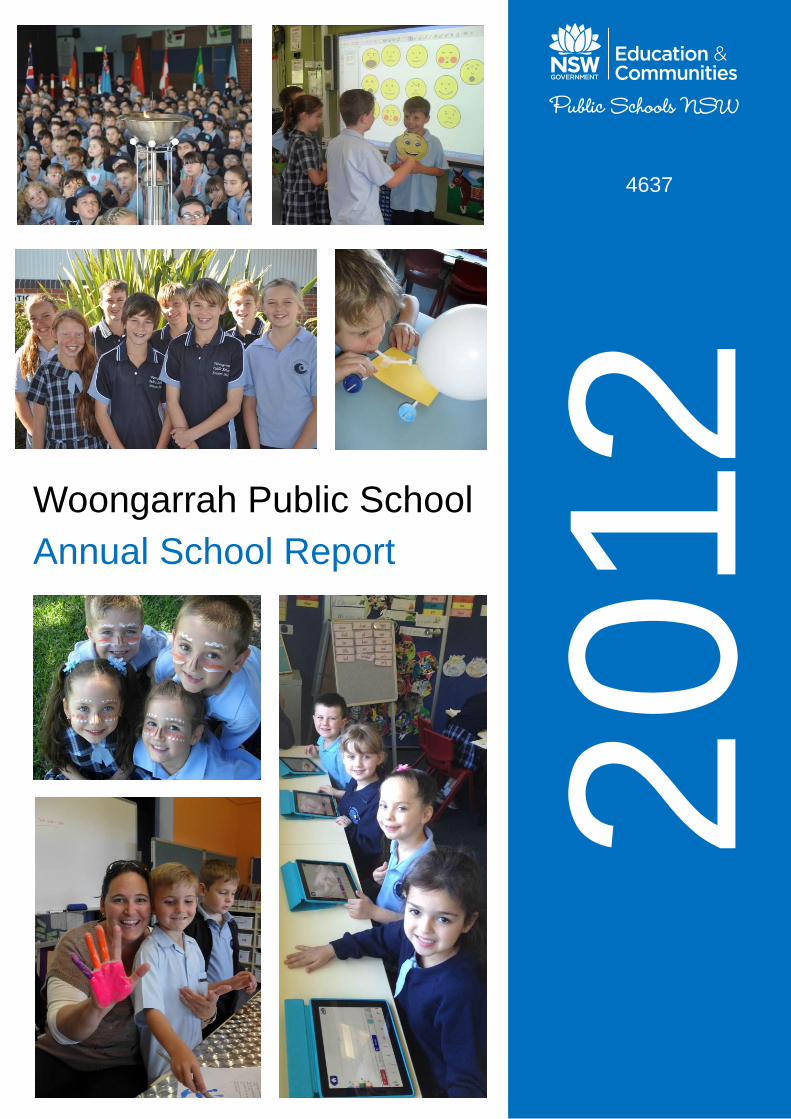
Woongarrah Public School
Annual School Report
2012
4637

2
Our school at a glance
Students
In 2012 there were 545 students from Kindergarten to Year 6 enrolled at Woongarrah Public School. These enrolments made up a total of 22 classes.
Staff
We have an experienced, highly professional and dedicated staff committed to the continual improvement of student learning outcomes and well-being.
2012 teaching staffing consisted of one principal, four Assistant Principals, 18 classroom teachers, two Reading Recovery teachers, two RFF teachers, a Learning and Support teacher and a teacher-librarian.
The teaching staff are supported by four School Administrative staff and five School Learning Support Officers.
Student achievement in 2012
Students continue to perform well in national assessments. 97% of students in Year 3 are performing at or above minimum standards in Literacy. 99% are performing above minimum standards in Numeracy. 94% of students in Year 5 are achieving at or above national standards in Literacy. 96% of students are performing above national minimum standards in Numeracy.
Messages
Principal's message
It is with pleasure that I submit the Annual School Report for 2012. The report details the school’s major achievements during 2012, an assessment of our progress towards our targets and the priorities that have been established within the three year (2012-2014) planning cycle. I commend this report to you.
I certify that the information in this report is the result of a rigorous school self-evaluation process and is a balanced and genuine account of the school's achievements and areas for development.
Leonie Clarkson
P&C message
The P&C meet regularly on the first Wednesday of each month.
P&C executive for 2012:
Name Position
Amy Crowther President
Leanne Sibthorpe Vice President
Michele Collins Vice President
Penny Allen Secretary
Taryn Gribbin Treasurer
If you have any questions we are always available, in person, via a note left in our mailbox in the office or by email to [email protected]. Please come along to a meeting, we look forward to welcoming you and hearing your ideas!
Student representative's message
This year, Parliament continued to meet twice each term. Parliament includes the eight Year 6 ministers, as well as two representatives from each class in Years 3-6 (Student Representative Council). We also introduced weekly ‘cabinet meetings’ where the Ministers met to discuss matters and complete jobs necessary as a result of the Parliament meeting.
We have participated in many things around the school. We formed a dance group, led by one of the Ministers. We conducted a table tennis competition. We helped set up new lunchtime clubs, such as chess, Lego, drawing, French knitting and card making. We wrote articles for the newsletter, helped to keep the sports shed tidy, took photos of school events and helped classes solve any issues that were raised at Parliament.
It has been a successful year.
Student Leaders for 2012:
Name Position
Jai Hupton Prime Minister
Rhys Barwick Deputy Prime Minister
Ministers:
Victoria Beasley Jake Harrison
Chloe Waddell Jacob McPherson
Isabelle Taylor Alex Buhr

3
School context
Student information
It is a requirement that the reporting of information for all students must be consistent with privacy and personal information policies.
Student enrolment profile
The total enrolment at Woongarrah Public School increased from 514 in 2011 to 545 in 2012.
2007 2008 2009 2010 2011 2012
Male 160 181 213 243 261 272
Female 170 193 214 243 253 273
Total 330 374 427 486 514 545
6% of students are Aboriginal, 4% have a
language background other than English.
Student attendance profile
Year 2009 2010 2011 2012
K 95.3 96.4 95.6 94.9
1 94.7 95.7 95.5 95.1
2 95.0 95.3 95.9 94.9
3 94.5 95.3 95.5 94.9
4 95.4 94.2 94.7 94.9
5 91.5 95.0 93.9 93.9
6 93.5 93.6 93.6 92.5
Total 94.4 95.2 95.1 94.5
Management of non-attendance
We regularly monitor attendance via our Student Welfare Team meetings. Teachers follow up on concerns through regular communication, including phone calls and notes home.
Staff information
It is a requirement that the reporting of information for all staff must be consistent with privacy and personal information policies.
Staff establishment
Position Number
Principal 1
Assistant Principal(s) 4
Classroom Teachers 19
RFF and part-time 2
Reading Recovery 0.8
Learning and Support Teacher 0.9
Teacher Librarian 1
Counsellor 0.4
School Administrative & Support Staff 4
School Learning Support Officers 5
Total 38
The National Education Agreement requires schools to report on Indigenous composition of their workforce. Two staff members are Aboriginal.
Staff retention
Mrs Nicolas and Mrs Rawson were appointed to the school through merit selection in 2012.
Ms Ella was appointed as a class teacher. Mrs Kerr-Thomson was appointed as an Assistant Principal. Mr O’Hara was appointed as General Assistant.
Mr Clemson was promoted to a Principal position in 2012.
Mrs McCrae and Mrs Broad received transfers for 2013 as School Learning Support Officers.
All other permanent staff will remain at Woongarrah in 2013.
Teacher qualifications
All teaching staff meet the professional requirements for teaching in NSW public schools.
Qualification % of staff
Degree or Diploma 70
Postgraduate 30
The school plays a key role in supporting the accreditation of New Scheme Teachers. In 2012, the school employed seven New Scheme Teachers and supported four of these teachers to complete accreditation.

4
The school also provides strong support for
university training programs, providing
opportunities for university students to complete
practical experiences at our school. Six university
students completed practicums in 2012.
Financial summary
This summary covers funds for operating costs and does not involve expenditure areas such as permanent salaries, building and major maintenance.
Date of financial summary 30/11/2012
Income $
Balance brought forward 203420.43 Global funds 233123.48 Tied funds 212885.57 School & community sources 110842.36 Interest 11319.59 Trust receipts 68753.15 Canteen 48715.65
Total income 889060.23
Expenditure
Teaching & learning Key learning areas 75344.52 Excursions 36156.74 Extracurricular dissections 45389.11
Library 8805.12 Training & development 2078.43 Tied funds 219028.60 Casual relief teachers 87823.02 Administration & office 54044.30 School-operated canteen 43558.62 Utilities 40462.03 Maintenance 5891.44 Trust accounts 41609.10 Capital programs 0.00
Total expenditure 660191.03
Balance carried forward 228869.20
A full copy of the school’s 2012 financial statement is tabled at the P&C annual general meeting. Further details concerning the statement can be obtained by contacting the school.
School performance 2012
Achievements
Arts
All students K-6 participated in Music Count Us In for the sixth year in a row.
We established a signing choir, who performed at our Public Speaking finals and Kindergarten Orientation.
The Christmas choir was very popular, performing at Warnervale Uniting Church and at the end of year K-6 assembly.
We conducted our first ever Public Speaking competition this year, with the finals held during Education Week. We were thoroughly impressed by the standard of the competition.
Stage 2 Stage 3
1 Tanaysha Newton-Carr Jai Hupton
2 Amelia Ruskin Jacob McPherson
3 Sophie Farmer Sarah El-Sayed
Sport
The 2012 Sporting Blue was awarded to Rhys Barwick for outstanding achievement in Sport.
The inaugural Premier’s Sporting Challenge medal was won by Sarah Kirk.
Three students were Sydney North representatives: Rhys Barwick (soccer) Isabelle Taylor (tennis) and Jai Hupton (AFL).
The school won the Wyong Zone Cross Country Carnival – the first time that we have won a major carnival event.
Years 3-6 students participated in LMG inter-school sports competitions in AFL, soccer, touch and T-Ball with schools in the Wadalba Schools Learning Community.
All classes participated in the Premier’s Sporting Challenge.
We held a K-6 Olympic Day where students were divided into countries to compete in games and activities, and an opening and closing ceremony.
The torch relay and lighting of the flame provided a great start to Olympic Day

5
Champion House Group 2012
Swimming Dolphin
Cross Country Dolphin
Athletics Goanna
Age Champions - Swimming
Junior Boy Ethan Writer
Junior Girl Shay McBeath
Senior Boy Riley Walkington
Senior Girl Chloe Waddell
Age Champions – Cross Country 2012
8/9 Tanaysha Newton-Carr Lachlan West
10 Presley Rawling Jye English
11 Hali Shiach-Scott Bailey Vickers
12/13 Sarah Kirk Jai Hupton
Age Champions – Athletics 2012
Junior Boy Jye English
Junior Girl Courtney Doyle and Presley Rawling
Senior Boy Rhys Barwick
Senior Girl Hali Shiach-Scott
House Captains
Dolphins Sarah Kirk Riley Walkington
Platypus Ashlee Stanford Kyle McGilvray
Goanna Chloe Ray James Kampas
Kangaroo Hannah Norman Harry Bates
Other
Other major award winners for 2012 include:
School Awards 2012
Dux of School Jai Hupton
Citizenship Award Victoria Beasley
Citizenship Award Sophie Noble
Environment Award Emma Garlick
Science Award Lachlan Neiheus
Mathematics Jai Hupton
Lifelong Learning Jessica Kilgour
100% NAPLAN Spelling Olivia Clarkson, Aiden Collins, Anna Chenda
Students in Stage 2 and 3 classes competed in
the Premier’s Spelling Bee. Saif-Dean Jarrar,
Bailey Hodges, Aiden Collins and Andrew
Hocking represented Woongarrah in the Regional
finals. Aiden Collins finished in second place in
the stage 3 competition.
Academic
The My School website provides detailed information and data for national literacy and numeracy testing (NAPLAN).
Click on the link http://www.myschool.edu.au and
enter the school name in the Find a school and select GO.
In NAPLAN, the results across the Years 3 to 9, are reported on a scale from Band 1 to Band 10. The achievement scale represents increasing levels of skills and understandings demonstrated in the assessments - Yr 3: from Band 1 (lowest) to Band 6 (highest); Yr 5: from Band 3 (lowest) to Band 8 (highest)
Reading – NAPLAN Year 3
In 2012, 76 students participated in NAPLAN Literacy tests. 97% or more of our students achieved above National Minimum standards in all aspects of literacy, with 100% in Writing.
Reading results were lower than results in other test areas. Student performance in all other areas of literacy was above state and region.
Reading results were lower than in previous years and boys results significantly lower than state which is cause for concern.
1 2 3 4 5 6
2 9 18 15 16 16
2.6 11.8 23.7 19.7 21.1 21.1
2.5 10.2 18.8 26.2 23.1 19.1
3.3 10.9 19.0 24.3 22.9 19.6
4.3 11.7 16.8 20.5 22.3 24.5
419.6
State DEC
414.7
SSG
410.5
School
Average score, 2012
Skill Band Distribution
Number in Bands
Percentage in Bands
School Average 2008-2012
SSG % in Bands 2012
State DEC % in Bands 2012
Band
Numeracy – NAPLAN Year 3
1 2 3 4 5 6
1 8 12 20 20 12
1.4 11.0 16.4 27.4 27.4 16.4
1.2 10.2 24.8 27.0 22.7 14.0
3.1 10.5 24.2 31.3 19.0 11.9
4.8 10.6 21.1 26.9 19.9 16.6
Average score, 2012
School
409.3
State DEC
400.2
SSG
395.4
Skill Band Distribution
State DEC % in Bands 2012
SSG % in Bands 2012
School Average 2008-2012
Percentage in Bands
Number in Bands
Band
76 students participated in NAPLAN Numeracy tests. 98.6% of students achieved above National Minimum standards.
Student performance in all areas was above state and region.

6
44% of students were ranked in the top two bands, above the state result of 40%.
Girls performed significantly above the state in all areas.
Trend data is very encouraging and superior to state and regional trends.
Reading – NAPLAN Year 5
85 students participated in NAPLAN Literacy tests. 94% achieved above National Minimum standards in Reading.
Reading results have improved from previous years, with less students in Bands 3 and 4, and more students in bands 5, 6 and 7. We need to see this trend continue in a positive direction.
There were less students in the bottom two bands (13%) than the state (18%), but only 22% in the top two bands (36% in state).
3 4 5 6 7 8
5 6 24 31 15 4
5.9 7.1 28.2 36.5 17.7 4.7
6.7 9.3 26.5 29.9 18.3 9.3
8.8 12.0 24.7 24.7 20.9 8.9
9.3 11.2 23.7 24.0 19.7 12.1
Band
Number in Bands
Percentage in Bands
State DEC % in Bands 2012
School Average 2008-2012
SSG % in Bands 2012
Skill Band Distribution
State DECSSGSchool
492.4486.2491.3Average score, 2012
Numeracy – NAPLAN Year 5
85 students participated in NAPLAN Numeracy tests. 96.5% achieved above National Minimum standards in Reading.
Girls performance is significantly lower than boys, which is a reversal from previous years.
There are more students in the top two bands than in previous years and less students in the bottom two bands.
3 4 5 6 7 8
3 7 32 23 12 8
3.5 8.2 37.7 27.1 14.1 9.4
2.6 13.0 30.5 30.9 15.2 7.8
5.8 13.0 28.8 30.3 12.9 9.2
6.4 13.2 24.6 26.7 14.2 15.0
SSG % in Bands 2012
Number in Bands
Percentage in Bands
School Average 2008-2012
State DEC % in Bands 2012
Band
493.6482.9487.5
School State DEC
Skill Band Distribution
Average score, 2012
SSG
Progress in reading
Average scaled growth is above state average.
The proportion of students achieving expected growth (68%) is higher than those who are not (32%).
Average progress in Reading between Year 3 and 5
2008-2010 2009-2011 2010-2012
School 94.0 79.3 81.4
State DEC 83.7 74.0 79.2
Progress in numeracy
Average scaled growth is above state average.
The proportion of students achieving expected growth has increased from 47% in 2011 to 57% in 2012.
Average progress in Numeracy between Year 3 and 5
2008-2010 2009-2011 2010-2012
School 93.4 95.5 96.6
SSG 89.1 95.1 96.0
State DEC 89.6 95.8 98.2

7
National Minimum Standards
Percentage of Year 3 students achieving at or above minimum standard
(exempt students included)
Reading 97.4
Writing 100.0
Spelling 97.3
Grammar & Punctuation 97.3
Numeracy 98.6
Percentage of Year 5 students achieving at or above minimum standard
(exempt students included)
Reading 94.1
Writing 97.6
Spelling 97.6
Grammar & Punctuation 90.5
Numeracy 96.5
Significant programs and initiatives
Aboriginal education
Teachers in all classes include an Aboriginal perspective in their teaching and learning programs. Studies in Human Society and Its Environment and Creative Arts allow students to increase their understanding of the histories, cultures and experiences of Aboriginal people as the first people of Australia.
In Term 1 we developed Personal Learning Plans for all 46 Aboriginal students. 100% of students and 65% of parents participated in this process. This is pleasing progress towards our goal of 100% participation . In Term 4, we evaluated our plans to discover that students are achieving their academic, social and cultural goals.
During National Aboriginal and Torres Strait Islander Day (NAIDOC) Week in Term 2, we celebrated with Indigenous games conducted by our Year 5 and 6 Aboriginal leaders. We also participated in the Great Book Swap for the first time and raised over $400 for the Indigenous Literacy Foundation.
Our Year 6 students decorated stones to add to our Bush Tucker garden – the start of an annual activity for Year 6. As they placed the stones in the garden, each student reflected on something that they can now do as they leave our school.
Our NAPLAN data indicates that the achievement of Aboriginal students was above state and region in Year 3 and Year 5 in Reading and Numeracy.
Multicultural education
Multicultural education is delivered through the Human Society and its Environment Key Learning Area. Learning about cultural diversity and the contribution to Australian society of people from many different backgrounds is critical to the development of informed and responsible citizenship.
4% of students have a language background other than English. There are no students requiring English as a Second Language (ESL).
We enjoy an inclusive school community and racism-free learning and working environment. Mrs Pyle and Mr Demir are the Anti-Racism Contact Officers at our school. There were no complaints relating to anti-racism this year.
Environmental Activities
Many K -6 students have enjoyed a wide range of environmental activities during 2012. Students are involved in activities such as environmental litter pick-up, pulping fruit scraps, tending to the worm farms, recycling the worm tea for environmentally friendly fertilizer, weeding and mulching all of our beautiful gardens and school grounds.
We extended our vegetable patch and planted new fruit trees. A Sensory garden is being created with raised garden beds for plants that students will be able to taste and touch.
Thanks to the wonderful enthusiasm shown by the gardening students they have won two prizes in Wyong Council Schools Gardening Competitions.
Local businesses, including Bunnings, are very generous in their support of environmental education at Woongarrah PS.
Our keen gardeners show off the newest addition to the vegie patch
8
Speech Program
In 2011, we established a speech therapy program for kindergarten students as an early intervention literacy strategy.
The Boehm Test of Basic Concepts is used to assess student’s knowledge of basic concepts that are fundamental to understanding instructions for early learning. 50 concepts are tested. All students were tested in Term 1, and again at the start of Term 4.
The average score in Term 1 was 36 out of 50. In Term 4, the average score had improved to 43. The percentage of students in the lowest performance band decreased from 51% to 12%, while the percentage of students in the highest band increased from 21% to 58%. This program will continue in 2013.
Respect and Responsibility
The values of respect and responsibility are embedded in our school culture. Activities that promoted respect and responsibility in 2012 included:
Celebrating ANZAC Day, NAIDOC Week and Remembrance Day.
Charitable fundraising – allowing students to select and support charities for children, with Stewart House as our main charity.
Participating in Jump Rope for Heart for the first time this year. We have the most generous community at Woongarrah having raised $7581.86 for the Heart Foundation – an outstanding effort!
Clean Up Schools Day and Waterwise program - teaching students that it is the responsibility of all to keep the environment clean
Progress on 2012 targets
2012 was the first year of a three-year planning cycle.
Target 1
To improve literacy outcomes for all students
Our achievements include:
81% of Kindergarten students and 85% of Year 1 students achieved at or above regional benchmark for reading:
2010 2011 2012
Kindy 76 65 81
Year 1 65 72.5 85
Year 2 74 50.5 70
97% of Year 3 students and 94% of Year 5 students achieved at or above national minimum standards in Reading
60% of students in Year 3 achieved the top two proficiency bands in writing, 56% in spelling and 57% in grammar and punctuation.
Growth between Year 3 and 5 was substantially above state average in Reading.
21 students who completed the MultiLit program achieved an average growth of 103 points – far exceeding average state growth of 77.8 points.
Target 2
To improve numeracy outcomes for all students
Our achievements include:
98.6% of Year 3 students and 96.5% of Year 5 students achieved at or above national minimum standards in Numeracy
Growth between Year 3 and 5 was above state average in Numeracy
The number of students achieving proficiency in the top two bands in numeracy exceeded HCC targets in Year 3 and 5.
There are more students in the top two bands in numeracy in Year 5 than in previous years.
Less students in the lower two bands in Year 5 than state
Enthusiastic teacher support for new ways to improve the school’s approach to supporting lower achievers in mathematics as a result of the TOWN program.
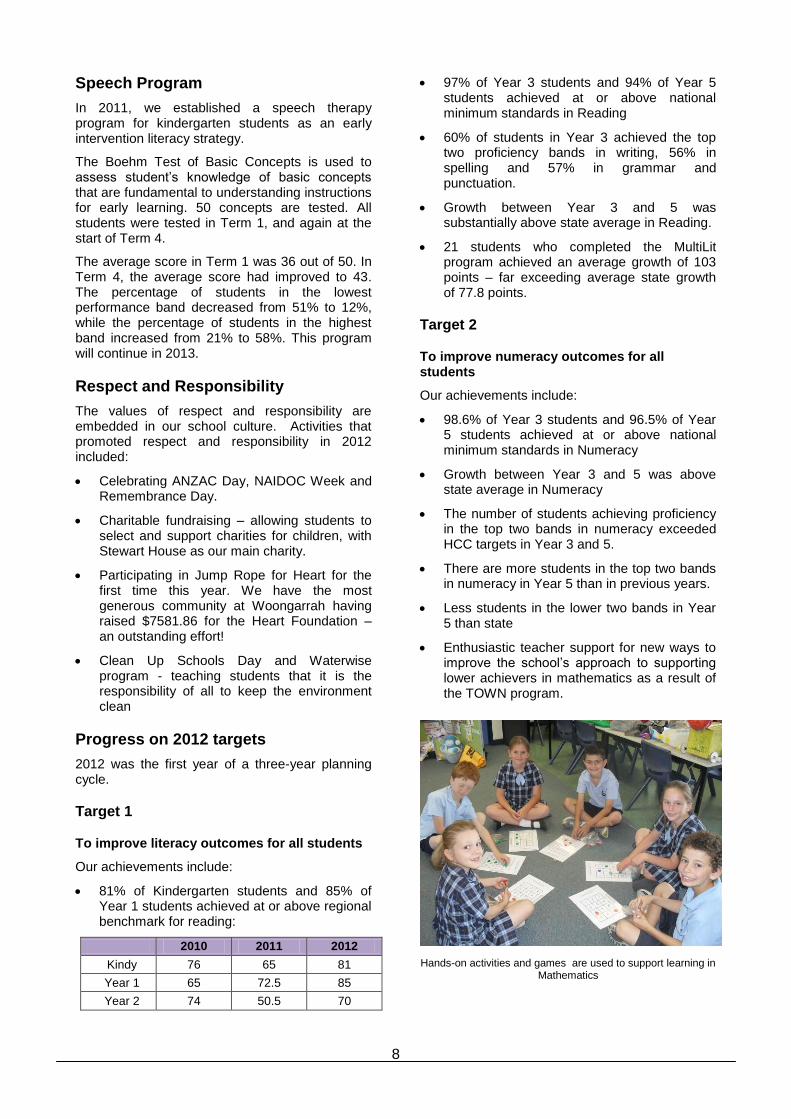
Hands-on activities and games are used to support learning in Mathematics

9
School evaluation
NSW public schools conduct evaluation to support the effective implementation of the school plan. In 2012 our school carried out evaluation of Learning and Support, Gifted and Talented Education and the new English K-6.
Learning and Support
Background
Recent changes to funding models and staffing allocations used to support students in regular classes with additional learning and support needs and their teachers resulted in a need to evaluate our programs, policies and procedures for Learning and Support. We used a matrix to assist planning and evaluation and met with parents and teachers.
Findings and conclusions
It is apparent that the learning and support planning processes are an integral part of the school plan and priorities and that there is effective, coordinated planning in place to identify and accommodate the specific learning and support needs of students.
Parents are supportive of our organisation and programs and recognise the inclusive nature of the school. This is also an identified positive feature of the school on annual satisfaction surveys.
Future directions
The results of the evaluation were very pleasing, highlighting that the school is operating at the ‘Best Practice’ level in all focus areas – identifying student need, learning and support adjustments, and management of learning and support.
Our challenge is recognised as finding innovative solutions and ways to continue to provide the same quality of support with reduced resources available.
We will continue to provide professional learning for staff and to provide support for students, parents and teachers through the Learning and Support Team, Learning and Support Teacher and focus programs and activities, such as Kindergarten speech and structured play.
English K-10
Background
The new English K-10 Australian Curriculum is due to begin implementation in 2014. We asked teachers to complete a self-audit to develop a profile of their strengths and gaps in relation to the new syllabus in order to inform our planning and
ensure that we are prepared for implementation in 2014.
Findings and conclusions
The audit identified a clear need for professional learning to ensure teachers have a clear understanding of the requirements of the new syllabus and realise the opportunities presented by the new syllabus.
The audit identified the need for a review and reworking of scope and sequence plans.
Future Directions
We will provide time for teachers to work in teams to realign current teaching and learning programs to the new syllabus.
We will provide a program of professional learning using school development days, staff meetings, professional learning funds and online resources being offered by the Board of Studies and Curriculum Learning and Innovation Centre.
Gifted and Talented Education
Background
In 2011, we evaluated Gifted and Talented (GAT) education prior to embarking on a 3 year plan for improvement. In 2012, we reviewed and evaluated our progress.
Findings and conclusions
There are six focus elements required for an effective GAT program. We have improved in most areas.
Identification 2011 = Level 1; 2012 = Level 3
We have improved the ways in which we identify and nominate students for GAT programs and enrichment activities.
Grouping 2011=Level 1; 2012 = Level 2
We have introduced some enrichment activities for Years 3-6 students.
Curriculum 2011 = Level 2; 2012 = Level 3
The staff have begun the process of differentiating units in some key learning areas. We have developed a Thinking Skills scope and sequence.
Professional learning 2011 = Level 2; 2012 = Level 3. The staff have been involved in professional learning in gifted education, including work with the regional consultant and a school development day.
Policy 2011 Level 2; 2012 = Level 3
A draft policy is in place.
Parents 2011 Level 1; 2012 = Level 2

10
Because of parent support, some provisions for gifted and talented students have been set up, e.g. enrichment activities. The P&C have funded the establishment of the Tournament of Minds program in 2013.
Future Directions
We have decided to fund the release of GAT program coordinators in 2013, with a different focus area each term, including Writing enrichment, GAT maths, Tournament of Minds and science and technology.
We will establish the Tournament of Minds program.
The Thinking Skills scope and sequence developed this year will begin implementation K-6.
Refer also to School Priority 3
Parent, student, and teacher satisfaction
In 2012 the school sought the opinions of parents, students and teachers about the school. We had over a 200% increase in the number of surveys returned from previous years. Responses are presented below.
Eight domains are reported on the surveys. Our results are as follows:
Domain Parent Teacher Student
Safety Very satisfied Very satisfied Very Satisfied
Learning Very satisfied Extremely satisfied
Very satisfied
Behaviour Very satisfied Extremely satisfied
Very satisfied
Consultation Very satisfied Very satisfied Extremely satisfied
Approach-ability
Very satisfied Extremely satisfied
Satisfied
School Image
Very satisfied Extremely satisfied
Very satisfied
School improvement
Very satisfied Very satisfied Very satisfied
Relationship Very satisfied Extremely satisfied
Very satisfied
There were many positive comments, as well as some sound suggestions for improvement that we can work on together.
The weekly behaviour cards and the use of ICT in the classrooms featured highly in responses.
Continuing our work on teaching students how to deal with teasing and bullying was also a common theme.
Consultation in school decision-making was identified as an area for improvement by staff, although parents and students are very satisfied. This is a reversal from the last time this survey was used in 2009, where staff were extremely satisfied and parents less so. We need to get the balance right.
The gist of the comments is reflected in the following examples:
My children love coming to school and are excited about the lessons provided.
Lovely grounds. Good teachers. Good discipline for children. Very happy with all the positive things the school does.
As a new member to this community, I have found this school to be very welcoming and the teachers extremely approachable. We have been very impressed with the speed that our child has settled in. Thanks.
The use of technology in the classroom is fantastic. I also love how welcome I feel in the classroom when I come to help out.
Communication with parents has been open and honest. This is much appreciated.
This is a positive working environment where staff opinions and views are heard. Staff feel happy which filters into the classroom. Woongarrah feels like a family.
I enjoy coming to work each day. I feel that I am continually supported, mentored and developed by the whole range of skilled teachers at our school.
Professional learning
Our staff maintain high professional standards through ongoing professional development. We received $18794 for teacher professional learning in 2012.
Focus Area Amount
Beginning Teachers 737
Use of ICT 265
Quality Teaching 2418
Literacy and Numeracy 7272
Syllabus Implementation 1449

11
Career Development 2317
Welfare and Equity 1663
Other 3690
Five school development days were completed. Staff also attended professional learning activities on topics related to school targets and personal professional learning plans.
All stage 2 and 3 teachers completed the Taking Off With Numeracy (TOWN) professional development program.
All K-2 teachers were trained in using the literacy and numeracy continuums and Best Start assessment data to guide teaching and learning in literacy and numeracy. The Best Start consultant worked closely with teachers throughout the year.
The staff entered into the spirit of Book Week
School planning 2012—2014
The school planning policy provides direction for the preparation and implementation of school plans including the identification of priority areas, intended outcomes and targets that are consistent with the NSW State Plan and the Department’s planning documents.
School priority 1
Outcome for 2012–2014
To improve literacy outcomes for all students
2013 Targets to achieve this outcome include:
To increase the percentage of Year 3 students in Band 4 or higher in Reading to 75% from an average of from 67.7% in 2010-2012
To increase the percentage of Year 5 students achieving Bands 7 or 8 in Reading to 25% from an average of 22% in 2010-2012
75% or above of students in K,1,2 achieve at or above regional benchmarks in Reading
97% of Year 3 and 5 students achieve at or above minimum standards in literacy
Strategies to achieve these targets include:
Implementation of L3 program in Kindergarten
Continuation of Reading Recovery in Year 1
Continuation of MultiLit program in Years 2-4
Continued implementation Best Start K-2
Implementation of Kindergarten Speech program
School priority 2
Outcome for 2012–2014
To improve numeracy outcomes for all students
2013 Targets to achieve this outcome include:
To increase the percentage of Year 5 students achieving Bands 7 or 8 in Numeracy to 25% (from an average of 20.5% in 2010-2012)
97% of Year 3 and 5 students achieve at or above minimum standards in numeracy
Strategies to achieve these targets include:
Implementation of TOWN program (2nd
year)
Continue to develop staff understanding of the numeracy continuum and Best Start to support teaching of mathematics
School priority 3
Outcome for 2012–2014
Increased time in quality learning for students
2013 Targets to achieve this outcome include:
A Gifted and Talented Education Policy is implemented
Strategies to achieve these targets include:
Implementation of the Tournament of Minds program in Stage 3
All teachers to implement new Thinking Skills scope and sequence K-6
Professional learning to improve skills and ability to meet the needs of GAT students through a differentiated curriculum
Introduction and implementation of the Woongarrah PS ‘Quality Start’ program for the first weeks of school K-6.

12
About this report
In preparing this report, the self-evaluation committee has gathered information from evaluations conducted during the year and analysed other information about the school's practices and student learning outcomes. The self-evaluation committee and school planning committee have determined targets for the school's future development.
Leonie Clarkson Principal
Sharon Buhr Assistant Principal
Lorne Smith Assistant Principal
Michele Kempys LAST
School contact information
Woongarrah Public School
63-73 Mataram Road
Woongarrah NSW 2263
Ph: 4392 7493
Fax: 43927807
Email: [email protected]
Web: www.woongarrah-p.schools.nsw.edu.au
School Code: 4637
Parents can find out more information about Annual School Reports, how to interpret information in the reports and have the opportunity to provide feedback about these reports at:
http://www.schools.nsw.edu.au/asr