annual report town of bellingham, massachusetts for
TRANSCRIPT

Annual Report
TOWN OF BELLINGHAM, MASSACHUSETTS
For Fiscal Year Ended June 30, 2009
TOWN OF BELLINGHAM, MASSACHUSETTS /s/ Marilyn Mathieu, Chief Financial Officer Filing Date: March 26, 2010
1
TOWN OF BELLINGHAM, MASSACHUSETTS
General The Town of Bellingham, which was incorporated as a town in 1719, is located in Norfolk County along the southern section of Massachusetts’ new growth corridor, Interstate Route 495. It is bordered on the east by the Towns of Franklin and Wrentham, on the south by Woonsocket, Rhode Island, on the west by Blackstone, Mendon and Hopedale and on the north by Milford and Medway. Bellingham, a residential community, is located approximately 35 miles from Boston, 27 miles from Providence, and within 30 miles of Attleboro, Brockton and Worcester. The Town covers a land area of approximately 18.5 square miles and, according to the 2000 census, has a population of 15,314. Bellingham's location 10 minutes south of the Massachusetts Turnpike (I-90) and the same distance north of Interstate 95 provides high accessibility to the entire eastern area of Massachusetts and northern Rhode Island. In addition, the Town is situated almost equidistant from Boston, Providence and Worcester, the major markets and cultural-educational-entertainment cores of southern New England. Local Government The Town has a five-member Board of Selectmen and operates under an open town meeting form of government. At the Annual Town Meeting in 1993, the Town voted to adopt a charter creating the position of Town Administrator with powers to appoint various officials and direct the operations of the Town. The Charter established the position of Chief Financial Officer who directly supervises the operations of the accounting office, the Treasurer/Collector, and the office of the Board of Assessors, thereby centralizing all town financial matters. Selectmen are elected to serve three-year terms on a staggered basis. Other elected officials include the Town Clerk and Moderator. A five-member School Committee is also elected, as is the Planning Board, Housing Authority, Library Trustees and Town Constables. Voters elect a representative to the Blackstone Valley Regional Vocational-Technical School District Committee, of which the Town is a member. Principal Executive Officers Manner of Term Office Name Selection Expires
Board of Selectmen Dawn Davies, Chair Elected May, 2010 Mary Chaves, Vice Chair Elected May, 2011 Jerald Mayhew Elected May, 2011 Skip Goodnow Elected May, 2012 Michael Connor Elected May, 2012 Town Administrator Denis C. Fraine Appointed June, 2011 Chief Financial Officer Marilyn A. Mathieu Appointed June, 2011 Town Collector Grace L. Devitt Appointed June, 2010 Town Treasurer Grace L. Devitt Appointed June, 2010 Town Clerk Ann Odabasian Elected May, 2010 Town Counsel Jay Talerman Appointed June, 2010 Municipal Services The Town provides general governmental services for the territory within its boundaries. These services include police and fire protection, streets, water and sewer, parks and recreation, and public education in grades K through 12. The Blackstone Valley Regional Vocational-Technical School District provides vocational and technical education for grades 9 through 12. Solid waste disposal is provided for those residents who are part of a residential curbside collection program. Participation in the program is through a user fee and is limited to residential solid waste from single family and multiple family dwellings. Town residents are actively involved in many elected and appointed positions that also serve the Town, such as the Affordable Fair Housing Committee, an Arts Council, a Council on Aging, the Historic Commission, the Finance Committee, and a Community Development Commission.

2
Transportation Bellingham is conveniently located near three commercial airports: Boston (Logan International), Providence and Worcester. In addition, a private airport, Draper Airport, is five minutes from Bellingham in the adjacent Town of Hopedale. There is no intercity or intracity bus service available in Bellingham. However, intercity carriers do serve the adjacent communities of Franklin and Milford, Massachusetts, and Woonsocket, Rhode Island. In addition, the MBTA provides weekday commuter rail service from nearby Franklin to Boston. Rail freight service to the Bellingham area is provided by Conrail, and the Providence and Worcester Railroad has lines which extend throughout the Town. The most important mode of transportation for Bellingham manufacturers is trucking. The Town's industrial zones are situated within a short distance of Interstate 495, and more than 30 trucking firms serve the Bellingham area. Most have terminals in the Framingham and Worcester, Massachusetts, or Providence, Rhode Island, areas. However, one firm, Truckadyne, is headquartered in Bellingham. Utilities Phase I of the Town's Sewer Project was completed in 1990, tying the northern and central sections of Town into the Charles River Pollution Control District (CRPCD). Phase II of the Town's Sewer Project, financed by bonds dated September 15, 1994, was completed in 1994 increasing the Water and Sewer Division's operating capacity to five sewer pumping stations, sixteen miles of sewer pipes and three metering stations. The Bellingham Water Department provides water to most Town residents and businesses. Town water is supplied from sixteen wells and is distributed to approximately 5,787 customers through a 90-mile pipe network of 6 inch to 16 inch mains. In addition, there are some 150 private wells in Bellingham. The average daily pumping rate is 1.58 MGD, with a peak rate of 2.4 MGD. The system's storage capacity in three standpipes is 5.1 million gallons. The water supply in Bellingham is presently adequate and capacity to serve long-term growth appears to be good. Two power companies, Boston Edison and Massachusetts Electric, supply electricity to Bellingham. The Northeast Energy Association's gas-fired co-generation plant, located in Bellingham, generates in excess of $1,300,000 in tax revenues annually. The facility was the first new electric generation facility to be built in Massachusetts since the Pilgrim Nuclear Plant and provides approximately 10 percent of Boston Edison's current capacity. In March 2000 construction began on another gas-fired electric generation plant which was completed in 2003. The American National Power generates in excess of $2,700,000. Tax revenues in excess of $50 million are expected over the next 20 years from the recently completed plant. No other power plants are proposed for construction within the Town. Bay State Gas is the provider of natural gas to the Bellingham area. Education The Town's school system currently maintains and operates three elementary schools and a junior-senior high school, providing education from preschool through grade 12, and an educational center for students requiring special education. To meet anticipated future enrollment needs, the Town constructed a new senior high school and renovated the Middle School, at an estimated total cost of $42.2 million. The Town believes that school capacity will be adequate for the foreseeable future. The Town is receiving state school construction grants that cover 76 percent of eligible project costs, including debt service associated with the financing of these projects. In addition, the Town is a member of the Blackstone Valley Vocational Regional School District, which provides vocational training for students in grades 9 through 12.

3
School Enrollments (1)
Projected2004-05 2005-06 2006-07 2007-08 2008-09 2009-10 2010-11
Kindergarten - 6 1,445 1,384 1,349 1,349 1,372 1,360 1,324 Grades 7 -8 432 440 442 417 386 410 426 Grades 9 -12 805 786 800 789 794 772 779 Total 2,682 2,610 2,591 2,555 2,552 2,542 2,529
Actual
Source: Superintendent of Schools. (1) As of October 1. Population and Income The following table illustrates census information for the Town, the Commonwealth and the United States.
Bellingham Massachusetts United States
Median Age:2000 36.3 36.5 35.3 1990 32.0 33.6 32.9
Median Family Income:2000 72,074$ 61,664$ 50,046$ 1990 50,681 44,367 35,225
Per Capita Income:2000 25,047$ 25,952$ 21,587$ 1990 15,869 17,224 14,420 `
Source: Federal Census. Employment by Industry The following table presents a breakdown of the major categories of employment for the Town:
Industry 2004 2005 2006 2007 2008
Construction 382 403 387 408 350 Manufacturing 593 619 593 582 541 Trade, Transportation & Utilities 2,314 2,436 2,741 2,614 2,568 Financial Activities 86 79 83 82 67 Professional and Business Services 213 251 254 251 263 Leisure and Hospitality 780 800 781 742 739 Other Services 221 213 203 176 160 Total Employment 4,589 4,801 5,042 4,855 4,688
Number of Establishments 440 426 422 424 417 Average Weekly Wages $561 $569 $594 $621 $650Total Wages $155,549,447 $164,172,399 $179,539,165 $182,033,164 $184,821,867
Calendar Year

4
Major Employers Following are the major employers in the community, excluding the Town which employs approximately 525 persons: Number of Name Nature of Business Employees Walmart Retail 250 Dunkin Donuts N.E. Distribution 200 Blue Linx/ABP Bellingham Lumber Distribution 120 Home Depot Retail 100 Market Basket Grocery 100 Source: Chief Financial Officer. Labor Force, Employment and Unemployment Rates According to the Massachusetts Department of Employment and Training data, in December 2009, the Town had a total labor force of 9,577 of whom 8,544 were employed and 1,033 or 10.8% were unemployed as compared to 9.1% for the Commonwealth and 7.8% for Norfolk County. The following table sets forth the Town's average labor force and unemployment rates for calendar years 2004 though 2008 in comparison with the unemployment rates for Norfolk County, the Commonwealth and the U.S. as a whole for the same period: Town of Bellingham Calendar Labor Unemployment Unemployment Rate Year Force Rate Norfolk County Massachusetts U.S.
2008 9,632 5.7% 5.3% 5.8% 2007 9,681 4.6 3.9 4.6 4.5 2006 9,641 5.1 4.3 4.9 4.6 2005 9,514 4.5 4.1 4.8 5.2 2004 9,605 4.9 4.5 4.4 5.4 Source: Massachusetts Department of Employment and Training. Building Permits Calendar Residential Non-Residential Total Year Number Value Number Value Number Value
2009 357 $ 5,620,083 103 $ 2,563,291 460 $ 8,183,374 2008 412 5,706,989 122 29,552,719 534 35,259,708 2007 425 8,112,154 87 6,820,082 512 14,932,236 2006 475 15,021,344 64 4,165,816 539 19,187,150 2005 706 23,426,317 78 198,767,600(1) 784 222,193,917 2004 684 16,489,476 138 37,002,261 822 53,491,737 Source: Town of Bellingham Building Inspector. (1) Increase due to 1,400 apartments built by JPI and a Dunkin Donuts distribution center.
5
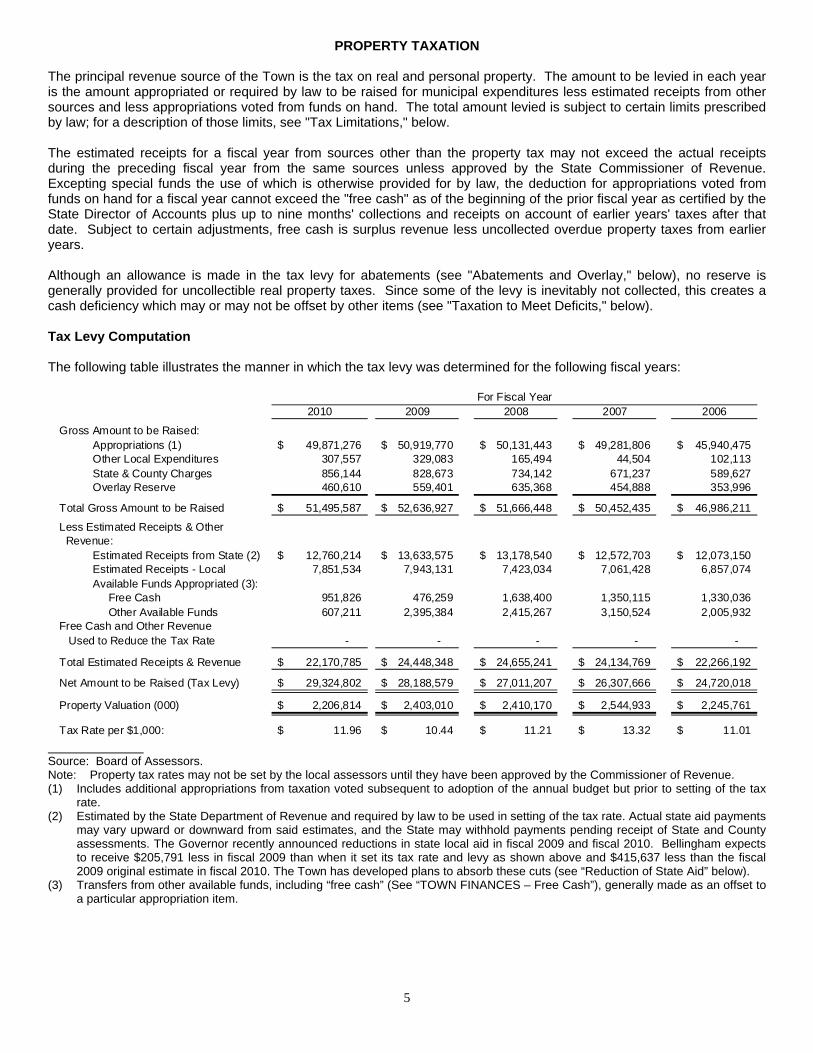
PROPERTY TAXATION The principal revenue source of the Town is the tax on real and personal property. The amount to be levied in each year is the amount appropriated or required by law to be raised for municipal expenditures less estimated receipts from other sources and less appropriations voted from funds on hand. The total amount levied is subject to certain limits prescribed by law; for a description of those limits, see "Tax Limitations," below. The estimated receipts for a fiscal year from sources other than the property tax may not exceed the actual receipts during the preceding fiscal year from the same sources unless approved by the State Commissioner of Revenue. Excepting special funds the use of which is otherwise provided for by law, the deduction for appropriations voted from funds on hand for a fiscal year cannot exceed the "free cash" as of the beginning of the prior fiscal year as certified by the State Director of Accounts plus up to nine months' collections and receipts on account of earlier years' taxes after that date. Subject to certain adjustments, free cash is surplus revenue less uncollected overdue property taxes from earlier years. Although an allowance is made in the tax levy for abatements (see "Abatements and Overlay," below), no reserve is generally provided for uncollectible real property taxes. Since some of the levy is inevitably not collected, this creates a cash deficiency which may or may not be offset by other items (see "Taxation to Meet Deficits," below). Tax Levy Computation The following table illustrates the manner in which the tax levy was determined for the following fiscal years:
2010 2009 2008 2007 2006
Gross Amount to be Raised:Appropriations (1) 49,871,276$ 50,919,770$ 50,131,443$ 49,281,806$ 45,940,475$ Other Local Expenditures 307,557 329,083 165,494 44,504 102,113 State & County Charges 856,144 828,673 734,142 671,237 589,627 Overlay Reserve 460,610 559,401 635,368 454,888 353,996
Total Gross Amount to be Raised 51,495,587$ 52,636,927$ 51,666,448$ 50,452,435$ 46,986,211$
Less Estimated Receipts & Other Revenue:
Estimated Receipts from State (2) 12,760,214$ 13,633,575$ 13,178,540$ 12,572,703$ 12,073,150$ Estimated Receipts - Local 7,851,534 7,943,131 7,423,034 7,061,428 6,857,074 Available Funds Appropriated (3): Free Cash 951,826 476,259 1,638,400 1,350,115 1,330,036 Other Available Funds 607,211 2,395,384 2,415,267 3,150,524 2,005,932
Free Cash and Other Revenue Used to Reduce the Tax Rate - - - - -
Total Estimated Receipts & Revenue 22,170,785$ 24,448,348$ 24,655,241$ 24,134,769$ 22,266,192$
Net Amount to be Raised (Tax Levy) 29,324,802$ 28,188,579$ 27,011,207$ 26,307,666$ 24,720,018$
Property Valuation (000) 2,206,814$ 2,403,010$ 2,410,170$ 2,544,933$ 2,245,761$
Tax Rate per $1,000: 11.96$ 10.44$ 11.21$ 13.32$ 11.01$
For Fiscal Year
Source: Board of Assessors. Note: Property tax rates may not be set by the local assessors until they have been approved by the Commissioner of Revenue. (1) Includes additional appropriations from taxation voted subsequent to adoption of the annual budget but prior to setting of the tax
rate. (2) Estimated by the State Department of Revenue and required by law to be used in setting of the tax rate. Actual state aid payments
may vary upward or downward from said estimates, and the State may withhold payments pending receipt of State and County assessments. The Governor recently announced reductions in state local aid in fiscal 2009 and fiscal 2010. Bellingham expects to receive $205,791 less in fiscal 2009 than when it set its tax rate and levy as shown above and $415,637 less than the fiscal 2009 original estimate in fiscal 2010. The Town has developed plans to absorb these cuts (see “Reduction of State Aid” below).
(3) Transfers from other available funds, including “free cash” (See “TOWN FINANCES – Free Cash”), generally made as an offset to a particular appropriation item.

6
Reduction of State Aid The Town of Bellingham has utilized various planning tools since 2007 to deal with the potential loss of state aid in fiscal 2009 through fiscal 2011. The Town Administrator and the Chief Financial Officer advised the Board of Selectmen in fiscal 2007 to adopt a policy of “non-replacement” except in critical positions or one person offices. As a result, the Town has not replaced a total of 11 employees since this policy was adopted. Most of these positions were vacated due to retirement and as a result, the Town has not had to absorb the unemployment costs as the Town is self funded. Budgets were level-funded except for contractual obligations for fiscal 2007, fiscal 2008 and fiscal 2009. In fiscal 2010, the Town lowered the school department budget by $600,000 and made corresponding cuts in town budgets. These cuts will result in additional employment costs as the Town is self funded as several staff positions were eliminated in the school department. In addition, union contracts were negotiated with substantial changes to the co-pays for office visits and prescription drugs. These changes should result in savings of approximately $300,000 for the Town’s health care costs. Several unions and all non-union personnel agreed to forgo the 3% raise for the first six months of fiscal 2010. All non-union school department personnel agreed to forgo the 3% raises for the entire fiscal 2010. These changes allowed the Town to continue operations for fiscal 2010 in spite of the state aid cuts without the use of one time revenues. The Town’s Free Cash for fiscal 2009 was used primarily for capital expenditures and to fund the snow and ice deficit. This remains the Town’s intention of the use of Free Cash for fiscal 2010. Assessed and Equalized Valuations Property is classified for the purpose of taxation according to its use. The legislature has in substance created three classes of taxable property: (1) residential real property, (2) open space land, and (3) all other (commercial, industrial and personal property). Within limits, cities and towns are given the option of determining the share of the annual levy to be borne by each of the three categories. The share required to be borne by residential real property is at least 50 per cent of its share of the total taxable valuation; the effective rate for open space must be at least 75 per cent of the effective rate for residential real property; and the share of commercial, industrial and personal property must not exceed 175 percent of their share of the total valuation. A city or town may also exempt up to 20 percent of the valuation of residential real property (where used as the taxpayer’s principal residence) and up to 10 percent of the valuation of commercial real property (where occupied by certain small businesses). Property may not be classified in a city or town until the State Commissioner of Revenue certifies that all property in the city or town has been assessed at its fair cash value. Such certification must take place every three years. Related statutes provide that certain forest land, agricultural or horticultural land (assessed at the value it has for these purposes) and recreational land (assessed on the basis of its use at a maximum of 25 percent of its fair cash value) are all to be taxed at the rate applicable to commercial property. Land classified as forest land is valued for this purpose at five percent of fair cash value but not less than ten dollars per acre. In order to determine appropriate relative values for the purposes of certain distributions to and assessments upon cities and towns, the Commissioner of Revenue biennially makes his own redetermination of the fair cash value of the taxable property in each municipality. This is known as the “equalized value”. See “DEBT LIMITS” above. Valuation of real and personal property in Bellingham is established by the Board of Assessors. The Town underwent revaluation most recently in fiscal 2008. The 2010 assessed valuation is currently 85 percent of equalized valuation as shown below: Assessed Valuations (1) Official Assessed Valuation Fiscal Real Personal Equalized as a Percent of Year Property Property Total Valuation (2) Equalized
2010 $1,907,972,471 $298,841,447 $2,206,813,918 $2,594,856,000 85.0% 2009 2,087,507,437 315,502,242 2,403,009,679 2,594,856,000 92.6 2008 2,112,918,126 297,252,241 2,410,170,367 2,509,075,900 96.1 2007 2,156,784,841 388,148,195 2,544,933,036 2,509,075,900 101.4 2006 1,869,101,797 376,659,975 2,245,761,772 2,047,232,900 109.7 (1) Source: Board of Assessors (2) Source: Massachusetts Department of Revenue - Equalized valuations are established as of January 1 of even-numbered years
for the next two years.
7
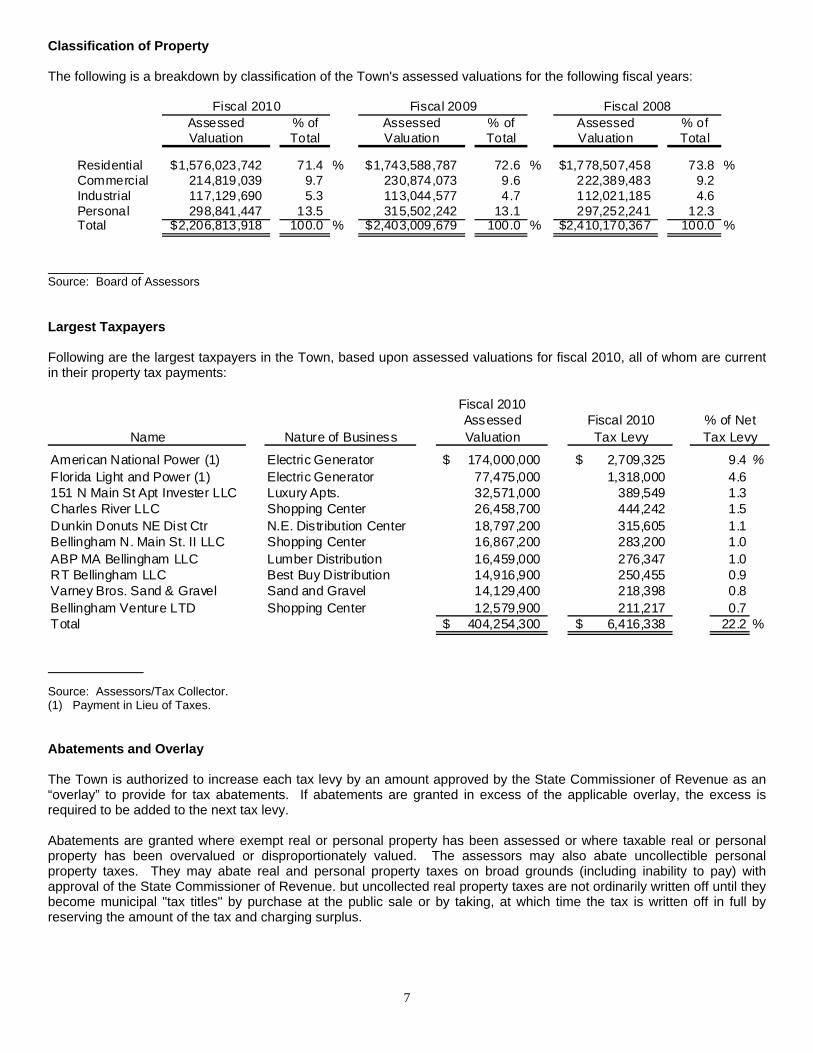
Classification of Property The following is a breakdown by classification of the Town's assessed valuations for the following fiscal years:
Fiscal 2010 Fiscal 2009 Fiscal 2008Assessed % of Assessed % of Assessed % ofValuation Total Valuation Total Valuation Total
Residential $1,576,023,742 71.4 % $1,743,588,787 72.6 % $1,778,507,458 73.8 %Commercial 214,819,039 9.7 230,874,073 9.6 222,389,483 9.2Industrial 117,129,690 5.3 113,044,577 4.7 112,021,185 4.6Personal 298,841,447 13.5 315,502,242 13.1 297,252,241 12.3Total $2,206,813,918 100.0 % $2,403,009,679 100.0 % $2,410,170,367 100.0 %
Source: Board of Assessors Largest Taxpayers Following are the largest taxpayers in the Town, based upon assessed valuations for fiscal 2010, all of whom are current in their property tax payments:
Fiscal 2010Assessed Fiscal 2010 % of Net
Name Nature of Business Valuation Tax Levy Tax Levy
American National Power (1) Electric Generator 174,000,000$ 2,709,325$ 9.4 %Florida Light and Power (1) Electric Generator 77,475,000 1,318,000 4.6151 N Main St Apt Invester LLC Luxury Apts. 32,571,000 389,549 1.3Charles River LLC Shopping Center 26,458,700 444,242 1.5Dunkin Donuts NE Dist Ctr N.E. Distribution Center 18,797,200 315,605 1.1Bellingham N. Main St. II LLC Shopping Center 16,867,200 283,200 1.0ABP MA Bellingham LLC Lumber Distribution 16,459,000 276,347 1.0RT Bellingham LLC Best Buy Distribution 14,916,900 250,455 0.9Varney Bros. Sand & Gravel Sand and Gravel 14,129,400 218,398 0.8Bellingham Venture LTD Shopping Center 12,579,900 211,217 0.7Total 404,254,300$ 6,416,338$ 22.2 %
Source: Assessors/Tax Collector. (1) Payment in Lieu of Taxes. Abatements and Overlay The Town is authorized to increase each tax levy by an amount approved by the State Commissioner of Revenue as an “overlay” to provide for tax abatements. If abatements are granted in excess of the applicable overlay, the excess is required to be added to the next tax levy. Abatements are granted where exempt real or personal property has been assessed or where taxable real or personal property has been overvalued or disproportionately valued. The assessors may also abate uncollectible personal property taxes. They may abate real and personal property taxes on broad grounds (including inability to pay) with approval of the State Commissioner of Revenue. but uncollected real property taxes are not ordinarily written off until they become municipal "tax titles" by purchase at the public sale or by taking, at which time the tax is written off in full by reserving the amount of the tax and charging surplus.
8
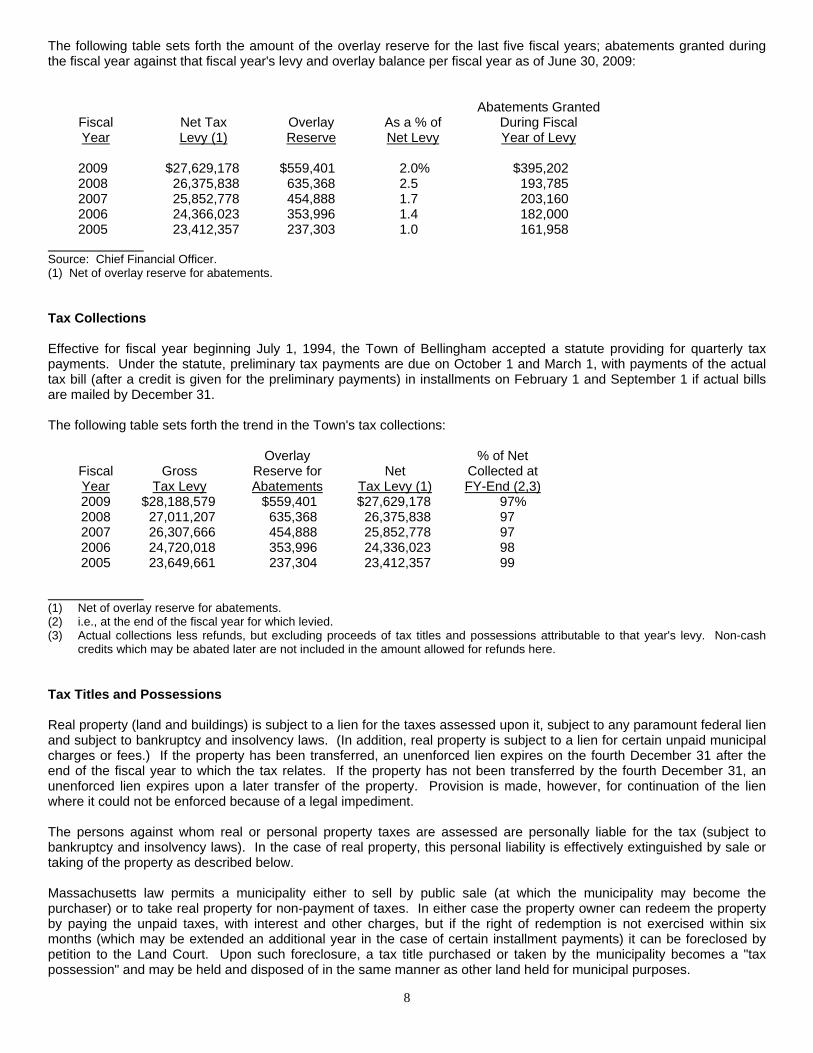
The following table sets forth the amount of the overlay reserve for the last five fiscal years; abatements granted during the fiscal year against that fiscal year's levy and overlay balance per fiscal year as of June 30, 2009: Abatements Granted Fiscal Net Tax Overlay As a % of During Fiscal Year Levy (1) Reserve Net Levy Year of Levy 2009 $27,629,178 $559,401 2.0% $395,202 2008 26,375,838 635,368 2.5 193,785 2007 25,852,778 454,888 1.7 203,160 2006 24,366,023 353,996 1.4 182,000 2005 23,412,357 237,303 1.0 161,958 Source: Chief Financial Officer. (1) Net of overlay reserve for abatements. Tax Collections Effective for fiscal year beginning July 1, 1994, the Town of Bellingham accepted a statute providing for quarterly tax payments. Under the statute, preliminary tax payments are due on October 1 and March 1, with payments of the actual tax bill (after a credit is given for the preliminary payments) in installments on February 1 and September 1 if actual bills are mailed by December 31. The following table sets forth the trend in the Town's tax collections: Overlay % of Net Fiscal Gross Reserve for Net Collected at Year Tax Levy Abatements Tax Levy (1) FY-End (2,3) 2009 $28,188,579 $559,401 $27,629,178 97% 2008 27,011,207 635,368 26,375,838 97 2007 26,307,666 454,888 25,852,778 97 2006 24,720,018 353,996 24,336,023 98 2005 23,649,661 237,304 23,412,357 99 (1) Net of overlay reserve for abatements. (2) i.e., at the end of the fiscal year for which levied. (3) Actual collections less refunds, but excluding proceeds of tax titles and possessions attributable to that year's levy. Non-cash
credits which may be abated later are not included in the amount allowed for refunds here. Tax Titles and Possessions Real property (land and buildings) is subject to a lien for the taxes assessed upon it, subject to any paramount federal lien and subject to bankruptcy and insolvency laws. (In addition, real property is subject to a lien for certain unpaid municipal charges or fees.) If the property has been transferred, an unenforced lien expires on the fourth December 31 after the end of the fiscal year to which the tax relates. If the property has not been transferred by the fourth December 31, an unenforced lien expires upon a later transfer of the property. Provision is made, however, for continuation of the lien where it could not be enforced because of a legal impediment. The persons against whom real or personal property taxes are assessed are personally liable for the tax (subject to bankruptcy and insolvency laws). In the case of real property, this personal liability is effectively extinguished by sale or taking of the property as described below. Massachusetts law permits a municipality either to sell by public sale (at which the municipality may become the purchaser) or to take real property for non-payment of taxes. In either case the property owner can redeem the property by paying the unpaid taxes, with interest and other charges, but if the right of redemption is not exercised within six months (which may be extended an additional year in the case of certain installment payments) it can be foreclosed by petition to the Land Court. Upon such foreclosure, a tax title purchased or taken by the municipality becomes a "tax possession" and may be held and disposed of in the same manner as other land held for municipal purposes.

9
It is the Town's practice to commence taking of real property for nonpayment of taxes within one year from the due date of the taxes. Taxes Outstanding The following table presents aggregate overdue property taxes, tax titles and tax possessions outstanding for the last five fiscal years:
As of Aggregate Taxes Tax June 30 Outstanding (1) Tax Titles Possessions 2009 $576,124 $856,059 $254,746 2008 535,725 743,888 254,746 2007 584,852 625,352 254,746 2006 402,879 639,124 266,842 2005 373,365 627,032 204,126 Source: Chief Financial Officer. (1) For five prior fiscal years. Excludes abated taxes; includes taxes in litigation, if any. Sale of Tax Receivables Cities and towns are authorized to sell delinquent property tax receivables by public sale or auction, either individually or in bulk. The Town does not expect to utilize this option at the present time. Taxation to Meet Deficits As noted elsewhere (see “Abatements and Overlay” above) overlay deficits, i.e. tax abatements in excess of the overlay included in the tax levy to cover abatements, are required to be added to the next tax levy. It is generally understood that revenue deficits, i.e. those resulting from non-property tax revenues being less than anticipated, are also required to be added to the tax levy (at least to the extent not covered by surplus revenue). Amounts lawfully expended since the prior tax levy and not included therein are also required to be included in the annual tax levy. The circumstances under which this can arise are limited since municipal departments are generally prohibited from incurring liabilities in excess of appropriations except for major disasters, mandated items, contracts in aid of housing and renewal projects and other long-term contracts. In addition, utilities must be paid at established rates and certain established salaries, e.g. civil service, must legally be paid for work actually performed, whether or not covered by appropriations. In the opinion of Bond Counsel, cities and towns are authorized to appropriate sums, and thus to levy taxes, to cover deficits arising from other causes, such as “free cash” deficits arising from a failure to collect taxes. This is not generally understood, however, and it has not been the practice to levy taxes to cover free cash deficits. Except to the extent that such deficits have been reduced or eliminated by subsequent collections of uncollected taxes (including sales of tax titles and tax possessions), lapsed appropriations, non-property tax revenues in excess of estimates, other miscellaneous items or funding loans authorized by special act, they remain in existence. Tax Limitations Chapter 59, Section 21C of the General Laws also know as Proposition 2 ½, imposes two separate limits on the annual tax levy of a city or town. The primary limitation is that the tax levy cannot exceed 2½ percent of the full and fair cash value. If a city or town exceeds the primary limitation, it must reduce its tax levy by at least 15 percent annually until it is in compliance, provided that the reduction can be reduced in any year to not less than 7½ percent by majority vote of the voters, or to less than 7½ percent by two-thirds vote of the voters. For cities and towns at or below the primary limit, a secondary limitation is that the tax levy cannot exceed the maximum levy limit for the preceding fiscal year as determined by the State Commissioner of Revenue by more than 2½ percent, subject to exceptions for property added to the tax rolls or property which has had an increase, other than as part of a general revaluation, in its assessed valuation over the prior year’s valuation.

10
This “growth” limit on the tax levy may be exceeded in any year by a majority vote of the voters, but an increase in the secondary or growth limit under this procedure does not permit a tax levy in excess of the primary limitation, since the two limitations apply independently. In addition, if the voters vote to approve taxes in excess of the “growth” limit for the purpose of funding a stabilization fund, such increased amount may only be taken into account for purposes of calculating the maximum levy limit in each subsequent year if the board of selectmen of a town or the city council of a city votes by a two-thirds vote to appropriate such increased amount in such subsequent year to the stabilization fund. The applicable tax limits may also be reduced in any year by a majority vote of the voters. The State Commissioner of Revenue may adjust any tax limit “to counterbalance the effects of extraordinary, non-recurring events which occurred during the base year”. Proposition 2 ½ further provides that the voters may exclude from the taxes subject to the tax limits and from the calculation of the maximum tax levy (a) the amount required to pay debt service on bonds and notes issued before November 4, 1980, if the exclusion is approved by a majority vote of the voters, and (b) the amount required to pay debt service on any specific subsequent issue for which similar approval is obtained. Even with voter approval, the holders of the obligations for which unlimited taxes may be assessed do not have a statutory priority or security interest in the portion of the tax levy attributable to such obligations. It should be noted that Massachusetts General Laws Chapter 44, Section 20 requires that the taxes excluded from the levy limit to pay debt service on any such bonds and notes be calculated based on the true interest cost of the issue. Accordingly, the Department of Revenue limits the amount of taxes which may be levied in each year to pay debt service on any such bonds and notes to the amount of such debt service, less a pro rata portion of any original issue premium received by the city or town that was not applied to pay costs of issuance. Voters may also exclude from the Proposition 2½ limits the amount required to pay specified capital outlay expenditures or for the city or town’s apportioned share for certain capital outlay expenditures by a regional governmental unit. In addition, the city council of a city, with the approval of the mayor if required, or the board of selectmen or the town council of a town may vote to exclude from the Proposition 2½ limits taxes raised in lieu of sewer or water charges to pay debt service on bonds or notes issued by the municipality (or by an independent authority, commission or district) for water or sewer purposes, provided that the municipality’s sewer or water charges are reduced accordingly. In addition, Proposition 2½ limits the annual increase in the total assessments on cities and towns by any county, district, authority, the Commonwealth or any other governmental entity (except regional school districts, the MWRA and certain districts for which special legislation provides otherwise) to the sum of (a) 2½ percent of the prior year’s assessments and (b) “any increases in costs, charges or fees for services customarily provided locally or for services subscribed to at local option”. Regional water districts, regional sewerage districts and regional veterans districts may exceed these limitations under statutory procedures requiring a two-thirds vote of the district’s governing body and either approval of the local appropriating authorities (by two-thirds vote in districts with more than two members or by majority vote in two-member districts) or approval of the registered voters in a local election (in the case of two-member districts). Under Proposition 2½ any State law to take effect on or after January 1, 1981 imposing a direct service or cost obligation on a city or town will become effective only if accepted or voluntarily funded by the city or town or if State funding is provided. Similarly, State rules or regulations imposing additional costs on a city or town or laws granting or increasing local tax exemptions are to take effect only if adequate State appropriations are provided. These statutory provisions do not apply to costs resulting from judicial decisions.
11
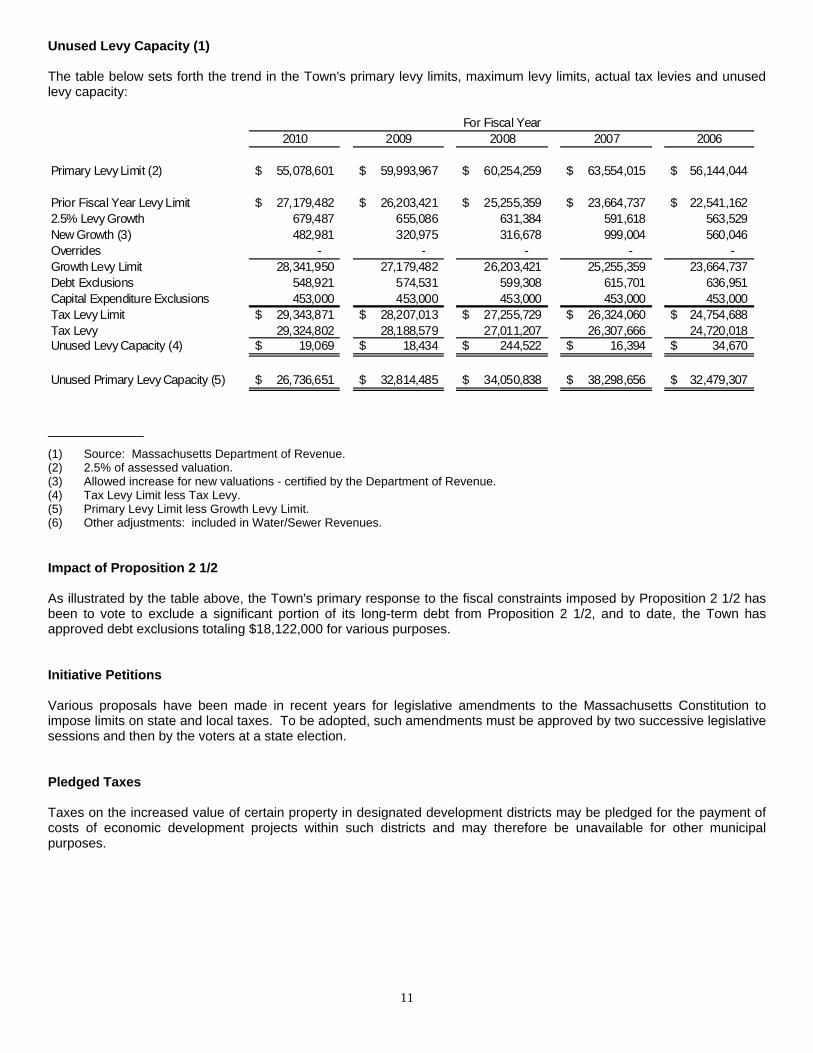
Unused Levy Capacity (1) The table below sets forth the trend in the Town's primary levy limits, maximum levy limits, actual tax levies and unused levy capacity:
2010 2009 2008 2007 2006
Primary Levy Limit (2) 55,078,601$ 59,993,967$ 60,254,259$ 63,554,015$ 56,144,044$
Prior Fiscal Year Levy Limit 27,179,482$ 26,203,421$ 25,255,359$ 23,664,737$ 22,541,162$ 2.5% Levy Growth 679,487 655,086 631,384 591,618 563,529 New Growth (3) 482,981 320,975 316,678 999,004 560,046 Overrides - - - - - Growth Levy Limit 28,341,950 27,179,482 26,203,421 25,255,359 23,664,737 Debt Exclusions 548,921 574,531 599,308 615,701 636,951 Capital Expenditure Exclusions 453,000 453,000 453,000 453,000 453,000 Tax Levy Limit 29,343,871$ 28,207,013$ 27,255,729$ 26,324,060$ 24,754,688$ Tax Levy 29,324,802 28,188,579 27,011,207 26,307,666 24,720,018 Unused Levy Capacity (4) 19,069$ 18,434$ 244,522$ 16,394$ 34,670$
Unused Primary Levy Capacity (5) 26,736,651$ 32,814,485$ 34,050,838$ 38,298,656$ 32,479,307$
For Fiscal Year
(1) Source: Massachusetts Department of Revenue. (2) 2.5% of assessed valuation. (3) Allowed increase for new valuations - certified by the Department of Revenue. (4) Tax Levy Limit less Tax Levy. (5) Primary Levy Limit less Growth Levy Limit. (6) Other adjustments: included in Water/Sewer Revenues. Impact of Proposition 2 1/2 As illustrated by the table above, the Town's primary response to the fiscal constraints imposed by Proposition 2 1/2 has been to vote to exclude a significant portion of its long-term debt from Proposition 2 1/2, and to date, the Town has approved debt exclusions totaling $18,122,000 for various purposes.
Initiative Petitions Various proposals have been made in recent years for legislative amendments to the Massachusetts Constitution to impose limits on state and local taxes. To be adopted, such amendments must be approved by two successive legislative sessions and then by the voters at a state election. Pledged Taxes Taxes on the increased value of certain property in designated development districts may be pledged for the payment of costs of economic development projects within such districts and may therefore be unavailable for other municipal purposes.

12
Community Preservation Act The Massachusetts Community Preservation Act (the “CPA”) permits cities and towns that accept its provisions to levy a surcharge on its real property tax levy and to receive state matching funds for the acquisition, creation, preservation, rehabilitation and restoration of open space, historic resources and affordable housing. The provisions of the CPA must be accepted by the voters of the city or town at an election after such provisions have first been accepted by either a vote of the legislative body of the city or town or an initiative petition signed by 5% of its registered voters. A city or town may approve a surcharge of up to 3% of the real property tax levy, and it may accept one or more exemptions to the surcharge under the CPA, including an exemption for low-income individuals and families and for low and moderate-income senior citizens, an exemption for $100,000 of the value of each taxable parcel of residential real property, and an exemption for commercial and industrial properties in cities and towns with classified tax rates. The surcharge is not counted in the total taxes assessed for the purpose of determining the permitted levy amount under Proposition 2 ½ (see “Tax Limitations” under “PROPERTY TAX”). A city or town may revoke its acceptance of the provisions f the CPA at any time after 5 years from the date of such acceptance and may change the amount of the surcharge or the exemptions to the surcharge at any time, provided that any such revocation or change must be approved pursuant to the same process as acceptance of the CPA. Any city or town that accepts the provisions of the CPA will receive annual state matching grants to supplement amounts raised by its surcharge on the real property tax levy. The state matching funds are raised from certain recording and filing fees of the registers of deeds. Those amounts are deposited into a state trust fund and are distributed to cities and towns that have accepted the provision of the CPA, which distributions are not subject to annual appropriation by the state legislature. The amount distributed tot each city and town is based on a statutory formula which requires that 80% of the amount in the state trust fund be used to match an equal percentage of the amount raised locally by each city and town, and that the remaining 20% of the amount in the fund be distributed only to those cities and towns that levy the maximum 3% surcharge base on a formula which takes into account equalized property valuation and population, resulting in larger distributions to those communities with low valuations and small populations. The total state distribution made to any city or town may not, however, exceed 100% of the amount raised locally by the surcharge on the real property tax levy. The amounts raised by the surcharge on real property taxes and received in state matching funds are required to be deposited in a dedicated community preservation fund. Each city or town that accepts the provisions of the CPA is required to establish a community preservation committee to study the community preservation needs of the community and to make recommendations to the legislative body of the city or town regarding the community preservation projects that should be funded from the community preservation fund. Upon the recommendations of the committee, the legislative body of the city or town may appropriate amounts from the fund for permitted community preservation purposes or may reserve amounts for spending in future fiscal years, provided that at least 10% of the total annual revenues to the fund must be spent or set aside for open space purposes, 10% for historic resource purposes and 10% for affordable housing purposes. The CPA authorizes cities and towns that accept its provisions to issue bonds and notes in anticipation of the receipt of surcharge revenues to finance community preservation projects approved under the provisions of the CPA. Bonds and notes issued under the CPA are general obligations of the city or town and are payable from amounts on deposit in the community preservation fund. In the event that a city or town revokes its acceptance of the provisions of the CPA, the surcharge shall remain in effect until all contractual obligations incurred by the city of town prior to such revocation, including the payment of bonds or notes issued under the CPA, have been fully discharged. The Town has not adopted the Community Preservation Act.

13
TOWN FINANCES The Budget and Appropriation Process The annual appropriations of the Town are ordinarily made at the Annual Town Meeting which generally takes place in May. Appropriations may also be voted at Special Town Meetings. Every town must have an appropriation, advisory, or finance committee. The Town of Bellingham's Finance Committee makes recommendations with respect to the budget of proposed expenditures which is submitted by the Board of Selectmen at the Annual Town Meeting. The school budget is limited to the total amount appropriated by the town meeting, but the school committee retains full power to allocate the funds appropriated. State and county assessments, abatements in excess of overlays, principal and interest not otherwise provided for, and final judgments are included in the tax levy whether or not included in the budget. Revenues are not required to be set forth in the budget, but estimated non-tax revenues are taken into account by the assessors in fixing the tax levy. Operating Budget Trends The following table sets forth the trend in the Town's operating budgets:
Appropriated Appropriated Appropriated Appropriated AppropriatedFiscal 2010 Fiscal 2009 Fiscal 2008 Fiscal 2007 Fiscal 2006
General Government 1,976,339$ 2,011,001$ 1,920,893$ 1,820,958$ 1,829,462$ Insurance & Benefits 7,350,099 7,473,100 7,192,383 6,952,000 5,447,359 Public Safety 4,526,497 4,803,484 4,433,816 4,385,018 4,264,602 Education 22,255,030 22,708,722 22,093,252 21,656,478 20,707,917 Public Works 2,777,535 2,909,305 2,806,013 2,776,342 2,554,331 Health/Human Services 216,993 268,001 268,084 259,362 237,702 Recreation/Culture 602,367 607,367 584,071 565,800 548,642 Debt Service 5,646,113 5,699,801 5,425,000 5,425,000 5,500,000 Water/Sewer 2,814,273 2,752,575 2,337,320 2,306,650 2,119,035 Total 48,165,246$ 49,233,356$ 47,060,832$ 46,147,608$ 43,209,050$
Source: Chief Financial Officer. Education Reform State legislation known as the Education Reform Act of 1993, as amended, imposes certain minimum expenditure requirements on municipalities with respect to funding for education and related programs, and may affect the level of state aid to be received for education. The requirements are determined on the basis of formulas affected by various measures of wealth and income, enrollments, prior levels of local spending and state aid, and other factors. The Town has routinely exceeded its spending requirements, as mandated by the Education Reform Act. Capital Planning Committee The Town has a Capital Planning Committee which reviews and updates a formalized 5-year operating and capital program on an annual basis. Upon review of the Town's needs, the Committee makes recommendations on various proposed capital projects to the Board of Selectmen based on priority. Revenues Property Taxes: Property taxes are the major source of revenue of the Town. The total amount levied is subject to certain limits prescribed by law; for a description of those limits, see "Tax Limitations," above.

14
State Distributions: In addition to grants for specified capital purposes (some of which are payable over the life of the bonds issued for the projects), the Commonwealth provides financial assistance to cities and towns for current purposes. Payments to cities and towns are derived primarily from a percentage of the State’s personal income, sales and use, and corporate excise tax receipts, together with the net receipts from the State Lottery. A municipality’s state aid entitlement is based on a number of different formulas, of which the “schools” and “lottery” formulas are the most important. Both of the major formulas tend to provide more state aid to poorer communities. The formulas for determining a municipality’s state aid entitlement are subject to amendment by the state legislature and, while a formula might indicate that a particular amount of state aid is owed, the amount of state aid actually paid is limited to the amount appropriated by the state legislature. The state annually estimates state aid but actual payments may vary from the estimate. In fiscal 2008, net distributions from the state totaled $10,597,088. In fiscal 2009 the Town received $9,784,204. The Town expects to receive $10,299,052 in fiscal 2010. In the fall of 1986, both the State Legislature (by statute, repealed as of October 15 1999) and the voters (by initiative petition) placed limits on the growth of state tax revenues. Although somewhat different in detail, each measure essentially limited the annual growth in state tax revenues to an average rate of growth in wages and salaries in the Commonwealth over the three previous calendar years. If not amended, the remaining law could restrict the amount of state revenues available for state aid to local communities. Legislation was enacted in 1991 to help municipalities compensate for additional local aid reductions by the Commonwealth for fiscal year 1992. Under that law, municipalities were allowed to defer budgeting for teacher’s summer compensation payable by the end of the fiscal years 1992 and 1993. Municipalities that chose to defer such amounts are required to amortize the resulting budget deficiency by raising at least one fifteenth of the deferred amount in each of the fiscal years 1997 through 2011, or in accordance with a more rapid amortization schedule. Reduction of State Aid: Immediately upon learning that there would be a mid-year State Aid reduction for FY2009, the Chief Financial Officer and the Town Administrator along with the Board of Selectmen imposed a mandatory spending freeze on all departments. The spending freeze was shared equally by the general government and the school department. This action, coupled with the fact that revenue estimates for both FY2009 and FY2010 were conservative, ensured that the Town would be able to absorb the state aid loss and not experience a revenue deficit for FY2009. The following are state aid payments received by the Town (including revenue sharing, capital project grants and education) for fiscal years 2005 through 2009 and an estimate for fiscal year 2010: Fiscal State Aid Year Receipts 2010(1) $12,760,835 (est.) 2009(1) 13,146,297 2008(1) 13,058,871 2007(2) 12,852,816 2006 12,055,875 2005 11,765,526 (1) Includes $2,461,783 Massachusetts School Building Assistance. (2) Includes $267,900 Massachusetts School Building Assistance. State School Building Assistance Program: Under its school building assistance program, the Commonwealth of Massachusetts provides grants to cities, towns and regional school districts for school construction projects. Until July 26, 2004, the State Board of Education was responsible for approving grants for school projects and otherwise administering the program. Grant amounts ranged from 50% to 90% of approved project costs. Municipalities generally issued bonds to finance the entire project cost, and the Commonwealth disbursed the grants in equal annual installments over the term of the related bonds. Pursuant to legislation which became effective on July 26, 2004, the state legislature created the Massachusetts School Building Authority (the “Authority”) to finance and administer the school building assistance program. The Authority has assumed all powers and obligations of the Board of Education with respect to the program. In addition to certain other amounts, the legislation dedicates a portion of Commonwealth sales tax receipts to the Authority to finance the program.

15
Projects previously approved for grants by the State Board of Education are entitled to receive grant payments from the Authority based on the approved project cost and reimbursement rate applicable under the prior law. The Authority has paid and is expected to continue to pay the remaining amounts of the grants for such projects either in annual installments to reimburse debt service on bonds issued by the municipalities to finance such projects, or as lump sum payments to contribute to the defeasance of such bonds. Projects on the priority waiting list as of July 1, 2004 are also entitled to receive grant payments from the Authority based on the eligible project costs and reimbursement rates applicable under the prior law. With limited exceptions, the Authority is required to fund the grants for such projects in the order in which they appear on the waiting list. Grants for any such projects that have been completed or substantially completed have been paid and are expected to continue to be paid by the Authority in lump sum payments, thereby eliminating the need for the Authority to reimburse interest expenses that would otherwise be incurred by the municipalities to permanently finance the Authority’s share of such project costs. Interest on debt issued by municipalities prior to July 1, 2004 to finance such project costs, and interest on temporary debt until receipt of the grant, is included in the approved costs of such projects. Grants for any such projects that have not yet commenced or that are underway have been and are expected to continue to be paid by the Authority as project costs are incurred by the municipality pursuant to a project funding agreement between the Authority and the municipality, eliminating the need for the municipality to borrow even on a temporary basis to finance the Authority’s share of the project costs in most cases. The range of reimbursement rates for new project grant applications submitted to the Authority on or after July 1, 2007 has been reduced to between 40% and 80% of approved project costs. The Authority promulgated new regulations with respect to the application and approval process for projects submitted after July 1, 2007. The Authority expects to pay grants for such projects as project costs are incurred pursuant to project funding agreements between the Authority and the municipalities. None of the interest expense incurred on debt issued by municipalities to finance their portion of the costs of new projects will be included in the approved project costs eligible for reimbursement. Motor Vehicle Excise Tax: An excise is imposed on the registration of motor vehicles (subject to exemptions) at a rate of $25 per $1,000 of valuation. The excise is collected by and for the benefit of the municipality in which the motor vehicle is customarily kept. Valuations are determined by a statutory formula based on manufacturers' list price and year of manufacture. Bills not paid when due bear interest at 12 percent per annum. Provision is also made to decline renewal of registration and owner's operating license until excise taxes are paid. The following table presents a five-year history of motor vehicle excise tax receipts of the Town: Fiscal Year Receipts 2009 $1,903,627 2008 2,127,333 2007 1,948,902 2006 1,987,634 2005 2,060,474 Water and Sewer Rates and Services: The Town provides water and sewer services to approximately 65% percent of the Town. The service is fully funded by user charges established to produce sufficient revenue to recover all costs, including debt service and administrative costs. In fiscal 2004, water and sewer were included as enterprise funds. Annual Audits The financial statements of the Town of Bellingham are audited annually by R. E. Brown & Co., Certified Public Accountants, of Mendon, Massachusetts. For information regarding the accounting policies of the Town, please refer to the Audited Financial Statements for fiscal year ending June 30, 2009, attached hereto as Appendix A. The attached report speaks only as of its date, and only to the matters expressly set forth therein. The auditors have not been engaged to review this Annual Report or to perform audit procedures regarding the post-audit period, nor have the auditors been requested to give their consent to the inclusion of their report in Appendix A. Except as stated in their report, the auditors have not been engaged to verify the financial information set out in Appendix A and are not passing upon and do not assume responsibility for the sufficiency, accuracy or completeness of the financial information presented in that appendix.

16
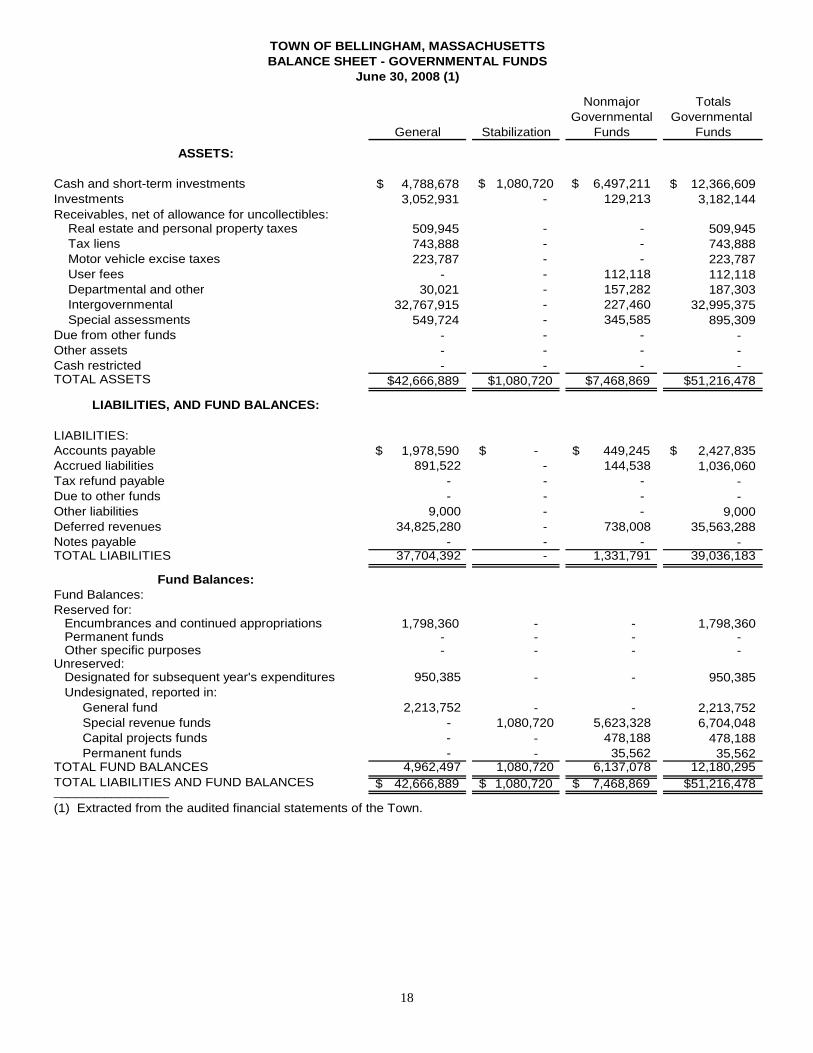
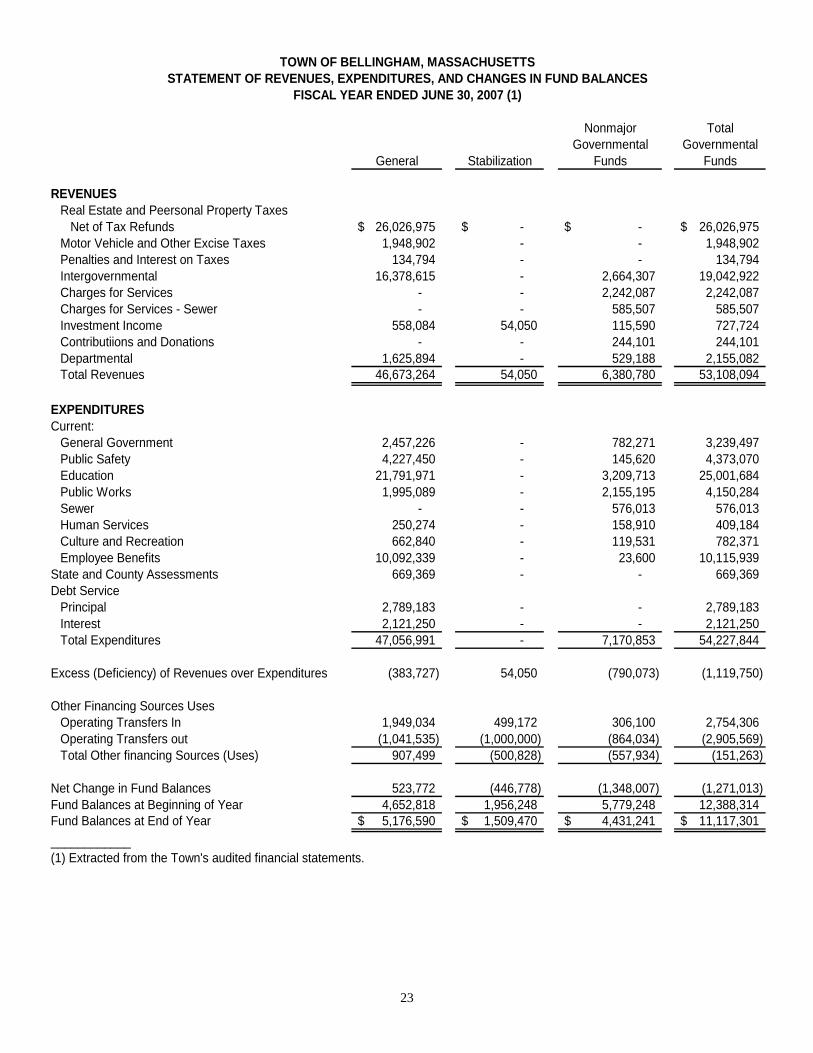
Financial Statements Set forth on the following pages are Governmental Funds Balance Sheets for fiscal years ended June 30, 2009, June 30, 2008, and June 30, 2007, and Statements of Revenues and Expenditures for fiscal years ended June 30, 2009, June 30, 2008, June 30, 2007, June 30, 2006 and June 30, 2005. Said statements were extracted from the audited financials statements of the Town.

17
TOWN OF BELLINGHAM, MASSACHUSETTSBALANCE SHEET - GOVERNMENTAL FUNDS
June 30, 2009 (1)
Nonmajor TotalsTax Governmental Governmental
General Stabilization Stabilization Funds Funds
ASSETS:
Cash and short-term investments 6,053,237$ $ 893,078 $ 83,228 $ 4,115,929 11,145,472$ Investments 1,459,328 52,642 1,511,970 Receivables, net of allowance for uncollectibles: Real estate and personal property taxes 548,985 548,985 Tax liens 856,059 856,059 Motor vehicle excise taxes 216,770 216,770 User fees 127,371 127,371 Departmental and other 41,368 233,571 274,939 Intergovernmental 30,306,132 344,826 30,650,958 Special assessments 484,824 274,383 759,207 TOTAL ASSETS $38,507,375 $893,078 $1,542,556 $5,148,722 $46,091,731
LIABILITIES, AND FUND BALANCES:
LIABILITIES:Accounts payable 1,003,837$ 1,046$ 1,004,883$ Accrued liabilities 908,044 144,232 1,052,276 Other liabilities 9,000 9,000 Deferred revenues 32,454,138 812,559 33,266,697 Notes payable 200,000 200,000 TOTAL LIABILITIES 34,375,019 - - 1,157,837 35,332,856
Fund Balances:Fund Balances:Reserved for: Encumbrances and continued appropriations 1,112,295 1,112,295 Unreserved: Designated for subsequent year's expenditures 964,885 964,885 Undesignated, reported in: General fund 2,055,176 2,055,176 Special revenue funds 893,078 1,542,556 3,746,766 6,182,400 Capital projects funds 207,005 207,005 Permanent funds 37,114 37,114 TOTAL FUND BALANCES 4,132,356 893,078 1,542,556 3,990,885 10,558,875 TOTAL LIABILITIES AND FUND BALANCES 38,507,375$ 893,078$ 1,542,556$ 5,148,722$ $46,091,731________________(1) Extracted from the audited financial statements of the Town.
18
TOWN OF BELLINGHAM, MASSACHUSETTSBALANCE SHEET - GOVERNMENTAL FUNDS
June 30, 2008 (1)
Nonmajor TotalsGovernmental Governmental
General Stabilization Funds Funds
ASSETS:
Cash and short-term investments 4,788,678$ $ 1,080,720 $ 6,497,211 12,366,609$ Investments 3,052,931 - 129,213 3,182,144 Receivables, net of allowance for uncollectibles: Real estate and personal property taxes 509,945 - - 509,945 Tax liens 743,888 - - 743,888 Motor vehicle excise taxes 223,787 - - 223,787 User fees - - 112,118 112,118 Departmental and other 30,021 - 157,282 187,303 Intergovernmental 32,767,915 - 227,460 32,995,375 Special assessments 549,724 - 345,585 895,309 Due from other funds - - - - Other assets - - - - Cash restricted - - - - TOTAL ASSETS $42,666,889 $1,080,720 $7,468,869 $51,216,478
LIABILITIES, AND FUND BALANCES:
LIABILITIES:Accounts payable 1,978,590$ -$ 449,245$ 2,427,835$ Accrued liabilities 891,522 - 144,538 1,036,060 Tax refund payable - - - - Due to other funds - - - - Other liabilities 9,000 - - 9,000 Deferred revenues 34,825,280 - 738,008 35,563,288 Notes payable - - - - TOTAL LIABILITIES 37,704,392 - 1,331,791 39,036,183
Fund Balances:Fund Balances:Reserved for: Encumbrances and continued appropriations 1,798,360 - - 1,798,360 Permanent funds - - - - Other specific purposes - - - - Unreserved: Designated for subsequent year's expenditures 950,385 - - 950,385 Undesignated, reported in: General fund 2,213,752 - - 2,213,752 Special revenue funds - 1,080,720 5,623,328 6,704,048 Capital projects funds - - 478,188 478,188 Permanent funds - - 35,562 35,562 TOTAL FUND BALANCES 4,962,497 1,080,720 6,137,078 12,180,295 TOTAL LIABILITIES AND FUND BALANCES 42,666,889$ 1,080,720$ 7,468,869$ $51,216,478________________(1) Extracted from the audited financial statements of the Town.

19
Nonmajor TotalsGovernmental Governmental
General Stabilization Funds Funds
ASSETS:
Cash and short-term investments 7,975,378$ $ 1,509,470 $ 4,283,104 13,767,952$ Investments - - 1,269,956 1,269,956 Receivables, net of allowance for uncollectibles: Real estate and personal property taxes 584,613 - - 584,613 Tax liens 625,352 - - 625,352 Motor vehicle excise taxes 214,999 - - 214,999 User fees - - 88,423 88,423 Departmental and other 26,306 - 132,238 158,544 Intergovernmental 35,229,698 - 29,394 35,259,092 Special assessments 122,313 - 390,541 512,854 TOTAL ASSETS $44,778,659 $1,509,470 $6,193,656 $52,481,785
LIABILITIES, AND FUND BALANCES:
LIABILITIES:Accounts Payable 738,822$ -$ 122,251$ 861,073$ Accrued Liabilities 759,966 - 128,962 888,928 Other Liabilities 1,300,000 - - 1,300,000 Deferred Revenue 36,803,281 - 611,202 37,414,483 Notes Payable - - 900,000 900,000 TOTAL LIABILITIES 39,602,069 - 1,762,415 41,364,484
Fund Balances:Fund Balances:Reserved for: Encumbrances and continued appropriations 1,468,285 - - 1,468,285 Unreserved: Designated for subsequent year's expenditures 1,391,425 300,000 - 1,691,425 Undesignated, reported in: - General fund 2,316,880 - - 2,316,880 Special revenue funds - 1,209,470 4,970,965 6,180,435 Capital projects funds - - (580,992) (580,992) Permanent funds - - 33,268 33,268 TOTAL FUND BALANCES 5,176,590 1,509,470 4,423,241 11,109,301 TOTAL LIABILITIES AND FUND BALANCES 44,778,659$ 1,509,470$ 6,193,656$ $52,481,785________________(1) Extracted from the audited financial statements of the Town.
TOWN OF BELLINGHAM, MASSACHUSETTSBALANCE SHEET - GOVERNMENTAL FUNDS
June 30, 2007 (1)

20
Nonmajor TotalsGovernmental Governmental
General Stabilization Funds Funds
ASSETS:
Cash and short-term investments 5,822,318$ $ 1,956,248 $ 4,822,218 12,600,784$ Investments 102,006 - 1,079,710 1,181,716 Receivables, net of allowance for uncollectibles: - Real estate and personal property taxes 402,879 - - 402,879 Tax liens 639,124 - - 639,124 Motor vehicle excise taxes 186,000 - - 186,000 User fees - - 87,416 87,416 Departmental and other 20,575 - 143,753 164,328 Intergovernmental 36,970,844 - 691,032 37,661,876 Special assessments 171,110 - 343,388 514,498 TOTAL ASSETS $44,314,856 $1,956,248 $7,167,517 $53,438,621
LIABILITIES, EQUITY AND FUND EQUITY
LIABILITIES:Accounts Payable 612,427$ -$ 200,202$ 812,629$ Accrued Liabilities 659,079 - - 659,079 Deferred Revenue 38,390,532 - 1,188,067 39,578,599 TOTAL LIABILITIES 39,662,038 - 1,388,269 41,050,307
FUND EQUITY:Fund Balances:Reserved for: Encumbrances and continued appropriations 1,451,540 - - 1,451,540 Unreserved: Designated for subsequent year's expenditures 1,056,105 1,000,000 - 2,056,105 Undesignated, reported in: - General fund 2,145,173 - - 2,145,173 Special revenue funds - 956,248 4,999,116 5,955,364 Capital projects funds - - 749,160 749,160 Permanent funds - - 30,972 30,972 TOTAL FUND EQUITY 4,652,818 1,956,248 5,779,248 12,388,314 TOTAL LIABILITIES AND FUND EQUITY 44,314,856$ 1,956,248$ 7,167,517$ $53,438,621________________(1) Extracted from the audited financial statements of the Town.
TOWN OF BELLINGHAM, MASSACHUSETTSBALANCE SHEET - GOVERNMENTAL FUNDS
June 30, 2006 (1)

21
TOWN OF BELLINGHAM, MASSACHUSETTSSTATEMENT OF REVENUES, EXPENDITURES, AND CHANGES IN FUND BALANCES
FISCAL YEAR ENDED JUNE 30, 2009(1)
Nonmajor TotalTax Governmental Governmental
General Stabilization Stabilization Funds Funds
REVENUESReal Estate and Personal Property Taxes Net of Tax Refunds 27,894,044$ 27,894,044$ Motor Vehicle and Other Excise Taxes 1,903,627 1,903,627 Penalties and Interest on Taxes 164,302 164,302 Intergovernmental 16,343,142 3,107,372 19,450,514 Charges for Services 2,369,315 2,369,315 Charges for Services - Sewer 666,235 666,235 Investment Income 213,239 12,358 50,618 14,998 291,213 Contributions and Donations 151,768 151,768 Departmental 1,351,431 492,566 1,843,997 Total Revenues 47,869,785 12,358 50,618 6,802,254 54,735,015
EXPENDITURESCurrent:
General Government 2,412,549 304,339 2,716,888 Public Safety 4,732,650 281,475 5,014,125 Education 22,469,280 4,082,797 26,552,077 Public Works 2,804,373 677,170 3,481,543 Sewer 719,821 719,821 Human Services 272,039 416,387 688,426 Culture and Recreation 619,042 217,519 836,561 Employee Benefits 10,046,218 500,000 10,546,218
State and County Assessments 850,467 850,467 Debt Service
Principal 3,057,880 3,057,880 Interest 1,955,270 1,955,270 Total Expenditures 49,219,768 - - 7,199,508 56,419,276
Excess (Deficiency) of Revenues over Expenditures (1,349,983) 12,358 50,618 (397,254) (1,684,261)
Other Financing Sources UsesProceeds from Bonds and Notes 220,000 220,000 Transfers in 852,251 35,000 887,251 Transfers out (332,409) (200,000) (512,001) (1,044,410) Total Other Financing Sources (Uses) 519,842 (200,000) - (257,001) 62,841
Net Change in Fund Balances (830,141) (187,642) 50,618 (654,255) (1,621,420) Fund Balances at Beginning of Year 4,962,497 1,080,720 1,491,938 4,645,140 12,180,295 Fund Balances at End of Year 4,132,356$ 893,078$ 1,542,556$ 3,990,885$ 10,558,875$ ____________(1) Extracted from the Town's audited financial statements.

22
TOWN OF BELLINGHAM, MASSACHUSETTSSTATEMENT OF REVENUES, EXPENDITURES, AND CHANGES IN FUND BALANCES
FISCAL YEAR ENDED JUNE 30, 2008(1)
Nonmajor TotalGovernmental Governmental
General Stabilization Funds Funds
REVENUESReal Estate and Personal Property Taxes Net of Tax Refunds 27,046,138$ -$ -$ 27,046,138$ Motor Vehicle and Other Excise Taxes 2,127,333 - - 2,127,333 Penalties and Interest on Taxes 159,643 - - 159,643 Intergovernmental 16,754,285 - 2,347,247 19,101,532 Charges for Services - - 2,469,492 2,469,492 Charges for Services - Sewer - - 705,415 705,415 Investment Income 426,527 56,250 108,981 591,758 Contributions and Donations - - 460,192 460,192 Departmental 1,169,695 - 648,445 1,818,140 Total Revenues 47,683,621 56,250 6,739,772 54,479,643
EXPENDITURESCurrent:
General Government 2,427,553 - 636,563 3,064,116 Public Safety 4,592,895 - 86,071 4,678,966 Education 22,103,550 - 3,380,238 25,483,788 Public Works 2,411,818 - 1,333,528 3,745,346 Sewer - - 594,839 594,839 Human Services 263,001 - 171,256 434,257 Culture and Recreation 603,752 127,875 731,627 Employee Benefits 10,563,837 - 23,600 10,587,437
State and County Assessments 824,031 - - 824,031 Capital Outlay - - - -
Debt ServicePrincipal 2,845,049 - - 2,845,049 Interest 2,063,722 - - 2,063,722 Total Expenditures 48,699,208 - 6,353,970 55,053,178
Excess (Deficiency) of Revenues over Expenditures (1,015,587) 56,250 385,802 (573,535)
Other Financing Sources UsesProceeds from Bonds and Notes - - 1,863,000 1,863,000 Proceeds from Refunding Bonds - - - - Premium from Issuance of Refunding Bonds - - - - Payments to Refunded Bond Escrow Agent - - - - Operating Transfers in 1,683,965 300,000 216,000 2,199,965 Operating Transfers out (882,471) (785,000) (758,965) (2,426,436) Total Other financing Sources (Uses) 801,494 (485,000) 1,320,035 1,636,529
Net Change in Fund Balances (214,093) (428,750) 1,705,837 1,062,994 Fund Balances at Beginning of Year 5,176,590 1,509,470 4,431,241 11,117,301 Fund Balances at End of Year 4,962,497$ 1,080,720$ 6,137,078$ 12,180,295$ ____________(1) Extracted from the Town's audited financial statements.
23
Nonmajor TotalGovernmental Governmental
General Stabilization Funds Funds
REVENUESReal Estate and Peersonal Property Taxes Net of Tax Refunds 26,026,975$ -$ -$ 26,026,975$ Motor Vehicle and Other Excise Taxes 1,948,902 - - 1,948,902 Penalties and Interest on Taxes 134,794 - - 134,794 Intergovernmental 16,378,615 - 2,664,307 19,042,922 Charges for Services - - 2,242,087 2,242,087 Charges for Services - Sewer - - 585,507 585,507 Investment Income 558,084 54,050 115,590 727,724 Contributiions and Donations - - 244,101 244,101 Departmental 1,625,894 - 529,188 2,155,082 Total Revenues 46,673,264 54,050 6,380,780 53,108,094
EXPENDITURESCurrent:
General Government 2,457,226 - 782,271 3,239,497 Public Safety 4,227,450 - 145,620 4,373,070 Education 21,791,971 - 3,209,713 25,001,684 Public Works 1,995,089 - 2,155,195 4,150,284 Sewer - - 576,013 576,013 Human Services 250,274 - 158,910 409,184 Culture and Recreation 662,840 - 119,531 782,371 Employee Benefits 10,092,339 - 23,600 10,115,939
State and County Assessments 669,369 - - 669,369 Debt Service
Principal 2,789,183 - - 2,789,183 Interest 2,121,250 - - 2,121,250 Total Expenditures 47,056,991 - 7,170,853 54,227,844
Excess (Deficiency) of Revenues over Expenditures (383,727) 54,050 (790,073) (1,119,750)
Other Financing Sources UsesOperating Transfers In 1,949,034 499,172 306,100 2,754,306 Operating Transfers out (1,041,535) (1,000,000) (864,034) (2,905,569) Total Other financing Sources (Uses) 907,499 (500,828) (557,934) (151,263)
Net Change in Fund Balances 523,772 (446,778) (1,348,007) (1,271,013) Fund Balances at Beginning of Year 4,652,818 1,956,248 5,779,248 12,388,314 Fund Balances at End of Year 5,176,590$ 1,509,470$ 4,431,241$ 11,117,301$ ____________(1) Extracted from the Town's audited financial statements.
TOWN OF BELLINGHAM, MASSACHUSETTSSTATEMENT OF REVENUES, EXPENDITURES, AND CHANGES IN FUND BALANCES
FISCAL YEAR ENDED JUNE 30, 2007 (1)

24
Nonmajor TotalGovernmental Governmental
General Stabilization Funds Funds
REVENUESReal Estate and Peersonal Property Taxes Net of Tax Refunds 24,558,779$ -$ -$ 24,558,779$ Motor Vehicle and Other Excise Taxes 1,987,634 - - 1,987,634 Penalties and Interest on Taxes 174,661 - - 174,661 Intergovernmental 15,295,673 - 2,297,646 17,593,319 Charges for Services - - 2,307,595 2,307,595 Charges for Services - Sewer - - 573,195 573,195 Investment Income 480,533 70,233 58,481 609,247 Contributiions and Donations - - 363,202 363,202 Departmental 1,249,003 - 239,586 1,488,589 Total Revenues 43,746,283 70,233 5,839,705 49,656,221
EXPENDITURESCurrent:
General Government 2,306,456 - 1,877,408 4,183,864 Public Safety 4,366,498 - 91,982 4,458,480 Education 20,797,308 - 3,449,063 24,246,371 Public Works 1,936,894 - 1,111,606 3,048,500 Sewer - - 853,852 853,852 Human Services 241,216 - 110,696 351,912 Culture and Recreation 552,427 - 72,883 625,310 Employee Benefits 8,031,316 - - 8,031,316
State and County Assessments 644,627 - - 644,627 Debt Service -
Principal 2,739,298 - - 2,739,298 Interest 2,265,375 - - 2,265,375 Total Expenditures 43,881,415 - 7,567,490 51,448,905
Excess (Deficiency) of Revenues over Expenditures (135,132) 70,233 (1,727,785) (1,792,684)
Other Financing Sources UsesProceeds from Bonds and Notes - - 300,000 300,000 Operating Transfers In 250,117 125,000 410,461 785,578 Operating Transfers out (855,041) (75,000) (90,117) (1,020,158) Total Other financing Sources (Uses) (604,924) 50,000 620,344 65,420
Net Change in Fund Balances (740,056) 120,233 (1,107,441) (1,727,264) Fund Balances at Beginning of Year 5,392,874 1,836,015 6,886,689 14,115,578 Fund Balances at End of Year 4,652,818$ 1,956,248$ 5,779,248$ 12,388,914$ ____________(1) Extracted from the Town's audited financial statements.
TOWN OF BELLINGHAM, MASSACHUSETTSSTATEMENT OF REVENUES, EXPENDITURES, AND CHANGES IN FUND BALANCES
FISCAL YEAR ENDED JUNE 30, 2006 (1)

25
Nonmajor TotalGovernmental Governmental
General Stabilization Funds Funds
REVENUESReal Estate and Peersonal Property Taxes Net of Tax Refunds 23,461,530$ -$ -$ 23,461,530$ Motor Vehicle and Other Excise Taxes 2,019,624 - - 2,019,624 Penalties and Interest on Taxes 127,987 - - 127,987 Intergovernmental 14,582,531 - 2,475,139 17,057,670 Charges for Services - - 2,588,993 2,588,993 Charges for Services - Sewer - - 543,715 543,715 Investment Income 217,496 45,092 31,730 294,318 Contributiions and Donations - - 343,793 343,793 Departmental 1,852,324 - 332,278 2,184,602 Total Revenues 42,261,492 45,092 6,315,648 48,622,232
EXPENDITURESCurrent:
General Government 2,564,529 - 2,342,788 4,907,317 Public Safety 4,171,880 - 176,800 4,348,680 Education 20,003,031 - 3,251,978 23,255,009 Public Works 2,225,136 - 602,143 2,827,279 Sewer - - 505,164 505,164 Human Services 238,103 - 146,383 384,486 Culture and Recreation 539,319 - 77,351 616,670 Employee Benefits 7,345,605 - - 7,345,605
State and County Assessments 573,829 - - 573,829 Debt Service -
Principal 2,609,953 - - 2,609,953 Interest 2,238,764 - - 2,238,764 Total Expenditures 42,510,149 - 7,102,607 49,612,756
Excess (Deficiency) of Revenues over Expenditures (248,657) 45,092 (786,959) (990,524)
Other Financing Sources Uses - - Proceeds from Bonds and Notes 2,438,000 2,438,000 Operating Transfers In 1,255,276 350,000 478,136 2,083,412 Operating Transfers out (1,247,511) (600,000) (570,276) (2,417,787) Total Other financing Sources (Uses) 7,765 (250,000) 2,345,860 2,103,625
Net Change in Fund Balances (240,862) (204,908) 1,558,903 1,113,133 Fund Balances at Beginning of Year 5,633,766 2,040,923 5,327,786 13,002,475 Fund Balances at End of Year 5,392,874$ 1,836,015$ 6,886,689$ 14,115,578$ ____________(1) Extracted from the Town's audited financial statements.
TOWN OF BELLINGHAM, MASSACHUSETTSSTATEMENT OF REVENUES, EXPENDITURES, AND CHANGES IN FUND BALANCES
FISCAL YEAR ENDED JUNE 30, 2005 (1)
26
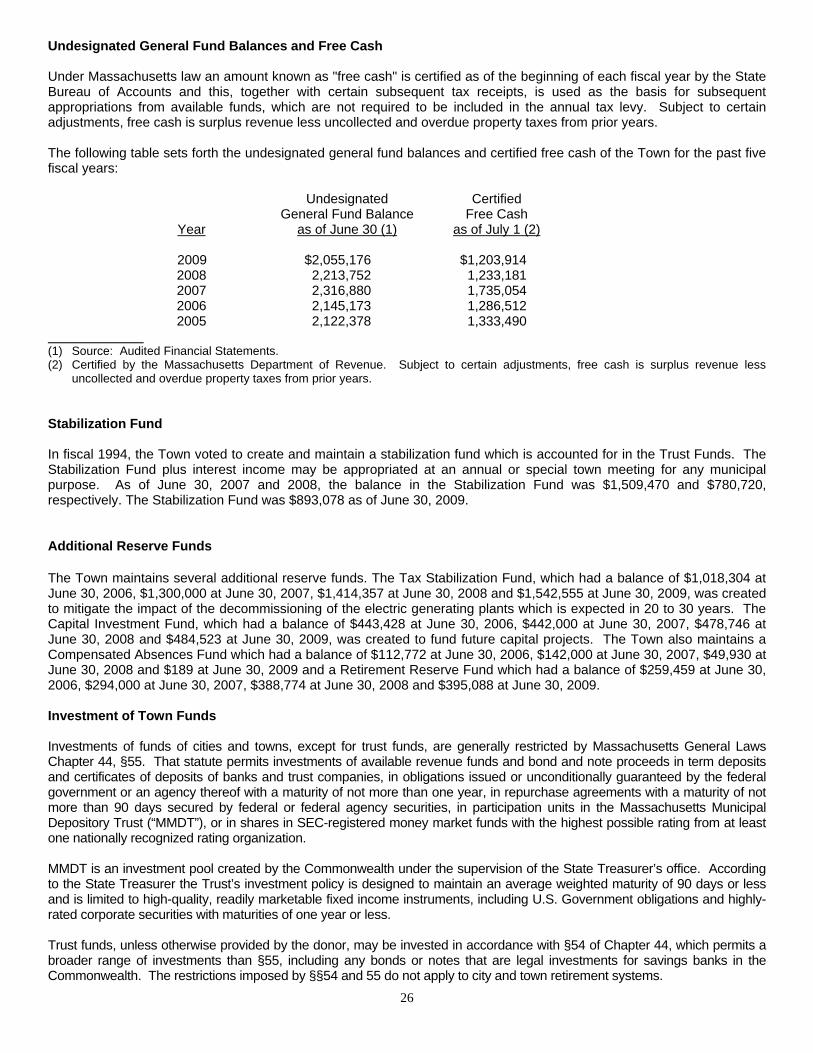
Undesignated General Fund Balances and Free Cash Under Massachusetts law an amount known as "free cash" is certified as of the beginning of each fiscal year by the State Bureau of Accounts and this, together with certain subsequent tax receipts, is used as the basis for subsequent appropriations from available funds, which are not required to be included in the annual tax levy. Subject to certain adjustments, free cash is surplus revenue less uncollected and overdue property taxes from prior years. The following table sets forth the undesignated general fund balances and certified free cash of the Town for the past five fiscal years: Undesignated Certified General Fund Balance Free Cash Year as of June 30 (1) as of July 1 (2) 2009 $2,055,176 $1,203,914 2008 2,213,752 1,233,181 2007 2,316,880 1,735,054 2006 2,145,173 1,286,512 2005 2,122,378 1,333,490 (1) Source: Audited Financial Statements. (2) Certified by the Massachusetts Department of Revenue. Subject to certain adjustments, free cash is surplus revenue less
uncollected and overdue property taxes from prior years. Stabilization Fund In fiscal 1994, the Town voted to create and maintain a stabilization fund which is accounted for in the Trust Funds. The Stabilization Fund plus interest income may be appropriated at an annual or special town meeting for any municipal purpose. As of June 30, 2007 and 2008, the balance in the Stabilization Fund was $1,509,470 and $780,720, respectively. The Stabilization Fund was $893,078 as of June 30, 2009. Additional Reserve Funds The Town maintains several additional reserve funds. The Tax Stabilization Fund, which had a balance of $1,018,304 at June 30, 2006, $1,300,000 at June 30, 2007, $1,414,357 at June 30, 2008 and $1,542,555 at June 30, 2009, was created to mitigate the impact of the decommissioning of the electric generating plants which is expected in 20 to 30 years. The Capital Investment Fund, which had a balance of $443,428 at June 30, 2006, $442,000 at June 30, 2007, $478,746 at June 30, 2008 and $484,523 at June 30, 2009, was created to fund future capital projects. The Town also maintains a Compensated Absences Fund which had a balance of $112,772 at June 30, 2006, $142,000 at June 30, 2007, $49,930 at June 30, 2008 and $189 at June 30, 2009 and a Retirement Reserve Fund which had a balance of $259,459 at June 30, 2006, $294,000 at June 30, 2007, $388,774 at June 30, 2008 and $395,088 at June 30, 2009. Investment of Town Funds Investments of funds of cities and towns, except for trust funds, are generally restricted by Massachusetts General Laws Chapter 44, §55. That statute permits investments of available revenue funds and bond and note proceeds in term deposits and certificates of deposits of banks and trust companies, in obligations issued or unconditionally guaranteed by the federal government or an agency thereof with a maturity of not more than one year, in repurchase agreements with a maturity of not more than 90 days secured by federal or federal agency securities, in participation units in the Massachusetts Municipal Depository Trust (“MMDT”), or in shares in SEC-registered money market funds with the highest possible rating from at least one nationally recognized rating organization. MMDT is an investment pool created by the Commonwealth under the supervision of the State Treasurer’s office. According to the State Treasurer the Trust’s investment policy is designed to maintain an average weighted maturity of 90 days or less and is limited to high-quality, readily marketable fixed income instruments, including U.S. Government obligations and highly-rated corporate securities with maturities of one year or less. Trust funds, unless otherwise provided by the donor, may be invested in accordance with §54 of Chapter 44, which permits a broader range of investments than §55, including any bonds or notes that are legal investments for savings banks in the Commonwealth. The restrictions imposed by §§54 and 55 do not apply to city and town retirement systems.

27
The Town has a written investment policy that has been presented to and adopted by the Board of Selectmen at a public meeting. Tax Increment Financing for Development Districts Under recent legislation, cities and towns are authorized to establish development districts to encourage increased residential, industrial and commercial activity. All or a portion of the taxes on growth in assessed value in such districts may be pledged and used solely to finance economic development projects pursuant to the city or town’s development program for the district. This includes pledging such “tax increments” for the payment of bonds issued to finance such projects. As a result of any such pledge, tax increments raised from new growth properties in development districts are not available for other municipal purposes. Tax increments are taken into account in determining the total taxes assessed for the purpose of calculating the maximum permitted tax levy under Proposition 2 ½ (see “Tax Limitations” under “PROPERTY TAXATION” above.) The Town has established no such district.
28
INDEBTEDNESS Authorization of General Obligation Bonds and Notes Serial bonds and notes are authorized by a two-thirds vote of the town meeting. Provision is made for a referendum on the borrowing authorization if there is a timely filing of a petition bearing the requisite number of signatures. Borrowings for some purposes require State administrative approval. When serial bonds or notes have been authorized, bond anticipation notes may be issued by the officers authorized to issue serial bonds or notes. Revenue anticipation notes and temporary notes in anticipation of authorized federal and state aid generally may be issued by the Treasurer with the approval of the Selectmen. Debt Limits General Obligations. Massachusetts cities and towns are authorized to issue general obligation indebtedness of these types: Serial Bonds and Notes. These are generally required to be payable in equal or diminishing annual principal amounts beginning no later than the end of the next fiscal year commencing after the date of issue and ending within the terms permitted by law. Level debt service is permitted for bonds or notes issued for certain purposes, including self-supporting enterprise purposes, certain state-aided school projects and certain community preservation and open space projects, as well as for those projects for which debt service has been exempted from property tax limitations. The principal amounts of certain economic development bonds supported by tax increment financing may be payable in equal, diminishing or increasing amounts beginning within 5 years after the date of issue. The maximum terms of serial bonds and notes vary from one year to 40 years, depending on the purpose of the issue. Most of the purposes are capital projects. Bonds or notes may be made callable and redeemed prior to their maturity, and a redemption premium may be paid. Refunding bonds or notes may be issued subject to the maximum term measured from the date of the original bonds or notes. Serial bonds may be issued as “qualified bonds” with the approval of the state Municipal Finance Oversight Board composed of the State Treasurer, the State Auditor, the Attorney General and the Director of Accounts, subject to such conditions and limitations (including restrictions on future indebtedness) as may be required by the Board. Qualified bonds may mature not less than 10 nor more than 30 years from their dates and are not subject to the amortization requirements described above. The State Treasurer is required to pay the debt service on qualified bonds and thereafter to withhold the amount of the debt service from state aid or other state payments; administrative costs and any loss of interest income to the State are to be assessed upon the city or town. Bond Anticipation Notes. These generally must mature within two years of their original dates of issuance but may be refunded from time to time for a period not to exceed five years from their original dates of issuance, provided that for each year that the notes are refunded beyond the second year they must be paid in part from revenue funds in an amount at least equal to the minimum annual payment that would have been required if the bonds had been issued at the end of the second year. For certain school projects, however, notes may be refunded from time to time for a period not to exceed seven years without having to pay any portion of the principal of the notes from revenue funds. The maximum term of bonds issued to refund bond anticipation notes is measured (except for certain school projects) from the date of the original issue of the notes. Revenue Anticipation Notes. These are issued to meet current expenses in anticipation of taxes and other revenues. They must mature within one year but, if payable in less than one year, may be refunded from time to time up to one year from the original date of issue. Grant Anticipation Notes. These are issued for temporary financing in anticipation of federal grants and state and county reimbursements. Generally, they must mature within two years but may be refunded from time to time as long as the municipality remains entitled to the grant or reimbursement. Revenue Bonds. Cities and towns may issue revenue bonds for solid waste disposal facilities, for projects financed under the Commonwealth’s Water Pollution Abatement or Drinking Water Revolving Loan Programs and for certain economic development projects supported by tax increment financing. In addition, cities and towns having electric departments may issue electric revenue bonds, and notes in anticipation of such bonds, subject to the approval of the State Department of Telecommunications and Energy. This article is not intended to summarize laws relating to revenue bonds or to notes issued in anticipation of them. Industrial revenue bonds are also outside the scope of this article. The Town of Bellingham has not borrowed against current revenue since fiscal 1994 and does not anticipate the need to do so in fiscal 2010.

29
DIRECT DEBT SUMMARY (1) AS OF JUNE 30, 2009
Long Term Indebtedness (2)
Within the General Debt Limit:Schools 352,600$ Sewers & Drains 1,244,205 Other Building 1,515,000 Street Sidewalks & Parking 1,125,000 Departmental Equipment 585,000 Land Acquisition 1,270,000
Total Within the General Debt Limit 6,091,805$
Outside the General Debt Limit:Sewers 1,513,400$ Schools 30,535,000 Water 3,832,659 Other 760,662
Total Outside the General Debt Limit 36,641,721$
Short Term IndebtednessBond Anticipation Notes Outstanding -$
Total Current Indebtedness 42,733,526$
(1) Principal amount only. Excludes lease and installment purchase obligations, overlapping debt and unfunded pension liability. (2) Based on the Town's equalized valuation of $2,594,856,000 effective January 1, 2008, its normal general debt limit is
$129,742,800 and its double general debt limit is $259,485,600. (See "Debt Limits," above.) Key Debt Ratios
2009 2008 2007 2006 2005
Amount (1) 42,733,526$ 46,078,379$ 45,185,612$ 48,379,667$ 51,230,565$ Per Capita (2) 2,790.49$ 3,008.91$ 2,950.61$ 3,065.11$ 3,245.73$ Percent of Assessed Valuation (3) 1.78% 1.91% 1.78% 2.15% 2.51%Percent of Equalized Valuation (4) 1.65% 1.84% 1.80% 2.36% 2.50%Per Capita as a Percent of Personal Income Per Capita 11.14% 12.01% 11.78% 12.24% 12.96%
As of June 30
(1) Excludes temporary loans, lease purchase obligations, overlapping debt and unfunded pension liability. (2) Source: U.S. Department of Commerce, Bureau of the Census - Latest applicable actuals or estimates. (3) Source: Board of Assessors - Assessed valuation as of the prior January 1. (4) Source: Massachusetts Department of Revenue. (Equalized valuation in effect for that fiscal year.)

30
Annual Debt Service as of June 30, 2009 (1)
Less Less CumulativeFiscal Outstanding(2) State School MWPAT Net % PrincipalYear Principal Interest Construction Aid Subsidies Debt Service Retired
2010 3,677,935$ 1,969,609$ (2,430,318)$ (36,112)$ 3,181,114$ 11.9 %2011 3,734,118 1,814,707 (2,430,318) (33,486) 3,085,021 23.52012 3,594,630 1,648,066 (2,430,318) (10,750) 2,801,628 33.92013 3,284,334 1,496,656 (2,430,318) (9,680) 2,340,992 42.72014 3,269,582 1,351,667 (2,430,318) (8,591) 2,182,340 50.92015 3,315,582 1,200,847 (2,430,318) (7,484) 2,078,628 58.72016 2,940,393 1,046,440 (2,430,318) (6,407) 1,550,107 64.52017 3,050,393 906,808 (2,430,318) (5,335) 1,521,547 70.22018 3,135,393 760,137 (2,430,318) (4,237) 1,460,975 75.62019 3,255,393 607,190 (2,430,318) (3,140) 1,429,125 81.02020 3,395,393 448,366 (2,430,318) (2,056) 1,411,385 86.32021 3,529,972 282,770 (2,430,318) (1,270) 1,381,154 91.42022 1,220,204 109,735 (516,059) (765) 813,115 94.52023 325,204 52,125 - (255) 377,074 95.92024 315,000 39,450 - - 354,450 97.22025 315,000 26,960 - - 341,960 98.52026 175,000 14,400 - - 189,400 99.22027 100,000 8,000 - - 108,000 99.62028 100,000 4,000 - - 104,000 100.0
Total 42,733,526$ 13,787,932$ (29,679,875)$ (129,567)$ 26,712,017$
(1) Excludes the refunding bonds, short-term debt, lease and installment purchase obligations, overlapping debt and unfunded
pension liability. (2) As of June 30, 2009, principal totaling $2,655,403 and interest totaling $261,463 are exempt from the provisions of Proposition 2
1/2. Authorized Unissued Debt and Prospective Financing The Town has $520,750 of authorized unissued debt, as follows:
DatePurpose Authorized Amount
Remediated Sewers 05/14/95 50,000$ Water Mains 10/12/05 270,000 Remediated Sewers 05/23/07 200,000 Keough Roof Replace 10/10/07 750 Total 520,750$
31
Overlapping Debt (1) The following are the principal entities whose indebtedness is chargeable to or payable from taxation of property within the Town of Bellingham: Outstanding Bellingham’s 2009 Total Bonded Debt Assessment and Estimated Share as of 6/30/09 $ % Norfolk County (2) $1,000,000 $102,239 2.08% Blackstone Valley Regional Vocational-Technical School District (3) $6,490,000 761,236 4.90% (1) Dollar assessment based upon total net operating expenses, inclusive of debt service where applicable. (2) Source: County Treasurer’s Office. Debt is as of 6/30/09. County expenses including debt service on county bonds are assessed
upon the cities and towns within the county in proportion to their taxable valuation as last equalized by the State Commissioner of Revenue. Legislation enacted in 1997 abolished the county governments of Franklin and Middlesex Counties as of July 1, 1997, with their assets, functions, debts and other obligations being assumed by the Commonwealth. The abolishment of the Middlesex County government was in part in response to a default by the county in the payment of general obligation notes of the county. The legislation also abolished the county governments of Hampden and Worcester Counties as of July 1, 1998. Legislation enacted in 1998 abolished the county governments of Hampshire, Essex and Berkshire Counties as of January 1, 1999, July 1, 1999 and July 1, 2000, respectively. The legislation requires the state secretary for administration and finance to establish a plan to recover the Commonwealth's expenditures for the liabilities and other debts assumed and paid by the Commonwealth on behalf of an abolished county. Unless these provisions are changed by further legislation, the state treasurer shall assess upon each city and town within the jurisdiction of an abolished county an amount not exceeding or equal to the county tax paid by each such city and town for the fiscal year immediately prior to the abolishment of the county until such expenditures by the Commonwealth are recovered. It is possible that similar legislation will be sought to provide for the abolishment of county government in all the remaining counties.
(3) Source: District Treasurer's Office. The operating expenses of regional school districts, including debt service when applicable, are apportioned among the member municipalities in accordance with the agreements establishing the districts, subject to the provisions of the Education Reform Act of 1993. The outstanding bonded debt of the District consists of two bond issues for which the Town is assessed at different rates, as shown above. The District has authorized $36,000,000 Bonds for adding to and equipping the District High School.
Contractual Obligations Obligations to make payments on account of municipal contracts are generally limited to currently available appropriations. A Massachusetts city or town has general statutory authority to enter into contracts for the exercise of any of its corporate powers for any period of time deemed to serve its best interests, but generally only when funds are available for the first fiscal year; obligations for succeeding fiscal years generally will be expressly subject to availability and appropriations of funds. Specific authority exists in relatively few cases for long-term contractual obligations that are not subject to annual appropriations, including contracts for refuse disposal (20 year maximum term). Municipalities may also enter into long-term contracts in aid of housing and renewal projects. There is implied authority to make other long-term contracts required to carry out authorized municipal functions, such as contracts to purchase water from private water companies. Pursuant to the Home Rule Amendment to the Massachusetts Constitution, cities and towns may also be empowered to make other contracts and leases. The Town presently has the following material contracts in effect: Estimated Contract Annual Cost Company Name Nature of Service Expires Fiscal 2010 B.F.I. Solid Waste Transfer 2015 $730,000 Semass Solid Waste Disposal 2010 695,000 Charles River Pollution Control District Wastewater Treatment 2018 236,650 Woonsocket Wastewater Wastewater Treatment 2018 198,715

32
RETIREMENT SYSTEM The Massachusetts General Laws provide for the establishment of contributory retirement systems for state employees, for teachers and for county, city and town employees other than teachers. Teachers are assigned to a separate statewide teachers’ system and not to the city and town systems. For all employees other than teachers, this law is subject to acceptance in each city and town. Substantially all employees of an accepting city or town are covered. If a town has a population of less than 10,000 when it accepts the statute, its non-teacher employees participate through the county system and its share of the county cost is proportionate to the aggregate annual rate of regular compensation of its covered employees. In addition to the contributory systems, cities and towns provide non-contributory pensions to a limited number of employees, primarily persons who entered service prior to July 1, 1937 and their dependents. The Public Employee Retirement Administration Commission (“PERAC”) provides oversight and guidance for and regulates all state and local retirement systems. The obligations of a city or town, whether direct or through a county system, are contractual legal obligations and are required to be included in the annual tax levy. If a city or town, or the county system of which it is a member, has not established a retirement system funding schedule as described below, the city or town is required to provide for the payment of the portion of its current pension obligations which is not otherwise covered by employee contributions and investment income. “Excess earnings,” or earnings on individual employees’ retirement accounts in excess of a predetermined rate, are required to be set aside in a pension reserve fund for future, not current, pension liabilities. Cities and towns may voluntarily appropriate to their system’s pension reserve fund in any given year up to five percent of the preceding year’s tax levy. The aggregate amount in the fund may not exceed ten percent of the equalized valuation of the city or town. If a city or town, or each member city and town of a county retirement system, has accepted the applicable law, it is required to annually appropriate an amount sufficient to pay not only its current pension obligations, but also a portion of its future pension liability. The portion of each such annual payment allocable to future pension obligations is required to be deposited in the pension reserve fund. The amount of the annual city or town appropriation for each such system is prescribed by a retirement system funding schedule which is periodically reviewed and approved by PERAC. Each system’s retirement funding schedule is designed to reduce the unfunded actuarial pension liability of the system to zero by not later than June 30, 2028, with annual increases in the scheduled payment amounts of not more than 4.5 percent. City, town and county systems which have an approved retirement funding schedule receive annual pension funding grants from the Commonwealth for the first 16 years of such funding schedule. Under legislation enacted in 2003, cities and towns that accepted its provisions and that obtained certain state approvals therefor could, within limits, reduce the amount of their scheduled appropriations for fiscal year 2004 and fiscal year 2005 for the unfunded portion of their pension liability to offset recent reductions in state aid. Cities and towns that reduced such appropriations were required to revise their retirement system funding schedule for eliminating their unfunded pension liability and could extend such schedule by one year, provided that in no event could such funding schedule extend beyond June 30, 2028. City, town and county systems may choose to participate in the Pension Reserves Investment Trust Fund (the “PRIT Fund”), which receives additional state funds to offset future pension costs of participating state and local systems. If a local system participates in the PRIT Fund, it must transfer ownership and control of all assets of its system to the Pension Reserves Investment Management Board, which manages the investment and reinvestment of the PRIT Fund. Cities and towns with systems participating in the PRIT Fund continue to be obligated to fund their pension obligations in the manner described above. The additional state appropriations to offset future pension liabilities of state and local systems participating in the PRIT Fund are required to total at least 1.3 percent of state payroll. Such additional state appropriations are deposited in the PRIT Fund and shared by all participating systems in proportion to their interests in the assets of the PRIT Fund as of July 1 for each fiscal year. Cost-of-living increases for each local retirement system may be granted and funded only by the local system, and only if it has established a funding schedule. Those statutory provisions are subject to acceptance by the local retirement board and approval by the local legislative body, which acceptance may not be revoked.

33
The following table sets forth the annual contributions of the Town to the retirement system for the last five fiscal years, as well as an estimate for the current fiscal year: Fiscal Year Contributory 2010 $1,664,852 (budget) 2009 1,594,595 2008 1,379,759 2007 1,365,000 2006 1,233,359 2005 1,041,020 Source: Chief Financial Officer. Under recent legislation, cost-of-living adjustments (COLA) for each local retirement system would be granted and funded only by the local system and only if it has established a funding schedule. Those statutory provisions are subject to acceptance by the local retirement board and approval by the local legislative body, which acceptance may not be revoked. The Norfolk County Retirement System has voted to accept this legislation. Other Post-Employment Benefits In addition to pension benefits, cities and towns may provide retired employees with health care and life insurance benefits. The portion of the cost of such benefits paid by cities or towns is generally provided on a pay-as-you-go basis. The Governmental Accounting Standards Board (“GASB”) recently promulgated its Statement Nos. 43 and 45, which will for the first time require public sector entities to report the future costs of these non-pension, post-employment benefits in their financial statements. These new accounting standards do not require pre-funding such benefits, but the basis applied by the standards for measurement of costs and liabilities for these benefits is conservative if they continue to be funded on a pay-as-you-go basis and will result in larger yearly cost and liability accruals than if such benefits were pre-funded in a trust fund in the same manner as traditional pension benefits. Although cities and towns that choose to self-insure all or a portion of the cost of the health care benefits they provide to employees and retirees may establish a trust fund for the purpose of paying claims, Massachusetts General Laws do not currently provide cities and towns with general legal authority to establish a trust fund for the purpose of pre-funding this liability in the same manner as traditional pension benefits. The Town was required to implement the new GASB reporting requirements for other post-employment benefits beginning in fiscal year 2008. The Town performed an actuarial valuation of its non-pension, post-employment benefit liability. As of July 1, 2008, the actuarial liability for benefits was $28,881,000. The Town’s annual required contribution is $2,956,183 and the Town’s fiscal year 2009 net pay-as you-go cost was $4,408,887. The Town is currently exploring adopting legislation that would allow the creation of an irrevocable trust fund for OPEB benefits. The Town currently has $478,904 in a Retirement Reserve Trust that could be transferred to the OPEB Trust Fund to being funding.

34
COLLECTIVE BARGAINING
City and town employees (other than managerial and confidential employees) are entitled to join unions and to bargain collectively on questions of wages, hours and other terms and conditions of employment. Provisions for compulsory arbitration for labor disputes involving firefighters and police officers were repealed by the Proposition 2 1/2 legislation. The Town employs approximately 778 persons on a full or part-time basis, including those in the School Department. Approximately 57 percent belong to unions or other collective bargaining groups as shown below: Number of Contract Employee Category Represented by Employees Expires (1) Firefighters International Association of Firefighters (Local 2071) 20 6/30/11 Public Works AFSCME Council 93, Local 747 19 6/30/11 Town Hall AFSCME Council 93, Local 747 30 6/30/11 Police Officers Bellingham Police Federation 27 6/30/11 Town Department Heads Bellingham Professional Association 11 6/30/11 School Department: Teachers Bellingham Teachers' Association 223 6/30/11 Nurses Bellingham Teachers’ Association 6 6/30/11 Clerks, Custodians, Cafeteria AFSCME, Local 747 62 6/30/09 Teachers Aides AFSCME, Local 747 42 6/30/09 Total 440 (1) Expired contracts are in negotiation.
LITIGATION
There are various suits pending in courts within the State in which the Town is a defendant. In the opinion of Town Management, no litigation is pending, or to its knowledge, threatened, which is likely to result, either individually or in the aggregate, in final judgments against the Town materially affecting its financial position.
_________________________
TOWN OF BELLINGHAM, MASSACHUSETTS /s/ Marilyn Mathieu, Chief Financial Officer March 26, 2010