annual report - previ · in the year in which it celebrated 15 years, previ futuro reached a total...
TRANSCRIPT

Annual Report
Contents
2013 highlights 3
Message from the Board of Directors 6
PREVI 8
Benefit plans 11
Strategy and investments 22
Accounting Statements December 2013 40
2013 Highlights
Annual Report PREVI 2013 3
now adjusted in the same month, answering a long-standing request from beneficiaries of Plan 1.
End of BET and return of contributions from Plan 1In 2013, with a challenging economic scenario, there was a reduction in the accumulated surplus of Plan 1. The result calculated on December 31st 2013 indicated that the resources assigned to payment of the Temporary Special Benefits (BET) and contributions would need to be used to help recover the Plan Contingency Reserve to the level of 25% of the Mathematical Reserve, as determined by Resolution CGPC 26/2008. Therefore, BET payment was closed, and contribution charging was resumed starting on January 2014.
BET was a special, temporary benefit paid to Plan 1 participants. Retirees and pensioners of the Plan received a special benefit, equivalent to 20% of the amount of their benefit. For active participants, the 20% were credited to individual checking accounts, as per Plan regulations. Contributions had
The year of 2013 was marked by challenges in the Brazilian complementary social security market. Macroeconomic changes, such as the raise in the base interest rate (Selic) and the drop in profitability of operations at the Stock Exchange, had significant influence in the performance of all institutions in this area. PREVI performs active management of its investments - paying attention to the market situation, working with various long term scenarios and seeking to predict trends. This enabled the Entity, even in a hard year, to minimize negative impact, always keeping in mind the need to maintain solid assets, capable of ensuring homogeneous payment of current and future benefits to participants.
Below we recount the main events for the year.
15 years of PREVI FuturoPREVI Futuro celebrated 15 years of existence. Going through a phase of growth and accumulation, the Plan already has 80,455 participants, of which 673 are retirees and pensioners, while managing a portfolio of R$ 4.5 billion in assets, a volume that positions it among the six biggest variable contribution (VC) plans in the country. In the last ten years, the accumulated affiliation rate of PREVI Futuro went from approximately 78% in 2004 to more than 94% in 2013.
New regulation for Plan 1The regulation for Benefit Plan 1 was modified in 2013. Among the main changes, one highlight is the change in the retirement complement adjustment date to the month of January. With this measure, the INSS and PREVI benefits are
80,455The number of participants of PREVI Futuro. The plan celebrated 15 years of existence in 2013
PREVI performs active management of its investments. This enabled the Entity to minimize negative impact in 2013, ensuring payment of current and future benefits to participants
Annual Report PREVI 2013 2013 Highlights 4
other agents of the capital market, driving lasting and sustainable businesses.
Citizen CompanyPREVI was recognized by the Regional Accounting Council of the State of Rio de Janeiro (CRC-RJ) for its efforts in publicizing accounting and social and environmental information. The Council granted the Citizen Company 2013 certificate, which validates the quality of information in the reports of organizations of all sizes and industries in national territory.
Launch of the new PREVI portalIn December, PREVI launched its new site, with layout and features that simplify browsing. At the portal, users can find out what’s new about the Institution and receive information about the plans, while learning about social security, performing operations and getting in touch through the Speak with Us section. Participants from Plan 1 and PREVI Future have pages with highlights including specific information for each plan. The query system has changed and enables locating news through various filters. It is also possible to send the stories by email or liking them on Facebook. This is another action aimed at forging a close relationship with participants, a strategic goal for PREVI.
been suspended since 2007, after a reduction of 40% that occurred in 2006.
Since 2006, R$ 20 billion was forwarded to participants in the form of extra benefits. Plan 1 still has a surplus and presents no risks regarding its balance and solidity, providing peace of mind to its participants.
Investment highlightsStructured investments achieved excellent profitability: 30.91% (PREVI Futuro) and 20.60% (Plan 1). These investments are basically formed by private equity funds, which invest in emerging companies with a potential for growth and rising value. In Plan 1, the segment accounts for 0.56% of the total investments, and in PREVI Futuro, 1.56%.
In recent years, the PREVI strategy for investment in real estate has been assertive, with significant profitability. In 2013, the segment achieved a yield of 17.51% in Plan 1 and 12.49% in PREVI Futuro. The portfolio achieved a growth of approximately R$ 530 million. This result consolidates it as the biggest portfolio of real estate assets in the Brazilian complementary social security sector.
PREVI Corporate Governance MeetingMore than 400 people participated in the 14th edition of the PREVI Corporate Governance Meeting, held in August. The agenda for the event, “Innovation and competitiveness”, was discussed by administrators and executives of some of the main Brazilian companies. With such large events, PREVI seeks to encourage best practices in the companies in which it holds participation and in
Launched in December 2013, PREVI’s new website presents what’s new about the Institution, information about the plans and various contents about social security
Annual Report PREVI 2013 2013 Highlights 5

Message from the Board of Directors
Annual Report PREVI 2013 6
In the year in which it celebrated 15 years, PREVI Futuro reached a total of 80,455 participants, and the participation rate in the Plan is currently over 94%. The total assets for PREVI Futuro at the end of 2013 was R$ 4.5 billion.
Many other key achievements were reached in 2013, with a highlight to the exponential growth of the real estate portfolio, which is getting close to R$ 10 billion invested, and to the profitability of structured investments, a segment that achie-ved the best performance among portfolios from both benefit plans last year. The two areas are set to keep growing in the portfolios of Plan 1 and PREVI Futuro, conside-ring recent returns on these kinds of investments and the continuous search for the biggest diversification possible in plan resource allocation.
In addition to all the achievements of the past year, it is important to mention our ongoing search for innovation in PREVI adminis-tration, reviewing processes and implementing projects that promote excellence management, as well as, of course, our concern with impro-ving an investment policy based on controlling risks and predicting economic and social scenarios.
As a way of providing even more transparency to the process of reporting the year of 2013, accoun-ting statements in this annual report now include new tables and more details, enabling better tracking of management activities numbers. Another step forward in information visibility is the provision of an infor-mation panel, with graphs and tables providing detailed data regarding Plan 1 and PREVI Futuro. Most of the information includes a historical series of 10 years, allowing tracking of data behavior over time.
Lastly, we reaffirm our conviction that, even with the difficulties we faced, we are advancing in the right direc-tion, making progress in PREVI’s management in order to fulfill our mission regarding Fund participants.
In 2013, the macroeconomic sce-nario in Brazil and across the world was a negative one for the main economic agents. The Brazilian pension fund industry was severely hit by these adversities, and in this context, the solid investments by PREVI and active management of these resources were key factors to end the year reaching the milestone of R$ 171 billion total assets, R$ 3.5 billion higher than in 2012.
The biggest proof of PREVI solidity is our coverage rate for commit-ments in Plan 1 (Active Assets on Mathematical Provisions), that is to say, the index that measures our capability to fulfill the mission of paying current and future benefits to participants of our most mature plan, which ended the year of 2013 at 1.22. This means Plan 1 has 22% more resources than needed to pay all its estimated future commitments. This situation gives us peace of mind to face the future.
In 2013, the total assets of Plan 1 grew over R$ 2.7 billion and reached the level of R$ 166.3 billion. At the end of the year, we interrupted payment of the Temporary Special Benefit (BET), in compliance with current legislation. It is important to note that, since 2006, approximately R$ 20 billion have been forwarded to associates in the form of extra be-nefits. Some of these benefits were permanently incorporated to Plan 1, such as the reduction of contributions by 40% and incorporation of special compensation and proportionality benefits.
PREVI’s active management and solid investments secure enough resources for paying all its estimated future commitments. We are advancing in the right direction
Annual Report PREVI 2013 Message from the Board of Directors 7
PREVI
In 2014, PREVI celebrates 110 years since its founding, and maintains its position as the biggest pension fund in Latin America. This is a result of management aimed at longevity and consistency in its equity, focused on offering security to its associates
Annual Report PREVI 2013 8

Founded on April 16th, 1904, Social Security Fund for Employees of Banco do Brasil - PREVI, celebrates 110 years in 2014, consolidating its position as the biggest pension fund in Latin America, supported by a culture of active, transparent, integrated and participative manage-ment in Brazil. Its 610 collaborators work at its headquarters, located in Rio de Janeiro, handling the retire-ment plans and savings of almost 200 thousand associates.
Committed towards the mission of ensuring benefits in addition to the Official Social Security for employe-es, former employees and pensio-ners of Banco do Brasil, the Entity closed the year of 2013 with equity at R$ 171 billion. These resources are managed in an efficient and transparent manner, with a focus on the long term. PREVI seeks longe-vity and profitability in investments in order to honor the commitments established with participants.
In management of investments and administration of plans, there is a high level of commitment and responsibility, as the employees
Profile
participate in PREVI and work to su-pport the Institution and retirement benefits. These factors are part of a management that values long term thinking and safeguarding the equity and investments of PREVI.
Approximately 90% of PREVI employees come from Banco do Brasil, its sponsor. Its own staff of collaborators is concentrated in the areas of customer service and secretary duties.
In 2013, the Entity took important measures to raise the skill level among its staff, according to a stra-tegic goal under the responsibility
“Transparency is part of PREVI’s values, and the annual report has always had this role. Receiving the Citizen Company certificate validates our concern as not only part of our institutional speech, but as something integrated in our practices. It is recognition that we are in the right path”.
DAN CONRADO, president of PREVI
110 yearsPREVI, Brazil’s oldest pension fund, was founded on April 1904
Annual Report PREVI 2013 PREVI 9
of the People Management area. Today, its employees are organized in high performance teams, well trained and equipped, with tech-niques and technology to serve PREVI’s mission.
All this is reflected in its market positioning - PREVI is the 33rd biggest pension fund in the world, according to the publication Pension & Investments, considering the base year of 2012. In national territory alone, PREVI holds approxima-tely 25% of assets and 7% of the number of participants in the whole complementary social security system. This equity is the direct result of the size of the commitment towards its participants. The large
VISION FOR THE FUTURETo be the best administrator of benefit plans in Brazil, an international reference with excellence proven by indicators in the areas of:
• asset and liability management practices;• participant satisfaction;• administrative cost (cost x benefit ratio);• social and environmental responsibility;• social security products and services;• personnel policies.
To be a reason for pride among participants, sponsors and employees.
MISSIONAdministrate benefit plans with effective management of contributed resources, seeking the best solutions to ensure social security benefits, in order to contribute towards the quality of life of participants and their dependants, serving their expectations and those of sponsors.
VALUESPREVI conducts its management guided and driven by ethical principles expressed in the following values:
• Responsibility, commitment, social and environmental responsibility;• Solidarity;• Quality, competence, excellence, creativity, professionalism;• Ethics, honesty, integrity;• Transparency;• Citizenship, democracy
amounts managed by PREVI are not an indication of the wealth of the Institution, but rather the resources needed to ensure stability and trust regarding payment of due benefits.
Since 2006, PREVI has been a signing member of the Principles for Responsible Investment (PRI), a global volunteer initiative of institutional investors seeking best practices in social responsi-bility, sustainability and corporate governance. PREVI is part of the PRI Council and represents Latin America in the initiative’s Executive Group, working as an agent to publicize and encourage participa-tion in the program among other institutions in the continent
Annual Report PREVI 2013 PREVI 10

Benefit plans
Plan 1, PREVI Futuro and Capec: find out about how the benefit plans and the Savings Portfolio evolved in 2013. Check out the paid benefit amounts, the number of participants in each plan and the adoption rates for PREVI Futuro and Capec
Annual Report PREVI 2013 11

benefits were paid out to over 91 thousand retirees and pensioners.
Plan 1 statusIn 2013, with a challenging economic scenario, there was a reduction in the accumulated surplus of Plan 1, mainly due to difficulties faced by the capital market. The Stock Exchange ended the year at a drop of 15.50%.
Another factor impacting the Plan 1 accounts was the increase of 8.63% (R$ 9 billion) in the Mathematical Reserve (sum of commitments: benefits granted and to be granted) of the Plan, which is attributed to the increased life expectancy
PREVI works to ensure its participants receive benefits in addition to those of the Official Social Security. In this manner, it contributes to maintain the quality of life of participants and their corresponding dependants.
Benefit Plan 1 is the defined benefit (DB) plan for Banco do Brasil employees hired until 1997. Meanwhile, PREVI Futuro is the variable contribution (VC) plan designed for employees who joined BB and PREVI after December 24th, 1997. The Savings Portfolio (Capec) is a plan for employees of Banco do Brasil and PREVI, with the goal of offering lump-sum survivor benefits and disability income, plus special savings (spouse).
Plan 1
Plan 1 is a social security plan for employees of Banco do Brasil hired until December 1997, and it is closed to new participants. Plan 1 associates, both active and retirees, contribute with a percentage of their wage or complements, and the sponsor provides a counterpart contribution with the same amount.
Plan 1 closed the year with an equity worth R$ 166.25 billion, R$ 114.22 billion in Mathematical Reserves (value planned for coverage of benefits) and total profitability of 7.30%. In 2013, over R$ 9 billion in
Participants
2010 2011 2012 2013
Active 32,449 30,659 28,826 25,849
Retirees 64,361 65,036 65,784 67,630
External active1 916 840 829 800
External retirees2 3,478 3,509 3,522 3,557
Pensioners 18,964 19,285 19,555 19,932
Total 120,168 119,329 118,516 117,768
1 Includes self-sponsored, Deferred Proportional Benefit, minimum pension and participants who still lack an option,2 Includes self-sponsored, Deferred Proportional Benefit and minimum pension,
Paid benefits (R$ )
2010 2011 2012 2013
PREVI1 6,194,828,011.66 9,045,819,173.89 8,423,228,164.55 9,246,889,979.12
INSS2 1,722,281,424.59 1,866,996,751.72 2,006,964,312.63 2,151,202,709.43
Banco do Brasil3 296,251,313.45 297,856,989.95 297,583,241.65 192,374,556.94
Total 8,213,360,749.70 11,210,672,915.56 10,727,775,718.83 11,590,467,245.49
1 PREVI Benefits include PREVI Complement, regular benefits, BET and benefits arising from judicial rulings.2 Includes amounts forwarded by PREVI through payroll under the Prisma Covenant.3 Banco do Brasil is responsible for paying benefits to founding participants of PREVI and for obligations arising from labor lawsuits, among others.
Annual Report PREVI 2013 Benefit plans 12
of special compensation and proportionality benefits. With the suspension of contributions after 2007, active and retiree associates gained nearly R$ 2.9 billion. Meanwhile, BET payments yielded transfers of R$ 6.4 billion, with benefits also accruing to pensioners.
Plan 1 still has a surplus of R$ 24.76 billion and presents no risks regarding its balance and solidity, providing peace of mind to its participants. PREVI is sure that its Investment Policy is in the right path and that 2013 results will be reversed in the future, with the improvement in the value of assets.
of participants, wage adjustments for active employees and actuarial correction of this reserve.
The 2013 results indicated that it was necessary to recover the Contingency Reserve to R$ 28.5 billion, in order to return to the level demanded by Resolution CGPC 26/2008, which determines that the distribution of surplus can only happen with resources exceeding the Contingency Reserve, which should be equivalent to 25% of the Mathematical Reserve. Faced with this scenario, ending BET and resuming charging of contributions could not be delayed. This is why, in January 2014, BET payments were closed, and charging of contributions from participants of Plan 1 and the sponsor was reinitiated.
Since 2006, approximately R$ 20 billion were transferred to Plan 1 participants in the form of additional benefits, thanks to the distribution of accumulated surplus. Some of these benefits were permanently incorporated to the Plan, such as the reduction of contributions by 40% in 2006, and the incorporation
Since 2006, approximately R$ 20 billion were transferred to Plan 1 participants in the form of additional benefi ts, thanks to the distribution of accumulated surplus. Plan 1 still has a surplus of R$ 24,76 billion and presents no risks regarding its balance and solidity, providing peace of mind to its participants.
“We are aware and mindful of the impact on the lives of each participant. But we can’t avoid taking the necessary decisions, for the sake of the fund, of the people who have already retired and those who will retire and receive their benefits in the future. Our commitment is towards the longevity of PREVI.”
DAN CONRADO, president of PREVI
Annual Report PREVI 2013 Benefit plans 13
Temporary Special Benefit (BET)
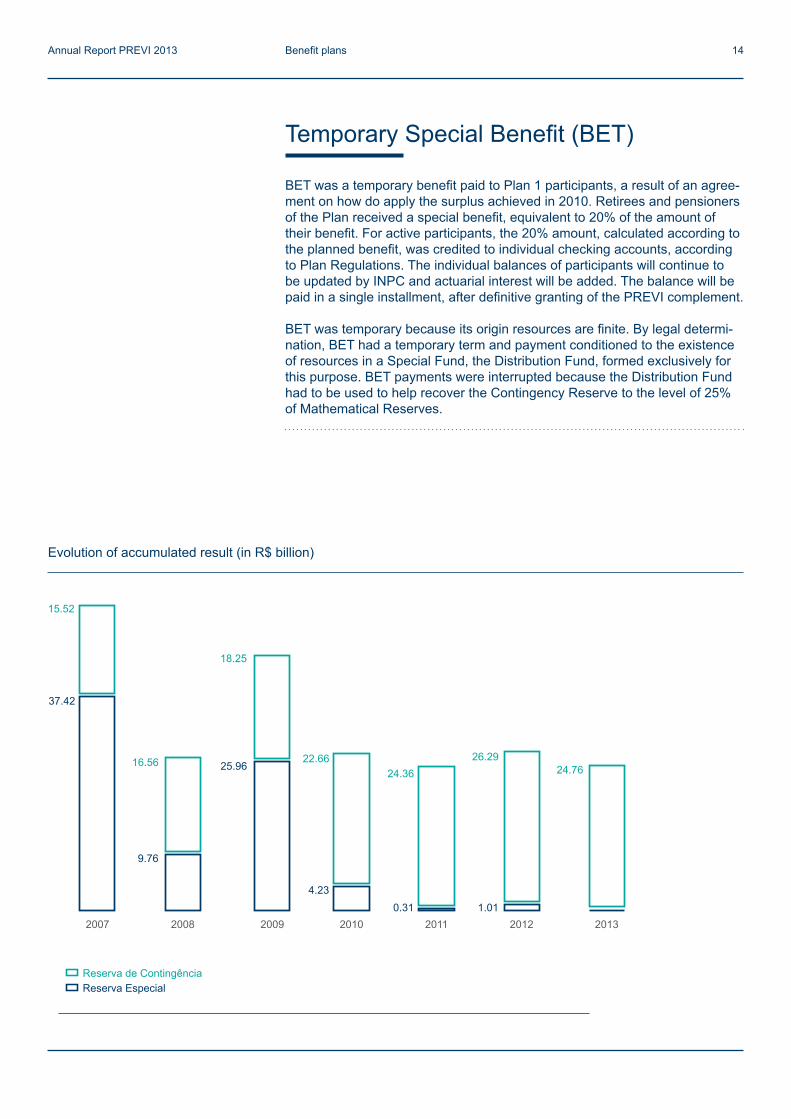
BET was a temporary benefit paid to Plan 1 participants, a result of an agree-ment on how do apply the surplus achieved in 2010. Retirees and pensioners of the Plan received a special benefit, equivalent to 20% of the amount of their benefit. For active participants, the 20% amount, calculated according to the planned benefit, was credited to individual checking accounts, according to Plan Regulations. The individual balances of participants will continue to be updated by INPC and actuarial interest will be added. The balance will be paid in a single installment, after definitive granting of the PREVI complement.
BET was temporary because its origin resources are finite. By legal determi-nation, BET had a temporary term and payment conditioned to the existence of resources in a Special Fund, the Distribution Fund, formed exclusively for this purpose. BET payments were interrupted because the Distribution Fund had to be used to help recover the Contingency Reserve to the level of 25% of Mathematical Reserves.
Evolution of accumulated result (in R$ billion)
Reserva de ContingênciaReserva Especial
2007
15.52
37.42
2008
16.56
9.76
2009
18.25
25.96
2010
22.66
4.23
2011
24.36
0.312012
26.29
1.012013
24.76
Annual Report PREVI 2013 Benefit plans 14

Normative InstructionThe Federal Revenue agency published on April 8th 2013 Normative Instruction (IN) # 1.343, in which it presents tax treatment regarding calculation of Income Tax (IR) for retirement amounts received from complementary social security entities, corresponding to personal contributions made in the period from 1989 to 1995. In practice, the IN offers the possibility of tax compensation, whether in the form of reduction in tax payments or receiving part of the amount of already paid taxes. The IN covers only Plan 1 participants who made personal contributions in this period and received the first benefit payment in 2008. More information are available at the site.
New regulation for Plan 1In 2013, a new regulation was approved for Plan 1. Among the main changes is moving the retirement complement adjustment date to the month of January. In 2013, the amounts retroactive to January were paid in May, with indexation. Regarding retirements and pensions granted until June 30th 2012, the adjustment was 3.819%, corresponding to the variation of the National Consumer Price Index (INPC) accumulated in the period from June to December 2012.
Other important changes were performed in the following articles:
• inclusion of possibility of Temporary Income Benefit for the Optional Part of Benefit Plan 1 (Articles 56 and 58);
• Compliance with PREVIC demands for adjustment of regulation text to the terms of Resolution CGPC # 19, dated September 25th, 2006 (articles 13 and 20);
• retroactive payment of PREVI complement with application of indexation (article 61);
• modification of rule for granting survivor benefit complement to former spouse (article 51);
• changes resulting from Collective Agreement 2012/2013, which plans for the incorporation of semestral bonus (articles 28, 30, 31, 65, 66, 67, 68, 88, 109 and 110);
• establishment of the 20th as the day for payment of benefits, unlinking it from the payroll date of Banco do Brasil, and changing the benefit adjustment month of Benefit Plan 1 (articles 61, 63 and 104);
• editorial adjustments (articles 9, 21, 28, 70, 90, 91, 104 and 110).
One of the main changes on Plan 1 regulation in 2013 was moving the retirement complement adjustment date to the month of January
24.76 biValue (in R$ ) of Plan 1 Contingency Reserve at the end of 2013
Annual Report PREVI 2013 Benefit plans 15
PREVI Futuro
PREVI Futuro closed the year with an equity of R$ 4.56 billion. This amount already positions the Plan among the 25 biggest pension funds and the six biggest variable contribution (VC) plans in the country.
In 2013, the total profitability of PREVI Futuro was 3.66%. In its 15 years of existence, the Plan has accumulated a profitability of 849.25%, while the actuarial goal was 725.68% (period from July 1998 to December 2013). The evolution achieved in a short maturing period demonstrates the growing relevance and potential of PREVI Futuro.
In 2013 PREVI Futuro celebrated 15 years, and the first Plan participants became eligible to request the Monthly Retirement Income benefit, after the waiting period of 180 contributions. The Plan already has 80,455 participants, of which 673 are beneficiaries.
The benefit to be paid to PREVI Futuro participants is based on plan contribution time, contribution levels, and the profitability of investments. The bigger the account balance, the higher the benefit amount can be. Therefore, the sooner a PREVI Futuro participant starts planning his future, the greater his chances at an easy retirement.
“Youngsters should believe in this partnership with the company and the social security plan, get more involved, invest in the relationship with the Bank and PREVI.”
BERNADETE BRAGA, PREVI Futuro participant
Fifteen years after its foundation, PREVI Futuro is ranked among Brazil’s biggest pension funds
Annual Report PREVI 2013 Benefit plans 16

Participants
2010 2011 2012 2013
Active 60,169 67,567 70,662 72,640
Retirees 103 128 157 186
External Active1 5,748 6,346 6,773 7,142
External retirees2 6 10 6 11
Pensioners 268 316 389 476
Total 66,294 74,367 77,987 80,455
1 includes self-sponsored, Deferred Proportional Benefit, and participants who still lack an option.2 includes self-sponsored and Deferred Proportional Benefit.
Paid benefits (R$ )
2010 2011 2012 2013
PREVI1 1,959,528.19 2,438,450.76 3,310,153.59 4,412,794.57
INSS 5,926,029.67 7,307,739.67 9,144,367.60 11,633,177.11
Banco do Brasil2 5,410.07 5,848.44 6,339.23 6,827.43
Total 7,890,967.93 9,752,038.87 12,460,860.42 16,052,799.11
1 PREVI benefits include PREVI Complement (Risk Benefits) and Deferred Proportional Benefit.2 Banco do Brasil is responsible for paying benefits related to obligations arising from labor lawsuits.
Evolution of accumulated equity (in R$ billion)
2007 2008 2009 2010 2011 2012 2013
0.91 1.10
1.69
2.24
2.82
3.77
4.56
Annual Report PREVI 2013 Benefit plans 17
ParticipationThe adoption percentage of PREVI Futuro at the time of hiring of new Banco do Brasil employees has progressively increased over the past years. Adoption rate at hiring was 71.19% in 2004, increasing to 89.14% in 2010 and reaching 92.59% in 2013.
The Plan’s accumulated affiliation rate is also gradually growing: in 2004, out of the total employees of Banco do Brasil, 77.93% were affiliated to PREVI Futuro; in 2010, this percentage moved to 91.27%; and in 2013, it has already reached 94.03%.
Reduction of actuarial interest ratesIn 2013, the new actuarial interest rates of PREVI Futuro entered into effect, having been reduced from 5.5% to 5% per year in December 2012. The expectation is reducing the rate to 4.5%, according to legislation rules, by 2018. The reduction in the actuarial rate for the Plan will demand a better strategy to achieve the best retirement because, in PREVI Futuro, lower rates lead to a drop in the planned benefits when they are calculated, due to the lower projected return. However, this difference can be compensated in the future by investments with a return above the actuarial goal. The goal of the reduction was to maintain the balance between contributions, future yield and amounts to be disbursed through benefit payments.
“I know about the importance of having an easy going retirement. I do what I can to increase even further the amounts that are being invested. I did Wage Preservation and increased by 2B contribution percentage to 10%.”
JOSÉ GUILHERME DE MORAES GERMANY, participant of PREVI Futuro
Portability
The PREVI Futuro Plan is also open to portability, which is guaranteed by law and has been part of the Plan’s regulations since 2012. Participants can expand their balance at PREVI Futuro transferring amounts that were previous-ly assigned to other social security plans. The resources are transferred directly from one social security plan to another, without going through the participant’s checking account, and no Income Tax (IR) or loading fee is charged.
Annual Report PREVI 2013 Benefit plans 18
Contribution, both through personal attendance events and through information campaigns about the need to contribute the maximum percentage.
Initiatives were also launched to stimulate the 2C sporadic contribution, particularly in the periods of 13th wage and participation in profits and results (PLR).
Plan participants can track their career contribution through self-service at the site, in which PREVI Futuro gained a specific area after restructuring of the portal. At the site it is possible to find information about the benefits offered by the Plan and the investment profiles, track the profitability of investments and access the Income Simulator, in which it is possible to prepare estimated income projections for the Plan’s scheduled benefits: Lifelong Monthly Income, Retirement Monthly Income and Anticipated Retirement Monthly Income.
Contributions that follow career – 2BThe 2B Contribution is a system that enables adjusting the contribution percentage of participants according to their career’s evolution, associated to the period of participation in the Plan. It is essential that the benefit amount to be received after retirement is compatible with compensation during the active period.
This contribution ranges from 1% to 10% of the participation wage, according to the participant’s score, and is tracked by the sponsor. The minimum contribution for PREVI Futuro is 7% of the participation wage, which is matched by an equivalent value from the sponsor.
From the total of participants who need to contribute to 2B, 92% contributed in 2013. A lot of effort has been employed to reach the total of participants, conducting many explanation actions about the 2B
92%
Percentage of participants entitled to the 2B that actually contributed to it
“I could have been making the career evolution contribution (2B), but I was wasting this chance. I started contributing to PREVI with an additional 5% of the wage, plus the basic contribution of 7%, and this amount is doubled by the counterpart contribution from the Bank, something you can’t get in open social security.”
WILSON DE FIGUEIREDO, PREVI Futuro participant
Annual Report PREVI 2013 Benefit plans 19
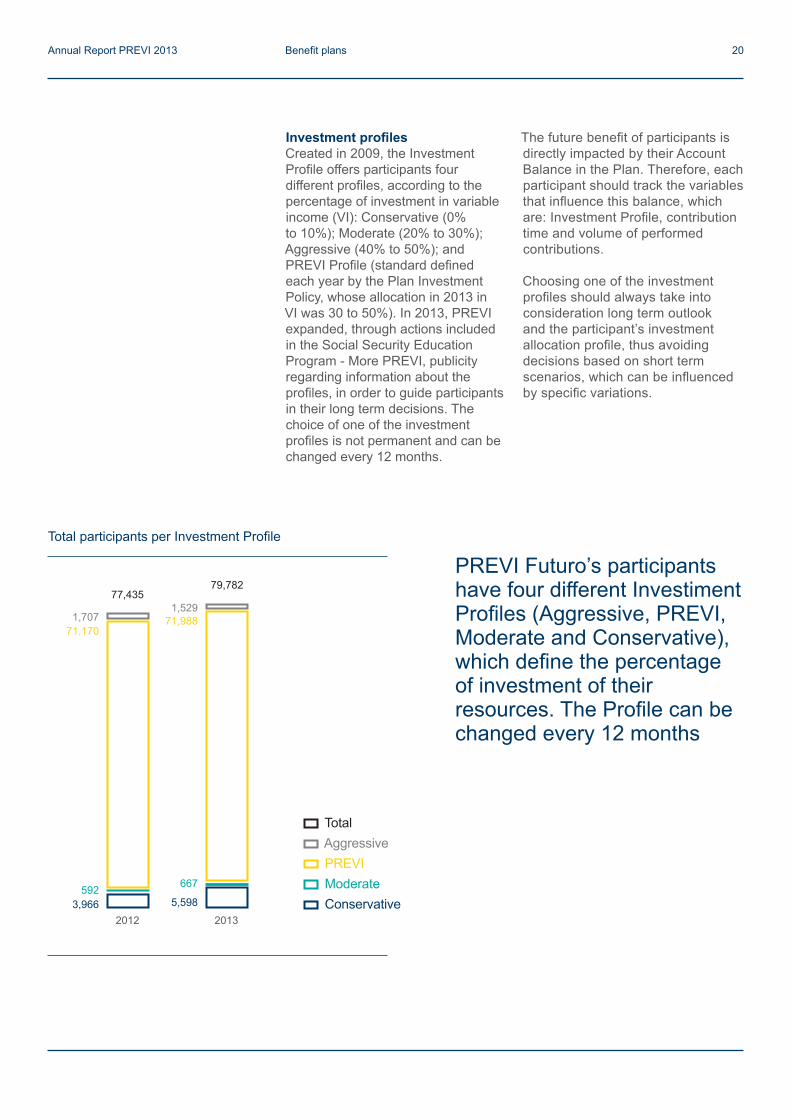
The future benefit of participants is directly impacted by their Account Balance in the Plan. Therefore, each participant should track the variables that influence this balance, which are: Investment Profile, contribution time and volume of performed contributions.
Choosing one of the investment profiles should always take into consideration long term outlook and the participant’s investment allocation profile, thus avoiding decisions based on short term scenarios, which can be influenced by specific variations.
Investment profilesCreated in 2009, the Investment Profile offers participants four different profiles, according to the percentage of investment in variable income (VI): Conservative (0% to 10%); Moderate (20% to 30%); Aggressive (40% to 50%); and PREVI Profile (standard defined each year by the Plan Investment Policy, whose allocation in 2013 in VI was 30 to 50%). In 2013, PREVI expanded, through actions included in the Social Security Education Program - More PREVI, publicity regarding information about the profiles, in order to guide participants in their long term decisions. The choice of one of the investment profiles is not permanent and can be changed every 12 months.
2012 2013
Total participants per Investment Profile
1,7071,529
71,17071,988
592 667
3,966 5,598
77,43579,782
Total Aggressive PREVI Moderate Conservative
PREVI Futuro’s participants have four different Investiment Profiles (Aggressive, PREVI, Moderate and Conservative), which define the percentage of investment of their resources. The Profile can be changed every 12 months
Annual Report PREVI 2013 Benefit plans 20
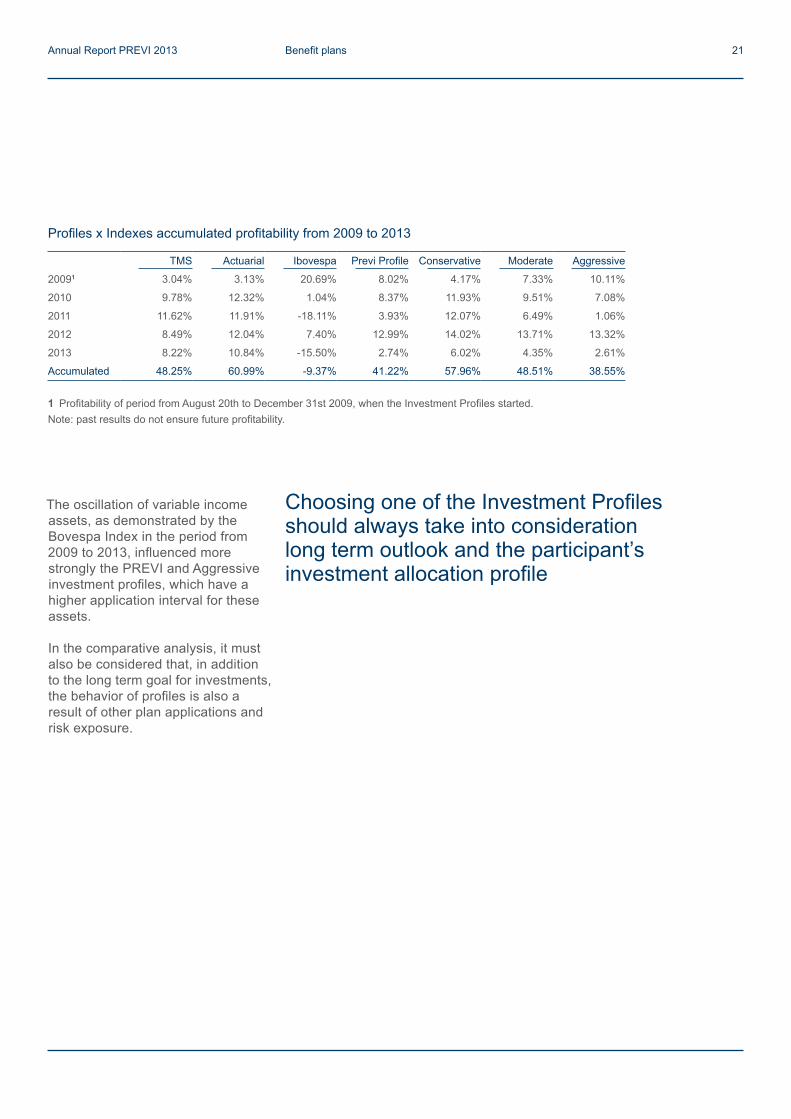
The oscillation of variable income assets, as demonstrated by the Bovespa Index in the period from 2009 to 2013, influenced more strongly the PREVI and Aggressive investment profiles, which have a higher application interval for these assets.
In the comparative analysis, it must also be considered that, in addition to the long term goal for investments, the behavior of profiles is also a result of other plan applications and risk exposure.
Profiles x Indexes accumulated profitability from 2009 to 2013
TMS Actuarial Ibovespa Previ Profile Conservative Moderate Aggressive
20091 3.04% 3.13% 20.69% 8.02% 4.17% 7.33% 10.11%
2010 9.78% 12.32% 1.04% 8.37% 11.93% 9.51% 7.08%
2011 11.62% 11.91% -18.11% 3.93% 12.07% 6.49% 1.06%
2012 8.49% 12.04% 7.40% 12.99% 14.02% 13.71% 13.32%
2013 8.22% 10.84% -15.50% 2.74% 6.02% 4.35% 2.61%
Accumulated 48.25% 60.99% -9.37% 41.22% 57.96% 48.51% 38.55%
1 Profitability of period from August 20th to December 31st 2009, when the Investment Profiles started. Note: past results do not ensure future profitability.
Choosing one of the Investment Profiles should always take into consideration long term outlook and the participant’s investment allocation profile
Annual Report PREVI 2013 Benefit plans 21
Strategy and investments
Technical qualification and the capacity to predict market movements were essential to prepare PREVI to face more adverse economic scenarios
Annual Report PREVI 2013 22
Investment policies and strategies
before being carried out. These are technical decisions, which follow the essential Mission of ensuring social security benefits, in compliance with the rules and regulations of the complementary social security segment and the principles of good corporate governance.
The investment policies include a set of directives that guide the long term management of benefit plan assets. The policies combine aspects of the philosophies for investment and planning, while considering the concept of balance and longevity for benefit plans, and are aimed at mitigating the occurrence of unbalances by establishing an asset composition optimizing the relationship between risk and return in the portfolio, in alignment with PREVI goals.
PREVI, as a closed complementary social security entity, manages resources from sponsor and personal contributions, as well as other special contributions described in the Statute or in specific instrument. In 2013, the Institution’s portfolio reached R$ 171 billion, distributed in varied investments, such as corporate shares, real estate, securities, etc.
Investment decisions take into consideration the profitability of assets and business security, and must follow the investment policies of benefit plans, prepared annually by the Planning Board and approved by the Executive Board. The separation between the area that conceives the Investment Policy (Planning Board) and the area that executes it (Investment Board) is another guarantee that each decision will undergo detailed examination
The investments follow technical decisions that consider the Mission of ensuring social security benefits and the compliance with rules and regulations
“We seek to build diversified portfolios covering multiple sectors, so any negative effects from a specific area of the economy can be counterbalanced by growth in others.”
VITOR PAULO, Planning director
Annual Report PREVI 2013 Strategy and investments 23
Risk-based Management
With the creation in 1997 of Risk Management, PREVI reaffirmed its pioneer status in the com-plementary social security segment. On account of its market exposure and its high volume of investments, the Entity developed evaluation methodologies for risks capable of undermining fulfillment of its Mission: payment of retirement and pension benefits to all its associates.
Maintaining this pioneer attitude, PREVI initiated in 2012 the Risk-Based Management (GBR) pro-ject, which consists of reviewing and reinforcing its risk management structure. The work involved a broad diagnostic of the current structure, evaluating the maturity level of its tools, methodolo-gies, processes and policies, compared to the best national and international references.
For 2014, many actions are planned for deployment, related to improvements in risk governance, updating of policies and processes and dissemination of risk culture across the Entity. The final goal of the GBR project is enabling an integrated view of all risks of benefit plans managed by PREVI. Part of this process consists of designing scenarios and simulations capable of compro-mising payment of benefits, projecting and estimating what could happen to PREVI in adverse situations and, if applicable, review procedures in order to mitigate these risks.
GBR is based on the principle that guaranteeing the Entity’s permanence depends on its capabi-lity to predict negative events and prepare itself for them. With GBR, PREVI has a more efficient and transparent mechanism, adjusted to the practices used in foreign pension funds and aligned to regulation recommendations.
PREVI maintains in its investment policies the search for diversification of assets and multiple sectors of the economy and geographic regions of Brazil, with the goal of reducing investment risk and increasing plan profitability.
In addition to the general directives for investments, the policies handle social and environmental responsibility criteria for each asset class (variable income, fixed income, structured investments and real estate), as described in PREVI’s Social and Environmental Responsibility Policy.
The separation between the area thatconceives the Investment Policyand the area that executes it guarantees that each decision will undergo detailed examination
Annual Report PREVI 2013 Strategy and investments 24
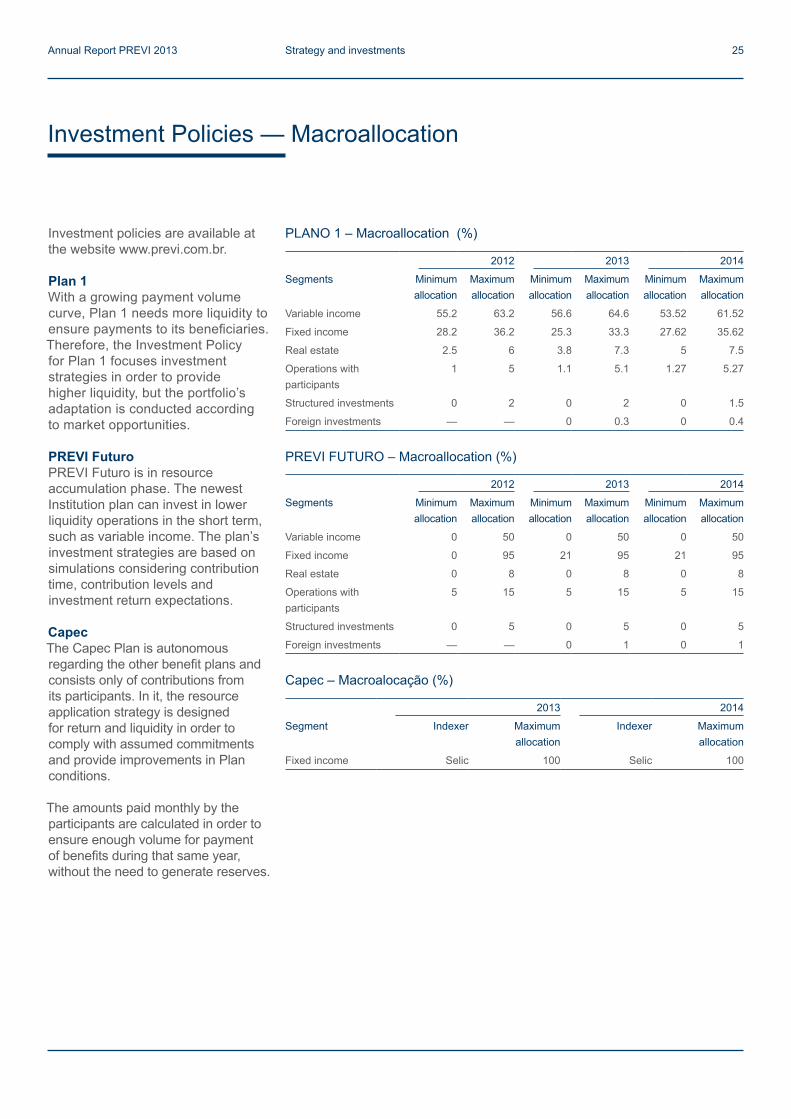
Investment policies are available at the website www.previ.com.br.
Plan 1With a growing payment volume curve, Plan 1 needs more liquidity to ensure payments to its beneficiaries. Therefore, the Investment Policy for Plan 1 focuses investment strategies in order to provide higher liquidity, but the portfolio’s adaptation is conducted according to market opportunities.
PREVI FuturoPREVI Futuro is in resource accumulation phase. The newest Institution plan can invest in lower liquidity operations in the short term, such as variable income. The plan’s investment strategies are based on simulations considering contribution time, contribution levels and investment return expectations.
CapecThe Capec Plan is autonomous regarding the other benefit plans and consists only of contributions from its participants. In it, the resource application strategy is designed for return and liquidity in order to comply with assumed commitments and provide improvements in Plan conditions.
The amounts paid monthly by the participants are calculated in order to ensure enough volume for payment of benefits during that same year, without the need to generate reserves.
PLANO 1 – Macroallocation (%)
2012 2013 2014
Segments Minimum allocation
Maximum allocation
Minimum allocation
Maximum allocation
Minimum allocation
Maximum allocation
Variable income 55.2 63.2 56.6 64.6 53.52 61.52
Fixed income 28.2 36.2 25.3 33.3 27.62 35.62
Real estate 2.5 6 3.8 7.3 5 7.5
Operations with participants
1 5 1.1 5.1 1.27 5.27
Structured investments 0 2 0 2 0 1.5
Foreign investments — — 0 0.3 0 0.4
PREVI FUTURO – Macroallocation (%)
2012 2013 2014
Segments Minimum allocation
Maximum allocation
Minimum allocation
Maximum allocation
Minimum allocation
Maximum allocation
Variable income 0 50 0 50 0 50
Fixed income 0 95 21 95 21 95
Real estate 0 8 0 8 0 8
Operations with participants
5 15 5 15 5 15
Structured investments 0 5 0 5 0 5
Foreign investments — — 0 1 0 1
Capec – Macroalocação (%)
2013 2014
Segment Indexer Maximum allocation
Indexer Maximum allocation
Fixed income Selic 100 Selic 100
Investment Policies — Macroallocation
Annual Report PREVI 2013 Strategy and investments 25
investments in companies that have incorporated as practice or are effectively working to incorporate the basic principles of social, environmental and ethical responsibility, in accordance with the Principles of Responsible Investment (PRI).
• Prohibitions – no investments can be made on assets from companies whose main activity is in the sectors of smoking and arms dealing.
Directives for the participation portfolio (variable income)In alignment with PREVI’s Social and Environmental Responsibility Policy, companies whose shares are held should be encouraged to adopt RSA actions, particularly in regards to:
• participation in pacts, movements, entities or external organizations focused on RSA or sustainability issues;
• disclosure of sustainability or RSA Policy, considering, among other aspects, relationship with consumers, customers and vendors, diversity, ecoefficient management, sustainable investments and sustainable regional development;
• publication of sustainability report using GRI format;
• preparation and publication of Assembly Participation Manual;
• ISO 14.000 Certification;• insertion of RSA criteria in the
strategic planning of companies.
Directives for structured investments• Corporate governance - fund
managers should stand out by transparency in administration and adoption of best practices in corporate governance, such as: (I) subscription of shares by manager for alignment of interests; (II) disclosure to shareholders about relevant modifications in the participation of managers in the fund, (III)
PRIAs signing member of the Principles for Responsible Investment (PRI) since 2006 and sole Latin American representative at the PRI board, PREVI has encouraged collective involvement among the Brazilian network of signees. The goal is to encourage transparency in management.
PREVI included in its investment policies the social and environmental responsibility (RSA) criteria to promote this kind of practice among other investors and consolidate its positioning in support of investments considering environmental, economic and social aspects.
Among its advisors at companies in which it holds participation, PREVI constantly stimulates debates regarding sustainability, such as the use of the international reporting methodology of the Global Reporting Initiative (GRI), monitoring of greenhouse effect gas emissions of the Carbon Disclosure Project (CDP), as well as other principles for best practices in corporate governance.
Below are the RSA Directives for investments.
General directives for the variable income segment• Bovespa governance level
- priority for business with companies listed at Bovespa governance levels or in the process of adopting them.
• Corporate governance practice - priority for investments in companies that fit the criteria contained in the PREVI Code of Best Practices in Corporate Governance, regarding directives established for: I) transparency, disclosure and responsibility, II) shareholder rights, III) equal treatment and IV) corporate ethics.
• Social, environmental and ethical responsibility - priority for
As a representative of the Principlesfor Responsible Investment (PRI) on Latin America, PREVI has encouraged the adoption of social and environmentalresponsibility (RSA) criteria among the companies in which it holds participation
Annual Report PREVI 2013 Strategy and investments 26
ethical responsibility actions, in alignment both with the Principles of Responsible Investment (PRI) and its Social and Environmental Responsibility Policy, in real estate enterprises the following is recommended, among other items:
• encourage the existence of an Ecoefficient Management Program, with the adoption of environmental technologies (energy efficiency, water conservation, material recycling and creation of green areas), while also encouraging local urban and social actions;
• striving towards good working conditions by seeking safety and commitment towards best practices in people management;
• adaptation of properties, with the goal of ensuring accessibility to people with special needs;
• adoption of RSA aspects in the process of evaluating lessees;
• the adoption of certifications regarding the real estate area.
The scenarios prepared for the investment policies considered that the global environment, in the social, political and economic aspects, will not present significant disrupting during the projection period. However, it is important to highlight some factors that can change the configuration of scenarios. If these factors occur, they will require a full review of forecasts:
• Serious geopolitical issues – initiation of large-scale armed conflict, terrorist attacks or other similar situations;
• Natural catastrophes – large-scale events in key regions that can reconfigure the political and economic situation;
• Institutional disruption – resulting from the rise to power of political groups that can significantly change political and economic actions.
periodic accountability about investment performance; and (IV) preparation of a regulation with clearly defined rules;
• Social, environmental and ethical responsibility - in the contracting of external managers, RSA criteria should be considered and preferably it should seek those that have incorporated or are incorporating social, environmental and ethical responsibility practices.
Managers should be encouraged to adopt PRI or other principles aimed at conducting social, environmental and ethical responsibility actions. In alignment with PREVI’s Social and Environmental Responsibility Policy and other RSA criteria described in this Policy, the adoption of social and environmental criteria in the evaluation and selection of investments to be performed by investment funds should be encouraged.
Directive for the fixed income segment• Social, environmental and ethical
responsibility – in investments on fixed income securities issued by private companies, social, environmental and ethical responsibility criteria should be incorporated in the evaluation of issuers.
Directives for the real estate segment• Corporate governance – in
enterprise management, guide the adoption of corporate governance standards in alignment with the PREVI Code of Best Practices and Corporate Governance in Real Estate Enterprises.
• Social, environmental and ethical responsibility – considering PREVI’s interest in having its investments stand out thanks to social, environmental and
Annual Report PREVI 2013 Strategy and investments 27
Investment decisions
increased its equity and closed the year with R$ 4.56 billion and a profitability of 3.66%.
Fixed incomeIn 2013, with the consolidation of inflation at a level close to the maximum goal defined by the National Currency Council (CMN), the Monetary Policy Committee (Copom) initiated the adjustment of the interest rate at a level above market expectations. On the foreign side, one highlight was the start of the recovery of the United States economy before predicted, leading analysts to consider an early reduction of monetary stimulus in that country, which led to an increase in the interest rates for US long term securities, also influencing the rise of the interest curve in Brazil.
On account of these factors, the fixed income market suffered strong oscillation in 2013. Plan 1 achieved
The search for liquidity guided decisions in 2013 for Plan 1. The approved strategy included moves such as the reduction of variable income, international investments and expanded participation in the real estate area. Due to market and regulation factors, the scenarios were reviewed, and some of these goals were postponed. Over the course of this year, the Stock Exchange dropped, and inflation and the base interest rate (Selic) rose. The reduction of variable income, which would offer more liquidity to Plan 1, was postponed due to the negative performance of the stock market. As part of the active management of investments performed by PREVI, this scenario and its potential long term impact were considered and helped determine investment decisions.
In this scenario, Plan 1 achieved full profitability of 7.30%, with an equity of R$ 166.25 billion. PREVI Futuro
166.25 biPlan 1’s total assets (R$ ) by the end of 2013
“Plan 1 commitments are on the same scale as its equity. The recipe for winning this challenge is: investing with a focus on medium and long term, analyzing the economic situation, identifying sectors with higher expectation of value creation and purchasing or selling assets considering their liquidity.”
RENÊ SANDA, director of Investments
Annual Report PREVI 2013 Strategy and investments 28

In Plan 1, approximately two thirds of the fixed income portfolio consists of titles marked-to-curve. In PREVI Futuro, given the characteristics of the variable contribution plan, with individual quotas and the possibility of participants defining their investment profile, the portfolio has a higher percentage of marked-to-market securities, but in spite of that, considering that the Plan is still in accumulation phase, and therefore few participants are eligible to request the retirement benefit, part of the portfolio consists of marked-to-curve securities. This management could be considered more conservative, but softens the effects of market variations. With this strategy, PREVI seeks to protect the equity of its associates.
a profitability of 8.07%, and PREVI Futuro obtained 5.52%. The Selic Average Rate (TMS), one of the market indicators for the segment, was 8.22%.
PREVI’s Fixed Income investment strategy combines marked-to-curve and marked-to-market securities. The marked-to-market securities are updated at the daily price, and therefore are affected by positive or negative market variations, while marked-to-curve securities, which are also referred as securities “kept until due date”, the return corresponds to their acquisition rate, which in other words, is the “curve” of the security’s compensation. In this case, market fluctuations do not interfere in the security’s profitability, which contributes to reduce volatility in the global results of the fixed income portfolio.
Profitability in 2013 (%)
Fixed income
Plan 1 8.07
PREVI Futuro 5.52
Reference index1 (INPC + 5.5%) 11.37
Market indicators
TMS 8.22
IMA-B (10.02)
IMA General (1.42)
1 Reference index of segment defined on the Investment Policy of Plans 1 and PREVI Futuro.
The fixed income market suffered strong oscillation in 2013. At PREVI, asset management sought to soften the effects of market variations and to protect the equity of its associates
Annual Report PREVI 2013 Strategy and investments 29
DerivativesIn 2013, PREVI conducted operations with Bovespa index and share derivatives, in compliance with investment policy rules of Plans 1 and PREVI Futuro and Resolution CMN 3.792, dated September 24th, 2009.
The Plan 1 and PREVI Futuro investment policies plan for the execution of derivative operations through future contracts of Ibovespa and options on shares and Bovespa indexes, with the goal of safeguarding positions and, in the case of Plan 1, also to anticipate allocation decisions. In addition, they establish a limit for operations of up to 10% of the financial total of the variable income segment for Plan 1, and up to 30% for PREVI Futuro.
Variable incomeThe strategy of significantly allocating resources on shares has proven itself right. In the past 10 years, investments in variable income achieved accumulated profitability of approximately 414%, much higher than the Bovespa Index (approximately 131%) and the actuarial goal for the period (approximately 200%).
In 2013, the variable income profitability of Plan 1 was 6.36%, while PREVI Futuro achieved a profitability of -2.85%. In comparison with the Ibovespa, IbrX and IbrX-50 indexes, which dropped 15.5%, 3.13% and 4.41%, respectively, the portfolio’s performance for both plans was higher than market indicators, result of active management of PREVI investments, with the tracking of long term macroeconomic scenarios, seeking to preempt trends and minimize potential negative market impact on the Entity’s investments.
Profitability in 2013 (%)
Variable income
Plan 1 6.36
PREVI Futuro (2.85)
Reference Index1 (IBrX) (3.13)
Market indicators
Ibovespa (15.50)
IBrX-50 (4.41)
1 Reference index of segment defined on the Investment Policy of Plans 1 and PREVI Futuro.
414%Variable income profitability in the last 10 years
Annual Report PREVI 2013 Strategy and investments 30
Institution put up for sale properties in its portfolio that had a value of less than R$ 50 million.
When the policy was established, 26 properties were included in the divestment portfolio. Investments in real estate enterprises have gained significant value and currently present one of the best profitabilities in PREVI’s investment portfolio.
Structured investmentsIn 2013, structured investments achieved significant profitability: 30.91% in PREVI Futuro and 20.60% in Plan 1. Structured investments are basically formed by private equity funds, which invest in emerging companies with a potential for growth and added value. In Plan 1, the segment accounts for 0.56% of the total investments, and in PREVI Futuro, 1.56%. Structured investments are set to keep growing in the portfolios of Plan 1 and PREVI Futuro, considering recent returns in this segment and the continuous search for the broadest diversification possible in plan resource allocation.
Real estateAssets in the real estate segment added up to R$ 9.14 billion in 2013, compared to R$ 8.23 billion for the previous year, consolidating its position as the biggest real estate asset portfolio in the Brazilian complementary social security sector. This growth is thanks to the rise in value of properties. Out of the properties that make up PREVI’s portfolio, 32 were reevaluated in 2013, based on reports from specialized companies, which generated a positive equity variation of R$ 827 million in the portfolio.
As far as portfolio growth goes, there was a rise of 5.75%, less than in 2012, which was 26.27%. On account of market oscillation throughout the year, PREVI was cautious when conducting the investments planned for the sector. During the next years, the Entity will invest in large scale projects. PREVI established in 2009, a Divestment Policy, in order to make its participation in the real estate segment more strategic and improve its work in the sector. Therefore, the
Profitability in 2013 (%)
Segment Plan 1 PREVI Futuro Reference index1
Real estate investments 17.51 12.49 16.12 (INPC +10% per year)
Structured investments 20.60 30.91 14.82 (INPC +8.5% per year)
1 Reference index of segment defined on the Investment Policy of Plans 1 and PREVI Futuro.
9.14 biValue (R$ ) of PREVI’s real state portfolio in 2013
Annual Report PREVI 2013 Strategy and investments 31
TupyIn 2013, Tupy S.A. joined “Novo Mercado”, positioning itself as a company at the highest degree of corporate governance of the Brazilian stock exchange, demanding from its directors and other collaborators commitment towards transparency and accountability regarding all shareholders.
Tupy S.A., the biggest foundry in Latin America, is headquartered in Joinville, Santa Catarina, and was founded in 1938. In February, the company converted all its preferred shares into voting shares, one of the relevant requirements for joining Bovespa’s “Novo Mercado”.
Companies and enterprises in which shares are held
PREVI resources are also invested in shares of companies and properties. As previously described, investment decisions take into account the liquidity and strategies of companies regarding the principles of sustainability.
PREVI’s role as disseminator of best practices among companies in which it holds participation is also aligned with its position at PRI. In compliance with its strategic goal, the Entity has developed in 2013 the mechanisms and forms of interaction with these companies.
PREVI has teams dedicated to monitoring its relevant investments, performing continuous engagement work among companies and investors. In this context, in 2013, PREVI evaluated the sustainability and corporate governance practices of companies in its portfolio, while also mapping the risk management mechanisms of these companies.
In 2013, PREVI evaluated the sustainability and corporate governance practices of companies in its portfolio, while also mapping the risk management mechanisms of these companies
“As a pension fund with a commitment towards benefit payments, we need to think about the long term. As institutional investors, we need to take into consideration the longevity of companies, which sustain the cash flow needed to pay these benefits.”
MARCO GEOVANNE, director of Participations
Annual Report PREVI 2013 Strategy and investments 32
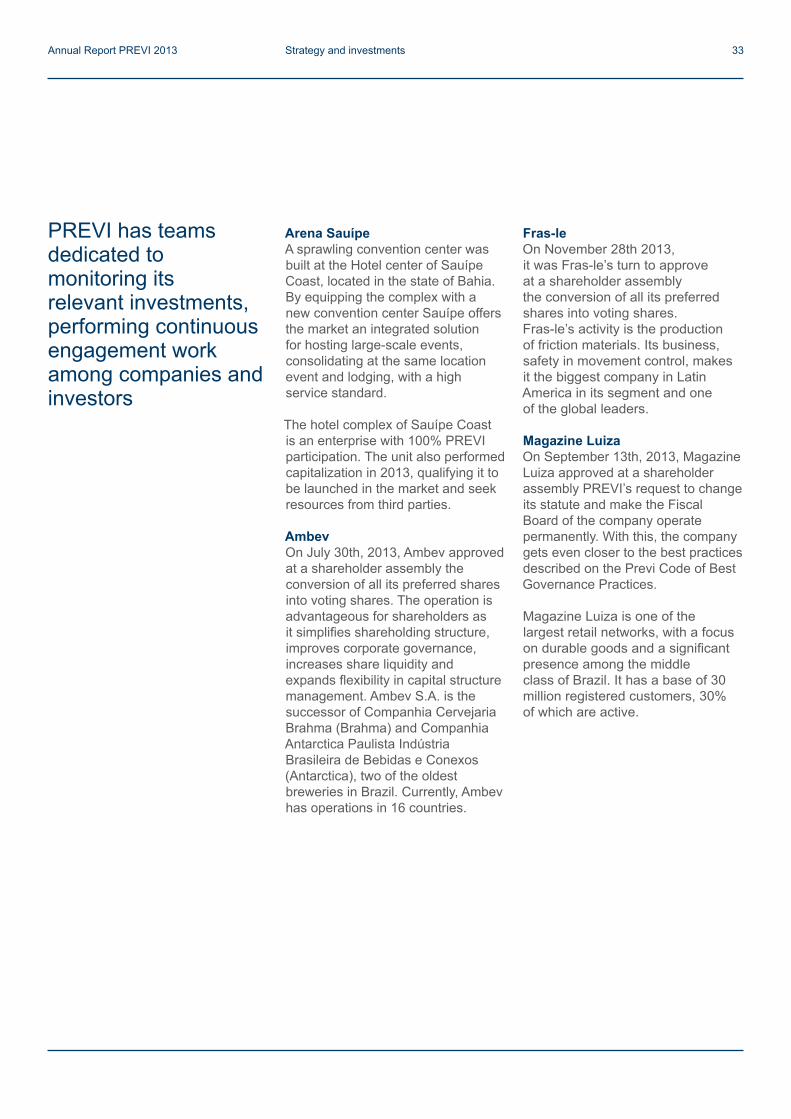
Fras-leOn November 28th 2013, it was Fras-le’s turn to approve at a shareholder assembly the conversion of all its preferred shares into voting shares. Fras-le’s activity is the production of friction materials. Its business, safety in movement control, makes it the biggest company in Latin America in its segment and one of the global leaders.
Magazine LuizaOn September 13th, 2013, Magazine Luiza approved at a shareholder assembly PREVI’s request to change its statute and make the Fiscal Board of the company operate permanently. With this, the company gets even closer to the best practices described on the Previ Code of Best Governance Practices.
Magazine Luiza is one of the largest retail networks, with a focus on durable goods and a significant presence among the middle class of Brazil. It has a base of 30 million registered customers, 30% of which are active.
Arena SauípeA sprawling convention center was built at the Hotel center of Sauípe Coast, located in the state of Bahia. By equipping the complex with a new convention center Sauípe offers the market an integrated solution for hosting large-scale events, consolidating at the same location event and lodging, with a high service standard.
The hotel complex of Sauípe Coast is an enterprise with 100% PREVI participation. The unit also performed capitalization in 2013, qualifying it to be launched in the market and seek resources from third parties.
AmbevOn July 30th, 2013, Ambev approved at a shareholder assembly the conversion of all its preferred shares into voting shares. The operation is advantageous for shareholders as it simplifies shareholding structure, improves corporate governance, increases share liquidity and expands flexibility in capital structure management. Ambev S.A. is the successor of Companhia Cervejaria Brahma (Brahma) and Companhia Antarctica Paulista Indústria Brasileira de Bebidas e Conexos (Antarctica), two of the oldest breweries in Brazil. Currently, Ambev has operations in 16 countries.
PREVI has teams dedicated to monitoring its relevant investments, performing continuous engagement work among companies and investors
Annual Report PREVI 2013 Strategy and investments 33
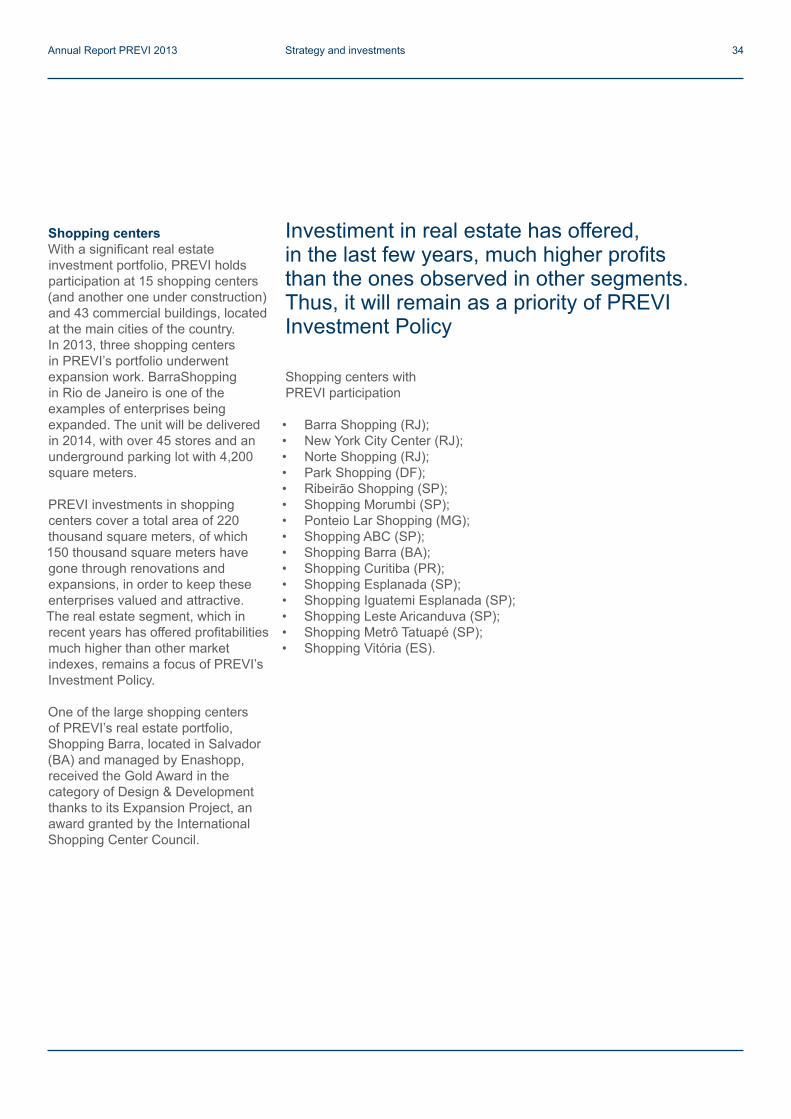
Shopping centers with PREVI participation
• Barra Shopping (RJ);• New York City Center (RJ);• Norte Shopping (RJ);• Park Shopping (DF);• Ribeirão Shopping (SP);• Shopping Morumbi (SP);• Ponteio Lar Shopping (MG);• Shopping ABC (SP);• Shopping Barra (BA);• Shopping Curitiba (PR);• Shopping Esplanada (SP);• Shopping Iguatemi Esplanada (SP);• Shopping Leste Aricanduva (SP);• Shopping Metrô Tatuapé (SP);• Shopping Vitória (ES).
Shopping centersWith a significant real estate investment portfolio, PREVI holds participation at 15 shopping centers (and another one under construction) and 43 commercial buildings, located at the main cities of the country. In 2013, three shopping centers in PREVI’s portfolio underwent expansion work. BarraShopping in Rio de Janeiro is one of the examples of enterprises being expanded. The unit will be delivered in 2014, with over 45 stores and an underground parking lot with 4,200 square meters.
PREVI investments in shopping centers cover a total area of 220 thousand square meters, of which 150 thousand square meters have gone through renovations and expansions, in order to keep these enterprises valued and attractive. The real estate segment, which in recent years has offered profitabilities much higher than other market indexes, remains a focus of PREVI’s Investment Policy.
One of the large shopping centers of PREVI’s real estate portfolio, Shopping Barra, located in Salvador (BA) and managed by Enashopp, received the Gold Award in the category of Design & Development thanks to its Expansion Project, an award granted by the International Shopping Center Council.
Investiment in real estate has offered, in the last few years, much higher profits than the ones observed in other segments. Thus, it will remain as a priority of PREVI Investment Policy
Annual Report PREVI 2013 Strategy and investments 34
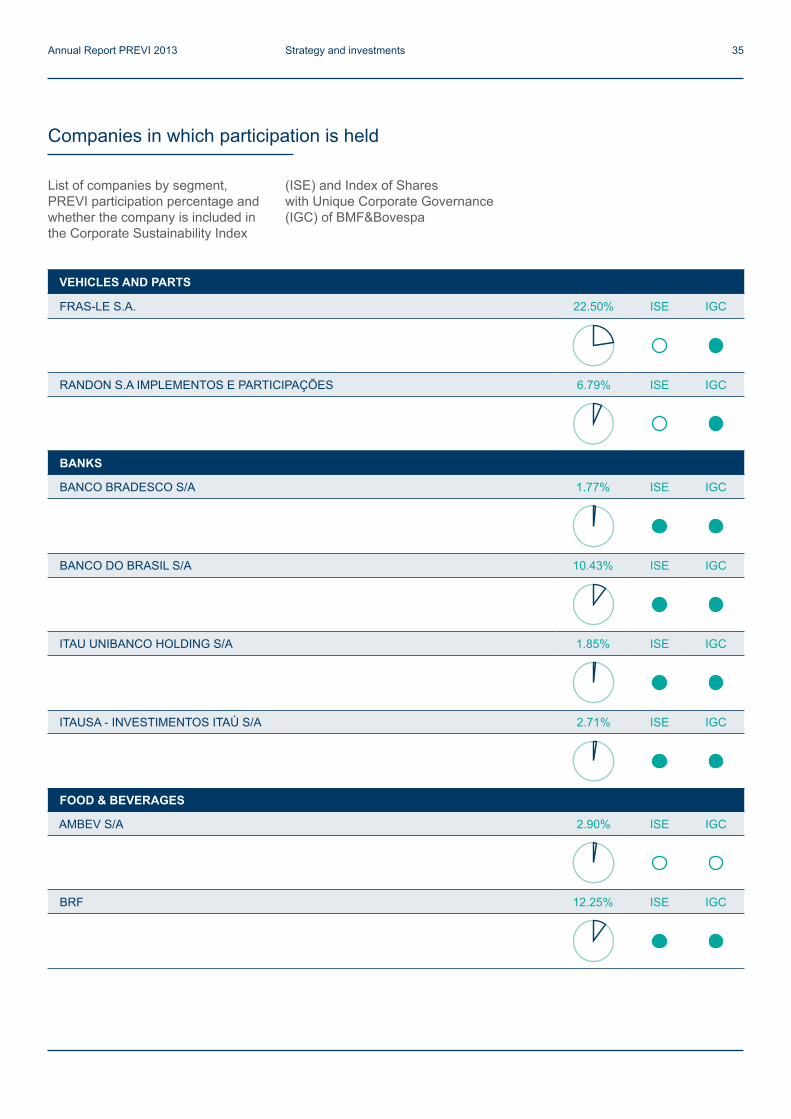
VEHICLES AND PARTS
FRAS-LE S.A. 22.50% ISE IGC
RANDON S.A IMPLEMENTOS E PARTICIPAÇÕES 6.79% ISE IGC
BANKS
BANCO BRADESCO S/A 1.77% ISE IGC
BANCO DO BRASIL S/A 10.43% ISE IGC
ITAU UNIBANCO HOLDING S/A 1.85% ISE IGC
ITAUSA - INVESTIMENTOS ITAÚ S/A 2.71% ISE IGC
FOOD & BEVERAGES
AMBEV S/A 2.90% ISE IGC
BRF 12.25% ISE IGC
Companies in which participation is held
List of companies by segment, PREVI participation percentage and whether the company is included in the Corporate Sustainability Index
(ISE) and Index of Shares with Unique Corporate Governance (IGC) of BMF&Bovespa
Annual Report PREVI 2013 Strategy and investments 35

INDUSTRIAL GOODS
KEPLER WEBER 17.56% ISE IGC
TUPY 28.22% ISE IGC
WEG S/A 0.15% ISE IGC
CONSUMER GOODS
SAUÍPE S.A. 100% ISE IGC
MAGAZINE LUIZA S.A. 2.38% ISE IGC
ENERGY
CELESC - CENTRAIS ELÉTRICAS DE SANTA CATARINA S.A. 14.46% ISE IGC
COMPANHIA ENERGÉTICA MINAS GERAIS – CEMIG 0.32% ISE IGC
ELECTRICITY
GTD PARTICIPAÇÕES*** 21.63% ISE IGC
521 PARTICIPAÇÕES 100% ISE IGC
NEOENERGIA S.A. 49.01% ISE IGC
Annual Report PREVI 2013 Strategy and investments 36
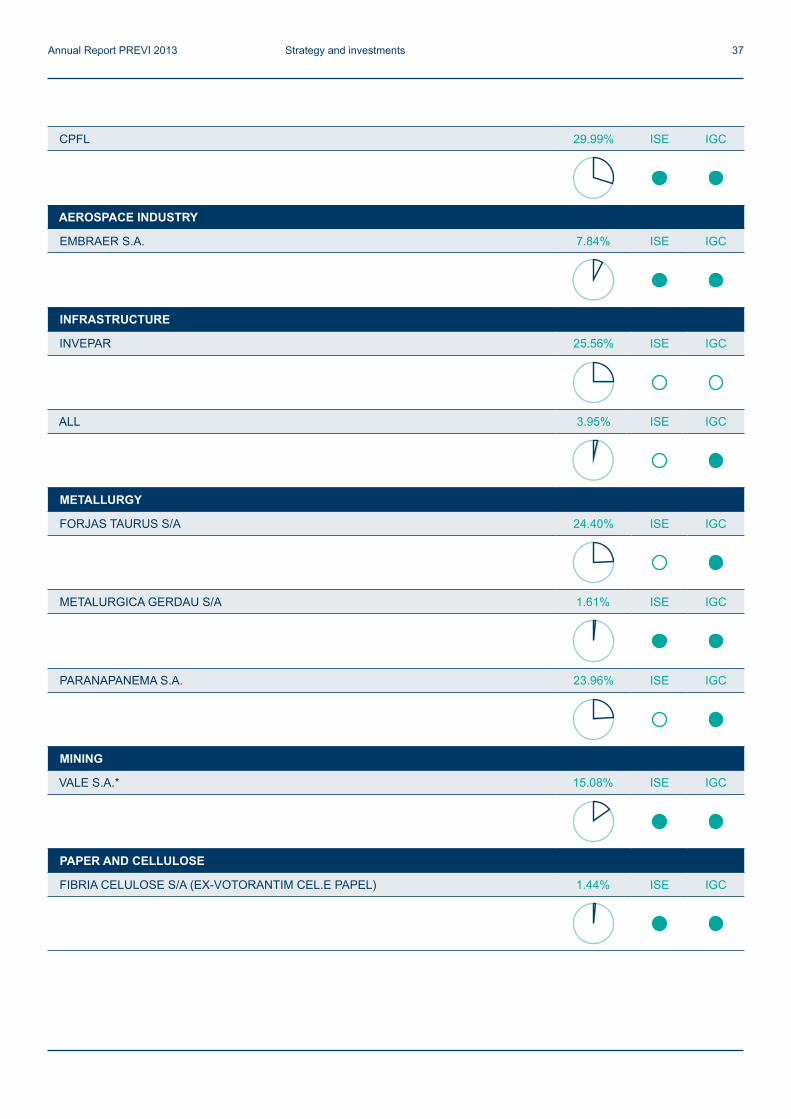
CPFL 29.99% ISE IGC
AEROSPACE INDUSTRY
EMBRAER S.A. 7.84% ISE IGC
INFRASTRUCTURE
INVEPAR 25.56% ISE IGC
ALL 3.95% ISE IGC
METALLURGY
FORJAS TAURUS S/A 24.40% ISE IGC
METALURGICA GERDAU S/A 1.61% ISE IGC
PARANAPANEMA S.A. 23.96% ISE IGC
MINING
VALE S.A.* 15.08% ISE IGC
PAPER AND CELLULOSE
FIBRIA CELULOSE S/A (EX-VOTORANTIM CEL.E PAPEL) 1.44% ISE IGC
Annual Report PREVI 2013 Strategy and investments 37
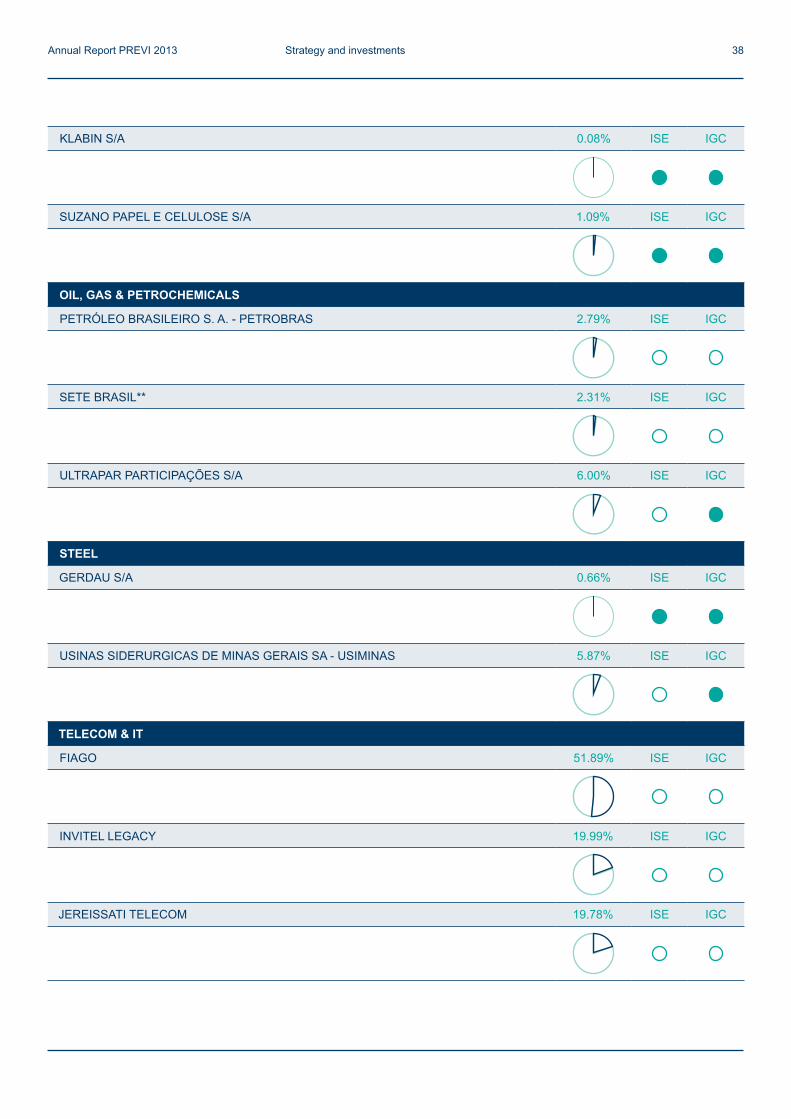
KLABIN S/A 0.08% ISE IGC
SUZANO PAPEL E CELULOSE S/A 1.09% ISE IGC
OIL, GAS & PETROCHEMICALS
PETRÓLEO BRASILEIRO S. A. - PETROBRAS 2.79% ISE IGC
SETE BRASIL** 2.31% ISE IGC
ULTRAPAR PARTICIPAÇÕES S/A 6.00% ISE IGC
STEEL
GERDAU S/A 0.66% ISE IGC
USINAS SIDERURGICAS DE MINAS GERAIS SA - USIMINAS 5.87% ISE IGC
TELECOM & IT
FIAGO 51.89% ISE IGC
INVITEL LEGACY 19.99% ISE IGC
JEREISSATI TELECOM 19.78% ISE IGC
Annual Report PREVI 2013 Strategy and investments 38
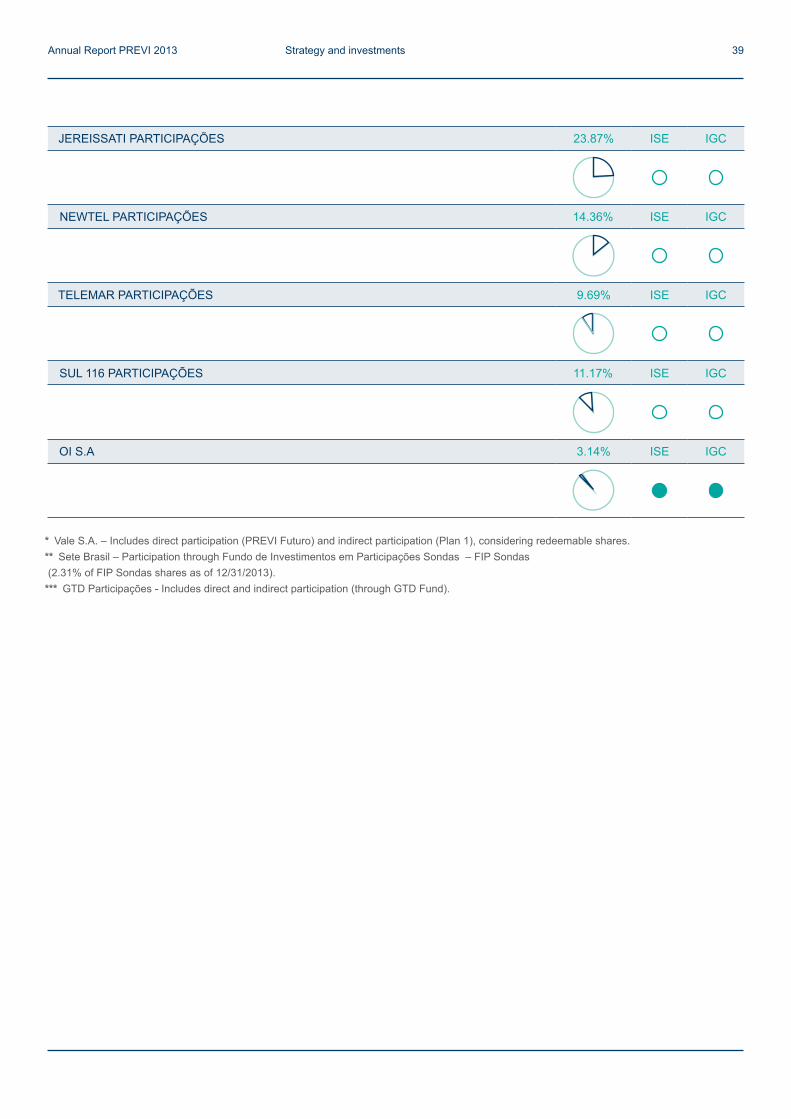
JEREISSATI PARTICIPAÇÕES 23.87% ISE IGC
NEWTEL PARTICIPAÇÕES 14.36% ISE IGC
TELEMAR PARTICIPAÇÕES 9.69% ISE IGC
SUL 116 PARTICIPAÇÕES 11.17% ISE IGC
OI S.A 3.14% ISE IGC
* Vale S.A. – Includes direct participation (PREVI Futuro) and indirect participation (Plan 1), considering redeemable shares.** Sete Brasil – Participation through Fundo de Investimentos em Participações Sondas – FIP Sondas (2.31% of FIP Sondas shares as of 12/31/2013).
*** GTD Participações - Includes direct and indirect participation (through GTD Fund).
Annual Report PREVI 2013 Strategy and investments 39

Accounting Statements December 2013
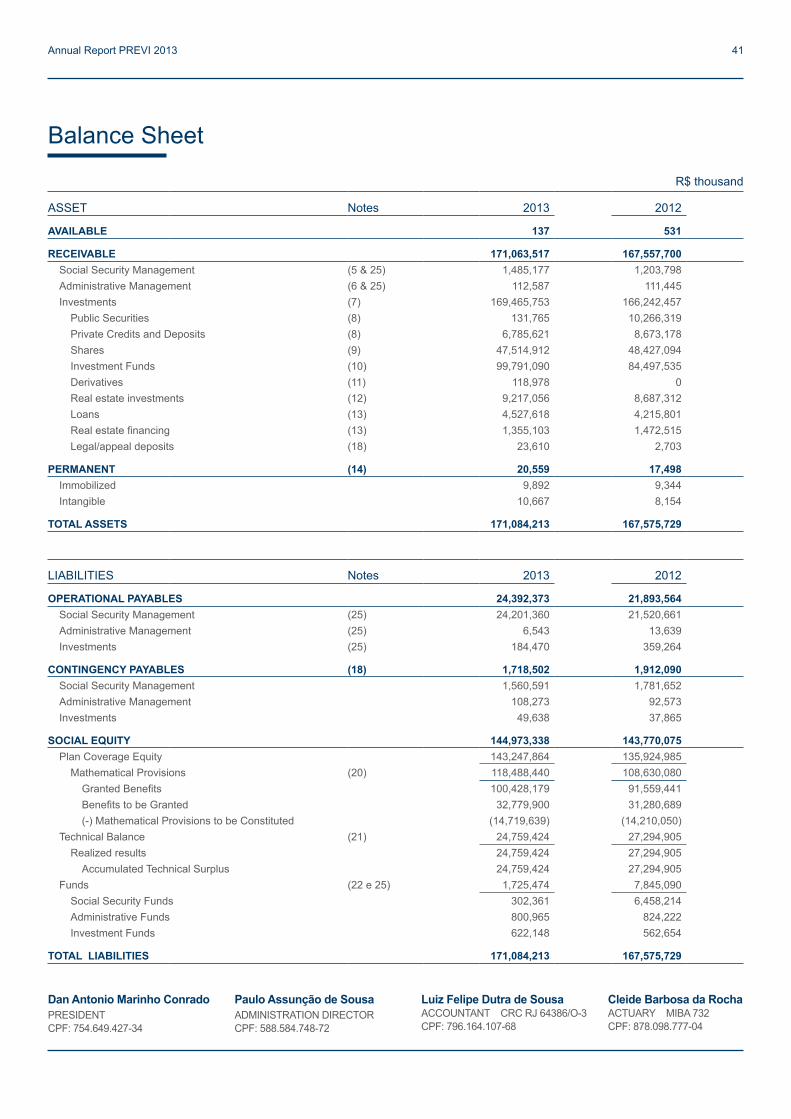
ASSET Notes 2013 2012
AVAILABLE 137 531
RECEIVABLE 171,063,517 167,557,700Social Security Management (5 & 25) 1,485,177 1,203,798Administrative Management (6 & 25) 112,587 111,445Investments (7) 169,465,753 166,242,457
Public Securities (8) 131,765 10,266,319Private Credits and Deposits (8) 6,785,621 8,673,178Shares (9) 47,514,912 48,427,094Investment Funds (10) 99,791,090 84,497,535Derivatives (11) 118,978 0Real estate investments (12) 9,217,056 8,687,312Loans (13) 4,527,618 4,215,801Real estate financing (13) 1,355,103 1,472,515Legal/appeal deposits (18) 23,610 2,703
PERMANENT (14) 20,559 17,498Immobilized 9,892 9,344Intangible 10,667 8,154
TOTAL ASSETS 171,084,213 167,575,729
LIABILITIES Notes 2013 2012
OPERATIONAL PAYABLES 24,392,373 21,893,564Social Security Management (25) 24,201,360 21,520,661Administrative Management (25) 6,543 13,639Investments (25) 184,470 359,264
CONTINGENCY PAYABLES (18) 1,718,502 1,912,090Social Security Management 1,560,591 1,781,652Administrative Management 108,273 92,573Investments 49,638 37,865
SOCIAL EQUITY 144,973,338 143,770,075Plan Coverage Equity 143,247,864 135,924,985
Mathematical Provisions (20) 118,488,440 108,630,080Granted Benefits 100,428,179 91,559,441Benefits to be Granted 32,779,900 31,280,689(-) Mathematical Provisions to be Constituted (14,719,639) (14,210,050)
Technical Balance (21) 24,759,424 27,294,905Realized results 24,759,424 27,294,905
Accumulated Technical Surplus 24,759,424 27,294,905Funds (22 e 25) 1,725,474 7,845,090
Social Security Funds 302,361 6,458,214Administrative Funds 800,965 824,222Investment Funds 622,148 562,654
TOTAL LIABILITIES 171,084,213 167,575,729
Balance Sheet
Dan Antonio Marinho ConradoPRESIDENTCPF: 754.649.427-34
Paulo Assunção de SousaADMINISTRATION DIRECTORCPF: 588.584.748-72
Luiz Felipe Dutra de SousaACCOUNTANT CRC RJ 64386/O-3CPF: 796.164.107-68
Cleide Barbosa da RochaACTUARY MIBA 732CPF: 878.098.777-04
R$ thousand
Annual Report PREVI 2013 41

DESCRIPTION (Note 23) 2013 2012 Variation (%)
A) Equity - start of fiscal year 143,770,075 135,763,356 5.9
1. Additions 16,380,805 22,115,162 (25.9)(+) Social Security Contributions (*) 3,824,422 3,195,773 19.7 (+) Positive Result of Investments - Social Security Management 12,151,432 18,558,289 (34.5)(+) Reversal of Contingencies - Social Security Management 65,154 0 0.0 (+) Administrative Revenue 250,102 219,822 13.8 (+) Positive Result of Investments - Administrative Management 30,201 91,810 (67.1)(+) Constitution of Investment Funds 59,494 49,468 20.3
2. Destinations (15,177,542) (14,108,443) 7.6 (-) Benefits (14,873,982) (13,767,952) 8.0 (-) Constitution of Contingencies - Social Security Management 0 (87,631) 0.0 (-) Administrative Expenses (287,859) (235,570) 22.2 (-) Constitution of Contingencies - Administrative Management (15,701) (17,290) (9.2)
3. Addition/Reduction on Equity (1+2) 1,203,263 8,006,719 (85.0)(+/-) Mathematical Provisions 9,858,360 8,654,239 13.9 (+/-) Technical Surplus (Deficit) of Fiscal Year (2,535,481) 2,629,659 (196.4)(+/-) Social Security Funds (6,155,853) (3,385,419) 81.8 (+/-) Administrative Funds (23,257) 58,772 (139.6)(+/-) Investment Funds 59,494 49,468 20.3
B) Equity - end of fiscal year (A+3) 144,973,338 143,770,075 0.8
Statement of Changes in Equity
(*) Net contributions, according to Attachment B, Resolution CNPC # 8, dated 10/31/2011.
Dan Antonio Marinho ConradoPRESIDENTCPF: 754.649.427-34
Paulo Assunção de SousaADMINISTRATION DIRECTORCPF: 588.584.748-72
Luiz Felipe Dutra de SousaACCOUNTANT CRC RJ 64386/O-3CPF: 796.164.107-68
R$ thousand
Annual Report PREVI 2013 42
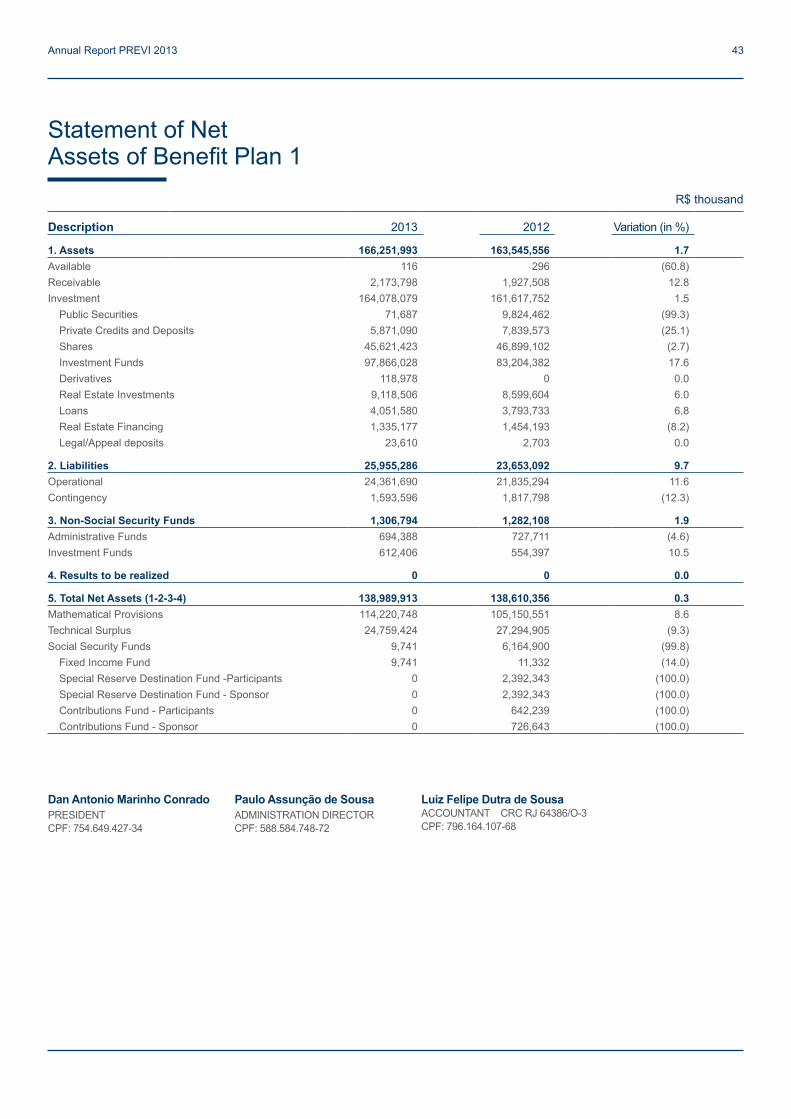
Description 2013 2012 Variation (in %)
1. Assets 166,251,993 163,545,556 1.7 Available 116 296 (60.8)Receivable 2,173,798 1,927,508 12.8 Investment 164,078,079 161,617,752 1.5
Public Securities 71,687 9,824,462 (99.3)Private Credits and Deposits 5,871,090 7,839,573 (25.1)Shares 45,621,423 46,899,102 (2.7)Investment Funds 97,866,028 83,204,382 17.6 Derivatives 118,978 0 0.0 Real Estate Investments 9,118,506 8,599,604 6.0 Loans 4,051,580 3,793,733 6.8 Real Estate Financing 1,335,177 1,454,193 (8.2)Legal/Appeal deposits 23,610 2,703 0.0
2. Liabilities 25,955,286 23,653,092 9.7 Operational 24,361,690 21,835,294 11.6 Contingency 1,593,596 1,817,798 (12.3)
3. Non-Social Security Funds 1,306,794 1,282,108 1.9 Administrative Funds 694,388 727,711 (4.6)Investment Funds 612,406 554,397 10.5
4. Results to be realized 0 0 0.0
5. Total Net Assets (1-2-3-4) 138,989,913 138,610,356 0.3 Mathematical Provisions 114,220,748 105,150,551 8.6 Technical Surplus 24,759,424 27,294,905 (9.3)Social Security Funds 9,741 6,164,900 (99.8)
Fixed Income Fund 9,741 11,332 (14.0)Special Reserve Destination Fund -Participants 0 2,392,343 (100.0)Special Reserve Destination Fund - Sponsor 0 2,392,343 (100.0)Contributions Fund - Participants 0 642,239 (100.0)Contributions Fund - Sponsor 0 726,643 (100.0)
Statement of Net Assets of Benefit Plan 1
Dan Antonio Marinho ConradoPRESIDENTCPF: 754.649.427-34
Paulo Assunção de SousaADMINISTRATION DIRECTORCPF: 588.584.748-72
Luiz Felipe Dutra de SousaACCOUNTANT CRC RJ 64386/O-3CPF: 796.164.107-68
R$ thousand
Annual Report PREVI 2013 43

DESCRIPTION 2013 2012 Variation (%)
1. Assets 4,561,935 3.771.440 21.0 Available 6 209 (97.1)Receivable 89,163 77,319 15.3 Investment 4,472,766 3,693,912 21.1
Public Securities 59,083 440,755 (86.6)Private Credits and Deposits 653,675 568,138 15.1 Shares 1,707,517 1,360,086 25.5 Investment Funds 1,457,977 796,835 83.0 Real Estate Investments 98,550 87,708 12.4 Loans 476,038 422,068 12.8 Real Estate Financing 19,926 18,322 8.8
2. Liabilities 6,361 15,390 (58.7)Operational 6,091 14,962 (59.3)Contingency 270 428 (36.9)
3. Non-Social Security Funds 94,909 82,489 15.1 Administrative Funds 85,167 74,232 14.7 Investment Funds 9,742 8,257 18.0
4. Results to be realized 0 0 0.0
5. Total Net Assets (1-2-3-4) 4,460,665 3,673,561 21.4 Mathematical Provisions 4,267,692 3,479,529 22.7 Social Security Funds 192,973 194,032 (0.5)
Protected Shares Fund 42,979 41,140 4.5 Fund to Cover Risks of Reentrance of Former Participants 19,060 18,242 4.5 Risk Management Fund 130,934 134,650 (2.8)
Statement of Net Assets of Benefit Plan PREVI Futuro
Dan Antonio Marinho ConradoPRESIDENTCPF: 754.649.427-34
Paulo Assunção de SousaADMINISTRATION DIRECTORCPF: 588.584.748-72
Luiz Felipe Dutra de SousaACCOUNTANT CRC RJ 64386/O-3CPF: 796.164.107-68
R$ thousand
Annual Report PREVI 2013 Strategy and investments 44
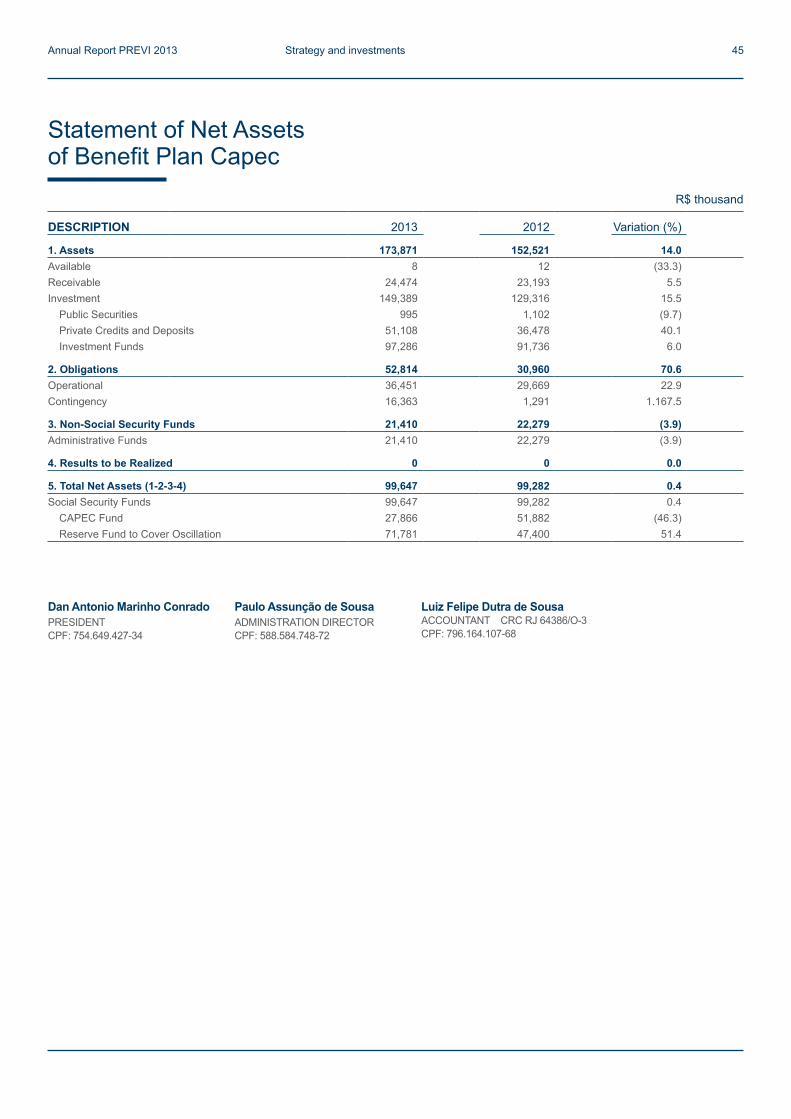
DESCRIPTION 2013 2012 Variation (%)
1. Assets 173,871 152,521 14.0 Available 8 12 (33.3)Receivable 24,474 23,193 5.5 Investment 149,389 129,316 15.5
Public Securities 995 1,102 (9.7)Private Credits and Deposits 51,108 36,478 40.1 Investment Funds 97,286 91,736 6.0
2. Obligations 52,814 30,960 70.6 Operational 36,451 29,669 22.9 Contingency 16,363 1,291 1.167.5
3. Non-Social Security Funds 21,410 22,279 (3.9)Administrative Funds 21,410 22,279 (3.9)
4. Results to be Realized 0 0 0.0
5. Total Net Assets (1-2-3-4) 99,647 99,282 0.4 Social Security Funds 99,647 99,282 0.4
CAPEC Fund 27,866 51,882 (46.3)Reserve Fund to Cover Oscillation 71,781 47,400 51.4
Statement of Net Assets of Benefit Plan Capec
Dan Antonio Marinho ConradoPRESIDENTCPF: 754.649.427-34
Paulo Assunção de SousaADMINISTRATION DIRECTORCPF: 588.584.748-72
Luiz Felipe Dutra de SousaACCOUNTANT CRC RJ 64386/O-3CPF: 796.164.107-68
R$ thousand
Annual Report PREVI 2013 Strategy and investments 45
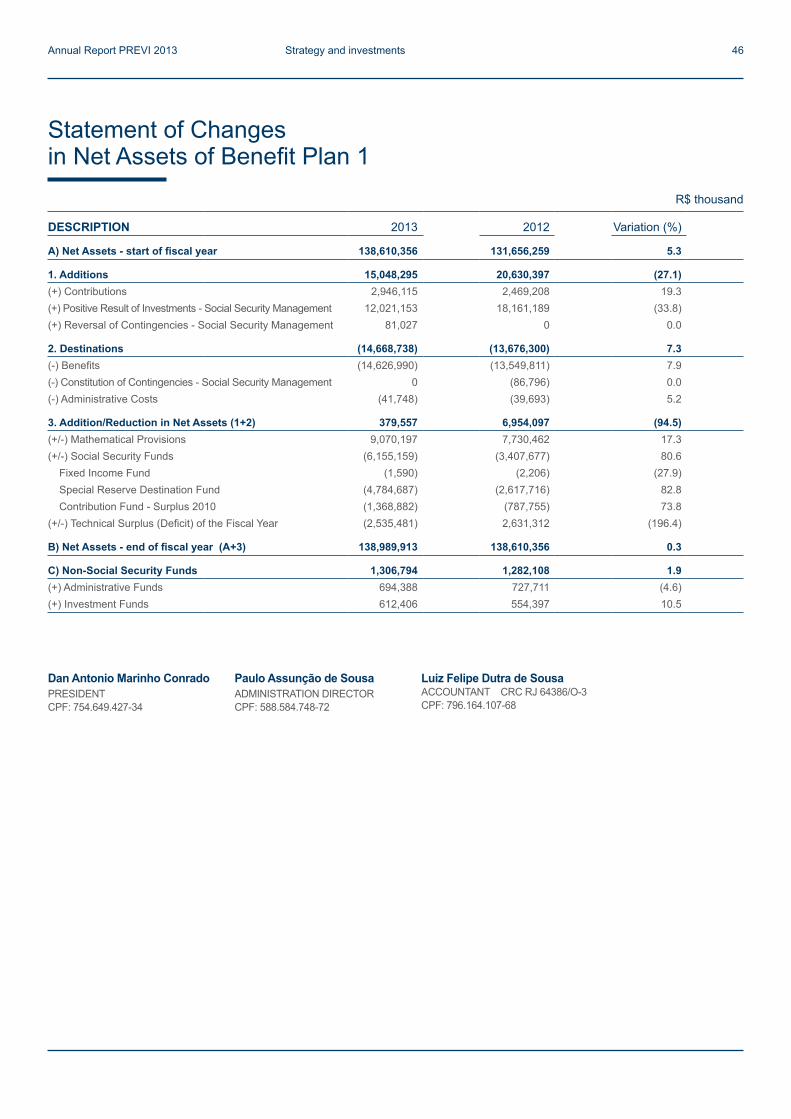
DESCRIPTION 2013 2012 Variation (%)
A) Net Assets - start of fiscal year 138,610,356 131,656,259 5.3
1. Additions 15,048,295 20,630,397 (27.1)(+) Contributions 2,946,115 2,469,208 19.3 (+) Positive Result of Investments - Social Security Management 12,021,153 18,161,189 (33.8)(+) Reversal of Contingencies - Social Security Management 81,027 0 0.0
2. Destinations (14,668,738) (13,676,300) 7.3 (-) Benefits (14,626,990) (13,549,811) 7.9 (-) Constitution of Contingencies - Social Security Management 0 (86,796) 0.0(-) Administrative Costs (41,748) (39,693) 5.2
3. Addition/Reduction in Net Assets (1+2) 379,557 6,954,097 (94.5)(+/-) Mathematical Provisions 9,070,197 7,730,462 17.3 (+/-) Social Security Funds (6,155,159) (3,407,677) 80.6
Fixed Income Fund (1,590) (2,206) (27.9)Special Reserve Destination Fund (4,784,687) (2,617,716) 82.8 Contribution Fund - Surplus 2010 (1,368,882) (787,755) 73.8
(+/-) Technical Surplus (Deficit) of the Fiscal Year (2,535,481) 2,631,312 (196.4)
B) Net Assets - end of fiscal year (A+3) 138,989,913 138,610,356 0.3
C) Non-Social Security Funds 1,306,794 1,282,108 1.9 (+) Administrative Funds 694,388 727,711 (4.6)(+) Investment Funds 612,406 554,397 10.5
Statement of Changes in Net Assets of Benefit Plan 1
Dan Antonio Marinho ConradoPRESIDENTCPF: 754.649.427-34
Paulo Assunção de SousaADMINISTRATION DIRECTORCPF: 588.584.748-72
Luiz Felipe Dutra de SousaACCOUNTANT CRC RJ 64386/O-3CPF: 796.164.107-68
R$ thousand
Annual Report PREVI 2013 Strategy and investments 46

DESCRIPTION 2013 2012 Variation (in %)
A) Net Assets - start of fiscal year 3,673,561 2,733,939 34.4
1. Additions 861,806 996,690 (13.5)(+) Contributions 740,165 611,350 21.1
(+) Portability 231 150 54.0 (+) Compensation of late contributions 0 0 0.0 (+) Other Additions 5,702 4,030 41.5
(+) Positive Result of Investments - Social Security Management 121,510 385,340 (68.5)(+) Reversal of Contingencies - Social Security Management 131 0 0.0
2. Destinations (74,702) (57,068) 30.9 (-) Benefits (45,327) (32,732) 38.5 (-) Constitution of Contingencies - Social Security Management
0 (46) 0.0
(-) Administrative Costs (29,375) (24,290) 20.9
3. Addition/Reduction in Net Assets (1+2) 787,104 939,622 (16.2)(+/-) Mathematical Provisions 788,163 923,777 (14.7)(+/-) Social Security Funds (1,059) 17,498 (106.1)
Fund to Cover Risk Oscillation 0 (110,823) 0.0Protected Shares Fund 1,840 590 211.9 Fund for Covering Risk of Reentering Former Participants 818 2,741 (70.2)Risk Management Fund (3,717) 124,990 (103.0)
(+/-) Technical Surplus (Deficit) of Fiscal Year 0 (1,653) 0.0
B) Net Assets - end of fiscal year (A+3) 4,460,665 3,673,561 21.4
C) Non-Social Security Funds 94,909 82,489 15.1 (+) Administrative Funds 85,167 74,232 14.7 (+) Investment Funds 9,742 8,257 18.0
Statement of Changes in Net Assets of Benefit Plan PREVI Futuro
Dan Antonio Marinho ConradoPRESIDENTCPF: 754.649.427-34
Paulo Assunção de SousaADMINISTRATION DIRECTORCPF: 588.584.748-72
Luiz Felipe Dutra de SousaACCOUNTANT CRC RJ 64386/O-3CPF: 796.164.107-68
R$ thousand
Annual Report PREVI 2013 47
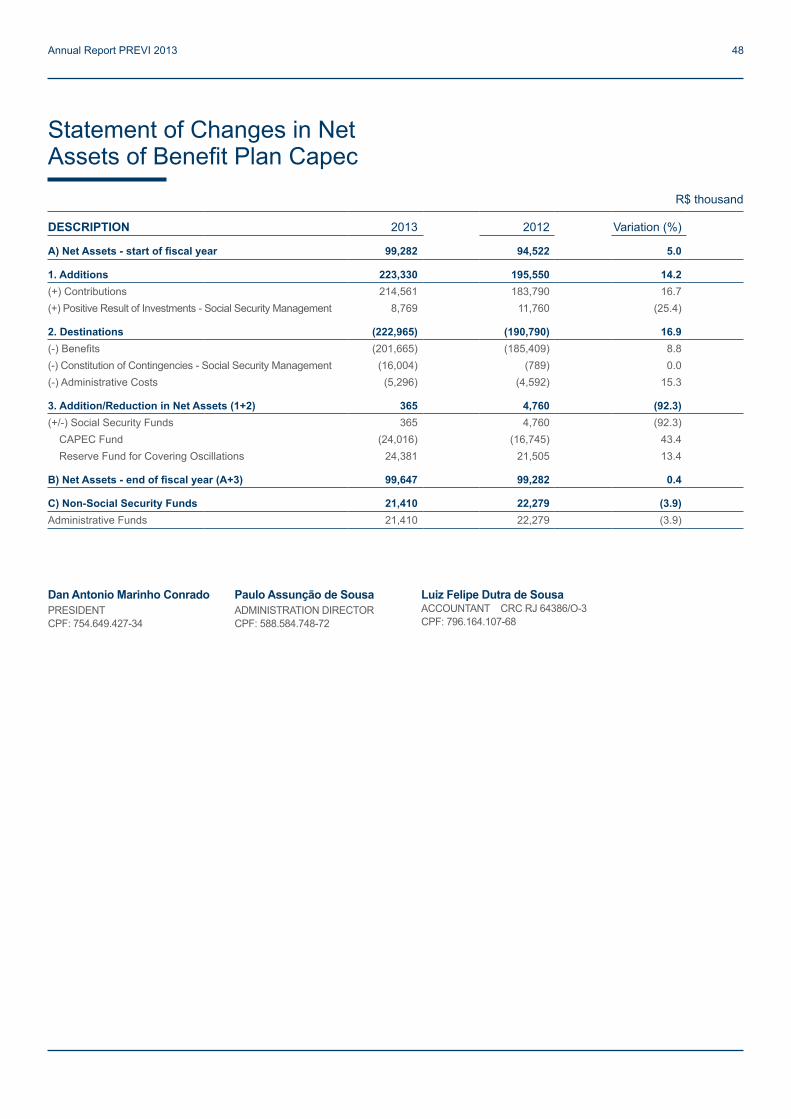
DESCRIPTION 2013 2012 Variation (%)
A) Net Assets - start of fiscal year 99,282 94,522 5.0
1. Additions 223,330 195,550 14.2 (+) Contributions 214,561 183,790 16.7 (+) Positive Result of Investments - Social Security Management 8,769 11,760 (25.4)
2. Destinations (222,965) (190,790) 16.9 (-) Benefits (201,665) (185,409) 8.8 (-) Constitution of Contingencies - Social Security Management (16,004) (789) 0.0 (-) Administrative Costs (5,296) (4,592) 15.3
3. Addition/Reduction in Net Assets (1+2) 365 4,760 (92.3)(+/-) Social Security Funds 365 4,760 (92.3)
CAPEC Fund (24,016) (16,745) 43.4 Reserve Fund for Covering Oscillations 24,381 21,505 13.4
B) Net Assets - end of fiscal year (A+3) 99,647 99,282 0.4
C) Non-Social Security Funds 21,410 22,279 (3.9)Administrative Funds 21,410 22,279 (3.9)
Statement of Changes in Net Assets of Benefit Plan Capec
Dan Antonio Marinho ConradoPRESIDENTCPF: 754.649.427-34
Paulo Assunção de SousaADMINISTRATION DIRECTORCPF: 588.584.748-72
Luiz Felipe Dutra de SousaACCOUNTANT CRC RJ 64386/O-3CPF: 796.164.107-68
R$ thousand
Annual Report PREVI 2013 48

DESCRIPTION (Note 24) 2013 2012 Variation (in %)
A) Administrative Fund of Previous Fiscal Year 824,222 765,450 7.7
1. Administrative Management Costs 280,303 311,632 (10.1)1.1. Revenue 280,303 311,632 (10.1)
Administrative Costs of Social Security Management 76,419 68,600 11.4 Administrative Costs of Investments 162,302 139,418 16.4 Administration Fee for Loans and Financing 9,070 10,041 (9.7)Direct Revenue 1,660 1,612 3.0 Positive Result of Investments 30,201 91,810 (67.1)Other Revenue 651 151 331.1
2. Administrative Expenses (303,560) (252,860) 20.1 2.1 Social Security Administration (132,188) (103,375) 27.9
Personnel and charges (55,565) (46,947) 18.4 Training / seminars and conferences (2,083) (1,401) 48.7 Travel and lodging (1,666) (1,479) 12.6 Third party services (28,469) (17,583) 61.9 General expenses (*) (26,248) (16,614) 58.0 Depreciation and amortization (2,455) (2,051) 19.7 Contingencies (15,701) (17,290) (9.2)Other Expenses (1) (10) (90.0)
2.2 Administration of Investments (171,371) (149,460) 14.7 Personnel and charges (102,576) (86,236) 18.9 Training / seminars and conferences (2,381) (1,633) 45.8 Travel and lodging (1,040) (965) 7.8 Third party services (27,253) (30,697) (11.2)General expenses (*) (34,606) (26,836) 29.0 Depreciation and amortization (3,512) (3,024) 16.1 Other Expenses (3) (69) (95.7)
2.3 Assistance Administration 0 0 0.0 2.4 Reversal of Resources to Benefit Plan (1) (25) (96.0)
3. Negative Result of Investments 0 0 0.0
4. Leftover/Insufficiency of Administrative Management (1-2-3) (23,257) 58,772 (139.6)
5. Constitution/Reversal of Administrative Fund (4) (23,257) 58,772 (139.6)
B) Administrative Fund of Current Fiscal Year (A+5) 800,965 824,222 (2.8)
Administrative Management Plan Statement (Consolidated)
(*) Includes expenses with rental and maintenance for headquarters, software maintenance, publications, legal and notary office expenses and electronic information.
Dan Antonio Marinho ConradoPRESIDENTCPF: 754.649.427-34
Paulo Assunção de SousaADMINISTRATION DIRECTORCPF: 588.584.748-72
Luiz Felipe Dutra de SousaACCOUNTANT CRC RJ 64386/O-3CPF: 796.164.107-68
R$ thousand
Annual Report PREVI 2013 49
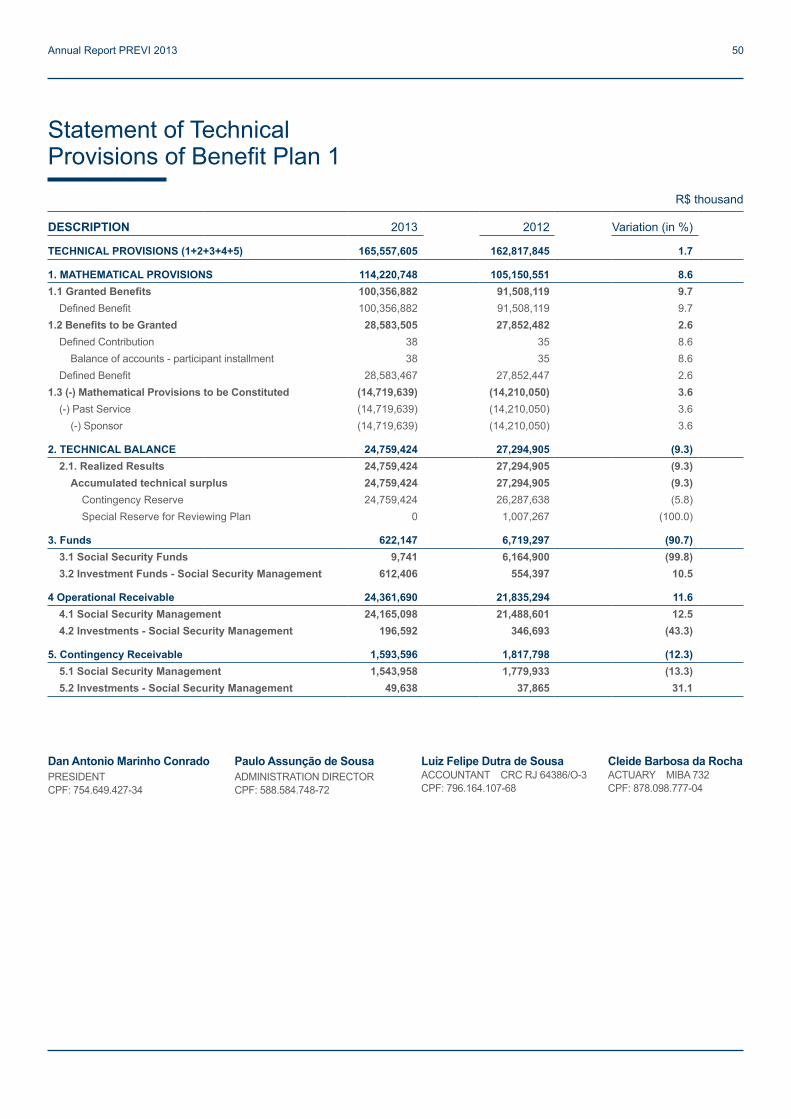
DESCRIPTION 2013 2012 Variation (in %)
TECHNICAL PROVISIONS (1+2+3+4+5) 165,557,605 162,817,845 1.7
1. MATHEMATICAL PROVISIONS 114,220,748 105,150,551 8.6 1.1 Granted Benefits 100,356,882 91,508,119 9.7
Defined Benefit 100,356,882 91,508,119 9.7 1.2 Benefits to be Granted 28,583,505 27,852,482 2.6
Defined Contribution 38 35 8.6 Balance of accounts - participant installment 38 35 8.6
Defined Benefit 28,583,467 27,852,447 2.6 1.3 (-) Mathematical Provisions to be Constituted (14,719,639) (14,210,050) 3.6
(-) Past Service (14,719,639) (14,210,050) 3.6 (-) Sponsor (14,719,639) (14,210,050) 3.6
2. TECHNICAL BALANCE 24,759,424 27,294,905 (9.3)2.1. Realized Results 24,759,424 27,294,905 (9.3)
Accumulated technical surplus 24,759,424 27,294,905 (9.3)Contingency Reserve 24,759,424 26,287,638 (5.8)Special Reserve for Reviewing Plan 0 1,007,267 (100.0)
3. Funds 622,147 6,719,297 (90.7)3.1 Social Security Funds 9,741 6,164,900 (99.8)3.2 Investment Funds - Social Security Management 612,406 554,397 10.5
4 Operational Receivable 24,361,690 21,835,294 11.6 4.1 Social Security Management 24,165,098 21,488,601 12.5 4.2 Investments - Social Security Management 196,592 346,693 (43.3)
5. Contingency Receivable 1,593,596 1,817,798 (12.3)5.1 Social Security Management 1,543,958 1,779,933 (13.3)5.2 Investments - Social Security Management 49,638 37,865 31.1
Statement of Technical Provisions of Benefit Plan 1
Dan Antonio Marinho ConradoPRESIDENTCPF: 754.649.427-34
Paulo Assunção de SousaADMINISTRATION DIRECTORCPF: 588.584.748-72
Luiz Felipe Dutra de SousaACCOUNTANT CRC RJ 64386/O-3CPF: 796.164.107-68
Cleide Barbosa da RochaACTUARY MIBA 732CPF: 878.098.777-04
R$ thousand
Annual Report PREVI 2013 50
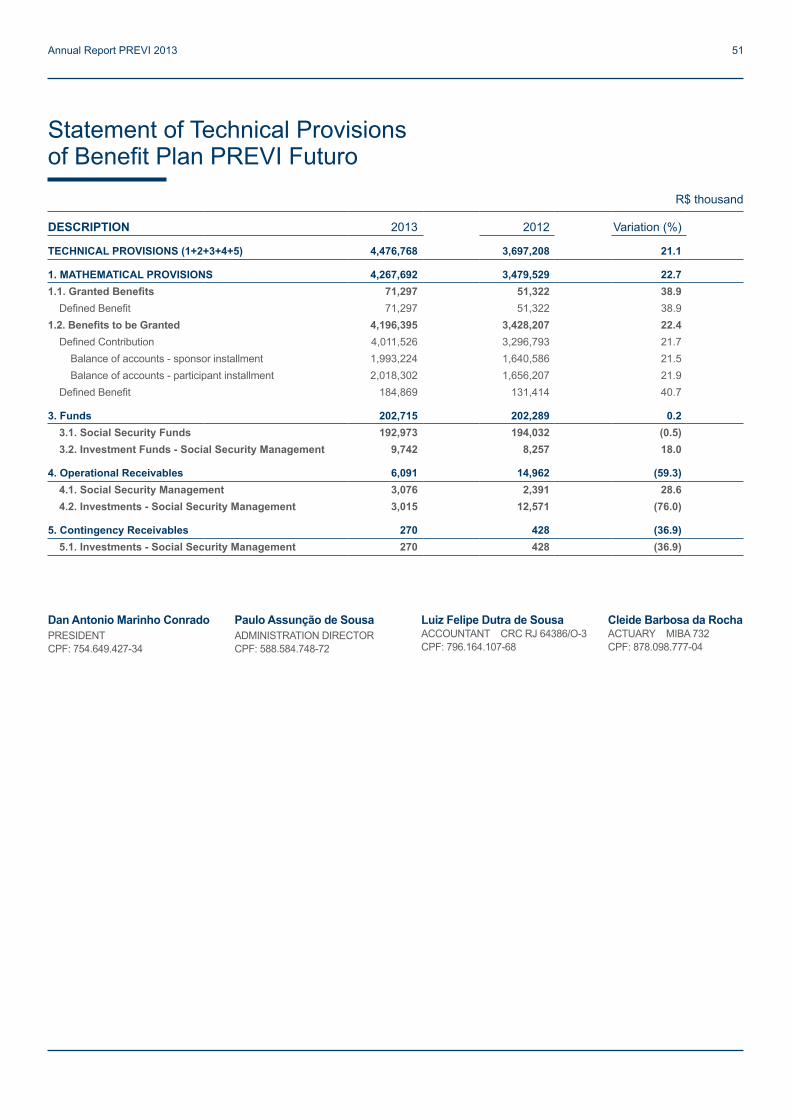
DESCRIPTION 2013 2012 Variation (%)
TECHNICAL PROVISIONS (1+2+3+4+5) 4,476,768 3,697,208 21.1
1. MATHEMATICAL PROVISIONS 4,267,692 3,479,529 22.7 1.1. Granted Benefits 71,297 51,322 38.9
Defined Benefit 71,297 51,322 38.9 1.2. Benefits to be Granted 4,196,395 3,428,207 22.4
Defined Contribution 4,011,526 3,296,793 21.7 Balance of accounts - sponsor installment 1,993,224 1,640,586 21.5 Balance of accounts - participant installment 2,018,302 1,656,207 21.9
Defined Benefit 184,869 131,414 40.7
3. Funds 202,715 202,289 0.2 3.1. Social Security Funds 192,973 194,032 (0.5)3.2. Investment Funds - Social Security Management 9,742 8,257 18.0
4. Operational Receivables 6,091 14,962 (59.3)4.1. Social Security Management 3,076 2,391 28.6 4.2. Investments - Social Security Management 3,015 12,571 (76.0)
5. Contingency Receivables 270 428 (36.9)5.1. Investments - Social Security Management 270 428 (36.9)
Statement of Technical Provisions of Benefit Plan PREVI Futuro
Dan Antonio Marinho ConradoPRESIDENTCPF: 754.649.427-34
Paulo Assunção de SousaADMINISTRATION DIRECTORCPF: 588.584.748-72
Luiz Felipe Dutra de SousaACCOUNTANT CRC RJ 64386/O-3CPF: 796.164.107-68
Cleide Barbosa da RochaACTUARY MIBA 732CPF: 878.098.777-04
R$ thousand
Annual Report PREVI 2013 51
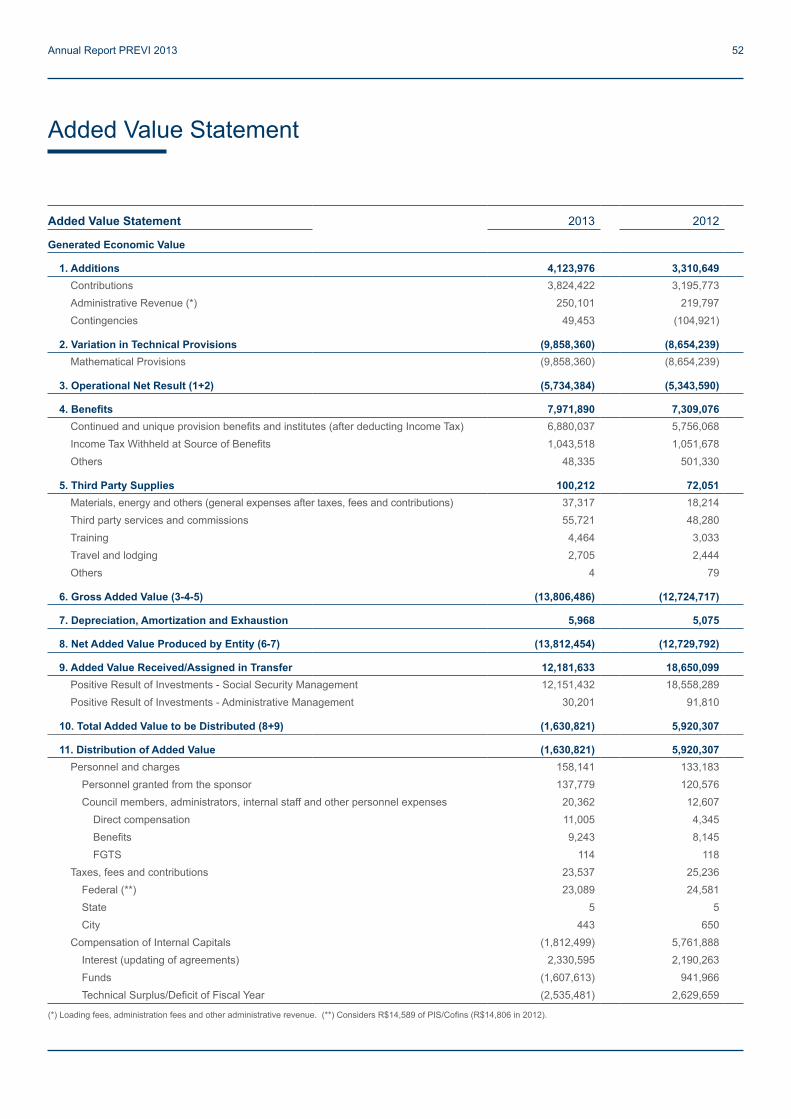
Added Value Statement
Added Value Statement 2013 2012
Generated Economic Value
1. Additions 4,123,976 3,310,649Contributions 3,824,422 3,195,773Administrative Revenue (*) 250,101 219,797Contingencies 49,453 (104,921)
2. Variation in Technical Provisions (9,858,360) (8,654,239)Mathematical Provisions (9,858,360) (8,654,239)
3. Operational Net Result (1+2) (5,734,384) (5,343,590)
4. Benefits 7,971,890 7,309,076Continued and unique provision benefits and institutes (after deducting Income Tax) 6,880,037 5,756,068Income Tax Withheld at Source of Benefits 1,043,518 1,051,678Others 48,335 501,330
5. Third Party Supplies 100,212 72,051Materials, energy and others (general expenses after taxes, fees and contributions) 37,317 18,214Third party services and commissions 55,721 48,280Training 4,464 3,033Travel and lodging 2,705 2,444Others 4 79
6. Gross Added Value (3-4-5) (13,806,486) (12,724,717)
7. Depreciation, Amortization and Exhaustion 5,968 5,075
8. Net Added Value Produced by Entity (6-7) (13,812,454) (12,729,792)
9. Added Value Received/Assigned in Transfer 12,181,633 18,650,099Positive Result of Investments - Social Security Management 12,151,432 18,558,289Positive Result of Investments - Administrative Management 30,201 91,810
10. Total Added Value to be Distributed (8+9) (1,630,821) 5,920,307
11. Distribution of Added Value (1,630,821) 5,920,307Personnel and charges 158,141 133,183
Personnel granted from the sponsor 137,779 120,576Council members, administrators, internal staff and other personnel expenses 20,362 12,607
Direct compensation 11,005 4,345Benefits 9,243 8,145FGTS 114 118
Taxes, fees and contributions 23,537 25,236Federal (**) 23,089 24,581State 5 5City 443 650
Compensation of Internal Capitals (1,812,499) 5,761,888Interest (updating of agreements) 2,330,595 2,190,263Funds (1,607,613) 941,966Technical Surplus/Deficit of Fiscal Year (2,535,481) 2,629,659
(*) Loading fees, administration fees and other administrative revenue. (**) Considers R$14,589 of PIS/Cofins (R$14,806 in 2012).
Annual Report PREVI 2013 52
Annual Report PREVI 2013 53
PublishingPREVI – Department of Communications and Marketing
GRI consulting, text, and editingReport Sustentabilidade
ReviewingAssertiva Produções Editoriais
TranslationEstado da Arte Produções Gráficas Ltda.
Projeto gráfico e diagramaçãoReport Sustentabilidade
Pictures PREVI Image Bank
Credits