annual report - power corporation of canada · businesses and investments which can generate...
TRANSCRIPT

Annual Report 2 0 1 1

This Annual Report is intended to provide interested shareholders and other interested persons with selected information concerning Power Corporation of Canada. For further information concerning the Corporation, shareholders and other interested persons should consult the Corporation’s disclosure documents, such as its Annual Information Form and Management’s Discussion and Analysis. Copies of the Corporation’s continuous disclosure documents can be obtained at www.sedar.com, on the Corporation’s website at www.powercorporation.com, or from the Office of the Secretary at the addresses shown at the end of this report.
Readers should also review the note further in this report, in the section entitled Review of Financial Performance, concerning the use of Forward-Looking Statements, which applies to the entirety of this Annual Report.
In addition, selected information concerning the business, operations, financial condition, financial performance, priorities, ongoing objectives, strategies and outlook of Power Corporation of Canada’s subsidiaries and associates is derived from public information published by such subsidiaries and associates and is provided here for the convenience of the shareholders of Power Corporation of Canada. For further information concerning such subsidiaries and associates, shareholders and other interested persons should consult the websites of, and other publicly available information published by, such subsidiaries and associates.
The following abbreviations are used throughout this report: Power Corporation of Canada (Power Corporation or the Corporation); Arkema Inc. (Arkema); CITIC Pacific Limited (CITIC Pacific); Gesca ltée (Gesca); Great-West Life & Annuity Insurance Company (Great-West Life & Annuity or GWL&A); Great-West Lifeco Inc. (Great-West Lifeco or Lifeco); Groupe Bruxelles Lambert (GBL); IGM Financial Inc. (IGM Financial or IGM); Imerys S.A. (Imerys); Investment Planning Counsel Inc. (Investment Planning Counsel); Investors Group Inc. (Investors Group); Lafarge S.A. (Lafarge); London Life Insurance Company (London Life); Mackenzie Financial Corporation (Mackenzie Financial or Mackenzie); Pargesa Holding SA (Pargesa); Parjointco N.V. (Parjointco); Pernod Ricard S.A. (Pernod Ricard); Power Financial Corporation (Power Financial); Putnam Investments, LLC (Putnam Investments or Putnam); Square Victoria Digital Properties Inc. (Square Victoria Digital Properties or SVDP); Suez Environnement Company (Suez Environnement); The Canada Life Assurance Company (Canada Life); The Great-West Life Assurance Company (Great-West Life); Total S.A. (Total); Victoria Square Ventures Inc. (Victoria Square Ventures or VSV). In addition, IFRS refers to International Financial Reporting Standards.

P O W E R C O R P O R A T I O N O F C A N A D A 2 0 11 A N N U A L R E P O R T 1
Financial HighlightsFOR THE YEARS ENDED DECEMBER 31[IN MILLIONS OF CANADIAN DOLL ARS, EXCEPT PER SHARE AMOUNTS] 2011 2010
Revenues 32,912 32,820
Operating earnings attributable to participating shareholders 1,152 957
Operating earnings per participating share 2.50 2.09
Net earnings attributable to participating shareholders 1,075 727
Net earnings per participating share 2.34 1.59
Dividends paid per participating share 1.16 1.16
Consolidated assets 255,496 247,526
Consolidated assets and assets under management 499,599 503,063
Shareholders’ equity 9,825 9,430
Total equity 25,035 23,851
Book value per participating share 19.67 18.85
Participating shares outstanding (in millions) 459.9 458.6
The Corporation uses operating earnings as a performance measure in analyzing its financial performance. For a discussion of the Corporation’s use of non‑IFRS financial measures, please refer to the Review of Financial Performance section in this Annual Report.
TABLE OF CONTENTS
Financial Highlights 1Group Organization Chart 2Corporate Profile 3Directors’ Report to Shareholders 6Responsible Management 16Review of Financial Performance 18Consolidated Financial Statements and Notes 34Five‑Year Financial Summary 103Board of Directors 104Officers 105Corporate Information 106
PCC AR ENG REW 2012–04–02 14:36 bleu

P O W E R C O R P O R A T I O N O F C A N A D A 2 0 11 A N N U A L R E P O R T2
GroupOrganizationChart
Percentages denote year‑end equity interest.
[1] Through its wholly owned subsidiary, Power Financial Europe B.V., Power Financial held a 50 per cent interest in Parjointco. Parjointco held a voting interest of 76.0 per cent and an equity interest of 56.5 per cent in Pargesa.
[2] Together, 65 per cent direct and indirect voting interest.
[3] Denotes voting interest.
68.2% [2]
Power Corporation of Canada
POWER FINANCIAL CORPORATION
SQUARE VICTORIA COMMUNICATIONS GROUP INC.
[1]
PARGESA HOLDING SA GREAT-WEST LIFECO INC.
100%THE GREAT-WEST LIFE ASSURANCE COMPANY
100%LONDON LIFE INSURANCE COMPANY
100%THE CANADA LIFE ASSURANCE COMPANY
100%GREAT-WEST LIFE & ANNUITY INSURANCE COMPANY
100% [3]
PUTNAMINVESTMENTS, LLC
INVESTMENTS
4.0% [2]
66.1% 100%

P O W E R C O R P O R A T I O N O F C A N A D A 2 0 11 A N N U A L R E P O R T 3
Incorporated in 1925, Power Corporation is a diversified international management and holding company with interests in companies in the financial services, communications and other business sectors.
Corporate Profile
IGM FINANCIAL INC.
100%INVESTORSGROUP INC.
100%MACKENZIE FINANCIAL CORPORATION
93.9%INVESTMENT PLANNINGCOUNSEL INC.
3.6%
57.6%
PCC AR ENG REW 2012–04–02 14:36 bleu

P O W E R C O R P O R A T I O N O F C A N A D A 2 0 11 A N N U A L R E P O R T4
POWER CORPORATION HOLDS DIRECT OR INDIRECT INTERESTS IN:
POWER FINANCIAL CORPORATIONPower Financial holds the controlling interest in Great-West Lifeco and IGM Financial. Power Financial
and the Frère group each hold a 50 per cent interest in Parjointco, which holds their interest in Pargesa.
GREAT-WEST L IFECO INC.is an international financial services holding company with interests in life insurance, health insurance,
retirement and investment services, asset management and reinsurance businesses. The company
has operations in Canada, the United States, Europe and Asia through Great-West Life, London Life,
Canada Life, Great-West Life & Annuity and Putnam Investments. Great-West Lifeco and its companies
have over $502 billion in assets under administration.
GREAT-WEST LIFE
is a leading Canadian insurer, with interests
in life insurance, health insurance, investment,
savings and retirement income, and reinsurance
businesses, primarily in Canada and Europe.
In Canada, Great-West Life and its subsidiaries,
London Life and Canada Life, offer a broad
portfolio of financial and benefit plan solutions
and serve the financial security needs of more
than 12 million people.
LONDON LIFE
offers financial security advice and planning
through its more than 3,150-member
Freedom 55 Financial™ division.
Freedom 55 Financial offers London Life’s
own brand of investments, savings and
retirement income, annuities, life insurance
and mortgage products, and a broad range
of financial products from other financial
institutions. London Life participates
in international reinsurance markets through
London Reinsurance Group.
CANADA LIFE
provides insurance and wealth management
products and services in Canada, the United
Kingdom, Isle of Man, Ireland and Germany.
Canada Life is a leading provider of traditional
mortality, structured and annuity reinsurance
solutions for life insurers in the United States
and in international markets through its
Reinsurance division.
GREAT-WEST LIFE & ANNUITY
operates in the United States, administering
retirement savings plans for employees in the
public/non-profit and corporate sectors, offering
fund management, investment and advisory
services, and providing individual retirement
accounts, life insurance, annuities, business-owned
life insurance and executive benefits products.
PUTNAM INVESTMENTS
is a Boston-based global asset manager and
retirement plan provider with 75 years of
investment experience. The company had
US$117 billion in assets under management at
December 31, 2011. In addition to over 80 retail
mutual funds, the firm offers a full range of
investment and retirement products and services
for advisors and their clients, institutional
investors and plan sponsors.
CorporateProfile( C O N T I N U E D )

P O W E R C O R P O R A T I O N O F C A N A D A 2 0 11 A N N U A L R E P O R T 5
IGM FINANCIALis one of Canada’s premier personal financial services companies, and one of the country’s largest
managers and distributors of mutual funds and other managed asset products, with over $118 billion
in total assets under management at December 31, 2011. The company serves the financial needs of
Canadians through multiple distinct businesses, including Investors Group, Mackenzie Financial and
Investment Planning Counsel.
INVESTORS GROUP
provides comprehensive planning, advice,
and services, including investment, retirement,
estate and tax planning, through a network
of approximately 4,600 consultants to nearly
one million Canadians. Investors Group offers
investment management, securities, insurance,
mortgage and other financial services to its clients
through integrated financial planning.
MACKENZIE FINANCIAL
is a multidimensional financial services company
with more than 150 mutual funds and is recognized
as one of Canada’s premier investment managers,
providing investment advisory and related services
in North America.
PARGESA GROUPholds significant impact ownership positions in six large industrial companies based in Europe: Lafarge
(cement and building materials), Imerys (industrial minerals), Total (oil and gas), GDF Suez (electricity and
gas), Suez Environnement (water and waste management) and Pernod Ricard (wines and spirits).
COMMUNICATIONS AND MEDIA
SQUARE V ICTORIA COMMUNICATIONS GROUP is a wholly owned subsidiary of Power Corporation. It holds interests in Gesca and Square Victoria
Digital Properties.
GESCA
is a wholly owned subsidiary and, through
its subsidiaries, is engaged in the publication of
the French-language national newspaper La Presse
and six other daily newspapers in the provinces
of Québec and Ontario. Through a subsidiary,
Gesca also operates LaPresse.ca, a leading
Canadian French-language news website.
SQUARE VICTORIA DIGITAL PROPERTIES
is a wholly owned subsidiary which, directly
or through subsidiaries, holds interests in
several digital businesses and is engaged
in television production.
INVESTMENTSIn addition to the foregoing, Power Corporation holds impact ownership investments in Asia,
wholly owned investment businesses in China, Europe, and the United States, as well as specific
investment funds.
PCC AR ENG REW 2012–04–02 14:36 bleu

P O W E R C O R P O R A T I O N O F C A N A D A 2 0 11 A N N U A L R E P O R T6
Directors’ Report to Shareholders
The Power Corporation family of companies and investments had a very
strong year in 2011, with stable results from the financial services businesses
and a meaningful contribution from investing activities. While 2011 showed
continued progress in global economic recovery, the year was nonetheless
challenging. Interest rates were low and the economy and equity markets showed
progress during the first half. This largely reversed itself during the second
half of the year. Our results indicate that we have the risk-management
culture, capital and liquidity to navigate these economic conditions successfully
and that investment gains represent an attractive upside to our business.
2 0 1 1
$499.6BILLION
$1,152MILLION
$574MILLION
CONSOLIDATED ASSETS AND
ASSETS UNDER MANAGEMENT
OPERATING EARNINGS
ATTRIBUTABLE TO PARTICIPATING
SHAREHOLDERS
DIVIDENDS DECLARED
13.0% $2.50 $1.16
RETURN ON EQUITY
BASED ON OPERATING EARNINGS
OPERATING EARNINGS
PER PARTICIPATING
SHARE
DIVIDENDS DECLARED
PER PARTICIPATING
SHARE
Mission
Enhancing shareholder value by actively managing operating businesses and investments which can generate long-term, sustainable growth in earnings and dividends. Value is best achieved through a prudent approach to risk and through responsible corporate citizenship. Power Corporation aims to act like an owner with a long-term perspective and a strategic vision anchored in strong core values.

P O W E R C O R P O R A T I O N O F C A N A D A 2 0 11 A N N U A L R E P O R T 7
Power Corporation’s financial services companies are focused on providing protection, asset management,
and retirement savings products and services. We continue to believe that the demographic trends affecting
retirement savings, coupled with strong evidence that advice from a qualified financial advisor creates added value
for our clients, reinforce the soundness of our strategy of building an advice-based multi-channel distribution
platform in North America. Our companies continue to benefit from the strength of our approach to balance
sheet management, our sustainable risk-management culture, credit investing skills and the resilience of our
distribution channels. We believe that this approach has produced industry-leading results at Great-West Lifeco
and IGM Financial, not to mention a resilient portfolio of high-quality companies in the Pargesa group.
In 2011, our investment activities demonstrated their return potential. By applying the Power Corporation
investment principles and taking advantage of the Corporation’s expertise, knowledge and relationships,
these businesses provided superior returns and diversification. The Sagard funds, whose management
entities are wholly owned by Power Corporation, all performed well in 2011. They consist of Sagard Europe,
which focuses on European private equity and harvested some noticeable gains in 2011, Sagard Capital, which
invests in core shareholder stakes in small and mid-size companies in the United States, and Sagard China,
which actively manages Chinese “A”, “B”, and “H” share equity holdings. Power’s North American Limited
Partnership investments also produced attractive returns. The most notable addition to our investment
activities during the year was the acquisition of a 10 per cent stake in China Asset Management Co. Ltd.,
which was finalized in December.
FINANCIAL RESULTSPower Corporation of Canada’s operating earnings attributable to participating shareholders were $1,152 million
or $2.50 per participating share for the year ended December 31, 2011, compared with $957 million or $2.09 per
share in 2010. This represents an increase of 19.9 per cent on a per share basis.
Subsidiaries contributed $1,150 million to Power Corporation’s operating earnings for the twelve-month period
ended December 31, 2011, compared with $1,097 million in the corresponding period in 2010, an increase of
4.8 per cent. Results from corporate activities represented a contribution of $43 million in the twelve-month
period ended December 31, 2011, compared with a net charge of $99 million in the same period in 2010.
Other items, not included in operating earnings, were a charge of $77 million in 2011. Other items in the
corresponding period in 2010 were a charge of $230 million. Other items in 2011 represents the Corporation’s
share of other items of Power Financial as discussed below, as well as a non-cash impairment charge of
$72 million related to the Corporation’s investment in CITIC Pacific.
As a result, net earnings attributable to participating shareholders were $1,075 million or $2.34 per share for
2011, compared with $727 million or $1.59 per share in the corresponding period in 2010.
Dividends paid totalled $1.16 per share in 2011, unchanged from 2010.
PCC AR ENG REW 2012–04–02 14:36 bleu

P O W E R C O R P O R A T I O N O F C A N A D A 2 0 11 A N N U A L R E P O R T8
GROUP COMPANIES’ RESULTS
POWER F INANCIAL CORPORATIONPower Financial’s operating earnings attributable to common shareholders for the year ended December 31, 2011
were $1,729 million or $2.44 per share, compared with $1,625 million or $2.30 per share in the corresponding
period in 2010. This represents an increase of 6.2 per cent on a per share basis.
The increase in operating earnings reflects primarily the increase in the contribution from the Corporation’s
subsidiaries, Great-West Lifeco and IGM Financial.
For the twelve-month period ended December 31, 2011, other items represented a charge of $7 million,
compared with a charge of $157 million in the corresponding period in 2010.
Other items in 2011 include a contribution of $88 million representing Power Financial’s share of non-operating
earnings of Great-West Lifeco. In the fourth quarter of 2011, Great-West Lifeco re-evaluated and reduced the
litigation provision established in the third quarter of 2010, which positively impacted Great-West Lifeco’s
common shareholders’ net earnings for 2011 by $223 million. Additionally, Great-West Lifeco established
a provision of $99 million in respect of the settlement of litigation relating to its ownership in a U.S.-based
private equity firm.
Other items in 2011 also include a charge of $133 million representing Power Financial’s share of GBL’s
€650 million write-down of its investment in Lafarge.
Including other items, net earnings attributable to common shareholders were $1,722 million or $2.43 per
share for the year ended December 31, 2011, compared with $1,468 million or $2.08 per share in 2010.
Dividends paid by Power Financial Corporation totalled $1.40 per common share in 2011, unchanged from 2010.
Directors’ Report to Shareholders( C O N T I N U E D )
POWER CORPORATION
OPERATING EARNINGS
Per share, in dollars
3.25
2.50
1.75
1.00
2007
2.703.12
PREVIOUS CANADIAN GAAP
1.81 2.09 2.50
2008 2009 2010 2011
IFR S

P O W E R C O R P O R A T I O N O F C A N A D A 2 0 11 A N N U A L R E P O R T 9
GREAT-WEST L IFECOGreat-West Lifeco’s financial condition remains very solid as a result of its continued strong performance in 2011.
The company delivered superior results compared to peer companies in its industry due to strong organic
growth of premiums and deposits, and solid investment performance, despite challenging market conditions.
Great-West Lifeco reported operating earnings attributable to common shareholders of $1,898 million for 2011,
compared with $1,819 million for 2010. Great-West Lifeco’s return on equity (ROE) of 16.6 per cent on operating
earnings and 17.6 per cent on net earnings for the twelve months ended December 31, 2011 continued to rank
among the strongest in the financial services sector.
Other measures of Great-West Lifeco’s performance in 2011 include:
> Premiums and deposits of $62.3 billion, compared with $59.1 billion in 2010.
> An increase in general fund and segregated fund assets from $229.4 billion to $238.8 billion in 2011.
> Total assets under administration at December 31, 2011 of $502 billion, compared to approximately $487 billion
a year ago.
The dividend on Great-West Lifeco’s common shares remained unchanged in 2011.
Great-West Lifeco’s capital position remains very strong. The Minimum Continuing Capital and Surplus
Requirements (MCCSR) ratio for Great-West Life was 204 per cent on a consolidated basis at December 31, 2011.
This measure of capital strength remains at the upper end of the target operating range.
At December 31, 2011, Great-West Lifeco held cash and cash equivalents of approximately $600 million, the net
result of capital transactions since the third quarter of 2008. As this cash is held at Great-West Lifeco, it is not
reflected in the regulatory capital ratios of its operating subsidiaries. It augments Great-West Lifeco’s capital
and liquidity position, thereby enhancing the company’s capability to take advantage of market opportunities.
In Canada, Great-West Lifeco’s companies maintained leading market positions in their individual and group
businesses. Individual insurance sales in Canada increased 6 per cent and sales of proprietary retail investment
funds increased 3 per cent year over year. The Canadian operations have experienced strong organic growth by
focusing on diversified distribution, prudent product and service enhancements, and expense management.
POWER CORPORATIONTOTAL ASSETS
UNDER ADMINISTRATION
In billions of dollars
650
550
450
350
2007
544619
PREVIOUS CANADIAN GAAP
579 616 621
2008 2009 2010 2011
IFR S
PCC AR ENG REW 2012–04–02 14:36 bleu

P O W E R C O R P O R A T I O N O F C A N A D A 2 0 11 A N N U A L R E P O R T10
Group retirement services recorded strong growth and group insurance continued to experience strong
persistency, while individual segregated funds and mutual funds maintained positive net cash flows.
Together, Great-West Lifeco’s operating companies remain Canada’s number one provider of individual
insurance solutions.
In the United States, Great-West Lifeco’s Financial Services businesses continued to post solid results in 2011.
While overall sales were down from 2010’s record-setting year, a focus on expanded distribution and diverse
product offerings contributed to a 23 per cent increase in corporate 401(k) plan sales and a strong jump in
regional and national business-owned life insurance cases in 2011.
In 2011, Putnam continued to rebuild its brand and position in the marketplace by focusing on investment
performance and innovation, and introduced new ways for investors to cope with volatile markets. For
example, the firm launched the Putnam Dynamic Risk Allocation Fund, which it believes may achieve
higher returns than a traditional balanced fund with approximately the same volatility and risk. Putnam
also established itself as one of the leaders in using social media as a means to interact with its clients and
strengthen its brand.
In Europe, Great-West Lifeco has operations through Canada Life in the United Kingdom, Isle of Man, Ireland
and Germany.
In 2011, the company continued to face a challenging credit environment as well as a general loss of consumer
confidence in investments due to volatility in equity markets. These pressures continued to affect sales
volumes. Earnings were again impacted by the required strengthening of reserves for future asset default
risk and asset impairments. The earnings impact was somewhat mitigated by both the company’s credit
risk reduction activities and the opportunity for yield enhancement of gilt holdings (U.K. government-issued
securities) due to wider credit spreads.
IGM FINANCIALIGM Financial and its operating companies experienced an increase in net earnings in 2011. Average total
assets under management increased year over year.
Investors Group and Mackenzie Financial, the company’s principal businesses, continued to generate business
growth through product innovation, investment management, resource management, and distribution
expansion throughout the year.
Operating earnings available to common shareholders for the year ended December 31, 2011 were $833 million
or $3.22 per share, compared with $759 million or $2.89 per share in 2010.
Net earnings available to common shareholders, including other items, for the year ended December 31, 2011
were $901 million or $3.48 per share, compared with $731 million or $2.78 per share in 2010.
Total assets under management at December 31, 2011 totalled $118.7 billion, compared with $129.5 billion
at December 31, 2010, a decrease of 8.3 per cent. The decrease was driven primarily by declining stock market
levels in the last half of the year.
Dividends were $2.10 per share for the year, up from $2.05 in the prior year.
Directors’ Report to Shareholders( C O N T I N U E D )
P O W E R C O R P O R A T I O N O F C A N A D A 2 0 11 A N N U A L R E P O R T 11
The Investors Group consultant network continued to expand by opening five new region offices during 2011.
The company now has 106 region offices across Canada. There were 4,608 consultants at December 31, 2011.
Investors Group mutual fund assets under management were $57.7 billion at the end of 2011, compared
with $61.8 billion in 2010. Mutual fund sales were $6.0 billion, compared with mutual fund sales in 2010 of
$5.7 billion. The redemption rate on long-term mutual funds for 2011 was 8.8 per cent, compared to 8.3 per cent
at December 31, 2010. Net sales of mutual funds in 2011 were $39 million.
Investors Group continued to respond to the complex financial needs of its clients by delivering a diverse range
of products and services in the context of personalized financial advice. Throughout the year, consultants
worked with clients to help them understand the impact of financial market volatility on their long-term
financial planning.
Mackenzie’s total assets under management were $61.7 billion at the end of 2011, compared with $68.3 billion
at December 31, 2010. Total sales were $10.3 billion, down from the prior year’s level of $12.2 billion. Total net
redemptions for the year were $2.5 billion, compared with $1.5 billion in 2010.
Mackenzie maintained its focus on delivering consistent long-term investment performance true to the
multiple styles deployed in the investment process, while emphasizing product innovation and communication
with advisors and investors. That focus is evidenced by the strength of Mackenzie’s relationships with financial
advisors, the work undertaken with investor and advisor education programs, and the company’s commitment
to focusing on active investment management strategies. During 2011, Mackenzie broadened its investment
choices for Canadians by adding several new funds and more options, including tax-deferred solutions.
PARGESADirectly and through the Belgian holding company Groupe Bruxelles Lambert (GBL), the Pargesa group holds
significant positions in six large companies based in Europe: Lafarge, which produces cement and building
materials; Imerys, a producer of industrial minerals; Total, in the oil and gas industry; GDF Suez, in electricity
and gas; Suez Environnement, in water and waste management; and Pernod Ricard, a leading producer
of wines and spirits. The Pargesa group’s strategy is to establish a limited number of substantial interests
in which it can acquire a position of control or significant influence.
Pargesa’s operating earnings stood at SF343 million in 2011 versus SF466 million in 2010. The decline
in income was mainly due to a weakening of the euro against the Swiss franc, Pargesa’s reporting currency.
The average 2011 rate declined 13.0 per cent and Pargesa recorded a SF55 million exchange loss on the
sale of euros resulting from the sale of its interest in Imerys to GBL. Moreover, although Imerys’ income
rose, its contribution at the Pargesa level declined due to the latter’s decreased economic interest in this
holding. After the assumption of a SF416 million write-down on GBL’s interest in Lafarge, net income showed
a SF65 million loss. The write-down had no impact on the group’s cash or adjusted net assets.
At the end of December 2011, Pargesa’s adjusted net asset value was SF6.7 billion. This represents a value of
SF80.0 per Pargesa share, compared with SF99.8 at the end of 2010, a decrease of 19.8 per cent expressed
in Swiss francs.
The 2011 financial crisis put a stop to the cyclical upturn in industrial production and international trade that
began in 2010. After rebounding sharply in 2010, economic growth slowed again in the second half of last
year. The European debt crisis spread to the real economy, as the weakening of European banking systems
led to a slowdown in lending, and drastic emergency public spending cuts in some countries had a negative
impact on growth. By the end of fiscal 2011, the euro zone had entered a recession.
At its next annual meeting of shareholders on May 16, 2012, Pargesa’s board of directors will propose paying
a dividend of SF2.57 per holder’s share, for a total distribution of SF217.5 million. The dividend per share of
SF2.57 represents a 5.5 per cent decrease in Swiss francs, but a 2.4 per cent increase when expressed in euros,
the currency in which the portfolio of the group is denominated.
PCC AR ENG REW 2012–04–02 14:36 bleu

P O W E R C O R P O R A T I O N O F C A N A D A 2 0 11 A N N U A L R E P O R T12
COMMUNICATIONS AND MEDIAThrough wholly owned subsidiaries, the Corporation participates in many sectors of the communications
industry.
Gesca holds the Corporation’s news media operations, including Canada’s leading French-language daily,
La Presse. The paper is known for its quality national and international coverage, exclusive reports, innovative
presentation and columnists whose work has received many awards for excellence in journalism. In 2010,
La Presse created an in-house team dedicated to the development of digital news products and platforms
and launched its popular iPhone application, “La Presse Hockey”. Gesca’s regional newspapers, Québec City’s
Le Soleil, Ottawa’s Le Droit, Trois-Rivières’ Le Nouvelliste, Sherbrooke’s La Tribune, Chicoutimi’s Le Quotidien
and Granby’s La Voix de l’Est, are published in compact formats and are deeply embedded institutions in the
communities they serve. Gesca also owns LaPresse.ca, a leading French-language point of reference for
online news and information in Canada.
Square Victoria Digital Properties (SVDP) holds the Corporation’s interest in digital media, television production,
book and magazine publishing. SVDP is particularly active in the digital space, most notably through its
interest in Workopolis, the leading online recruitment company in Canada, Olive Media, a leading Canadian
online sales representation company, and Bytheowner Inc., a Canadian real estate Internet advertising
business. SVDP also owns La PresseTélé, one of the leading independent television production companies
in Québec.
INVESTMENT ACTIVITIESSeparate from its investment in Group companies, Power Corporation conducts investment activities that
build on historic relationships and take advantage of opportunities that may also provide superior long-term
returns and diversification for the Corporation. These investments include our long-standing activities in Asia,
wholly owned investment businesses and specific investment funds. Readers are cautioned, though, that
the income to the Corporation from these investment activities can be volatile, but is expected to produce
an attractive return to shareholders over the long run.
ASIAIn Asia, Power Corporation holds an approximately 4.3 per cent interest in CITIC Pacific. The company achieved
a profit attributable to shareholders of HK$9.2 billion for the year 2011, a 4 per cent increase from 2010.
The specialty steel sector contributed HK$2.0 billion to CITIC Pacific’s profits. Excluding an impairment charge
of HK$342 million due to the closure of some outdated furnaces, contribution from the sector increased
11 per cent over 2010. With the addition of new capacity, steel production increased 13 per cent to 6.96 million
tons for the year.
The number one priority for CITIC Pacific management continues to be building its iron ore mine in Western
Australia and bringing it into production as early as possible. Construction of major facilities for the first
production line is in its final phases. Work on the second production line has begun. CITIC Pacific is targeting
to begin commissioning the two production lines no later than the end of August and the end of December
of 2012, respectively.
Directors’ Report to Shareholders( C O N T I N U E D )
P O W E R C O R P O R A T I O N O F C A N A D A 2 0 11 A N N U A L R E P O R T 13
Profit contribution to CITIC Pacific from the property sector increased 270 per cent to HK$2.2 billion in 2011,
with completion and delivery of units in a number of residential projects and twin office towers in Shanghai.
Sales in 2011 were affected by measures put in place by the government to regulate the property market.
CITIC Pacific believes that the situation is likely to continue for some time, but has confidence in the long-
term growth prospects of the real estate market in China.
CITIC Pacific has maintained its declared dividend of HK$0.45 in 2011.
Power Corporation is also involved in selected investment projects in China and, in October 2004, was granted
a licence to operate as a Qualified Foreign Institutional Investor (QFII) in the Chinese “A” shares market. As at
December 31, 2011, the fair market value of the investments in this program had increased to an amount of
$222 million, excluding cash of $12 million. In addition, the Corporation is planning to invest US$50 million
in Chinese companies listed on the Hong Kong Stock Exchange (“H” shares) and the Shenzhen or Shanghai
Stock Exchange (“B” shares). As at December 31, 2011, the fair value of the “B” and “H” shares program was
$35 million, excluding cash of $6 million. Together, the Chinese “A”, “B” and “H” share activity is defined by
the Corporation as Sagard China.
On December 28, 2011, the Corporation finalized the purchase from CITIC Securities Co. Ltd. of a 10 per cent
stake in China Asset Management Co. Ltd. (China AMC) for an amount of approximately CDN$282 million.
China AMC was established in 1998 and was one of the first asset management companies approved by
the China Securities Regulatory Commission. It is recognized as the leading company in the Chinese asset
management sector.
INVESTMENTS IN FUNDSSagard Europe, managed by Sagard SAS, a wholly owned subsidiary of the Corporation based in Paris,
manages two private equity funds, Sagard 1 and Sagard 2. In 2002, Power Corporation committed to invest
€100 million in Sagard Private Equity Partners (Sagard 1), a €535 million European fund, in which GBL also
made a commitment totalling €50 million. Sagard 1 completed 12 investments for a total of €501 million.
As at December 31, 2011, ten investments had been sold, generating excellent returns and earnings for the
Corporation. As of December 31, 2011, Power has received cumulative cash distributions from Sagard 1 in
the amount of €273 million, including €81 million in 2011.
Sagard 2, a new fund with the same investment strategy as Sagard 1, was launched in 2006. The new fund
closed with €1.0 billion in total commitments. Power Corporation committed to invest €200 million in Sagard 2,
and Pargesa and GBL committed to invest €50 million and €150 million respectively. In November 2009,
the size of Sagard 2 was reduced by 20 per cent to €810 million, with each investor’s commitment being
reduced in the same proportion. As of the date hereof, Sagard 2 holds six investments.
In addition, Sagard Capital Partners Management, a U.S.-based wholly owned subsidiary of the Corporation,
has been investing in mid-cap publicly listed companies in the United States, taking an active core shareholder
approach in a limited number of these companies. The book value of these investments was $236 million as
at December 31, 2011, and their historical cost is $183 million.
Over the years, Power Corporation has invested in a number of other selected investment funds, hedge funds
and securities. The Corporation holds investments in a limited number of North American-based private
equity funds. In general, these funds performed well in 2011, and Power Corporation remains satisfied with
the superior rates of return and earnings generated over the years by its private equity portfolio.
GROUP DEVELOPMENTSThe companies in the Power Corporation group were active in the capital markets in February 2012, with the
issuance of perpetual preferred shares to improve the quality of capital: Great-West Lifeco issued $250 million
of First Preferred Shares, Series P, Power Financial issued $250 million of First Preferred Shares, Series R,
and Power Corporation issued $200 million of First Preferred Shares, Series G.
PCC AR ENG REW 2012–04–02 14:36 bleu

P O W E R C O R P O R A T I O N O F C A N A D A 2 0 11 A N N U A L R E P O R T14
BOARD OF DIRECTORSSeveral Directors will not stand for re-election at the May 2012 Annual Meeting of Shareholders.
The Right Honourable Donald F. Mazankowski was first elected to the Board in 1996, following a distinguished
career of public service during which he held the posts of Deputy Prime Minister of Canada, Minister of Finance,
President of the Treasury Board, Minister of Transport, Minister of Agriculture and President of the Queen’s
Privy Council for Canada. He has served on the Executive, Audit, Compensation, Related Party and Conduct
Review (as Chairman) and Governance and Nominating Committees of the Board. He has also served for
many years on the Boards and Board Committees of Power Financial Corporation, Great-West Lifeco and
subsidiaries, and IGM Financial and subsidiaries.
Mr. Jerry E.A. Nickerson, Chairman of the Board of H.B. Nickerson and Sons Limited, has been a Director
of Power Corporation since 1999, bringing with him many years of business experience. He has chaired the
Compensation Committee and has sat on the Executive Committee of the Board. Mr. Nickerson has also
served as a Director of Power Financial Corporation and Great-West Lifeco and subsidiaries, and as a member
of several committees of these companies’ boards. He chaired the Audit Committees of Great-West Lifeco
and The Great-West Life Assurance Company from 1994 to 2009 and of other subsidiaries at various times
during that period.
Dr. James R. Nininger joined the Board of Power Corporation of Canada in 2001. He was President and Chief
Executive Officer of the Conference Board of Canada for many years. He has chaired the Audit Committee
of the Board of Power Corporation since May 2002. He has served as well on the Compensation Committee.
Mr. Robert Parizeau has been a director of Power Corporation of Canada since 1985. He is Chairman of
AON Parizeau Inc., and has provided the Board with the benefit of many years’ involvement in the insurance
industry, as well as broad experience in the banking sector and other industries in Canada. He has served
as a member of the Audit Committee since 1988.
In addition, and in keeping with the Corporation’s practice of maintaining a majority of Directors who
are independent of management, several Directors who are also, and will remain, senior officers of the
Corporation or its affiliates will not stand for re-election to the Board of Directors. They are Me Guy Fortin,
Messrs. Raymond L. McFeetors, Michel Plessis-Bélair, John A. Rae and Dr. Henri-Paul Rousseau.
On behalf of the Board and the shareholders, we wish to thank all of these Directors for their valuable service
to Power Corporation of Canada and its affiliates over many years. During their tenure and with the benefit
of their judgment and wise counsel, the Power group made several important acquisitions and dispositions,
successfully confronted the economic challenges of recent years, and achieved long-term performance of
which they should be justifiably proud.
INDUSTRY MAT TERSThe evolving savings and retirement readiness of Canadians are matters of vital importance in an environment
of volatile economic and market conditions, and demographic pressures due to an aging work force, longer
life expectancies and shorter working careers.
Directors’ Report to Shareholders( C O N T I N U E D )

P O W E R C O R P O R A T I O N O F C A N A D A 2 0 11 A N N U A L R E P O R T 15
Studies show that Canada’s retirement system is among the strongest in the OECD, both in terms of income
adequacy and system sustainability. One of its key strengths is that it is well balanced between government-
provided programs, employer-sponsored plans and individual savings. Notwithstanding the system’s relative
strength, research suggests that a number of Canadians across different age and income brackets may
still not be adequately prepared for retirement, mainly because they do not save enough or do not benefit
from participation in a retirement plan. Enhancements to the system can and should be made in order
to facilitate and incent Canadians to save more. The retirement readiness of Canadians is best enhanced
through targeted, incremental changes to an already well-balanced retirement system which blends public
and private responsibility.
Canadians’ use of financial advisors is an important factor in enabling them to plan for and live comfortably
in retirement. Research by the Investment Funds Institute of Canada demonstrates that people who use a
financial advisor have substantially higher investment assets than non-advised households, in each income
range and age bracket. Moreover, the relationship with a financial advisor generally starts early in life and,
contrary to popular belief, begins when the individual has a relatively low level of financial assets. The value
of advice is based upon the impact of a long-term relationship between an individual or household and a
financial advisor where saving habits and market discipline are built over time.
THE POWER GROUPPower Corporation continues to adhere closely to investment principles which have been developed over
a long period of time. We invest in the equities of companies that have a long-term perspective, that maintain
a prudent financial structure and that have the capacity for sustainable dividend cash flow. We adhere to our
governance model in which we are active owners operating through the boards of directors of our controlled
companies and present with influence in our core shareholder investments. Lastly, we invest in a limited number
of high-quality, socially responsible companies with sustainable franchises and attractive growth prospects.
Your Directors and management seek to deliver attractive long-term shareholder returns, as reflected in
our share price and stable dividend growth. While we are seeing the encouraging signs of an economic
recovery in North America and improving stability in Europe, the operating environment is still challenging.
Nevertheless, the Power Group of companies sees increasing opportunities to grow our business organically
and through targeted acquisitions. The environment lends itself to companies with strong balance sheets,
sound financial management and prudent liquidity positions taking advantage of these opportunities.
Your Directors wish to express gratitude on behalf of the shareholders for the important contribution made
by the management and the employees of our Corporation and its associated companies to the success
achieved in 2011 and look forward to 2012.
ON BEHALF OF THE BOARD OF DIRECTORS,
Signed Signed
Paul Desmarais, Jr., O.C., O.Q.
Chairman and
Co-Chief Executive Officer
March 14, 2012
André Desmarais, O.C., O.Q.
Deputy Chairman,
President and
Co-Chief Executive Officer
PCC AR ENG REW 2012–04–02 14:36 bleu

P O W E R C O R P O R A T I O N O F C A N A D A 2 0 11 A N N U A L R E P O R T16
Responsible Management
OVERSIGHT: We remain committed to
furthering our responsible management
philosophy, predicated on a strong foundation
of integrity and ethical conduct.
Our CSR Statement, which can be found on our
website, reflects our philosophy of responsible
management. It helps shape the corporate
culture we foster throughout the Power group
of companies.
A Power Corporation officer has been tasked
with overseeing the implementation of our
CSR Statement and will be providing annual
progress reports on our CSR initiatives to the
Governance and Nominating Committee of
the Board of Directors.
We encourage and support the efforts of our
portfolio companies to develop initiatives
consistent with our CSR Statement. We also
work with our major operating subsidiaries on
group-wide CSR strategic issues.
PEOPLE: We support our people by
providing an enriching, respectful, balanced
and rewarding work environment.
We rely on all the people in our group of companies
for the success of our business. A motivated work
force respected by management is one of the
most effective means we have to create long-term
value for our shareholders. We actively support
a culture of development and performance. We
seek to create flexible and balanced workplaces
that recognize the value of diversity and
personal well-being.
Our people are the ambassadors of our core
values. Our management philosophy is based
on teamwork and trust, especially critical in our
business environment where they are charged
with earning the trust of our customers. We will
continue to ensure they benefit from positive
working relationships and opportunities for
personal growth.
Responsible management has always been an intrinsic corporate value at our
company and is a constant priority that we believe is essential to long-term
profitability and value creation. Responsible management defines our approach
at Power Corporation in all facets of our business. It informs our efforts when
dealing with Corporate Social Responsibility (CSR) issues and initiatives relating to
our portfolio companies. The same is true with the manner in which we manage
our relationships with the communities where we are established and the ethical
way in which we treat our customers, employees and business partners.

P O W E R C O R P O R A T I O N O F C A N A D A 2 0 11 A N N U A L R E P O R T 17
SOCIETY: We contribute to society by
making sound investments and by supporting
the communities where we are established.
M A K I N G S O U N D I N V E S T M E N T S
The mainstay of our business is financial services.
Our companies help customers achieve their
financial and retirement goals by providing
financial advice and planning products and
services. We believe that the companies in which
we invest have sound and well-structured products
that meet customer needs and provide value.
Our primary areas of focus are life and health
protection, retirement savings and investment
advisory services. Our companies operate in a
financially prudent manner and have sustainable
business models within their relative markets.
We also have a limited number of investment
platforms that follow our investing principles,
including our commitment to CSR. Through our
responsible management approach, we recognize
the importance of both financial and non-financial
elements when conducting our analysis of
investment opportunities and interacting with
our portfolio companies. We will continue to
integrate environmental, social and governance
considerations in our investment analysis process
and active ownership approach.
S U P P O R T I N G O U R C O M M U N I T I E S
As part of our CSR values, we strive to be
responsible corporate citizens and make a
positive contribution to the communities where
the Corporation is established. Over the years,
we have generously contributed to more than
800 organizations and supported many employee
volunteering initiatives. Since its inception,
we have been supporters of Imagine, a national
program to promote corporate and public giving,
volunteering and support in the community,
consistently exceeding the minimum donation
guideline of one per cent of pre-tax domestic
profit. Through our Donations Committee we will
continue to support our communities with a focus
on health, education, arts and culture, community
development, and the environment.
ENVIRONMENT: We work to reduce the
environmental impact of our businesses
through continuous improvement.
Sound environmental practices and behaviours
are well-rooted in how the Corporation approaches
its business activities, and we remain committed
to conducting our activities in an environmentally
responsible manner.
As a holding company, our limited direct
environmental impact is primarily related to
the activities of our head office, which has no
production, manufacturing or service operations.
Over the years, we have focused our efforts on
resource conservation, energy efficiency and
waste management. We remain committed to
continuously reducing our limited impact while
working with our group companies to support
their environmental management initiatives.
COLLABORATION AND TRANSPARENCY:
We are committed to responsible disclosure.
We believe in enhancing our disclosure to better
communicate our responsible management
activities. We realize this is an area that continues
to grow in importance for our stakeholders.
Over the coming years, we will be improving the
quality of our CSR reporting to provide meaningful
information to our stakeholders.
PCC AR ENG REW 2012–04–02 14:36 bleu

P O W E R C O R P O R A T I O N O F C A N A D A 2 0 11 A N N U A L R E P O R T18
MARCH 14 , 2012
This Annual Report is designed to provide interested shareholders and others with selected information concerning Power Corporation of Canada. For further
information concerning the Corporation, shareholders and other interested persons should consult the Corporation’s disclosure documents such as its Annual
Information Form and Management’s Discussion and Analysis (MD&A). Copies of the Corporation’s continuous disclosure documents can be obtained at
www.sedar.com, on the Corporation’s website at www.powercorporation.com, or from the office of the Secretary at the addresses shown at the end of this report.
FORWARD‑LOOKING STATEMENTS > Certain statements in this document, other than statements of historical fact, are forward‑looking statements based on certain assumptions and reflect the Corporation’s current expectations, or with respect to disclosure regarding the Corporation’s public subsidiaries, reflect such subsidiaries’ disclosed current expectations. Forward‑looking statements are provided for the purposes of assisting the reader in understanding the Corporation’s financial performance, financial position and cash flows as at and for the periods ended on certain dates and to present information about management’s current expectations and plans relating to the future and the reader is cautioned that such statements may not be appropriate for other purposes. These statements may include, without limitation, statements regarding the operations, business, financial condition, expected financial results, performance, prospects, opportunities, priorities, targets, goals, ongoing objectives, strategies and outlook of the Corporation and its subsidiaries, as well as the outlook for North American and international economies for the current fiscal year and subsequent periods. Forward‑looking statements include statements that are predictive in nature, depend upon or refer to future events or conditions, or include words such as “expects”, “anticipates”, “plans”, “believes”, “estimates”, “seeks”, “intends”, “targets”,
“projects”, “forecasts” or negative versions thereof and other similar expressions, or future or conditional verbs such as “may”, “will”, “should”, “would” and “could”.
By its nature, this information is subject to inherent risks and uncertainties, that may be general or specific and which give rise to the possibility that expectations, forecasts, predictions, projections or conclusions will not prove to be accurate, that assumptions may not be correct and that objectives, strategic goals and priorities will not be achieved. A variety of factors, many of which are beyond the Corporation’s and its subsidiaries’ control, affect the operations, performance and results of the Corporation and its subsidiaries and their businesses, and could cause actual results to differ materially from current expectations of estimated or anticipated events or results. These factors include, but are not limited to: the impact or unanticipated impact of general economic, political and market factors in North America and internationally, interest and foreign exchange rates, global equity and capital markets, management of market liquidity and
funding risks, changes in accounting policies and methods used to report financial condition (including uncertainties associated with critical accounting assumptions and estimates), the effect of applying future accounting changes, business competition, operational and reputational risks, technological change, changes in government regulation and legislation, changes in tax laws, unexpected judicial or regulatory proceedings, catastrophic events, the Corporation’s and its subsidiaries’ ability to complete strategic transactions, integrate acquisitions and implement other growth strategies, and the Corporation’s and its subsidiaries’ success in anticipating and managing the foregoing factors.
The reader is cautioned to consider these and other factors, uncertainties and potential events carefully and not to put undue reliance on forward‑looking statements. Information contained in forward‑looking statements is based upon certain material assumptions that were applied in drawing a conclusion or making a forecast or projection, including management’s perceptions of historical trends, current conditions and expected future developments, as well as other considerations that are believed to be appropriate in the circumstances, including that the foregoing list of factors, collectively, are not expected to have a material impact on the Corporation and its subsidiaries. While the Corporation considers these assumptions to be reasonable based on information currently available to management, they may prove to be incorrect.
Other than as specifically required by applicable Canadian law, the Corporation undertakes no obligation to update any forward‑looking statement to reflect events or circumstances after the date on which such statement is made, or to reflect the occurrence of unanticipated events, whether as a result of new information, future events or results, or otherwise.
Additional information about the risks and uncertainties of the Corporation’s business and material fac tors or assumptions on which information contained in forward‑looking statements is based is provided in its disclosure materials, including its most recent MD&A and its Annual Information Form, f iled with the securities regulator y authorities in Canada and available at www.sedar.com.
Review of Financial PerformanceAll tabular amounts are in millions of Canadian dollars, unless otherwise noted.
Readers are reminded that a list of the abbreviations used throughout this report can be found on the inside front cover. In addition, the following abbreviations are used in
the Review of Financial Performance and in the Financial Statements and Notes thereto: Audited Consolidated Financial Statements of Power Corporation and Notes thereto
for the year ended December 31, 2011 (the 2011 Consolidated Financial Statements or the Financial Statements); International Financial Reporting Standards (IFRS); previous
Canadian generally accepted accounting principles (previous Canadian GAAP or previous CGAAP).
P O W E R C O R P O R A T I O N O F C A N A D A 2 0 11 A N N U A L R E P O R T 19
O V E R V I E W
Power Corporation is a holding company whose principal asset is its
controlling interest in Power Financial. As of the date hereof, Power
Corporation holds a 66.1% equity and voting interest in Power Financial.
P O W E R F I N A N C I A L C O R P O R A T I O N
Power Financial holds substantial interests in the financial services industry
through its controlling interests in Lifeco and IGM. Power Financial also holds,
together with the Frère group of Belgium, an interest in Pargesa.
As at December 31, 2011, Power Financial and IGM held 68.2% and 4.0%,
respectively, of Lifeco’s common shares, representing approximately 65%
of the voting rights attached to all outstanding Lifeco voting shares. As at
December 31, 2011, Power Financial and Great‑West Life, a subsidiary of Lifeco,
held 57.6% and 3.6%, respectively, of IGM’s common shares.
Power Financial Europe B.V., a wholly owned subsidiary of Power Financial,
and the Frère group each hold a 50% interest in Parjointco, which, as at
December 31, 2011, held a 56.5% equity interest in Pargesa, representing 76.0%
of the voting rights of that company. These figures do not reflect the dilution
which could result from the potential conversion of outstanding debentures
convertible into new bearer shares issued by Pargesa in 2006 and 2007.
The Pargesa Group has holdings in major companies based in Europe. These
investments are held by Pargesa through its affiliated Belgian holding
company, Groupe Bruxelles Lambert. As at December 31, 2011, Pargesa held a
50.0% equity interest in GBL, representing 52.0% of the voting rights.
As at December 31, 2011, Pargesa’s portfolio was composed of interests in
various sectors, including primarily oil and gas through Total; energy and
energy services through GDF Suez; water and waste management services
through Suez Environnement; industrial minerals through Imerys; cement
and building materials through Lafarge; and wines and spirits through
Pernod Ricard. Also as at December 31, 2011, GBL had a 10% interest in
Arkema, a global chemical producer based in France. On March 14, 2012, GBL
announced the sale of its interest in Arkema for proceeds of €432 million and
a gain of €220 million. Also, on March 14, 2012, GBL announced it had launched
the sale of a maximum of 6.2 million shares of Pernod Ricard, representing
approximately 2.3% of the share capital of Pernod Ricard.
In addition, Pargesa and GBL have also invested, or committed to invest, in
the area of private equity, including in the French private equity funds Sagard 1
and Sagard 2, whose management company is a subsidiary of the Corporation.
C O M M U N I C A T I O N S — M E D I A
Square Victoria Communications Group is a wholly owned subsidiary of Power
Corporation which participates in numerous sectors of the communications
and media industry, principally through its wholly owned subsidiaries Gesca
and Square Victoria Digital Properties.
Gesca, through its subsidiaries, is engaged in the publication of seven
daily newspapers, including La Presse, and the operation of the related
website Lapresse.ca.
Square Victoria Digital Properties, directly or through its subsidiaries,
produces television programming and invests in new media ventures and
start‑up digital projects. Square Victoria Digital Properties also holds a
50% interest in Workopolis, an Internet‑based career and recruitment
business, and an interest in the Olive Canada Network, an online advertising
network. Square Victoria Digital Properties also holds, through subsidiaries,
a 67% interest in the Canadian real estate Internet advertising business
Bytheowner Inc.
A S I A
In Asia, the Corporation holds as of the date hereof a 4.3% equity interest in
CITIC Pacific, a public corporation whose shares are listed on the Hong Kong
Stock Exchange. CITIC Pacific’s businesses include special steel manufacturing,
iron ore mining and property development. Most of CITIC Pacific’s assets are
invested in mainland China, Hong Kong and Australia. CITIC Pacific is subject
to the public disclosure requirements of the Hong Kong Stock Exchange.
Power Corporation is involved in selected Canadian investment projects in
China and, in October 2004, was granted a licence to operate as a Qualified
Foreign Institutional Investor (QFII) in the Chinese “A” shares market, for an
amount of US$50 million. As at December 31, 2011, the market value of the
investments in this program had increased to an amount of CDN$222 million,
excluding cash of CDN$12 million. In addition, the Corporation has invested
US$50 million in Chinese companies listed on the Hong Kong Stock Exchange
(“H” shares) and the Shenzhen or Shanghai Stock Exchange (“B” shares).
As at December 31, 2011, the fair value of the “B” and “H” shares program was
CDN$35 million, excluding cash of CDN$6 million. Together, the Chinese “A”,
“B” and “H” share activity is defined by the Corporation as Sagard China.
On December 28, 2011, the Corporation finalized the purchase of a 10% stake
in China AMC from CITIC Securities Co. Ltd. for an amount of approximately
CDN$282 million. China AMC was established in 1998 and was one of the first
asset management companies approved by the China Securities Regulatory
Commission. It is recognized as the leading company in the Chinese asset
management sector.
At December 31, 2011, the carrying value of all foregoing Asia investments
was $840 million.
I N V E S T M E N T I N F U N D S A N D S E C U R I T I E S
In 2002, Power Corporation made a commitment of €100 million to Sagard
Private Equity Partners (Sagard 1), a €535 million fund, to which GBL also made
an investment commitment of €50 million. Sagard 1 has completed twelve
investments, ten of which had been sold by December 31, 2011.
Sagard 2 was launched in 2006 with the same investment strategy as Sagard 1.
This fund closed with total commitments of €1.0 billion. Power Corporation
made a €200 million commitment to Sagard 2, while Pargesa and GBL made
commitments of €50 million and €150 million, respectively. In November 2009,
the Corporation’s commitment was reduced to €160 million and the size of
the fund was reduced to €810 million. Pargesa and GBL’s commitments were
also reduced to €40 million and €120 million, respectively. As of the date of
this report, Sagard 1 held two investments and Sagard 2, six investments.
The Sagard 1 and Sagard 2 funds are managed by Sagard SAS, a wholly owned
subsidiary of the Corporation based in Paris, France. Together, the Sagard 1
and Sagard 2 funds are defined by the Corporation as Sagard Europe.
In addition, a wholly owned subsidiary of the Corporation, Sagard Capital
Partners Management (Sagard Capital), has been investing in mid‑cap public
companies in the United States, pursuant to a plan to allocate a portion of
the Corporation’s cash resources to selected investment opportunities in that
country. At December 31, 2011, the carrying value of these investments in the
United States is $236 million.
Power Corporation has invested for many years in private equity limited
partnerships based upon superior returns and relationships with the
Corporation. The carrying value of these investments is $276 million at
December 31, 2011. The Corporation has also invested, directly or through
wholly owned subsidiaries, in a number of selected hedge funds and securities.
The Corporation has also invested in privately‑held Potentia Solar Inc.,
a rooftop solar power producer in Ontario.
The Corporation has outstanding commitments to make future capital
contributions to investment funds for an aggregate amount of $319 million.
These investments and the investments in Asia support the diversification
strategy of the Corporation. However, their contribution to operating earnings,
both in terms of magnitude and timing, is by nature difficult to predict.

REVIEW OF FINANCIAL PERFORMANCEP O W E R C O R P O R A T I O N O F C A N A D A 2 0 11 A N N U A L R E P O R T20
B A S I S O F P R E S E N T A T I O N A N D S U M M A R Y O F A C C O U N T I N G P O L I C I E S
I N T E R N A T I O N A L F I N A N C I A L R E P O R T I N G S T A N D A R D S
In Februar y 2008, the Canadian Institute of Chartered Accountants
announced that Canadian GAAP for publicly accountable enterprises would
be replaced by International Financial Reporting Standards (IFRS), as issued
by the International Accounting Standards Board (IASB), for fiscal years
beginning on or after January 1, 2011.
The Corporation developed and implemented an IFRS changeover plan
which addressed key areas, including accounting policies, financial reporting,
disclosure controls and procedures, information systems, education and
training, and other business activities. The Corporation commenced
reporting under IFRS for the quarter ending March 31, 2011, including
presenting a transitional balance sheet at January 1, 2010 and reporting under
IFRS for comparative periods, with the required reconciliations presented.
The Corporation’s presentation currency is the Canadian dollar.
The information for prior periods presented herein, including information
relating to comparative periods in 2010, has been restated or reclassified
to conform to IFRS and to financial statement presentations adopted
for the current period being reported, unless otherwise noted as being
presented under previous Canadian GAAP and not IFRS. Included in the
Corporation’s 2011 Consolidated Financial Statements is the IFRS 1 transitional
note including reconciliations of the balance sheet and equity at transition
to IFRS, and reconciliations of net earnings and comprehensive income at
December 31, 2010 for the figures previously presented under Canadian GAAP.
The impact to shareholders’ equity at transition (January 1, 2010) from previous
Canadian GAAP to IFRS was a net decrease of $248 million. The impact to 2010
earnings was a decrease of $139 million, consisting of a decrease in operating
earnings of $17 million and additional charges to other items of $122 million.
For a complete listing of relevant IFRS accounting policies and details
of the impact of the initial adoption of IFRS on the presentation of the
financial statements, refer to Notes 2 and 3 of the Corporation’s 2011
Consolidated Financial Statements. Further information is also available on
the Corporation’s website at www.powercorporation.com.
I N C L U S I O N O F P A R G E S A ’ S R E S U L T S
The investment in Pargesa, an associate of the Corporation as defined
under IFRS, is accounted for by Power Financial under the equity method.
As described above, the Pargesa portfolio currently consists primarily of
investments in Imerys, Total, GDF Suez, Suez Environnement, Lafarge,
Pernod Ricard and Arkema, which are held through GBL, which is consolidated
in Pargesa. Imerys’ results are consolidated in the financial statements of
GBL, while the contribution from Total, GDF Suez, Suez Environnement,
Pernod Ricard and Arkema to GBL’s operating earnings consists of the
dividends received from these companies. GBL accounts for its investment in
Lafarge under the equity method, and consequently, the contribution from
Lafarge to GBL’s earnings consists of GBL’s share of Lafarge’s net earnings.
The contribution from Pargesa to Power Financial’s earnings is based on the
economic (flow‑through) presentation of results as published by Pargesa.
Pursuant to this presentation, operating earnings and non‑operating
earnings are presented separately by Pargesa. Power Corporation’s share of
non‑operating earnings of Pargesa, after adjustments or reclassifications
if necessar y, is included as part of other items in the Corporation’s
financial statements.
N O N - I F R S F I N A N C I A L M E A S U R E S
In analyzing the financial results of the Corporation and consistent
with the presentation in previous years, net earnings are subdivided in
the section “Results of Power Corporation of Canada” below into the
following components:
> operating earnings; and
> other items or non‑operating earnings, which include the after‑tax impact
of any item that management considers to be of a non‑recurring nature
or that could make the period‑over‑period comparison of results from
operations less meaningful, and also include the Corporation’s share of any
such item presented in a comparable manner by its subsidiaries. Please also
refer to the comments above related to the inclusion of Pargesa’s results.
Management has used these financial measures for many years in its
presentation and analysis of the financial performance of Power Corporation,
and believes that they provide additional meaningful information to readers
in their analysis of the results of the Corporation.
Operating earnings and operating earnings per share are non‑IFRS financial
measures that do not have a standard meaning and may not be comparable to
similar measures used by other entities. For a reconciliation of these non‑IFRS
measures to results reported in accordance with IFRS, see “Results of Power
Corporation of Canada — Earnings Summary — Condensed Supplementary
Statements of Earnings” section below.

P O W E R C O R P O R A T I O N O F C A N A D A 2 0 11 A N N U A L R E P O R T 21
R E S U L T S O F P O W E R C O R P O R A T I O N O F C A N A D A
This section is an overview of the results of Power Corporation. In this section,
consistent with past practice, the contributions from Power Financial, Square
Victoria Communications Group, Victoria Square Ventures and Sagard SAS
are accounted for using the equity method in order to facilitate the discussion
and analysis. This presentation has no impact on Power Corporation’s net
earnings and is intended to assist readers in their analysis of the results of
the Corporation.
E A R N I N G S S U M M A R Y — C O N D E N S E D S U P P L E M E N T A R Y S T A T E M E N T S O F E A R N I N G S
The following table shows a reconciliation of non‑IFRS financial measures used herein for the periods indicated, with the reported results in accordance with
IFRS for net earnings attributable to participating shareholders and earnings per share.
T WELVE MONTHS ENDED DECEMBER 31 2011 2010
Contribution to operating earnings from subsidiaries 1,150 1,097
Results from corporate activities
Income from investments 159 17
Operating and other expenses (116) (116)
Dividends on non‑participating shares (41) (41)
Operating earnings attributable to participating shareholders 1,152 957
Other items (77) (230)
Net earnings attributable to participating shareholders 1,075 727
Earnings per share attributable to participating shareholders
— operating earnings 2.50 2.09
— non‑operating earnings (0.16) (0.50)
— net earnings 2.34 1.59
O P E R A T I N G E A R N I N G S A T T R I B U T A B L E T O P A R T I C I P A T I N G S H A R E H O L D E R S
Operating earnings attributable to participating shareholders for the twelve‑
month period ended December 31, 2011 were $1,152 million or $2.50 per share,
compared with $957 million or $2.09 per share in the corresponding period
in 2010 (an increase of 19.9% on a per share basis).
C O N T R I B U T I O N T O O P E R A T I N G E A R N I N G S F R O M S U B S I D I A R I E S
Power Corporation’s share of operating earnings from its subsidiaries was
$1,150 million for the twelve‑month period ended December 31, 2011, compared
with $1,097 million for the same period in 2010, an increase of $53 million
or 4.8%.
Power Financial, which makes the most significant contribution to the
Corporation’s earnings, reported operating earnings attributable to common
shareholders of $1,729 million or $2.44 per share for the twelve‑month period
ended December 31, 2011, compared with $1,625 million or $2.30 per share for
the same period in 2010 (an increase of 6.2% on a per share basis).
R E S U L T S F R O M C O R P O R A T E A C T I V I T I E S
Results from corporate activities include income from investments, operating
expenses, financing charges, depreciation and income taxes.
Corporate activities represented a contribution of $43 million in the twelve‑
month period ended December 31, 2011, compared with a net charge of
$99 million in the corresponding period in 2010. The changes in corporate
activities are essentially due to changes in the Corporation’s income from
investments (discussed below).
The following table provides, by category of investment components, details of income from investments for the periods indicated:
T WELVE MONTHS ENDED DECEMBER 31 2011 2010
Dividends from CITIC Pacific 9 9
Sagard China 7 (1)
Sagard Capital 15 (3)
Sagard Europe [1] 82 (9)
Investment funds and hedge funds 39 15
Other 7 6
159 17
[1] During the second and third quarters of 2011, Sagard 1 sold investments for which the Corporation recorded gains of $41 million and $45 million, respectively.

REVIEW OF FINANCIAL PERFORMANCEP O W E R C O R P O R A T I O N O F C A N A D A 2 0 11 A N N U A L R E P O R T22
Impairment charges recorded against operating earnings were $19 million
in the twelve‑month period ended December 31, 2011, compared with
$29 million in the corresponding period in 2010.
Other impairment charges were recorded in 2011 and 2010 in Other Items, as
described below.
Readers are cautioned that the amount and timing of contributions from
private equity funds, investment funds and hedge funds, as well as from
Sagard China and Sagard Capital, are difficult to predict and can also be
affected by foreign exchange fluctuations.
O T H E R I T E M S
Other items not included in operating earnings represented a net charge of
$77 million in the twelve‑month period ended December 31, 2011, compared
with a net charge of $230 million in the corresponding period in 2010.
Other items in 2011 included a contribution of $58 million representing the
Corporation’s share of non‑operating earnings of Lifeco. In the fourth quarter
of 2011, Lifeco re‑evaluated and reduced a litigation provision established
in the third quarter of 2010 which positively impacted Lifeco’s common
shareholders’ net earnings by $223 million. Additionally, in the fourth quarter
of 2011, Lifeco established a provision of $99 million after tax in respect of the
settlement of litigation relating to its ownership in a U.S.‑based private equity
firm. The net impact to Lifeco of these two unrelated matters was $124 million.
Other items in 2011 also include i) an impairment charge on the Corporation’s
investment in CITIC Pacific for an amount of $72 million recorded in the third
quarter and ii) the Corporation’s share of GBL’s €650 million writedown of
its investment in Lafarge for an amount of $87 million recorded in the third
quarter. The persistence of Lafarge’s share price at a level significantly below
its consolidated carrying value rendered an impairment test necessary.
Other items of IGM include the gain on the disposal of M.R.S. Trust Company
and M.R.S. Inc. (together, MRS) as well as an amount related to changes in
the status of certain income tax filings.
Other items in 2010 were primarily composed of the Corporation’s share
of the litigation provision referred to above recorded by Lifeco in the third
quarter of 2010 and impairment charges on the CITIC Pacific investment
of $133 million recorded under IFRS due to the decline in the market price of
CITIC Pacific in 2010.
Readers are reminded that the Corporation had recorded an impairment
charge on CITIC Pacific in 2009 and, pursuant to IFRS, there is an automatic
recognition of an impairment loss upon further declines in the value of an
available‑for‑sale equity investment.
The following table provides additional information on other items for the periods indicated:
T WELVE MONTHS ENDED DECEMBER 31 2011 2010
Power Corporation’s share of
Lifeco 58 (96)
IGM 23 (9)
Pargesa (86)
Other
Impairment charge on CITIC Pacific (72) (133)
Other 8
(77) (230)
N E T E A R N I N G S A T T R I B U T A B L E T O P A R T I C I P A T I N G S H A R E H O L D E R S
Net earnings attributable to participating shareholders for the twelve‑month period ended December 31, 2011 were $1,075 million or $2.34 per share, compared
with $727 million or $1.59 per share in the corresponding period in 2010.
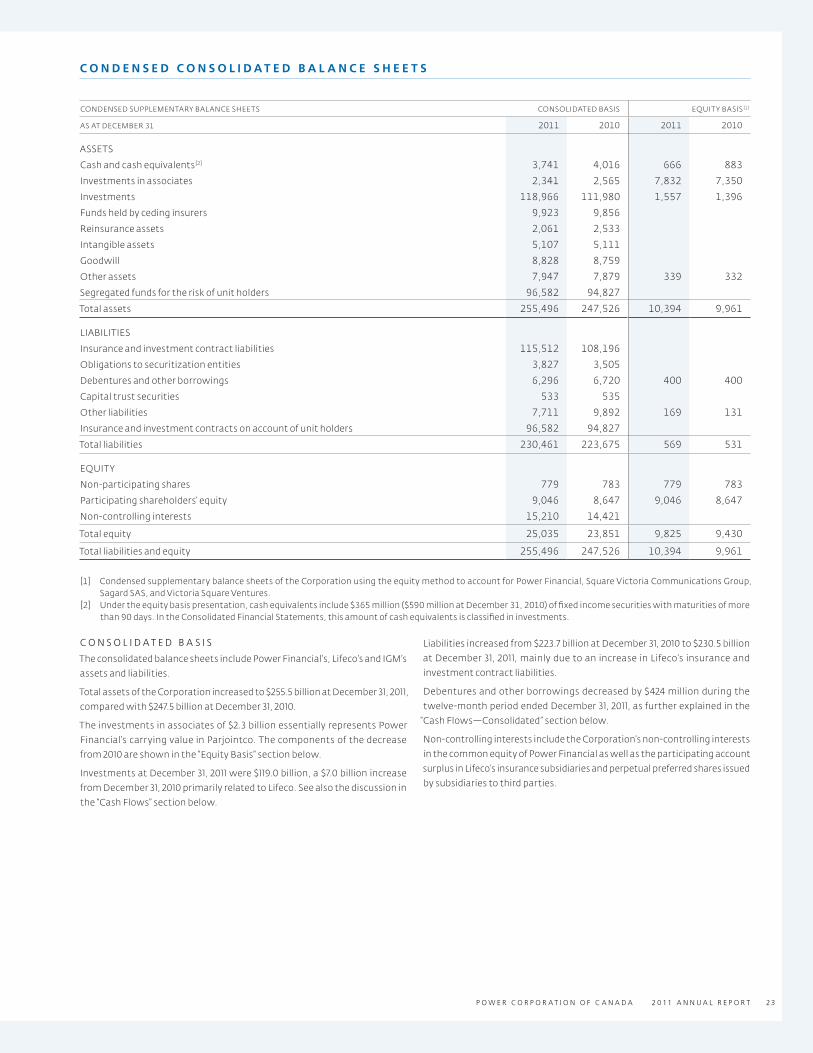
P O W E R C O R P O R A T I O N O F C A N A D A 2 0 11 A N N U A L R E P O R T 23
C O N D E N S E D C O N S O L I D A T E D B A L A N C E S H E E T S
CONDENSED SUPPLEMENTARY BAL ANCE SHEETS CONSOLIDATED BASIS EQUIT Y BASIS [1]
AS AT DECEMBER 31 2011 2010 2011 2010
ASSETS
Cash and cash equivalents [2] 3,741 4,016 666 883
Investments in associates 2,341 2,565 7,832 7,350
Investments 118,966 111,980 1,557 1,396
Funds held by ceding insurers 9,923 9,856
Reinsurance assets 2,061 2,533
Intangible assets 5,107 5,111
Goodwill 8,828 8,759
Other assets 7,947 7,879 339 332
Segregated funds for the risk of unit holders 96,582 94,827
Total assets 255,496 247,526 10,394 9,961
LIABILITIES
Insurance and investment contract liabilities 115,512 108,196
Obligations to securitization entities 3,827 3,505
Debentures and other borrowings 6,296 6,720 400 400
Capital trust securities 533 535
Other liabilities 7,711 9,892 169 131
Insurance and investment contracts on account of unit holders 96,582 94,827
Total liabilities 230,461 223,675 569 531
EQUITY
Non‑participating shares 779 783 779 783
Participating shareholders’ equity 9,046 8,647 9,046 8,647
Non‑controlling interests 15,210 14,421
Total equity 25,035 23,851 9,825 9,430
Total liabilities and equity 255,496 247,526 10,394 9,961
[1] Condensed supplementary balance sheets of the Corporation using the equity method to account for Power Financial, Square Victoria Communications Group, Sagard SAS, and Victoria Square Ventures.
[2] Under the equity basis presentation, cash equivalents include $365 million ($590 million at December 31, 2010) of fixed income securities with maturities of more than 90 days. In the Consolidated Financial Statements, this amount of cash equivalents is classified in investments.
C O N S O L I D A T E D B A S I S
The consolidated balance sheets include Power Financial’s, Lifeco’s and IGM’s
assets and liabilities.
Total assets of the Corporation increased to $255.5 billion at December 31, 2011,
compared with $247.5 billion at December 31, 2010.
The investments in associates of $2.3 billion essentially represents Power
Financial’s carrying value in Parjointco. The components of the decrease
from 2010 are shown in the “Equity Basis” section below.
Investments at December 31, 2011 were $119.0 billion, a $7.0 billion increase
from December 31, 2010 primarily related to Lifeco. See also the discussion in
the “Cash Flows” section below.
Liabilities increased from $223.7 billion at December 31, 2010 to $230.5 billion
at December 31, 2011, mainly due to an increase in Lifeco’s insurance and
investment contract liabilities.
Debentures and other borrowings decreased by $424 million during the
twelve‑month period ended December 31, 2011, as further explained in the
“Cash Flows — Consolidated” section below.
Non‑controlling interests include the Corporation’s non‑controlling interests
in the common equity of Power Financial as well as the participating account
surplus in Lifeco’s insurance subsidiaries and perpetual preferred shares issued
by subsidiaries to third parties.

REVIEW OF FINANCIAL PERFORMANCEP O W E R C O R P O R A T I O N O F C A N A D A 2 0 11 A N N U A L R E P O R T24
Assets under administration of Lifeco and IGM are as follows:
AS AT DECEMBER 31 [ IN BILLIONS OF CANADIAN DOLL ARS ] 2011 2010
Assets under management of Lifeco
Invested assets 114.6 106.6
Other corporate assets 27.6 27.9
Segregated funds net assets 96.6 94.8
Proprietary mutual funds and institutional net assets 125.4 126.1
364.2 355.4
Assets under management of IGM 118.7 129.5
Total assets under management 482.9 484.9
Other assets under administration of Lifeco 137.8 131.5
Total assets under administration 620.7 616.4
Total assets under administration at December 31, 2011 increased by $4.3 billion
(an increase at Lifeco of $15.1 billion and a decrease at IGM of $10.8 billion) from
December 31, 2010:
> Total assets under administration by Lifeco at December 31, 2011 increased
by $15.1 billion from December 31, 2010, primarily due to an increase in fair
value of invested assets as a result of lower government bond rates and
an increase in other assets under administration due to new plan sales and
positive currency movement.
> IGM’s assets under management, at market value, were $118.7 billion at
December 31, 2011, compared with $129.5 billion at December 31, 2010.
E Q U I T Y B A S I S
Under the equity basis presentation, Power Financial, Square Victoria
Communications Group, Victoria Square Ventures, and Sagard SAS are
accounted for by the Corporation using the equity method. This presentation
has no impact on Power Corporation’s shareholders’ equity and is intended
to assist readers in isolating the contribution of Power Corporation, as the
parent company, to consolidated assets and liabilities.
Cash and cash equivalents held by Power Corporation amounted to
$666 million at December 31, 2011, compared with $883 million at the end
of December 2010 (see “Cash Flows — Corporate” section below for details).
In managing its own cash and cash equivalents, the Corporation may hold
cash balances or invest in short‑term paper or equivalents, as well as deposits,
denominated in foreign currencies and thus be exposed to fluctuations in
exchange rates. In order to protect against such fluctuations, the Corporation
may, from time to time, enter into currency‑hedging transactions with
financial institutions with high credit ratings. As at December 31, 2011, 87% of
the $666 million of cash and cash equivalents was denominated in Canadian
dollars or in foreign currencies with currency hedges in place. The balance,
denominated in foreign currencies, was unhedged.
Investments are principally composed of the carr ying value of the
Corporation’s interest in its subsidiaries, Power Financial, Square Victoria
Communications Group, Victoria Square Ventures, and Sagard SAS, as well
as the carrying value of its portfolio of investment funds, other marketable
securities and non‑quoted investments.
The carrying value at equity of Power Corporation’s investments in its subsidiaries increased to $7,832 million at December 31, 2011, compared with $7,350 million
at December 31, 2010, as outlined in the following table:
Carrying value, at the beginning 7,350
Share of operating earnings 1,150
Share of other items (5)
Dividends (655)
Other (8)
Carrying value, at the end 7,832
Investments amounted to $1,557 million at December 31, 2011, compared with $1,396 million at December 31, 2010.
The following table provides further detail on the carrying value of investments:
AS AT DECEMBER 31 2011 2010
COSTREVALUATION TO FAIR VALUE
FAIR VALUE COST
REVALUATION TO FAIR VALUE
FAIR VALUE
CITIC Pacific 238 50 288 310 96 406
China AMC 282 − 282 − − −
Sagard China 263 (6) 257 218 15 233
Sagard Capital 136 100 236 121 90 211
Sagard 1 and Sagard 2 116 5 121 95 50 145
Investment funds 230 46 276 213 83 296
Hedge funds 43 10 53 38 15 53
Other 44 − 44 41 11 52
1,352 205 1,557 1,036 360 1,396

P O W E R C O R P O R A T I O N O F C A N A D A 2 0 11 A N N U A L R E P O R T 25
E Q U I T Y
Non‑participating shares of the Corporation consist of five series of First
Preferred Shares with an aggregate stated capital amount of $779 million
as at December 31, 2011 (compared with $783 million as at December 31, 2010),
of which $750 million are non‑cumulative. All of these series are perpetual
preferred shares and are redeemable in whole or in part at the option of
the Corporation from specific dates. The First Preferred Shares, 1986 Series,
with a stated value of $29 million at December 31, 2011 ($33 million at the
end of 2010), have a sinking fund provision under which the Corporation will
make all reasonable efforts to purchase on the open market 20,000 shares
per quarter. A total of 77,300 such shares were purchased during the twelve
months ended December 31, 2011.
Excluding non‑participating shares, participating shareholders’ equity
was $9,046 million at December 31, 2011, compared with $8,647 million at
December 31, 2010. The $399 million increase was primarily due to:
> A $562 million increase in retained earnings, reflecting mainly net earnings
of $1,116 million, less dividends declared of $574 million.
> Changes to accumulated other comprehensive income in the negative
amount of $194 million, made up of a negative variation of $154 million
primarily in connection with the Corporation’s investments and the
Corporation’s share of other comprehensive income of its subsidiaries for
a negative amount of $40 million.
> Issuance of a total of 1,266,262 Subordinate Voting Shares during the twelve
months ended December 31, 2011 under the Corporation’s Executive Stock
Option Plan, resulting in an increase in stated capital of $22 million.
As a result of the above, book value per participating share of the Corporation
was $19.67 at December 31, 2011, compared with $18.85 at the end of 2010.
The Corporation filed a short‑form base shelf prospectus dated November 23,
2010, pursuant to which, for a period of 25 months thereafter, the Corporation
may issue up to an aggregate of $1 billion of First Preferred Shares, Subordinate
Voting Shares and debt securities, or any combination thereof. This filing
provides the Corporation with the flexibility to access debt and equity
markets on a timely basis to make changes to the Corporation’s capital
structure in response to changes in economic conditions and changes in its
financial condition.
O U T S T A N D I N G N U M B E R O F P A R T I C I P A T I N G S H A R E S
As of the date hereof, there were 48,854,772 Participating Preferred Shares
of the Corporation outstanding, unchanged from December 31, 2010, and
411,042,894 Subordinate Voting Shares of the Corporation outstanding,
compared with 409,7 76,632 at December 31, 2010. The increase in the
number of outstanding Subordinate Voting Shares reflects the exercise of
options under the Corporation’s Executive Stock Option Plan. As of the date
hereof, options were outstanding to purchase up to 13,387,225 Subordinate
Voting Shares of the Corporation under the Corporation’s Executive Stock
Option Plan.
C A S H F L O W S
C O N D E N S E D C A S H F L O W S — C O N S O L I D A T E D
FOR THE YEARS ENDED DECEMBER 31 2011 2010
Cash flow from operating activities 5,425 6,519
Cash flow from financing activities (2,306) (1,166)
Cash flow from investing activities (3,130) (6,524)
Effect of changes in exchange rates on cash and cash equivalents 24 (215)
Increase (decrease) in cash and cash equivalents — continuing operations 13 (1,386)
Cash and cash equivalents, at the beginning 4,016 5,383
Less: cash and cash equivalents — discontinued operations, beginning of year (288) (269)
Cash and cash equivalents — continuing operations, end of year 3,741 3,728
On a consolidated basis, cash and cash equivalents from continuing
operations increased by $13 million in the twelve‑month period ended
December 31, 2011, compared with a decrease of $1,386 million in the
corresponding period in 2010.
Operating activities produced a net inflow of $5,425 million in the twelve‑
month period ended December 31, 2011, compared with a net inflow of
$6,519 million in the corresponding period in 2010.
Operating activities during the twelve‑month period ended December 31,
2011, compared to the same period in 2010, included:
> Lifeco’s cash flow from operations was a net inflow of $4,844 million,
compared with a net inflow of $5,797 million in the corresponding period
in 2010. Cash provided by operating activities is used by Lifeco primarily to
pay policy benefits, policyholder dividends and claims, as well as operating
expenses and commissions. Cash flows generated by operations are mainly
invested by Lifeco to support future liability cash requirements.
> Operating activities of IGM, after payment of commissions, generated
$777 million, compared with $824 million in the corresponding period
in 2010.
Cash flows from financing activities, which include dividends paid on the
participating and non‑participating shares of the Corporation, as well as
dividends paid by subsidiaries to non‑controlling interests, resulted in a net
outflow of $2,306 million in the twelve‑month period ended December 31,
2011, compared with a net outflow of $1,166 million in the corresponding
period in 2010.
Financing activities during the twelve‑month period ended December 31, 2011,
compared to the same period in 2010, included:
> Dividends paid by the Corporation and its subsidiaries to non‑controlling
interests were $1,654 million, compared with $1,636 million in the
corresponding period in 2010.
> Issuance of subordinate voting shares of the Corporation for an amount
of $22 million pursuant to the Corporation’s Executive Stock Option Plan,
compared with $23 million in the corresponding period in 2010.
> Repurchase of non‑participating shares by the Corporation for an amount
of $4 million, compared with $4 million in the corresponding period in 2010.

REVIEW OF FINANCIAL PERFORMANCEP O W E R C O R P O R A T I O N O F C A N A D A 2 0 11 A N N U A L R E P O R T26
> Issuance of common shares by subsidiaries of the Corporation for an
amount of $64 million, compared with $115 million in the corresponding
period in 2010.
> No issuance of preferred shares by subsidiaries of the Corporation,
compared to issuance in the amount of $680 million in the corresponding
period in 2010.
> Repurchase for cancellation by subsidiaries of the Corporation of their
common shares amounted to $186 million, compared with $157 million in
the corresponding period in 2010.
> No redemption of preferred shares by subsidiaries of the Corporation,
compared to redemption in the amount of $812 million in the corresponding
period in 2010.
> No issuance of debentures and other debt instruments at Lifeco, compared
to an issuance for an amount of $500 million in the corresponding period
in 2010.
> Net repayment of other borrowings at Lifeco for an amount of $6 million,
compared with net repayment of debentures and other borrowings of
$254 million in the corresponding period in 2010.
> Repayment of debentures by IGM for an amount of $450 million, compared
with issuance of debentures of $200 million in the corresponding period
in 2010.
> Increase in obligations to securitization entities at IGM for an amount of
$319 million, compared with an increase of $193 million in the corresponding
period in 2010.
> A net payment of $408 million by IGM in 2011 arising from obligations
related to assets sold under repurchase agreements, compared to
net receipts of $5 million in 2010. The net payment in 2011 included the
settlement of $428 million in obligations related to the sale of $426 million
in Canada Mortgage Bonds, which are reported in investing activities.
Cash flows from investing activities resulted in a net outflow of $3,130 million
in the twelve‑month period ended December 31, 2011, compared with a net
outflow of $6,524 million in the corresponding period in 2010.
Investing activities during the twelve‑month period ended December 31, 2011,
compared to the same period in 2010, included:
> Investing activities at Lifeco resulted in a net outflow of $3,407 million,
compared with a net outflow of $6,099 million in the corresponding
period in 2010.
> Investing activities at IGM resulted in a net inflow of $229 million, compared
with a net inflow of $60 million in the corresponding period in 2010.
> The Corporation’s investing activities represented an outflow of
$250 million, compared with an outflow of $102 million in the corresponding
period in 2010 as shown in the “Cash Flows — Corporate” section below.
> In addition, the Corporation reduced its level of fixed income securities with
maturities of more than 90 days, resulting in a net inflow of $225 million,
compared with a net outflow of $149 million in the corresponding period
in 2010.
C A S H F L O W S — C O R P O R A T E
FOR THE YEARS ENDED DECEMBER 31 2011 2010
CASH FLOW FROM OPERATING ACTIVITIES
Net earnings 1,116 768
Earnings from subsidiaries not received in cash (490) (342)
Impairment charges (operating and non‑operating) 91 162
Net gains on disposal of investments (169) (37)
Other 41 69
589 620
CASH FLOW FROM FINANCING ACTIVITIES
Dividends paid on participating and non‑participating shares (574) (572)
Issuance of subordinate voting shares 22 23
Repurchase of non‑participating shares (4) (4)
(556) (553)
CASH FLOW FROM INVESTING ACTIVITIES
Proceeds from disposal of investments 332 189
Investment in subsidiaries (7) (4)
Purchase of investments (567) (253)
Other (8) (34)
(250) (102)
INCREASE (DECREASE) IN CASH AND CASH EQUIVALENTS (217) (35)
Cash and cash equivalents, beginning of year 883 918
Cash and cash equivalents, end of year 666 883

P O W E R C O R P O R A T I O N O F C A N A D A 2 0 11 A N N U A L R E P O R T 27
Power Corporation is a holding company. As such, corporate cash flows
from operations, before payment of dividends on the non‑participating
shares and on the participating shares, are principally made up of dividends
received from its subsidiaries and income from investments, less operating
expenses, financing charges, and income taxes. Dividends received from
Power Financial, which is also a holding company, represent a significant
component of the Corporation’s corporate cash flows. In each quarter of 2011,
Power Financial declared dividends on its Common Shares of $0.35 per share,
the same as in the corresponding quarters of 2010.
The ability of Power Financial to meet its obligations generally and pay
dividends depends in particular upon receipt of sufficient funds from its
subsidiaries. The payment of interest and dividends by Power Financial’s
principal subsidiaries is subject to restrictions set out in relevant corporate
and insurance laws and regulations, which require that solvency and capital
standards be maintained. As well, the capitalization of certain of Power
Financial’s subsidiaries takes into account the views expressed by the various
credit rating agencies that provide ratings related to financial strength and
other measures relating to those companies.
In the twelve‑month period ended December 31, 2011, dividends declared on
the Corporation’s participating shares amounted to $1.16 per share, the same
as in the corresponding period in 2010.
S U M M A R Y O F C R I T I C A L A C C O U N T I N G E S T I M A T E S
The preparation of financial statements in conformity with IFRS requires
management to adopt accounting policies and to make estimates and
assumptions that affect amounts reported in the Corporation’s 2011
Consolidated Financial Statements. The major accounting policies and
related critical accounting estimates underlying the Corporation’s 2011
Consolidated Financial Statements are summarized below. In applying
these policies, management makes subjective and complex judgments that
frequently require estimates about matters that are inherently uncertain.
Many of these policies are common in the insurance and other financial
services industries; others are specific to the Corporation’s businesses and
operations. The significant accounting estimates are as follows:
F A I R V A L U E M E A S U R E M E N T
Financial and other instruments held by the Corporation and its
subsidiaries include portfolio investments, various derivative financial
instruments, and debentures and other debt instruments.
Financial instrument carrying values reflect the liquidity of the markets
and the liquidity premiums embedded in the market pricing methods the
Corporation relies upon.
In accordance with IFRS 7, Financial Instruments — Disclosure, the Corporation’s
assets and liabilities recorded at fair value have been categorized based upon
the following fair value hierarchy:
> Level 1 inputs utilize observable, quoted prices (unadjusted) in active
markets for identical assets or liabilities that the Corporation has the
ability to access.
> Level 2 inputs utilize other than quoted prices included in Level 1 that are
observable for the asset or liability, either directly or indirectly.
> Level 3 inputs are unobservable and include situations where there is little,
if any, market activity for the asset or liability.
In certain cases, the inputs used to measure fair value may fall into different
levels of the fair value hierarchy. In such cases, the level in the fair value
hierarchy within which the fair value measurement in its entirety falls has
been determined based on the lowest level input that is significant to the
fair value measurement in its entirety. The Corporation’s assessment of the
significance of a particular input to the fair value measurement in its entirety
requires judgment and considers factors specific to the asset or liability.
Refer to Note 29 to the Corporation’s 2011 Consolidated Financial Statements
for disclosure of the Corporation’s f inancial instruments fair value
measurement as at December 31, 2011.
Fair values for bonds classified as fair value through profit or loss are
determined using quoted market prices. Where prices are not quoted in
a normally active market, fair values are determined by valuation models
primarily using observable market data inputs. Market values for bonds and
mortgages classified as loans and receivables are determined by discounting
expected future cash flows using current market rates.
Fair values for public stocks are generally determined by the last bid price
for the security from the exchange where it is principally traded. Fair values
for stocks for which there is no active market are determined by discounting
expected future cash flows based on expected dividends and where market
value cannot be measured reliably, fair value is estimated to be equal to cost.
Market values for real estate are determined using independent appraisal
services and include management adjustments for material changes in
property cash flows, capital expenditures or general market conditions in the
interim period between appraisals.
I M P A I R M E N T
Investments are reviewed regularly on an individual basis to determine
impairment status. The Corporation considers various factors in the
impairment evaluation process, including, but not limited to, the financial
condition of the issuer, specific adverse conditions affecting an industry
or region, decline in fair value not related to interest rates, bankruptcy or
defaults and delinquency in payments of interest or principal. Investments
are deemed to be impaired when there is no longer reasonable assurance
of timely collection of the full amount of the principal and interest due.
The market value of an investment is not by itself a definitive indicator of
impairment, as it may be significantly influenced by other factors, including
the remaining term to maturity and liquidity of the asset. However, market
price must be taken into consideration when evaluating impairment.
For impaired mortgages and bonds classified as loans and receivables,
provisions are established or write‑offs are recorded to adjust the carrying
value to the estimated realizable amount. Wherever possible, the fair value
of collateral underlying the loans or observable market price is used to
establish the estimated realizable value. For impaired available‑for‑sale loans
recorded at fair value, the accumulated loss recorded in accumulated other
comprehensive income is reclassified to net investment income. Impairments
on available‑for‑sale debt instruments are reversed if there is objective
evidence that a permanent recovery has occurred. All gains and losses on
bonds classified or designated as fair value through profit or loss are already
recorded in income, therefore a reduction due to impairment of assets will
be recorded in income. As well, when determined to be impaired, interest is
no longer accrued and previous interest accruals are reversed.

REVIEW OF FINANCIAL PERFORMANCEP O W E R C O R P O R A T I O N O F C A N A D A 2 0 11 A N N U A L R E P O R T28
G O O D W I L L A N D I N T A N G I B L E S I M P A I R M E N T T E S T I N G
Goodwill and intangible assets are tested for impairment annually or more
frequently if events indicate that impairment may have occurred. Intangible
assets that were previously impaired are reviewed at each reporting date
for evidence of reversal. In the event that certain conditions have been met,
the Corporation would be required to reverse the impairment charge or a
portion thereof.
Goodwill has been allocated to cash generating units (CGU), representing the
lowest level in which goodwill is monitored for internal reporting purposes.
Goodwill is tested for impairment by comparing carrying value of the CGU
groups to the recoverable amount to which the goodwill has been allocated.
Intangible assets are tested for impairment by comparing the asset’s carrying
amount to its recoverable amount. An impairment loss is recognized for the
amount by which the asset’s carrying amount exceeds its recoverable amount.
The recoverable amount is the higher of the asset’s fair value less cost to sell
and value in use, which is generally calculated using the present value of
estimated future cash flows expected to be generated.
I N S U R A N C E A N D I N V E S T M E N T C O N T R A C T L I A B I L I T I E S
Insurance and investment contract liabilities represent the amounts required,
in addition to future premiums and investment income, to provide for
future benefit payments, policyholder dividends, commission and policy
administrative expenses for all insurance and annuity policies in force
with Lifeco. The Appointed Actuaries of Lifeco’s subsidiary companies are
responsible for determining the amount of the liabilities to make appropriate
provisions for Lifeco’s obligations to policyholders. The Appointed Actuaries
determine the insurance and investment contract liabilities using generally
accepted actuarial practices, according to the standards established by
the Canadian Institute of Actuaries. The valuation uses the Canadian Asset
Liability Method. This method involves the projection of future events in order
to determine the amount of assets that must be set aside currently to provide
for all future obligations and involves a significant amount of judgment.
In the computation of insurance contract liabilities, valuation assumptions
have been made regarding rates of mortality/morbidity, investment
returns, levels of operating expenses, rates of policy termination and
rates of utilization of elective policy options or provisions. The valuation
assumptions use best estimates of future experience together with a
margin for adverse deviation. These margins are necessary to provide
for possibilities of misestimation and/or future deterioration in the best
estimate assumptions and provide reasonable assurance that insurance
contract liabilities cover a range of possible outcomes. Margins are reviewed
periodically for continued appropriateness.
Additional detail regarding these estimates can be found in Note 2 to the
Corporation’s 2011 Consolidated Financial Statements.
I N C O M E T A X E S
The Corporation is subject to income tax laws in various jurisdictions.
The Corporation’s and its subsidiaries’ operations are complex and related tax
interpretations, regulations and legislation that pertain to its activities are
subject to continual change. Lifeco’s primary Canadian operating subsidiaries
are subject to a regime of specialized rules prescribed under the Income Tax Act
(Canada) for purposes of determining the amount of the companies’ income
that will be subject to tax in Canada. Accordingly, the provision for income
taxes represents the applicable company’s management’s interpretation
of the relevant tax laws and its estimate of current and future income tax
implications of the transactions and events during the period. Deferred
tax assets and liabilities are recorded based on expected future tax rates and
management’s assumptions regarding the expected timing of the reversal
of temporary differences. The Corporation has substantial deferred income
tax assets. The recognition of deferred tax assets depends on management’s
assumption that future earnings will be sufficient to realize the deferred
benefit. The amount of the asset recorded is based on management’s best
estimate of the timing of the reversal of the asset.
The audit and review activities of the Canada Revenue Agency and other
jurisdictions’ tax authorities affect the ultimate determination of the
amounts of income taxes payable or receivable, future income tax assets
or liabilities and income tax expense. Therefore, there can be no assurance
that taxes will be payable as anticipated and/or the amount and timing
of receipt or use of the tax‑related assets will be as currently expected.
Management’s experience indicates the taxation authorities are more
aggressively pursuing perceived tax issues and have increased the resources
they put to these efforts.
E M P L O Y E E F U T U R E B E N E F I T S
The Corporation and its subsidiaries maintain contributor y and non‑
contributory defined benefit and defined contribution pension plans for
certain employees and advisors. The defined benefit pension plans provide
pensions based on length of service and final average pay. Certain pension
payments are indexed either on an ad hoc basis or a guaranteed basis.
The defined contribution pension plans provide pension benefits based on
accumulated employee and Corporation contributions. The Corporation
and its subsidiaries also provide post‑employment health, dental and life
insurance benefits to eligible employees and advisors. For further information
on the Corporation’s pension plans and other post‑employment benefits
refer to Note 27 to the Corporation’s 2011 Consolidated Financial Statements.
Accounting for pension and other post‑employment benefits requires
estimates of future returns on plan assets, expected increases in
compensation levels, trends in healthcare costs, and the period of time
over which benefits will be paid, as well as the appropriate discount rate
for accrued benefit obligations. These assumptions are determined by
management using actuarial methods and are reviewed and approved
annually. Emerging experience, which may differ from the assumptions, will
be revealed in future valuations and will affect the future financial position
of the plans and net periodic benefit costs.
D E F E R R E D S E L L I N G C O M M I S S I O N S
Commissions paid on the sale of certain mutual fund products are deferred
and amortized over a maximum period of seven years. IGM regularly reviews
the carrying value of deferred selling commissions with respect to any events
or circumstances that indicate impairment. Among the tests performed
by IGM to assess recoverability is the comparison of the future economic
benefits derived from the deferred selling commission asset in relation to its
carrying value. At December 31, 2011, there were no indications of impairment
to deferred selling commissions.

P O W E R C O R P O R A T I O N O F C A N A D A 2 0 11 A N N U A L R E P O R T 29
F U T U R E A C C O U N T I N G C H A N G E S
The Corporation continues to monitor the potential changes proposed by
the IASB and to consider the impact changes in the standards may have on
the Corporation’s operations.
In addition, the Corporation may be impacted in the future by the following
IFRS and is currently evaluating the impact these future standards will have
on its consolidated financial statements when they become effective:
> IFRS 4 – Insurance Contracts The IASB issued an exposure draft
proposing changes to the accounting standard for insurance contracts
in July 2010. The proposal would require an insurer to measure insurance
liabilities using a model focusing on the amount, timing, and uncertainty
of future cash flows associated with fulfilling its insurance contracts.
This is vastly different from the connection between insurance assets
and liabilities considered under CALM and may cause significant volatility
in the results of Lifeco. The exposure draft also proposes changes to the
presentation and disclosure within the financial statements.
Lifeco will continue to measure insurance contract liabilities using CALM
until such time when a new IFRS for insurance contract measurement is
issued. A final standard is not expected to be implemented for several years;
Lifeco continues to actively monitor developments in this area.
> IFRS 7 – Financial Instruments: Disclosure Effective for the Corporation
on January 1, 2013, the IASB issued amendments to IFRS 7 regarding
disclosure of offsetting financial assets and financial liabilities. The
amendments will allow users of financial statements to improve their
understanding of transfer transactions of financial assets (for example,
securitizations), including understanding the possible effects of any
risks that may remain with the entity that transferred the assets. The
amendments also require additional disclosures if a disproportionate
amount of transfer transactions are undertaken near the end of a
reporting period.
> IFRS 9 – Financial Instruments The IASB approved the adoption
of the proposed new Financial Instruments standard to be effective
January 1, 2015.
The new standard requires all financial assets to be classified on initial
recognition at amortized cost or fair value while eliminating the existing
categories of available for sale, held to maturity, and loans and receivables.
The new standard also requires:
• embedded derivatives to be assessed for classification together with
their financial asset host;
• a single expected loss impairment method be used for financial
assets; and
• amendments to the criteria for hedge accounting and measuring
effectiveness.
The full impact of IFRS 9 on the Corporation will be evaluated after
the remaining stages of the IASB’s project to replace IAS 39, Financial
Instruments: Recognition and Measurement — impairment methodology,
hedge accounting, and asset and liability offsetting — are finalized.
The Corporation continues to actively monitor developments in this area.
> IFRS 10 – Consolidated Financial Statements Effective for the
Corporation on January 1, 2013, IFRS 10, Consolidated Financial Statements
uses consolidated principles based on a revised definition of control.
The definition of control is dependent on the power of the investor to direct
the activities of the investee, the ability of the investor to derive variable
benefits from its holdings in the investee, and a direct link between the
power to direct activities and receive benefits.
> IFRS 11 – Joint Arrangements Effective for the Corporation on January 1,
2013, IFRS 11, Joint Arrangements separates jointly controlled entities
between joint operations and joint ventures. The standard has eliminated
the option of using proportionate consolidation in accounting for interests
in joint ventures, now requiring an entity to use the equity method of
accounting for interests in joint ventures.
> IFRS 12 – Disclosure of Interest in Other Entities Effective for the
Corporation on January 1, 2013, IFRS 12, Disclosure of Interest in Other Entities
proposes new disclosure requirements for the interest an entity has in
subsidiaries, joint arrangements, associates, and structured entities.
The standard requires enhanced disclosure, including how control was
determined and any restrictions that might exist on consolidated assets
and liabilities presented within the financial statements.
As a consequence of the issuance of IFRS 10, 11 and 12, the IASB also issued
amended and re‑titled IAS 27, Separate Financial Statements and IAS 28,
Investments in Associates and Joint Ventures. The new requirements are effective
for the Corporation on January 1, 2013.
> IFRS 13 – Fair Value Measurement Effective for the Corporation on
January 1, 2013, IFRS 13, Fair Value Measurement provides guidance for the
measurement and disclosure of assets and liabilities held at fair value.
The standard refines the measurement and disclosure requirements
and aims to achieve consistency with other standard setters to improve
visibility to financial statement users.
> IAS 1 – Presentation of Financial Statements Effective for the
Corporation on January 1, 2013, IAS 1, Presentation of Financial Statements
includes requirements that other comprehensive income be classified
by nature and grouped between those items that will be classified
subsequently to profit or loss (when specific conditions are met) and
those that will not be reclassified. Other amendments include changes
to discontinued operations and overall financial statement presentation.
> IAS 19 – Employee Benefits The IASB published an amended version of
this standard in June 2011 that eliminates the corridor approach for actuarial
gains and losses resulting in those gains and losses being recognized
immediately through other comprehensive income while the net pension
asset or liability would reflect the full funded status of the plan on the
balance sheets. Further, the standard includes changes to how the defined
benefit obligation and the fair value of the plan assets would be presented
within the financial statements of an entity.
The Corporation will continue to use the corridor method until January 1,
2013, when the revised IAS for employee benefits becomes effective.
> IAS 32 – Financial Instruments Presentation In December 2011, the IASB
issued amendments to IAS 32 which clarify the existing requirements for
offsetting financial assets and financial liabilities. The amendments will
be effective for the Corporation on January 1, 2014.

REVIEW OF FINANCIAL PERFORMANCEP O W E R C O R P O R A T I O N O F C A N A D A 2 0 11 A N N U A L R E P O R T30
R I S K F A C T O R S
There are certain risks inherent in an investment in the securities of the
Corporation and in the activities of the Corporation, including the following
and others, which investors should carefully consider before investing in
securities of the Corporation. This description of risks does not include all
possible risks, and there may be other risks of which the Corporation is not
currently aware.
Power Corporation is a holding company whose principal asset is its
controlling interest in Power Financial. Power Financial holds substantial
interests in the financial services industry through its controlling interest in
each of Lifeco and IGM. As a result, investors in Power Corporation are subject
to the risks attributable to its subsidiaries, including those as the principal
shareholder of Power Financial, which in turn has the risks attributable to
its subsidiaries, including those as the principal shareholder of each of Lifeco
and IGM.
As a holding company, Power Corporation’s ability to pay interest and
other operating expenses and dividends, to meet its obligations and
to complete current or desirable future enhancement opportunities or
acquisitions generally depends upon receipt of sufficient dividends from
its principal subsidiaries and other investments and its ability to raise
additional capital. The likelihood that shareholders of Power Corporation
will receive dividends will be dependent upon the operating performance,
profitability, financial position and creditworthiness of the principal direct
and indirect subsidiaries of Power Corporation and on their ability to pay
dividends to Power Corporation. The payment of interest and dividends by
certain of these principal subsidiaries to Power Corporation is also subject
to restrictions set forth in insurance, securities and corporate laws and
regulations which require that solvency and capital standards be maintained
by such companies. If required, the ability of Power Corporation to arrange
additional financing in the future will depend in part upon prevailing market
conditions as well as the business performance of Power Corporation and
its subsidiaries. In recent years, global financial conditions and market
events have experienced increased volatility and resulted in the tightening
of credit that has reduced available liquidity and overall economic activity.
There can be no assurance that debt or equity financing will be available,
or, together with internally generated funds, will be sufficient to meet or
satisfy Power Corporation’s objectives or requirements or, if the foregoing
are available to Power Corporation, that they will be on terms acceptable to
Power Corporation. The inability of Power Corporation to access sufficient
capital on acceptable terms could have a material adverse effect on Power
Corporation’s business, prospects, dividend paying capability and financial
condition, and further enhancement opportunities or acquisitions.
The market price for Power Corporation’s securities may be volatile and
subject to wide fluctuations in response to numerous factors, many of which
are beyond Power Corporation’s control. Economic conditions may adversely
affect Power Corporation, including fluctuations in foreign exchange,
inflation and interest rates, as well as monetary policies, business investment
and the health of capital markets in Canada, the United States, Europe and
Asia. In recent years, financial markets have experienced significant price
and volume fluctuations that have affected the market prices of equity
securities held by the Corporation and its subsidiaries, and that have often
been unrelated to the operating performance, underlying asset values or
prospects of such companies. Additionally, these factors, as well as other
related factors, may cause decreases in asset values that are deemed
to be significant or prolonged, which may result in impairment losses.
In periods of increased levels of volatility and related market turmoil, Power
Corporation’s subsidiaries’ operations could be adversely impacted and the
trading price of Power Corporation’s securities may be adversely affected.
O F F - B A L A N C E S H E E T A R R A N G E M E N T S
G U A R A N T E E S
In the normal course of their businesses, the Corporation and its subsidiaries
may enter into certain agreements, the nature of which precludes the
possibility of making a reasonable estimate of the maximum potential
amount the Corporation or subsidiary could be required to pay third parties,
as some of these agreements do not specify a maximum amount and
the amounts are dependent on the outcome of future contingent events,
the nature and likelihood of which cannot be determined.
L E T T E R S O F C R E D I T
In the normal course of their reinsurance business, Lifeco’s subsidiaries
provide letters of credit to other parties or beneficiaries. A beneficiary will
typically hold a letter of credit as collateral in order to secure statutory credit
for reserves ceded to or amounts due from Lifeco’s subsidiaries. A letter of
credit may be drawn upon demand. If an amount is drawn on a letter of credit
by a beneficiary, the bank issuing the letter of credit will make a payment to
the beneficiary for the amount drawn, and Lifeco’s subsidiaries will become
obligated to repay this amount to the bank.
Lifeco, through certain of its operating subsidiaries, has provided letters of
credit to both external and internal parties, which are described in Note 32
to the Corporation’s 2011 Consolidated Financial Statements.
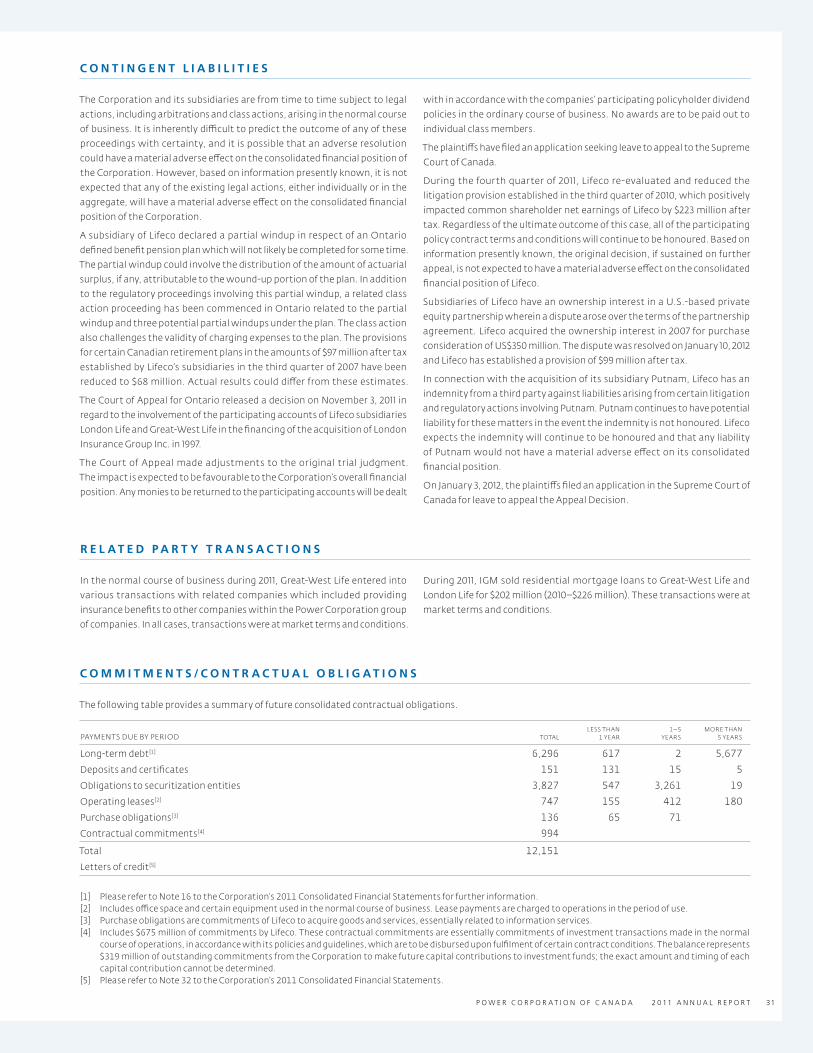
P O W E R C O R P O R A T I O N O F C A N A D A 2 0 11 A N N U A L R E P O R T 31
C O N T I N G E N T L I A B I L I T I E S
The Corporation and its subsidiaries are from time to time subject to legal
actions, including arbitrations and class actions, arising in the normal course
of business. It is inherently difficult to predict the outcome of any of these
proceedings with certainty, and it is possible that an adverse resolution
could have a material adverse effect on the consolidated financial position of
the Corporation. However, based on information presently known, it is not
expected that any of the existing legal actions, either individually or in the
aggregate, will have a material adverse effect on the consolidated financial
position of the Corporation.
A subsidiary of Lifeco declared a partial windup in respect of an Ontario
defined benefit pension plan which will not likely be completed for some time.
The partial windup could involve the distribution of the amount of actuarial
surplus, if any, attributable to the wound‑up portion of the plan. In addition
to the regulatory proceedings involving this partial windup, a related class
action proceeding has been commenced in Ontario related to the partial
windup and three potential partial windups under the plan. The class action
also challenges the validity of charging expenses to the plan. The provisions
for certain Canadian retirement plans in the amounts of $97 million after tax
established by Lifeco’s subsidiaries in the third quarter of 2007 have been
reduced to $68 million. Actual results could differ from these estimates.
The Court of Appeal for Ontario released a decision on November 3, 2011 in
regard to the involvement of the participating accounts of Lifeco subsidiaries
London Life and Great‑West Life in the financing of the acquisition of London
Insurance Group Inc. in 1997.
The Court of Appeal made adjustments to the original trial judgment.
The impact is expected to be favourable to the Corporation’s overall financial
position. Any monies to be returned to the participating accounts will be dealt
with in accordance with the companies’ participating policyholder dividend
policies in the ordinary course of business. No awards are to be paid out to
individual class members.
The plaintiffs have filed an application seeking leave to appeal to the Supreme
Court of Canada.
During the fourth quarter of 2011, Lifeco re‑evaluated and reduced the
litigation provision established in the third quarter of 2010, which positively
impacted common shareholder net earnings of Lifeco by $223 million after
tax. Regardless of the ultimate outcome of this case, all of the participating
policy contract terms and conditions will continue to be honoured. Based on
information presently known, the original decision, if sustained on further
appeal, is not expected to have a material adverse effect on the consolidated
financial position of Lifeco.
Subsidiaries of Lifeco have an ownership interest in a U.S.‑based private
equity partnership wherein a dispute arose over the terms of the partnership
agreement. Lifeco acquired the ownership interest in 2007 for purchase
consideration of US$350 million. The dispute was resolved on January 10, 2012
and Lifeco has established a provision of $99 million after tax.
In connection with the acquisition of its subsidiary Putnam, Lifeco has an
indemnity from a third party against liabilities arising from certain litigation
and regulatory actions involving Putnam. Putnam continues to have potential
liability for these matters in the event the indemnity is not honoured. Lifeco
expects the indemnity will continue to be honoured and that any liability
of Putnam would not have a material adverse effect on its consolidated
financial position.
On January 3, 2012, the plaintiffs filed an application in the Supreme Court of
Canada for leave to appeal the Appeal Decision.
R E L A T E D P A R T Y T R A N S A C T I O N S
In the normal course of business during 2011, Great‑West Life entered into
various transactions with related companies which included providing
insurance benefits to other companies within the Power Corporation group
of companies. In all cases, transactions were at market terms and conditions.
During 2011, IGM sold residential mortgage loans to Great‑West Life and
London Life for $202 million (2010–$226 million). These transactions were at
market terms and conditions.
C O M M I T M E N T S / C O N T R A C T U A L O B L I G A T I O N S
The following table provides a summary of future consolidated contractual obligations.
PAYMENTS DUE BY PERIOD TOTALLESS THAN
1 YEAR1 – 5
YEARSMORE THAN
5 YEARS
Long‑term debt [1] 6,296 617 2 5,677
Deposits and certificates 151 131 15 5
Obligations to securitization entities 3,827 547 3,261 19
Operating leases [2] 747 155 412 180
Purchase obligations [3] 136 65 71
Contractual commitments [4] 994
Total 12,151
Letters of credit [5]
[1] Please refer to Note 16 to the Corporation’s 2011 Consolidated Financial Statements for further information.[2] Includes office space and certain equipment used in the normal course of business. Lease payments are charged to operations in the period of use.[3] Purchase obligations are commitments of Lifeco to acquire goods and services, essentially related to information services.[4] Includes $675 million of commitments by Lifeco. These contractual commitments are essentially commitments of investment transactions made in the normal
course of operations, in accordance with its policies and guidelines, which are to be disbursed upon fulfilment of certain contract conditions. The balance represents $319 million of outstanding commitments from the Corporation to make future capital contributions to investment funds; the exact amount and timing of each capital contribution cannot be determined.
[5] Please refer to Note 32 to the Corporation’s 2011 Consolidated Financial Statements.

REVIEW OF FINANCIAL PERFORMANCEP O W E R C O R P O R A T I O N O F C A N A D A 2 0 11 A N N U A L R E P O R T32
F I N A N C I A L I N S T R U M E N T S
F A I R V A L U E O F F I N A N C I A L I N S T R U M E N T S
The following table presents the fair value of the Corporation’s financial
instruments. Fair value represents the amount that would be exchanged in
an arm’s‑length transaction between willing parties and is best evidenced by
a quoted market price, if one exists. Fair values are management’s estimates
and are generally calculated using market conditions at a specific point in
time and may not reflect future fair values. The calculations are subjective
in nature, involve uncertainties and matters of significant judgment (please
refer to Note 29 to the Corporation’s 2011 Consolidated Financial Statements).
AS AT DECEMBER 31 2011 2010
CARRYING VALUE FAIR VALUE
CARRYING VALUE FAIR VALUE
ASSETS
Cash and cash equivalents 3,741 3,741 4,016 4,016
Investments (excluding investment properties) 115,765 118,094 109,023 110,523
Funds held by ceding insurers 9,923 9,923 9,856 9,856
Derivative financial instruments 1,056 1,056 1,030 1,030
Other financial assets 3,638 3,638 3,755 3,755
Total financial assets 134,123 136,452 127,680 129,180
LIABILITIES
Deposits and certificates 151 152 835 840
Funds held under reinsurance contracts 169 169 149 149
Obligation to securitization entities 3,827 3,930 3,505 3,564
Debentures and other borrowings 6,296 7,029 6,720 7,334
Capital trust securities 533 577 535 596
Derivative financial instruments 430 430 244 244
Other financial liabilities 4,199 4,199 6,146 6,146
Total financial liabilities 15,605 16,486 18,134 18,873
D E R I V A T I V E F I N A N C I A L I N S T R U M E N T S
In the course of their activities, the Corporation and its subsidiaries use
derivative financial instruments. When using such derivatives, they only act
as limited end‑users and not as market‑makers in such derivatives.
The use of derivatives is monitored and reviewed on a regular basis by senior
management of the companies. The Corporation and its subsidiaries have
each established operating policies and processes relating to the use of
derivative financial instruments, which in particular aim at:
> prohibiting the use of derivative instruments for speculative purposes;
> documenting transactions and ensuring their consistency with risk
management policies;
> demonstrating the effectiveness of the hedging relationships; and
> monitoring the hedging relationship.
There were no major changes to the Corporation’s and its subsidiaries’
policies and procedures with respect to the use of derivative instruments in
2011. There has been a slight decrease in the notional amount outstanding
($14,996 million at December 31, 2011, compared with $15,019 million at
December 31, 2010) and an increase in the exposure to credit risk ($1,056 million
at December 31, 2011, compared with $1,030 million at December 31, 2010) that
represents the market value of those instruments, which are in a gain position.
See Note 28 to the Corporation’s 2011 Consolidated Financial Statements for
more information on the type of derivative financial instruments used by the
Corporation and its subsidiaries.
D I S C L O S U R E C O N T R O L S A N D P R O C E D U R E S
Based on their evaluations as of December 31, 2011, the Co‑Chief Executive Officers and the Chief Financial Officer have concluded that the Corporation’s
disclosure controls and procedures were effective as at December 31, 2011.
I N T E R N A L C O N T R O L O V E R F I N A N C I A L R E P O R T I N G
Based on their evaluations as of December 31, 2011, the Co‑Chief Executive Officers and the Chief Financial Officer have concluded that the Corporation’s internal
controls over financial reporting were effective as at December 31, 2011. During the fourth quarter of 2011, there have been no changes in the Corporation’s
internal control over financial reporting that have materially affected, or are reasonably likely to materially affect, the Corporation’s internal control over
financial reporting.

P O W E R C O R P O R A T I O N O F C A N A D A 2 0 11 A N N U A L R E P O R T 33
S U B S E Q U E N T E V E N T S
On February 28, 2012 the Corporation issued 8,000,000 5.6% Non‑Cumulative First Preferred Shares, Series G for gross proceeds of $200 million.
On February 23, 2012, Power Financial issued 10,000,000 5.5% Non‑Cumulative First Preferred Shares, Series R for gross proceeds of $250 million.
On February 22, 2012, Lifeco issued 10,000,000 5.4% Non‑Cumulative First Preferred Shares, Series P for gross proceeds of $250 million.
S E L E C T E D A N N U A L I N F O R M A T I O N
FOR THE YEARS ENDED DECEMBER 31 2011 2010 2009
(IFRS) (IFRS)(PREVIOUS
CANADIAN GA AP)
Total revenue including discontinued operations 32,945 32,857 33,152
Operating earnings attributable to participating shareholders [1] 1,152 957 867
per share — basic 2.50 2.09 1.81
Net earnings attributable to participating shareholders 1,075 727 682
per share — basic 2.34 1.59 1.40
per share — diluted 2.32 1.57 1.40
Earnings from discontinued operations attributable to participating shareholders 26 1 1
per share — basic 0.05
per share — diluted 0.05
Earnings from continuing operations attributable to participating shareholders 1,049 726 681
per share — basic 2.29 1.59 1.40
per share — diluted 2.27 1.57 1.40
Consolidated assets 255,496 247,526 143,007
Total financial liabilities 15,605 18,134 14,014
Debentures and other borrowings 6,296 6,720 6,375
Shareholders’ equity 9,825 9,430 9,829
Book value per share 19.67 18.85 19.78
Number of participating shares outstanding (millions)
Participating preferred shares 48.9 48.9 48.9
Subordinate voting shares 411.0 409.8 408.4
Dividends per share (declared)
Participating shares 1.1600 1.1600 1.1600
First preferred shares
1986 Series 1.0500 0.8829 0.8960
Series A 1.4000 1.4000 1.4000
Series B 1.3375 1.3375 1.3375
Series C 1.4500 1.4500 1.4500
Series D 1.2500 1.2500 1.2500
[1] Operating earnings and operating earnings per share are non‑IFRS financial measures.

P O W E R C O R P O R A T I O N O F C A N A D A 2 0 11 A N N U A L R E P O R T34
Consolidated Balance Sheets
[IN MILLIONS OF CANADIAN DOLL ARS]DECEMBER 31,
2011DECEMBER 31,
2010JANUARY 1,
2010
ASSETS
Cash and cash equivalents [Note 5] 3,741 4,016 5,383
Investments [Note 6]
Bonds 79,186 74,250 67,942 Mortgages and other loans 21,541 20,209 20,613 Shares 7,876 7,737 7,584 Investment properties 3,201 2,957 2,615 Loans to policyholders 7,162 6,827 6,957
118,966 111,980 105,711Funds held by ceding insurers [Note 7] 9,923 9,856 10,984Reinsurance assets [Note 13] 2,061 2,533 2,800Investments in associates [Note 8] 2,341 2,565 2,948Owner-occupied properties [Note 9] 565 511 502Capital assets [Note 9] 340 320 305Derivative financial instruments [Note 28] 1,056 1,030 782Other assets [Note 10] 4,759 4,774 4,920Deferred tax assets [Note 19] 1,227 1,244 1,294Intangible assets [Note 11] 5,107 5,111 5,279Goodwill [Note 11] 8,828 8,759 8,686Segregated funds for the risk of unit holders [Note 12] 96,582 94,827 87,495
Total assets 255,496 247,526 237,089
LIABILITIES
Insurance contract liabilities [Note 13] 114,730 107,405 105,028Investment contract liabilities [Note 13] 782 791 841Deposits and certificates [Note 14] 151 835 907Funds held under reinsurance contracts 169 149 331Obligation to securitization entities [Note 15] 3,827 3,505 3,310Debentures and other borrowings [Note 16] 6,296 6,720 6,339Capital trust securities [Note 17] 533 535 540Derivative financial instruments [Note 28] 430 244 359Preferred shares of subsidiaries – – 499Other liabilities [Note 18] 5,668 7,530 6,763Deferred tax liabilities [Note 19] 1,293 1,134 1,003Insurance and investment contracts on account of unit holders [Note 12] 96,582 94,827 87,495
Total liabilities 230,461 223,675 213,415
EQUITY
Stated capital [Note 20]
Non-participating shares 779 783 787 Participating shares 571 549 526Retained earnings 8,119 7,557 7,374Reserves 356 541 894
Total shareholders’ equity 9,825 9,430 9,581Non-controlling interests [Note 22] 15,210 14,421 14,093
Total equity 25,035 23,851 23,674
Total liabilities and equity 255,496 247,526 237,089
Approved by the Board of Directors
Signed, Signed,
James R. Nininger Michel Plessis-Bélair
Director Director
CONSOLIDATED FINANCIAL STATEMENTS

P O W E R C O R P O R A T I O N O F C A N A D A 2 0 11 A N N U A L R E P O R T 35
Consolidated Statements of Earnings
FOR THE YEARS ENDED DECEMBER 31[IN MILLIONS OF CANADIAN DOLL ARS, EXCEPT PER SHARE AMOUNTS] 2011 2010
REVENUES
Premium income
Gross premiums written 20,013 20,404 Ceded premiums (2,720) (2,656)
Total net premiums 17,293 17,748
Net investment income [Note 6]
Regular net investment income 5,720 5,723 Change in fair value 4,154 3,785
9,874 9,508Fee and media income 5,745 5,564
Total revenues 32,912 32,820
EXPENSES
Policyholder benefits
Insurance and investment contracts
Gross 16,591 17,550 Ceded (1,217) (2,208)
15,374 15,342Policyholder dividends and experience refunds 1,424 1,466Change in insurance and investment contract liabilities 6,245 6,417
Total paid or credited to policyholders 23,043 23,225Commissions 2,312 2,216Operating and administrative expenses [Note 25] 3,501 4,299Financing charges [Note 26] 443 465
Total expenses 29,299 30,205
3,613 2,615Share of earnings (losses) of investments in associates [Note 8] (20) 124
Earnings before income taxes — continuing operations 3,593 2,739Income taxes [Note 19] 711 532
Net earnings — continuing operations 2,882 2,207Net earnings — discontinued operations [Note 4] 63 2
Net earnings 2,945 2,209
Attributable to
Non‑controlling interests [Note 22] 1,829 1,441 Non‑participating shareholders 41 41 Participating shareholders 1,075 727
2,945 2,209
Earnings per participating share [Note 30]
Net earnings attributable to participating shareholders
— Basic 2.34 1.59 — Diluted 2.32 1.57
Net earnings from continuing operations attributable to participating shareholders
— Basic 2.29 1.59 — Diluted 2.27 1.57

P O W E R C O R P O R A T I O N O F C A N A D A 2 0 11 A N N U A L R E P O R T36
Consolidated Statements of Comprehensive Income
FOR THE YEARS ENDED DECEMBER 31[IN MILLIONS OF CANADIAN DOLL ARS] 2011 2010
Net earnings 2,945 2,209
Other comprehensive income (loss)
Net unrealized gains (losses) on available‑for‑sale assets
Unrealized gains (losses) 111 257
Income tax (expense) benefit (68) (47)
Realized (gains) losses transferred to net earnings (198) 24
Income tax expense (benefit) 43 20
(112) 254
Net unrealized gains (losses) on cash flow hedges
Unrealized gains (losses) (15) 77
Income tax (expense) benefit 10 (27)
Realized (gains) losses transferred to net earnings (7) 2
Income tax expense (benefit) (1) (1)
(13) 51
Net unrealized foreign exchange gains (losses) on translation of foreign operations 261 (619)
Share of other comprehensive income of associates (222) (446)
Other comprehensive income (loss) (86) (760)
Total comprehensive income 2,859 1,449
Attributable to
Non‑controlling interests 1,937 1,045
Non‑participating shareholders 41 41
Participating shareholders 881 363
2,859 1,449
CONSOLIDATED FINANCIAL STATEMENTS
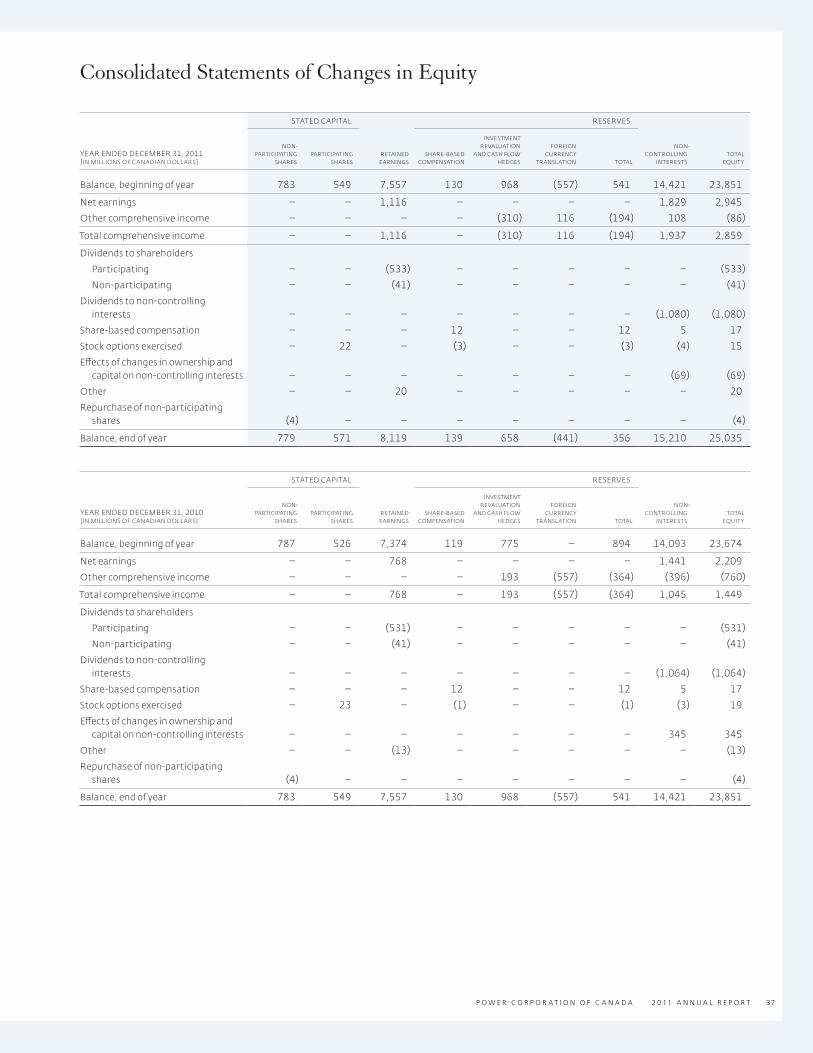
P O W E R C O R P O R A T I O N O F C A N A D A 2 0 11 A N N U A L R E P O R T 37
Consolidated Statements of Changes in Equity
STATED CAPITAL RESERVES
YEAR ENDED DECEMBER 31, 2011[IN MILLIONS OF CANADIAN DOLL ARS]
NON‑PARTICIPATING
SHARESPARTICI PATING
SHARESRETAINED
EARNINGSSHARE‑BASED
COMPENSATION
INVESTMENT REVALUATION
AND CASH FLOW HEDGES
FOREIGN CURRENCY
TRANSLATION TOTAL
NON‑ CONTROLLING INTERESTS
TOTAL EQUITY
Balance, beginning of year 783 549 7,557 130 968 (557) 541 14,421 23,851
Net earnings – – 1,116 – – – – 1,829 2,945
Other comprehensive income – – – – (310) 116 (194) 108 (86)
Total comprehensive income – – 1,116 – (310) 116 (194) 1,937 2,859
Dividends to shareholders
Participating – – (533) – – – – – (533)
Non‑participating – – (41) – – – – – (41)
Dividends to non‑controlling interests – – – – – – – (1,080) (1,080)
Share‑based compensation – – – 12 – – 12 5 17
Stock options exercised – 22 – (3) – – (3) (4) 15
Effects of changes in ownership and capital on non‑controlling interests – – – – – – – (69) (69)
Other – – 20 – – – – – 20
Repurchase of non‑participating shares (4) – – – – – – – (4)
Balance, end of year 779 571 8,119 139 658 (441) 356 15,210 25,035
STATED CAPITAL RESERVES
YEAR ENDED DECEMBER 31, 2010[IN MILLIONS OF CANADIAN DOLL ARS]
NON‑PARTICIPATING
SHARESPARTICI PATING
SHARESRETAINED
EARNINGSSHARE‑BASED
COMPENSATION
INVESTMENT REVALUATION
AND CASH FLOW HEDGES
FOREIGN CURRENCY
TRANSLATION TOTAL
NON‑ CONTROLLING INTERESTS
TOTAL EQUITY
Balance, beginning of year 787 526 7,374 119 775 – 894 14,093 23,674
Net earnings – – 768 – – – – 1,441 2,209
Other comprehensive income – – – – 193 (557) (364) (396) (760)
Total comprehensive income – – 768 – 193 (557) (364) 1,045 1,449
Dividends to shareholders
Participating – – (531) – – – – – (531)
Non‑participating – – (41) – – – – – (41)
Dividends to non‑controlling interests – – – – – – – (1,064) (1,064)
Share‑based compensation – – – 12 – – 12 5 17
Stock options exercised – 23 – (1) – – (1) (3) 19
Effects of changes in ownership and capital on non‑controlling interests – – – – – – – 345 345
Other – – (13) – – – – – (13)
Repurchase of non‑participating shares (4) – – – – – – – (4)
Balance, end of year 783 549 7,557 130 968 (557) 541 14,421 23,851

P O W E R C O R P O R A T I O N O F C A N A D A 2 0 11 A N N U A L R E P O R T38 CONSOLIDATED FINANCIAL STATEMENTS
Consolidated Statements of Cash Flows
FOR THE YEARS ENDED DECEMBER 31 [IN MILLIONS OF CANADIAN DOLL ARS] 2011 2010
OPERATING ACTIVITIES — CONTINUING OPERATIONS
Earnings before income taxes — continuing operations 3,593 2,739 Income tax paid, net of refunds received – (154) Adjusting items
Change in insurance and investment contract liabilities 6,029 6,654 Change in funds held by ceding insurers 464 649 Change in funds held under reinsurance contracts 25 (121) Change in deferred acquisition costs (15) (49) Change in reinsurance contracts 415 160 Change in fair value of financial instruments (4,182) (3,838) Other (904) 479
5,425 6,519
FINANCING ACTIVITIES — CONTINUING OPERATIONS
Dividends paid
By subsidiaries to non‑controlling interests (1,080) (1,064) Non‑participating shares (41) (41) Participating shares (533) (531)
(1,654) (1,636)
Issue of subordinate voting shares by the Corporation [Note 20] 22 23 Issue of common shares by subsidiaries 64 115 Issue of preferred shares by subsidiaries – 680 Repurchase of non‑participating shares by the Corporation [Note 20] (4) (4) Repurchase of common shares by subsidiaries (186) (157) Redemption of preferred shares by subsidiaries – (812) Changes in other debt instruments (5) (55) Issue of debentures [Note 16] – 700 Repayment of debentures [Note 16] (450) (200) Change in obligations related to assets sold under repurchase agreements (408) 5 Change in obligations to securitization entities 319 193 Change in deposits and certificates (4) (4) Other – (14)
(2,306) (1,166)
INVESTMENT ACTIVITIES — CONTINUING OPERATIONS
Bond sales and maturities 21,161 20,562 Mortgage loan repayments 1,756 2,102 Sale of shares 2,659 2,772 Change in loans to policyholders (198) (135) Change in repurchase agreements (1,053) 559 Investment in bonds (20,938) (27,469) Investment in mortgage loans (3,361) (2,088) Investment in shares (3,204) (2,340) Proceeds on disposal of business [Note 4] 199 – Investment in investment properties and other (151) (487)
(3,130) (6,524)
Effect of changes in exchange rates on cash and cash equivalents — continuing operations 24 (215)
Increase (decrease) in cash and cash equivalents — continuing operations 13 (1,386)Cash and cash equivalents, beginning of year 4,016 5,383Less: Cash and cash equivalents — discontinued operations, beginning of year [Note 5] (288) (269)
Cash and cash equivalents — continuing operations, end of year 3,741 3,728
NET CASH FROM CONTINUING OPERATING ACTIVITIES INCLUDE
Interest and dividends received 5,063 5,056 Interest paid 527 536

P O W E R C O R P O R A T I O N O F C A N A D A 2 0 11 A N N U A L R E P O R T 39
Notes to the Consolidated Financial StatementsAll tabular amounts are in millions of Canadian dollars, unless otherwise noted.
N O T E 1 C O R P O R AT E I N F O R M AT I O N
Power Corporation of Canada (Power Corporation or the Corporation) is
a publicly listed company (TSX: POW) incorporated and domiciled in Canada.
The registered address of the Corporation is 751 Victoria Square, Montréal,
Québec, Canada, H2Y 2J3.
Power Corporation is a diversified international management and holding
company that holds interests, directly or indirectly, in companies in the
financial services, communications and other business sectors.
The Consolidated Financial Statements (f inancial statements) of
Power Corporation for the year ended December 31, 2011 were approved for
issue by the Board of Directors on March 14, 2012.
N O T E 2 B A S I S O F P R E S E N TAT I O N A N D S U M M A R Y O F S I G N I F I C A N T A C C O U N T I N G P O L I C I E S
The financial statements of Power Corporation at December 31, 2011 have
been prepared in accordance with International Financial Reporting
Standards (IFRS).
The financial statements are prepared using IFRS accounting policies, which
were adopted by the Corporation for fiscal periods beginning on January 1,
2011, with an effective transition date of January 1, 2010. These accounting
policies are based on IFRS and the interpretations of the IFRS Interpretations
Committee that the Corporation applied consistently to all periods presented
throughout these financial statements.
The Corporation’s f inancial statements were previously prepared
in accordance with previous Canadian generally accepted accounting
principles — Part V (previous Canadian GAAP), which differs in some areas from
IFRS. See Note 3 for an explanation of how the adoption of IFRS has affected
the reported financial position, financial performance and accounting policies
of the Corporation. This note includes reconciliations and descriptions of the
effect of the transition from previous Canadian GAAP to IFRS.
The financial statements include the accounts of Power Corporation and all
its subsidiaries on a consolidated basis after elimination of intercompany
transactions and balances. Subsidiaries of the Corporation are fully
consolidated from the date of acquisition, being the date on which the
Corporation obtains control, and continue to be consolidated until the date
that such control ceases.
The principal subsidiaries of the Corporation are:
> Power Financial Corporation (Power Financial) (interest of 66.1%
(2010 – 66.1%)), Square Victoria Communications Group Inc. (interest of
100% (2010 – 100%)), whose major operating subsidiary companies are
Gesca ltée and Square Victoria Digital Properties Inc., and Victoria Square
Ventures (interest of 100% (2010 – 100%)).
> Power Financial holds a controlling interest in Great‑West Lifeco Inc.
(direct interest of 68.2% (2010 – 68.3%)), whose major operating subsidiary
companies are Great‑West Life & Annuity Insurance Company, London
Life Insurance Company, The Canada Life Assurance Company, The
Great‑West Life Assurance Company and Putnam Investments, LLC.
> Power Financial also holds a controlling interest in IGM Financial Inc.
(direct interest of 57.6% (2010 – 57.0%)), whose major operating subsidiary
companies are Investors Group Inc. and Mackenzie Financial Corporation.
> IGM Financial Inc. holds 4.0% (2010 – 4.0%) of the common shares of
Great‑West Lifeco Inc., and The Great‑West Life Assurance Company holds
3.6% (2010 – 3.5%) of the common shares of IGM Financial Inc.
> Power Financial also holds a 50% (2010 – 50%) interest in Parjointco N.V.
Parjointco holds a 56.5% (2010 – 54.1%) equity interest in Pargesa Holding
SA. Power Financial accounts for its investment in Parjointco using the
equity method.
U S E O F E S T I M A T E S A N D M E A S U R E M E N T U N C E R T A I N T Y
The preparation of financial statements in conformity with IFRS requires
management to exercise judgment in the process of applying accounting
policies and requires management to make estimates and assumptions
that affect the amounts reported in those financial statements and
accompanying notes. Actual results may differ from these estimates. Areas
where estimates are exercised by management include: the valuation and
classification of insurance and investment contract liabilities, determination
of the fair value and classification for certain financial assets and liabilities,
goodwill and indefinite life intangible assets, income taxes, deferred selling
commissions, contingencies, and pension plans and other post‑employment
benefits. The reported amounts and note disclosures are determined using
management’s best estimates.
The key areas where judgment has been applied include: the classification
of insurance and investment contracts, the classification of financial
instruments, deferred income reserves (DIR) and deferred acquisition costs
(DAC), the valuation of deferred income tax assets, the determination of which
financial assets should be derecognized, the level of componentization of
property, plant and equipment, the determination of relationships with
subsidiaries and special purpose entities and the identification of cash
generating units.
The results of the Corporation reflect management’s judgments regarding
the impact of prevailing global credit, equity and foreign exchange market
conditions. The estimation of insurance and investment contract liabilities
relies upon investment credit ratings. Lifeco’s practice is to use third‑party
independent credit ratings where available.
R E V E N U E R E C O G N I T I O N
For Lifeco, premiums for all types of insurance contracts and contracts with
limited mortality or morbidity risk are generally recognized as revenue when
due and collection is reasonably assured. When premiums are recognized,
insurance contract liabilities are computed with the result that benefits and
expenses are matched with such revenue.

P O W E R C O R P O R A T I O N O F C A N A D A 2 0 11 A N N U A L R E P O R T40 NOTES TO THE CONSOLIDATED FINANCIAL STATEMENTS
For Lifeco, fee income is recognized when the service is performed, the
amount is collectible and can be reasonably estimated. Fee income
primarily includes fees earned from the management of segregated fund
assets, proprietary mutual fund assets, fees earned on the administration of
administrative services only (ASO) Group health contracts and fees earned
from management services.
For IGM, management fees are based on the net asset value of mutual fund
assets under management and are recognized on an accrual basis as the
service is performed. Administration fees are also recognized on an accrual
basis as the service is performed. Distribution fees derived from mutual fund
and securities transactions are recognized on a trade‑date basis. Distribution
fees derived from insurance and other financial services transactions are
recognized on an accrual basis. These management, administration and
distribution fees are included in fee income in the statements of earnings.
Media revenues are recognized as follows: newspaper sales are recognized
at the time of delivery, advertising sales are recognized at the time the
advertisement is published.
C A S H A N D C A S H E Q U I V A L E N T S
Cash and cash equivalents include cash, current operating accounts,
overnight bank and term deposits with original maturities of three months
or less, fixed income securities with an original term to maturity of three
months or less, as well as other highly liquid investments with short‑term
maturities that are readily convertible to known amounts of cash.
I N V E S T M E N T S
Investments include bonds, mortgages and other loans, shares, investment
properties, and loans to policyholders. Investments are classified as either
fair value through profit or loss, available for sale, held to maturity, loans
and receivables or as non‑financial instruments, based on management’s
intention relating to the purpose and nature for which the instruments were
acquired or the characteristics of the investments. The Corporation currently
has not classified any investments as held to maturity.
Investments in bonds and shares normally actively traded on a public
market are either designated or classified as fair value through profit or
loss or classified as available for sale and are recorded on a trade‑date basis.
Fixed income securities are included in bonds on the Consolidated Balance
Sheets (balance sheets). Fair value through profit or loss investments are
recognized at fair value on the balance sheets with realized and unrealized
gains and losses reported in the Consolidated Statements of Earnings
(statements of earnings). Available‑for‑sale investments are recognized at
fair value on the balance sheets with unrealized gains and losses recorded
in other comprehensive income. Gains and losses are reclassified from other
comprehensive income and recorded in the statements of earnings when the
available‑for‑sale investment is sold or impaired. Interest income earned on
both fair value through profit or loss and available‑for‑sale bonds is recorded
as investment income earned in the statements of earnings. Impairment
losses on available‑for‑sale shares are recorded if the loss is significant or
prolonged and subsequent losses are recorded in net earnings.
Investments in shares where a market value cannot be measured reliably
are classified as available for sale and carried at cost. Investments in shares
in companies over which the Corporation exerts significant influence but
does not control are accounted for using the equity method of accounting.
Investments in mortgages and other loans, and bonds not normally actively
traded on a public market and other loans are classified as loans and
receivables and are carried at amortized cost using the effective interest
rate method, net of any allowance for credit losses. Interest income earned
and realized gains and losses on the sale of investments classified as loans
and receivables are recorded in net investment income in the statements
of earnings.
Investment properties are initially measured at cost and subsequently carried
at fair value on the balance sheets. All changes in fair value are recorded
as investment income earned in the statements of earnings. Fair values
for investment properties are determined using independent qualified
appraisal services. Property that is leased that would otherwise be classified
as investment property if owned by the Corporation is also included with
investment properties.
Fair value measurement Financial instrument carrying values necessarily
reflect the prevailing market liquidity and the liquidity premiums embedded
in the market pricing methods the Corporation relies upon.
The following is a description of the methodologies used to value instruments
carried at fair value:
Bonds at fair value through profit or loss and available for sale Fair values for
bonds classified as fair value through profit or loss or available for sale are
determined with reference to quoted market bid prices primarily provided
by third‑party independent pricing sources. Where prices are not quoted in
a normally active market, fair values are determined by valuation models.
The Corporation maximizes the use of observable inputs and minimizes the
use of unobservable inputs when measuring fair value. The Corporation
obtains quoted prices in active markets, when available, for identical assets at
the balance sheet date to measure bonds at fair value in its fair value through
profit or loss and available‑for‑sale portfolios.
The Corporation estimates the fair value of bonds not traded in active markets
by referring to actively traded securities with similar attributes, dealer
quotations, matrix pricing methodology, discounted cash flow analyses
and/or internal valuation models. This methodology considers such factors
as the issuer’s industry, the security’s rating, term, coupon rate and position
in the capital structure of the issuer, as well as yield curves, credit curves,
prepayment rates and other relevant factors. For bonds that are not traded
in active markets, valuations are adjusted to reflect illiquidity, and such
adjustments are generally based on available market evidence. In the absence
of such evidence, management’s best estimate is used.
Shares at fair value through profit or loss and available for sale Fair values for
publicly traded shares are generally determined by the last bid price for the
security from the exchange where it is principally traded. Fair values for shares
for which there is no active market are determined by discounting expected
future cash flows. The Corporation maximizes the use of observable inputs
and minimizes the use of unobservable inputs when measuring fair value.
The Corporation obtains quoted prices in active markets, when available, for
identical assets at the balance sheets dates to measure shares at fair value
in its fair value through profit or loss and available‑for‑sale portfolios.
Mortgages and other loans, and Bonds classif ied as Loans and receivables
Disclosure of fair values for bonds and mortgages and other loans, classified
as loans and receivables, are determined by discounting expected future cash
flows using current market rates.
NOTE 2 BASIS OF PRESENTATION AND SUMMARY OF SIGNIFICANT ACCOUNTING POLICIES (CONTINUED)
P O W E R C O R P O R A T I O N O F C A N A D A 2 0 11 A N N U A L R E P O R T 41
Investment properties Fair values for investment properties are determined
using independent appraisal services and include management adjustments
for material changes in property cash flows, capital expenditures or general
market conditions in the interim period between appraisals.
Impairment Investments are reviewed regularly on an individual basis to
determine impairment status. The Corporation considers various factors in
the impairment evaluation process, including, but not limited to, the financial
condition of the issuer, specific adverse conditions affecting an industry
or region, decline in fair value not related to interest rates, bankruptcy or
defaults, and delinquency in payments of interest or principal.
Investments are deemed to be impaired when there is no longer reasonable
assurance of timely collection of the full amount of the principal and interest
due. The market value of an investment is not a definitive indicator of
impairment, as it may be significantly influenced by other factors, including
the remaining term to maturity and liquidity of the asset. However, market
price must be taken into consideration when evaluating impairment.
For impaired mortgages and other loans, and bonds classified as loans and
receivables, provisions are established or impairments recorded to adjust
the carrying value to the net realizable amount. Wherever possible the fair
value of collateral underlying the loans or observable market price is used to
establish net realizable value. For impaired available‑for‑sale bonds, recorded
at fair value, the accumulated loss recorded in the investment revaluation
reserves is reclassified to net investment income. Impairments on available‑
for‑sale debt instruments are reversed if there is objective evidence that a
permanent recovery has occurred. All gains and losses on bonds classified
or designated as fair value through profit or loss are already recorded in the
earnings, therefore, a reduction due to impairment of these assets will be
recorded in earnings. As well, when determined to be impaired, contractual
interest is no longer accrued and previous interest accruals are reversed.
T R A N S A C T I O N C O S T S
Transaction costs are expensed as incurred for financial instruments classified
or designated as fair value through profit or loss. Transaction costs for
financial assets classified as available for sale or loans and receivables are
added to the value of the instrument at acquisition and taken into net
earnings using the effective interest method. Transaction costs for financial
liabilities classified as other than fair value through profit or loss are deducted
from the value of the instrument issued and taken into net earnings using the
effective interest method.
I N V E S T M E N T S I N A S S O C I A T E S
Associates are all entities in which the Corporation exercises significant
influence over the entity’s management and operating and financial policy,
without exercising control, and generally implies holding 20% to 50% of the
voting rights. Investments in associates are accounted for using the equity
method and are initially measured at cost. Subsequently, the share in earnings
or losses of the associate attributable to equity holders of the Corporation
is recognized in net earnings and the change in equity attributable to equity
holders of the Corporation is recognized in equity.
L O A N S T O P O L I C Y H O L D E R S
Loans to policyholders are shown at their unpaid principal balance and are
fully secured by the cash surrender values of the policies. The carrying value
of loans to policyholders approximates fair value.
R E I N S U R A N C E C O N T R A C T S
Lifeco, in the normal course of business, is both a user and a provider of
reinsurance in order to limit the potential for losses arising from certain
exposures. Assumed reinsurance refers to the acceptance of certain insurance
risks by Lifeco underwritten by another company. Ceded reinsurance refers
to the transfer of insurance risk, along with the respective premiums, to one
or more reinsurers who will share the risks. To the extent that assuming
reinsurers are unable to meet their obligations, Lifeco remains liable to its
policyholders for the portion reinsured. Consequently, allowances are made
for reinsurance contracts which are deemed uncollectible.
Assumed reinsurance premiums, commissions and claim settlements,
as well as the reinsurance assets associated with insurance and investment
contracts, are accounted for in accordance with the terms and conditions of
the underlying reinsurance contract. Reinsurance assets are reviewed for
impairment on a regular basis for any events that may trigger impairment.
Impairment occurs when there is objective evidence that Lifeco will not be
able to collect amounts due under the terms of the contract. The carrying
amount of a reinsurance asset is adjusted through an allowance account with
any impairment loss being recorded in the statements of earnings.
Any gains or losses on buying reinsurance are recognized in the statement of
earnings immediately at the date of purchase and are not amortized.
Premiums and claims ceded for reinsurance are deducted from premiums
earned and insurance and investment contract benefits. Assets and
liabilities related to reinsurance are reported on a gross basis in the balance
sheets. The amount of reserves ceded to reinsurers is estimated in a manner
consistent with the claim liability associated with reinsured risks.
D E R E C O G N I T I O N
IGM enters into transactions where it transfers financial assets recognized
on its balance sheets. The determination of whether the financial assets
are derecognized is based on the extent to which the risks and rewards
of ownership are transferred.
If substantially all of the risks and rewards of a financial asset are not retained,
IGM derecognizes the financial asset. The gains or losses and the servicing
fee revenue for financial assets that are derecognized are reported in net
investment income in the statements of earnings.
If all or substantially all risks and rewards are retained, the financial assets
are not derecognized and the transactions are accounted for as secured
financing transactions.
C A P I T A L A S S E T S A N D O W N E R - O C C U P I E D P R O P E R T I E S
Capital assets and property held for own use are carried at cost less
accumulated depreciation and impairments. Depreciation is charged so
as to write off the cost of assets, using the straight‑line method, over their
estimated useful lives, which vary from 3 to 50 years. Capital assets are tested
for impairment whenever events or changes in circumstances indicate that
the carrying amount may not be recoverable.
> Buildings, owner‑occupied properties, and components 10 – 50 years
> Equipment, furniture and fixtures 3 – 10 years
> Other capital assets 3 – 10 years
O T H E R A S S E T S
Trading account assets consist of investments in Putnam‑sponsored funds,
which are carried at fair value based on the net asset value of these funds.
Investments in these assets are included in other assets on the balance sheets
with realized and unrealized gains and losses reported in the statements
of earnings.
NOTE 2 BASIS OF PRESENTATION AND SUMMARY OF SIGNIFICANT ACCOUNTING POLICIES (CONTINUED)

P O W E R C O R P O R A T I O N O F C A N A D A 2 0 11 A N N U A L R E P O R T42 NOTES TO THE CONSOLIDATED FINANCIAL STATEMENTS
Also included in other assets are deferred acquisition costs relating to
investment contracts. Deferred acquisition costs are recognized if the costs
are incremental and incurred due to the contract being issued.
G O O D W I L L A N D I N T A N G I B L E A S S E T S
Goodwill represents the excess of purchase consideration over the fair value
of net assets acquired. Following recognition, goodwill is measured at cost
less any accumulated impairment losses.
Intangible assets represent finite life and indefinite life intangible assets
acquired and software acquired or internally developed. Finite life intangible
assets include the value of software, some customer contracts, distribution
channels, distribution contracts, technology, deferred selling commissions,
and property leases. Finite life intangible assets are tested for impairment
whenever events or changes in circumstances indicate that the carrying value
may not be recoverable. Intangible assets with finite lives are amortized on
a straight‑line basis over their estimated useful lives, not exceeding a period
of 30 years.
Deferred selling commissions Commissions paid by IGM on the sale
of certain mutual funds are deferred and amortized over their estimated
useful lives, not exceeding a period of seven years. Commissions paid on the
sale of deposits are deferred and amortized over their estimated useful lives,
not exceeding a period of five years. When a mutual fund client redeems
certain units in mutual funds, a redemption fee is paid by the client and is
recorded as revenue by IGM. The remaining unamortized deferred selling
commission asset attributable to the initial sale of these mutual fund units
is recorded as a disposal. IGM regularly reviews the carrying value of deferred
selling commissions with respect to any events or circumstances that indicate
impairment. Among the tests performed by IGM to assess recoverability is
the comparison of the future economic benefits derived from the deferred
selling commission asset in relation to its carrying value.
Indefinite life intangible assets include brands and trademarks, some
customer contracts, the shareholders’ portion of acquired future participating
account profits, trade names and mutual fund management contracts.
Amounts are classified as indefinite life intangible assets when based on an
analysis of all the relevant factors, and when there is no foreseeable limit
to the period over which the asset is expected to generate net cash inflows
for the Corporation. The identification of indefinite life intangible assets
is made by reference to relevant factors such as product life cycles, potential
obsolescence, industry stability and competitive position.
Impairment testing Goodwill and indefinite life intangible assets are tested
for impairment annually or more frequently if events indicate that impairment
may have occurred. Intangible assets that were previously impaired are
reviewed at each reporting date for evidence of reversal. In the event that
certain conditions have been met, the Corporation would be required to
reverse the impairment charge or a portion thereof.
Goodwill has been allocated to groups of cash generating units (CGU),
representing the lowest level in which goodwill is monitored for internal
reporting purposes. Goodwill is tested for impairment by comparing
the carrying value of the groups of CGU to the recoverable amount to which
the goodwill has been allocated. Intangible assets are tested for impairment
by comparing the asset’s carrying amount to its recoverable amount.
An impairment loss is recognized for the amount by which the asset’s
carrying amount exceeds its recoverable amount. The recoverable amount
is the higher of the asset’s fair value less cost to sell or value in use, which
is calculated using the present value of estimated future cash flows expected
to be generated.
S E G R E G A T E D F U N D S F O R T H E R I S K O F U N I T H O L D E R S
Segregated fund assets and liabilities arise from contracts where all financial
risks associated with the related assets are borne by unit holders and are
presented separately in the balance sheets at fair value. Investment income
and changes in market value of the segregated fund assets are offset by
a corresponding change in the segregated fund liabilities.
I N S U R A N C E A N D I N V E S T M E N T C O N T R A C T L I A B I L I T I E S
Contract classification Lifeco’s products are classified at contract inception,
for accounting purposes, as insurance, service or investment contracts,
depending on the existence of significant insurance risk. Significant insurance
risk exists when Lifeco agrees to compensate policyholders or beneficiaries
of the contract for specified uncertain future events that adversely affect the
policyholder and whose amount and timing are unknown. When significant
insurance risk exists, the contract is accounted for as an insurance contract
in accordance with IFRS 4, Insurance Contracts. Refer to Note 13 for discussion
of insurance risk.
In the absence of significant insurance risk, the contract is classified as an
investment or service contract. Investment contracts with discretionary
participating features are accounted for in accordance with IFRS 4 and
investment contracts without discretionary participating features are
accounted for in accordance with IAS 39, Financial Instruments: Recognition and
Measurement. Lifeco has not classified any contracts as investment contracts
with discretionary participating features. Service contracts mainly relate
to Group administrative services only (ASO) contracts and are accounted for
under IAS 18, Revenue Recognition.
Investment contracts may be reclassified as insurance contracts after
inception if insurance risk becomes significant. A contract that is classified
as an insurance contract at contract inception remains as such until all rights
and obligations under the contract are extinguished or expire.
Investment contracts are contracts that carry financial risk, which is the
risk of a possible future change in one or more of the following: interest rate,
commodity price, foreign exchange rate, or credit rating. Refer to Note 24
on Risk Management.
Measurement Insurance contract liabilities represent the amounts required,
in addition to future premiums and investment income, to provide for
future benefit payments, policyholder dividends, commission and policy
administrative expenses for all insurance and annuity policies in force
with Lifeco. The Appointed Actuaries of Lifeco’s subsidiary companies are
responsible for determining the amount of the liabilities to make appropriate
provisions for Lifeco’s obligations to policyholders. The Appointed Actuaries
determine the liabilities for insurance contracts and investment contracts
using generally accepted actuarial practices, according to the standards
established by the Canadian Institute of Actuaries. The valuation uses the
Canadian Asset Liability Method (CALM). This method involves the projection
of future events in order to determine the amount of assets that must be set
aside currently to provide for all future obligations and involves a significant
amount of judgment.
Investment contract liabilities are measured at fair value through profit and
loss, while certain annuity products are measured at amortized cost.
NOTE 2 BASIS OF PRESENTATION AND SUMMARY OF SIGNIFICANT ACCOUNTING POLICIES (CONTINUED)
P O W E R C O R P O R A T I O N O F C A N A D A 2 0 11 A N N U A L R E P O R T 43
D E F E R R E D I N C O M E R E S E R V E S
Included in other liabilities are deferred income reserves relating to investment
contract liabilities. Deferred income reserves are amortized on a straight‑line
basis to recognize the initial policy fees over the policy term, not to exceed
20 years, to release revenue as it is earned over the policy term.
P O L I C Y H O L D E R B E N E F I T S
Gross benefits and claims for life insurance contracts include the cost of all
claims arising during the year, and settlement of claims, as well as changes
in the gross valuation of insurance contracts. Death claims and surrenders
are recorded on the basis of notifications received. Maturities and annuity
payments are recorded when due.
F I N A N C I A L L I A B I L I T I E S
Financial liabilities, other than insurance and investment contract liabilities,
are classified as other liabilities. Debentures and other debt instruments,
capital trust securities and other liabilities are initially recorded on the balance
sheets at fair value and subsequently carried at amortized cost using the
effective interest rate method with amortization expense recorded in the
statements of earnings.
S H A R E - B A S E D P A Y M E N T S
The fair value‑based method of accounting is used for the valuation
of compensation expense for options granted to employees. Compensation
expense is recognized over the period that the stock options vest, with
a corresponding increase in share‑based compensation reserves. When the
stock options are exercised, the proceeds, together with the amount recorded
in share‑based compensation reserves, are added to the stated capital of the
entity issuing the corresponding shares.
Lifeco follows the liability method of accounting for share‑based awards
issued by its subsidiaries Putnam and PanAgora Asset Management, Inc.
Compensation expense is recognized as an increase to operating expenses in
the statements of earnings and a liability is recognized on the balance sheets
over the vesting period of the share‑based awards. The liability is remeasured
at fair value at each reporting period and is settled in cash when the shares
are purchased from employees.
R E P U R C H A S E A G R E E M E N T S
Lifeco enters into repurchase agreements with third‑party broker‑dealers in
which Lifeco sells securities and agrees to repurchase substantially similar
securities at a specified date and price. As substantially all of the risks and
rewards of ownership of assets are retained, Lifeco does not derecognize
the assets. Such agreements are accounted for as investment financings.
D E R I V A T I V E F I N A N C I A L I N S T R U M E N T S
The Corporation and its subsidiaries use derivative products as risk
management instruments to hedge or manage asset, liability and capital
positions, including revenues. The Corporation’s policy guidelines prohibit
the use of derivative instruments for speculative trading purposes.
All derivatives are recorded at fair value on the balance sheets. The method
of recognizing unrealized and realized fair value gains and losses depends
on whether the derivatives are designated as hedging instruments. For
derivatives that are not designated as hedging instruments, unrealized
and realized gains and losses are recorded in net investment income on the
statements of earnings. For derivatives designated as hedging instruments,
unrealized and realized gains and losses are recognized according to the
nature of the hedged item.
Derivatives are valued using market transactions and other market evidence
whenever possible, including market‑based inputs to models, broker or dealer
quotations or alternative pricing sources with reasonable levels of price
transparency. When models are used, the selection of a particular model
to value a derivative depends on the contractual terms of, and specific risks
inherent in the instrument, as well as the availability of pricing information
in the market. The Corporation generally uses similar models to value
similar instruments. Valuation models require a variety of inputs, including
contractual terms, market prices and rates, yield curves, credit curves,
measures of volatility, prepayment rates and correlations of such inputs.
To qualify for hedge accounting, the relationship between the hedged
item and the hedging instrument must meet several strict conditions on
documentation, probability of occurrence, hedge effectiveness and reliability
of measurement. If these conditions are not met, then the relationship
does not qualify for hedge accounting treatment and both the hedged item
and the hedging instrument are reported independently, as if there was
no hedging relationship.
Where a hedging relationship exists, the Corporation documents all
relationships between hedging instruments and hedged items, as well as
its risk management objectives and strategy for undertaking various hedge
transactions. This process includes linking derivatives that are used in
hedging transactions to specific assets and liabilities on the balance sheets
or to specific firm commitments or forecasted transactions. The Corporation
also assesses, both at the hedge’s inception and on an ongoing basis, whether
derivatives that are used in hedging transactions are effective in offsetting
changes in fair values or cash flows of hedged items. Hedge effectiveness is
reviewed quarterly through correlation testing.
Fair value hedges For fair value hedges, changes in fair value of
both the hedging instrument and the hedged item are recorded in net
investment income and consequently any ineffective portion of the hedge is
recorded immediately in net investment income.
Cash flow hedges For cash flow hedges, the effective portion of the
changes in fair value of the hedging instrument is recorded in the same
manner as the hedged item in either net investment income or other
comprehensive income, while the ineffective por tion is recognized
immediately in net investment income. Gains and losses that accumulate in
cash flow hedges reserves are recorded in net investment income in the same
period the hedged item affects net earnings. Gains and losses on cash flow
hedges are immediately reclassified from cash flow hedges reserves to net
investment income if and when it is probable that a forecasted transaction
is no longer expected to occur.
Net investment hedges Foreign exchange forward contracts may be used
to hedge net investment in foreign operations. Changes in the fair value of
these hedges are recorded in other comprehensive income. Hedge accounting
is discontinued when the hedging no longer qualifies for hedge accounting.
E M B E D D E D D E R I V A T I V E S
Embedded derivatives are treated as separate contracts and are recorded at
fair value on the balance sheet with changes in fair value in the statements of
earnings if their economic characteristics and risks are not closely related to
those of the host contract and the host contract is not itself recorded at fair
value through earnings. Embedded derivatives that meet the definition of an
insurance contract are accounted for and measured as an insurance contract.
NOTE 2 BASIS OF PRESENTATION AND SUMMARY OF SIGNIFICANT ACCOUNTING POLICIES (CONTINUED)

P O W E R C O R P O R A T I O N O F C A N A D A 2 0 11 A N N U A L R E P O R T44 NOTES TO THE CONSOLIDATED FINANCIAL STATEMENTS
F O R E I G N C U R R E N C Y T R A N S L A T I O N
The Corporation and its subsidiaries operate with multiple functional
currencies. The Corporation’s financial statements are prepared in Canadian
dollars, which is the functional and presentation currency of the Corporation.
For the purpose of presenting financial statements, assets and liabilities are
translated into Canadian dollars at the rate of exchange prevailing at the
balance sheet dates and all income and expenses are translated at an average
of daily rates. Unrealized foreign currency translation gains and losses on
the Corporation’s net investment in its foreign operations and associates
are presented separately as a component of other comprehensive income.
Unrealized gains and losses are recognized in earnings when there has been
a disposal of a foreign operation or associates.
All other assets and liabilities denominated in foreign currencies are translated
into each entity’s functional currency at exchange rates prevailing at the
balance sheet dates for monetary items and at exchange rates prevailing
at the transaction dates for non‑monetary items. Realized and unrealized
exchange gains and losses are included in net investment income and are not
material to the financial statements of the Corporation.
P E N S I O N P L A N S A N D O T H E R P O S T - E M P L O Y M E N T B E N E F I T S
The Corporation and its subsidiaries maintain defined benefit pension plans as
well as defined contribution pension plans for eligible employees and advisors.
The plans provide pension based on length of service and final average
earnings. The benefit obligation is actuarially determined and accrued using
the projected benefit method pro‑rated on service. Pension expense consists
of the aggregate of the actuarially computed cost of pension benefits provided
in respect of the current year’s service, and imputed interest on the accrued
benefit obligation, less expected returns on plan assets, which are valued at
market value. Past service costs are amortized on a straight‑line basis over
the average period until the benefits become vested. Vested past service costs
are recognized immediately in pension expense. For the Corporation’s defined
benefit plans, actuarial gains and losses are amortized into the statements of
earnings using the straight‑line method over the average remaining working
life of employees covered by the plan to the extent that the net cumulative
unrecognized actuarial gains and losses at the end of the previous reporting
period exceed corridor limits. The corridor is defined as ten per cent of the
greater of the present value of the defined benefit obligation or the fair value
of plan assets. The amortization charge is reassessed at the beginning of each
year. The cost of pension benefits is charged to earnings using the projected
benefit method pro‑rated on services.
The Corporation and its subsidiaries also have unfunded supplementary
pension plans for certain employees. Pension expense related to current
services is charged to earnings in the period during which the services
are rendered.
In addition, the Corporation and its subsidiaries provide certain post‑
employment healthcare, dental, and life insurance benefits to eligible retirees,
employees and advisors. The current cost of post‑employment health, dental
and life benefits is charged to earnings using the projected unit credit method
pro‑rated on services.
F U N D S H E L D B Y C E D I N G I N S U R E R S / F U N D S H E L D U N D E R R E I N S U R A N C E C O N T R A C T S
Under certain forms of reinsurance contracts, it is customary for the ceding
insurer to retain possession of the assets supporting the liabilities ceded.
Lifeco records an amount receivable from the ceding insurer or payable to
the reinsurer representing the premium due. Investment revenue on these
funds withheld is credited by the ceding insurer.
I N C O M E T A X E S
On December 20, 2010, the International Accounting Standards Board (IASB)
issued “Deferred Tax: Recovery of Underlying Assets (Amendments to IAS 12)”
concerning the determination of deferred tax on investment property
measured at fair market value. IAS 12 was updated to include a rebuttable
presumption that a deferred tax on investment property measured using
the fair value model in IAS 40 should be determined on the basis that its
carrying amount will be recovered through sale. The amendments are
mandatory for annual periods beginning on or after January 1, 2012, but
early adoption is permitted. Lifeco has elected to adopt the amendment
effective January 1, 2010.
The income tax expense for the period represents the sum of current income
tax and deferred income tax. Income tax is recognized as an expense
or income in profit or loss except to the extent that it relates to items that
are recognized outside profit or loss (whether in other comprehensive income
or directly in equity), in which case the income tax is also recognized outside
profit or loss.
Current income tax Current income tax is based on taxable income for
the year. Current tax liabilities (assets) for the current and prior periods are
measured at the amount expected to be paid to (recovered from) the taxation
authorities using the rates that have been enacted or substantively enacted
at the balance sheet date. Current tax assets and current income tax liabilities
are offset, if a legally enforceable right exists to offset the recognized amounts
and the entity intends either to settle on a net basis, or to realize the assets
and settle the liability simultaneously.
Deferred income tax Deferred income tax is the tax expected to be payable
or recoverable on tax loss carry forwards and on differences arising between
the carrying amounts of assets and liabilities in the financial statements and
the corresponding bases used in the computation of taxable income and is
accounted for using the balance sheet liability method. Deferred tax liabilities
are generally recognized for all taxable temporary differences and deferred tax
assets are recognized to the extent that it is probable that taxable profits will
be available against which deductible temporary differences can be utilized.
Such assets and liabilities are not recognized if the temporary difference arises
from the initial recognition of an asset or liability in a transaction other than
a business combination that at the time of the transaction affects neither
accounting nor taxable profit or loss.
Deferred tax assets and liabilities are measured at the tax rates expected to
apply in the year when the asset is realized or the liability is settled, based
on tax rates (and tax laws) that have been enacted or substantively enacted
at the balance sheet date. Deferred tax assets and deferred tax liabilities are
offset, if a legally enforceable right exists to set off current tax assets against
current income tax liabilities and the deferred income taxes relate to the same
taxable entity and the same taxation authority.
The carrying amount of deferred tax assets is reviewed at each balance sheet
date and reduced to the extent that it is probable that sufficient taxable profit
will be available to allow all or part of the deferred tax asset to be utilized.
Unrecognized deferred tax assets are reassessed at each balance sheet date
and are recognized to the extent that it has become probable that future
taxable profit will allow the deferred tax asset to be recovered.
NOTE 2 BASIS OF PRESENTATION AND SUMMARY OF SIGNIFICANT ACCOUNTING POLICIES (CONTINUED)

P O W E R C O R P O R A T I O N O F C A N A D A 2 0 11 A N N U A L R E P O R T 45
Deferred tax liabilities are recognized for taxable temporary differences
arising on investments in subsidiaries and associates, except where the
group controls the timing of the reversal of the temporary difference
and it is probable that the temporary differences will not reverse in the
foreseeable future.
Under the IFRS liability method, a provision for tax uncertainties which meet
the probable threshold for recognition is measured. Measurement of the
provision is based on the probability weighted average approach.
L E A S E S
Leases that do not transfer substantially all the risks and rewards of
ownership are classified as operating leases. Payments made under operating
leases, where the Corporation is the lessee, are charged to net earnings over
the period of use.
Where the Corporation is the lessor under an operating lease for its
investment property, the assets subject to the lease arrangement are
presented within the balance sheets. Income from these leases is recognized
in the statements of earnings on a straight‑line basis over the lease term.
E A R N I N G S P E R S H A R E
Basic earnings per share is determined by dividing net earnings available
to common shareholders by the weighted average number of common shares
outstanding for the year. Diluted earnings per share is determined using the
same method as basic earnings per share, except that the weighted average
number of common shares outstanding includes the potential dilutive effect
of outstanding stock options granted by the Corporation and its subsidiaries,
as determined by the treasury stock method.
F U T U R E A C C O U N T I N G C H A N G E S
The Corporation continues to monitor the potential changes proposed by
the IASB and to consider the impact changes in the standards may have on
the Corporation’s operations.
In addition, the Corporation may be impacted in the future by the following
IFRS and is currently evaluating the impact these future standards will have
on its consolidated financial statements when they become effective:
IFRS 4 – Insurance Contracts The IASB issued an exposure draft proposing
changes to the accounting standard for insurance contracts in July 2010.
The proposal would require an insurer to measure insurance liabilities using
a model focusing on the amount, timing, and uncertainty of future cash flows
associated with fulfilling its insurance contracts. This is vastly different from
the connection between insurance assets and liabilities considered under
CALM and may cause significant volatility in the results of Lifeco. The exposure
draft also proposes changes to the presentation and disclosure within the
financial statements.
Lifeco will continue to measure insurance contract liabilities using CALM until
such time when a new IFRS for insurance contract measurement is issued.
A final standard is not expected to be implemented for several years; Lifeco
continues to actively monitor developments in this area.
IFRS 7 – Financial Instruments: Disclosure Effective for the Corporation on
January 1, 2013, the IASB issued amendments to IFRS 7 regarding disclosure
of offsetting financial assets and financial liabilities. The amendments will
allow users of financial statements to improve their understanding of transfer
transactions of financial assets (for example, securitizations), including
understanding the possible effects of any risks that may remain with the
entity that transferred the assets. The amendments also require additional
disclosures if a disproportionate amount of transfer transactions are
undertaken near the end of a reporting period.
IFRS 9 – Financial Instruments The IASB approved the adoption of the
proposed new Financial Instruments standard to be effective January 1, 2015.
The new standard requires all financial assets to be classified on initial
recognition at amortized cost or fair value while eliminating the existing
categories of available for sale, held to maturity, and loans and receivables.
The new standard also requires:
> embedded derivatives to be assessed for classification together with their
financial asset host
> a single expected loss impairment method be used for financial assets
> amendments to the criteria for hedge accounting and measuring
effectiveness
The full impact of IFRS 9 on the Corporation will be evaluated after the
remaining stages of the IASB’s project to replace IAS 39, Financial Instruments:
Recognition and Measurement — impairment methodology, hedge accounting,
and asset and liability offsetting — are finalized. The Corporation continues
to actively monitor developments in this area.
IFRS 10 – Consolidated Financial Statements Effective for the Corporation
on January 1, 2013, IFRS 10, Consolidated Financial Statements uses consolidated
principles based on a revised definition of control. The definition of control is
dependent on the power of the investor to direct the activities of the investee,
the ability of the investor to derive variable benefits from its holdings in
the investee, and a direct link between the power to direct activities and
receive benefits.
IFRS 11 – Joint Arrangements Effective for the Corporation on January 1,
2013, IFRS 11, Joint Arrangements separates jointly controlled entities between
joint operations and joint ventures. The standard has eliminated the option
of using proportionate consolidation in accounting for interests in joint
ventures, now requiring an entity to use the equity method of accounting
for interests in joint ventures.
IFRS 12 – Disclosure of Interest in Other Entities Effective for the
Corporation on January 1, 2013, IFRS 12, Disclosure of Interest in Other Entities
proposes new disclosure requirements for the interest an entity has in
subsidiaries, joint arrangements, associates, and structured entities.
The standard requires enhanced disclosure, including how control was
determined and any restrictions that might exist on consolidated assets and
liabilities presented within the financial statements.
As a consequence of the issuance of IFRS 10, 11 and 12, the IASB also issued
amended and re‑titled IAS 27, Separate Financial Statements and IAS 28,
Investments in Associates and Joint Ventures. The new requirements are effective
for the Corporation on January 1, 2013.
IFRS 13 – Fair Value Measurement Effective for the Corporation on
January 1, 2013, IFRS 13, Fair Value Measurement provides guidance for the
measurement and disclosure of assets and liabilities held at fair value. The
standard refines the measurement and disclosure requirements and aims
to achieve consistency with other standard setters to improve visibility to
financial statement users.
IAS 1 – Presentation of Financial Statements Effective for the Corporation
on Januar y 1, 2013, IAS 1, Presentation of Financial Statements includes
requirements that other comprehensive income be classified by nature and
grouped between those items that will be classified subsequently to profit or
loss (when specific conditions are met) and those that will not be reclassified.
Other amendments include changes to discontinued operations and overall
financial statement presentation.
NOTE 2 BASIS OF PRESENTATION AND SUMMARY OF SIGNIFICANT ACCOUNTING POLICIES (CONTINUED)

P O W E R C O R P O R A T I O N O F C A N A D A 2 0 11 A N N U A L R E P O R T46 NOTES TO THE CONSOLIDATED FINANCIAL STATEMENTS
IAS 19 – Employee Benefits The IASB published an amended version of this
standard in June 2011 that eliminates the corridor approach for actuarial gains
and losses resulting in those gains and losses being recognized immediately
through other comprehensive income while the net pension asset or liability
would reflect the full funded status of the plan on the balance sheets. Further,
the standard includes changes to how the defined benefit obligation and
the fair value of the plan assets would be presented within the financial
statements of an entity.
The Corporation will continue to use the corridor method until January 1, 2013,
when the revised IAS for employee benefits becomes effective.
IAS 32 – Financial Instruments: Presentation In December 2011, the IASB
issued amendments to IAS 32 which clarify the existing requirements for
offsetting financial assets and financial liabilities. The amendments will be
effective for the Corporation on January 1, 2014.
N O T E 3 T R A N S I T I O N T O I F R S
Power Corporation’s annual financial statements have been prepared in
accordance with IFRS, as adopted by the Accounting Standards Board of
Canada for financial reporting periods beginning on or after January 1, 2011.
References made to International Accounting Standards (IAS) throughout
refer to the application of IAS and relate to the interpretations of the IFRS
Interpretations Committee.
These are the Corporation’s first annual consolidated financial statements
prepared in accordance with IFRS, with 2010 comparative figures restated
accordingly. Prior to the adoption of IFRS, the consolidated financial
statements were prepared in accordance with previous Canadian GAAP.
The effects of the transition to IFRS as of January 1, 2010 on the financial
position, financial performance and cash flows are noted below.
R E C O N C I L I A T I O N S O F P R E V I O U S C A N A D I A N G A A P T O I F R S
At transition to IFRS, the Corporation applied IFRS 1, which requires the
Corporation to reconcile shareholders’ equity and total comprehensive income
for prior periods presented. The adoption of IFRS has not substantially
changed the presentation of the Corporation’s cash flows, however, it has
resulted in certain changes to the Corporation’s reported financial position
and results of operations. IFRS has also resulted in a number of presentation
changes to the Corporation’s financial statements. In order for readers to
understand the effects of adopting IFRS, reconciliations of the Corporation’s
financial statements from previous Canadian GAAP to IFRS, along with
narrative explanations, have been provided below.
IFRS does not allow the use of hindsight to recreate or revise estimates
and consequently the estimates previously made by the Corporation under
previous Canadian GAAP were not revised when converting to IFRS, except
where necessary to reflect any difference in accounting policies.
The following reconciliations of previous Canadian GAAP to IFRS have
been prepared:
i) Reconciliation of the opening balance sheet as at January 1, 2010
ii) Reconciliation of net earnings attributable to shareholders for the year
ended December 31, 2010
iii) Reconciliation of total comprehensive income (loss) for the year ended
December 31, 2010
iv) Reconciliation of equity as at January 1, 2010, and December 31, 2010
NOTE 2 BASIS OF PRESENTATION AND SUMMARY OF SIGNIFICANT ACCOUNTING POLICIES (CONTINUED)

P O W E R C O R P O R A T I O N O F C A N A D A 2 0 11 A N N U A L R E P O R T 47
i ) RECONCIL IATION OF THE OPENING BAL ANCE SHEET AS AT JANUARY 1, 2010
REFERENCE
REPORTED UNDER PREVIOUS CGA AP
DECEMBER 31, 2009
CONVERSION ADJUSTMENTS
PRESENTATION AND RECL ASSI‑
FICATION ADJUSTMENTS
DATE OF TRANSITION
TO IFRS JANUARY 1,
2010
ASSETS
Cash and cash equivalents y 5,385 – (2) 5,383
Investments
Bonds 67,942 – – 67,942
Mortgages and other loans m 17,356 3,257 – 20,613
Shares r, p 7,463 121 – 7,584
Investment properties f, g, s 3,101 (85) (401) 2,615
Loans to policyholders 6,957 – – 6,957
102,819 3,293 (401) 105,711
Funds held by ceding insurers t 10,839 – 145 10,984
Reinsurance assets t – – 2,800 2,800
Investments in associates o, y 2,677 154 117 2,948
Owner‑occupied properties d, r – 40 462 502
Capital assets d, y 360 8 (63) 305
Derivative financial instruments m 844 (62) – 782
Other assets a, i, m, n, p, u, y 5,540 (225) (395) 4,920
Deferred tax assets q 1,281 13 – 1,294
Intangible assets l, y, n 4,502 (7) 784 5,279
Goodwill l, y 8,760 (13) (61) 8,686
Segregated funds for the risk of unit holders w – – 87,495 87,495
Total assets 143,007 3,201 90,881 237,089
LIABILITIES
Insurance contract liabilities f, g, h, t, u, v 102,651 (29) 2,406 105,028
Investment contract liabilities t, u, v – – 841 841
Deposits and certificates 907 – – 907
Funds held under reinsurance contracts t 186 – 145 331
Obligation to securitization entities m – 3,310 – 3,310
Debentures and other borrowings p 6,375 (36) – 6,339
Capital trust securities 540 – – 540
Derivative financial instruments m 364 (5) – 359
Preferred shares of subsidiaries p 503 (4) – 499
Other liabilities a, g, h, i, j, k, m, p, y 6,038 734 (9) 6,763
Deferred tax liabilities q, y 1,136 (136) 3 1,003
Non‑controlling interests p, x 14,478 (385) (14,093) –
Insurance and investment contracts on account of unit holders w – – 87,495 87,495
Total liabilities 133,178 3,449 76,788 213,415
EQUITY
Stated capital
Non‑participating shares 787 – – 787
Participating shares 526 – – 526
Retained earnings 8,742 (1,368) – 7,374
Contributed surplus p 117 2 – 119
Accumulated other comprehensive income (loss) b, c, p, q, r (343) 1,118 – 775
Total shareholders’ equity 9,829 (248) – 9,581
Non‑controlling interests p, x – – 14,093 14,093
Total equity 9,829 (248) 14,093 23,674
Total liabilities and equity 143,007 3,201 90,881 237,089
N O T E 3 T R A N S I T I O N T O I F R S (CONTINUED)
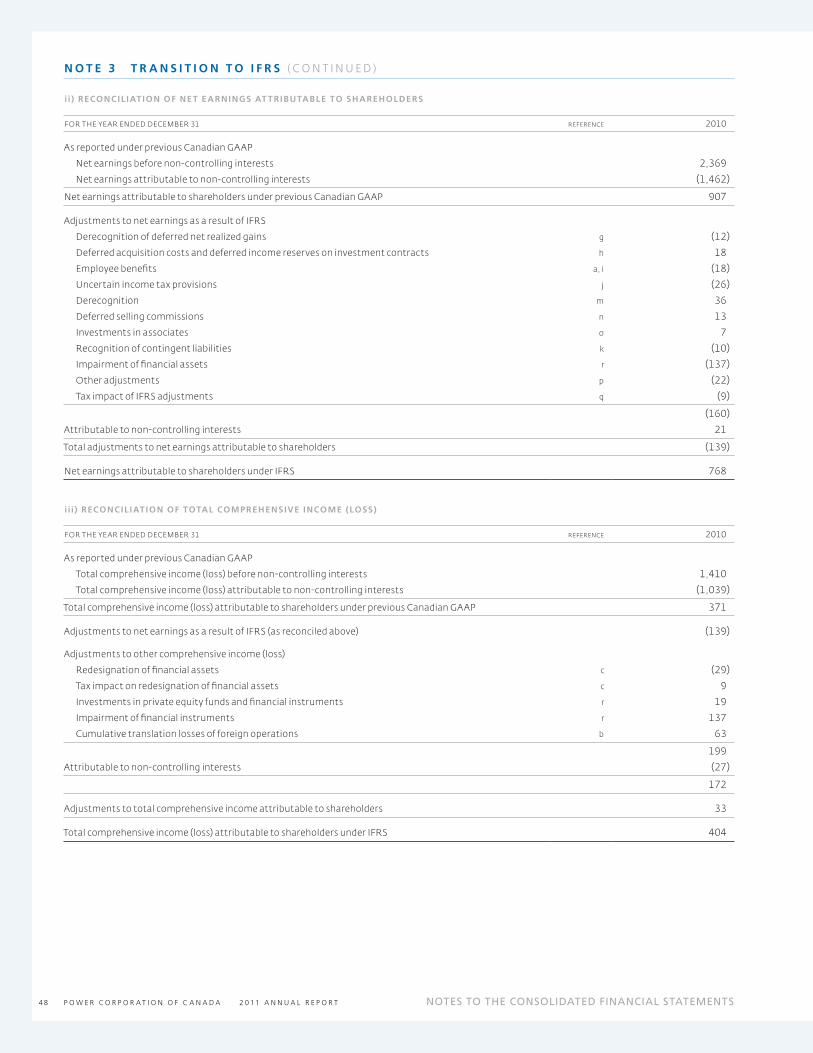
P O W E R C O R P O R A T I O N O F C A N A D A 2 0 11 A N N U A L R E P O R T48 NOTES TO THE CONSOLIDATED FINANCIAL STATEMENTS
i i ) RECONCIL IATION OF NET EARNINGS AT TRIBUTABLE TO SHAREHOLDERS
FOR THE YEAR ENDED DECEMBER 31 REFERENCE 2010
As reported under previous Canadian GAAP
Net earnings before non‑controlling interests 2,369
Net earnings attributable to non‑controlling interests (1,462)
Net earnings attributable to shareholders under previous Canadian GAAP 907
Adjustments to net earnings as a result of IFRS
Derecognition of deferred net realized gains g (12)
Deferred acquisition costs and deferred income reserves on investment contracts h 18
Employee benefits a, i (18)
Uncertain income tax provisions j (26)
Derecognition m 36
Deferred selling commissions n 13
Investments in associates o 7
Recognition of contingent liabilities k (10)
Impairment of financial assets r (137)
Other adjustments p (22)
Tax impact of IFRS adjustments q (9)
(160)
Attributable to non‑controlling interests 21
Total adjustments to net earnings attributable to shareholders (139)
Net earnings attributable to shareholders under IFRS 768
i i i ) RECONCIL IATION OF TOTAL COMPREHENSIVE INCOME (LOSS)
FOR THE YEAR ENDED DECEMBER 31 REFERENCE 2010
As reported under previous Canadian GAAP
Total comprehensive income (loss) before non‑controlling interests 1,410
Total comprehensive income (loss) attributable to non‑controlling interests (1,039)
Total comprehensive income (loss) attributable to shareholders under previous Canadian GAAP 371
Adjustments to net earnings as a result of IFRS (as reconciled above) (139)
Adjustments to other comprehensive income (loss)
Redesignation of financial assets c (29)
Tax impact on redesignation of financial assets c 9
Investments in private equity funds and financial instruments r 19
Impairment of financial instruments r 137
Cumulative translation losses of foreign operations b 63
199
Attributable to non‑controlling interests (27)
172
Adjustments to total comprehensive income attributable to shareholders 33
Total comprehensive income (loss) attributable to shareholders under IFRS 404
N O T E 3 T R A N S I T I O N T O I F R S ( CO N T I N U E D )

P O W E R C O R P O R A T I O N O F C A N A D A 2 0 11 A N N U A L R E P O R T 49
iv) RECONCIL IATION OF EQUIT Y
REFERENCE
DATE OF TRANSITION
TO IFRS JANUARY 1,
2010DECEMBER 31,
2010
Equity under previous Canadian GAAP 9,829 9,648
Total adjustments to equity at date of transition — January 1, 2010 – 13,845
9,829 23,493
Changes in retained earnings
IFRS 1 optional elections/exemptions
Employee benefits — cumulative unamortized actuarial gains and losses a (465) 8
Cumulative translation losses of foreign operations b (1,809) –
Redesignation of financial assets c (127) –
Fair value as deemed cost for owner‑occupied properties d 40 –
Mandatory adjustments
Measurement of investment properties at fair value f 119 –
Derecognition of deferred net realized gains g 110 (12)
Deferred acquisition costs and deferred income reserves on investment contracts h (508) 18
Unamortized vested past service costs and other employment benefits i 121 (26)
Uncertain income tax provisions j (240) (26)
Derecognition m (127) 36
Intangible assets/Deferred selling commissions l, n (10) 13
Investments in associates o 154 7
Recognition of contingent liabilities k (25) (10)
Impairment of goodwill l (13) –
Impairment of financial assets r (8) (137)
Other adjustments p 11 (22)
Tax impact of IFRS adjustments q 170 (9)
Attributable to non‑controlling interests p 1,239 21
Charges to retained earnings – (3)
(1,368) (142)
Changes in contributed surplus
Graded vesting method for share‑based payments p 5 1
Attributable to non‑controlling interests p (3) (1)
2 –
Changes in accumulated other comprehensive income
Redesignation of financial assets c 127 (29)
Tax impact on redesignation of financial assets c, q (34) 9
Investments in private equity funds and financial instruments r 120 19
Impairment of financial instruments r 8 137
Cumulative translation losses of foreign operations b 1,809 63
Attributable to non‑controlling interests p (912) (27)
1,118 172
Changes in non‑controlling interests
Presentation of non‑controlling interests in equity x 14,093 328
Total changes in equity for the period 13,845 358
Total equity under IFRS, end of period 23,674 23,851
N O T E 3 T R A N S I T I O N T O I F R S ( CO N T I N U E D )

P O W E R C O R P O R A T I O N O F C A N A D A 2 0 11 A N N U A L R E P O R T50 NOTES TO THE CONSOLIDATED FINANCIAL STATEMENTS
S T A T E M E N T O F C A S H F L O W S
Under IFRS, the statement of cash flows continues to be presented using the
indirect method with limited presentation differences of operating earnings
being presented before tax and cash flows related to tax expense presented
separately within operating cash flows. The cash flows reported under the
previous Canadian GAAP for operating, financing, and investing activities
have not been substantially impacted by the adoption of IFRS requirements.
I F R S 1 F I R S T - T I M E A D O P T I O N O F I F R S
In preparing the annual consolidated financial statements, the Corporation
has applied IFRS 1, which requires retrospective application of IFRS, except
for certain optional exemptions and mandatory exceptions provided in the
standard. The optional exemptions adopted by the Corporation and the
mandatory exceptions that apply to the Corporation are described below.
I F R S O P T I O N A L E X E M P T I O N S
a) Employee benefits — cumulative unamortized actuarial gains
and losses
The Corporation elected to apply the exemption available to recognize all
cumulative unamortized actuarial gains and losses of the Corporation’s
defined benefit plans in equity upon transition to IFRS. This adjustment,
referred to as the “fresh start adjustment”, decreased equity by $465 million
before tax (decrease of $288 million in shareholders’ equity and $177 million in
non‑controlling interests) and increased earnings by $8 million before tax for
the year ended December 31, 2010. Subsequent to transition, the Corporation
continues to use the corridor approach available under the present IAS 19,
Employee Benefits standard for deferring recognition of actuarial gains and
losses that reside within the corridor.
b) Cumulative translation adjustments of foreign operations
The Corporation elected to reset its cumulative translation adjustment
account for all foreign operations to zero as of January 1, 2010. Future
gains or losses on disposal of any foreign operations and associates will
therefore exclude translation differences that arose before January 1, 2010.
The balance of the cumulative loss to be reclassified from accumulated other
comprehensive income (AOCI) to opening retained earnings at January 1, 2010
was $946 million (the adjustment of cumulative translation adjustment
before non‑controlling interests amounted to $1,809 million). As a result of
the foreign exchange revaluation of the transitional IFRS adjustments, the
total impact to the cumulative translation adjustment was an increase of
$63 million for the year ended December 31, 2010.
c) Redesignation of financial assets
Lifeco elected to redesignate certain non‑participating available‑for‑
sale financial assets to the fair value through profit or loss classification
and certain financial assets classified as fair value through profit or loss
under previous Canadian GAAP to available for sale. The redesignation had
no overall impact on the Corporation’s opening equity at transition but
resulted in a reclassification within equity of $127 million before tax and non‑
controlling interests, between retained earnings and accumulated other
comprehensive income.
For the year ended December 31, 2010 the redesignation decreased other comprehensive income by $29 million before tax.
The financial assets carried at fair value in the most recent previous Canadian GAAP consolidated financial statements and at transition to IFRS are as follows:
AS AT JANUARY 1, 2010 FAIR VALUE UNREALIZED GAINS
RECL ASSIFIED TO AOCI
Financial assets redesignated to fair value through profit or loss 373 38
Financial assets redesignated to available for sale 360 89
d) Fair value as deemed cost for owner-occupied properties
The Corporation elected to measure some owner‑occupied properties
at fair value as its deemed cost at the January 1, 2010 transition date,
which resulted in an increase to equity of $40 million before tax (increase
of $17 million in shareholders’ equity and $23 million in non‑controlling
interests). Subsequent to this date, owner‑occupied properties are carried
at amortized cost. The total fair value as at January 1, 2010 for owner‑
occupied properties, which includes a transitional adjustment of $40 million,
amounted to $502 million.
e) Business combinations
The Corporation applied the IFRS 1 business combinations exemption
and did not restate business combinations that took place prior to the
January 1, 2010 transition date, which had no impact on operating figures.
The Corporation will apply IFRS 3, Business Combinations, prospectively for
business combinations occurring on or after January 1, 2010.
Under IFRS, restructuring provisions are only included as part of the
acquired liabilities when the acquiree has recognized an existing liability
for restructuring in accordance with the applicable IFRS. As a result,
restructuring provisions recorded as part of the purchase price allocation
under previous Canadian GAAP are charged to earnings under IFRS. Also,
under IFRS a gain was recognized by a subsidiary representing the revaluation
of assets on a business acquisition achieved in stages. The total impact of
these adjustments was zero for the year ended December 31, 2010.
M A N D A T O R Y C H A N G E S I N A C C O U N T I N G P O L I C I E S A T C O N V E R S I O N T O I F R S
MEASUREMENT AND RECOGNIT ION DIFFERENCES
f) Measurement of investment properties at fair value
Under previous Canadian GAAP, real estate was carried at cost net of
writedowns and allowance for loss, plus a moving average market value
adjustment. Under IFRS, real estate held for investment purposes is classified
as investment property and is measured at fair value. This measurement
change increased equity at January 1, 2010 by $119 million before tax (increase
of $54 million in shareholders’ equity and $65 million in non‑controlling
interests), with no effect on earnings, offset by the change in accounting
for owner‑occupied properties, for the year ended December 31, 2010.
N O T E 3 T R A N S I T I O N T O I F R S ( CO N T I N U E D )

P O W E R C O R P O R A T I O N O F C A N A D A 2 0 11 A N N U A L R E P O R T 51
g) Deferred net realized gains
Under previous Canadian GAAP, net realized gains and losses associated with
the sale of real estate were deferred and included in deferred net realized
gains on the balance sheets. These deferred net realized gains and losses were
amortized to earnings at a rate of 3% per quarter on a declining balance basis.
Under IFRS, gains and losses associated with the sale of investment properties
are immediately recognized in earnings and consequently the balance
of the unrecognized net deferred realized gains was recognized in equity
at transition. This recognition change increased equity at January 1, 2010
by $110 million before tax (increase of $22 million in shareholders’ equity and
$88 million in non‑controlling interests), and decreased earnings by $12 million
before tax for the year ended December 31, 2010.
h) Deferred acquisition costs (DAC) and deferred
income reserves (DIR) on investment contracts
Under previous Canadian GAAP, DAC relating to policyholder liabilities were
deferred in policy liabilities and amortized into consolidated net earnings
over the anticipated period of benefit. Under IFRS, DAC on policyholder
liabilities reclassified as investment contract liabilities are no longer deferred
and amortized into earnings over the anticipated period of benefit but
rather recognized through earnings in the period incurred for those costs
not incremental to issuing the contract. In addition to DAC, DIR related to
fee income on investment contracts will also be deferred and recognized
over the term of the contract. The change in measurement for both DAC and
DIR decreased equity at January 1, 2010 by $508 million before tax (decrease
of $238 million in shareholders’ equity and $270 million in non‑controlling
interests), and increased earnings by $18 million before tax for the year ended
December 31, 2010.
i) Unamortized vested past service costs and other
employment benefits
Previous Canadian GAAP and IFRS differ in their treatment of other employee
benefits, including the timing of recognition of unamortized vested past
ser vice costs and certain ser vice awards. The change in recognition
for these vested past service costs and other employee benefits under
IFRS increased equity at January 1, 2010 by $121 million before tax (increase
of $47 million in shareholders’ equity and $74 million in non‑controlling
interests), and decreased earnings by $26 million before tax for the year ended
December 31, 2010.
j) Uncertain income tax provisions
The difference in the recognition and measurement of uncertain income
tax provisions between previous Canadian GAAP and IFRS decreased equity
at January 1, 2010 by $240 million (decrease of $109 million in shareholders’
equity and $131 million in non‑controlling interests), and has decreased
earnings by $26 million for the year ended December 31, 2010.
k) Recognition of contingent liabilities
Under previous Canadian GAAP, a contingent liability was recognized as a
result of a past transaction or event if it was likely that it would result in a loss
and the amount of the loss could be reasonably estimated.
Under IFRS, a provision is recognized when there is a present obligation
as a result of a past transaction or event, it is “probable” that an outflow of
resources will be required to settle the obligation and a reliable estimate
can be made of the obligation. The previous Canadian GAAP recognition
criterion of “likely” was a higher threshold than “probable” which results in
additional provisions being recognized under IFRS. IFRS also provides for the
use of the weighted average of all possible outcomes or the midpoint where
there is a range of equally possible outcomes. The change in recognition
of contingent liabilities decreased equity at January 1, 2010 by $25 million
before tax (decrease of $10 million in shareholders’ equity and $15 million in
non‑controlling interests) and decreased earnings by $10 million before tax
for the year ended December 31, 2010.
l) Goodwill and intangible asset measurement and
impairment testing
Goodwill and intangible assets under IFRS are measured using the cost
model, based on the recoverable amount, which is the greater of value in use
or fair value less cost to sell. The recoverable amount calculated under IFRS
is greater than or approximates the previous Canadian GAAP carrying value
at January 1, 2010 and therefore no transitional adjustment was required.
At each reporting date, the Corporation reviews goodwill and intangible
assets for indicators of impairment or reversals of impairment on the
intangible assets. In the event that certain conditions have been met, the
Corporation is required to reverse the impairment charge, or a portion thereof,
on intangible assets.
Under previous Canadian GAAP, goodwill was tested for impairment by
comparing the fair value of the reporting unit to which the goodwill was
associated with its carrying value. Under IFRS, the carrying value of goodwill
is tested for impairment by reference to the cash generating unit in which
goodwill is associated. A cash generating unit represents the lowest level in
which goodwill is monitored for internal reporting purposes.
Under IFRS, the cost of assets acquired outside of a business combination
is not adjusted for the tax effect on any differences between the accounting
cost and the tax cost at the time of the acquisition. Opening equity was
adjusted by $7 million to reflect the difference in amortization expense related
to certain intangible assets where deferred taxes increased the cost of the
asset acquired.
Upon the adoption of IFRS, a subsidiary of the Corporation has reduced the
carrying value of its goodwill by an amount of $13 million.
m) Derecognition
Under previous Canadian GAAP, derecognition focused on surrendering
control over the transferred assets in order to derecognize the assets and
recognize a sale.
Under IFRS, derecognition focuses to a greater extent on the transfer of
the risks and rewards of ownership in order to derecognize the asset and
recognize a sale. As a result, IGM’s securitization transactions are accounted
for as secured borrowings under IFRS rather than sales, which results
in an increase in total assets and liabilities recorded on the balance sheets.
The increase in the mortgage balances was $3.5 billion at December 31, 2010
(January 1, 2010 – $3.3 billion) with a corresponding increase in liabilities.
Certain other mortgage‑related assets and liabilities, including retained
interests, certain derivative instruments and servicing liabilities, were
adjusted. At December 31, 2010, the decrease in other assets was $91 million
(January 1, 2010 – $129 million) and in other liabilities was $85 million (January 1,
2010 – $55 million).
In addition, as these transactions are treated as financing transactions rather
than sale transactions, a transitional adjustment to opening retained earnings
is required to reflect this change in accounting treatment. Opening retained
earnings, revenue and expenses have been adjusted to reflect this change.
The change related to derecognition decreased equity at January 1, 2010 by
$127 million before tax (decrease of $50 million in shareholders’ equity and
$77 million in non‑controlling interests), and increased earnings by $36 million
before tax for the year ended December 31, 2010.
N O T E 3 T R A N S I T I O N T O I F R S ( CO N T I N U E D )
P O W E R C O R P O R A T I O N O F C A N A D A 2 0 11 A N N U A L R E P O R T52 NOTES TO THE CONSOLIDATED FINANCIAL STATEMENTS
n) Deferred selling commissions
Under previous Canadian GAAP, deferred selling commissions were finite
life intangible assets and were presented in other assets. Previous Canadian
GAAP did not specifically address the accounting for disposals of finite life
intangible assets and as a result, IGM utilized a shorter amortization period
in order to account for disposals.
Under IFRS, deferred selling commissions are finite life intangible assets.
IFRS more specifically addresses the approach to recording amortization
and disposals of intangible assets. The change related to deferred selling
commissions decreased equity at January 1, 2010 by $3 million before tax
(decrease of $1 million in shareholders’ equity and $2 million in non‑controlling
interests), and has increased earnings by $13 million before tax for the year
ended December 31, 2010.
o) Investments in associates
The Corporation increased the carrying value of its investments in associates
and its shareholders’ equity by an amount of $154 million to reflect amounts
previously recognized under IFRS by Pargesa which were not recognized
under previous Canadian GAAP as at January 1, 2010. The largest component
of this adjustment consists of the Corporation’s share of the reversal
in 2009 of an impairment charge recorded by Groupe Bruxelles Lambert for
an amount of $139 million. The adjustment increased shareholders’ equity
by an amount of $102 million and non‑controlling interests by $52 million.
Other adjustments during 2010 resulted in an increase of $7 million for the
year ended December 31, 2010.
p) Other adjustments
In addition to the items described above, several other items have been
identified where the transition from previous Canadian GAAP to IFRS
resulted in measurement changes. These adjustments mainly include (i) the
capitalization of transaction costs on other than held‑for‑trading financial
liabilities under IFRS, as opposed to being charged to earnings under previous
Canadian GAAP, (ii) the adoption of the graded vesting method to account for
all stock options for some subsidiaries, and the adoption and classification
as liabilities for certain share‑based payments, (iii) Lifeco’s preferred shares
previously recorded at fair value are recorded at amortized cost under
IFRS, (iv) the amortization of fixed assets by components, and (v) other
minor adjustments.
Furthermore, the total impact of all the adjustments related to IFRS 1 and
mandatory changes in accounting policies at conversion (as listed from a) to r))
to non‑controlling interests amounted to $385 million as at January 1, 2010.
q) Tax impact of IFRS adjustments
The tax effect of the above adjustments, excluding the uncertain tax
provisions, is a decrease to tax liabilities of $136 million at transition (increase
of $84 million in shareholders’ equity and of $52 million in non‑controlling
interests), and has decreased earnings by $9 million for the year ended
December 31, 2010.
r) Investments in private equity funds and financial instruments
The Corporation measures at fair value certain investments which, under
previous Canadian GAAP, were recorded at cost. The adjustment results in
an increase to equity of $120 million. Also, under IFRS as opposed to previous
Canadian GAAP, once an impairment has been recognized, a further
decrease in the value of the security is immediately considered to be a
further impairment. At January 1, 2010, additional impairments of financial
assets of $8 million decreased the opening retained earnings. For the
Corporation, additional impairments of $137 million before tax for the year
ended December 31, 2010 were recorded under IFRS.
PRESENTATION AND CL ASSIF IC ATION DIFFERENCES
s) Presentation of real estate properties
Properties classified as real estate under previous Canadian GAAP are
reclassified to investment properties ($2,615 million) and to owner‑occupied
properties ($401 million) in the balance sheets under IFRS.
t) Presentation of reinsurance accounts
Reinsurance accounts are presented on a gross basis on the balance sheets,
totalling $2,800 million of reinsurance assets with an offsetting increase
to insurance and investment contract liabilities and no impact to equity.
Funds‑withheld asset and liability accounts have also been adjusted and are
presented as a gross amount of $145 million. Presentation of gross reinsurance
revenues and expenses is also required within the statements of earnings.
u) Reclassification of deferred acquisition costs
The deferred acquisition costs of $447 million recognized on investment
contracts that were included within policy liabilities under previous Canadian
GAAP have been reclassified to other assets on the balance sheets.
N O T E 3 T R A N S I T I O N T O I F R S ( CO N T I N U E D )

P O W E R C O R P O R A T I O N O F C A N A D A 2 0 11 A N N U A L R E P O R T 53
v) Presentation of insurance and investment contract liabilities
Under previous Canadian GAAP, all policyholder‑related liabilities were
classified as actuarial liabilities and valued using the Canadian Asset Liability
Method (CALM). Under IFRS 4, Insurance Contracts, contracts are classified
and measured depending on the existence of significant insurance risk.
If significant insurance risk exists, the contract is classified as an insurance
contract and IFRS permits the Corporation to continue to measure insurance
contract liabilities using CALM. If significant insurance risk does not exist,
then the contract is classified as an investment contract and measured at
either fair value or amortized cost. The change in reclassification had no
impact on opening equity at January 1, 2010, or consolidated earnings and
comprehensive income at December 31, 2010.
The reconciled amount of policy liabilities under previous Canadian GAAP to insurance and investment contract liabilities under IFRS at transition is as follows:
Policy liabilities under previous Canadian GAAP at December 31, 2009:
Actuarial liabilities 98,059
Provision for claims 1,308
Provision for policyholder dividends 606
Provision for experience rating refunds 317
Policyholder funds 2,361
102,651
IFRS conversion adjustments:
Remeasurement of deferred acquisition costs 151
Fair value of investment properties backing liabilities (203)
Recognition of deferred net realized gains 23
Subtotal — IFRS conversion adjustments (29)
IFRS reclassification adjustments:
Deferred acquisition costs to other assets 447
Reinsurance assets offset by reinsurance liabilities 2,800
Subtotal — IFRS reclassification adjustments 3,247
Total investment and insurance contract liabilities under IFRS at January 1, 2010 105,869
Attributable to
Insurance contract liabilities 105,028
Investment contract liabilities 841
105,869
w) Presentation of segregated funds on the balance sheets
Under IFRS, the assets and liabilities of the segregated funds, totalling
$87.5 billion at January 1, 2010, are included at fair value on the balance sheets
as a line item within both assets and liabilities. There was no measurement
change impacting equity.
x) Presentation of non-controlling interests within equity
Under previous Canadian GAAP, non‑controlling interests were presented
between liabilities and equity, whereas under IFRS non‑controlling
interests are presented within the equity section of the balance sheet.
This reclassification of non‑controlling interests represents an increase of
$14,478 million to equity as a result of this change in presentation at transition
to IFRS.
y) Joint ventures
The Corporation has elected to account for its interests in joint ventures
using the equity method instead of the proportionate consolidation method
required under previous Canadian GAAP.
N O T E 3 T R A N S I T I O N T O I F R S ( CO N T I N U E D )

P O W E R C O R P O R A T I O N O F C A N A D A 2 0 11 A N N U A L R E P O R T54 NOTES TO THE CONSOLIDATED FINANCIAL STATEMENTS
N O T E 4 D I S C O N T I N U E D O P E R AT I O N S
On November 16, 2011, IGM completed the sale of 100% of the common shares
of M.R.S. Trust Company and M.R.S. Inc. (MRS). Cash consideration was
$199 million in addition to the repayment of $20 million of subordinated debt
and the assumption of the liability related to amounts held on deposit with
MRS by Investors Group Securities Inc.
In accordance with IFRS 5 — Non-Current Assets Held for Sale and Discontinued
Operations, the operating results and cash flows of MRS, which were
previously included in the IGM reportable segment, have been classified as
discontinued operations.
Net earnings from discontinued operations are as follows:
PERIOD ENDED NOVEMBER 15,
2011
YEAR ENDED DECEMBER 31,
2010
REVENUES
Net investment income 14 14
Fee income 19 23
33 37
EXPENSES
Operating and administrative expenses 27 31
Income taxes (recovery) (27) 4
– 35
33 2
Gain on sale, net of tax 30 –
Net earnings — discontinued operations 63 2
Attributable to
Non‑controlling interests 37 1
Participating shareholders 26 1
63 2
Cash flows from discontinued operations are as follows:
PERIOD ENDED NOVEMBER 15,
2011
YEAR ENDED DECEMBER 31,
2010
Net cash flows from operating activities 7 6
Net cash flows from financing activities (33) (69)
Net cash flows from investing activities 165 82
Net increase in cash and cash equivalents 139 19
N O T E 5 C A S H A N D C A S H E Q U I VA L E N T S
DECEMBER 31, 2011
DECEMBER 31, 2010
JANUARY 1, 2010
Cash 952 772 1,106
Cash equivalents 2,789 2,956 4,008
Cash and cash equivalents — continuing operations 3,741 3,728 5,114
Cash and cash equivalents — discontinued operations – 288 269
3,741 4,016 5,383

P O W E R C O R P O R A T I O N O F C A N A D A 2 0 11 A N N U A L R E P O R T 55
N O T E 6 I N V E S T M E N T S
C A R R Y I N G V A L U E S A N D F A I R V A L U E S
Carrying values and estimated fair values of investments are as follows:
DECEMBER 31, 2011
DECEMBER 31, 2010
JANUARY 1, 2010
CARRYING VALUE
FAIR VALUE
CARRYING VALUE
FAIR VALUE
CARRYING VALUE
FAIR VALUE
Bonds
Designated as fair value through profit or loss [1] 60,141 60,141 55,277 55,277 51,756 51,756
Classified as fair value through profit or loss [1] 1,853 1,853 1,748 1,748 1,759 1,759
Available for sale 7,448 7,448 7,935 7,935 5,262 5,262
Loans and receivables 9,744 10,785 9,290 9,942 9,165 9,421
79,186 80,227 74,250 74,902 67,942 68,198
Mortgages and other loans
Loans and receivables 21,249 22,537 19,985 20,833 20,372 20,682
Designated as fair value through profit or loss [1] 292 292 224 224 241 241
21,541 22,829 20,209 21,057 20,613 20,923
Shares
Designated as fair value through profit or loss [1] 5,502 5,502 5,364 5,364 4,928 4,928
Available for sale 2,374 2,374 2,373 2,373 2,656 2,656
7,876 7,876 7,737 7,737 7,584 7,584
Investment properties 3,201 3,201 2,957 2,957 2,615 2,615
Loans to policyholders 7,162 7,162 6,827 6,827 6,957 6,957
118,966 121,295 111,980 113,480 105,711 106,277
[1] Investments can be categorized as fair value through profit or loss in two ways; designated as fair value through profit or loss at the option of management, or classified as fair value through profit or loss if they are actively traded for the purpose of earning investment income.
B O N D S A N D M O R T G A G E S
Carrying value of bonds and mortgages due over the current and non‑current term are as follows:
CARRYING VALUE
TERM TO MATURIT Y
DECEMBER 31, 2011 1 YEAR OR LESS 1–5 YEARS OVER 5 YEARS TOTAL
Bonds 7,823 17,681 53,367 78,871
Mortgage loans 2,042 8,916 10,272 21,230
9,865 26,597 63,639 100,101
CARRYING VALUE
TERM TO MATURIT Y
DECEMBER 31, 2010 1 YEAR OR LESS 1–5 YEARS OVER 5 YEARS TOTAL
Bonds 8,965 16,122 48,833 73,920
Mortgage loans 1,900 8,201 9,855 19,956
10,865 24,323 58,688 93,876
CARRYING VALUE
TERM TO MATURIT Y
JANUARY 1, 2010 1 YEAR OR LESS 1–5 YEARS OVER 5 YEARS TOTAL
Bonds 7,531 15,719 44,435 67,685
Mortgage loans 1,871 7,987 10,464 20,322
9,402 23,706 54,899 88,007
The above table excludes the carrying value of impaired bonds and mortgages, as the ultimate timing of collectability is uncertain.

P O W E R C O R P O R A T I O N O F C A N A D A 2 0 11 A N N U A L R E P O R T56 NOTES TO THE CONSOLIDATED FINANCIAL STATEMENTS
IMPAIRED INVESTMENTS, ALLOWANCE FOR CREDIT LOSSES, INVESTMENTS WITH RESTRUC TURED TERMS
The carrying amount of impaired investments is as follows:
DECEMBER 31, 2011
DECEMBER 31, 2010
JANUARY 1, 2010
Impaired amounts by type [1]
Fair value through profit or loss 290 302 239
Available for sale 51 29 23
Loans and receivables 36 51 71
Total 377 382 333
[1] Excludes amounts in funds held by ceding insurers of nil at December 31, 2011, $11 million at December 31, 2010 and $6 million at January 1, 2010.
The allowance for credit losses and changes in the allowance for credit losses related to investments classified as loans and receivables are as follows:
2011 2010
Balance, beginning of year 68 88
Net provision (recovery) for credit losses (13) (5)
Write‑offs, net of recoveries (15) (8)
Other (including foreign exchange rate changes) (3) (7)
Balance, end of year 37 68
The allowance for credit losses is supplemented by the provision for future credit losses included in policy liabilities.
Lifeco holds investments with restructured terms or which have been exchanged for securities with amended terms. These investments are performing
according to their new terms. The carrying value of these investments is as follows:
DECEMBER 31, 2011
DECEMBER 31, 2010
JANUARY 1, 2010
Bonds 16 23 36
Bonds with equity conversion features 119 150 169
Mortgages 17 18 1
152 191 206
NET INVESTMENT INCOME
2011 BONDSMORTGAGE
LOANS SHARESINVESTMENT PROPERTIES OTHER TOTAL
Regular net investment income:
Investment income earned 3,793 941 203 254 396 5,587
Net realized gains (losses) (available for sale) 119 – 169 – 5 293
Net realized gains (losses) (other classifications) 11 33 – – – 44
Net recovery (provision) for credit losses (loans and receivables) 20 (7) – – – 13
Other income and expenses – (2) (102) (65) (48) (217)
3,943 965 270 189 353 5,720
Changes in fair value on fair value through profit or loss assets:
Net realized/unrealized gains (losses) (classified fair value through profit or loss) 74 – – – – 74
Net realized/unrealized gains (losses) (designated fair value through profit or loss) 4,166 (7) (280) 143 58 4,080
4,240 (7) (280) 143 58 4,154
Net investment income (loss) 8,183 958 (10) 332 411 9,874
N O T E 6 I N V E S T M E N T S ( CO N T I N U E D )
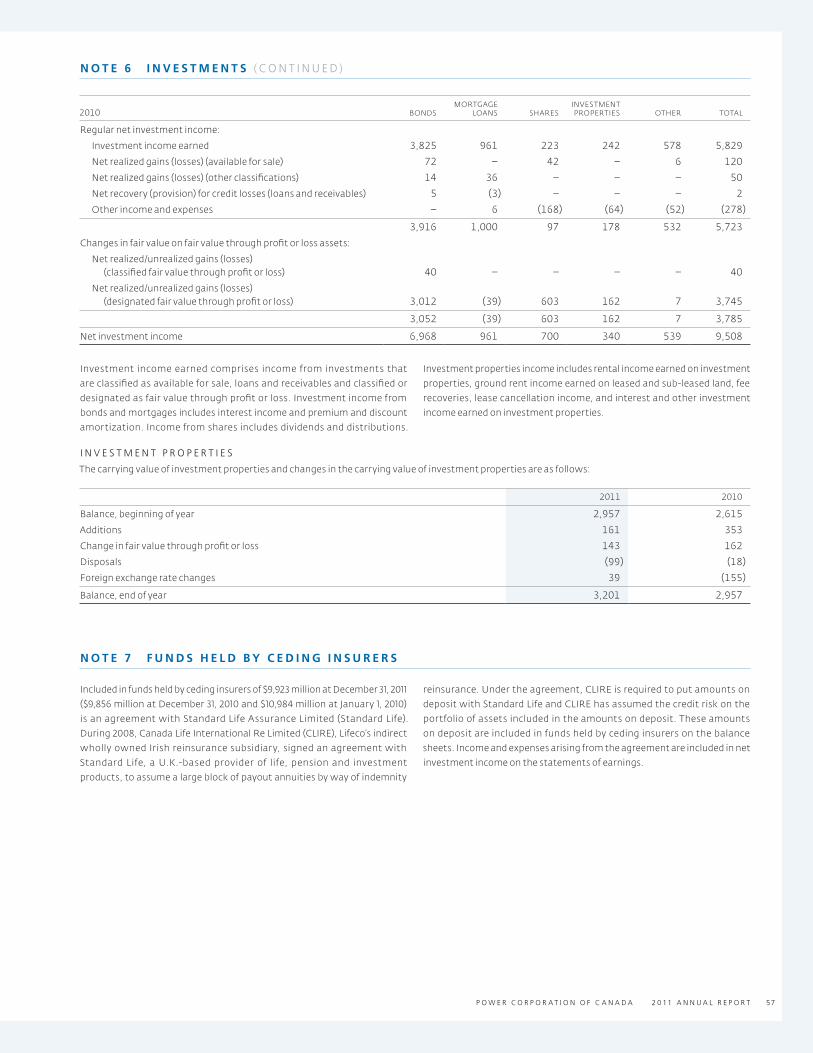
P O W E R C O R P O R A T I O N O F C A N A D A 2 0 11 A N N U A L R E P O R T 57
2010 BONDSMORTGAGE
LOANS SHARESINVESTMENT PROPERTIES OTHER TOTAL
Regular net investment income:
Investment income earned 3,825 961 223 242 578 5,829
Net realized gains (losses) (available for sale) 72 – 42 – 6 120
Net realized gains (losses) (other classifications) 14 36 – – – 50
Net recovery (provision) for credit losses (loans and receivables) 5 (3) – – – 2
Other income and expenses – 6 (168) (64) (52) (278)
3,916 1,000 97 178 532 5,723
Changes in fair value on fair value through profit or loss assets:
Net realized/unrealized gains (losses) (classified fair value through profit or loss) 40 – – – – 40
Net realized/unrealized gains (losses) (designated fair value through profit or loss) 3,012 (39) 603 162 7 3,745
3,052 (39) 603 162 7 3,785
Net investment income 6,968 961 700 340 539 9,508
Investment income earned comprises income from investments that
are classified as available for sale, loans and receivables and classified or
designated as fair value through profit or loss. Investment income from
bonds and mortgages includes interest income and premium and discount
amortization. Income from shares includes dividends and distributions.
Investment properties income includes rental income earned on investment
properties, ground rent income earned on leased and sub‑leased land, fee
recoveries, lease cancellation income, and interest and other investment
income earned on investment properties.
I N V E S T M E N T P R O P E R T I E S
The carrying value of investment properties and changes in the carrying value of investment properties are as follows:
2011 2010
Balance, beginning of year 2,957 2,615
Additions 161 353
Change in fair value through profit or loss 143 162
Disposals (99) (18)
Foreign exchange rate changes 39 (155)
Balance, end of year 3,201 2,957
N O T E 7 F U N D S H E L D B Y C E D I N G I N S U R E R S
Included in funds held by ceding insurers of $9,923 million at December 31, 2011
($9,856 million at December 31, 2010 and $10,984 million at January 1, 2010)
is an agreement with Standard Life Assurance Limited (Standard Life).
During 2008, Canada Life International Re Limited (CLIRE), Lifeco’s indirect
wholly owned Irish reinsurance subsidiary, signed an agreement with
Standard Life, a U.K.‑based provider of life, pension and investment
products, to assume a large block of payout annuities by way of indemnity
reinsurance. Under the agreement, CLIRE is required to put amounts on
deposit with Standard Life and CLIRE has assumed the credit risk on the
portfolio of assets included in the amounts on deposit. These amounts
on deposit are included in funds held by ceding insurers on the balance
sheets. Income and expenses arising from the agreement are included in net
investment income on the statements of earnings.
N O T E 6 I N V E S T M E N T S ( CO N T I N U E D )

P O W E R C O R P O R A T I O N O F C A N A D A 2 0 11 A N N U A L R E P O R T58 NOTES TO THE CONSOLIDATED FINANCIAL STATEMENTS
At December 31, 2011 CLIRE had amounts on deposit of $9,411 million ($9,333 million at December 31, 2010 and $10,329 million at January 1, 2010). The details of
the funds on deposit and related credit risk on the funds are as follows:
Carrying values and estimated fair values:
DECEMBER 31, 2011
DECEMBER 31, 2010
JANUARY 1, 2010
CARRYING VALUE
FAIR VALUE
CARRYING VALUE
FAIR VALUE
CARRYING VALUE
FAIR VALUE
Cash and cash equivalents 49 49 138 138 25 25
Bonds 9,182 9,182 9,031 9,031 10,121 10,121
Other assets 180 180 164 164 183 183
9,411 9,411 9,333 9,333 10,329 10,329
Supporting:
Reinsurance liabilities 9,082 9,082 8,990 8,990 9,999 9,999
Surplus 329 329 343 343 330 330
9,411 9,411 9,333 9,333 10,329 10,329
Included in the amount on deposit are impaired investments with a carrying amount of nil at December 31, 2011 ($11 million at December 31, 2010 and $6 million
at January 1, 2010) that are net of impairments of nil at December 31, 2011 ($17 million at December 31, 2010 and $4 million at January 1, 2010).
The following table provides details of the carrying value of bonds included in the funds on deposit by industry sector:
DECEMBER 31, 2011
DECEMBER 31, 2010
JANUARY 1, 2010
Bonds issued or guaranteed by:
Provincial, state and municipal governments 88 37 41
Other foreign governments 3,074 3,250 3,913
Government‑related 369 252 292
Supranationals 128 107 115
Asset‑backed securities 242 244 242
Residential mortgage‑backed securities 73 54 81
Banks 1,807 2,040 2,232
Other financial institutions 747 652 681
Basic materials 21 19 16
Communications 239 241 278
Consumer products 404 464 517
Industrial products/services 26 14 13
Natural resources 220 147 218
Real estate 381 373 393
Transportation 117 94 97
Utilities 1,135 950 962
Miscellaneous 111 93 30
Total bonds 9,182 9,031 10,121
The following table provides details of the carrying value of bonds by asset quality:
BOND PORTFOLIO QUALIT YDECEMBER 31,
2011DECEMBER 31,
2010JANUARY 1,
2010
AAA 3,520 3,542 4,318
AA 1,819 1,725 1,843
A 3,116 3,019 3,181
BBB 468 396 409
BB and lower 259 349 370
Total bonds 9,182 9,031 10,121
N O T E 7 F U N D S H E L D B Y C E D I N G I N S U R E R S ( CO N T I N U E D )

P O W E R C O R P O R A T I O N O F C A N A D A 2 0 11 A N N U A L R E P O R T 59
N O T E 8 I N V E S T M E N T S I N A S S O C I AT E S
Investments in associates are composed principally of Power Financial’s 50% interest in Parjointco. As at December 31, 2011, Parjointco held a 56.5% equity
interest in Pargesa (54.1% as at December 31, 2010).
Pargesa’s financial information as at December 31, 2011 can be obtained in its publicly available information.
The carrying value of the investments in associates is as follows:
2011 2010
Carrying value, beginning of year 2,565 2,948
Purchase of investments 3 9
Share of earnings (losses) (20) 124
Share of other comprehensive income (loss) (221) (446)
Dividends (5) (63)
Other 19 (7)
Carrying value, end of year 2,341 2,565
During 2011, Pargesa recorded an impairment charge on its investment
in Lafarge S.A. An impairment test was performed as Lafarge’s share
price has persistently been at a level significantly below its carrying value.
In 2011, the test was renewed in a weakened economic environment,
and led to determining a value in use below the existing carrying value.
The impairment recorded results in a reduction of the carrying value of
Lafarge. The Corporation’s share of this charge was $133 million.
The net asset value of the Corporation’s interest in Pargesa is $2,047 million
as at December 31, 2011. The carrying value of the investment in Pargesa,
adjusted for other comprehensive income amounts, is $2,046 million.
N O T E 9 O W N E R - O C C U P I E D P R O P E R T I E S A N D C A P I TA L A S S E T S
The carrying value of owner‑occupied properties and capital assets and the changes in the carrying value of owner‑occupied properties and capital assets
are as follows:
2011 2010
DECEMBER 31OWNER‑OCCUPIED
PROPERTIES CAPITAL ASSETSOWNER‑OCCUPIED
PROPERTIES CAPITAL ASSETS
Cost, beginning of year 604 1,111 589 1,066
Additions 56 87 25 86
Disposal (1) (35) – (19)
Change in foreign exchange rates 4 (18) (10) (22)
Cost, end of year 663 1,145 604 1,111
Accumulated amortization, beginning of year (93) (791) (87) (761)
Amortization (5) (63) (7) (60)
Disposal – 30 – 13
Change in foreign exchange rates – 19 1 17
Accumulated amortization, end of year (98) (805) (93) (791)
Carrying value, end of year 565 340 511 320
The following table provides details of the carrying value of owner‑occupied properties and capital assets by geographic location:
DECEMBER 31, 2011
DECEMBER 31, 2010
JANUARY 1, 2010
Canada 702 639 591
United States 176 167 187
Europe 27 25 29
905 831 807
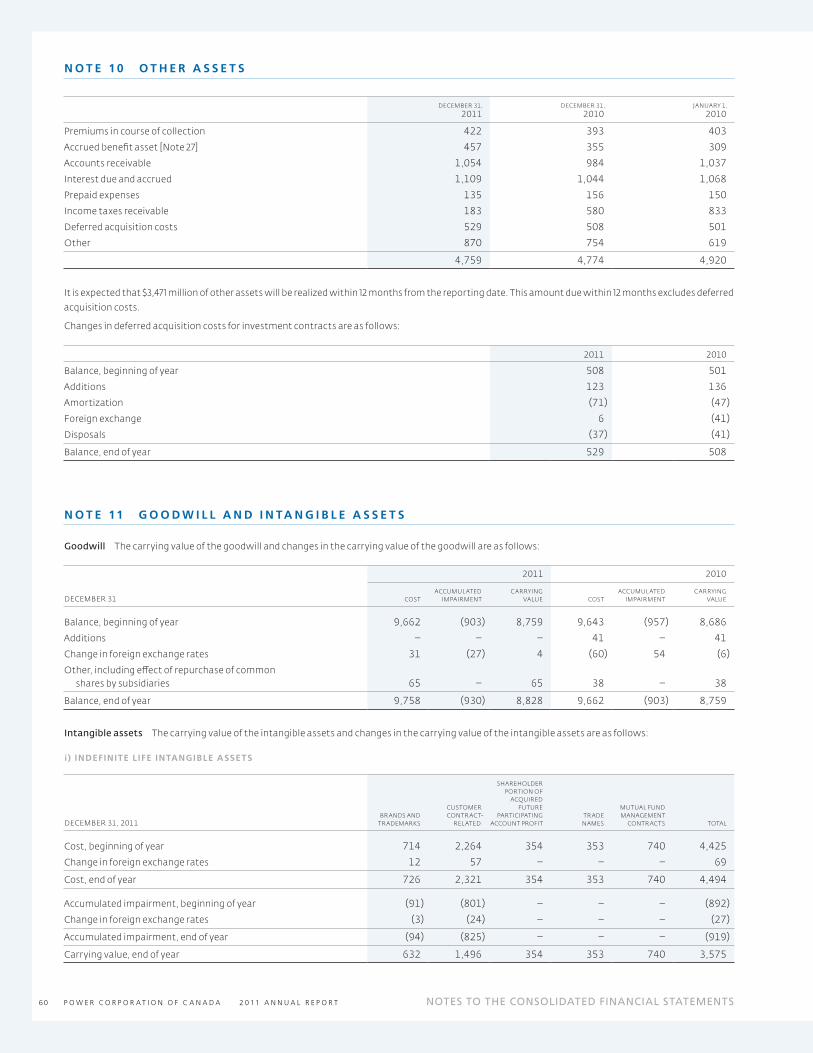
P O W E R C O R P O R A T I O N O F C A N A D A 2 0 11 A N N U A L R E P O R T60 NOTES TO THE CONSOLIDATED FINANCIAL STATEMENTS
N O T E 1 0 O T H E R A S S E T S
DECEMBER 31, 2011
DECEMBER 31, 2010
JANUARY 1, 2010
Premiums in course of collection 422 393 403
Accrued benefit asset [Note 27] 457 355 309
Accounts receivable 1,054 984 1,037
Interest due and accrued 1,109 1,044 1,068
Prepaid expenses 135 156 150
Income taxes receivable 183 580 833
Deferred acquisition costs 529 508 501
Other 870 754 619
4,759 4,774 4,920
It is expected that $3,471 million of other assets will be realized within 12 months from the reporting date. This amount due within 12 months excludes deferred
acquisition costs.
Changes in deferred acquisition costs for investment contracts are as follows:
2011 2010
Balance, beginning of year 508 501
Additions 123 136
Amortization (71) (47)
Foreign exchange 6 (41)
Disposals (37) (41)
Balance, end of year 529 508
N O T E 11 G O O D W I L L A N D I N TA N G I B L E A S S E T S
Goodwill The carrying value of the goodwill and changes in the carrying value of the goodwill are as follows:
2011 2010
DECEMBER 31 COSTACCUMUL ATED
IMPAIRMENTCARRYING
VALUE COSTACCUMUL ATED
IMPAIRMENTCARRYING
VALUE
Balance, beginning of year 9,662 (903) 8,759 9,643 (957) 8,686
Additions – – – 41 – 41
Change in foreign exchange rates 31 (27) 4 (60) 54 (6)
Other, including effect of repurchase of common shares by subsidiaries 65 – 65 38 – 38
Balance, end of year 9,758 (930) 8,828 9,662 (903) 8,759
Intangible assets The carrying value of the intangible assets and changes in the carrying value of the intangible assets are as follows:
i ) INDEFINITE L IFE INTANGIBLE ASSETS
DECEMBER 31, 2011BRANDS AND
TRADEMARKS
CUSTOMERCONTRAC T‑
REL ATED
SHAREHOLDER PORTION OF
ACQUIRED FUTURE
PARTICIPATING ACCOUNT PROFIT
TRADE NAMES
MUTUAL FUND MANAGEMENT
CONTRACTS TOTAL
Cost, beginning of year 714 2,264 354 353 740 4,425
Change in foreign exchange rates 12 57 – – – 69
Cost, end of year 726 2,321 354 353 740 4,494
Accumulated impairment, beginning of year (91) (801) – – – (892)
Change in foreign exchange rates (3) (24) – – – (27)
Accumulated impairment, end of year (94) (825) – – – (919)
Carrying value, end of year 632 1,496 354 353 740 3,575

P O W E R C O R P O R A T I O N O F C A N A D A 2 0 11 A N N U A L R E P O R T 61
DECEMBER 31, 2010BRANDS AND
TRADEMARKS
CUSTOMERCONTRAC T‑
REL ATED
SHAREHOLDER PORTION OF
ACQUIRED FUTURE
PARTICIPATING ACCOUNT PROFIT
TRADE NAMES
MUTUAL FUND MANAGEMENT
CONTRACTS TOTAL
Cost, beginning of year 746 2,378 354 344 737 4,559
Additions – – – 9 3 12
Change in foreign exchange rates (32) (114) – – – (146)
Cost, end of year 714 2,264 354 353 740 4,425
Accumulated impairment, beginning of year (97) (849) – – – (946)
Change in foreign exchange rates 6 48 – – – 54
Accumulated impairment, end of year (91) (801) – – – (892)
Carrying value, end of year 623 1,463 354 353 740 3,533
JANUARY 1, 2010BRANDS AND
TRADEMARKS
CUSTOMERCONTRAC T‑
REL ATED
SHAREHOLDER PORTION OF
ACQUIRED FUTURE
PARTICIPATING ACCOUNT PROFIT
TRADE NAMES
MUTUAL FUND MANAGEMENT
CONTRACTS TOTAL
Cost 746 2,378 354 344 737 4,559
Accumulated impairment (97) (849) – – – (946)
Carrying value 649 1,529 354 344 737 3,613
i i ) F IN ITE L IFE INTANGIBLE ASSETS
DECEMBER 31, 2011
CUSTOMERCONTRAC T‑
REL ATEDDISTRIBUTION
CHANNELSDISTRIBUTION
CONTRAC TS
TECHNOLOGY, PROPERT Y
LEASES AND OTHER SOFT WARE
DEFERRED SELLING
COMMISSIONS TOTAL
Cost, beginning of year 564 100 103 47 472 1,623 2,909
Additions – – 4 – 41 238 283
Disposal/redemption – – – – (4) (104) (108)
Change in foreign exchange rates 7 – – – 5 – 12
Other, including write‑off of assets fully amortized – (2) – – 54 (206) (154)
Cost, end of year 571 98 107 47 568 1,551 2,942
Accumulated amortization, beginning of year (169) (24) (26) (28) (255) (829) (1,331)
Amortization (34) (3) (7) (8) (64) (237) (353)
Impairment – – – – (4) – (4)
Disposal/redemption – – – – 3 60 63
Change in foreign exchange rates (1) – – – (3) – (4)
Other, including write‑off of assets fully amortized – – – – 13 206 219
Accumulated amortization, end of year (204) (27) (33) (36) (310) (800) (1,410)
Carrying value, end of year 367 71 74 11 258 751 1,532
N O T E 11 G O O D W I L L A N D I N TA N G I B L E A S S E T S ( CO N T I N U E D )

P O W E R C O R P O R A T I O N O F C A N A D A 2 0 11 A N N U A L R E P O R T62 NOTES TO THE CONSOLIDATED FINANCIAL STATEMENTS
DECEMBER 31, 2010
CUSTOMERCONTRAC T‑
REL ATEDDISTRIBUTION
CHANNELSDISTRIBUTION
CONTRAC TS
TECHNOLOGY, PROPERT Y
LEASES AND OTHER SOFT WARE
DEFERRED SELLING
COMMISSIONS TOTAL
Cost, beginning of year 579 108 95 43 421 1,633 2,879
Additions – – 8 6 35 239 288
Disposal/redemption – – – – (1) (109) (110)
Change in foreign exchange rates (15) (8) – (2) (10) – (35)
Other, including write‑off of assets fully amortized – – – – 27 (140) (113)
Cost, end of year 564 100 103 47 472 1,623 2,909
Accumulated amortization, beginning of year (138) (22) (19) (21) (227) (786) (1,213)
Amortization (33) (4) (7) (8) (59) (244) (355)
Disposal/redemption – – – – 1 61 62
Change in foreign exchange rates 2 2 – 1 7 – 12
Other, including write‑off of assets fully amortized – – – – 23 140 163
Accumulated amortization, end of year (169) (24) (26) (28) (255) (829) (1,331)
Carrying value, end of year 395 76 77 19 217 794 1,578
JANUARY 1, 2010
CUSTOMERCONTRAC T‑
REL ATEDDISTRIBUTION
CHANNELSDISTRIBUTION
CONTRAC TS
TECHNOLOGY, PROPERT Y
LEASES AND OTHER SOFT WARE
DEFERRED SELLING
COMMISSIONS TOTAL
Cost 579 108 95 43 421 1,633 2,879
Accumulated impairment (138) (22) (19) (21) (227) (786) (1,213)
Carrying value 441 86 76 22 194 847 1,666
Recoverable amount The recoverable amount of all cash generating units
is determined as the higher of fair value less cost to sell and value‑in‑use. Fair
value is determined using a combination of commonly accepted valuation
methodologies, namely comparable trading multiples, comparable
transaction multiples and discounted cash flow analysis. Comparable
trading and transaction multiples methodologies calculate value by applying
multiples observed in the market against historical results or projections
approved by management as applicable. Value calculated by discounted cash
flow analysis uses cash flow projections based on financial budgets approved
by management covering an initial period (typically four or five years). Value
beyond the initial period is derived from applying a terminal value multiple
to the final year of the initial projection period. The terminal value multiple
is a function of the discount rate and the estimated terminal growth rate.
The estimated terminal growth rate is not to exceed the long‑term average
growth rate (inflation rate) of the markets in which the subsidiaries of the
Corporation operates.
For Lifeco, the key assumptions used for the discounted cash flow calculations
are based on past experience and external sources of information. The key
assumptions are as follows:
> Risk‑adjusted discount rates used for the calculation of present value are
based on Lifeco’s weighted average cost of capital.
> Economic assumptions are based on market yields on risk‑free interest
rates at the end of each reporting period.
> Terminal growth rate represents the rate used to extrapolate new
business contributions beyond the business plan period, and is based on
management’s estimate of future growth; it ranges between 1.5% and 3.0%,
depending on the nature of the business.
For IGM, the valuation models used to assess fair value utilized assumptions
that include levels of growth in assets under management from net sales
and market, pricing and margin changes, synergies achieved on acquisition,
discount rates, and observable data from comparable transactions.
The fair value less cost to sell was compared with the carrying amount of
goodwill and indefinite life intangible assets and it was determined there
was no impairment in the value of these assets.
N O T E 11 G O O D W I L L A N D I N TA N G I B L E A S S E T S ( CO N T I N U E D )
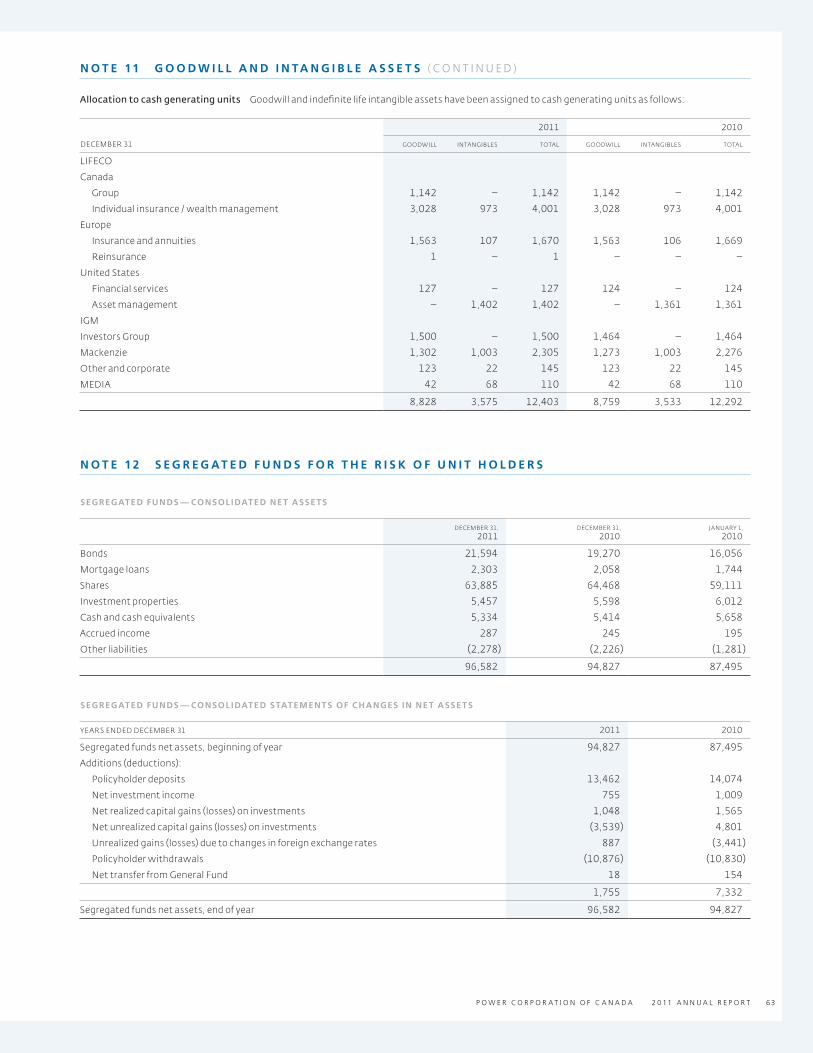
P O W E R C O R P O R A T I O N O F C A N A D A 2 0 11 A N N U A L R E P O R T 63
Allocation to cash generating units Goodwill and indefinite life intangible assets have been assigned to cash generating units as follows:
2011 2010
DECEMBER 31 GOODWILL INTANGIBLES TOTAL GOODWILL INTANGIBLES TOTAL
LIFECO
Canada
Group 1,142 – 1,142 1,142 – 1,142
Individual insurance / wealth management 3,028 973 4,001 3,028 973 4,001
Europe
Insurance and annuities 1,563 107 1,670 1,563 106 1,669
Reinsurance 1 – 1 – – –
United States
Financial services 127 – 127 124 – 124
Asset management – 1,402 1,402 – 1,361 1,361
IGM
Investors Group 1,500 – 1,500 1,464 – 1,464
Mackenzie 1,302 1,003 2,305 1,273 1,003 2,276
Other and corporate 123 22 145 123 22 145
MEDIA 42 68 110 42 68 110
8,828 3,575 12,403 8,759 3,533 12,292
N O T E 1 2 S E G R E G AT E D F U N D S F O R T H E R I S K O F U N I T H O L D E R S
SEGREGATED FUNDS — CONSOLIDATED NET ASSETS
DECEMBER 31, 2011
DECEMBER 31, 2010
JANUARY 1, 2010
Bonds 21,594 19,270 16,056
Mortgage loans 2,303 2,058 1,744
Shares 63,885 64,468 59,111
Investment properties 5,457 5,598 6,012
Cash and cash equivalents 5,334 5,414 5,658
Accrued income 287 245 195
Other liabilities (2,278) (2,226) (1,281)
96,582 94,827 87,495
SEGREGATED FUNDS — CONSOLIDATED STATEMENTS OF CHANGES IN NET ASSETS
YEARS ENDED DECEMBER 31 2011 2010
Segregated funds net assets, beginning of year 94,827 87,495
Additions (deductions):
Policyholder deposits 13,462 14,074
Net investment income 755 1,009
Net realized capital gains (losses) on investments 1,048 1,565
Net unrealized capital gains (losses) on investments (3,539) 4,801
Unrealized gains (losses) due to changes in foreign exchange rates 887 (3,441)
Policyholder withdrawals (10,876) (10,830)
Net transfer from General Fund 18 154
1,755 7,332
Segregated funds net assets, end of year 96,582 94,827
N O T E 11 G O O D W I L L A N D I N TA N G I B L E A S S E T S ( CO N T I N U E D )

P O W E R C O R P O R A T I O N O F C A N A D A 2 0 11 A N N U A L R E P O R T64 NOTES TO THE CONSOLIDATED FINANCIAL STATEMENTS
N O T E 1 3 I N S U R A N C E A N D I N V E S T M E N T C O N T R A C T L I A B I L I T I E S
I N S U R A N C E A N D I N V E S T M E N T C O N T R A C T L I A B I L I T I E S
DECEMBER 31, 2011 GROSS CEDED NET
Insurance contract liabilities 114,730 2,061 112,669
Investment contract liabilities 782 – 782
115,512 2,061 113,451
DECEMBER 31, 2010 GROSS CEDED NET
Insurance contract liabilities 107,405 2,533 104,872
Investment contract liabilities 791 – 791
108,196 2,533 105,663
JANUARY 1, 2010 GROSS CEDED NET
Insurance contract liabilities 105,028 2,800 102,228
Investment contract liabilities 841 – 841
105,869 2,800 103,069
C O M P O S I T I O N O F I N S U R A N C E A N D I N V E S T M E N T C O N T R A C T L I A B I L I T I E S A N D R E L A T E D S U P P O R T I N G A S S E T S
The composition of insurance and investment contract liabilities of Lifeco is as follows:
DECEMBER 31, 2011 GROSS CEDED NET
Participating
Canada 26,470 (50) 26,520
United States 8,639 18 8,621
Europe 1,230 – 1,230
Non‑participating
Canada 27,099 919 26,180
United States 16,657 276 16,381
Europe 35,417 898 34,519
115,512 2,061 113,451
DECEMBER 31, 2010 GROSS CEDED NET
Participating
Canada 25,093 5 25,088
United States 8,137 20 8,117
Europe 1,209 – 1,209
Non‑participating
Canada 25,415 1,265 24,150
United States 14,896 301 14,595
Europe 33,446 942 32,504
108,196 2,533 105,663
JANUARY 1, 2010 GROSS CEDED NET
Participating
Canada 23,113 (12) 23,125
United States 8,280 30 8,250
Europe 1,456 – 1,456
Non‑participating
Canada 23,673 1,219 22,454
United States 14,190 363 13,827
Europe 35,157 1,200 33,957
105,869 2,800 103,069

P O W E R C O R P O R A T I O N O F C A N A D A 2 0 11 A N N U A L R E P O R T 65
The composition of the assets supporting insurance and investment contract liabilities and equity of Lifeco is as follows:
DECEMBER 31, 2011 BONDSMORTGAGE
LOANS SHARESINVESTMENT PROPERTIES OTHER TOTAL
Carrying value
Participating liabilities
Canada 11,862 6,686 3,864 507 3,551 26,470
United States 4,059 152 – – 4,428 8,639
Europe 855 56 176 22 121 1,230
Non‑participating liabilities
Canada 16,674 4,738 1,329 20 4,338 27,099
United States 13,523 2,369 – – 765 16,657
Europe 20,449 2,506 119 2,092 10,251 35,417
Other 6,563 484 – 6 100,099 107,152
Total equity 4,088 441 1,216 554 9,805 16,104
Total carrying value 78,073 17,432 6,704 3,201 133,358 238,768
Fair value 79,114 18,662 6,772 3,201 133,358 241,107
DECEMBER 31, 2010 BONDSMORTGAGE
LOANS SHARESINVESTMENT PROPERTIES OTHER TOTAL
Carrying value
Participating liabilities
Canada 10,872 6,158 3,775 419 3,869 25,093
United States 3,823 169 – – 4,145 8,137
Europe 804 66 185 27 127 1,209
Non‑participating liabilities
Canada 15,956 5,069 1,431 13 2,946 25,415
United States 12,695 1,474 – – 727 14,896
Europe 18,970 2,189 108 1,914 10,265 33,446
Other 5,163 511 – 19 100,716 106,409
Total equity 3,920 479 1,201 565 8,651 14,816
Total carrying value 72,203 16,115 6,700 2,957 131,446 229,421
Fair value 72,855 16,880 6,769 2,957 131,446 230,907
JANUARY 1, 2010 BONDSMORTGAGE
LOANS SHARESINVESTMENT PROPERTIES OTHER TOTAL
Carrying value
Participating liabilities
Canada 10,244 6,025 3,535 324 2,985 23,113
United States 3,763 216 – – 4,301 8,280
Europe 784 77 224 33 338 1,456
Non‑participating liabilities
Canada 14,309 5,327 991 21 3,025 23,673
United States 11,915 1,451 – – 824 14,190
Europe 18,923 2,535 131 1,683 11,885 35,157
Other 2,374 483 243 4 95,463 98,567
Total equity 3,835 570 1,318 548 8,437 14,708
Total carrying value 66,147 16,684 6,442 2,613 127,258 219,144
Fair value 66,403 16,891 6,503 2,613 127,258 219,668
Cash flows of assets supporting insurance and investment contract liabilities are matched within reasonable limits. Changes in the fair values of these assets
are essentially offset by changes in the fair value of insurance and investment contract liabilities.
Changes in the fair values of assets backing capital and surplus, less related income taxes, would result in a corresponding change in surplus over time in
accordance with investment accounting policies.
N O T E 1 3 I N S U R A N C E A N D I N V E S T M E N T C O N T R A C T L I A B I L I T I E S ( CO N T I N U E D )

P O W E R C O R P O R A T I O N O F C A N A D A 2 0 11 A N N U A L R E P O R T66 NOTES TO THE CONSOLIDATED FINANCIAL STATEMENTS
C H A N G E S I N I N S U R A N C E C O N T R A C T L I A B I L I T I E S
The change in insurance contract liabilities during the year was the result of the following business activities and changes in actuarial estimates:
PARTICIPATING NON‑PARTICIPATING
DECEMBER 31, 2011GROSS
LIABILIT YREINSURANCE
ASSET NETGROSS
LIABILIT YREINSURANCE
ASSET NETTOTAL
NET
Balance, beginning of year 34,398 25 34,373 73,007 2,508 70,499 104,872
Crown Ancillary reclassification (89) – (89) 89 – 89 –
Impact of new business 133 – 133 3,088 (329) 3,417 3,550
Normal change in force 1,719 (14) 1,733 1,910 476 1,434 3,167
Management actions and changes in assumptions (139) (45) (94) (806) (583) (223) (317)
Impact of foreign exchange rate changes 281 2 279 1,139 21 1,118 1,397
Balance, end of year 36,303 (32) 36,335 78,427 2,093 76,334 112,669
PARTICIPATING NON‑PARTICIPATING
DECEMBER 31, 2010GROSS
LIABILIT YREINSURANCE
ASSET NETGROSS
LIABILIT YREINSURANCE
ASSET NETTOTAL
NET
Balance, beginning of year 32,798 18 32,780 72,230 2,782 69,448 102,228
Impact of new business 193 – 193 5,139 141 4,998 5,191
Normal change in force 2,021 9 2,012 (87) (199) 112 2,124
Management actions and changes in assumptions (5) – (5) (520) (96) (424) (429)
Business movement from/to external parties – – – (1) – (1) (1)
Impact of foreign exchange rate changes (609) (2) (607) (3,754) (120) (3,634) (4,241)
Balance, end of year 34,398 25 34,373 73,007 2,508 70,499 104,872
Under fair value accounting, movement in the market value of the supporting
assets is a major factor in the movement of insurance contract liabilities.
Changes in the fair value of assets are largely offset by corresponding changes
in the fair value of liabilities. The change in the value of the insurance contract
liabilities associated with the change in the value of the supporting assets
is included in the normal change in force above.
In 2011, the major contributors to the increase in net insurance contract
liabilities were the impact of new business ($3,550 million increase) and the
normal change in the in‑force business ($3,167 million increase), primarily due
to the change in fair value.
Lifeco’s net non‑participating insurance contract liabilities decreased
by $223 million in 2011 due to management actions and assumption
changes including a $68 million decrease in Canada, a $132 million decrease
in Europe and a $23 million decrease in the United States.
Lifeco adopted the revised Actuarial Standards of Practice for subsection 2350
relating to future mortality improvement in insurance contract liabilities for
life insurance and annuities. The resulting decrease in net non‑participating
insurance contract liabilities for life insurance was $446 million, including
a $182 million decrease in Canada, a $242 million decrease in Europe
(primarily reinsurance) and a $22 million decrease in the United States.
The resulting change in net insurance contract liabilities for annuities was
a $47 million increase, including a $53 million increase in Canada, a $58 million
decrease in Europe and a $52 million increase in the United States.
The remaining increase in Canada was primarily due to increased provisions
for policyholder behaviour in Individual Insurance ($172 million increase),
provision for asset liability matching ($147 million increase), updated
base annuity mortality ($43 million increase) and a reclassification from
miscellaneous liabilities ($29 million increase), partially offset by updated
expenses and taxes ($137 million decrease), updated morbidity assumptions
($101 million decrease), updated base life insurance mortality ($38 million
decrease), modelling refinements across the Canadian segment ($40 million
decrease) and reinsurance‑related management actions ($16 million decrease).
The remaining increase in Europe was primarily due to increased provisions
for policyholder behaviour in reinsurance ($227 million increase), updated
base life insurance mortality ($50 million increase) and updated morbidity
assumptions ($15 million increase), partially offset by modelling refinements
in the U.K. and Reinsurance Segments ($69 million decrease), updated base
annuity mortality ($42 million decrease), and reduced provisions for asset
liability matching ($16 million decrease).
The remaining decrease in the United States was primarily due to updated
base annuity mortality ($28 million decrease) and updated base life insurance
mortality ($23 million decrease).
Net participating insurance contract liabilities decreased by $94 million in 2011
due to management actions and assumption changes. The decrease was
primarily due to decreases in the provision for future policyholder dividends
($1,556 million decrease), modelling refinements in Canada ($256 million
decrease), improved Individual Life mortality ($256 million decrease, including
$27 million from the Standards of Practice revision) and updated expenses
and taxes ($15 million decrease), partially offset by lower investment returns
($1,952 million increase), and increased provisions for policyholder behaviour
($40 million increase).
N O T E 1 3 I N S U R A N C E A N D I N V E S T M E N T C O N T R A C T L I A B I L I T I E S ( CO N T I N U E D )

P O W E R C O R P O R A T I O N O F C A N A D A 2 0 11 A N N U A L R E P O R T 67
In 2010, the major contributors to the increase in insurance contract liabilities
were the impact of new business and the normal change in the in‑force
business, partially offset by the impact of foreign exchange rates.
Lifeco’s net non‑participating insurance contract liabilities decreased
by $424 million in 2010 due to management actions and assumption
changes, including a $246 million decrease in Canada, a $123 million
decrease in Europe and a $55 million decrease in the United States. The
decrease in Canada was primarily due to updated expenses and taxes
in Individual Insurance ($86 million decrease), improved Individual Life
mortality ($64 million decrease), improved Group Insurance morbidity
($62 million decrease), modelling refinements across the Canadian segment
($56 million decrease) and reduced provisions for asset liability matching
($49 million decrease), partially offset by increased provisions for policyholder
behaviour in Individual Insurance ($69 million increase). The decrease in
Europe was primarily due to reduced provisions for asset liability matching
($120 million decrease), modelling refinements across the division ($97 million
decrease) and updated expenses ($25 million decrease), partially offset by
strengthened Reinsurance life mortality ($71 million increase), strengthened
longevity ($16 million increase), strengthened Group Insurance morbidity
($13 million increase), increased provisions for policyholder behaviour
($10 million increase) and asset default ($8 million increase). The decrease in
the United States was primarily due to improved Life mortality ($52 million
decrease), improved longevity ($6 million decrease), modelling refinements
($4 million decrease), partially offset by increased provisions for policyholder
behaviour ($8 million increase).
Lifeco’s net participating insurance contract liabilities decreased by $5 million
in 2010 due to management actions and assumption changes. The decrease
was primarily due to updated expenses ($261 million decrease), improved
investment returns ($20 million decrease), and improved Individual Life
mortality ($13 million decrease), partially offset by modelling refinements
($213 million increase), increases in the provision for future policyholder
dividends ($66 million increase) and increased provisions for policyholder
behaviour ($10 million increase).
C H A N G E S I N I N V E S T M E N T C O N T R A C T L I A B I L I T I E S M E A S U R E D A T F A I R V A L U E
2011 2010
DECEMBER 31 GROSS CEDED NET GROSS CEDED NET
Balance, beginning of year 791 – 791 841 – 841
Normal change in‑force business (54) – (54) (28) – (28)
Investment experience 35 – 35 – – –
Impact of foreign exchange rate changes 10 – 10 (22) – (22)
Balance, end of year 782 – 782 791 – 791
The carrying value of investment contract liabilities approximates its fair value.
C A N A D I A N U N I V E R S A L L I F E E M B E D D E D D E R I V A T I V E S
Lifeco bifurcated the index‑linked component of the universal life contracts
as this embedded derivative is not closely related to the insurance host and
is not itself an insurance contract. The forward contracts are contractual
agreements in which the policyholder is entitled to the performance of the
underlying index. The policyholder may select one or more of the following
indices: the TSX, the S&P and the AEX.
A C T U A R I A L A S S U M P T I O N S
In the computation of insurance contract liabilities, valuation assumptions
have been made regarding rates of mortality/morbidity, investment
returns, levels of operating expenses, rates of policy termination and
rates of utilization of elective policy options or provisions. The valuation
assumptions use best estimates of future experience together with
a margin for adverse deviation. These margins are necessary to provide
for possibilities of misestimation and/or future deterioration in the best
estimate assumptions and provide reasonable assurance that insurance
contract liabilities cover a range of possible outcomes. Margins are reviewed
periodically for continued appropriateness.
The methods for arriving at these valuation assumptions are outlined below:
Mortality A life insurance mortality study is carried out annually for
each major block of insurance business. The results of each study are used
to update Lifeco’s experience valuation mortality tables for that business.
When there is insufficient data, use is made of the latest industry experience
to derive an appropriate valuation mortality assumption. The actuarial
standards were amended to remove the requirement that, for life insurance,
any reduction in liabilities due to mortality improvement assumption be offset
by an equal amount of provision for adverse deviation. Appropriate provisions
have been made for future mortality deterioration on term insurance.
Annuitant mortality is also studied regularly and the results used to modify
established industry experience annuitant mortality tables. Mortality
improvement has been projected to occur throughout future years
for annuitants.
Morbidity Lifeco uses industry‑developed experience tables modified
to reflect emerging Lifeco experience. Both claim incidence and termination
are monitored regularly and emerging experience is factored into the
current valuation.
Property and casualty reinsurance Insurance contract liabilities for
property and casualty reinsurance written by London Reinsurance Group Inc.
(LRG), a subsidiary of London Life, are determined using accepted actuarial
practices for property and casualty insurers in Canada. Reflecting the
long‑term nature of the business, insurance contract liabilities have been
established using cash flow valuation techniques, including discounting.
The insurance contract liabilities are based on cession statements provided
by ceding companies. In certain instances, LRG management adjusts
cession statement amounts to reflect management’s interpretation of
the treaty. Differences will be resolved via audits and other loss mitigation
activities. In addition, insurance contract liabilities also include an amount
for incurred but not reported losses which may differ significantly from the
ultimate loss development. The estimates and underlying methodology
are continually reviewed and updated, and adjustments to estimates are
reflected in earnings. LRG analyses the emergence of claims experience
against expected assumptions for each reinsurance contract separately and
at the portfolio level. If necessary, a more in‑depth analysis is undertaken of
the cedant experience.
N O T E 1 3 I N S U R A N C E A N D I N V E S T M E N T C O N T R A C T L I A B I L I T I E S ( CO N T I N U E D )

P O W E R C O R P O R A T I O N O F C A N A D A 2 0 11 A N N U A L R E P O R T68 NOTES TO THE CONSOLIDATED FINANCIAL STATEMENTS
Investment returns The assets which correspond to the different liability
categories are segmented. For each segment, projected cash flows from
the current assets and liabilities are used in the Canadian Asset Liability
Method to determine insurance contract liabilities. Cash flows from assets
are reduced to provide for asset default losses. Testing under several interest
rate and equity scenarios (including increasing and decreasing rates) is done
to provide for reinvestment risk (refer to Note 24).
Expenses Contractual policy expenses (e.g., sales commissions) and tax
expenses are reflected on a best estimate basis. Expense studies for indirect
operating expenses are updated regularly to determine an appropriate
estimate of future operating expenses for the liability type being valued.
Improvements in unit operating expenses are not projected. An inflation
assumption is incorporated in the estimate of future operating expenses
consistent with the interest rate scenarios projected under the Canadian
Asset Liability Method as inflation is assumed to be correlated with new
money interest rates.
Policy termination Studies to determine rates of policy termination are
updated regularly to form the basis of this estimate. Industry data is also
available and is useful where Lifeco has no experience with specific types of
policies or its exposure is limited. Lifeco has significant exposures in respect
of the T‑100 and Level Cost of Insurance Universal Life products in Canada and
policy termination rates at the renewal period for renewable term policies in
Canada and Reinsurance. Industry experience has guided Lifeco’s persistency
assumption for these products as Lifeco’s own experience is very limited.
Utilization of elective policy options There are a wide range of elective
options embedded in the policies issued by Lifeco. Examples include term
renewals, conversion to whole life insurance (term insurance), settlement
annuity purchase at guaranteed rates (deposit annuities) and guarantee
re‑sets (segregated fund maturity guarantees). The assumed rates of
utilization are based on Lifeco or industry experience when it exists and,
when not, on judgment considering incentives to utilize the option. Generally,
whenever it is clearly in the best interests of an informed policyholder to
utilize an option, then it is assumed to be elected.
Policyholder dividends and adjustable policy features Future
policyholder dividends and other adjustable policy features are included
in the determination of insurance contract liabilities with the assumption
that policyholder dividends or adjustable benefits will change in the future
in response to the relevant experience. The dividend and policy adjustments
are determined consistent with policyholders’ reasonable expectations, such
expectations being influenced by the participating policyholder dividend
policies and/or policyholder communications, marketing material and past
practice. It is Lifeco’s expectation that changes will occur in policyholder
dividend scales or adjustable benefits for participating or adjustable business
respectively, corresponding to changes in the best estimate assumptions,
resulting in an immaterial net change in insurance contract liabilities. Where
underlying guarantees may limit the ability to pass all of this experience
back to the policyholder, the impact of this non‑adjustability impacting
shareholder earnings is reflected in the impacts of changes in best estimate
assumptions above.
R I S K M A N A G E M E N T
Insurance risk Insurance risk is the risk that the insured event occurs
and that there are large deviations between expected and actual actuarial
assumptions including mortality, persistency, longevity, morbidity, expense
variations and investment returns.
As an insurance company, Lifeco is in the business of accepting risk associated
with insurance contract liabilities. The objective of Lifeco is to mitigate its
exposure to risk arising from these contracts through product design, product
and geographical diversification, the implementation of Lifeco’s underwriting
strategy guidelines, and through the use of reinsurance arrangements.
The following table provides information about Lifeco’s insurance contract liabilities’ sensitivities to management’s best estimate of the approximate impact
as a result of changes in assumptions used to determine Lifeco’s liability associated with these contracts.
2011 2010
CHANGES IN ASSUMPTIONS
IMPAC T ONLIFECO
PROFIT OR LOSS
POWER CORPORATION’S
SHARECHANGES IN
ASSUMPTIONS
IMPAC T ONLIFECO
PROFIT OR LOSS
POWER CORPORATION’S
SHARE
Mortality 2% (188) (88) 2% (159) (74)
Annuitant mortality 2% (176) (82) 2% (172) (80)
Morbidity 5% (181) (85) 5% (151) (71)
Investment returns
Parallel shift in yield curve
Increase 1% 123 57 1% 25 12
Decrease 1% (511) (239) 1% (279) (130)
Change in equity markets
Increase 10% 21 10 10% (25) (12)
Decrease 10% (57) (27) 10% (54) (25)
Change in best estimate returns for equities
Increase 1% 292 136 1% 242 113
Decrease 1% (316) (148) 1% (279) (130)
Expenses 5% (55) (26) 5% (51) (24)
Policy termination 10% (435) (203) 10% (320) (149)
N O T E 1 3 I N S U R A N C E A N D I N V E S T M E N T C O N T R A C T L I A B I L I T I E S ( CO N T I N U E D )

P O W E R C O R P O R A T I O N O F C A N A D A 2 0 11 A N N U A L R E P O R T 69
Concentration risk may arise from geographic regions, accumulation of risks and market risks. The concentration of insurance risk before and after reinsurance
by geographic region is described below.
DECEMBER 31, 2011
DECEMBER 31, 2010
JANUARY 1, 2010
GROSS CEDED NET GROSS CEDED NET GROSS CEDED NET
Canada 53,569 869 52,700 50,508 1,270 49,238 46,786 1,207 45,579
United States 25,296 294 25,002 23,033 321 22,712 22,470 393 22,077
Europe 36,647 898 35,749 34,655 942 33,713 36,613 1,200 35,413
115,512 2,061 113,451 108,196 2,533 105,663 105,869 2,800 103,069
Reinsurance risk Maximum limits per insured life benefit amount (which
vary by line of business) are established for life and health insurance and
reinsurance is purchased for amounts in excess of those limits.
Reinsurance costs and recoveries as defined by the reinsurance agreement are
reflected in the valuation with these costs and recoveries being appropriately
calibrated to the direct assumptions.
Reinsurance contracts do not relieve Lifeco from its obligations to
policyholders. Failure of reinsurers to honour their obligations could result
in losses to Lifeco. Lifeco evaluates the financial condition of its reinsurers
to minimize its exposure to significant losses from reinsurer insolvencies.
Certain of the reinsurance contracts are on a funds withheld basis where
Lifeco retains the assets supporting the reinsured insurance contract
liabilities, thus minimizing the exposure to significant losses from reinsurer
insolvency on those contracts.
N O T E 1 4 D E P O S I T S A N D C E R T I F I C AT E S
Included in the assets of the balance sheets are cash and cash equivalents, shares, loans, and accounts and other receivables amounting to $151 million
(December 31, 2010 – $835 million; January 1, 2010 – $907 million) related to deposits and certificates.
TERM TO MATURIT Y
DEMAND1 YEAR
OR LESS1–5
YEARSOVER
5 YEARS
DECEMBER 31, 2011 TOTAL
DECEMBER 31, 2010 TOTAL
JANUARY 1, 2010 TOTAL
Deposits 122 9 14 2 147 830 903
Certificates – – 1 3 4 5 4
122 9 15 5 151 835 907
Deposits related to MRS were nil as at December 31, 2011 (December 31, 2010 – $681 million; January 1, 2010 – $750 million). The deposits were disposed of as part
of the sale of MRS (Note 4).
N O T E 1 5 O B L I G AT I O N T O S E C U R I T I Z AT I O N E N T I T I E S
IGM enters into transactions that result in the transfer of financial assets
to third parties. IGM securitizes residential mortgages through the Canada
Mortgage and Housing Corporation (CMHC)‑sponsored National Housing
Act Mortgage‑Backed Securities (NHA MBS) Program and Canada Mortgage
Bond (CMB) Program and through Canadian bank‑sponsored asset‑backed
commercial paper (ABCP) programs. IGM has retained prepayment risk
and certain elements of credit risk associated with the transferred assets.
Accordingly, IGM has recorded these loans on the balance sheets at a carrying
value of $3.76 billion at December 31, 2011 (December 31, 2010–$3.47 billion;
January 1, 2010–$3.26 billion), and has recorded an offsetting liability,
obligation to securitization entities, of $3.83 billion (December 31, 2010–
$3.51 billion; January 1, 2010–$3.31 billion) which is carried at amortized cost.
IGM’s credit risk on its securitization activities is limited through the use of
insurance as substantially all securitized mortgages are insured. Additional
information related to the management of credit risk can be found in the risk
management discussion (Note 24).
N O T E 1 3 I N S U R A N C E A N D I N V E S T M E N T C O N T R A C T L I A B I L I T I E S ( CO N T I N U E D )

P O W E R C O R P O R A T I O N O F C A N A D A 2 0 11 A N N U A L R E P O R T70 NOTES TO THE CONSOLIDATED FINANCIAL STATEMENTS
N O T E 1 6 D E B E N T U R E S A N D O T H E R B O R R O W I N G S
DECEMBER 31, 2011
DECEMBER 31, 2010
JANUARY 1, 2010
CARRYINGVALUE
FAIRVALUE
CARRYING VALUE
FAIRVALUE
CARRYINGVALUE
FAIRVALUE
OTHER BORROWINGS
GREAT‑WEST LIFECO INC.
Commercial paper and other short‑term debt instruments with interest rates from 0.20% to 0.39% (0.36% to 0.44% in 2010) 100 100 91 91 102 102
Revolving credit facility with interest equal to LIBOR rate plus 1% or U.S. prime rate loan (US$200 million) 204 204 213 213 273 273
OTHER
Other credit facilities at various rates 8 8 7 7 8 8
TOTAL OTHER BORROWINGS 312 312 311 311 383 383
DEBENTURES
POWER CORPORATION OF CANADA
7.57% debentures, due April 22, 2019, unsecured 250 308 250 296 250 285
8.57% debentures, due April 22, 2039, unsecured 150 211 150 208 150 187
POWER FINANCIAL CORPORATION
6.90% debentures, due March 11, 2033, unsecured 250 295 250 285 250 258
IGM FINANCIAL INC.
6.75% debentures 2001 Series, due May 9, 2011, unsecured – – 450 458 450 478
6.58% debentures 2003 Series, due March 7, 2018, unsecured 150 175 150 170 150 164
7.35% debentures 2009 Series, due April 8, 2019, unsecured 375 457 375 446 375 427
6.65% debentures 1997 Series, due December 13, 2027, unsecured 125 148 125 138 125 127
7.45% debentures 2001 Series, due May 9, 2031, unsecured 150 189 150 178 150 166
7.00% debentures 2002 Series, due December 31, 2032, unsecured 175 213 175 199 175 188
7.11% debentures 2003 Series, due March 7, 2033, unsecured 150 185 150 174 150 164
6.00% debentures 2010 Series, due December 10, 2040, unsecured 200 220 200 203 – –
GREAT‑WEST LIFECO INC.
Term note due October 18, 2012, bearing an interest rate of LIBOR plus 0.30% (US$304 million), unsecured 304 308 301 297 319 319
6.75% debentures originally due August 10, 2015, redeemed August 10, 2010, unsecured – – – – 200 207
6.14% debentures due March 21, 2018, unsecured 199 229 199 226 199 218
4.65% debentures due August 13, 2020, unsecured 497 522 497 503 – –
6.40% subordinated debentures due December 11, 2028, unsecured 100 115 100 110 100 105
6.74% debentures due November 24, 2031, unsecured 190 237 190 232 190 216
6.67% debentures due March 21, 2033, unsecured 397 472 397 463 397 431
6.625% deferrable debentures due November 15, 2034, unsecured (US$175 million) 175 170 169 161 180 138
5.998% debentures due November 16, 2039, unsecured 343 383 343 375 342 345
Subordinated debentures due May 16, 2046, bearing an interest rate of 7.153% until May 16, 2016 and, thereafter, a rate of 2.538% plus the 3‑month LIBOR rate, unsecured (US$300 million) 310 298 295 297 312 277
Subordinated debentures due June 21, 2067, bearing an interest rate of 5.691% until 2017 and, thereafter, a rate equal to the Canadian 90‑day bankers’ acceptance rate plus 1.49%, unsecured 994 1,028 993 1,044 991 1,018
Subordinated debentures due June 26, 2068, bearing an interest rate of 7.127% until 2018 and, thereafter, a rate equal to the Canadian 90‑day bankers’ acceptance rate plus 3.78%, unsecured 497 551 496 556 496 554
Notes payable with interest rate of 8.0% due May 6, 2014, unsecured 3 3 4 4 5 5
TOTAL DEBENTURES 5,984 6,717 6,409 7,023 5,956 6,277
6,296 7,029 6,720 7,334 6,339 6,660
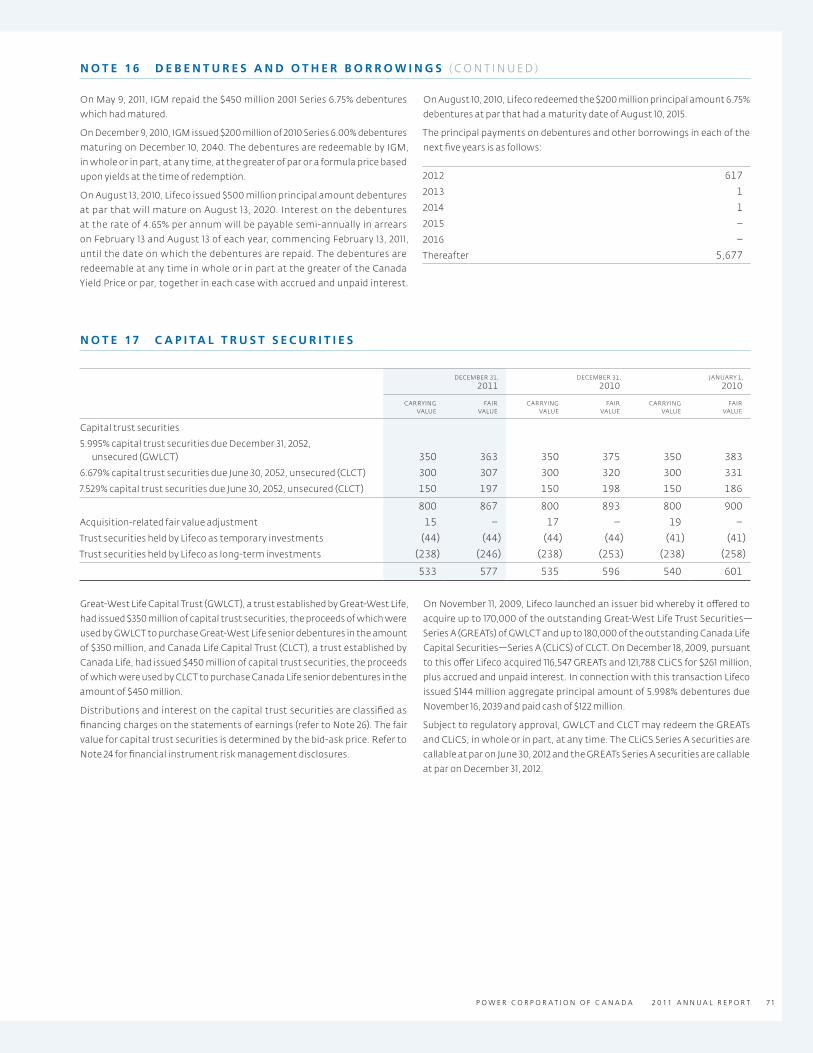
P O W E R C O R P O R A T I O N O F C A N A D A 2 0 11 A N N U A L R E P O R T 71
On May 9, 2011, IGM repaid the $450 million 2001 Series 6.75% debentures
which had matured.
On December 9, 2010, IGM issued $200 million of 2010 Series 6.00% debentures
maturing on December 10, 2040. The debentures are redeemable by IGM,
in whole or in part, at any time, at the greater of par or a formula price based
upon yields at the time of redemption.
On August 13, 2010, Lifeco issued $500 million principal amount debentures
at par that will mature on August 13, 2020. Interest on the debentures
at the rate of 4.65% per annum will be payable semi‑annually in arrears
on February 13 and August 13 of each year, commencing February 13, 2011,
until the date on which the debentures are repaid. The debentures are
redeemable at any time in whole or in part at the greater of the Canada
Yield Price or par, together in each case with accrued and unpaid interest.
On August 10, 2010, Lifeco redeemed the $200 million principal amount 6.75%
debentures at par that had a maturity date of August 10, 2015.
The principal payments on debentures and other borrowings in each of the
next five years is as follows:
2012 617
2013 1
2014 1
2015 –
2016 –
Thereafter 5,677
N O T E 17 C A P I TA L T R U S T S E C U R I T I E S
DECEMBER 31, 2011
DECEMBER 31, 2010
JANUARY 1, 2010
CARRYING VALUE
FAIR VALUE
CARRYING VALUE
FAIR VALUE
CARRYING VALUE
FAIR VALUE
Capital trust securities
5.995% capital trust securities due December 31, 2052, unsecured (GWLCT) 350 363 350 375 350 383
6.679% capital trust securities due June 30, 2052, unsecured (CLCT) 300 307 300 320 300 331
7.529% capital trust securities due June 30, 2052, unsecured (CLCT) 150 197 150 198 150 186
800 867 800 893 800 900
Acquisition‑related fair value adjustment 15 – 17 – 19 –
Trust securities held by Lifeco as temporary investments (44) (44) (44) (44) (41) (41)
Trust securities held by Lifeco as long‑term investments (238) (246) (238) (253) (238) (258)
533 577 535 596 540 601
Great‑West Life Capital Trust (GWLCT), a trust established by Great‑West Life,
had issued $350 million of capital trust securities, the proceeds of which were
used by GWLCT to purchase Great‑West Life senior debentures in the amount
of $350 million, and Canada Life Capital Trust (CLCT), a trust established by
Canada Life, had issued $450 million of capital trust securities, the proceeds
of which were used by CLCT to purchase Canada Life senior debentures in the
amount of $450 million.
Distributions and interest on the capital trust securities are classified as
financing charges on the statements of earnings (refer to Note 26). The fair
value for capital trust securities is determined by the bid‑ask price. Refer to
Note 24 for financial instrument risk management disclosures.
On November 11, 2009, Lifeco launched an issuer bid whereby it offered to
acquire up to 170,000 of the outstanding Great‑West Life Trust Securities —
Series A (GREATs) of GWLCT and up to 180,000 of the outstanding Canada Life
Capital Securities — Series A (CLiCS) of CLCT. On December 18, 2009, pursuant
to this offer Lifeco acquired 116,547 GREATs and 121,788 CLiCS for $261 million,
plus accrued and unpaid interest. In connection with this transaction Lifeco
issued $144 million aggregate principal amount of 5.998% debentures due
November 16, 2039 and paid cash of $122 million.
Subject to regulatory approval, GWLCT and CLCT may redeem the GREATs
and CLiCS, in whole or in part, at any time. The CLiCS Series A securities are
callable at par on June 30, 2012 and the GREATs Series A securities are callable
at par on December 31, 2012.
N O T E 1 6 D E B E N T U R E S A N D O T H E R B O R R O W I N G S ( CO N T I N U E D )

P O W E R C O R P O R A T I O N O F C A N A D A 2 0 11 A N N U A L R E P O R T72 NOTES TO THE CONSOLIDATED FINANCIAL STATEMENTS
N O T E 1 8 O T H E R L I A B I L I T I E S
DECEMBER 31, 2011
DECEMBER 31, 2010
JANUARY 1, 2010
Income taxes payable 531 517 499
Repurchase agreements 250 1,677 1,162
Accrued benefit liability [Note 27] 1,002 948 861
Accounts payable 1,612 1,652 1,314
Deferred income reserves 406 377 357
Bank overdraft 437 429 341
Dividends payable 176 174 170
Other 1,254 1,756 2,059
5,668 7,530 6,763
It is expected that $3,617 million of other liabilities will be realized within 12 months from the reporting date. This amount due within 12 months excludes
deferred income reserves.
Changes in deferred income reserves are as follows:
2011 2010
Balance, beginning of year 377 357
Additions 97 108
Amortization (38) (27)
Foreign exchange 5 (33)
Disposals (35) (28)
Balance, end of year 406 377
N O T E 1 9 I N C O M E TA X E S
E F F E C T I V E I N C O M E T A X R A T E
The Corporation’s effective income tax rate is derived as follows:
2011 2010
YEARS ENDED DECEMBER 31 % %
Combined basic Canadian federal and provincial tax rates 28.0 30.4
Increase (decrease) in the income tax rate resulting from:
Non‑taxable investment income (3.1) (2.4)
Lower effective tax rates on income not subject to tax in Canada (2.5) (2.2)
Earnings of investments in associates (0.4) (1.9)
Impact of rate changes on deferred income taxes (0.2) (0.2)
Loss consolidation transaction (0.4) –
Other (1.6) (4.3)
Effective income tax rate 19.8 19.4
As of January 1, 2011, the federal corporate tax rate decreased from 18% to 16.5%. As of July 1, 2011, the Ontario provincial corporate tax rate decreased from
12% to 11.5%.
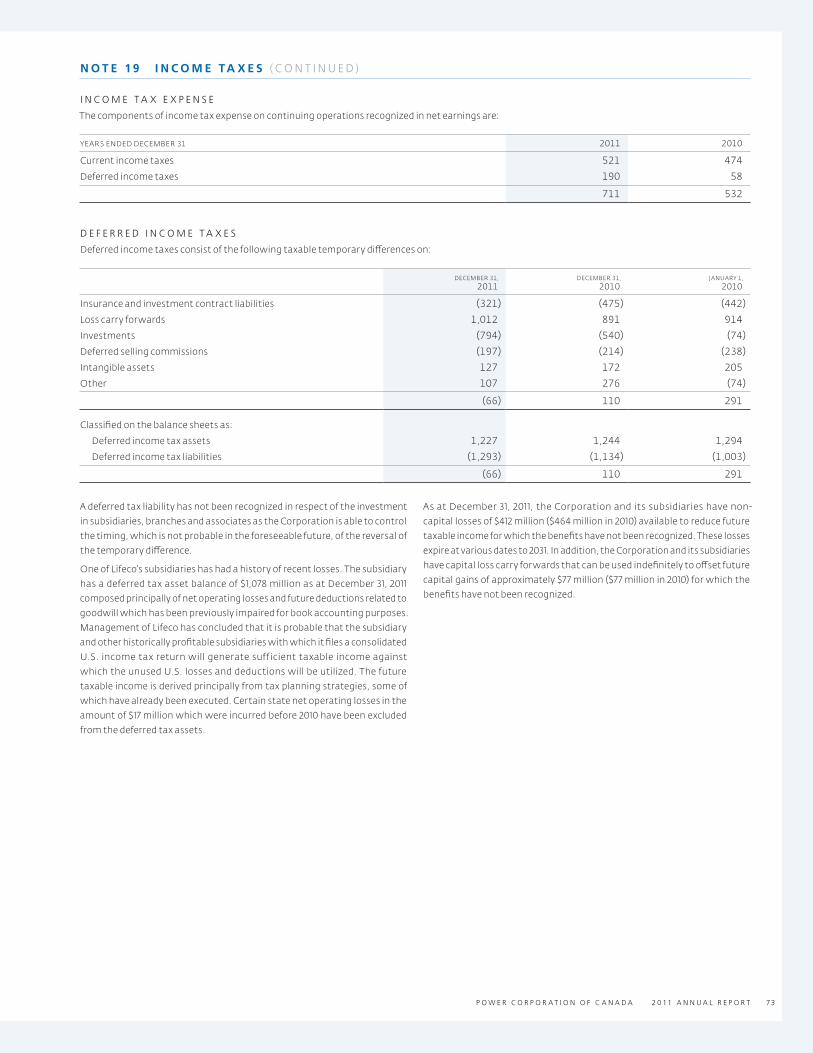
P O W E R C O R P O R A T I O N O F C A N A D A 2 0 11 A N N U A L R E P O R T 73
I N C O M E T A X E X P E N S E
The components of income tax expense on continuing operations recognized in net earnings are:
YEARS ENDED DECEMBER 31 2011 2010
Current income taxes 521 474
Deferred income taxes 190 58
711 532
D E F E R R E D I N C O M E T A X E S
Deferred income taxes consist of the following taxable temporary differences on:
DECEMBER 31, 2011
DECEMBER 31, 2010
JANUARY 1, 2010
Insurance and investment contract liabilities (321) (475) (442)
Loss carry forwards 1,012 891 914
Investments (794) (540) (74)
Deferred selling commissions (197) (214) (238)
Intangible assets 127 172 205
Other 107 276 (74)
(66) 110 291
Classified on the balance sheets as:
Deferred income tax assets 1,227 1,244 1,294
Deferred income tax liabilities (1,293) (1,134) (1,003)
(66) 110 291
A deferred tax liability has not been recognized in respect of the investment
in subsidiaries, branches and associates as the Corporation is able to control
the timing, which is not probable in the foreseeable future, of the reversal of
the temporary difference.
One of Lifeco’s subsidiaries has had a history of recent losses. The subsidiary
has a deferred tax asset balance of $1,078 million as at December 31, 2011
composed principally of net operating losses and future deductions related to
goodwill which has been previously impaired for book accounting purposes.
Management of Lifeco has concluded that it is probable that the subsidiary
and other historically profitable subsidiaries with which it files a consolidated
U.S. income tax return will generate sufficient taxable income against
which the unused U.S. losses and deductions will be utilized. The future
taxable income is derived principally from tax planning strategies, some of
which have already been executed. Certain state net operating losses in the
amount of $17 million which were incurred before 2010 have been excluded
from the deferred tax assets.
As at December 31, 2011, the Corporation and its subsidiaries have non‑
capital losses of $412 million ($464 million in 2010) available to reduce future
taxable income for which the benefits have not been recognized. These losses
expire at various dates to 2031. In addition, the Corporation and its subsidiaries
have capital loss carry forwards that can be used indefinitely to offset future
capital gains of approximately $77 million ($77 million in 2010) for which the
benefits have not been recognized.
N O T E 1 9 I N C O M E TA X E S ( CO N T I N U E D )
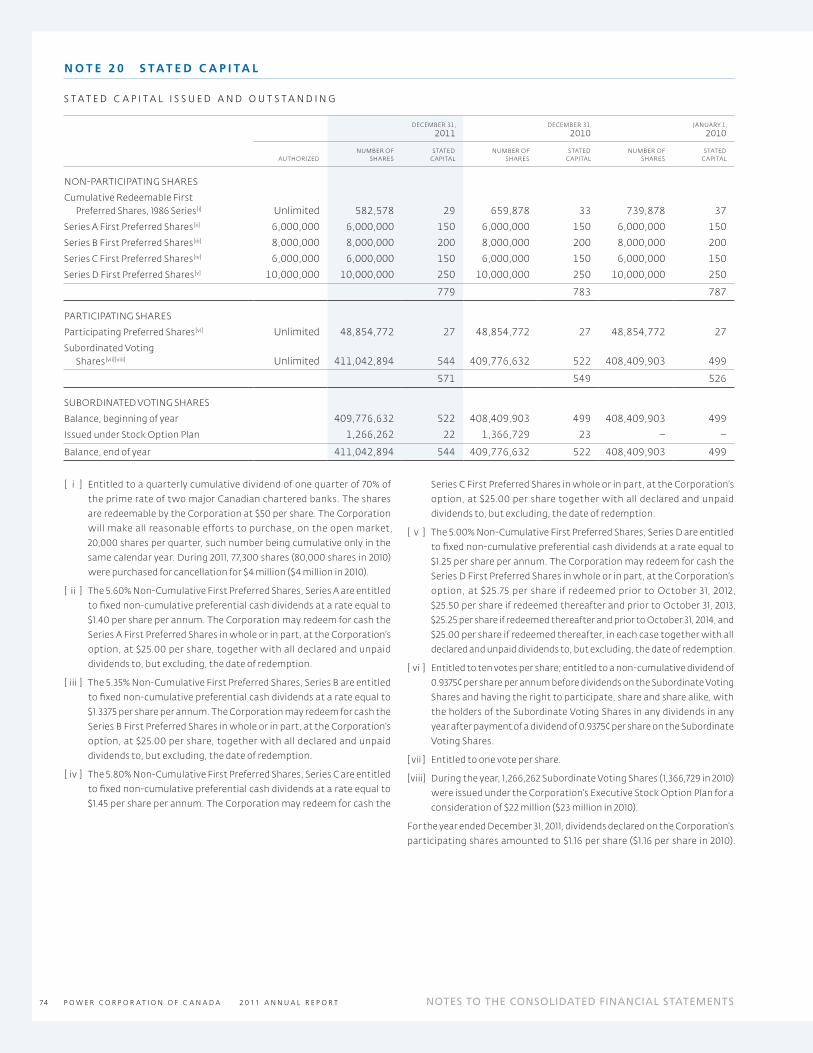
P O W E R C O R P O R A T I O N O F C A N A D A 2 0 11 A N N U A L R E P O R T74 NOTES TO THE CONSOLIDATED FINANCIAL STATEMENTS
N O T E 2 0 S TAT E D C A P I TA L
S T A T E D C A P I T A L I S S U E D A N D O U T S T A N D I N G
DECEMBER 31, 2011
DECEMBER 31, 2010
JANUARY 1, 2010
AUTHORIZEDNUMBER OF
SHARESSTATED
CAPITALNUMBER OF
SHARESSTATED
CAPITALNUMBER OF
SHARESSTATED
CAPITAL
NON‑PARTICIPATING SHARES
Cumulative Redeemable First Preferred Shares, 1986 Series [i] Unlimited 582,578 29 659,878 33 739,878 37
Series A First Preferred Shares [ii] 6,000,000 6,000,000 150 6,000,000 150 6,000,000 150
Series B First Preferred Shares [iii] 8,000,000 8,000,000 200 8,000,000 200 8,000,000 200
Series C First Preferred Shares [iv] 6,000,000 6,000,000 150 6,000,000 150 6,000,000 150
Series D First Preferred Shares [v] 10,000,000 10,000,000 250 10,000,000 250 10,000,000 250
779 783 787
PARTICIPATING SHARES
Participating Preferred Shares [vi] Unlimited 48,854,772 27 48,854,772 27 48,854,772 27
Subordinated Voting Shares [vii][viii] Unlimited 411,042,894 544 409,776,632 522 408,409,903 499
571 549 526
SUBORDINATED VOTING SHARES
Balance, beginning of year 409,776,632 522 408,409,903 499 408,409,903 499
Issued under Stock Option Plan 1,266,262 22 1,366,729 23 – –
Balance, end of year 411,042,894 544 409,776,632 522 408,409,903 499
[ i ] Entitled to a quarterly cumulative dividend of one quarter of 70% of
the prime rate of two major Canadian chartered banks. The shares
are redeemable by the Corporation at $50 per share. The Corporation
will make all reasonable efforts to purchase, on the open market,
20,000 shares per quarter, such number being cumulative only in the
same calendar year. During 2011, 77,300 shares (80,000 shares in 2010)
were purchased for cancellation for $4 million ($4 million in 2010).
[ ii ] The 5.60% Non‑Cumulative First Preferred Shares, Series A are entitled
to fixed non‑cumulative preferential cash dividends at a rate equal to
$1.40 per share per annum. The Corporation may redeem for cash the
Series A First Preferred Shares in whole or in part, at the Corporation’s
option, at $25.00 per share, together with all declared and unpaid
dividends to, but excluding, the date of redemption.
[ iii ] The 5.35% Non‑Cumulative First Preferred Shares, Series B are entitled
to fixed non‑cumulative preferential cash dividends at a rate equal to
$1.3375 per share per annum. The Corporation may redeem for cash the
Series B First Preferred Shares in whole or in part, at the Corporation’s
option, at $25.00 per share, together with all declared and unpaid
dividends to, but excluding, the date of redemption.
[ iv ] The 5.80% Non‑Cumulative First Preferred Shares, Series C are entitled
to fixed non‑cumulative preferential cash dividends at a rate equal to
$1.45 per share per annum. The Corporation may redeem for cash the
Series C First Preferred Shares in whole or in part, at the Corporation’s
option, at $25.00 per share together with all declared and unpaid
dividends to, but excluding, the date of redemption.
[ v ] The 5.00% Non‑Cumulative First Preferred Shares, Series D are entitled
to fixed non‑cumulative preferential cash dividends at a rate equal to
$1.25 per share per annum. The Corporation may redeem for cash the
Series D First Preferred Shares in whole or in part, at the Corporation’s
option, at $25.75 per share if redeemed prior to October 31, 2012,
$25.50 per share if redeemed thereafter and prior to October 31, 2013,
$25.25 per share if redeemed thereafter and prior to October 31, 2014, and
$25.00 per share if redeemed thereafter, in each case together with all
declared and unpaid dividends to, but excluding, the date of redemption.
[ vi ] Entitled to ten votes per share; entitled to a non‑cumulative dividend of
0.9375¢ per share per annum before dividends on the Subordinate Voting
Shares and having the right to participate, share and share alike, with
the holders of the Subordinate Voting Shares in any dividends in any
year after payment of a dividend of 0.9375¢ per share on the Subordinate
Voting Shares.
[ vii ] Entitled to one vote per share.
[ viii] During the year, 1,266,262 Subordinate Voting Shares (1,366,729 in 2010)
were issued under the Corporation’s Executive Stock Option Plan for a
consideration of $22 million ($23 million in 2010).
For the year ended December 31, 2011, dividends declared on the Corporation’s
participating shares amounted to $1.16 per share ($1.16 per share in 2010).
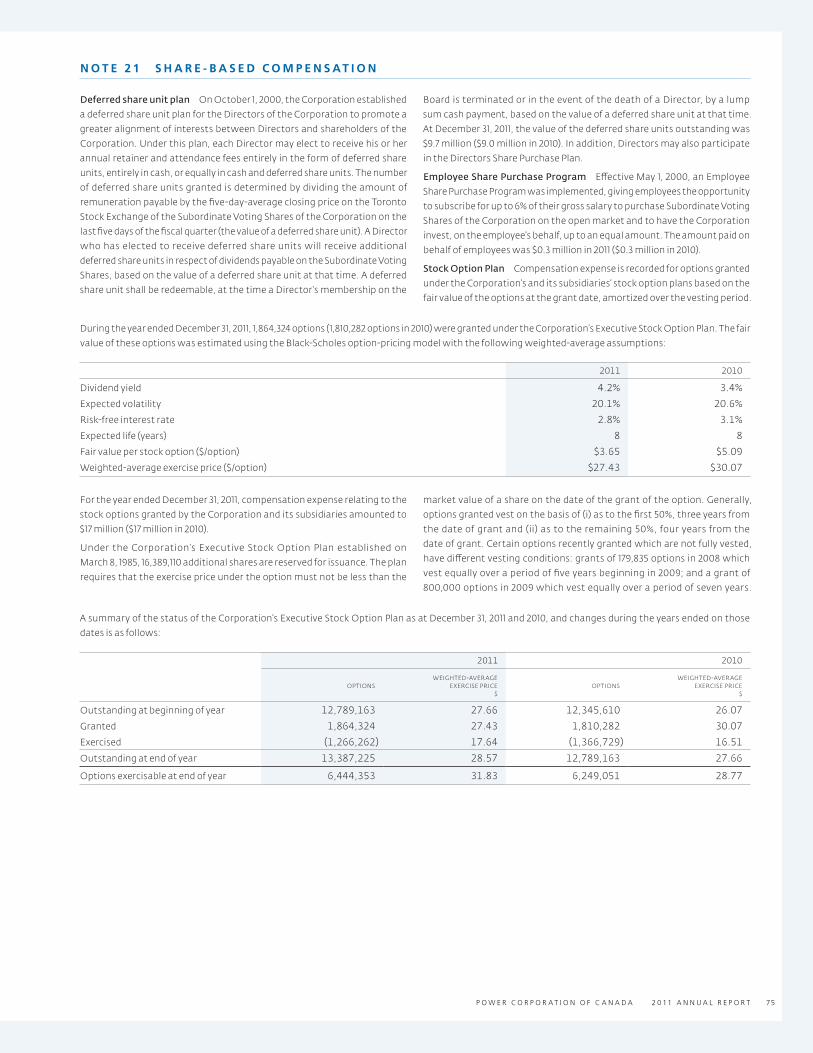
P O W E R C O R P O R A T I O N O F C A N A D A 2 0 11 A N N U A L R E P O R T 75
N O T E 2 1 S H A R E - B A S E D C O M P E N S AT I O N
Deferred share unit plan On October 1, 2000, the Corporation established
a deferred share unit plan for the Directors of the Corporation to promote a
greater alignment of interests between Directors and shareholders of the
Corporation. Under this plan, each Director may elect to receive his or her
annual retainer and attendance fees entirely in the form of deferred share
units, entirely in cash, or equally in cash and deferred share units. The number
of deferred share units granted is determined by dividing the amount of
remuneration payable by the five‑day‑average closing price on the Toronto
Stock Exchange of the Subordinate Voting Shares of the Corporation on the
last five days of the fiscal quarter (the value of a deferred share unit). A Director
who has elected to receive deferred share units will receive additional
deferred share units in respect of dividends payable on the Subordinate Voting
Shares, based on the value of a deferred share unit at that time. A deferred
share unit shall be redeemable, at the time a Director’s membership on the
Board is terminated or in the event of the death of a Director, by a lump
sum cash payment, based on the value of a deferred share unit at that time.
At December 31, 2011, the value of the deferred share units outstanding was
$9.7 million ($9.0 million in 2010). In addition, Directors may also participate
in the Directors Share Purchase Plan.
Employee Share Purchase Program Effective May 1, 2000, an Employee
Share Purchase Program was implemented, giving employees the opportunity
to subscribe for up to 6% of their gross salary to purchase Subordinate Voting
Shares of the Corporation on the open market and to have the Corporation
invest, on the employee’s behalf, up to an equal amount. The amount paid on
behalf of employees was $0.3 million in 2011 ($0.3 million in 2010).
Stock Option Plan Compensation expense is recorded for options granted
under the Corporation’s and its subsidiaries’ stock option plans based on the
fair value of the options at the grant date, amortized over the vesting period.
During the year ended December 31, 2011, 1,864,324 options (1,810,282 options in 2010) were granted under the Corporation’s Executive Stock Option Plan. The fair
value of these options was estimated using the Black‑Scholes option‑pricing model with the following weighted‑average assumptions:
2011 2010
Dividend yield 4.2% 3.4%
Expected volatility 20.1% 20.6%
Risk‑free interest rate 2.8% 3.1%
Expected life (years) 8 8
Fair value per stock option ($/option) $3.65 $5.09
Weighted‑average exercise price ($/option) $27.43 $30.07
For the year ended December 31, 2011, compensation expense relating to the
stock options granted by the Corporation and its subsidiaries amounted to
$17 million ($17 million in 2010).
Under the Corporation’s Executive Stock Option Plan established on
March 8, 1985, 16,389,110 additional shares are reserved for issuance. The plan
requires that the exercise price under the option must not be less than the
market value of a share on the date of the grant of the option. Generally,
options granted vest on the basis of (i) as to the first 50%, three years from
the date of grant and (ii) as to the remaining 50%, four years from the
date of grant. Certain options recently granted which are not fully vested,
have different vesting conditions: grants of 179,835 options in 2008 which
vest equally over a period of five years beginning in 2009; and a grant of
800,000 options in 2009 which vest equally over a period of seven years.
A summary of the status of the Corporation’s Executive Stock Option Plan as at December 31, 2011 and 2010, and changes during the years ended on those
dates is as follows:
2011 2010
OPTIONSWEIGHTED‑AVERAGE
EXERCISE PRICE$
OPTIONSWEIGHTED‑AVERAGE
EXERCISE PRICE$
Outstanding at beginning of year 12,789,163 27.66 12,345,610 26.07
Granted 1,864,324 27.43 1,810,282 30.07
Exercised (1,266,262) 17.64 (1,366,729) 16.51
Outstanding at end of year 13,387,225 28.57 12,789,163 27.66
Options exercisable at end of year 6,444,353 31.83 6,249,051 28.77
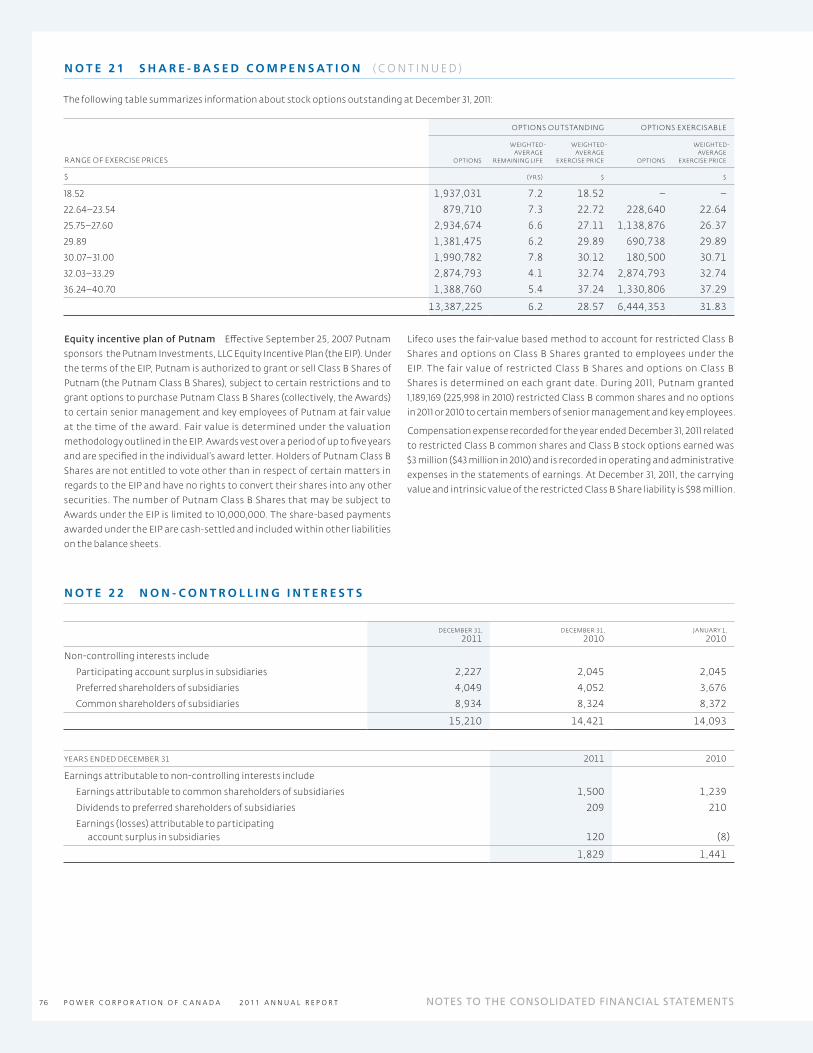
P O W E R C O R P O R A T I O N O F C A N A D A 2 0 11 A N N U A L R E P O R T76 NOTES TO THE CONSOLIDATED FINANCIAL STATEMENTS
The following table summarizes information about stock options outstanding at December 31, 2011:
OPTIONS OUTSTANDING OPTIONS EXERCISABLE
RANGE OF EXERCISE PRICES OPTIONS
WEIGHTED‑AVERAGE
REMAINING LIFE
WEIGHTED‑AVERAGE
EXERCISE PRICE OPTIONS
WEIGHTED‑AVERAGE
EXERCISE PRICE
$ (YRS) $ $
18.52 1,937,031 7.2 18.52 – –
22.64 – 23.54 879,710 7.3 22.72 228,640 22.64
25.75 – 27.60 2,934,674 6.6 27.11 1,138,876 26.37
29.89 1,381,475 6.2 29.89 690,738 29.89
30.07 – 31.00 1,990,782 7.8 30.12 180,500 30.71
32.03 – 33.29 2,874,793 4.1 32.74 2,874,793 32.74
36.24 – 40.70 1,388,760 5.4 37.24 1,330,806 37.29
13,387,225 6.2 28.57 6,444,353 31.83
Equity incentive plan of Putnam Effective September 25, 2007 Putnam
sponsors the Putnam Investments, LLC Equity Incentive Plan (the EIP). Under
the terms of the EIP, Putnam is authorized to grant or sell Class B Shares of
Putnam (the Putnam Class B Shares), subject to certain restrictions and to
grant options to purchase Putnam Class B Shares (collectively, the Awards)
to certain senior management and key employees of Putnam at fair value
at the time of the award. Fair value is determined under the valuation
methodology outlined in the EIP. Awards vest over a period of up to five years
and are specified in the individual’s award letter. Holders of Putnam Class B
Shares are not entitled to vote other than in respect of certain matters in
regards to the EIP and have no rights to convert their shares into any other
securities. The number of Putnam Class B Shares that may be subject to
Awards under the EIP is limited to 10,000,000. The share‑based payments
awarded under the EIP are cash‑settled and included within other liabilities
on the balance sheets.
Lifeco uses the fair‑value based method to account for restricted Class B
Shares and options on Class B Shares granted to employees under the
EIP. The fair value of restricted Class B Shares and options on Class B
Shares is determined on each grant date. During 2011, Putnam granted
1,189,169 (225,998 in 2010) restricted Class B common shares and no options
in 2011 or 2010 to certain members of senior management and key employees.
Compensation expense recorded for the year ended December 31, 2011 related
to restricted Class B common shares and Class B stock options earned was
$3 million ($43 million in 2010) and is recorded in operating and administrative
expenses in the statements of earnings. At December 31, 2011, the carrying
value and intrinsic value of the restricted Class B Share liability is $98 million.
N O T E 2 2 N O N - C O N T R O L L I N G I N T E R E S T S
DECEMBER 31, 2011
DECEMBER 31, 2010
JANUARY 1, 2010
Non‑controlling interests include
Participating account surplus in subsidiaries 2,227 2,045 2,045
Preferred shareholders of subsidiaries 4,049 4,052 3,676
Common shareholders of subsidiaries 8,934 8,324 8,372
15,210 14,421 14,093
YEARS ENDED DECEMBER 31 2011 2010
Earnings attributable to non‑controlling interests include
Earnings attributable to common shareholders of subsidiaries 1,500 1,239
Dividends to preferred shareholders of subsidiaries 209 210
Earnings (losses) attributable to participating account surplus in subsidiaries 120 (8)
1,829 1,441
N O T E 2 1 S H A R E - B A S E D C O M P E N S AT I O N ( CO N T I N U E D )

P O W E R C O R P O R A T I O N O F C A N A D A 2 0 11 A N N U A L R E P O R T 77
N O T E 2 3 C A P I TA L M A N A G E M E N T
As an investment holding company, Power Corporation’s objectives in
managing its capital are:
> To provide sufficient financial flexibility to pursue its growth strategy and
support its group companies and other investments.
> To maintain an appropriate credit rating to achieve access to the capital
markets at the lowest overall cost of capital.
> To provide attractive long‑term returns to shareholders of the Corporation.
The Corporation manages its capital taking into consideration the risk
characteristics and liquidity of its holdings. In order to maintain or adjust its
capital structure, the Corporation may adjust the amount of dividends paid
to shareholders, return capital to shareholders or issue new forms of capital.
The capital structure of the Corporation consists of preferred shares,
debentures and equity composed of stated capital, retained earnings and
non‑controlling interests in the equity of subsidiaries of the Corporation.
The Corporation utilizes perpetual non‑participating shares as a permanent
and cost‑effective source of capital. The Corporation considers itself to be a
long‑term investor and as such holds positions in long‑term investments as
well as cash and short‑term investments for liquidity purposes. As such, the
Corporation makes minimal use of leverage at the holding company level.
The Corporation is not subject to externally imposed regulator y
capital requirements.
The Corporation’s major operating subsidiaries are subject to regulatory
capital requirements along with capital standards set by peers or
rating agencies.
Lifeco’s subsidiaries Great‑West Life and Great‑West Life & Annuity are
subject to minimum regulatory capital requirements. Lifeco’s practice is to
maintain the capitalization of its regulated operating subsidiaries at a level
that will exceed the relevant minimum regulatory capital requirements in
the jurisdictions in which they operate:
> In Canada, the Office of the Superintendent of Financial Institutions
has established a capital adequacy measurement for life insurance
companies incorporated under the Insurance Companies Act (Canada) and
their subsidiaries, known as the Minimum Continuing Capital and Surplus
Requirements (MCCSR). As at December 31, 2011, the MCCSR ratio for
Great‑West Life was 204%.
> At December 31, 2011, the Risk‑Based Capital ratio (RBC) of Great‑West
Life & Annuity, Lifeco’s regulated U.S. operating company, was 430% of
the Company Action Level set by the National Association of Insurance
Commissioners. Great‑West Life & Annuity reports its RBC ratio annually to
U.S. insurance regulators.
> In the United Kingdom, Canada Life UK is required to satisfy the capital
resources requirements set out in the Integrated Prudential Sourcebook,
part of the Financial Services Authority Handbook. The capital requirements
are prescribed by a formulaic capital requirement (Pillar 1) and an individual
capital adequacy framework which requires an entity to self‑assess an
appropriate amount of capital it should hold, based on the risks encountered
from its business activities. At the end of 2011, Canada Life UK complied with
the capital resource requirements in the United Kingdom.
> As at December 31, 2010 and 2011, Lifeco maintained capital levels above the
minimum local requirements in its other foreign operations.
IGM subsidiaries subject to regulatory capital requirements include trust
companies, securities dealers and mutual fund dealers. These subsidiaries
are in compliance with all regulatory capital requirements.
N O T E 2 4 R I S K M A N A G E M E N T
Power Corporation and its subsidiaries have policies relating to the
identification, measurement, monitoring, mitigating and controlling of
risks associated with financial instruments. The key risks related to financial
instruments are liquidity risk, credit risk and market risk (currency, interest
rate and equity price).
The Corporation and its subsidiaries have also established policies and
procedures designed to identify, measure and report all material risks.
Management is responsible for establishing capital management procedures
for implementing and monitoring the capital plan. The Board of Directors
of the Corporation and the boards of directors of its subsidiaries review and
approve all capital transactions undertaken by management.
L I Q U I D I T Y R I S K
Liquidity risk is the risk that the Corporation and its subsidiaries will not be
able to meet all cash outflow obligations as they come due.
Power Corporation is a holding company. As such, corporate cash flows from
operations, before payment of dividends, are principally made up of dividends
received from its subsidiaries and income from investments, less operating
expenses, financing charges and income taxes. Power Financial, which is also
a holding company, represents a significant component of corporate cash
flows. The ability of Lifeco and IGM, which are also holding companies, to
meet their obligations and pay dividends depends in particular upon receipt
of sufficient funds from their own subsidiaries.
Power Corporation and Power Financial seek to maintain a sufficient
level of liquidity to meet all their cash flow requirements. In addition,
Power Corporation and Power Financial jointly have a $100 million
uncommitted line of credit with a Canadian chartered bank. A wholly owned
subsidiary of the Corporation maintains a $40 million uncommitted line of
credit with a Canadian chartered bank.

P O W E R C O R P O R A T I O N O F C A N A D A 2 0 11 A N N U A L R E P O R T78 NOTES TO THE CONSOLIDATED FINANCIAL STATEMENTS
Principal payments on debentures (other than those of Lifeco and IGM
discussed below) represent the only significant contractual liquidity
requirement of Power Corporation and Power Financial.
DECEMBER 31, 2011LESS THAN
1 YEAR1 – 5
YEARSAF TER
5 YEARS TOTAL
Debentures 8 – 650 658
Power Corporation’s liquidity position and its management of liquidity risk
have not changed materially since December 31, 2010.
For Lifeco, the following policies and procedures are in place to manage
liquidity risk:
> Lifeco closely manages operating liquidity through cash flow matching of
assets and liabilities and forecasting earned and required yields, to ensure
consistency between policyholder requirements and the yield of assets.
Approximately 72% of insurance and investment contract liabilities are
non‑cashable prior to maturity or subject to market value adjustments.
> Management of Lifeco monitors the use of lines of credit on a regular basis,
and assesses the ongoing availability of these and alternative forms of
operating credit.
> Management of Lifeco closely monitors the solvency and capital positions
of its principal subsidiaries opposite liquidity requirements at the holding
company. Additional liquidity is available through established lines of credit
or the capital markets. Lifeco maintains a $200 million committed line of
credit with a Canadian chartered bank.
In the normal course of business, Lifeco enters into contracts that give rise to commitments of future minimum payments that impact short‑term and long‑
term liquidity. The following table summarizes the principal repayment schedule of certain of Lifeco’s financial liabilities.
PAYMENTS DUE BY PERIOD
DECEMBER 31, 2011 1 YEAR 2 YEARS 3 YEARS 4 YEARS 5 YEARSAFTER
5 YEARS TOTAL
Debentures and other debt instruments 609 1 1 – – 3,702 4,313
Capital trust securities[1] – – – – – 800 800
Purchase obligations 65 35 16 16 4 – 136
Pension contributions 150 – – – – – 150
824 36 17 16 4 4,502 5,399
[1] Payments due have not been reduced to reflect that Lifeco held capital trust securities of $275 million principal amount ($282 million carrying value).
IGM’s liquidity management practices include: controls over liquidity
management processes; stress testing of various operating scenarios; and
oversight over liquidity management by committees of the board of directors
of IGM.
For IGM, a key liquidity requirement is the funding of commissions paid on
the sale of mutual funds. Commissions on the sale of mutual funds continue
to be paid from operating cash flows.
IGM also maintains sufficient liquidity to fund and temporarily hold
mortgages. Through its mortgage banking operations, residential mortgages
are sold or securitized to:
> Investors Mortgage and Short Term Income Fund and Investors Canadian
Corporate Bond Fund;
> third parties, including Canada Mortgage and Housing Corporation
(CMHC) or Canadian bank‑sponsored securitization trusts;
> institutional investors through private placements.
Certain subsidiaries of Investors Group are approved issuers of National
Housing Act Mortgage‑Backed Securities (NHA MBS) and approved sellers
into the Canada Mortgage Bond Program (CMB Program). This issuer and
seller status provides IGM with additional funding sources for residential
mortgages. IGM’s continued ability to fund residential mortgages through
Canadian bank‑sponsored securitization trusts and NHA MBS is dependent
on securitization market conditions that are subject to change.
Liquidity requirements for a trust subsidiary which engages in financial
intermediary activities are based on policies approved by a committee of its
board of directors. As at December 31, 2011, the trust subsidiary’s liquidity was
in compliance with these policies.
N O T E 2 4 R I S K M A N A G E M E N T ( CO N T I N U E D )
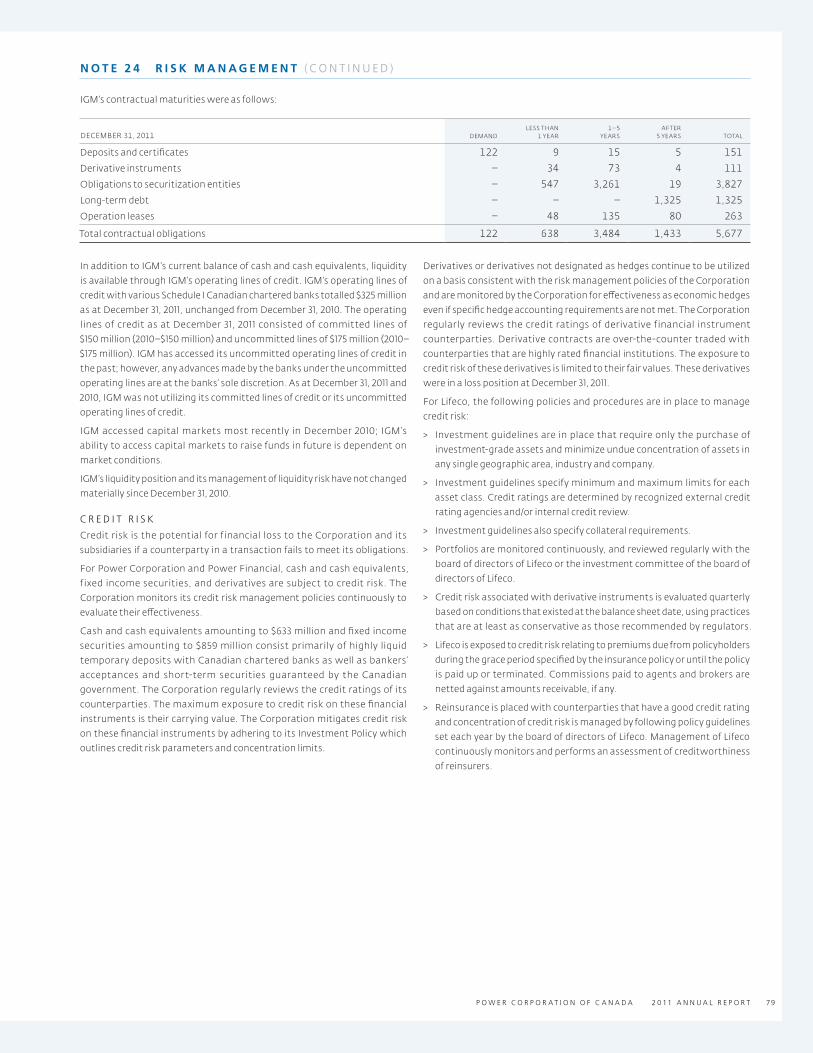
P O W E R C O R P O R A T I O N O F C A N A D A 2 0 11 A N N U A L R E P O R T 79
IGM’s contractual maturities were as follows:
DECEMBER 31, 2011 DEMANDLESS THAN
1 YEAR1 – 5
YEARSAFTER
5 YEARS TOTAL
Deposits and certificates 122 9 15 5 151
Derivative instruments – 34 73 4 111
Obligations to securitization entities – 547 3,261 19 3,827
Long‑term debt – – – 1,325 1,325
Operation leases – 48 135 80 263
Total contractual obligations 122 638 3,484 1,433 5,677
In addition to IGM’s current balance of cash and cash equivalents, liquidity
is available through IGM’s operating lines of credit. IGM’s operating lines of
credit with various Schedule I Canadian chartered banks totalled $325 million
as at December 31, 2011, unchanged from December 31, 2010. The operating
lines of credit as at December 31, 2011 consisted of committed lines of
$150 million (2010–$150 million) and uncommitted lines of $175 million (2010–
$175 million). IGM has accessed its uncommitted operating lines of credit in
the past; however, any advances made by the banks under the uncommitted
operating lines are at the banks’ sole discretion. As at December 31, 2011 and
2010, IGM was not utilizing its committed lines of credit or its uncommitted
operating lines of credit.
IGM accessed capital markets most recently in December 2010; IGM’s
ability to access capital markets to raise funds in future is dependent on
market conditions.
IGM’s liquidity position and its management of liquidity risk have not changed
materially since December 31, 2010.
C R E D I T R I S K
Credit risk is the potential for financial loss to the Corporation and its
subsidiaries if a counterparty in a transaction fails to meet its obligations.
For Power Corporation and Power Financial, cash and cash equivalents,
fixed income securities, and derivatives are subject to credit risk. The
Corporation monitors its credit risk management policies continuously to
evaluate their effectiveness.
Cash and cash equivalents amounting to $633 million and fixed income
securities amounting to $859 million consist primarily of highly liquid
temporary deposits with Canadian chartered banks as well as bankers’
acceptances and short‑term securities guaranteed by the Canadian
government. The Corporation regularly reviews the credit ratings of its
counterparties. The maximum exposure to credit risk on these financial
instruments is their carrying value. The Corporation mitigates credit risk
on these financial instruments by adhering to its Investment Policy which
outlines credit risk parameters and concentration limits.
Derivatives or derivatives not designated as hedges continue to be utilized
on a basis consistent with the risk management policies of the Corporation
and are monitored by the Corporation for effectiveness as economic hedges
even if specific hedge accounting requirements are not met. The Corporation
regularly reviews the credit ratings of derivative financial instrument
counterparties. Derivative contracts are over‑the‑counter traded with
counterparties that are highly rated financial institutions. The exposure to
credit risk of these derivatives is limited to their fair values. These derivatives
were in a loss position at December 31, 2011.
For Lifeco, the following policies and procedures are in place to manage
credit risk:
> Investment guidelines are in place that require only the purchase of
investment‑grade assets and minimize undue concentration of assets in
any single geographic area, industry and company.
> Investment guidelines specify minimum and maximum limits for each
asset class. Credit ratings are determined by recognized external credit
rating agencies and/or internal credit review.
> Investment guidelines also specify collateral requirements.
> Portfolios are monitored continuously, and reviewed regularly with the
board of directors of Lifeco or the investment committee of the board of
directors of Lifeco.
> Credit risk associated with derivative instruments is evaluated quarterly
based on conditions that existed at the balance sheet date, using practices
that are at least as conservative as those recommended by regulators.
> Lifeco is exposed to credit risk relating to premiums due from policyholders
during the grace period specified by the insurance policy or until the policy
is paid up or terminated. Commissions paid to agents and brokers are
netted against amounts receivable, if any.
> Reinsurance is placed with counterparties that have a good credit rating
and concentration of credit risk is managed by following policy guidelines
set each year by the board of directors of Lifeco. Management of Lifeco
continuously monitors and performs an assessment of creditworthiness
of reinsurers.
N O T E 2 4 R I S K M A N A G E M E N T ( CO N T I N U E D )

P O W E R C O R P O R A T I O N O F C A N A D A 2 0 11 A N N U A L R E P O R T80 NOTES TO THE CONSOLIDATED FINANCIAL STATEMENTS
MA XIMUM EXPOSURE TO CREDIT R ISK FOR L IFECO
The following table summarizes Lifeco’s maximum exposure to credit risk related to financial instruments. The maximum credit exposure is the carrying
value of the asset net of any allowances for losses.
DECEMBER 31,2011
DECEMBER 31, 2010
JANUARY 1, 2010
Cash and cash equivalents 2,056 1,840 3,427
Bonds
Fair value through profit or loss 61,709 56,333 52,375
Available for sale 6,620 6,580 4,607
Loans and receivables 9,744 9,290 9,165
Mortgage loans 17,432 16,115 16,684
Loans to policyholders 7,162 6,827 6,957
Funds held by ceding insurers [1] 9,923 9,856 10,984
Reinsurance assets 2,061 2,533 2,800
Other financial assets [1] 3,764 3,934 4,115
Derivative assets 968 984 717
Total balance sheet maximum credit exposure 121,439 114,292 111,831
[1] Includes $9,411 million ($9,333 million at December 31, 2010 and $10,329 at January 1, 2010) of funds held by ceding insurers where Lifeco retains the credit risk of the assets supporting the liabilities ceded.
Credit risk is also mitigated by entering into collateral agreements. The amount
and type of collateral required depends on an assessment of the credit risk of the
counterparty. Guidelines are implemented regarding the acceptability of types
of collateral and the valuation parameters. Management of Lifeco monitors the
value of the collateral, requests additional collateral when needed and performs
an impairment valuation when applicable. Lifeco has $21 million of collateral
received in 2011 ($24 million of collateral received at December 31, 2010 and
$35 million of collateral received at January 1, 2010) relating to derivative assets.
CONCENTR ATION OF CREDIT R ISK FOR L IFECO
Concentrations of credit risk arise from exposures to a single debtor, a
group of related debtors or groups of debtors that have similar credit risk
characteristics in that they operate in the same geographic region or in
similar industries. The characteristics are similar in that changes in economic
or political environments may impact their ability to meet obligations as
they come due.
The following table provides details of the carrying value of bonds of Lifeco by industry sector and geographic distribution:
DECEMBER 31, 2011 CANADAUNITED STATES EUROPE TOTAL
Bonds issued or guaranteed by:
Canadian federal government 4,328 2 42 4,372
Provincial, state and municipal governments 6,430 1,980 53 8,463
U.S. Treasury and other U.S. agencies 271 2,857 1,006 4,134
Other foreign governments 185 25 8,216 8,426
Government‑related 1,293 – 955 2,248
Supranationals 443 12 211 666
Asset‑backed securities 2,696 3,401 803 6,900
Residential mortgage‑backed securities 26 638 146 810
Banks 2,168 416 1,858 4,442
Other financial institutions 855 1,449 1,615 3,919
Basic materials 233 748 214 1,195
Communications 508 221 501 1,230
Consumer products 1,848 1,813 1,771 5,432
Industrial products/services 695 825 212 1,732
Natural resources 1,127 560 554 2,241
Real estate 608 – 1,610 2,218
Transportation 1,721 672 624 3,017
Utilities 3,792 2,689 3,158 9,639
Miscellaneous 2,024 814 277 3,115
Total long‑term bonds 31,251 19,122 23,826 74,199
Short‑term bonds 2,980 323 571 3,874
34,231 19,445 24,397 78,073
N O T E 2 4 R I S K M A N A G E M E N T ( CO N T I N U E D )

P O W E R C O R P O R A T I O N O F C A N A D A 2 0 11 A N N U A L R E P O R T 81
DECEMBER 31, 2010 CANADAUNITED STATES EUROPE TOTAL
Bonds issued or guaranteed by:
Canadian federal government 3,548 – 31 3,579
Provincial, state and municipal governments 5,619 1,815 62 7,496
U.S. Treasury and other U.S. agencies 335 2,851 976 4,162
Other foreign governments 216 11 7,617 7,844
Government‑related 1,057 – 946 2,003
Supranationals 381 11 223 615
Asset‑backed securities 2,728 3,450 842 7,020
Residential mortgage‑backed securities 25 745 111 881
Banks 2,183 442 1,993 4,618
Other financial institutions 1,057 1,359 1,470 3,886
Basic materials 201 587 182 970
Communications 589 246 477 1,312
Consumer products 1,608 1,419 1,495 4,522
Industrial products/services 544 726 181 1,451
Natural resources 997 561 422 1,980
Real estate 422 – 1,400 1,822
Transportation 1,557 563 464 2,584
Utilities 3,266 2,433 2,794 8,493
Miscellaneous 1,728 628 232 2,588
Total long‑term bonds 28,061 17,847 21,918 67,826
Short‑term bonds 2,822 816 739 4,377
30,883 18,663 22,657 72,203
JANUARY 1, 2010 CANADAUNITED STATES EUROPE TOTAL
Bonds issued or guaranteed by:
Canadian federal government 2,264 1 14 2,279
Provincial, state and municipal governments 4,917 1,333 58 6,308
U.S. Treasury and other U.S. agencies 240 2,620 758 3,618
Other foreign governments 212 – 6,652 6,864
Government‑related 937 – 916 1,853
Supranationals 516 4 436 956
Asset‑backed securities 2,636 3,306 851 6,793
Residential mortgage‑backed securities 46 842 60 948
Banks 2,201 453 2,299 4,953
Other financial institutions 1,021 1,336 1,507 3,864
Basic materials 151 571 198 920
Communications 598 276 473 1,347
Consumer products 1,384 1,351 1,664 4,399
Industrial products/services 516 651 206 1,373
Natural resources 1,000 710 581 2,291
Real estate 559 – 1,216 1,775
Transportation 1,414 585 495 2,494
Utilities 3,008 2,172 2,701 7,881
Miscellaneous 1,489 562 182 2,233
Total long‑term bonds 25,109 16,773 21,267 63,149
Short‑term bonds 2,406 455 137 2,998
27,515 17,228 21,404 66,147
N O T E 2 4 R I S K M A N A G E M E N T ( CO N T I N U E D )

P O W E R C O R P O R A T I O N O F C A N A D A 2 0 11 A N N U A L R E P O R T82 NOTES TO THE CONSOLIDATED FINANCIAL STATEMENTS
The following table provides details of the carrying value of mortgage loans of Lifeco by geographic location:
DECEMBER 31, 2011SINGLE‑FAMILY
RESIDENTIALMULTI‑FAMILY
RESIDENTIAL COMMERCIAL TOTAL
Canada 1,591 3,407 7,022 12,020
United States – 811 1,999 2,810
Europe 79 108 2,415 2,602
1,670 4,326 11,436 17,432
DECEMBER 31, 2010SINGLE‑FAMILY
RESIDENTIALMULTI‑FAMILY
RESIDENTIAL COMMERCIAL TOTAL
Canada 1,622 3,528 6,691 11,841
United States – 464 1,517 1,981
Europe – 26 2,267 2,293
1,622 4,018 10,475 16,115
JANUARY 1, 2010SINGLE‑FAMILY
RESIDENTIALMULTI‑FAMILY
RESIDENTIAL COMMERCIAL TOTAL
Canada 1,695 3,965 6,371 12,031
United States – 485 1,509 1,994
Europe – 29 2,630 2,659
1,695 4,479 10,510 16,684
ASSET QUALIT Y
BOND PORTFOLIO QUALIT YDECEMBER 31,
2011DECEMBER 31,
2010JANUARY 1,
2010
AAA 29,612 28,925 24,653
AA 12,894 11,436 10,684
A 22,066 19,968 19,332
BBB 12,399 10,649 10,113
BB and lower 1,102 1,225 1,365
Total bonds 78,073 72,203 66,147
DERIVATIVE PORTFOLIO QUALIT YDECEMBER 31,
2011DECEMBER 31,
2010JANUARY 1,
2010
Over‑the‑counter contracts (counterparty ratings):
AAA 12 5 5
AA 361 491 338
A 595 488 374
Total 968 984 717
N O T E 2 4 R I S K M A N A G E M E N T ( CO N T I N U E D )

P O W E R C O R P O R A T I O N O F C A N A D A 2 0 11 A N N U A L R E P O R T 83
LOANS OF L IFECO PAST DUE, BUT NOT IMPAIRED
Loans that are past due but not considered impaired are loans for which scheduled payments have not been received, but management of Lifeco has reasonable
assurance of collection of the full amount of principal and interest due. The following table provides carrying values of the loans past due, but not impaired:
DECEMBER 31, 2011
DECEMBER 31, 2010
JANUARY 1, 2010
Less than 30 days 3 7 45
30 – 90 days 1 2 6
Greater than 90 days 1 2 9
Total 5 11 60
The following outlines the future asset credit losses provided for in insurance and investment contract liabilities. These amounts are in addition to the
allowance for asset losses included with assets:
DECEMBER 31, 2011
DECEMBER 31, 2010
JANUARY 1, 2010
Participating 852 802 755
Non‑participating 1,648 1,516 1,712
2,500 2,318 2,467
For IGM, cash and cash equivalents, securities holdings, mortgage and
investment loan portfolios, and derivatives are subject to credit risk. IGM
monitors its credit risk management practices continuously to evaluate
their effectiveness.
With respect to IGM, at December 31, 2011, cash and cash equivalents of
$1,052 million consisted of cash balances of $97 million on deposit with
Canadian chartered banks and cash equivalents of $955 million. Cash
equivalents are composed primarily of Government of Canada treasury bills
totalling $521 million, provincial government and government‑guaranteed
commercial paper of $340 million and bankers’ acceptances issued by
Canadian chartered banks of $94 million. IGM regularly reviews the credit
ratings of its counterparties. The maximum exposure to credit risk on these
financial instruments is their carrying value. IGM manages credit risk related
to cash and cash equivalents by adhering to its Investment Policy that
outlines credit risk parameters and concentration limits.
Fair value through profit or loss securities include Canada Mortgage Bonds
with a fair value of $227 million and fixed income securities comprising the
restructured notes of the master asset vehicle conduits with a fair value of
$29 million. These fair values represent the maximum exposure to credit risk
of IGM at December 31, 2011.
IGM regularly reviews the credit quality of the mortgage portfolios related
to IGM’s mortgage banking operations and its intermediary operations,
as well as the adequacy of the collective allowance. As at December 31,
2011, mortgages related to continuing operations totalled $4.09 billion and
consisted of residential mortgages:
> Sold to securitization programs which are classified as loans and receivables
and totalled $3.76 billion compared to $3.47 billion at December 31, 2010.
In applying the derecognition criteria under IAS 39 — Financial Instruments,
IGM has recorded these loans on its balance sheet following securitization.
An offsetting liability, Obligations to securitization entities, has been
recorded and totalled $3.83 billion at December 31, 2011, compared to
$3.51 billion at December 31, 2010.
> Related to IGM’s mortgage banking operations which are classified as
held for trading and totalled $292.1 million, compared to $187.3 million
at December 31, 2010. These loans are held by IGM pending sale
or securitization.
> Related to IGM’s intermediary operations which are classified as loans
and receivables and totalled $31.3 million at December 31, 2011, compared
to $39.5 million at December 31, 2010.
As at December 31, 2011, the mortgage portfolios related to IGM’s intermediary
operations were geographically diverse, 100% residential (2010 – 100%)
and 99.4% insured (2010 – 99.0%). As at December 31, 2011, impaired and
uninsured, non‑performing mortgages over 90 days were nil, unchanged
from December 31, 2010. The characteristics of the mortgage portfolios have
not changed significantly during 2011.
IGM purchases portfolio insurance from CMHC on newly funded qualifying
conventional mortgages. Under the NHA MBS and CMB Programs, it is a
requirement that securitized mortgages be insured against default by an
approved insurer, and IGM has also insured substantially all loans securitized
through ABCP programs. At December 31, 2011, 93.0% of the securitized
portfolio and the residential mortgages classified as held for trading were
insured, compared to 94.1% at December 31, 2010. As at December 31, 2011,
impaired loans on these portfolios were $1 million, compared to $1 million
at December 31, 2010. At December 31, 2011, there were no uninsured non‑
performing mortgages over 90 days in these portfolios, compared to
$0.3 million at December 31, 2010.
The collective allowance for credit losses related to continuing operations
was $1 million at December 31, 2011, compared to $1 million at December 31,
2010, and is considered adequate by management to absorb all credit‑ related
losses in the mortgage portfolios.
IGM retains certain elements of credit risk on securitized loans. At December 31,
2011, 96.2% of securitized loans were insured against credit losses. The fair
value of IGM’s retained interests in securitized mortgages was $24 million at
December 31, 2011, compared to $107 million at December 31, 2010. Retained
interests include:
> Cash reserve accounts and rights to future net interest income — which were
$11 million and $91 million, respectively, at December 31, 2011. Cash reserve
accounts are reflected on the balance sheet, whereas rights to future net
interest income are not reflected on the balance sheet and will be recorded
over the life of the mortgages.
The portion of this amount pertaining to Canadian bank‑sponsored
securitization trusts of $45 million is subordinated to the interests of the
trust and represents the maximum exposure to credit risk for any failure
N O T E 2 4 R I S K M A N A G E M E N T ( CO N T I N U E D )

P O W E R C O R P O R A T I O N O F C A N A D A 2 0 11 A N N U A L R E P O R T84 NOTES TO THE CONSOLIDATED FINANCIAL STATEMENTS
of the borrowers to pay when due. Credit risk on these mortgages is
mitigated by any insurance on these mortgages, as previously discussed,
and IGM’s credit risk on insured loans is to the insurer. At December 31, 2011,
86.5% of the $1.1 billion in outstanding mortgages securitized under these
programs were insured.
Rights to future net interest income under the NHA MBS and CMB
Programs totalled $56 million. Under the NHA MBS and CMB Programs,
IGM has an obligation to make timely payments to security holders
regardless of whether amounts are received from mortgagors. All
mortgages securitized under the NHA MBS and CMB Programs are insured
by CMHC or another approved insurer under the programs. Outstanding
mortgages securitized under these programs are $2.7 billion.
> Fair value of principal reinvestment account swaps — had a negative fair value
of $77 million at December 31, 2011 which is reflected on the balance sheet.
These swaps represent the component of a swap entered into under
the CMB Program whereby IGM pays coupons on Canada Mortgage
Bonds and receives investment returns on the reinvestment of repaid
mortgage principal. The notional amount of these swaps was $556 million
at December 31, 2011.
IGM’s exposure to credit risk related to cash and cash equivalents, fixed income
securities and mortgage and investment loan portfolios has been significantly
reduced since December 31, 2010 as a result of the sale of MRS. However, IGM’s
management of credit risk on its continuing operations has not changed
materially since December 31, 2010.
IGM utilizes derivatives to hedge interest rate risk and reinvestment risk
associated with its mortgage banking and securitization activities, as well as
market risk related to certain stock‑based compensation arrangements.
IGM participates in the CMB Program by entering into back‑to‑back swaps
whereby Canadian Schedule I chartered banks designated by IGM are
between IGM and the Canadian Housing Trust. IGM receives coupons on
NHA MBS and eligible principal reinvestments and pays coupons on the
Canada Mortgage Bonds. IGM also enters into interest rate swaps to hedge
interest rate and reinvestment risk associated with the CMB Program. The
negative fair value of these swaps totalled $26 million at December 31, 2011 and
the outstanding notional amount was $4.4 billion. Certain of these swaps
relate to securitized mortgages that have been recorded on IGM’s balance
sheet with an associated obligation. Accordingly, these swaps, with an
outstanding notional amount of $2.7 billion and having a negative fair value
of $33 million, are not reflected on the balance sheet. Principal reinvestment
account swaps and hedges of reinvestment and interest rate risk, with an
outstanding notional amount of $1.7 billion and having fair value of $7 million,
are reflected on the balance sheet. The exposure to credit risk, which is limited
to the fair value of swaps in a gain position, totalled $87 million at December 31,
2011, compared to $22 million at December 31, 2010.
IGM utilizes interest rate swaps to hedge interest rate risk associated with
mortgages securitized through Canadian bank‑sponsored ABCP programs.
The negative fair value of these interest rate swaps totalled $23 million
on an outstanding notional amount of $1.0 billion at December 31, 2011.
The exposure to credit risk, which is limited to the fair value of swaps in a
gain position, totalled $1 million at December 31, 2011, compared to $1 million
at December 31, 2010.
IGM also utilizes interest rate swaps to hedge interest rate risk associated
with its investments in Canada Mortgage Bonds. The negative fair value
of these interest rate swaps totalled $7 million on an outstanding notional
amount of $200 million at December 31, 2011. The exposure to credit risk,
which is limited to the fair value of the interest rate swaps which are in
a gain position, was nil at December 31, 2011, compared to $15 million at
December 31, 2010.
IGM enters into other derivative contracts which consist primarily of interest
rate swaps utilized to hedge interest rate risk related to mortgages held
pending sale, or committed to, by IGM as well as total return swaps and
forward agreements on IGM’s common shares utilized to hedge deferred
compensation arrangements. The fair value of interest rate swaps, total
return swaps and forward agreements was nil on an outstanding notional
amount of $76 million at December 31, 2011, compared to a fair value of
$1 million on an outstanding notional amount of $118 million at December 31,
2010. The exposure to credit risk, which is limited to the fair value of those
instruments which are in a gain position, was $1 million at December 31, 2011,
unchanged from December 31, 2010.
The aggregate credit risk exposure related to derivatives that are in a gain
position of $89 million does not give effect to any netting agreements or
collateral arrangements. The exposure to credit risk, considering netting
agreements and collateral arrangements, was $0.3 million at December 31,
2011. Counterparties are all Canadian Schedule I chartered banks and, as a
result, management of IGM has determined that IGM’s overall credit risk
related to derivatives was not significant at December 31, 2011. Management
of credit risk has not changed materially since December 31, 2010.
M A R K E T R I S K
Market risk is the risk that the fair value or future cash flows of a financial
instrument will fluctuate as a result of changes in market factors. Market
factors include three types of risks: currency risk, interest rate risk and equity
price risk.
Currency risk Currency risk relates to the Corporation, its subsidiaries
and its investments in associates operating in different currencies and
converting non‑Canadian earnings at different points in time at different
foreign exchange levels when adverse changes in foreign currency exchange
rates occur.
Power Corporation and Power Financial’s financial assets are essentially
cash and cash equivalents and fixed income securities and other investments
consisting of securities, investment funds and hedge funds. In managing their
own cash and cash equivalents, Power Corporation and Power Financial may
hold cash balances denominated in foreign currencies and thus be exposed to
fluctuations in exchange rates. In order to protect against such fluctuations,
Power Corporation and Power Financial may from time to time enter into
currency‑hedging transactions with highly rated financial institutions. As at
December 31, 2011, 83% of Power Corporation and Power Financial’s cash
and cash equivalents were denominated in Canadian dollars or in foreign
currencies with currency hedges in place.
Most of Power Corporation’s other investments are classified as available
for sale, therefore unrealized gains and losses on these investments are
recorded in other comprehensive income until realized. As at December 31,
2011, the impact of a 5% decrease in foreign exchange rates would have been
a $64 million unrealized loss recorded in other comprehensive income.
For Lifeco, if the assets backing insurance and investment contract liabilities
are not matched by currency, changes in foreign exchange rates can expose
Lifeco to the risk of foreign exchange losses not offset by liability decreases.
Lifeco has net investments in foreign operations. In addition, Lifeco’s debt
obligations are mainly denominated in Canadian dollars. In accordance with
IFRS, foreign currency translation gains and losses from net investments
in foreign operations, net of related hedging activities and tax effects, are
recorded in accumulated other comprehensive income. Strengthening or
N O T E 2 4 R I S K M A N A G E M E N T ( CO N T I N U E D )

P O W E R C O R P O R A T I O N O F C A N A D A 2 0 11 A N N U A L R E P O R T 85
weakening of the Canadian dollar spot rate compared to the U.S. dollar,
British pound and euro spot rates impacts Lifeco’s total share capital and
surplus. Correspondingly, Lifeco’s book value per share and capital ratios
monitored by rating agencies are also impacted. The following policies and
procedures are in place to mitigate Lifeco’s exposure to currency risk:
> Lifeco uses financial measures such as constant currency calculations to
monitor the effect of currency translation fluctuations.
> Investments are normally made in the same currency as the liabilities
supported by those investments. Segmented investment guidelines include
maximum tolerances for unhedged currency mismatch exposures.
> Foreign currency assets acquired to back liabilities are normally converted
back to the currency of the liability using foreign exchange contracts.
> A 10% weakening of the Canadian dollar against foreign currencies would
be expected to increase non‑participating insurance and investment
contract liabilities and their supporting assets by approximately the
same amount, resulting in an immaterial change to net earnings. A 10%
strengthening of the Canadian dollar against foreign currencies would
be expected to decrease non‑participating insurance and investment
contract liabilities and their supporting assets by approximately the same
amount, resulting in an immaterial change in net earnings.
IGM’s financial instruments are generally denominated in Canadian dollars,
and do not have significant exposure to changes in foreign exchange rates.
Interest rate risk Interest rate risk is the risk that the fair value of future
cash flows of a financial instrument will fluctuate because of changes in the
market interest rates.
Power Corporation and Power Financial’s financial instruments are essentially
cash and cash equivalents, fixed income securities, other investments and
long‑term debt that do not have significant exposure to interest rate risk.
For Lifeco, the following policies and procedures are in place to mitigate
exposure to interest rate risk:
> Lifeco utilizes a formal process for managing the matching of assets and
liabilities. This involves grouping general fund assets and liabilities into
segments. Assets in each segment are managed in relation to the liabilities
in the segment.
> Interest rate risk is managed by investing in assets that are suitable for
the products sold.
> Where these products have benefit or expense payments that are
dependent on inflation (inflation‑indexed annuities, pensions and disability
claims), Lifeco generally invests in real return instruments to hedge its real
dollar liability cash flows. Some protection against changes in the inflation
index is achieved as any related change in the fair value of the assets will be
largely offset by a similar change in the fair value of the liabilities.
> For products with fixed and highly predictable benefit payments,
investments are made in fixed income assets or real estate whose cash
flows closely match the liability product cash flows. Where assets are
not available to match certain cash flows, such as long‑tail cash flows,
a portion of these are invested in equities and the rest are duration
matched. Hedging instruments are employed where necessary when there
is a lack of suitable permanent investments to minimize loss exposure
to interest rate changes. To the extent these cash flows are matched,
protection against interest rate change is achieved and any change in the
fair value of the assets will be offset by a similar change in the fair value
of the liabilities.
> For products with less predictable timing of benefit payments, investments
are made in fixed income assets with cash flows of a shorter duration than
the anticipated timing of benefit payments or equities, as described below.
> The risks associated with the mismatch in portfolio duration and cash flow,
asset prepayment exposure and the pace of asset acquisition are quantified
and reviewed regularly.
Projected cash flows from the current assets and liabilities are used in
the Canadian Asset Liability Method to determine insurance contract
liabilities. Valuation assumptions have been made regarding rates of returns
on supporting assets, fixed income, equity and inflation. The valuation
assumptions use best estimates of future reinvestment rates and inflation
assumptions with an assumed correlation together with margins for adverse
deviation set in accordance with professional standards. These margins
are necessary to provide for possibilities of misestimation and/or future
deterioration in the best estimate assumptions and provide reasonable
assurance that insurance contract liabilities cover a range of possible
outcomes. Margins are reviewed periodically for continued appropriateness.
Projected cash flows from fixed income assets used in actuarial calculations
are reduced to provide for potential asset default losses. The net effective yield
rate reduction averaged 0.19% (0.21% in 2010). The calculation for future credit
losses on assets is based on the credit quality of the underlying asset portfolio.
Testing under several interest rate scenarios (including increasing and
decreasing rates) is done to assess reinvestment risk.
One way of measuring the interest rate risk associated with this assumption
is to determine the effect on the insurance and investment contract liabilities
impacting the shareholder earnings of Lifeco of a 1% immediate parallel shift
in the yield curve. These interest rate changes will impact the projected
cash flows.
> The effect of an immediate 1% parallel increase in the yield curve would
be to decrease these insurance and investment contract liabilities by
approximately $180 million, causing an increase in net earnings of Lifeco
of approximately $123 million (Power Corporation’s share — $57 million).
> The effect of an immediate 1% parallel decrease in the yield curve would
be to increase these insurance and investment contract liabilities by
approximately $731 million, causing a decrease in net earnings of Lifeco
of approximately $511 million (Power Corporation’s share — $238 million).
In addition to the above, if this change in the yield curve persisted for an
extended period the range of the tested scenarios might change. The effect
of an immediate 1% parallel decrease or increase in the yield curve persisting
for a year would have immaterial additional effects on the reported insurance
and investment contract liabilities.
IGM is exposed to interest rate risk on its loan portfolio, fixed income
securities, Canada Mortgage Bonds and on certain of the derivative financial
instruments used in IGM’s mortgage banking and intermediary operations.
The objective of IGM’s asset and liability management is to control interest
rate risk related to its intermediary operations by actively managing its
interest rate exposure. As at December 31, 2011, the total gap between deposit
assets and liabilities was within IGM’s trust subsidiaries’ stated guidelines.
IGM utilizes interest rate swaps with Canadian Schedule I chartered bank
counterparties in order to reduce the impact of fluctuating interest rates on
its mortgage banking operations, as follows:
> IGM has funded f ixed rate mor tgages with ABCP as par t of the
securitization transactions with bank‑sponsored securitization trusts.
IGM enters into interest rate swaps with Canadian Schedule I chartered
banks to hedge the risk that ABCP rates rise. However, IGM remains
exposed to the basis risk that ABCP rates are greater than the bankers’
acceptance rates that it receives on its hedges.
N O T E 2 4 R I S K M A N A G E M E N T ( CO N T I N U E D )

P O W E R C O R P O R A T I O N O F C A N A D A 2 0 11 A N N U A L R E P O R T86 NOTES TO THE CONSOLIDATED FINANCIAL STATEMENTS
> IGM has in certain instances funded floating rate mortgages with fixed rate
Canada Mortgage Bonds as part of the securitization transactions under
the CMB Program. IGM enters into interest rate swaps with Canadian
Schedule I chartered banks to hedge the risk that the interest rates earned
on floating rate mortgages declines. As previously discussed, as part of the
CMB Program, IGM also is entitled to investment returns on reinvestment
of principal repayments of securitized mortgages and is obligated to pay
Canada Mortgage Bond coupons that are generally fixed rate. IGM hedges
the risk that reinvestment returns decline by entering into interest rate
swaps with Canadian Schedule I chartered bank counterparties.
> IGM is exposed to the impact that changes in interest rates may have
on the value of its investments in Canada Mortgage Bonds. IGM enters
into interest rate swaps with Canadian Schedule I chartered bank
counterparties to hedge interest rate risk on these bonds.
> IGM is also exposed to the impact that changes in interest rates may have
on the value of mortgages held, or committed to, by IGM. IGM may enter
into interest rate swaps to hedge this risk.
As at December 31, 2011, the impact to annual net earnings of IGM of a
100‑basis‑point change in interest rates would have been approximately
$4 million (Power Corporation’s share — $2 million). IGM’s exposure to
and management of interest rate risk has not changed materially since
December 31, 2010.
Equity price risk Equity price risk is the uncertainty associated with the
valuation of assets arising from changes in equity markets. To mitigate
equity price risk, the Corporation and its subsidiaries have investment policy
guidelines in place that provide for prudent investment in equity markets
within clearly defined limits.
Power Corporation and Power Financial’s financial instruments are essentially
cash and cash equivalents, fixed income securities, other investments and
long‑term debt. Power Corporation’s other investments are classified as
available for sale, therefore unrealized gains and losses on these investments
are recorded in other comprehensive income until realized. Other investments
are reviewed periodically to determine whether there is objective evidence
of an impairment in value.
During the year, the Corporation recorded impairment charges amounting
to $91 million ($162 million in 2010). As at December 31, 2011, the impact of a
5% decrease in the value of other investments would have been a $76 million
unrealized loss recorded in other comprehensive income.
For Lifeco, the risks associated with segregated fund guarantees have been
mitigated through a hedging program for lifetime Guaranteed Minimum
Withdrawal Benefit guarantees (GMWB) using equity futures, currency
forwards, and interest rate derivatives. For policies with segregated fund
guarantees, Lifeco generally determines insurance contract liabilities at a
conditional tail expectation of 75 (CTE75) level.
Some insurance and investment contract liabilities are supported by
investment properties, common stocks and private equities, for example,
segregated fund products and products with long‑tail cash flows. Generally
these liabilities will fluctuate in line with equity market values. There
will be additional impacts on these liabilities as equity market values
fluctuate. A 10% increase in equity markets would be expected to additionally
decrease non‑participating insurance and investment contract liabilities
by approximately $27 million, causing an increase in net earnings of Lifeco
of approximately $21 million (Power Corporation’s share — $10 million).
A 10% decrease in equity markets would be expected to additionally increase
non‑par ticipating insurance and investment contract liabilities by
approximately $77 million, causing a decrease in net earnings of Lifeco of
approximately $57 million (Power Corporation’s share — $26 million).
The best estimate return assumptions for equities are primarily based
on long‑term historical averages. Changes in the current market could
result in changes to these assumptions and will impact both asset and
liability cash flows. A 1% increase in the best estimate assumption would
be expected to decrease non‑participating insurance contract liabilities by
approximately $389 million, causing an increase in net earnings of Lifeco of
approximately $292 million (Power Corporation’s share — $136 million). A 1%
decrease in the best estimate assumption would be expected to increase
non‑participating insurance contract liabilities by approximately $424 million,
causing a decrease in net earnings of Lifeco of approximately $316 million
(Power Corporation’s share — $147 million).
IGM is exposed to equity price risk on its proprietary investment funds which
are classified as available‑for‑sale securities. Unrealized gains and losses on
these securities are recorded in other comprehensive income until they are
realized or until management of IGM determines there is objective evidence
of impairment in value, at which time they are recorded in the statements
of earnings.
IGM sponsors a number of deferred compensation arrangements where
payments to participants are linked to the performance of the common
shares of IGM Financial Inc. IGM hedges this risk through the use of forward
agreements and total return swaps.
Caution related to risk sensitivities In this document the Corporation
and its subsidiaries have provided estimates of sensitivities and risk exposure
measures for certain risks. These include the sensitivity due to specific
changes in interest rate levels projected and market prices as at the valuation
date. Actual results can differ significantly from these estimates for a variety
of reasons, including:
> assessment of the circumstances that led to the scenario may lead
to changes in (re)investment approaches and interest rate scenarios
considered;
> changes in actuarial, investment return and future investment activity
assumptions;
> actual experience differing from the assumptions;
> changes in business mix, effective tax rates and other market factors;
> interactions among these factors and assumptions when more than one
changes; and
> the general limitations of internal models.
For these reasons, the sensitivities should only be viewed as directional
estimates of the underlying sensitivities for the respective factors based on
the assumptions outlined below. Given the nature of these calculations, the
Corporation cannot provide assurance that the actual impact on net earnings
attributed to shareholders will be as indicated.
N O T E 2 4 R I S K M A N A G E M E N T ( CO N T I N U E D )
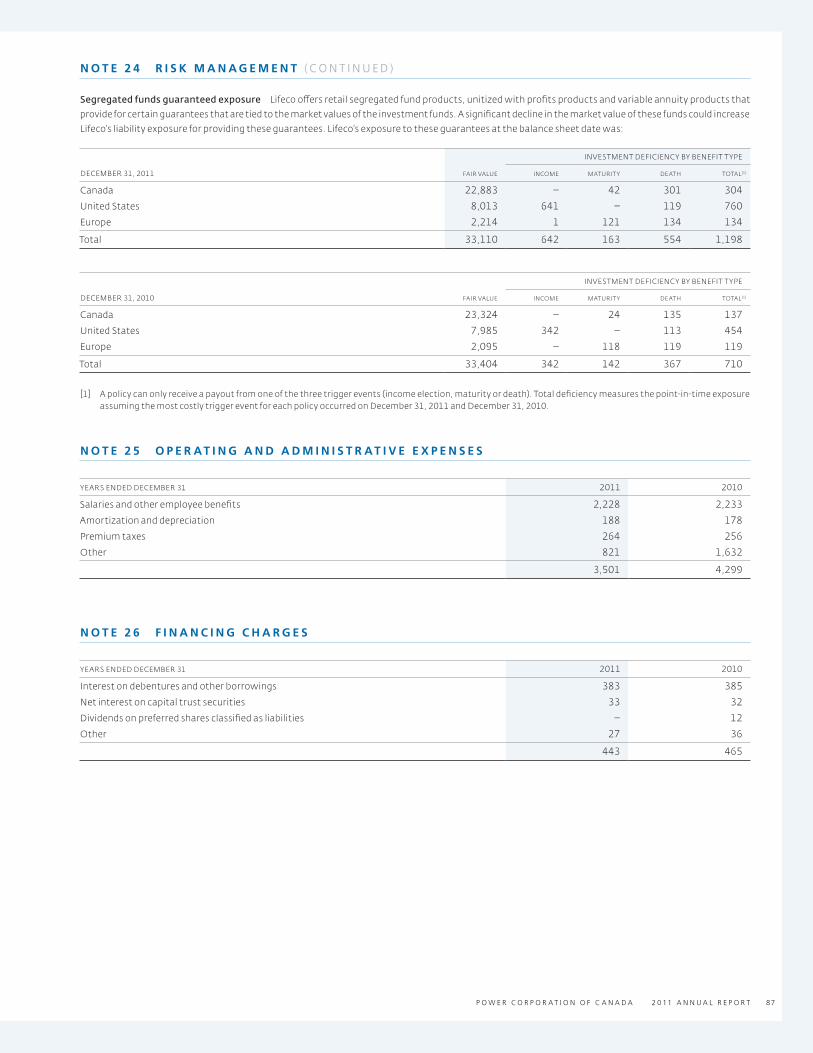
P O W E R C O R P O R A T I O N O F C A N A D A 2 0 11 A N N U A L R E P O R T 87
Segregated funds guaranteed exposure Lifeco offers retail segregated fund products, unitized with profits products and variable annuity products that
provide for certain guarantees that are tied to the market values of the investment funds. A significant decline in the market value of these funds could increase
Lifeco’s liability exposure for providing these guarantees. Lifeco’s exposure to these guarantees at the balance sheet date was:
INVESTMENT DEFICIENCY BY BENEFIT T YPE
DECEMBER 31, 2011 FAIR VALUE INCOME MATURIT Y DEATH TOTAL [1]
Canada 22,883 – 42 301 304
United States 8,013 641 – 119 760
Europe 2,214 1 121 134 134
Total 33,110 642 163 554 1,198
INVESTMENT DEFICIENCY BY BENEFIT T YPE
DECEMBER 31, 2010 FAIR VALUE INCOME MATURIT Y DEATH TOTAL [1]
Canada 23,324 – 24 135 137
United States 7,985 342 – 113 454
Europe 2,095 – 118 119 119
Total 33,404 342 142 367 710
[1] A policy can only receive a payout from one of the three trigger events (income election, maturity or death). Total deficiency measures the point‑in‑time exposure assuming the most costly trigger event for each policy occurred on December 31, 2011 and December 31, 2010.
N O T E 2 5 O P E R AT I N G A N D A D M I N I S T R AT I V E E X P E N S E S
YEARS ENDED DECEMBER 31 2011 2010
Salaries and other employee benefits 2,228 2,233
Amortization and depreciation 188 178
Premium taxes 264 256
Other 821 1,632
3,501 4,299
N O T E 2 6 F I N A N C I N G C H A R G E S
YEARS ENDED DECEMBER 31 2011 2010
Interest on debentures and other borrowings 383 385
Net interest on capital trust securities 33 32
Dividends on preferred shares classified as liabilities – 12
Other 27 36
443 465
N O T E 2 4 R I S K M A N A G E M E N T ( CO N T I N U E D )

P O W E R C O R P O R A T I O N O F C A N A D A 2 0 11 A N N U A L R E P O R T88 NOTES TO THE CONSOLIDATED FINANCIAL STATEMENTS
N O T E 2 7 P E N S I O N P L A N S A N D O T H E R P O S T - E M P L O Y M E N T B E N E F I T S
The Corporation and its subsidiaries maintain funded defined benefit pension
plans for certain employees and advisors as well as unfunded supplementary
employee retirement plans (SERP) for eligible employees. The Corporation’s
subsidiaries also maintain defined contribution pension plans for certain
employees and advisors. The Corporation and its subsidiaries provide post‑
employment health, dental and life insurance benefits to eligible retirees
and advisors.
Subsidiaries of Lifeco have declared partial windups in respect of certain
defined pension plans, the impact of which has not been reflected in the
pension plan accounts.
P L A N A S S E T S , B E N E F I T O B L I G A T I O N S A N D F U N D E D S T A T U S
2011 2010
PENSION PL ANS
OTHER POST‑EMPLOYMENT
BENEFITSPENSION
PL ANS
OTHER POST‑EMPLOYMENT
BENEFITS
CHANGE IN FAIR VALUE OF PLAN ASSETS
Fair value of plan assets, beginning of year 3,982 – 3,758 –
Expected return on plan assets 251 – 236 –
Employee contributions 25 – 25 –
Employer contributions 143 21 111 21
Actuarial gain (losses) (186) – 110 –
Benefits paid (237) (21) (207) (21)
Settlement – – (2) –
Foreign exchange and other 14 – (49) –
Fair value of plan assets, end of year 3,992 – 3,982 –
CHANGE IN DEFINED BENEFIT OBLIGATIONS
Defined benefit obligation, beginning of year 4,335 491 3,828 427
Employer current service cost 88 4 69 4
Employee contributions 25 – 25 –
Interest on defined obligations 235 27 231 26
Actuarial (gains) losses 238 1 428 54
Benefits paid (237) (21) (207) (21)
Past service cost 7 – 28 2
Settlement – – (2) –
Foreign exchange and other 22 – (65) (1)
Defined benefit obligation, end of year 4,713 502 4,335 491
FUNDED STATUS
Fund surplus (deficit) (721) (502) (353) (491)
Unamortized past service costs 6 (33) 3 (41)
Unamortized net actuarial losses (credits) 723 53 298 54
Unrecognized amount due to limit on asset (71) – (63) –
Accrued benefit asset (liability) (63) (482) (115) (478)
The aggregate accrued benefit obligations of plan assets are as follows:
YEARS ENDED DECEMBER 31 2011 2010
Wholly or partly funded plans 4,266 3,927
Wholly unfunded plans 447 408
The Corporation and its subsidiaries expect to contribute $169 million to their funded and unfunded defined benefit pension and other post‑employment
benefit plans in 2012.
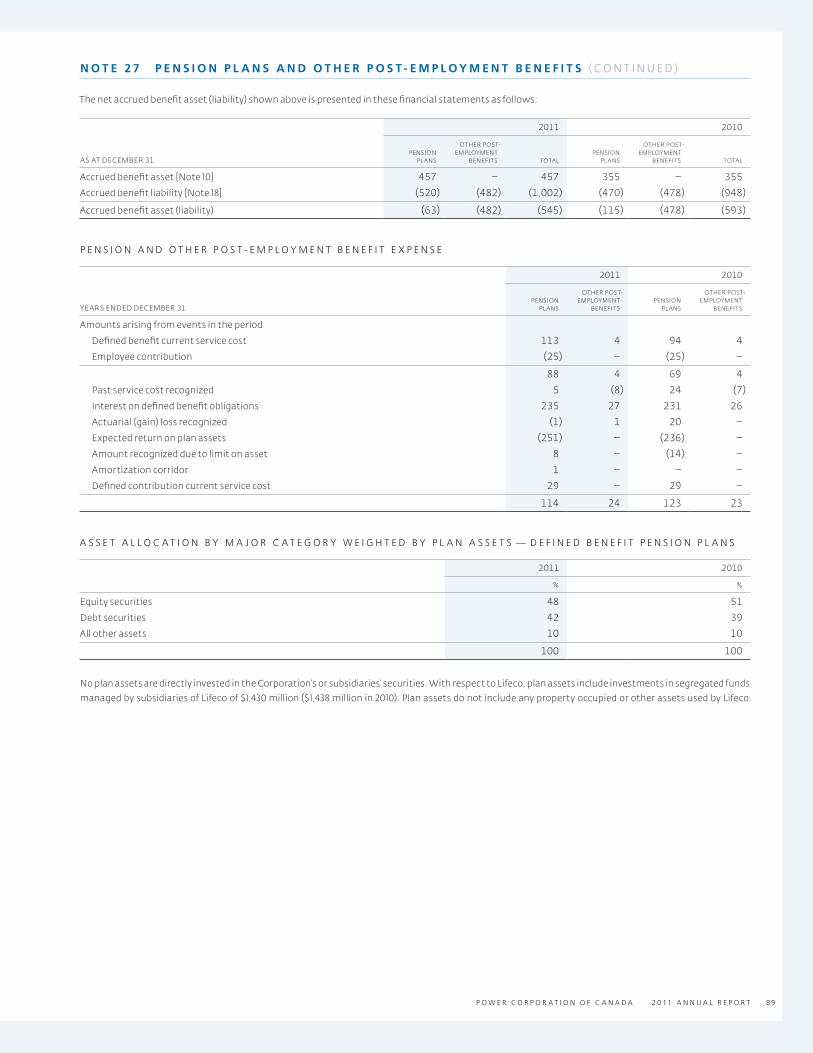
P O W E R C O R P O R A T I O N O F C A N A D A 2 0 11 A N N U A L R E P O R T 89
The net accrued benefit asset (liability) shown above is presented in these financial statements as follows:
2011 2010
AS AT DECEMBER 31PENSION
PL ANS
OTHER POST‑EMPLOYMENT
BENEFITS TOTALPENSION
PL ANS
OTHER POST‑EMPLOYMENT
BENEFITS TOTAL
Accrued benefit asset [Note 10] 457 – 457 355 – 355
Accrued benefit liability [Note 18] (520) (482) (1,002) (470) (478) (948)
Accrued benefit asset (liability) (63) (482) (545) (115) (478) (593)
P E N S I O N A N D O T H E R P O S T - E M P L O Y M E N T B E N E F I T E X P E N S E
2011 2010
YEARS ENDED DECEMBER 31PENSION
PL ANS
OTHER POST‑EMPLOYMENT
BENEFITSPENSION
PL ANS
OTHER POST‑EMPLOYMENT
BENEFITS
Amounts arising from events in the period
Defined benefit current service cost 113 4 94 4
Employee contribution (25) – (25) –
88 4 69 4
Past service cost recognized 5 (8) 24 (7)
Interest on defined benefit obligations 235 27 231 26
Actuarial (gain) loss recognized (1) 1 20 –
Expected return on plan assets (251) – (236) –
Amount recognized due to limit on asset 8 – (14) –
Amortization corridor 1 – – –
Defined contribution current service cost 29 – 29 –
114 24 123 23
A S S E T A L L O C A T I O N B Y M A J O R C A T E G O R Y W E I G H T E D B Y P L A N A S S E T S — D E F I N E D B E N E F I T P E N S I O N P L A N S
2011 2010
% %
Equity securities 48 51
Debt securities 42 39
All other assets 10 10
100 100
No plan assets are directly invested in the Corporation’s or subsidiaries’ securities. With respect to Lifeco, plan assets include investments in segregated funds
managed by subsidiaries of Lifeco of $1,430 million ($1,438 million in 2010). Plan assets do not include any property occupied or other assets used by Lifeco.
N O T E 2 7 P E N S I O N P L A N S A N D O T H E R P O S T - E M P L O Y M E N T B E N E F I T S ( CO N T I N U E D )

P O W E R C O R P O R A T I O N O F C A N A D A 2 0 11 A N N U A L R E P O R T90 NOTES TO THE CONSOLIDATED FINANCIAL STATEMENTS
S I G N I F I C A N T A S S U M P T I O N S
DEFINED BENEFIT PENSION PL ANS
OTHER POST‑EMPLOYMENT BENEFITS
% 2011 2010 2011 2010
WEIGHTED AVERAGE ASSUMPTIONS USED TO DETERMINE BENEFIT COST
Discount rate 5.5 6.2 5.5 6.3
Expected long‑term rate of return on plan assets 6.2 6.3 – –
Rate of compensation increase 3.7 3.7 – –
WEIGHTED AVERAGE ASSUMPTIONS USED TO DETERMINE ACCRUED BENEFIT OBLIGATION
Discount rate 5.1 5.5 5.1 5.5
Rate of compensation increase 3.6 3.5 – –
WEIGHTED AVERAGE HEALTHCARE TREND RATES
Initial healthcare trend rate 6.8 7.0
Ultimate healthcare trend rate 4.5 4.3
Year ultimate trend rate is reached 2024 2024
The overall expected rate of return on plan assets for the year is determined
based on long‑term market expectations prevailing at the beginning of the
year for each asset class, weighted by portfolio allocation, less an allowance
in respect to all expenses expected to be charged to the fund. Anticipated
future long‑term performance of individual asset categories is considered,
reflecting management’s best estimates of expected future inflation and
expected real yields on fixed income securities and equities. Since the prior
year‑end there have been no changes in the method used to determine the
overall expected rate of return. In 2011, the actual return on plan assets was
$65 million ($347 million in 2010).
The period of time over which benefits are assumed to be paid is based
on best estimates of future mortality including allowances for mortality
improvements. Mortality assumptions are significant in measuring
the defined benefit obligation for defined benefit plans. The mortality
assumptions applied by the Corporation and its subsidiaries take into
consideration average life expectancy, including allowances for future
mortality improvement as appropriate, and reflect variations in such factors
as age, gender and geographic location. The assumptions also take into
consideration an estimation of future improvements in longevity. This
estimate is subject to considerable uncertainty and judgment is required in
establishing this assumption.
The mortality tables are reviewed at least annually, and assumptions are
in accordance with accepted actuarial practice in Canada. Emerging plan
experience is reviewed and considered in establishing the best estimate for
future mortality.
I M P A C T O F C H A N G E S T O A S S U M E D H E A L T H C A R E R A T E S — O T H E R P O S T - E M P L O Y M E N T B E N E F I T S
IMPAC T ON END‑OF‑YEAR ACCRUED POST‑EMPLOYMENT BENEFIT
OBLIGATION
IMPAC T ON POST‑EMPLOYMENT BENEFIT SERVICE AND
INTEREST COST
2011 2010 2011 2010
1% increase in assumed healthcare cost trend rate 54 52 3 3
1% decrease in assumed healthcare cost trend rate (46) (44) (3) (3)
S U M M A R I Z E D P L A N I N F O R M A T I O N
DEFINED BENEFIT PENSION PL ANS
OTHER POST‑EMPLOYMENT BENEFITS
2011 2010 2011 2010
Defined benefit obligation (4,713) (4,335) (502) (491)
Fair value of plan assets 3,992 3,982 – –
Funded status of plan (721) (353) (502) (491)
Experience adjustment on plan liabilities (238) (428) (1) (54)
Experience adjustment on plan assets (186) 110 – –
N O T E 2 7 P E N S I O N P L A N S A N D O T H E R P O S T - E M P L O Y M E N T B E N E F I T S ( CO N T I N U E D )
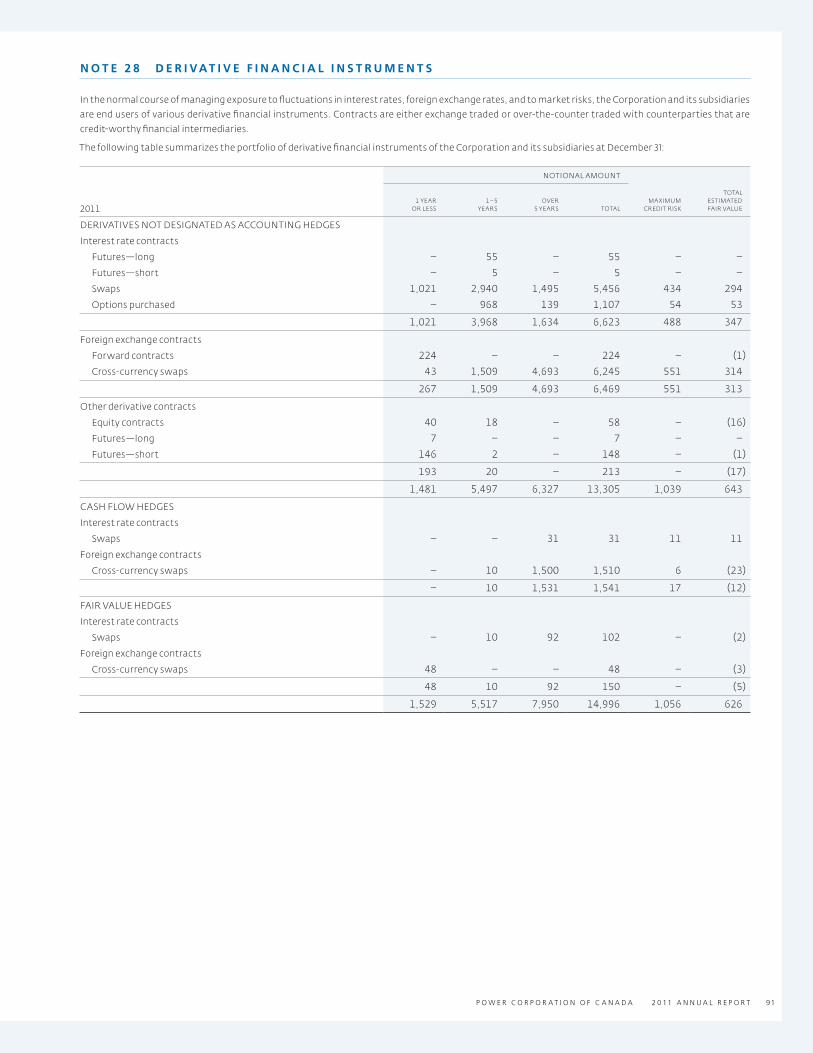
P O W E R C O R P O R A T I O N O F C A N A D A 2 0 11 A N N U A L R E P O R T 91
N O T E 2 8 D E R I VAT I V E F I N A N C I A L I N S T R U M E N T S
In the normal course of managing exposure to fluctuations in interest rates, foreign exchange rates, and to market risks, the Corporation and its subsidiaries
are end users of various derivative financial instruments. Contracts are either exchange traded or over‑the‑counter traded with counterparties that are
credit‑worthy financial intermediaries.
The following table summarizes the portfolio of derivative financial instruments of the Corporation and its subsidiaries at December 31:
NOTIONAL AMOUNT
20111 YEAR
OR LESS1 – 5
YEARSOVER
5 YEARS TOTALMA XIMUM
CREDIT RISK
TOTAL ESTIMATEDFAIR VALUE
DERIVATIVES NOT DESIGNATED AS ACCOUNTING HEDGES
Interest rate contracts
Futures — long – 55 – 55 – –
Futures — short – 5 – 5 – –
Swaps 1,021 2,940 1,495 5,456 434 294
Options purchased – 968 139 1,107 54 53
1,021 3,968 1,634 6,623 488 347
Foreign exchange contracts
Forward contracts 224 – – 224 – (1)
Cross‑currency swaps 43 1,509 4,693 6,245 551 314
267 1,509 4,693 6,469 551 313
Other derivative contracts
Equity contracts 40 18 – 58 – (16)
Futures — long 7 – – 7 – –
Futures — short 146 2 – 148 – (1)
193 20 – 213 – (17)
1,481 5,497 6,327 13,305 1,039 643
CASH FLOW HEDGES
Interest rate contracts
Swaps – – 31 31 11 11
Foreign exchange contracts
Cross‑currency swaps – 10 1,500 1,510 6 (23)
– 10 1,531 1,541 17 (12)
FAIR VALUE HEDGES
Interest rate contracts
Swaps – 10 92 102 – (2)
Foreign exchange contracts
Cross‑currency swaps 48 – – 48 – (3)
48 10 92 150 – (5)
1,529 5,517 7,950 14,996 1,056 626

P O W E R C O R P O R A T I O N O F C A N A D A 2 0 11 A N N U A L R E P O R T92 NOTES TO THE CONSOLIDATED FINANCIAL STATEMENTS
NOTIONAL AMOUNT
20101 YEAR
OR LESS1 – 5
YEARSOVER
5 YEARS TOTALMA XIMUM
CREDIT RISK
TOTAL ESTIMATEDFAIR VALUE
DERIVATIVES NOT DESIGNATED AS ACCOUNTING HEDGES
Interest rate contracts
Futures — long 57 1 – 58 – –
Futures — short 165 – – 165 – –
Swaps 1,199 3,135 1,321 5,655 250 153
Options purchased 226 846 221 1,293 31 31
1,647 3,982 1,542 7,171 281 184
Foreign exchange contracts
Forward contracts 267 – – 267 6 6
Cross‑currency swaps 70 1,284 4,454 5,808 704 589
337 1,284 4,454 6,075 710 595
Other derivative contracts
Equity contracts 43 21 – 64 – (20)
Futures — long 8 – – 8 – –
Futures — short 38 – – 38 – –
89 21 – 110 – (20)
2,073 5,287 5,996 13,356 991 759
CASH FLOW HEDGES
Interest rate contracts
Swaps – – 58 58 12 12
Foreign exchange contracts
Cross‑currency swaps – – 1,500 1,500 27 15
– – 1,558 1,558 39 27
FAIR VALUE HEDGES
Interest rate contracts
Swaps 55 – – 55 – –
Foreign exchange contracts
Cross‑currency swaps 50 – – 50 – –
105 – – 105 – –
2,178 5,287 7,554 15,019 1,030 786
The amount subject to credit risk is limited to the current fair value of the
instruments which are in a gain position. The credit risk is presented without
giving effect to any netting agreements or collateral arrangements and does not
reflect actual or expected losses. The total estimated fair value represents the
total amount that the Corporation and its subsidiaries would receive (or pay) to
terminate all agreements at year‑end. However, this would not result in a gain
or loss to the Corporation and its subsidiaries as the derivative instruments
which correlate to certain assets and liabilities provide offsetting gains or losses.
Swaps Interest rate swaps, futures and options are used as part of a
portfolio of assets to manage interest rate risk associated with investment
activities and insurance and investment contract liabilities and to reduce the
impact of fluctuating interest rates on the mortgage banking operations and
intermediary operations. Interest rate swap agreements require the periodic
exchange of payments without the exchange of the notional principal amount
on which payments are based. Changes in fair value are recorded in net
investment income in the statements of earnings.
Call options grant the Corporation and its subsidiaries the right to enter into
a swap with predetermined fixed‑rate payments over a predetermined time
period on the exercise date. Call options are used to manage the variability
in future interest payments due to a change in credited interest rates and the
related potential change in cash flows due to surrenders. Call options are also
used to hedge minimum rate guarantees.
Foreign exchange contracts Cross‑currency swaps are used in combination
with other investments to manage foreign currency risk associated with
investment activities and insurance and investment contract liabilities. Under
these swaps, principal amounts and fixed and floating interest payments may
be exchanged in different currencies. The Corporation and its subsidiaries
also enter into certain foreign exchange forward contracts to hedge certain
product liabilities.
Other derivative contracts Equity index swaps, futures and options are
used to hedge certain product liabilities. Equity index swaps are also used
as substitutes for cash instruments and are used to periodically hedge the
market risk associated with certain fee income.
Lifeco may use credit derivatives to manage its credit exposure and for risk
diversification in its investment portfolio.
N O T E 2 8 D E R I VAT I V E F I N A N C I A L I N S T R U M E N T S ( CO N T I N U E D )

P O W E R C O R P O R A T I O N O F C A N A D A 2 0 11 A N N U A L R E P O R T 93
IGM also enters into total return swaps and forward agreements to manage
its exposure to fluctuations in the total return of its common shares related
to deferred compensation arrangements. Total return swap and forward
agreements require the exchange of net contractual payments periodically or
at maturity without the exchange of the notional principal amounts on which
the payments are based. Certain of these instruments are not designated
as hedges. Changes in fair value are recorded in operating expenses in the
statements of earnings for those instruments not designated as hedges.
N O T E 2 9 F A I R VA L U E O F F I N A N C I A L I N S T R U M E N T S
The following table presents the fair value of the Corporation’s financial instruments using the valuation methods and assumptions described below. Fair
values are management’s estimates and are generally calculated using market conditions at a specific point in time and may not reflect future fair values. The
calculations are subjective in nature, involve uncertainties and matters of significant judgment.
DECEMBER 31, 2011
DECEMBER 31, 2010
JANUARY 1, 2010
CARRYINGVALUE
FAIR VALUE
CARRYINGVALUE
FAIR VALUE
CARRYING VALUE
FAIR VALUE
ASSETS
Cash and cash equivalents 3,741 3,741 4,016 4,016 5,383 5,383
Investments (excluding investment properties) 115,765 118,094 109,023 110,523 103,096 103,662
Funds held by ceding insurers 9,923 9,923 9,856 9,856 10,984 10,984
Derivative financial instruments 1,056 1,056 1,030 1,030 782 782
Other financial assets 3,638 3,638 3,755 3,755 3,960 3,960
Total financial assets 134,123 136,452 127,680 129,180 124,205 124,771
LIABILITIES
Deposits and certificates 151 152 835 840 907 916
Funds held under reinsurance contracts 169 169 149 149 331 331
Obligation to securitization entities 3,827 3,930 3,505 3,564 3,310 3,349
Debentures and other borrowings 6,296 7,029 6,720 7,334 6,339 6,660
Capital trust securities 533 577 535 596 540 601
Preferred shares of subsidiaries – – – – 499 517
Derivative financial instruments 430 430 244 244 359 359
Other financial liabilities 4,199 4,199 6,146 6,146 5,498 5,498
Total financial liabilities 15,605 16,486 18,134 18,873 17,783 18,231
Fair value is determined using the following methods and assumptions:
> The fair value of short‑term financial instruments approximates carrying
value due to their short‑term maturities. These include cash and cash
equivalents, dividends, interest and other receivables, premiums in course
of collection, accounts payable, repurchase agreements, dividends and
interest payable, and income tax payable.
> Shares and bonds are valued at quoted market prices, when available.
When a quoted market price is not readily available, alternative valuation
methods may be used. For mortgage and other loans, bonds, loans and
other receivables, the fair value is determined by discounting the expected
future cash flows at market interest rates for loans with similar credit risks
and maturities (refer to Note 2).
> Deposits and certificates are valued by discounting the contractual cash
flows using market interest rates currently offered for deposits with similar
terms and credit risks.
> Obligations to securitization entities are valued by discounting the
expected future cash flows by prevailing market yields for securities issued
by these securitization entities having like maturities and characteristics.
> Debentures and other borrowings are determined by reference to current
market prices for debt with similar terms, risks and maturities.
> Preferred shares are valued using quoted prices from active markets.
> Derivative financial instruments fair values are based on quoted market
prices, where available, prevailing market rates for instruments with
similar characteristics and maturities, or discounted cash flow analysis.
In accordance with IFRS 7, Financial Instruments — Disclosures, the Corporation’s
assets and liabilities recorded at fair value have been categorized based upon
the following fair value hierarchy:
> Level 1 inputs utilize observable, quoted prices (unadjusted) in active
markets for identical assets or liabilities that the Corporation has the ability
to access. Financial assets and liabilities utilizing Level 1 inputs include
actively exchange‑traded equity securities and mutual and segregated
funds which have available prices in an active market with no redemption
restrictions. Level 1 assets also inclide liquid open‑end investment fund
units, and investments in Government of Canada Bonds and Canada
Mortgage Bonds in instances where there are quoted prices available
from active markets.
N O T E 2 8 D E R I VAT I V E F I N A N C I A L I N S T R U M E N T S ( CO N T I N U E D )
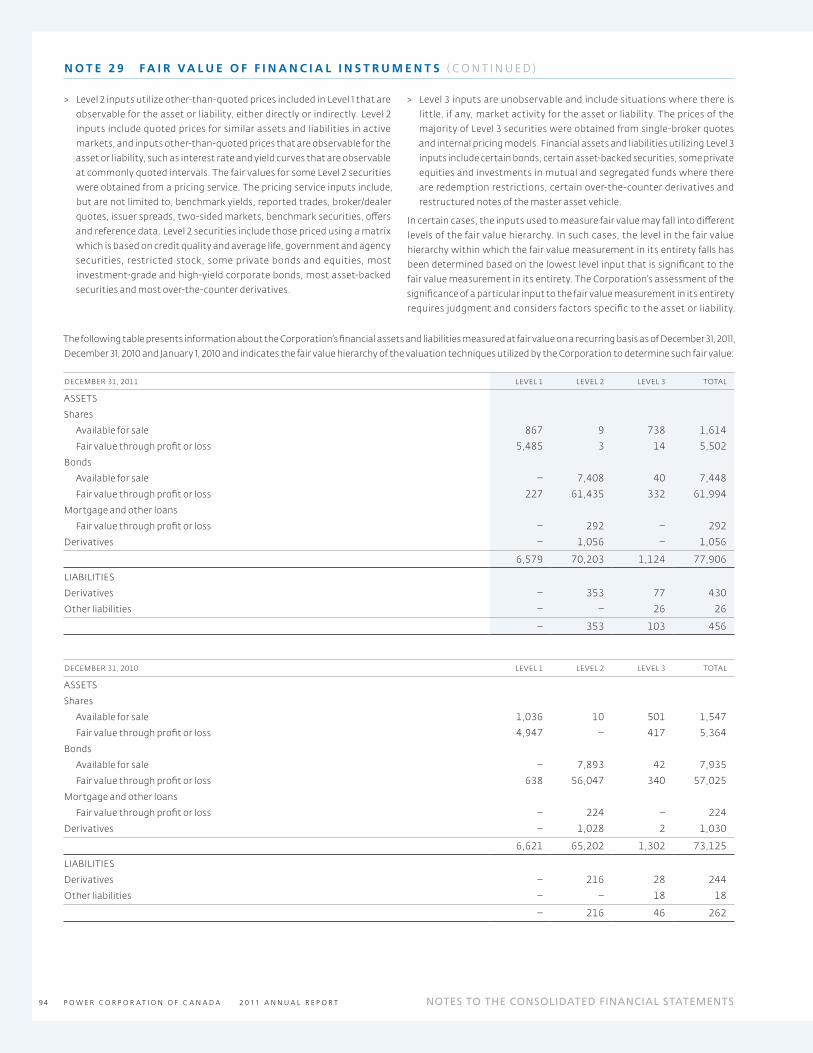
P O W E R C O R P O R A T I O N O F C A N A D A 2 0 11 A N N U A L R E P O R T94 NOTES TO THE CONSOLIDATED FINANCIAL STATEMENTS
> Level 2 inputs utilize other‑than‑quoted prices included in Level 1 that are
observable for the asset or liability, either directly or indirectly. Level 2
inputs include quoted prices for similar assets and liabilities in active
markets, and inputs other‑than‑quoted prices that are observable for the
asset or liability, such as interest rate and yield curves that are observable
at commonly quoted intervals. The fair values for some Level 2 securities
were obtained from a pricing service. The pricing service inputs include,
but are not limited to, benchmark yields, reported trades, broker/dealer
quotes, issuer spreads, two‑sided markets, benchmark securities, offers
and reference data. Level 2 securities include those priced using a matrix
which is based on credit quality and average life, government and agency
securities, restricted stock, some private bonds and equities, most
investment‑grade and high‑yield corporate bonds, most asset‑backed
securities and most over‑the‑counter derivatives.
> Level 3 inputs are unobservable and include situations where there is
little, if any, market activity for the asset or liability. The prices of the
majority of Level 3 securities were obtained from single‑broker quotes
and internal pricing models. Financial assets and liabilities utilizing Level 3
inputs include certain bonds, certain asset‑backed securities, some private
equities and investments in mutual and segregated funds where there
are redemption restrictions, certain over‑the‑counter derivatives and
restructured notes of the master asset vehicle.
In certain cases, the inputs used to measure fair value may fall into different
levels of the fair value hierarchy. In such cases, the level in the fair value
hierarchy within which the fair value measurement in its entirety falls has
been determined based on the lowest level input that is significant to the
fair value measurement in its entirety. The Corporation’s assessment of the
significance of a particular input to the fair value measurement in its entirety
requires judgment and considers factors specific to the asset or liability.
The following table presents information about the Corporation’s financial assets and liabilities measured at fair value on a recurring basis as of December 31, 2011,
December 31, 2010 and January 1, 2010 and indicates the fair value hierarchy of the valuation techniques utilized by the Corporation to determine such fair value:
DECEMBER 31, 2011 LEVEL 1 LEVEL 2 LEVEL 3 TOTAL
ASSETS
Shares
Available for sale 867 9 738 1,614
Fair value through profit or loss 5,485 3 14 5,502
Bonds
Available for sale – 7,408 40 7,448
Fair value through profit or loss 227 61,435 332 61,994
Mortgage and other loans
Fair value through profit or loss – 292 – 292
Derivatives – 1,056 – 1,056
6,579 70,203 1,124 77,906
LIABILITIES
Derivatives – 353 77 430
Other liabilities – – 26 26
– 353 103 456
DECEMBER 31, 2010 LEVEL 1 LEVEL 2 LEVEL 3 TOTAL
ASSETS
Shares
Available for sale 1,036 10 501 1,547
Fair value through profit or loss 4,947 – 417 5,364
Bonds
Available for sale – 7,893 42 7,935
Fair value through profit or loss 638 56,047 340 57,025
Mortgage and other loans
Fair value through profit or loss – 224 – 224
Derivatives – 1,028 2 1,030
6,621 65,202 1,302 73,125
LIABILITIES
Derivatives – 216 28 244
Other liabilities – – 18 18
– 216 46 262
N O T E 2 9 F A I R VA L U E O F F I N A N C I A L I N S T R U M E N T S ( CO N T I N U E D )

P O W E R C O R P O R A T I O N O F C A N A D A 2 0 11 A N N U A L R E P O R T 95
JANUARY 1, 2010 LEVEL 1 LEVEL 2 LEVEL 3 TOTAL
ASSETS
Shares
Available for sale 1,245 30 459 1,734
Fair value through profit or loss 4,783 – 145 4,928
Bonds
Available for sale – 5,195 67 5,262
Fair value through profit or loss 625 52,248 642 53,515
Mortgage and other loans
Fair value through profit or loss – 241 – 241
Derivatives – 752 30 782
Other assets 10 7 – 17
6,663 58,473 1,343 66,479
LIABILITIES
Derivatives – 353 6 359
Other liabilities – – 16 16
– 353 22 375
The following table presents additional information about assets and liabilities measured at fair value on a recurring basis for which the Corporation has
utilized Level 3 inputs to determine fair value for the years ended December 31, 2011 and 2010:
SHARES BONDS
DECEMBER 31, 2011AVAIL ABLE
FOR SALE
FAIR VALUE THROUGH
PROFIT OR LOSSAVAIL ABLE
FOR SALE
FAIR VALUE THROUGH
PROFIT OR LOSSDERIVATIVES,
NET
OTHERASSETS
(LIABILITIES) TOTAL
Balance, beginning of year 501 417 42 340 (26) (18) 1,256
Total gains (losses)
In net earnings 121 35 1 54 (62) (5) 144
In other comprehensive income (89) – 2 – – – (87)
Purchases 415 65 – – – (3) 477
Sales (210) (6) – (4) – – (220)
Settlements – – (5) (58) 11 – (52)
Transfers out of Level 3 – (497) – – – – (497)
Balance, end of year 738 14 40 332 (77) (26) 1,021
SHARES BONDS
DECEMBER 31, 2010AVAIL ABLE
FOR SALE
FAIR VALUE THROUGH
PROFIT OR LOSSAVAIL ABLE
FOR SALE
FAIR VALUE THROUGH
PROFIT OR LOSSDERIVATIVES,
NET
OTHERASSETS
(LIABILITIES) TOTAL
Balance, beginning of year 459 145 67 642 24 (16) 1,321
Total gains (losses)
In net earnings 7 16 (2) 16 (61) (1) (25)
In other comprehensive income 42 – 2 – – – 44
Purchases 67 288 – – 1 (6) 350
Sales (74) (30) – (76) – – (180)
Settlements – – (5) (95) 7 5 (88)
Transfers in to Level 3 – – – 5 – – 5
Transfers out of Level 3 – (2) (20) (152) 3 – (171)
Balance, end of year 501 417 42 340 (26) (18) 1,256
N O T E 2 9 F A I R VA L U E O F F I N A N C I A L I N S T R U M E N T S ( CO N T I N U E D )

P O W E R C O R P O R A T I O N O F C A N A D A 2 0 11 A N N U A L R E P O R T96 NOTES TO THE CONSOLIDATED FINANCIAL STATEMENTS
N O T E 3 0 E A R N I N G S P E R S H A R E
The following is a reconciliation of the numerators and the denominators used in the computations of earnings per share:
YEARS ENDED DECEMBER 31 2011 2010
Net earnings attributable to shareholders 1,116 768
Dividends on non‑participating shares (41) (41)
Net earnings attributable to participating shareholders 1,075 727
Dilutive effect of subsidiaries (8) (5)
Diluted net earnings attributable to participating shareholders 1,067 722
Weighted average number of participating shares outstanding (millions)
— Basic 459.8 457.9
Exercise of stock options 2.8 5.2
Shares assumed to be repurchased with proceeds from exercise of stock options (2.2) (3.8)
Weighted average number of participating shares outstanding (millions)
— Diluted 460.4 459.3
For 2011, 10,570,484 stock options (7,635,810 in 2010) have been excluded from the computation of diluted earnings per share as the exercise price was higher
than the market price.
YEARS ENDED DECEMBER 31 2011 2010
Basic earnings per participating share ($)
From continuing operations 2.29 1.59
From discontinued operations 0.05 –
2.34 1.59
Diluted earnings per participating share ($)
From continuing operations 2.27 1.57
From discontinued operations 0.05 –
2.32 1.57
N O T E 3 1 C O N T I N G E N T L I A B I L I T I E S
The Corporation and its subsidiaries are from time to time subject to legal
actions, including arbitrations and class actions, arising in the normal course
of business. It is inherently difficult to predict the outcome of any of these
proceedings with certainty, and it is possible that an adverse resolution
could have a material adverse effect on the consolidated financial position of
the Corporation. However, based on information presently known, it is not
expected that any of the existing legal actions, either individually or in the
aggregate, will have a material adverse effect on the consolidated financial
position of the Corporation.
A subsidiary of Lifeco has declared a partial windup in respect of an Ontario
defined benefit pension plan which will not likely be completed for some time.
The partial windup could involve the distribution of the amount of actuarial
surplus, if any, attributable to the wound‑up portion of the plan. In addition
to the regulatory proceedings involving this partial windup, a related class
action proceeding has been commenced in Ontario related to the partial
windup and three potential partial windups under the plan. The class action
also challenges the validity of charging expenses to the plan. The provisions
for certain Canadian retirement plans in the amounts of $97 million after tax
established by Lifeco’s subsidiaries in the third quarter of 2007 have been
reduced to $68 million. Actual results could differ from these estimates.
The Court of Appeal for Ontario released a decision on November 3, 2011 in
regard to the involvement of the participating accounts of Lifeco subsidiaries
London Life and Great‑West Life in the financing of the acquisition of London
Insurance Group Inc. in 1997 (the “Appeal Decision”).
The Appeal Decision made substantial adjustments to the original trial
judgement (the “Trial Decision”). The impact is expected to be favourable
to Lifeco’s overall financial position. Any monies to be returned to the
participating accounts will be dealt with in accordance with Lifeco’s
participating policyholder dividend policies in the ordinary course of business.
No awards are to be paid out to individual class members.
During the fourth quarter of 2011, in response to the Appeal Decision, Lifeco
re‑evaluated and reduced the litigation provision established in the third
quarter of 2010, which positively impacted common shareholder net earnings
of Lifeco by $223 million after tax (Power Corporation’s share — $104 million).
Regardless of the ultimate outcome of this case, all of the participating policy
contract terms and conditions will continue to be honoured.
Based on information presently known, the Trial Decision, if affirmed on
further appeal, is not expected to have a material adverse effect on the
consolidated financial position of Lifeco.

P O W E R C O R P O R A T I O N O F C A N A D A 2 0 11 A N N U A L R E P O R T 97
Subsidiaries of Lifeco have an investment in a U.S.‑based private equity
partnership wherein a dispute arose over the terms of the partnership
agreement. Lifeco acquired the investment in 2007 for purchase consideration
of US$350 million. The dispute was resolved on January 10, 2012 and Lifeco has
established a provision of $99 million after tax.
In connection with the acquisition of its subsidiary Putnam, Lifeco has an
indemnity from a third party against liabilities arising from certain litigation
and regulatory actions involving Putnam. Putnam continues to have potential
liability for these matters in the event the indemnity is not honoured. Lifeco
expects the indemnity will continue to be honoured and that any liability
of Putnam would not have a material adverse effect on its consolidated
financial position.
S U B S E Q U E N T E V E N T
On January 3, 2012 the plaintiffs filed an application in the Supreme Court of
Canada for leave to appeal the Appeal Decision.
N O T E 3 2 C O M M I T M E N T S A N D G U A R A N T E E S
G U A R A N T E E S
In the normal course of operations, the Corporation and its subsidiaries
execute agreements that provide for indemnifications to third parties in
transactions such as business dispositions, business acquisitions, loans and
securitization transactions. The Corporation and its subsidiaries have also
agreed to indemnify their directors and certain of their officers. The nature of
these agreements precludes the possibility of making a reasonable estimate
of the maximum potential amount the Corporation and its subsidiaries
could be required to pay third parties as the agreements often do not specify
a maximum amount and the amounts are dependent on the outcome
of future contingent events, the nature and likelihood of which cannot
be determined. Historically, the Corporation has not made any payments
under such indemnification agreements. No amounts have been accrued
related to these agreements.
S Y N D I C A T E D L E T T E R S O F C R E D I T
Clients residing in the United States are required, pursuant to their insurance
laws, to obtain letters of credit issued on behalf of London Reinsurance Group
(LRG) from approved banks in order to further secure LRG’s obligations under
certain reinsurance contracts.
LRG has a syndicated letter of credit facility providing US$650 million in
letters of credit capacity. The facility was arranged in 2010 for a five‑year
term expiring November 12, 2015. Under the terms and conditions of the
facility, collateralization may be required if a default under the letter of credit
agreement occurs. LRG has issued US$479 million in letters of credit under the
facility as at December 31, 2011 (US$507 million at December 31, 2010).
In addition, LRG has other bilateral letter of credit facilities totalling
US$18 million (US$18 million in 2010). LRG issued US$7 million in letters
of credit under these facilities as of December 31, 2011 (US$6 million at
December 31, 2010).
P L E D G I N G O F A S S E T S
With respect to Lifeco, the amounts of assets which have a security interest by way of pledging is $577 million at December 31, 2011 ($554 million at
December 31, 2010 and $595 million at January 1, 2010) in respect of reinsurance agreements.
C O M M I T M E N T S
The Corporation and its subsidiaries enter into operating leases for office space and certain equipment used in the normal course of operations. Lease payments
are charged to operations over the period of use. The future minimum lease payments in aggregate and by year are as follows:
2012 2013 2014 2015 2016
2017 AND
THEREAFTER TOTAL
Future lease payments 155 131 111 94 75 181 747
O T H E R C O M M I T M E N T S
The Corporation has outstanding commitments of $319 million representing future capital contributions to private equity funds.
N O T E 3 1 C O N T I N G E N T L I A B I L I T I E S ( CO N T I N U E D )

P O W E R C O R P O R A T I O N O F C A N A D A 2 0 11 A N N U A L R E P O R T98 NOTES TO THE CONSOLIDATED FINANCIAL STATEMENTS
N O T E 3 3 R E L AT E D P A R T Y T R A N S A C T I O N S
Power Corporation of Canada is incorporated and domiciled in Canada.
Principal subsidiaries The financial statements of the Corporation include the operations of the following subsidiaries:
CORPORATION INCORPORATED IN PRIMARY BUSINESS OPERATION % HELD
Power Financial Corporation Canada Financial services holding company 66.1%
Great‑West Lifeco Inc. Canada Financial services holding company 68.2%
The Great‑West Life Assurance Company Canada Insurance and wealth management 100.0%
London Life Insurance Company Canada Insurance and wealth management 100.0%
The Canada Life Assurance Company Canada Insurance and wealth management 100.0%
Great‑West Life & Annuity Insurance Company United States Insurance and wealth management 100.0%
Putnam Investments, LLC United States Financial services 97.6%
IGM Financial Inc. Canada Financial services 57.6%
Investors Group Inc. Canada Financial services 100.0%
Mackenzie Financial Corporation Canada Financial services 100.0%
Parjointco N.V. Netherlands Holding company 50.0%
Pargesa Holding SA Switzerland Holding company 56.5%
Square Victoria Communications Group Inc. Canada Communication and media 100.0%
Gesca ltée Canada Communication and media 100.0%
Square Victoria Digital Properties Canada Communication and media 100.0%
152245 Canada Inc. Canada Holding company 100.0%
Sagard Capital Partners Management Corp. United States Holding company 100.0%
Sagard SAS France Holding company 100.0%
Victoria Square Ventures Inc. Canada Holding company 100.0%
Balances and transactions between the Corporation and its subsidiaries,
which are related parties of the Corporation, have been eliminated on
consolidation and are not disclosed in this note. Details of transactions
between the Corporation and other related parties are disclosed below.
Transactions with related parties In the normal course of business,
Great‑West Life enters into various transactions with related companies
which include providing insurance benefits to other companies within the
Power Financial Corporation group of companies. In all cases, transactions
were at market terms and conditions.
During 2011, IGM sold residential mortgage loans to Great‑West Life and
London Life for $202 million (2010 – $226 million).
Key management compensation Key management personnel are
those persons having authority and responsibility for planning, directing
and controlling the activities of the Corporation, directly or indirectly.
The persons included in the key management personnel are the members of
the Board of Directors of the Corporation, as well as certain management
executives of the Corporation and subsidiaries.
The following table describes all compensation paid to, awarded to, or earned by each of the key management personnel for services rendered in all capacities
to the Corporation and its subsidiaries:
YEARS ENDED DECEMBER 31 2011 2010
Short‑term employee benefits 23 21
Post‑employment benefits 5 13
Share‑based payment 12 9
40 43

P O W E R C O R P O R A T I O N O F C A N A D A 2 0 11 A N N U A L R E P O R T 99
N O T E 3 4 S U B S E Q U E N T E V E N T S
On February 28, 2012, the Corporation issued 8,000,000 5.6% Non‑Cumulative First Preferred Shares, Series G for gross proceeds of $200 million.
On February 23, 2012, Power Financial issued 10,000,000 5.5% Non‑Cumulative First Preferred Shares, Series R for gross proceeds of $250 million.
On February 22, 2012, Lifeco issued 10,000,000 5.4% Non‑Cumulative First Preferred Shares, Series P for gross proceeds of $250 million.
N O T E 3 5 S E G M E N T E D I N F O R M AT I O N
The following strategic business units constitute the Corporation’s reportable
operating segments:
> Lifeco offers, in Canada, the United States and Europe, a wide range of life
insurance, retirement and investment products, as well as reinsurance and
specialty general insurance products, to individuals, businesses and other
private and public organizations.
> IGM offers a comprehensive package of financial planning services and
investment products to its client base. IGM derives its revenues from
a range of sources, but primarily from management fees, which are
charged to its mutual funds for investment advisory and management
services. IGM also earns revenue from fees charged to its mutual funds for
administrative services.
> Parjointco holds the Corporation’s interest in Pargesa, a holding company
which holds diversified interests in companies based in Europe active
in various sectors, including specialty minerals, cement and building
materials, water, waste services, energy, and wines and spirits.
> The segment entitled Other is made up of corporate activities of the
Corporation and of Power Financial. The segment also includes the
results of Square Victoria Communications Group Inc. and consolidation
elimination entries.
The accounting policies of the operating segments are those described in
Note 2 — Basis of Presentation and Summary of Significant Accounting Policies
of the financial statements. The Corporation evaluates the performance
based on the operating segment’s contribution to consolidated net earnings.
Revenues and assets are attributed to geographic areas based on the point of
origin of revenues and the location of assets. The contribution to consolidated
net earnings of each segment is calculated after taking into account the
investment Lifeco and IGM have in each other.

P O W E R C O R P O R A T I O N O F C A N A D A 2 0 11 A N N U A L R E P O R T100 NOTES TO THE CONSOLIDATED FINANCIAL STATEMENTS
I N F O R M A T I O N O N P R O F I T M E A S U R E
FOR THE YEAR ENDED DECEMBER 31, 2011 LIFECO IGM PARJOINTCO OTHER TOTAL
REVENUES
Premium income, net 17,293 – – – 17,293
Investment income, net 9,702 161 – 11 9,874
Fee and media income 2,903 2,571 – 271 5,745
29,898 2,732 – 282 32,912
EXPENSES
Total paid or credited to policyholders 23,043 – – – 23,043
Commissions 1,548 895 – (131) 2,312
Operating and administrative expenses 2,314 638 – 549 3,501
Financing charges 289 103 – 51 443
27,194 1,636 – 469 29,299
2,704 1,096 – (187) 3,613
Share of earnings (losses) of investments in associates – – (20) – (20)
Earnings before income taxes — continuing operations 2,704 1,096 (20) (187) 3,593
Income taxes 465 250 – (4) 711
Contribution to net earnings — continuing operations 2,239 846 (20) (183) 2,882
Contribution to net earnings — discontinued operations – 63 – – 63
Contribution to net earnings 2,239 909 (20) (183) 2,945
Attributable to
Non‑controlling interests 1,324 566 (7) (54) 1,829
Non‑participating shareholders – – – 41 41
Participating shareholders 915 343 (13) (170) 1,075
2,239 909 (20) (183) 2,945
I N F O R M A T I O N O N A S S E T S A N D L I A B I L I T I E S M E A S U R E
DECEMBER 31, 2011 LIFECO IGM PARJOINTCO OTHER TOTAL
Goodwill 5,861 2,925 – 42 8,828
Total assets 238,552 10,839 2,222 3,883 255,496
Total liabilities 222,664 6,625 – 1,172 230,461
G E O G R A P H I C I N F O R M A T I O N
DECEMBER 31, 2011 CANADAUNITED STATES EUROPE TOTAL
Invested assets 63,817 27,683 31,207 122,707
Investments in associates 119 – 2,222 2,341
Segregated funds for the risk of unit holders 49,622 22,359 24,601 96,582
Other assets 4,377 3,050 12,504 19,931
Goodwill and intangible assets 10,406 1,769 1,760 13,935
Total assets 128,341 54,861 72,294 255,496
Total revenues 17,473 6,144 9,295 32,912
N O T E 3 5 S E G M E N T E D I N F O R M AT I O N ( CO N T I N U E D )

P O W E R C O R P O R A T I O N O F C A N A D A 2 0 11 A N N U A L R E P O R T 101
I N F O R M A T I O N O N P R O F I T M E A S U R E
FOR THE YEAR ENDED DECEMBER 31, 2010 LIFECO IGM PARJOINTCO OTHER TOTAL
REVENUES
Premium income, net 17,748 – – – 17,748
Investment income, net 9,534 146 – (172) 9,508
Fee and media income 2,821 2,468 – 275 5,564
30,103 2,614 – 103 32,820
EXPENSES
Total paid or credited to policyholders 23,225 – – – 23,225
Commissions 1,477 854 – (115) 2,216
Operating and administrative expenses 3,150 636 – 513 4,299
Financing charges 288 111 – 66 465
28,140 1,601 – 464 30,205
1,963 1,013 – (361) 2,615
Share of earnings (losses) of investments in associates – – 121 3 124
Earnings before income taxes — continuing operations 1,963 1,013 121 (358) 2,739
Income taxes 254 270 – 8 532
Contribution to net earnings — continuing operations 1,709 743 121 (366) 2,207
Contribution to net earnings — discontinued operations – 2 – – 2
Contribution to net earnings 1,709 745 121 (366) 2,209
Attributable to
Non‑controlling interests 976 470 41 (46) 1,441
Non‑participating shareholders – – – 41 41
Participating shareholders 733 275 80 (361) 727
1,709 745 121 (366) 2,209
I N F O R M A T I O N O N A S S E T S A N D L I A B I L I T I E S M E A S U R E
DECEMBER 31, 2010 LIFECO IGM PARJOINTCO OTHER TOTAL
Goodwill 5,857 2,860 – 42 8,759
Total assets 229,221 11,902 2,448 3,955 247,526
Total liabilities 214,605 7,920 – 1,150 223,675
G E O G R A P H I C I N F O R M A T I O N
DECEMBER 31, 2010 CANADAUNITEDSTATES EUROPE TOTAL
Invested assets 61,163 25,935 28,898 115,996
Investments in associates 117 – 2,448 2,565
Segregated funds for the risk of unit holders 50,001 21,189 23,637 94,827
Other assets 5,348 2,929 11,991 20,268
Goodwill and intangible assets 10,388 1,717 1,765 13,870
Total assets 127,017 51,770 68,739 247,526
Total revenues 17,085 6,523 9,212 32,820
G E O G R A P H I C I N F O R M A T I O N
JANUARY 1, 2010 CANADAUNITEDSTATES EUROPE TOTAL
Invested assets 56,926 24,737 29,431 111,094
Investments in associates 119 – 2,829 2,948
Segregated funds for the risk of unit holders 45,006 22,799 19,690 87,495
Other assets 4,464 13,888 3,235 21,587
Goodwill and intangible assets 10,351 1,721 1,893 13,965
Total assets 116,866 63,145 57,078 237,089
N O T E 3 5 S E G M E N T E D I N F O R M AT I O N ( CO N T I N U E D )

P O W E R C O R P O R A T I O N O F C A N A D A 2 0 11 A N N U A L R E P O R T102
Independent Auditor’s Report
TO THE SHAREHOLDERS OF POWER CORPORATION OF CANADA
We have audited the accompanying consolidated financial statements of Power Corporation of Canada, which comprise the consolidated balance sheets as
at December 31, 2011, December 31, 2010 and January 1, 2010, and the consolidated statements of earnings, statements of comprehensive income, statements
of changes in equity and statements of cash flows for the years ended December 31, 2011 and December 31, 2010, and a summary of significant accounting
policies and other explanatory information.
Management’s Responsibility for the Consolidated Financial Statements
Management is responsible for the preparation and fair presentation of these consolidated financial statements in accordance with International Financial
Reporting Standards, and for such internal control as management determines is necessary to enable the preparation of consolidated financial statements
that are free from material misstatement, whether due to fraud or error.
Auditor’s Responsibility
Our responsibility is to express an opinion on these consolidated financial statements based on our audits. We conducted our audits in accordance with
Canadian generally accepted auditing standards. Those standards require that we comply with ethical requirements and plan and perform the audit to obtain
reasonable assurance about whether the consolidated financial statements are free from material misstatement.
An audit involves performing procedures to obtain audit evidence about the amounts and disclosures in the consolidated financial statements. The procedures
selected depend on the auditor’s judgment, including the assessment of the risks of material misstatement of the consolidated financial statements, whether
due to fraud or error. In making those risk assessments, the auditor considers internal control relevant to the entity’s preparation and fair presentation of
the consolidated financial statements in order to design audit procedures that are appropriate in the circumstances, but not for the purpose of expressing
an opinion on the effectiveness of the entity’s internal control. An audit also includes evaluating the appropriateness of accounting policies used and the
reasonableness of accounting estimates made by management, as well as evaluating the overall presentation of the consolidated financial statements.
We believe that the audit evidence we have obtained in our audits is sufficient and appropriate to provide a basis for our audit opinion.
Opinion
In our opinion, the consolidated financial statements present fairly, in all material respects, the financial position of Power Corporation of Canada
at December 31, 2011, December 31, 2010 and January 1, 2010, and its financial performance and its cash flows for the years ended December 31, 2011 and
December 31, 2010 in accordance with International Financial Reporting Standards.
Signed,
Deloitte & Touche LLP 1
March 14, 2012
Montréal, Québec
1 Chartered accountant auditor permit No. 9569

P O W E R C O R P O R A T I O N O F C A N A D A 2 0 11 A N N U A L R E P O R T 103
Power Corporation of CanadaF I V E -Y E A R F I N A N C I A L S U M M A R Y
PREVIOUS CANADIAN GA AP
DECEMBER 31[ IN MILLIONS OF CANADIAN DOLL ARS, EXCEPT PER SHARE AMOUNTS ] (UNAUDITED) 2011 2010 2009 2008 2007
CONSOLIDATED BALANCE SHEETSCash and cash equivalents 3,741 4,016 5,385 5,233 6,320Total assets 255,496 247,526 143,007 143,700 132,951Shareholders’ equity 9,825 9,430 9,829 9,757 10,037Consolidated assets and assets under management 499,599 503,063 474,551 454,312 524,276CONSOLIDATED STATEMENTS OF EARNINGSREVENUESPremium income, net 17,293 17,748 18,033 30,007 18,753Investment income, net 9,874 9,508 9,597 1,343 4,910Fee and media income 5,745 5,564 5,412 5,978 5,766
32,912 32,820 33,042 37,328 29,429EXPENSESTotal paid or credited to policyholders 23,043 23,225 23,809 26,774 19,122Commissions 2,312 2,216 2,088 2,172 2,236Operating and administrative expenses 3,501 4,299 4,153 4,217 3,740Intangible and goodwill impairment – – – 2,178 –Financing charges 443 465 523 445 417
29,299 30,205 30,573 35,786 25,5153,613 2,615 2,469 1,542 3,914
Share of earnings (losses) of investments in associates (20) 124 66 (195) 152Income taxes 711 532 531 38 972Net earnings — continuing operations 2,882 2,207 2,004 1,309 3,094Net earnings — discontinued operations 63 2 – 692 203Net earnings 2,945 2,209 2,004 2,001 3,297
Attributable to Non‑controlling interests 1,829 1,441 1,322 1,133 1,834 Non‑participating shareholders 41 41 41 42 42 Participating shareholders 1,075 727 641 826 1,421
2,945 2,209 2,004 2,001 3,297PER SHAREOperating earnings before other items and discontinued operations 2.50 2.09 1.81 1.97 2.90Net earnings from discontinued operations 0.05 – – 0.73 0.22Net earnings 2.34 1.59 1.40 1.81 3.13Dividends 1.16000 1.16000 1.16000 1.11125 0.92125Book value at year‑end 19.67 18.85 19.78 19.65 20.37MARKET PRICE (PARTICIPATING SHARES)High 29.50 31.50 31.08 40.22 41.92Low 20.90 24.98 14.70 19.11 33.55Year‑end 23.82 27.67 29.21 22.42 40.13
Q U A R T E R LY F I N A N C I A L I N F O R M AT I O N
[IN MILLIONS OF CANADIAN DOLL ARS, EXCEPT PER SHARE AMOUNTS] (UNAUDITED)TOTAL
REVENUESNET
EARNINGS
EARNINGS PER SHARE
— BASIC
EARNINGS PER SHARE — DILUTED
2011First quarter 7,032 597 0.47 0.47Second quarter 7,953 834 0.77 0.77Third quarter 9,246 587 0.41 0.41Fourth quarter 8,681 927 0.68 0.672010First quarter 9,001 543 0.36 0.36Second quarter 8,013 584 0.36 0.36Third quarter 9,813 470 0.37 0.37Fourth quarter 5,993 612 0.50 0.50

P O W E R C O R P O R A T I O N O F C A N A D A 2 0 11 A N N U A L R E P O R T104
Board of Directors
PIERRE BEAUDOIN
PRESIDENT AND CHIEF EXECUTIVE OFFICER, BOMBARDIER INC.
MARCEL R. COUTU
PRESIDENT AND CHIEF EXECUTIVE OFFICER, CANADIAN OIL SANDS LIMITED
LAURENT DASSAULT
VICE-CHAIRMAN AND CHIEF EXECUTIVE OFFICER, GROUPE INDUSTRIEL MARCEL DASSAULT SA
ANDRÉ DESMARAIS, o.c., o.q. [1,5]
DEPUTY CHAIRMAN, PRESIDENT AND CO-CHIEF EXECUTIVE OFFICER OF THE CORPORATION AND CO-CHAIRMAN, POWER FINANCIAL CORPORATION
THE HONOURABLE PAUL DESMARAIS, p.c., c.c., o.q. [1, 5]
CHAIRMAN OF THE EXECUTIVE COMMITTEE OF THE CORPORATION
PAUL DESMARAIS, JR., o.c., o.q. [1, 5]
CHAIRMAN AND CO-CHIEF EXECUTIVE OFFICER OF THE CORPORATION AND CO-CHAIRMAN, POWER FINANCIAL CORPORATION
GUY FORTIN*
VICE-CHAIRMAN, SANPALO INVESTMENTS CORPORATION
ANTHONY R. GRAHAM, ll.d. [1, 3, 4 , 5]
PRESIDENT, WITTINGTON INVESTMENTS, LIMITED
ROBERT GRATTON
DEPUTY CHAIRMAN OF THE CORPORATION
ISABELLE MARCOUX
CHAIR OF THE BOARD AND VICE-PRESIDENT, CORPORATE DEVELOPMENT, TRANSCONTINENTAL INC.
THE RIGHT HONOURABLE DONALD F. MAZANKOWSKI*, p.c., o.c., a.o.e. [1, 2, 3, 4 , 5]
COMPANY DIRECTOR
RAYMOND L. McFEETORS*
VICE-CHAIRMAN, POWER FINANCIAL CORPORATION AND CHAIRMAN, GREAT-WEST LIFECO INC.
JERRY E.A. NICKERSON* [1, 3]
CHAIRMAN OF THE BOARD, H.B. NICKERSON & SONS LIMITED
JAMES R. NININGER*, ph.d. [2, 3]
COMPANY DIRECTOR
R. JEFFREY ORR
PRESIDENT AND CHIEF EXECUTIVE OFFICER, POWER FINANCIAL CORPORATION
ROBERT PARIZEAU* [2]
CHAIRMAN, AON PARIZEAU INC.
MICHEL PLESSIS -BÉLAIR*, fca
VICE-CHAIRMAN OF THE CORPORATION
JOHN A. RAE*, c.m.EXECUTIVE VICE-PRESIDENT, OFFICE OF THE CHAIRMAN OF THE EXECUTIVE COMMITTEE OF THE CORPORATION
HENRI-PAUL ROUSSEAU*, ph.d.VICE-CHAIRMAN OF THE CORPORATION AND OF POWER FINANCIAL CORPORATION
T. TIMOTHY RYAN, JR.
PRESIDENT AND CHIEF EXECUTIVE OFFICER, SECURITIES INDUSTRY AND FINANCIAL MARKETS ASSOCIATION
EMO” KE J.E. SZATHMÁRY, c.m., o.m., ph.d., frsc [2, 4]
PRESIDENT EMERITUS, UNIVERSITY OF MANITOBA
Directors Emeritus
JAMES W. BURNS, o.c., o.m.
THE HONOURABLE P. MICHAEL PITFIELD, p.c., q.c.[1] Member of the Executive Committee
[2] Member of the Audit Committee
[3] Member of the Compensation Committee
[4] Member of the Related Party and Conduct Review Committee
[5] Member of the Governance and Nominating Committee
* Not standing for re‑election

P O W E R C O R P O R A T I O N O F C A N A D A 2 0 11 A N N U A L R E P O R T 105
Officers
PAUL DESMARAIS, JR., o.c., o.q.CHAIRMAN AND CO-CHIEF EXECUTIVE OFFICER
ANDRÉ DESMARAIS, o.c., o.q.DEPUTY CHAIRMAN, PRESIDENT AND CO-CHIEF EXECUTIVE OFFICER
ROBERT GRATTON
DEPUTY CHAIRMAN
MICHEL PLESSIS -BÉLAIR, fcaVICE-CHAIRMAN
HENRI-PAUL ROUSSEAU, ph.d.VICE-CHAIRMAN
PHILIP K. RYAN
EXECUTIVE VICE-PRESIDENT AND CHIEF FINANCIAL OFFICER
JOHN A. RAE, c.m.EXECUTIVE VICE-PRESIDENT, OFFICE OF THE CHAIRMAN OF THE EXECUTIVE COMMITTEE
EDWARD JOHNSON
SENIOR VICE-PRESIDENT, GENERAL COUNSEL AND SECRETARY
ARNAUD VIAL
SENIOR VICE-PRESIDENT
DANIEL FRIEDBERG
VICE-PRESIDENT
PETER KRUYT
VICE-PRESIDENT
PIERRE LAROCHELLE
VICE-PRESIDENT
DENIS LE VASSEUR, c.a.VICE-PRESIDENT AND CONTROLLER
STÉPHANE LEMAY
VICE-PRESIDENT, ASSISTANT GENERAL COUNSEL AND ASSOCIATE SECRETARY
HENRY YUHONG LIU, cfaVICE-PRESIDENT
RICHARD PAN
VICE-PRESIDENT
LUC RENY, cfaVICE-PRESIDENT
ISABELLE MORIN, c.a.TREASURER

P O W E R C O R P O R A T I O N O F C A N A D A 2 0 11 A N N U A L R E P O R T106
Corporate Information
The trademarks contained in this report are owned by Power Corporation of Canada, or by a member of the Power Corporation group of companiesTM. Trademarks that are not owned by Power Corporation of Canada are used with permission.
Additional copies of this Annual Report, as well as copies
of the annual report of Power Financial Corporation,
are available from the Secretary:
POWER CORPORATION OF CANADA
751 VICTORIA SQUARE
MONTRÉAL, QUÉBEC, CANADA H2Y 2J3
or
POWER CORPORATION OF CANADA
SUITE 2600, RICHARDSON BUILDING
1 LOMBARD PLACE
WINNIPEG, MANITOBA, CANADA R3B 0X5
WEBSITE
www.powercorporation.com
Si vous préférez recevoir ce rapport annuel en français,
veuillez vous adresser au secrétaire :
POWER CORPORATION DU CANADA
751, SQUARE VICTORIA
MONTRÉAL (QUÉBEC) CANADA H2Y 2J3
ou
POWER CORPORATION DU CANADA
BUREAU 2600, RICHARDSON BUILDING
1 LOMBARD PLACE
WINNIPEG (MANITOBA) CANADA R3B 0X5
STOCK LISTINGS
Shares of Power Corporation of Canada are listed on the
Toronto Stock Exchange:
Subordinate Voting Shares: POW
Participating Preferred Shares: POW.PR.E
First Preferred Shares 1986 Series: POW.PR.F
First Preferred Shares, Series A: POW.PR.A
First Preferred Shares, Series B: POW.PR.B
First Preferred Shares, Series C: POW.PR.C
First Preferred Shares, Series D: POW.PR.D
First Preferred Shares, Series G: POW.PR.G
TRANSFER AGENT AND REGISTRAR
Computershare Investor Services Inc.
Offices in:
Montréal (QC); Toronto (ON); Vancouver (BC)
www.computershare.com
SHAREHOLDER SERVICES
Shareholders with questions relating to the payment of
dividends, change of address and share certificates should
contact the Transfer Agent:
Computershare Investor Services Inc.
Shareholder Services
100 University Avenue, 9th Floor
Toronto, Ontario, Canada M5J 2Y1
Telephone: 1‑800‑564‑6253 (toll‑free in Canada and the U.S.)
or 514‑982‑7555
www.computershare.com
Power Corporation of Canada has been designated “A Caring Company” by Imagine, a national program to promote corporate and public giving, volunteering and support in the community.


PR
INT
ED
IN
CA
NA
DA