view this presentation (pdf 3.43 mb) - s21.q4cdn.com our approach as “the monthly dividend...
TRANSCRIPT

RETAILINVESTOR PRESENTATION
December 2017
1
ContentsCompany Overview & Historical Risk/Reward 2
Dependable Dividends 6
Portfolio Diversification 10
Asset and Portfolio Management 17
Investment Strategy 20
Capital Structure & Scalability 24
Business Plan 28
All data as of September 30, 2017 unless otherwise specified
Statements in this investor presentation that are not strictly historical are "forward-looking" statements. Forward-looking statements involve known and unknown risks, which may cause
the company‘s actual future results to differ materially from expected results. These risks include, among others, general economic conditions, local real estate conditions, tenant financial
health, the availability of capital to finance planned growth, continued volatility and uncertainty in the credit markets and broader financial markets, property acquisitions and the timing
of these acquisitions, charges for property impairments, and the outcome of any legal proceedings to which the company is a party, as described in the company's filings with the
Securities and Exchange Commission. Consequently, forward-looking statements should be regarded solely as reflections of the company's current operating plans and estimates. Actual
operating results may differ materially from what is expressed or forecast in this investor presentation. The company undertakes no obligation to publicly release the results of any
revisions to these forward-looking statements that may be made to reflect events or circumstances after the date these statements were made.

2
Company Overview: The Monthly Dividend Company®
Leading real estate company: Largest net lease REIT with 5,062 properties and $22 billion enterprise value
Founded in 1969; NYSE listing in 1994 (NYSE ticker “O”)
Member of S&P 500 index
Member of S&P High-Yield Dividend Aristocrats® index (1)
One of only 9 U.S. REITs with at least one “A” credit rating (2)
Consistent track record: 16.4% compound average annual shareholder return since NYSE listing in 1994
4.4% dividend yield, paid monthly
4.6% compound average annual growth in dividend since NYSE listing
80 consecutive quarters of dividend increases
(1) The S&P High Yield Dividend Aristocrats® index is designed to measure the performance of companies within the S&P Composite 1500® that have
followed a managed-dividends policy of consistently increasing dividends every year for at least 20 years.
(2) Excludes REITs without rated debt
3
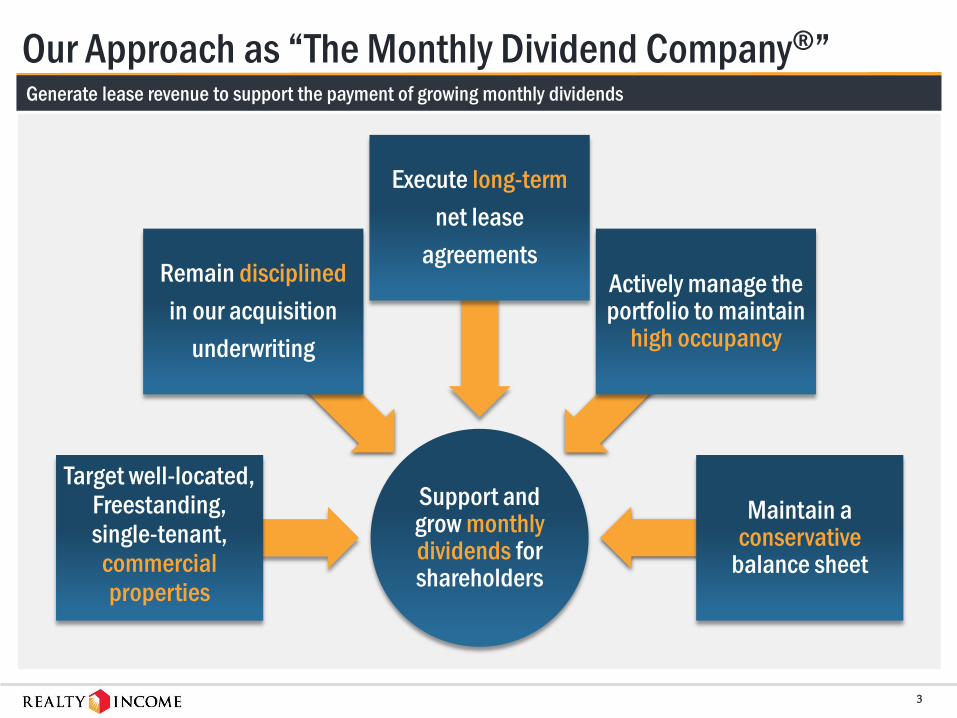
Our Approach as “The Monthly Dividend Company®”Generate lease revenue to support the payment of growing monthly dividends
Support and grow monthly dividends for shareholders
Target well-located,Freestanding,single-tenant,
commercialproperties
Remain disciplined
in our acquisition
underwriting
Execute long-term
net lease
agreementsActively manage the portfolio to maintain
high occupancy
Maintain a conservative
balance sheet

4
Differentiated Business Model from “Traditional” Retail REITsLease structure and growth drivers support predictable revenue stream relative to other forms of retail real estate
Initial Length of Lease 15+ Years < 10 Years
Remaining Avg Term ~ 10 Years ~ 5-7 Years
Responsibility for Property Expenses Tenant Landlord
Gross Margin > 98% ~ 75%
Volatility of Rental Revenue Low Modest / High
Maintenance Capital Expenditures Low Modest / High
Reliance on Anchor Tenant(s) None High
Average Retail Property Size / Fungibility 12k sf / High 150k–850k sf / Low
Shopping
Centers and
Malls
Realty Income leases freestanding properties on a “triple-net”
basis (tenant pays for taxes, insurance and maintenance)
Target Markets Many Few
External Acquisition Opportunities High Low
Institutional Buyer Competition Modest High
Shopping
Centers and
MallsRealty Income growth opportunities through acquisitions

5
16.4%
10.8%10.4%
9.8% 9.7%
O Equity REITIndex
DJIA Nasdaq S&P 500
Compound Average Annual Total
Shareholder Return Since 1994
Safety: Lowest Volatility, Highest Return Relative to Market IndicesSince 1994 NYSE listing, Realty Income shares have outperformed benchmark indices while exhibiting lower volatility
O
Standard deviation of total returns measures deviation from average annual total returns since 1994 and uses annualized total returns for YTD period
15.5% 16.1%
18.4% 18.9%
29.6%
O DJIA S&P 500 Equity REITIndex
Nasdaq
Standard Deviation of Annual
Returns Since 1994
O

6
DEPENDABLEDIVIDENDS

7
739%
439%
Total Return % Price Change %
Dividends Matter to Long-Term Investor ReturnsIn a low-growth, low-yield environment, consistent dividend growth generates significant value for investors
41% of S&P 500 Index
returns from 1994
through 3Q17 were
attributed to dividends
3123%
615%
Total Return % Price Change % 80% of Realty Income
returns from 1994 NYSE
listing through 3Q17 were
attributed to dividends
S&P 500 Index Returns: With and Without Dividends (Oct 18, 1994(1) – September 30, 2017)
Realty Income Index Returns: With and Without Dividends (Oct 18, 1994(1) – September 30, 2017)
(1) October 18, 1994 = Realty Income NYSE Listing
Source: SNL

8
1994 1995 1996 1997 1998 1999 2000 2001 2002 2003 2004 2005 2006 2007 2008 2009 2010 2011 2012 2013 2014 2015 2016 2017
YTD
$0.90 $0.93 $0.945 $0.96 $1.02
$1.08 $1.11 $1.14 $1.17 $1.20
$1.32
$1.40
$1.52 $1.64
$1.70 $1.72 $1.73 $1.75
$1.82
$2.19 $2.20 $2.29
$2.43
$2.544
Consistent Dividends That Grow Over Time Steady dividend track record supported by inherently stable business model, disciplined execution
Strong Dividend Track Record
80 consecutive quarterly increases
93 total increases since 1994 NYSE listing
~83.4% Annualized AFFO payout (midpoint of 2017 guidance)
4.6% compound average annualized growth rate since NYSE listing
One of only five REITs included in S&P High Yield Dividend Aristocrats® index
As of October 2017 dividend declaration
Annualized dividend amount reflects the December declared dividend per share annualized, with the exception of 2017, which reflects the October 2017 declared dividend annualized
9
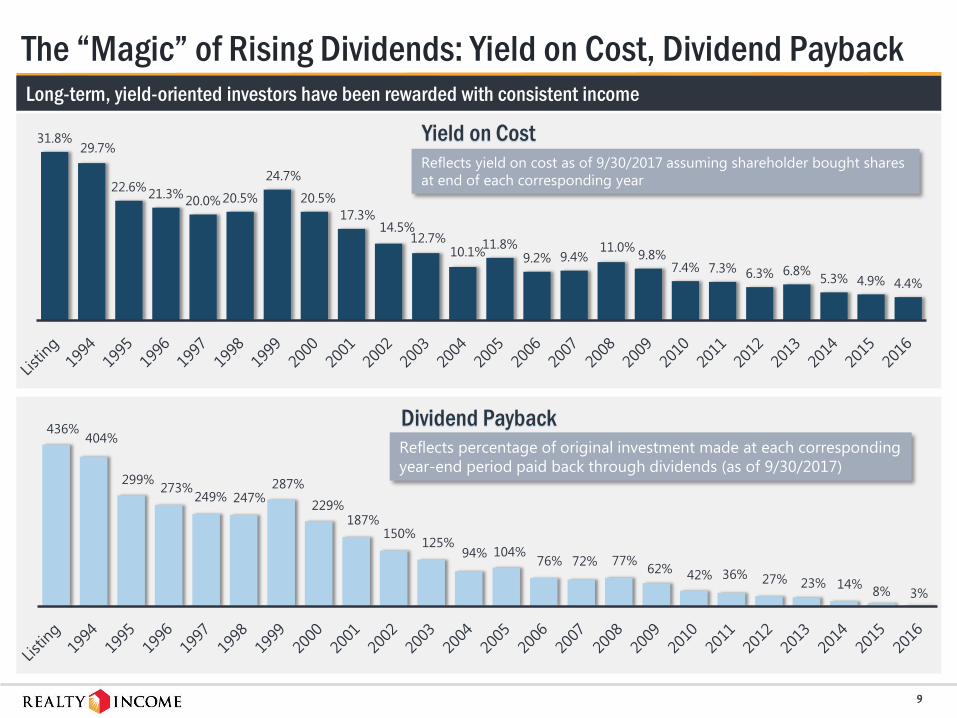
436%404%
299%273%
249% 247%287%
229%187%
150%125%
94% 104%76% 72% 77%
62% 42% 36% 27% 23% 14%8% 3%
Reflects percentage of original investment made at each corresponding
year-end period paid back through dividends (as of 9/30/2017)
Dividend Payback
31.8%29.7%
22.6%21.3%
20.0% 20.5%
24.7%
20.5%
17.3%14.5%
12.7%10.1%
11.8%9.2% 9.4%
11.0%9.8%
7.4% 7.3% 6.3% 6.8%5.3% 4.9% 4.4%
Reflects yield on cost as of 9/30/2017 assuming shareholder bought shares
at end of each corresponding year
Yield on Cost
The “Magic” of Rising Dividends: Yield on Cost, Dividend PaybackLong-term, yield-oriented investors have been rewarded with consistent income
10
PORTFOLIO
DIVERSIFICATION
11
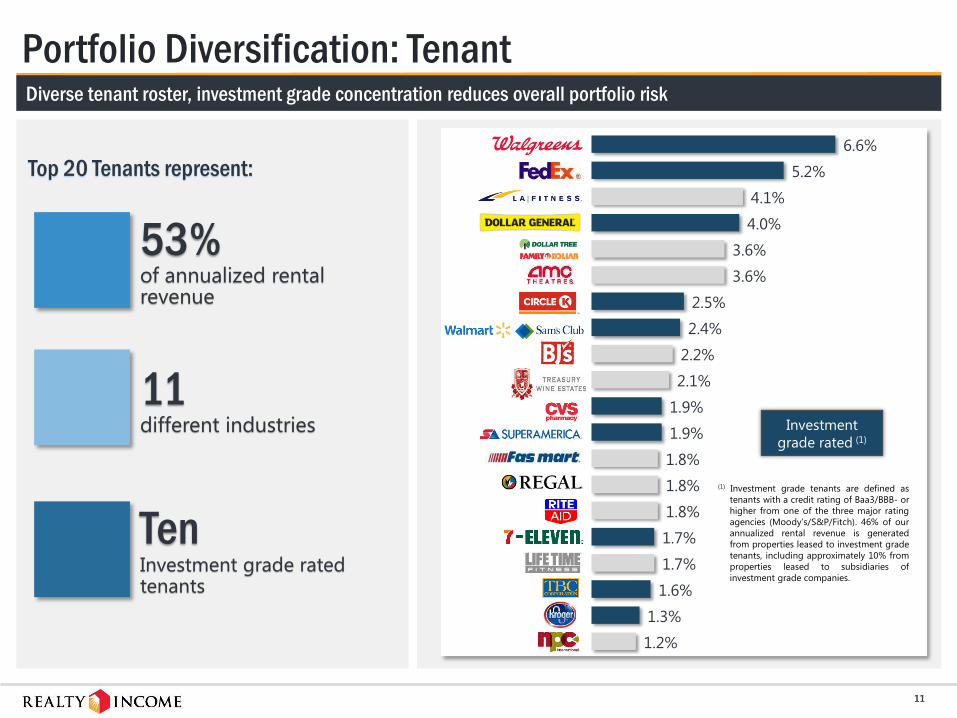
Portfolio Diversification: Tenant
11different industries
53%of annualized rental revenue
TenInvestment grade rated tenants
6.6%
5.2%
4.1%
4.0%
3.6%
3.6%
2.5%
2.4%
2.2%
2.1%
1.9%
1.9%
1.8%
1.8%
1.8%
1.7%
1.7%
1.6%
1.3%
1.2%
(1) Investment grade tenants are defined as
tenants with a credit rating of Baa3/BBB- or
higher from one of the three major rating
agencies (Moody’s/S&P/Fitch). 46% of our
annualized rental revenue is generated
from properties leased to investment grade
tenants, including approximately 10% from
properties leased to subsidiaries of
investment grade companies.
Top 20 Tenants represent:
Diverse tenant roster, investment grade concentration reduces overall portfolio risk
Investment
grade rated (1)

12
Retail Tenants in Top 20 are Highly Insulated from Changing Consumer Behavior
Top 20 tenants all fall in at least one category (Service, Non-Discretionary, Low Price Point Retail or Non-Retail)
Service / Experiential
Non-Discretionary
Low Price Point
Service / Experiential Non-Discretionary
Low Price Point
Non-Retail
Non-Retail
NPC represented by Wendy’s / TBC represented by National Tire & Battery / Walmart represented by Neighborhood Markets and Sam’s Club

13
Top Tenant Exposure: 2009 vs. TodayTop 15 tenants represent higher quality credit, less cyclical industries and greater diversification vs. 2009
Tenant Industry % of Rent
Hometown Buffet Casual Dining 6.0%
Kerasotes Showplace Theatres Theatres 5.3%
L.A. Fitness Health & Fitness 5.3%
The Pantry Convenience Stores 4.3%
Friendly’s Casual Dining 4.1%
Rite Aid Drug Stores 3.4%
La Petite Academy Child Care 3.3%
TBC Corporation Auto Tire Services 3.2%
Boston Market QSR 3.1%
Couche-Tard / Circle K Convenience Stores 3.0%
NPC / Pizza Hut QSR 2.6%
FreedomRoads / Camping World Sporting Goods 2.6%
KinderCare Child Care 2.5%
Regal Cinemas Theatres 2.3%
Sports Authority Sporting Goods 2.0%
Total % of Rent - Top 15 Tenants 53.0%
Investment Grade % - Top 15 Tenants 3.2%
#1 Industry – Restaurants 21.3%
#2 Industry – Convenience Stores 17.0%
Top 15 Tenants as of YE 2009 Top 15 Tenants as of 3Q 2017
Bold tenants represent investment-grade rated credit
Tenant Industry % of Rent
Walgreens Drug Stores 6.6%
FedEx (Non-Retail) Transportation 5.2%
L.A. Fitness Health & Fitness 4.1%
Dollar General Dollar Stores 4.0%
Dollar Tree / Family Dollar Dollar Stores 3.6%
AMC Theatres Theatres 3.6%
Circle K / The Pantry Convenience Stores 2.5%
Walmart / Sam’s Club Grocery / Wholesale 2.4%
BJ’s Wholesale Clubs Wholesale Clubs 2.2%
Treasury Wine Estates (Non-Retail) Beverages 2.1%
CVS Pharmacy Drug Stores 1.9%
Super America / Western Refining Convenience Stores 1.9%
GPM Investments / Fas Mart Convenience Stores 1.8%
Regal Cinemas Theatres 1.8%
Rite Aid Drug Stores 1.8%
Total % of Rent - Top 15 Tenants 45.5%
Investment Grade % - Top 15 Tenants 24.5%
#1 Industry – Drug Stores 10.8%
#2 Industry – Convenience Stores 9.5%

14
Portfolio Diversification: Industry
3.2%
3.7%
4.6%
5.0%
5.1%
5.4%
7.6%
7.8%
9.5%
10.8%
Wholesale Clubs
Casual Dining Restaurants
Grocery
Quick-Service Restaurants
Theaters
Transportation Services
Health and Fitness
Dollar Stores
Convenience Stores
Drug Stores
Exposure to defensive industries:Top 10 industries represent strong diversification, significant exposure to non-discretionary, low price-point, service-oriented industries
No industry represents more than 10.8% of rent
Non-Discretionary
Service-Oriented
Non-Discretionary, Low Price Point
Non-Discretionary, Service-Oriented
Low Price Point, Service-Oriented
N/A (Non-Retail Exposure)
Low Price Point
Service-Oriented
Low Price Point, Service-Oriented
Low Price Point
Industry Retail Characteristics

15
Portfolio Diversification: GeographyBalanced presence in 49 states and Puerto Rico
PUERTO RICO
Represents percentage of rental revenue %
California 9.6%
Texas 9.3%
Illinois 6.2%
Florida 5.9%
Ohio 5.3%
New York 4.6%
% of Rental Revenue
<1
<1
<1
<1
<1<1
<1
<1
<1
<19.6 1.6 1.6
<12.2
9.3
1.6
3.1
3.4
1.3
<1
1.4
1.6
3.0
6.2
2.4
2.9 5.3
2.1
1.4
1.9 4.4
5.9
2.2
2.7
2.8
<1
2.9
4.6
<1<1
1.2
<1
<1
1.7
1.5<1
<1
<1
<1
16
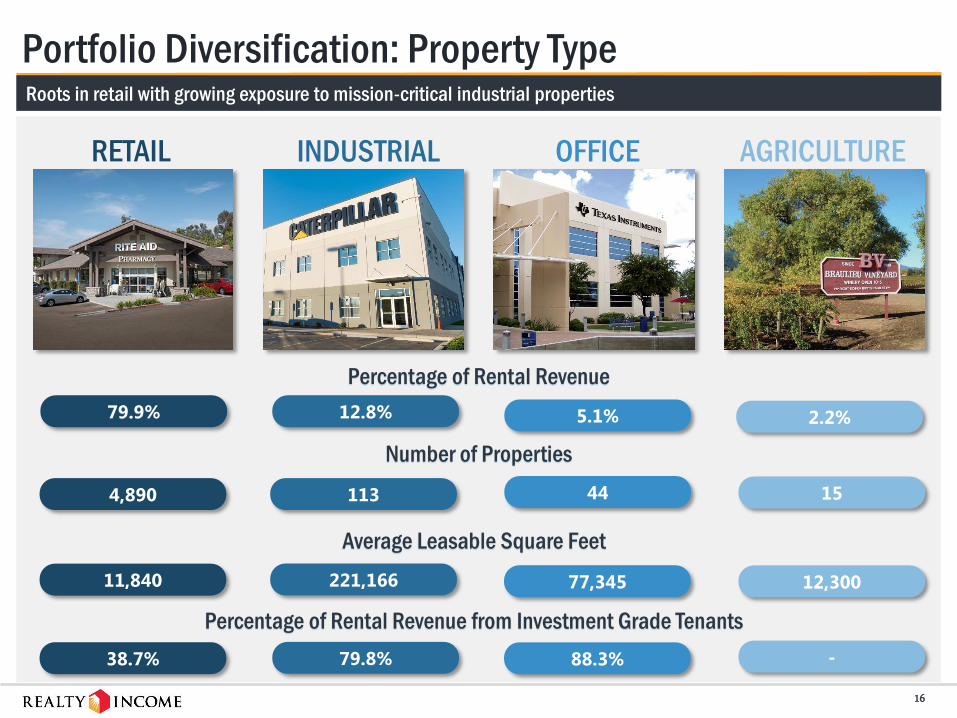
Portfolio Diversification: Property TypeRoots in retail with growing exposure to mission-critical industrial properties
79.9% 12.8% 5.1% 2.2%
Number of Properties
Percentage of Rental Revenue
RETAIL INDUSTRIAL OFFICE AGRICULTURE
4,890 113 44 15
Average Leasable Square Feet
11,840 221,166 77,345 12,300
Percentage of Rental Revenue from Investment Grade Tenants
38.7% 79.8% 88.3% -
17
ASSET ANDPORTFOLIO MANAGEMENT
18
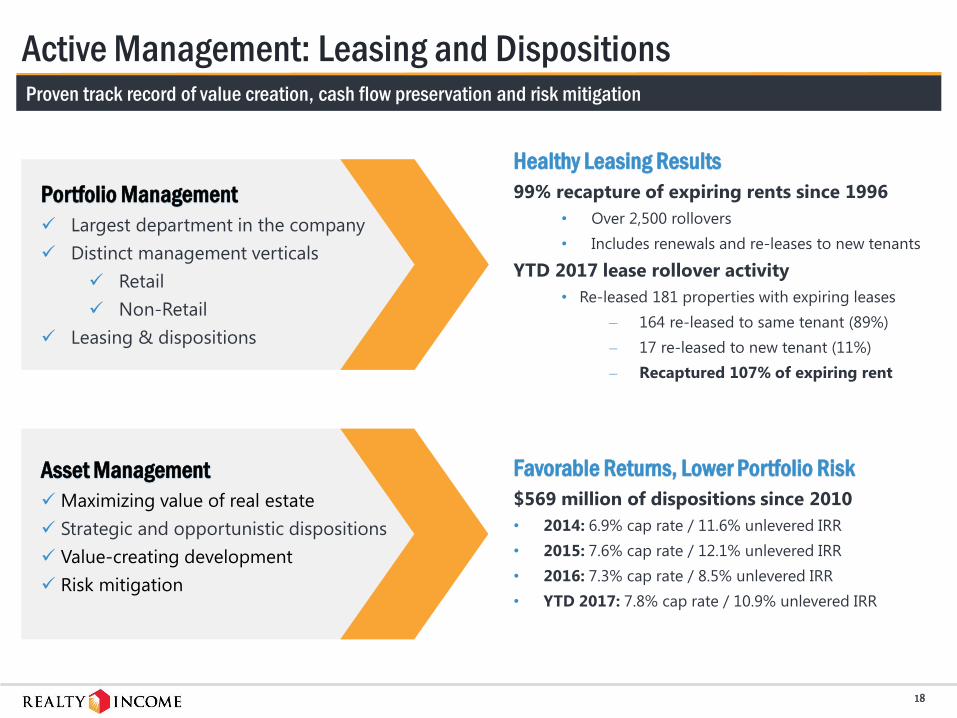
Active Management: Leasing and DispositionsProven track record of value creation, cash flow preservation and risk mitigation
Portfolio Management
Largest department in the company
Distinct management verticals
Retail
Non-Retail
Leasing & dispositions
Healthy Leasing Results
99% recapture of expiring rents since 1996
• Over 2,500 rollovers
• Includes renewals and re-leases to new tenants
YTD 2017 lease rollover activity
• Re-leased 181 properties with expiring leases
– 164 re-leased to same tenant (89%)
– 17 re-leased to new tenant (11%)
– Recaptured 107% of expiring rent
Asset Management
Maximizing value of real estate
Strategic and opportunistic dispositions
Value-creating development
Risk mitigation
Favorable Returns, Lower Portfolio Risk
$569 million of dispositions since 2010
• 2014: 6.9% cap rate / 11.6% unlevered IRR
• 2015: 7.6% cap rate / 12.1% unlevered IRR
• 2016: 7.3% cap rate / 8.5% unlevered IRR
• YTD 2017: 7.8% cap rate / 10.9% unlevered IRR
19
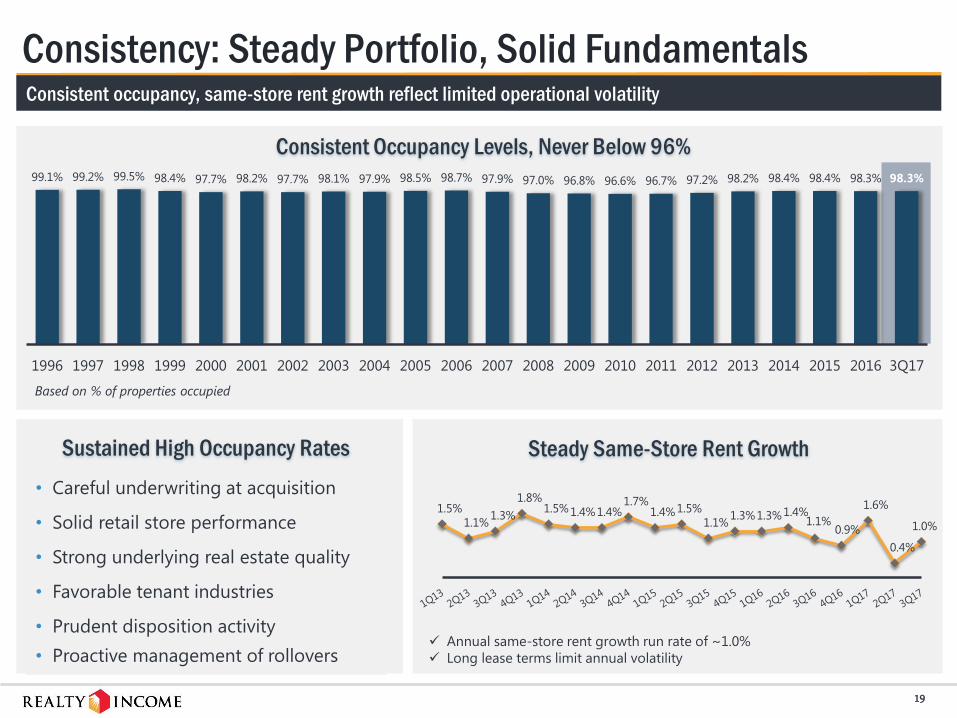
99.1% 99.2% 99.5% 98.4% 97.7% 98.2% 97.7% 98.1% 97.9% 98.5% 98.7% 97.9% 97.0% 96.8% 96.6% 96.7% 97.2% 98.2% 98.4% 98.4% 98.3% 98.3%
1996 1997 1998 1999 2000 2001 2002 2003 2004 2005 2006 2007 2008 2009 2010 2011 2012 2013 2014 2015 2016 3Q17
Based on % of properties occupied
Consistency: Steady Portfolio, Solid Fundamentals
• Careful underwriting at acquisition
• Solid retail store performance
• Strong underlying real estate quality
• Favorable tenant industries
• Prudent disposition activity
• Proactive management of rollovers
Steady Same-Store Rent Growth
Consistent occupancy, same-store rent growth reflect limited operational volatility
Consistent Occupancy Levels, Never Below 96%
1.5%
1.1%1.3%
1.8%1.5%1.4%1.4%
1.7%1.4%1.5%
1.1%1.3%1.3%1.4%
1.1%0.9%
1.6%
0.4%
1.0%
Annual same-store rent growth run rate of ~1.0%
Long lease terms limit annual volatility
Sustained High Occupancy Rates
20
INVESTMENT STRATEGY

21
Investment Strategy: Underwriting ApproachReal estate focused / Motivated to exceed long-term cost of capital
• Property attributes – Quality of real estate, age, size, fungibility
• Market review – Strategic locations critical to generating revenue
• Demographic analysis – Five-mile population density, household income, unemployment trends
• Valuation – Replacement cost, market rents, initial cash yield, IRR over initial lease term
• Property due diligence – Site visits, vehicle traffic, industry, property type, title, environmental, etc.
REAL ESTATE ANALYSIS
CREDIT ANALYSIS
• Financial review and analysis
• Tenant research – Reliable, sustainable cash flow
• Industry research – Defensive, resilient to macroeconomic volatility
• Discussion with key management representatives
Strong unit-level cash flow
coverage (specific to each industry)
Tenants with service, non-
discretionary, and/or low price
point component to their business
Favorable sales and demographic
trends
Significant markets (generally MSAs
of ≥350,000 people) and/or
mission critical locations
Primarily industrial and distribution
properties leased to Fortune 1000,
investment grade rated tenants
Long lease duration
Retail Non-Retail(principally Industrial)

22
Portfolio Highly Insulated From Retail E-Commerce and Economic Disruptors
97% of total portfolio rent is protected against retail e-commerce threats and economic downturns
20%Non-Retail
77%Retail tenants with at
least one of the following
components to their
business:
Service
Non-Discretionary
Low Price-Point
IG Rating
Insulated from E-commerce pressures
Fortune 1000 tenants
73% of rent from investment grade tenants
Primarily industrial distribution exposure
Service / Experiential
Difficult or impossible for
E-commerce to replicate
i.e. Gyms, Theaters
% of Total Portfolio Rent
Non-Discretionary Low Price Point
Lower volatility during periods of economic distress
Less incentive to price shop / immediacy a priority
i.e. Drug / Convenience / Dollar / Grocery Stores, QSR
Protects against one of the top drivers of retailer bankruptcies (high leverage)
Average annual default rates for speculative grade credits are ~40x higher than IG credits
Investment Grade-Rated
23
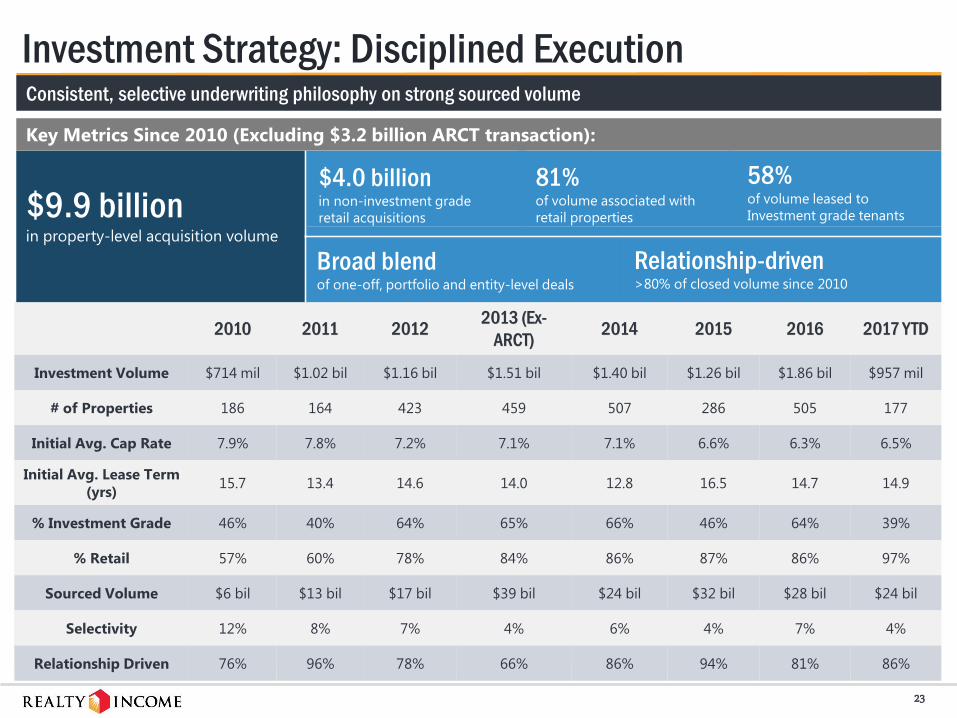
Investment Strategy: Disciplined ExecutionConsistent, selective underwriting philosophy on strong sourced volume
2010 2011 20122013 (Ex-
ARCT)2014 2015 2016 2017 YTD
Investment Volume $714 mil $1.02 bil $1.16 bil $1.51 bil $1.40 bil $1.26 bil $1.86 bil $957 mil
# of Properties 186 164 423 459 507 286 505 177
Initial Avg. Cap Rate 7.9% 7.8% 7.2% 7.1% 7.1% 6.6% 6.3% 6.5%
Initial Avg. Lease Term
(yrs)15.7 13.4 14.6 14.0 12.8 16.5 14.7 14.9
% Investment Grade 46% 40% 64% 65% 66% 46% 64% 39%
% Retail 57% 60% 78% 84% 86% 87% 86% 97%
Sourced Volume $6 bil $13 bil $17 bil $39 bil $24 bil $32 bil $28 bil $24 bil
Selectivity 12% 8% 7% 4% 6% 4% 7% 4%
Relationship Driven 76% 96% 78% 66% 86% 94% 81% 86%
$9.9 billionin property-level acquisition volume
$4.0 billionin non-investment grade
retail acquisitions
81%of volume associated with
retail properties
58%of volume leased to
Investment grade tenants
Broad blendof one-off, portfolio and entity-level deals
Relationship-driven>80% of closed volume since 2010
Key Metrics Since 2010 (Excluding $3.2 billion ARCT transaction):
24
CAPITAL STRUCTURE AND SCALABILITY

25
Conservative Capital Structure
Common Stock: $15.7 billion – 72.6%
• Shares/Units outstanding – 282 million
Debt: $5.9 billion – 27.4%
• Unsecured Ratings – A3 / BBB+ / BBB+
• Unsecured Notes/Bonds - $5.3 billion
• Unsecured Term Loans - $320 million
• Mortgages - $336 million
• Revolving Credit Facility - $0
Modest leverage, low cost of capital, ample liquidity provides financial flexibility
Debt 27.4%
Common
Stock
72.6%
Total Capitalization: $21.6 billion
Pro-forma for December 2017 activities and stock price as of 12/1/17:
• $1.3 billion bond offering
• $550 million 2019 notes redemption
26
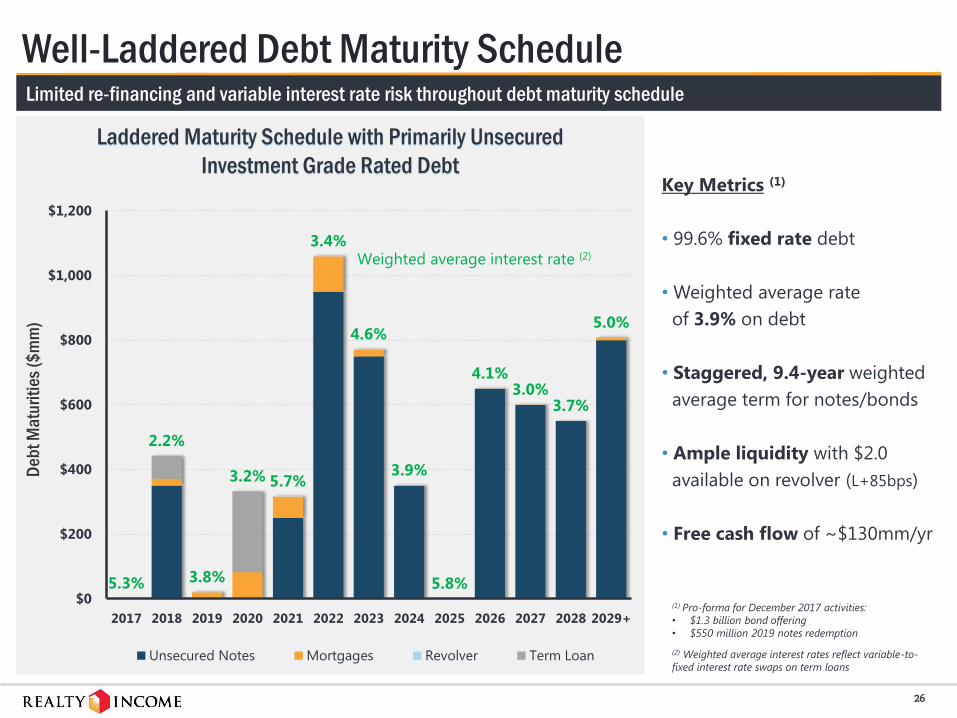
Well-Laddered Debt Maturity Schedule
Key Metrics (1)
• 99.6% fixed rate debt
• Weighted average rate
of 3.9% on debt
• Staggered, 9.4-year weighted
average term for notes/bonds
• Ample liquidity with $2.0
available on revolver (L+85bps)
• Free cash flow of ~$130mm/yr
Limited re-financing and variable interest rate risk throughout debt maturity schedule
5.3%
2.2%
3.8%
3.2% 5.7%
3.4%
4.6%
3.9%
5.8%
4.1%3.0%
3.7%
5.0%
$0
$200
$400
$600
$800
$1,000
$1,200
2017 2018 2019 2020 2021 2022 2023 2024 2025 2026 2027 2028 2029+
Unsecured Notes Mortgages Revolver Term Loan
Weighted average interest rate (2)
Laddered Maturity Schedule with Primarily Unsecured
Investment Grade Rated Debt
De
bt
Ma
turi
ties
($m
m)
(1) Pro-forma for December 2017 activities:
• $1.3 billion bond offering
• $550 million 2019 notes redemption
(2) Weighted average interest rates reflect variable-to-
fixed interest rate swaps on term loans

27
5.8%5.0%
G&A as % of Rental Revenue1
$2,211
$7,192Adjusted EBITDA per Employee ($000s)
59 bps
27 bps
G&A as % of EV (bps)
Scalability of Costs Contributes to Higher Relative Valuation
• Efficiency and scalability of business model leads net lease industry
• G&A expense should be treated the same as dollar of property-level cash flow
• Consensus NAV estimates generally exclude impact of G&A expenses, thus no explicit
“credit” for G&A efficiencies is recognized
• Capping G&A with real estate multiple degrades NAV/sh more for smaller portfolios
with less scalability
Relative NAV valuation comparisons should consider G&A efficiencies
Source: FactSet
103 bps
38 bps
G&A as % of Equity Mkt Cap
~93% EBITDA margins, never below 90% since 1998
1 G&A includes acquisition transaction costs; percentage of rental revenue calculation excludes tenant reimbursements from denominator
YTD figures represent MRQ annualized, where applicable
64 bps
39 bps
G&A as % of Gross RE Book Value (bps)
28
Business Plan
• Pay 12 monthly dividends
• Raise the dividend
• Remain disciplined in our acquisitions underwriting approach
• Acquire additional properties according to our selective investment strategy
• Maintain high occupancy through active portfolio management
• Maintain a conservative balance sheet
• Continue to grow investor interest in The Monthly Dividend Company®
NYSE: “O”