annual report - network waitaki · pdf file · 2017-07-13network waitaki limited...
TRANSCRIPT

for the year ended 31 March 2015
ANNUAL REPORT

Network Waitaki Limited Annual Report for the year ended 31 March 2015 1
CONTENTS
Directory 2
Annual Review 3
Senior Management 9
Directors’ Report 10
Company Trend Statement 13
Directors’ Responsibility Statement
14
FINANCIAL STATEMENTS
Statements of Comprehensive Income
15
Statements of Changes in Equity 15
Statements of Financial Position 16
Statements of Cash Flows 17
Notes to the Financial Statements
18
Performance Targets 38
Auditor’s Report 40

Network Waitaki Limited Annual Report for the year ended 31 March 2015 2
DIRECTORY
DIRECTORS: WAITAKI POWER TRUST TRUSTEES:
Mrs. C.M. Kearney (Chairman) Dr H.F. Brookes (Chairman)
Mr. D. Atkinson Mr. A.J. Brady
Mr. C. J. Dennison Mr. D. E. Norman
Mr. D.A. Ruddenklau Mr. H.J. Tonkin
Mr J.D. Walker Mr. J. Webster
Mr. A.J. Wood
SOLICITORS: AUDITORS:
Berry & Co., Eden Street Mark Bramley
Oamaru PricewaterhouseCoopers,
Dunedin
REGISTERED OFFICE: ON BEHALF OF THE Auditor-General
10 Chelmer Street, Oamaru
CHIEF EXECUTIVE Principal Bankers
Mr. G.B. Clark ANZ, The Octagon, Dunedin

Network Waitaki Limited Annual Report for the year ended 31 March 2015 3
ANNUAL REVIEW
The Directors’ and Chief Executive of the Network Waitaki Ltd are pleased to be able to present the Annual Report for the year ending 31
March 2015.
Network Waitaki Ltd is owned on behalf of consumers by the Waitaki Power Trust. Network Waitaki Contracting was merged with Network
Waitaki Limited on 31 March 2015.
Our commitment to consumers is to operate a safe, secure and cost-efficient electricity network that is able to meet growing customer demand
for electricity. We also, where appropriate, support the growth and wellbeing of the wider community.
Key Statistics as at 31 March 2015
Length of 33kV lines and cables 170 km
Length of 11kV lines and cables 1,425 km
Length of LV lines and cables 336 km
Number of zone substations 15
Number of connected customers 12,581
Coincident maximum demand 51 MW
Energy transported across the network 291 GWh
Distribution transformer capacity (distributor and customer owned) 188 MVA
Zone substation transformer capacity 188 MVA
Discount paid to consumers (excluding GST) $1.7 million
Number of employees 57
Safety The Board, Management and Staff of the Network Waitaki Ltd are fully focused on enhancing and developing a positive safety environment for
staff and the public.
Network Waitaki operates in a high risk industry and seeks to mitigate the potential for health and safety incidents. Policies, procedures and
staff training has been reviewed and undertaken. This initiative is ongoing and improvement is continuous.
Part of developing a safety culture within the Company is reporting and monitoring near miss incidents. These are the experiences that are
used for improvement and learning. Staff are encouraged to report and investigate these with the purpose of identifying cause and mitigating
risk.
Health and Safety actions this year include:
1. The Vault computer system for recording and tracking workplace safety and training data was installed;
2. Streamlining paperwork associated with safety reporting;
3. Vehicle training for staff in 4WD and 2WD vehicles; and
4. An Independent Safety Audit.

Network Waitaki Limited Annual Report for the year ended 31 March 2015 4
ANNUAL REVIEW (CONTINUED)
A concern is the number of incidents involving the public, which as can be seen from the table below, have been increasing gradually at a rate
of about 5 incidents per year since 2012. Activities related to Rural Farming, Construction and Trades and Motor Vehicles have been the main
contributors to the increase.
Summary of Electrical Accidents and Incidents Involving the Public
Activities 2009 2010 2011 2012 2013 2014 2015
Rural Farming 13 9 10 9 17 19 19
Construction and Trades 9 10 11 12 8 18 9
Leisure, Sports and Consumer/Residential 17 13 10 6 8 1 9
Vandalism 1 4 4 2 1
Motor Vehicles 14 13 9 13 13 13 19
Total 54 49 44 42 46 52 56
To raise public awareness of the hazards associated with working or playing in the proximity of electricity reticulation assets, Network Waitaki
has employed newspaper and radio safety advertisements such as the ones below.

Network Waitaki Limited Annual Report for the year ended 31 March 2015 5
ANNUAL REVIEW (CONTINUED)
Security SAIDI 2007 - 2008 2008 - 2009 2009 - 2010 2010 - 2011 2011 - 2012 2012 - 2013 2013 - 2014 2014-15
SAIDI Planned 24.14 10.76 14.68 11.38 13.52 4.84 7.69 12.95
SAIDI Unplanned 70.53 58.60 49.61 49.95 37.33 49.89 87.44 38.12
SAIDI Actual Total 94.67 69.36 64.29 61.33 50.85 54.73 95.13 51.07
SAIDI Normalised 76.01 59.29 64.28 61.33 50.85 54.73 81.40 51.07
SAIDI Target 100 100 100 90 90 81.07 116.5 116.5
SAIDI National Median 139.90 200.90 153.80 195.40 173.70 155.80 177.8 N/A
SAIFI 2007 - 2008 2008 - 2009 2009 - 2010 2010 - 2011 2011 - 2012 2012 - 2013 2013 - 2014 2014-15
SAIFI Actual 2.1 1.07 1.46 0.82 0.95 1.41 1.65 1.10
SAIFI Normalised 0.86 0.75 0.9 0.79 0.65 1.41 1.31 1.10
SAIFI Target 1.39 1.39 1.39 1.7 1.7 0.90 1.54 1.54
The Board are pleased to note the extremely favourable network performance figures over the year, despite challenging weather conditions.
External factors have a major influence on the reliability figures for the network. Tree management by the Company and cooperation by tree
owners is important to reduce outages to the minimum
The Company seeks to minimise outages to consumers by undertaking live line work and using generators where appropriate when
undertaking line work programmes.
Network maintenance and capital investment are important for a reliable and secure electricity supply to all consumers.
Capital Investment Capital Investment has been targeted to meet load demand in the hinterland with the growth of irrigation and dairying. Network investment
provides security of supply across the region.
Record units of electricity were distributed over the network this year with the increased demand due to dry weather conditions.
66kV Line Kurow to Duntroon
The major project commencing before the end of the financial year is the 66kV line being built from the Kurow substation to the Duntroon
substation. Completion date for the project is spring 2015.
Lake Waitaki Grid Exit Point
A larger transformer has been sited at the Lake Waitaki Grid Exit Point as a sub-transmission solution to transmission constraints on the
Oamaru Grid Exit Point. Load will be shifted away from Oamaru and supplied via Lake Waitaki.
Kurow Substation Upgrade
This upgrade forms the third part of improvement of security of supply to the Hakataramea Valley and Kurow area, replacement transformers
have been installed in the substation to increase capacity at this substation.
Asset Management Software
Investment in Asset Management software, TechOne, provides security of data and streamlining of internal Company systems. The
implementation and development of the project occurred in the financial year with the roll out starting in the 2015/16 financial year.
GIS Upgrade
The GIS product was upgraded during the year in preparation for integration to with Technology One Asset Management product in the
2015/16 year. This investment will allow the implementation of Software Mobility allowing information to be communicated between staff in the
field and the office.
Network Waitaki Limited Annual Report for the year ended 31 March 2015 6
ANNUAL REVIEW (CONTINUED)
Financial result The financial performance of the Company was higher than expected due to the positive contribution made by the contracting division, as well
as from an increase in Capital Contributions. Capital Contributions totalled $3,362,025 (2014 $1,459,782) and reflect a higher level of
consumer investment.
Consumers received a total discount of $1,728,625 excluding GST (2014 $1,676,203 excluding GST). The level of discount reflected the
decision to retain funds in the business in order to finance the 2015 investment in sub transmission assets and other developments to secure
the supply of electricity to the district.
A net profit before tax of $7,887,405 (2014 $3,858,693) was achieved.
Network Operations Capital expenditure amounted to $8,456,773 (2014 $5,070,677). Network capital expenditure amounted to $4,163,629.
Significant network capital expenditure is summarised below:
Projects include:
A GXP at Lake Waitaki
A Sub-station at Kurow
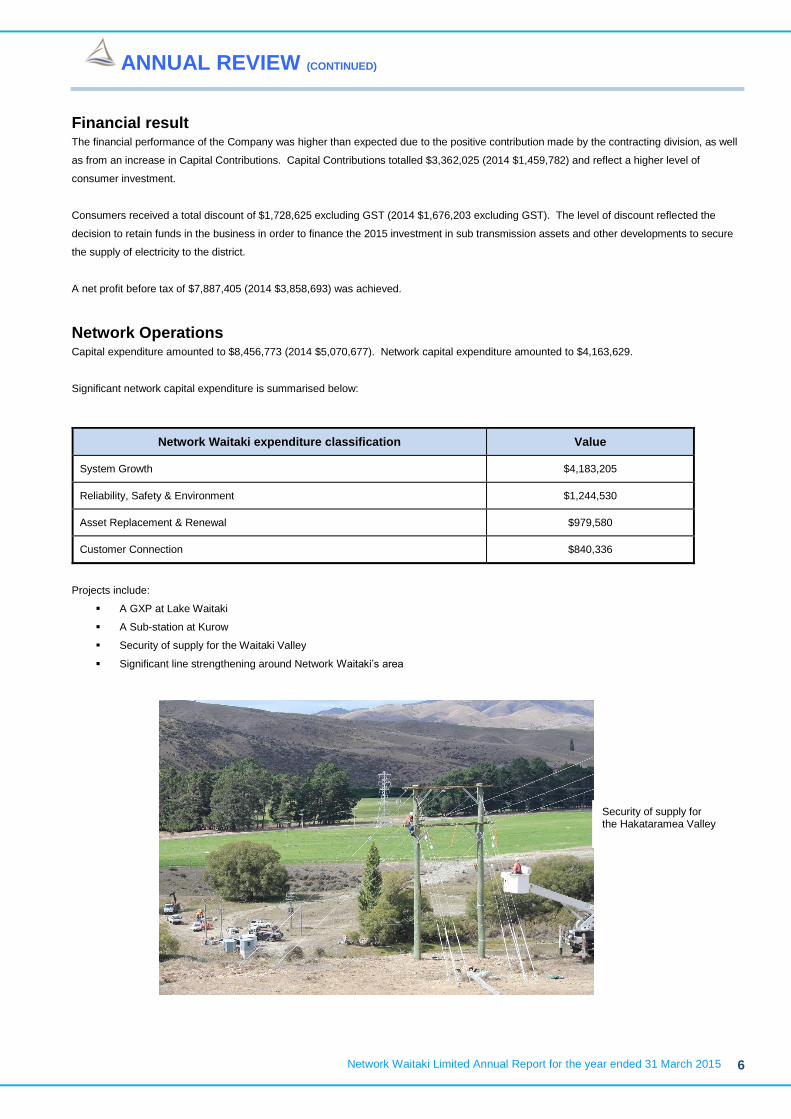
Security of supply for the Waitaki Valley
Significant line strengthening around Network Waitaki’s area
Network Waitaki expenditure classification Value
System Growth $4,183,205
Reliability, Safety & Environment $1,244,530
Asset Replacement & Renewal $979,580
Customer Connection $840,336
Security of supply for the Hakataramea Valley

Network Waitaki Limited Annual Report for the year ended 31 March 2015 7
ANNUAL REVIEW (CONTINUED)
Supporting Growth and Wellbeing of the Community
Sponsorship Grants
The Company supports a variety of organisations through an annual grant. . This year grants to the value of $84,779 were made. Significant
grants included:
North Otago Recreational Turf Trust 8,000 Summer Camp 2,000
North Otago Rugby Union 7,500 Union Cricket Club Inc 3,000
Victorian Town at Work 5,500 Oamaru Farmers' Market 1,800
North Otago Sports Bodies Assn. 4,000 Waitaki Community Gardens 2,303
North Otago Basketball Assoc 3,000 Waitaki Road Safe Inc 2,157
Otago Community Hospice Trust 3,000 Alzheimers Society Otago Inc 2,300
Sport Otago 3,000 Barnardos Oamaru 4,689
North Otago Search & Rescue Inc 2,500 Maheno Primary School 7,000
Waitaki Autism Chritable Trust 2,500 Mental Illness Waitaki Inc 2,400
Waitaki Boy's High School 2,500 Oamaru Intermediate School 5,000
Waitaki Girl's High School 2,500 St Patricks Scout Group 1,000
North Otago Electricity Heritage Trust 2,000 The House of Breakthrough Trust Oamaru 3,000
North Otago Youth Support 2,000 The NO Section of the NZ Alpine Club 1,885
Presbyterian Support Otago 2,000 Whitestone Taekwondo Club 1,108
Chairman, Mrs Kearney Unveiling a Plaque at Duntroon With Duntroon School Pupils

Network Waitaki Limited Annual Report for the year ended 31 March 2015 8
ANNUAL REVIEW (CONTINUED)
University Scholarship The university scholarship programme continues with another scholarship being awarded bring the
number scholarship recipients to three. This year Duncan McLeod was the worthy recipient.
Network Waitaki Ltd wishes Duncan all the best for his first year at Canterbury University studying
Electrical Engineering. Peter Knight, our original scholar, has joined the staff after completing his
B.E Hons (Electrical)
Staff Network Waitaki is fortunate to have a cohesive team of dedicated and skilled staff, committed to safety and delivery of services to consumers.
The increased level of capital investment has placed demands on staff to meet challenging timeframes and expectations. Without fail, over the
year, staff have risen to the challenge. The Board are very appreciative of the good work done by staff throughout the organisation.
A line mechanics team was again entered the ESITO Annual Connection line mechanic competition. The event was held in Christchurch and
competition was fierce. The team represented the Company very credibly gaining an overall fourth ranking whilst winning the Driving and
Chainsaw Safety sections and winning an award for the Best Presented Team.
Board The composition of the Board has remained with the Waitaki Power Trust re appointing Clare Kearney and Derek Atkinson to the Board.
The Board and Management seek to positively engage with the Waitaki Power Trust, as shareholders in the Company. The Board regularly
reports to the Trust, discussing any issues that are raised.
The Board would like to thank Graham Clark and the Network Waitaki team for their continued good work for the Company on behalf of
consumers.
Going forward The 2015/16 financial year starts as a merged network and contracting business.
As part of SmartCo, a combined electricity distribution company initiative, Network Waitaki moves this year to rolling out Smart Meters for
consumers. This is a major technological change for the company and is in response to a demand from the industry to provide real-time
electricity consumption data. Network Waitaki owns most of the existing meters in the network.
Further capital investment is planned in the Duntroon, Kurow and Papakaio areas.
Clare Kearney Graham Clark
Chairman Chief Executive

Network Waitaki Limited Annual Report for the year ended 31 March 2015 9
SENIOR MANAGEMENT
Graham Clark, CEO, BBS (Accounting), ANZIM
Graham manages the day to day operation of the Company having had a long association with Network Waitaki.
Glynne Lloyd, Network Manager, BE (Electrical), DipBusAdmin
Glynne heads the network engineering team which is responsible for the design and management of the distribution system.
Doreen Cleave, Finance Manager, BCom (Accounting), GradDipCom (Accounting)
Doreen is a Chartered Accountant and is responsible for providing financial services to the Company.
Jan deBruin, Commercial Manager, MA (Economics)
Jan is responsible for providing commercial and regulatory services to the Company.
Derek McGee, Manager of Network Waitaki Contracting
Derek heads the network contracting team which is responsible for the construction and management of electrical sub-transmission and distribution systems.
Stephen Murphy, ITT Manager, BCom (Inf Sci), DipGrad (Inf Sci), MusB, MIITP, ITCP
Stephen is responsible for the operation and management of the company’s information and communication assets.

Network Waitaki Limited Annual Report for the year ended 31 March 2015 10
DIRECTORS’ REPORT
DIRECTORS' INTERESTS The following Directors of Network Waitaki Limited have declared interests in identified entities as shareholder and/or director. The
declaration serves as notice that the Director may benefit from any transactions between Network Waitaki Limited and the identified
entities.
Clare Kearney (Chairman) Clare has been a member of the board since 2005 and Chairman from July 2008. Currently she is Chair of Sport Otago, a Trustee of Waitaki Safer Community Trust, a Trustee of KP & CM Kearney Family Trust, an Observer Director of Taieri Gorge Railway Limited, and a shareholder in Veterinary Centre Limited.
Derek Atkinson Derek has been a Director since June 2011.
John Walker John has been a Director since June 2005. He is Chairman of Whitestone Contracting Limited, and a Director/Shareholder of Mighty Mix Dog Food Limited.
Chris Dennison Chris has been a Director since June 2013. He is Chairman of Lower Waitaki Irrigation Company, a Director of Dennison Farms Limited and a Director of the Waitaki Irrigators Collective.
David Ruddenklau David joined the board in July 2011. He is a Director and Shareholder of Newhaven Farms Limited, Livingstone Creek Farm Limited, and Carhill Limited; a Shareholder of North Otago Irrigation Company; a Trustee for Springhill Forestry Limited, Pukeraro Trust and Otago/Southland Child Cancer Foundation; and a Restructuring Facilitator of Maerewhenua Irrigation.
Tony Wood Tony joined the board in July 2012. He is a Director and Shareholder of A J Wood Chartered Accountants Ltd, A J Wood Trustees Ltd (also Trustee to various Clients’ Family Trusts), Mackismith Properties Ltd, and a Trustee of Wood Family Trust. Tony is the Chairman of North Otago Search and Rescue.
Back row: Derek Atkinson, Tony Wood and David Ruddenklau. Seated: Chris Dennison, Clare Kearney (chairman) and John Walker

Network Waitaki Limited Annual Report for the year ended 31 March 2015 11
DIRECTORS’ REPORT (CONTINUED)
GENERAL DISCLOSURES
PRINCIPAL ACTIVITIES The principal activity of Network Waitaki Limited is ownership of its electricity distribution network.
REVIEW OF OPERATIONS The Operating Revenue (before customer discount) was $26,903,304 (2014 $21,825,234) for the year.
Operating Profit before Taxation is $7,887,405 (2014 $3,858,693).
SHARE CAPITAL Total issued and paid up capital as at 31 March 2015 was 14,000,000 Ordinary Fully-Paid Shares. There has been no movement in Share Capital
during the year.
USE OF COMPANY INFORMATION There were no notices from Directors of Network Waitaki Limited or a Director of a related body corporate requesting to use company
information received in their capacity as Directors which would not otherwise have been available to them.
DIVIDENDS No dividend was declared for the 2015 year, (2014 NIL)
DISCOUNT A discount (excluding GST) of $1,728,625 has been paid to Customers (2014 $1,676,203).
DONATIONS The company made donations totaling $84,779 in the year (2014 $77,997).
CORPORATE GOVERNANCE The Network Waitaki Limited operates under a set of corporate governance principles designed to ensure the Company is effectively managed.
Board of Directors
The Board is the governing body of the company and currently has six members. The Board is appointed by the shareholders to oversee the
management of the Company and is responsible for all corporate governance matters. The Board endeavours to ensure that the activities undertaken
are carried out in the best interests of all shareholders, while respecting the rights of other stakeholders. The Board met twelve times during the
financial year.
Responsibilities
The Board is responsible for the management, supervision, regulatory compliance, health and safety, and direction of the Company. This incorporates
the long-term strategic financial plan, strategic initiatives, budgets and the policy framework. The Board has developed and maintains clear policies
which define the individual and collective responsibilities of the Board and management.

Network Waitaki Limited Annual Report for the year ended 31 March 2015 12
DIRECTORS’ REPORT (CONTINUED)
REMUNERATION OF DIRECTORS
Total Directors’ fees paid $ Mrs. C.M. Kearney 44,375 Mr. D. Atkinson 28,625
Mr. D.A. Ruddenklau 28,625 Mr. C.J. Dennison 28,625
Mr. J.D. Walker 28,625 Mr. A.J. Wood 28,625
Total Directors’ fees 187,500
EMPLOYEE REMUNERATION The Companies Act 1993 requires the number of employees receiving remuneration greater than $100,000 to be disclosed. Two employees
within the Network Waitaki Limited received remuneration in the range of $100,000 to $110,000, three employees received remuneration in the
range of $110,000 to $120,000, two employees received remuneration in the range of $120,000 to $130,000, one employee received
remuneration in the range of $150,000 to $160,000 and one employee received remuneration in the range of $220,000 to $230,000.
INDEMNIFICATION AND INSURANCE OF OFFICERS AND DIRECTORS The Company continues to indemnify all Directors named in this report against any liability to any person other than Network Waitaki Limited or
a related company for any act done or omission made in a Director's capacity as a Director of Network Waitaki Limited, and all costs incurred
in defending or settling any claim or proceedings related to such liability, unless the liability is criminal liability or liability for breach of Section
131 of the Companies Act 1993.
During the financial year, the Network Waitaki Limited paid insurance premiums in respect of Directors’ and Officers’ liability insurance. The
policies do not specify the premium for individual Directors and executive officers.
The Directors’ and Officers’ liability insurance provides cover against all costs and expenses involved in defending legal actions and any
resulting payments arising from a liability to persons (other than Network Waitaki Limited or a related body corporate) incurred in their position
as Director or executive officer unless the conduct involves a willful breach of duty or an improper use of inside information or position to gain
advantage.
EVENTS SUBSEQUENT TO BALANCE DATE Network Waitaki Contracting Limited amalgamated with Network Waitaki Limited at the end of the 2015 financial year. The Directors are not
aware of any other matter or circumstance since the end of the financial year, not otherwise dealt with in this report that has significantly
affected or may significantly affect the operation of Network Waitaki Limited, the results of those operations or the state of affairs of Network
Waitaki Limited.
AUDITORS In accordance with Section 45 of the Energy Companies Act 1992, the Controller and Auditor-General are responsible for the audit of Network
Waitaki Limited. In accordance with Section 29 of the Public Finance Act 1977, the Controller and Auditor-General have contracted the audit of
Network Waitaki Limited to Mark Bramley using the staff and resources of PricewaterhouseCoopers. The auditor’s fee for 2014/15 was
$52,075.
Clare Kearney Tony Wood Chairman Director

Network Waitaki Limited Annual Report for the year ended 31 March 2015 13
TREND STATEMENT
2015 2014 2013 2012 2011 2010
$’000
$’000
$’000
$’000
$’000
$’000 FINANCIAL PERFORMANCE
Operating Revenue
26,903 21,825 19,305 16,322 16,382 16,062 Operating Surplus before Tax and
before Associated Earnings
7,887 3,859 3,344 1,860 2,408 2,970 Associate Company Earnings
0 0 0 0 0 0 Operating Profit before Tax
7,887 3,859 3,344 1,860 2,408 2,970 Taxation
(2,137) (1,163) (955) (261) (1,052) (382) Net Surplus
5,750 2,696 2,389 1,599 1,356 2,588 Shareholders’ Distributions
0 0 0 0 0 1,250 Customer Discounts
1,729 1,676 2,023 1,873 2,367 2,164 FINANCIAL POSITION Current Assets
15,122 12,416 11,119 8,387 8,379 10,838 Non-Current Assets
79,946 74,039 72,246 71,150 71,049 65,656 Total Assets
95,068 86,455 83,365 79,537 79,428 76,494 Liabilities
17,867 14,940 14,546 13,108 14,887 13,309 Net Assets
77,265 71,515 68,819 66,429 64,541 63,185 Share Capital
14,571 14,571 14,571 14,571 14,571 14,571 Reserves
0 0 0 0 0 0 Retained Earnings
62,694 56,944 54,248 51,858 49,970 48,614
Equity
77,265 71,515 68,819 66,429 64,541 63,185 FINANCIAL RATIOS Accounting Return on Total Assets
Before Discount
7.86% 5.06% 5.29% 4.37% 4.69% %
5.36% After Discount
6.04% 3.12% 2.87% 2.01% 1.71% 3.38% Accounting Return on Equity
Before Discount
9.68% 6.11% 6.44% 5.25% 5.77% 6.49% After Discount
7.44% 3.77% 3.49% 2.42% 2.10% 4.10% NPAT to Shareholders Funds
7.44% 3.77% 3.49% 2.42% 2.10% 4.10% Current Ratio
3.23 4.60 3.86 4.47 2.53 4.63 NPAT Earnings Per Share in Cents
Before Discount
53.42 31.23 31.52 24.80 26.60 29.31 After Discount
41.07 19.26 17.07 11.42 9.69 18.49 Net Assets Per Share $5.51 $5.11 $4.89 $4.74 $4.61 $4.51
STATISTICS SAIDI (normalized)
51.07 79.62 54.73 50.85 61.33 64.28 SAIFI (normalized)
1.10 1.28 1.41 0.65 0.79 0.90 CAIDI
46.60 62.31 38.80 78.23 77.63 71.42 Direct Line Cost per km of line
$1,931 $1,710 $1,421 $1,483 $1,168 $1,333 Indirect Line Cost per Consumer
$110 $92 $83 $81 $64 $69

Network Waitaki Limited Annual Report for the year ended 31 March 2015 14
DIRECTORS’ RESPONSIBILITY STATEMENT
The Directors are responsible for ensuring that the financial statements give a true and fair view of the financial position of the Network Waitaki
Limited as at 31 March 2015 and its financial performance and cash flows for the year ended on that date.
The Directors consider that the financial statements of the Network Waitaki Limited have been prepared using appropriate accounting policies
consistently applied and supported by reasonable judgments and estimates, and that all relevant reporting and accounting standards have
been followed.
The Directors believe that proper accounting records have been kept which enable, with reasonable accuracy, the determination of the
financial position of the Network Waitaki Limited and facilitate compliance of the financial statements with the Financial Reporting Act 1993.
The Directors consider they have taken adequate steps to safeguard the assets of the Network Waitaki Limited and to prevent and detect fraud
and other irregularities.
The Directors have pleasure in presenting the Financial Statements of Network Waitaki Limited for the year ended 31 March 2015.
The Board of Directors of Network Waitaki Limited authorises these Financial Statements for issue on 25 May 2015.
For and on behalf of the Board of Directors
Clare Kearney Tony Wood Chairman Director

Network Waitaki Limited Annual Report for the year ended 31 March 2015 15
STATEMENTS OF CHANGES IN EQUITY for the year ended 31 March 2015
COMPANY Share
Capital $
Retained Earnings
$
Total Equity
$ Balance at 1 April 2013 14,571,119 54,247,392 68,818,511 Profit for the year, being total comprehensive income - 2,696,045 2,696,045 Balance at 31 March 2014 14,571,119 56,943,437 71,514,556 Balance at 1 April 2014 14,571,119 56,943,437 71,514,556 Profit for the year, being total comprehensive income - 5,749,557 5,749,557 Balance at 31 March 2015 14,571,119 62,692,994 77,264,113
These financial statements should be read in conjunction with the attached notes.
STATEMENTS OF COMPREHENSIVE INCOME for the year ended 31 March 2015
Notes 2015
$ 2014 $
Operating Revenue 2 26,903,304 21,825,234 Less Customer Discount (1,728,625) (1,676,203) Operating Revenue after Customer Discount 25,174,679 20,149,031 Less Operating Expenses 3 (5,974,247) (6,105,634) Transmission Costs (4,998,747) (4,725,369) Employee Costs (2,532,551) (2,059,582) Depreciation, Amortisation and Impairment 4 (3,781,729) (3,399,753) Operating Profit Before Tax 7,887,405 3,858,693 Taxation 5 (2,137,848) (1,162,648) Net Profit for the Year 5,749,557 2,696,045 Total Comprehensive Income 5,749,557 2,696,045

Network Waitaki Limited Annual Report for the year ended 31 March 2015 16
These financial statements should be read in conjunction with the attached notes.
STATEMENTS OF FINANCIAL POSITION
as at 31 March 2015
Notes 2015
$ 2014
$
ASSETS CURRENT ASSETS Cash and Cash Equivalents 8,150,496 825,465 Short Term Deposits 3,503,602 9,390,324 Trade and Other Receivables 6 2,859,357 1,637,981 Inventories 9 502,179 402,568 Work in Progress ,5,523 23,323 Deferred Tax 5 164,392 136,364 TOTAL CURRENT ASSETS 15,185,549 12,416,025 NON-CURRENT ASSETS Property, Plant and Equipment 7 78,656,765 73,037,102 Intangible Assets 8 786,865 349,443 Inventories 9 502,260 652,204 TOTAL NON-CURRENT ASSETS 79,945,890 74,038,749 TOTAL ASSETS 95,131,439 86,454,774 LIABILITIES CURRENT LIABILITIES Trade and Other Payables 10 3,816,456 2,218,301 Employee Entitlements 11 580,941 486,777 Taxation Payable 297,744 (6,196) TOTAL CURRENT LIABILITIES 4,695,141 2,698,882 NON-CURRENT LIABILITIES Loan from Waitaki Power Trust 15 1,150,000 1,150,000 Deferred Tax 5 12,022,185 11,091,336 TOTAL NON-CURRENT LIABILITIES 13,172,185 12,241,336 TOTAL LIABILITIES 17,867,326 14,940,218 EQUITY Share Capital 12 14,571,119 14,571,119 Retained Earnings 13 62,692,994 56,943,437 TOTAL SHAREHOLDERS’ EQUITY
77,264,113 71,514,556
TOTAL LIABILITIES AND SHAREHOLDERS’ EQUITY
95,131,439 86,454,774

Network Waitaki Limited Annual Report for the year ended 31 March 2015 17
STATEMENTS OF CASH FLOWS for the year ended 31 March 2015
These financial statements should be read in conjunction with the attached notes.
Note 2015
$ 2014 $
CASH FLOWS FROM OPERATING ACTIVITIES Cash was Provided from: Receipts from Customers 25,068,500 20,084,173 Interest Received 392,989 399,455 25,461,488 20,483,628 Cash was Disbursed to: Payments to Suppliers and Employees (13,623,661) (13,110,087) Income Tax Paid (931,087) (873,121) Net GST Paid (35,087) 5,767 (14,589,841) (13,977,441) NET CASH FROM OPERATING ACTIVITIES 14 10,871,648 6,506,187
CASH FLOWS FROM INVESTING ACTIVITIES Cash was Provided from: Proceeds of Sale of Assets 17,863 -
17,863 - Cash was Applied to: Purchase of Property, Plant and Equipment and Intangible Assets (9,451,197) (5.205,145) (9,451,197) (5,205,145) NET CASH FROM INVESTING ACTIVITIES (9,433,334) (5,205,145)) CASH FLOWS FROM FINANCING ACTIVITIES Cash was Provided from: Repayment of Loan - - Dividend from Network Waitaki Contracting Ltd - - - - NET CASH FROM FINANCING ACTIVITIES - - NET INCREASE/(DECREASE) IN CASH HELD 1,438,314 1,301,042
Cash and Cash Equivalents at Beginning of the Year 10,215,784 8,914,742 CASH, CASH EQUIVALENTS AND DEPOSITS ON CALL AT END OF THE YEAR
11,654,098 10,215,784

Network Waitaki Limited Annual Report for the year ended 31 March 2015 18
NOTES TO THE FINANCIAL STATEMENTS
1 SIGNIFICANT ACCOUNTING POLICIES
ENTITY REPORTING Network Waitaki Limited is a consumer trust-owned electricity distribution network operator in North Otago. The Company’s registered office is
10 Chelmer Street, Oamaru, New Zealand.
PARENT TRUST The parent trust is the Waitaki Power Trust.
GENERAL INFORMATION The Parent is a limited liability company incorporated and domiciled in New Zealand.
STATEMENT OF COMPLIANCE WITH NZ IFRS Basis of Preparation The financial statements have been prepared in accordance with Generally Accepted Accounting Practice in New Zealand (NZ GAAP). They
comply with New Zealand equivalents to International Financial Reporting Standards (NZ IFRS) as applicable for profit-oriented entities.
The company is eligible and has elected to report in accordance with Tier 2 for-profit accounting standards, NZ IFRS Reduced Disclosure
Regime (NZ IFRS RDR) on the basis that the company has no public accountability and is not a large public sector nonprofit entity.
In adopting NZ IFRS RDR, the company has taken a number of disclosure concessions.
NEW STANDARDS FIRST APPLIED IN THE PERIOD
The company has adopted External Reporting Board Standard A1 Accounting Standards Framework (For-profit Entities Update) (XRB A1).
XRB A1 establishes a for-profit tier structure and outlines which suite of accounting standards entities in different tiers must follow. The
company is eligible and has elected to report in accordance with Tier 2 For-profit Accounting Standards (NZ IFRS RDR). In adopting NZ IFRS
RDR, the company has taken advantage of a number of disclosure concessions. There were no other impacts on the current or prior year
financial statements of the Company’s transition to NZ IFRS RDR.
DATE OF ISSUE FOR THE FINANCIAL STATEMENTS These financial statements have been approved for issue by the Board of Directors on 25 May 2015. The entity’s owners do not have the
power to amend the financial statements after its issue.
PROFIT-ORIENTED ENTITY The Company is a profit-oriented entity for the purpose of complying with NZ IFRS.
STATUTORY BASE Network Waitaki Limited is:
a New Zealand registered company under the Companies Act 1993,
an energy company as defined in the Energy Companies Act 2013.
The financial statements have been prepared in accordance with the requirements of the Financial Reporting Act 2013, the Companies Act
1993 and the Energy Companies Act 1992.
FUNCTIONAL AND PRESENTATION CURRENCY The Company’s financial statements are presented in whole New Zealand dollars, which is the Company’s functional and presentation
currency.

Network Waitaki Limited Annual Report for the year ended 31 March 2015 19
NOTES TO THE FINANCIAL STATEMENTS (CONTINUED)
1 SIGNIFICANT ACCOUNTING POLICIES (CONTINUED)
MEASUREMENT BASE The financial statements have been prepared on the historical cost basis, and its modification by the revaluation of certain assets as identified
in specific accounting policies below. Accounting policies adopted and applied ensure that the resulting financial information satisfies the
concepts of relevance and reliability, thereby ensuring that the substance of the underlying transactions or other events is reported.
CRITICAL ACCOUNTING ESTIMATES AND JUDGMENTS IN APPLYING THE ENTITY’S ACCOUNTING POLICIES The preparation of financial statements in conformity with NZ IFRS requires management to make certain critical accounting estimates and
judgments that affect the application of policies and the reported amount of assets, liabilities, income and expenses. The estimates and
associated assumptions have been based on historical experience and other factors that are believed to be reasonable in the circumstances.
These estimates and judgments form the basis for the carrying values of assets and liabilities where these are not readily apparent from other
sources. Actual results may differ from these estimates.
Estimates and underlying judgments are regularly reviewed. Any changes to estimates are recognised in the period if the change affects that
period, or in future periods if the change also affects future periods.
In the process of applying the Company’s accounting policies, management has made the following estimates and judgments that have had
the most significant impact on the amounts recognised in these financial statements,
Network reticulation assets
Network reticulation assets are depreciated at the rates provided by the ODV handbook issued by the Commerce Commission in 2004.
Easements
Easements are recorded at cost.
GOODS AND SERVICES TAX (GST) The Statement of Comprehensive Income and Statement of Cash Flows have been prepared so that all components are stated exclusive of
GST. All items in the Statement of Financial Position are stated net of GST, with the exception of receivables and payables.
REVENUE Sale of goods
Revenue from the sale of goods is recognised in the Statement of Comprehensive Income when the significant risks and rewards of ownership
have been transferred to the consumer. No revenue is recognised if there are significant uncertainties regarding recovery of the consideration
due, associated costs or the possible return of goods, or where there is continuing management involvement with the goods.
Services supplied
Revenue from the sale of services is recognised in the Statement of Comprehensive Income when it is probable that the economic benefits
associated with the transaction will flow to the company. No revenue from services supplied is recognised when the stage of completion of the
transaction cannot be measured reliably or the amount of revenue from the transaction cannot be reliably measured.
Investment income
Interest is recognised using the effective interest method.
Dividends are recognised when the right to receive payment is established.
Rental income is recognised on an accrual basis in accordance with the substance of the relevant agreements.
Lease income
Revenues from operating leases are recognised on a straight line basis over the period between rental reviews.

Network Waitaki Limited Annual Report for the year ended 31 March 2015 20
NOTES TO THE FINANCIAL STATEMENTS (CONTINUED)
1 SIGNIFICANT ACCOUNTING POLICIES (CONTINUED)
Customer contributions
Contributions from customers in relation to the construction of new lines for the network are accounted for as income in the year in which the
Company completes the actual work.
Construction Contracts
Revenue from construction contracts is recognised by reference to the recoverable cost incurred during the period plus the percentage of fees
earned.
When a loss is expected to occur, it is recognised immediately.
INCOME TAX Income tax expense in relation to the profit or loss for the period comprises current tax and deferred tax.
Current tax is the amount of income tax payable on the taxable profit from the current year, plus any adjustments to income tax payable in
respect of the prior year. Current tax is calculated using rates that have been enacted or substantially enacted by balance date.
Deferred tax is the amount of income tax payable or receivable in future periods in respect of temporary differences and unused tax losses.
Temporary differences are differences between the carrying amount of assets and liabilities in the financial statements and the corresponding
tax bases used in the computation of taxable profit.
Deferred income tax assets are recognised to the extent that it is probable that future taxable profit will be available against which the
temporary differences can be utilised.
Deferred income tax is provided on temporary differences arising on investments in associates, except where the timing of the reversal of the
temporary difference is controlled by the Company and it is probable that the temporary difference will not reverse in the foreseeable future.
CAPITAL AND OPERATING EXPENDITURE Capital expenditure relates to expenditure incurred in the creation of a new asset and expenditure incurred on existing reticulation system
assets to the extent the system is enhanced.
Operating expenditure relates to expenditure incurred in maintaining and operating the property, plant and equipment and investment
properties of the Company.
DIVIDENDS Provision is made for the amount of any dividend declared on or before the end of the financial year but not distributed at balance date.
Distribution of dividends to the Company shareholders is recognised as a liability in the Company’s financial statements in the period in which
the dividends are approved by the Board of Directors.
CASH AND CASH EQUIVALENTS Cash and Cash Equivalents include cash on hand, deposits held at call with financial institutions, other short-term, highly liquid investments
with original maturities of three months or less that are readily convertible to known amounts of cash and which are subject to an insignificant
risk of changes in value, and bank overdrafts.
CURRENT INVESTMENTS Current investments comprise cash deposits held with financial institutions with an original maturity greater than three months and less than
twelve months.
HELD FOR SALE ASSETS An asset is classified as ‘held for sale’ if its carrying amount will be recovered principally through a sale rather than continuing use. On
classification as ‘held for sale’, assets are recognised at the lower of carrying amount and fair value less costs to sell. Impairment losses on
initial classification as ‘held for sale’ are included in the Statement of Comprehensive Income.

Network Waitaki Limited Annual Report for the year ended 31 March 2015 21
NOTES TO THE FINANCIAL STATEMENTS (CONTINUED)
1 SIGNIFICANT ACCOUNTING POLICIES (CONTINUED)
WORK IN PROGRESS Work in progress is stated at actual direct costs incurred, less non-recoverable amounts.
CAPITAL RISK MANAGEMENT The Company’s objective when managing capital, which comprises share capital plus retained earnings, is to safeguard the ability to continue
as a going concern and to provide acceptable returns to shareholders.
The Company is not subject to any externally imposed capital requirements.
In order to maintain or adjust the capital structure, the Company may adjust the amount of discount paid to customers.
TRADE RECEIVABLES Trade receivables are recognised initially at fair value and subsequently measured at amortised cost, less provision for impairment. A provision
for impairment of trade receivables is established when there is objective evidence that the Company will not be able to collect all amounts due
according to the original terms of the receivables. The amount of the provision is the difference between the assets’ carrying amount and
realisable value. The amount of the provision is recognised in the Statement of Comprehensive Income.
PROPERTY, PLANT AND EQUIPMENT Property, plant and equipment comprise mainly buildings, land, meters and relays, and office equipment. Buildings, meters and relays
purchased prior to the adoption of NZ IFRS, 1 April 2006, are shown at ‘deemed cost’ less subsequent depreciation and impairment write-
down. Land purchased prior to 1 April 2006 is shown at deemed cost.
Property, Plant and Equipment acquired subsequent to the adoption of ‘deemed cost’, after 1 April 2006, is recorded at the value of the
consideration given to acquire the assets, plus the value of other directly attributable costs which have been incurred in bringing the assets to
the location and condition necessary for their intended service, less subsequent depreciation and impairment write-down.
Network Reticulation Assets comprises mainly Low Voltage, 11kV, 33kV and LV conductor and associated transformers and substations.
Reticulation assets are shown at deemed cost less subsequent depreciation and impairment write-down.
Network Reticulation Assets acquired subsequent to the adoption of ‘deemed cost’ are recorded at the value of the consideration given to
acquire the assets and the value of other directly attributable costs which have been incurred in bringing the assets to the location and
condition necessary for their intended service less subsequent depreciation and impairment write-down.
Capital Contributions are amortised over 10 years.
Easements Assets sited on easements will normally be renewed at the end of their economic life in the same location in which they are
currently housed. On this basis, the easement itself has an indefinite life. Annually, easements are tested for signs of impairment.
Contracting Equipment comprises mainly plant and equipment used in the construction and repair of network reticulation systems. Items are
recorded at the value of the consideration given to acquire the assets and the value of directly attributable costs which have been incurred in
bringing the assets to the location and condition necessary for their intended service less subsequent depreciation and impairment write-down.
Depreciation of Property, Plant and Equipment Depreciation is provided on all property, plant and equipment, other than freehold land, at
rates that will allocate the assets’ cost or valuation, to their residual values, over their estimated lives. All network reticulation system assets
and contracting equipment assets are depreciated on a straight line basis; other assets are depreciated using both straight line and diminishing
value.

Network Waitaki Limited Annual Report for the year ended 31 March 2015 22
NOTES TO THE FINANCIAL STATEMENTS (CONTINUED)
1 SIGNIFICANT ACCOUNTING POLICIES (CONTINUED)
Depreciation of Property, Plant and Equipment (continued)
The following depreciation rates have been used:
Item Depreciation rate
Contracting Equipment 6.0% to 30.0%
Distribution System 1.4% to 10.0%
Fibre Network 7.0%
Freehold Buildings 1.25% to 2.5%
Motor Vehicles 13.5% to 26.0%
Plant and Equipment 5.0% to 80.0%
Office Furniture and Equipment 8.0% to 40.0%
Gains and losses on disposal of property, plant and equipment are taken into account in determining the operating result for the year.
INTANGIBLE ASSETS Intangible Assets consist solely of computer software, which is recorded at the value of the consideration given to acquire the assets plus the
value of other directly attributable costs which have been incurred in bringing the assets to the location and condition necessary for their
intended service.
Amortisation of intangible assets is provided for at rates that will allocate the assets’ cost or valuation, to their residual values, over their
estimated lives. All intangible assets are amortised on a straight line basis.
Intangible assets are carried at cost less accumulated amortisation.
The following amortisation rates have been used:
Item Amortisation rate
Computer Software 24% to 48%
IMPAIRMENT Assets that have an indefinite useful life, for example easements, are not subject to depreciation and are tested annually for impairment.
Assets that are subject to depreciation or amortisation are reviewed for impairment whenever events or changes in circumstances indicate that
the carrying amount may not be recoverable. An impairment loss is recognised for the amount by which the asset’s carrying amount exceeds
its recoverable amount. The recoverable amount is the higher of an asset’s fair value less cost to sell and value in use. For the purpose of
assessing impairment, assets are grouped at the lowest levels for which there are separately identifiable cash flows (cash-generating units).
Non-financial assets that have suffered impairment are reviewed for possible reversal of the impairment at each reporting date.
INVENTORIES Inventories are valued at the lower of cost and net realisable value, with additional allowance for obsolescence where necessary. The cost of
finished goods comprises direct materials and, where applicable, direct labour and other direct variable costs incurred in order to bring
inventories to their present location and condition. Costs are assigned to individual items of inventory on a weighted average cost basis.
Non-current inventories are exclusively used in the production of the Company’s non-current assets.
BORROWING COSTS Borrowing costs for assets are capitalised when the construction period of qualifying assets is greater than nine months. The capitalisation
rate used to determine the amount of borrowing costs eligible for capitalisation is the current cost of borrowing from financial markets.

Network Waitaki Limited Annual Report for the year ended 31 March 2015 23
NOTES TO THE FINANCIAL STATEMENTS (CONTINUED)
1 SIGNIFICANT ACCOUNTING POLICIES (CONTINUED)
BORROWINGS Borrowings are initially measured at fair value plus transaction costs.
Borrowings are classified as current liabilities unless the Company has an unconditional right to defer settlement of the liability for at least
12 months after the balance date.
Any difference between the proceeds (net of transaction costs) and the redemption amount is recognised in the Statement of Comprehensive
Income over the period of the borrowings, using the effective interest method.
FINANCIAL ASSETS The only financial assets that the Company has are loans and receivables. Regular way purchases and sales of financial assets are
accounted for at trade date.
Loans and receivables
Loans and receivables are non-derivative financial assets with fixed or determinable payments that are not quoted in an active market. They
are included in current assets, except for maturities greater than 12 months after the balance sheet date. These are classified as non-current
assets. The Company’s loans and receivables comprise ‘trade and receivables’, current investments and cash and cash equivalents in the
Statement of Financial Position.
FINANCIAL RISK MANAGEMENT Risk management is carried out by management under policies approved by the Board of Directors. Management identifies and evaluates
relevant financial risks and acts to manage these risks where possible within the parameters set out by the board of directors. The board
provides written principles for overall risk management, as well as policies covering specific areas, such as foreign exchange risk and credit
risk.
Market risk (i) Foreign exchange risk
The Company’s revenue is entirely denominated in New Zealand dollars and it has limited currency exposure in the foreseeable future. The
Company may from time to time purchase assets denominated in foreign currency. Board approval is required for foreign currency-
denominated contracts valued above a specified threshold, together with a recommendation on the manner in which the foreign currency
exposure is to be managed, which may include the use of foreign exchange contracts.
(ii) Cash flow and fair value interest rate risk
Apart from a loan from the Waitaki Power Trust, the Company has no interest risk from long-term borrowing. The loan from the shareholder is
an unsecured loan with interest charged at a commercial rate. Board approval is required for borrowings, together with a recommendation on
the manner in which the interest rate risk is to be managed.
Credit risk
Credit risk is managed by the Company under policy approved by the board. Credit risk arises from cash and cash equivalents and deposits
with banks, as well as credit exposure to customers, including outstanding receivables and committed transactions. For banks and financial
institutions, only independent parties with a minimum Standard and Poor’s rating of BBB for long-term investments and A-2 for short-term
investment, or financial institutions that provide well-supported first ranking security, are acceptable. Investments with banks and financial
institutions are limited to a term of no more than 24 months and no more than $3 million or 25% of current investments, whichever is the
greater, in any one institution. Credit risk associated with trade receivables is limited through electricity retailer invoicing for line and metering
charges rather than individual consumer invoicing for line and metering charges. Credit risk is also limited in trade receivables by the
requirement of a minimum of 50% deposit of the total cost of new connections before work is started.

Network Waitaki Limited Annual Report for the year ended 31 March 2015 24
NOTES TO THE FINANCIAL STATEMENTS (CONTINUED)
1 SIGNIFICANT ACCOUNTING POLICIES (CONTINUED)
Liquidity risk
Cash flow forecasting is performed in the operating entities of the Company. The Company monitors its rolling forecast liquidity requirements to
ensure it has sufficient cash to meet operational needs while maintaining sufficient headroom at all times. Such financial forecasting takes into
consideration the Company’s debt financing plans and compliance with the Statement of Corporate Intent.
Surplus cash held by the operating entities over and above the balance required for working capital management is invested in interest-bearing
call accounts and term deposits.
Note 19 analyses the Company’s non-derivative financial liabilities and net-settled derivative financial liabilities into relevant maturity groupings
based on the remaining period, at the statement of financial position date to the contractual maturity date. Derivative financial liabilities are
included in the analyses if their contractual maturities are essential for an understanding of timing of the cash flows. The amounts disclosed in
the table are contractual undiscounted cash flows.
Fair value estimation
The fair value of financial assets and liabilities must be estimated for recognition and measurement and for disclosure purposes.
The fair value for any financial instruments that are not traded in an active market is determined using valuation techniques. The Company
uses a variety of methods and makes assumptions that are based on market conditions existing at each balance date.
FOREIGN CURRENCY TRANSACTIONS Transactions denominated in foreign currencies are translated into the reporting currency using the exchange rate in effect at the transaction
date. Foreign currency monetary items at balance date are translated at the exchange rate in effect at the balance date. Non-monetary assets
and liabilities carried at fair value that are denominated in foreign currencies are translated at the rates ruling at the date when the fair value is
determined.
Exchange differences on foreign currency balances are recognised in the Statement of Comprehensive Income in the period that they occur.
TRADE AND OTHER PAYABLES Trade and Other Payables are recognised when the Company becomes obliged to make future payments resulting from the purchase of goods
and services. Trade and Other Payables are recognised at fair value.
PROVISIONS Provisions are recognised when the Company has a present legal or constructive obligation as a result of past events, it is more likely than not
that an outflow of resources will be required to settle the obligation, and the amount has been reliably estimated. Provisions are not recognised
for future operating losses.
Where there are a number of similar obligations, the likelihood that an outflow will be required in settlement is determined by considering the
class of obligations as a whole. A provision is recognised even if the likelihood of an outflow with respect to any one item included in the same
class of obligations may be small.
Chris Lambourne

Network Waitaki Limited Annual Report for the year ended 31 March 2015 25
NOTES TO THE FINANCIAL STATEMENTS (CONTINUED)
1 SIGNIFICANT ACCOUNTING POLICIES (CONTINUED)
EMPLOYEE ENTITLEMENTS Wages, salaries and annual leave
Employee Entitlements to salaries, wages and annual leave are recognised when they accrue to employees.
Sick and special leave
Employee Entitlements to sick and special leave are recognised when taken by employees. A provision is made for the additional amount that
the Company expects to pay as a result of unused sick or special leave that has accumulated at balance date.
Long service leave
Long service leave is not recognised in the first 10 years of service. After 10 years of service an allowance is made of 1/5 per year towards
long service leave entitlement. This allowance is then discounted back to current value. Employees are entitled to long service leave after
serving for 15 years
SHARE CAPITAL Ordinary shares are classified as equity.
Incremental costs directly attributable to the issue of new shares are shown in equity as a deduction, net of tax, from the proceeds.
LEASES Operating Leases Leases in which a significant portion of the risks and rewards of ownership are retained by the lessor are classified as operating leases.
Payments made under operating leases (net of any incentives received from the lessor) are charged to the profit and loss component of the
statements of comprehensive income on a straight-line basis over the period of the lease.
Finance Leases The Company is the Lessor
Assets leased to third parties under operating leases are included in property, plant and equipment in the Statement of Financial Position. They
are depreciated over their expected useful lives on a basis consistent with similar owned property, plant and equipment. Rental income (net of
incentives given to lessees) is recognised on a straight-line basis over the lessee term.
The Company is the Lessee Leases in which the Company has substantially all the risks and rewards of ownership are classified as finance leases. Finance leases are
capitalised at the lease’s inception at the lower of the fair value of the leased asset and the present value of the minimum lease payments.
Each lease payment is allocated between the liability and finance charges so as to achieve a constant rate on the finance balance
outstanding.
The corresponding rental obligations, net of finance charges, are included in other long term payables. The interest element of the finance cost
is charged to the Statement of Comprehensive Income over the lease period so as to produce a constant periodic rate of interest on the
remaining balance of the liability for each period.
Property, plant and equipment acquired under a finance lease are depreciated over the shorter of the asset’s useful life and the lease term.

Network Waitaki Limited Annual Report for the year ended 31 March 2015 26
NOTES TO THE FINANCIAL STATEMENTS (CONTINUED)
1 SIGNIFICANT ACCOUNTING POLICIES (CONTINUED)
BASIS OF ACCOUNTING The financial statements represent those of the amalgamated company and have been prepared on the basis of predecessor financial
statements - an accounting treatment applied in business combinations for entities under common control. The predecessor financial
statements include the amalgamation of the financial statements of Network Waitaki Contracting Limited and Network Waitaki Limited and the
reporting of their results as a single entity as if they had existed in that form for the periods being reported. The effect of applying the
predecessor financial statements basis of preparation is the same as reporting the consolidated financial statements of the group under
previous group and parent reporting. There are no other changes in the accounting policies applied.
CHANGES IN ACCOUNTING POLICY AND DISCLOSURES New and amended standards adopted by the company
The following standards have been adopted by the Company for the first time in the current financial year.
Amendment to NZ IAS 32, ‘Financial instruments: Presentation’ on offsetting financial assets and financial liabilities
This amendment clarifies that the right of set-off must not be contingent on a future event. It must also be legally enforceable for all
counterparties in the normal course of business, as well as in the event of default, insolvency or bankruptcy. The amendment also considers
settlement mechanism. The amendment did not have a significant effect on the company financial statements.
Amendment to NZ IAS 36, ‘Impairment of assets’, on the recoverable amount disclosures for non-financial assets
This amendment removed certain disclosures of the recoverable amount of cash-generating units which had been included in NZ IAS 36 by the
issue of NZ IFRS 13.
Amendments to NZ IAS 39, Financial instruments: Recognition and measurement’ on the novation of derivatives and the
continuation of hedge accounting
This amendment considers legislative changes to ‘over-the-counter’ derivatives and the establishment of central counterparties. Under NZ IAS
39 novation of derivatives to central counterparties would result in discontinuance of hedge accounting. This amendment provides relief from
discontinuing hedge accounting when novation of a hedging instrument meets specified criteria. The Company has applied the amendment
and there has been no significant impact on the financial statements as a result.
NZ IFRIC 21, ‘Levies’, sets out the accounting for an obligation to pay a levy if that liability is within the scope of IAS 37 ‘Provisions’
The interpretation addresses what the obligating event is that gives rise to the payment a levy and when a liability should be recognized. The
Company is not currently subjected to significant levies so the impact on the company is not material.
Other standards, amendments and interpretations which are effective for this financial year are not material to the Company.

Network Waitaki Limited Annual Report for the year ended 31 March 2015 27
NOTES TO THE FINANCIAL STATEMENTS (CONTINUED)
1 SIGNIFICANT ACCOUNTING POLICIES (CONTINUED)
New Standards and interpretations not yet adopted
A number of new standards and amendments to standards and interpretations are effective for annual periods beginning after 1 April 2015,
and have not been applied in preparing these consolidated financial statements. None of these are expected to have a significant effect on the
consolidated financial statements of the Company, except the following set out below:
NZ IFRS 9 Financial Instruments
NZ IFRS 9, ‘Financial instruments’, addresses the classification, measurement and recognition of financial assets and financial liabilities. The
complete version of NZ IFRS 9 was issued in September 2014. It replaces the guidance in NZ IAS 39 that relates to the classification and
measurement of financial instruments. NZ IFRS 9 retains but simplifies the mixed measurement model and establishes three primary
measurement categories for financial assets: amortised cost, fair value through other comprehensive income and fair value through profit or
loss. The basis of classification depends on the entity’s business model and the contractual cash flow characteristics of the financial asset.
Investments in equity instruments are required to be measured at fair value through profit or loss with the irrevocable option at inception to
present changes in fair value in other comprehensive income not recycling. There is now a new expected credit losses model that replaces the
incurred loss impairment model used in NZ IAS 39. For financial liabilities there were no changes to classification and measurement except for
the recognition of changes in own credit risk in other comprehensive income, for liabilities designated at fair value through profit or loss. NZ
IFRS 9 relaxes the requirements for hedge effectiveness by replacing the bright line hedge effectiveness tests. It requires an economic
relationship between the hedged item and hedging instrument and for the ‘hedged ratio’ to be the same as the one management actually use
for risk management purposes. Contemporaneous documentation is still required but beginning on or after 1 January 2018. Early adoption is
permitted. The company intends to adopt NZ IFRS 9 on its effective date and has yet to assess its full impact.
IFRS 15, Revenue from contracts with customers, (effective for annual periods beginning on or after 1 January 2017)
IFRS 15 addresses recognition of revenue from contracts with customers. It replaces the current revenue recognition guidance in IAS 18
Revenue and IAS 11 Construction contracts and is applicable to all entities with revenue. It sets out a 5 step model for revenue recognition to
depict the transfer of promised goods or services to customers in an amount that reflects the consideration to which the entity expects to be
entitled in exchange for those goods or services. The Company has yet to assess IFRS 15's full impact. The Company will apply this standard
from 1 April 2017.

Network Waitaki Limited Annual Report for the year ended 31 March 2015 28
NOTES TO THE FINANCIAL STATEMENTS (CONTINUED)
2015
$ 2014
$
2 OPERATING REVENUE
Operating Revenue Comprises:
Network 17,957,444 14,910,331 Capital Contributions 3,362,025 1,459,782
Metering 949,020 966,038 Interest 392,986 399,454 Bad Debts Recovered 4,817 2,089 Dividend Received - - Rent 58,715 9,333 Contracting Revenue 3,102,315 3,261,303
Other 1,075,982 816,904
26,903,304 21,825,234
3 OPERATING EXPENSES
Operating Expenses Comprise: Operating Costs 5,560,758 5,391,792 Directors’ Fees 187,500 178,500 Assets Scrapped - 367,733 Donations 84,779 77,997 Audit Fees 52,075 54,450 Other Services - PWC 49,500 13,943 Other Regulatory Audits – Other 18,497 6,080
Rent 13,300 13,300 Bad Debts Written Off 2,526 1,839
5,974,247 6,105,634
4 DEPRECIATION, AMORTISATION AND IMPAIRMENT
Depreciation, Amortisation and Impairment Comprises: Buildings 38,795 66,164 Contracting Equipment 272,193 252,388 Network Reticulation System 2,299,679 2,247,954 Meters and Relays 318,535 362,245 Plant and Equipment 193,179 154,978 Fibre Network 182,308 182,308 Intangibles 254,194 133,715 3,781,729 3,399,753

Network Waitaki Limited Annual Report for the year ended 31 March 2015 29
NOTES TO THE FINANCIAL STATEMENTS (CONTINUED)
2015
$ 2014
$
5 TAXATION
Tax Expense for Period Made up of Current Taxation Expense 1,235,026 594,090 Deferred Taxation Expense 902,822 568,559 2,137,848 1,162,649
Operating Surplus Before Income Tax 7,887,405 3,858,693
Prima Facie Taxation @ 28 cents 2,208,473 1,080,434
Movement in Income Tax Due to:-
Non Deferred Tax Differences Non Assessable Income (95,044) 57,939 Non Deductible Expenses 5,516 7,086 Prior Period Adjustment 18,903 17,190
(70,625) 82,215
Tax Expense 2,137,848 1,162,649 Deferred Tax Movements Capital Contributions (757,303) (318,812) Depreciation (172,876) (23,846) Prior Period Adjustment - (17,190) Tax Return to Provision True up – Depreciation - (224,945) Other 27,357 16,236
(902,822) (568,557)
Income Tax Expense 1,235,026 594,090
Imputation Credit Account Opening Balance 7,407,652 6,534,531 Prior Period Adjustment - - Income Tax Payments During the Year 945,000 873,121 Income Tax Refunds Received During the Year (87,303) - Imputation Credit Received - - Other Credits 6,735 - Imputation Credit Allocated to Dividends in the Year - - Closing Balance 8,272,084 7,407,652

Network Waitaki Limited Annual Report for the year ended 31 March 2015 30
NOTES TO THE FINANCIAL STATEMENTS (CONTINUED) 5 TAXATION (CONTINUED) Depreciation Other Total $ $ $ DEFERRED TAX LIABILITY/(ASSET) Opening Balance as at 1 April 2013 10,090,038 296,376 10,386,414 Change in the Year 258,500 310,058 568,558 Closing Balance as at 31 March 2014 10,348,538 606,434 10,954,972
Opening Balance as at 1 April 2014 10,348,538 606,434 10,954,972 Change in the Year 172,876 729,946 902,822 Closing Balance as at 31 March 2015 10,521,414 1,336,380 11,857,794
Current and Non-Current Deferred tax Liability/(Asset) 2014 Current Deferred Tax - (136,364) (136,364) Non-Current Deferred Tax 10,348,538 742,798 11,091,336 Total Deferred tax 10,348,538 606,434 10,954,972
2015 Current Deferred Tax (672) (163,720) (164,392) Non-Current Deferred Tax 10,522,086 1,500,100 12,022,186 Total Deferred Tax 10,521,414 1,336,380 11,857,794
2015
$ 2014
$
6 TRADE AND OTHER RECEIVABLES
The Balance Comprises: Trade Receivables 2,160,089 1,360,619 Trade Receivable from Subsidiaries - -
Total Receivables 2,160,089 1,360,619 Other Receivables 353,365 94,577 Prepayments 258,348 130,322 GST 87,555 52,463 Balance at End of Year 2,859,357 1,637,981
Trade and Other Receivables less than 90 days old 2,835,477 1,591,267 Trade and Other Receivables greater than 90 days old 23,880 46,714 Trade and Other Receivables greater than 90 days old and impaired - - 2,859,357 1,637,981 No Trade and Other Receivables were impaired in 2014 or 2015.

NOTES TO THE FINANCIAL STATEMENTS (CONTINUED)
7 PROPERTY, PLANT AND EQUIPMENT
Freehold Buildings Network Meters Easements Fibre Contracting Plant Land Reticulation and Network Equipment and System Relays Equipment Totals $ $ $ $ $ $ $ $ $ Gross Carrying Amount
At 1 April 2013 204,180 1,113,104 83,515,152 2,857,224 113,945 2,604,400 2,006,018 1,398,261 93,812,284
Additions 202,500 547,500 2,140,902 21,403 22,234 - 540,051 174,796 3,649,387
Disposals - - (378,129) (161,728) - - (73,312) (18,185) (631,354)
At 31 March 2014 406,680 1,660,604 85,277,925 2,716,899 136,179 2,604,400 2,472,757 1,554,872 96,830,317
Additions - 874 5,072,527 21,967 11,077 - 270,205 343,512 5,720,163
Disposals - - (383,360) (163,693) - - (295,671) (181,559) (1,024,284)
At 31 March 2015 406,680 1,661,478 89,967,092 2,575,173 147,256 2,604,400 2,447,292 1,716,824 101,526,196
Accumulated Depreciation and Impairment
At 1 April 2013 - 275,587 17,837,357 1,757,928 0 454,982 677,189 669,873 21,672,916
Charge for Year - 66,165 2,247,955 362,245 - 182,308 252,382 154,978 3,266,032
Disposals - - (165,128) (161,721) - - (73,302) (19,213) (419,364)
At 31 March 2014 - 341,752 19,920,183 1,958,452 - 637,290 854,269 805,638 24,519,585
Charge for Year - 38,795 2,299,679 318,535 - 182,308 272,193 193,179 3,304,689
Disposals - - (160,239) (163,693) - - (291,244) (169,168) (786,347)
At 31 March 2015 - 380,546 22,059,624 2,113,293 - 819,598 835,214 829,650 27,037,926
Net Book Values
At 31 March 2014 406,680 1,318,852 65,357,742 758,447 136,179 1,967,110 1,616,492 749,234 72,310,733
Work in Progress - - 724,406 - 2,162 - - 948 727,515
406,680 1,318,852 66,082,148 758,447 138,341 1,967,110 1,616,492 750,182 73,038,242
At 31 March 2015 406,680 1,280,932 67,907,468 461,880 136,179 1,784,802 1,612,078 887,175 74,486,270
Work in Progress - 117,609 4,035,922 - 665 - - 16,299 4,170,495
406,680 1,398,541 71,943,390 461,880 138,341 1,784,802 1,612,078 727,067 78,656,765

Network Waitaki Group Annual Report for the year ended 31 March 2015 32
NOTES TO THE FINANCIAL STATEMENTS (CONTINUED)
2015
$ 2014
$
8 INTANGIBLE ASSETS
Purchased Software
Gross Carrying Amount
Opening Balance 669,047 707,958
Additions 653,130 120,266
Disposals (57,268) (159,177)
Closing Balance 1,265,759 669,047
Accumulated Amortisation and Impairment
Opening Balance 319,604 197,985
Charge for Year 254,194 133,715
Disposals (58,352) (12,096)
Closing Balance 516,296 319,604
Net Book Value 749,463 349,443
Work in Progress 37,401 -
Carrying Amount 786,865 349,443

Network Waitaki Group Annual Report for the year ended 31 March 2015 33
NOTES TO THE FINANCIAL STATEMENTS (CONTINUED)
2015
$ 2014
$
9 INVENTORIES CURRENT ASSET INVENTORIES Contracting Inventory Opening Balance 402,568 468,248 Purchases in the Year 1,537,775 1,348,282 Inventory sold (1,438,164) (1,413,962) Closing Inventory 502,179 402,568 NON-CURRENT ASSET INVENTORIES Network Inventory Opening Balance 647,707 419,953 Purchases in the Year 661,807 1,080,354 Used on the Reticulation System (812,484) (852,600) Closing Inventory 497,030 647,707 Metering Inventory Opening Balance 4,497 4,757 Purchases in the Year 46,441 35,078 Transferred to Meters and Relays (45,708) (35,338) Closing Inventory 5,230 4,497 Total Non-Current Inventory 502,260 652,204 During the periods no non-current inventory was sold to external parties. No inventory has been written down, or had a write-down
reversal. No inventory is pledged as security for liabilities.
10 TRADE AND OTHER PAYABLES Trade Payables 3,717,318 1,339,482 Trade Payable to Subsidiaries - - Total Payables 3,717,318 1,339,482 Accruals 99,138 826,356 Balance at End of Year 3,816,456 2,218,301
All trade and other payables have a maturity within one year.
Note 19 provides analyses of the non-derivative financial liabilities and net-settled derivative financial liabilities into relevant maturity groups
based on the remaining period from the date of the Statement of Financial Position to the contractual maturity date.
11 EMPLOYEE ENTITLEMENTS Leave Entitlements 476,018 386,478 Other Entitlements 104,923 100,298 Total 580,941 486,776

Network Waitaki Group Annual Report for the year ended 31 March 2015 34
NOTES TO THE FINANCIAL STATEMENTS (CONTINUED)
2015
$ 2014 $
12 SHARE CAPITAL Fully Paid-up Ordinary Shares 14,000,000 14,000,000 Non-issued Shares and Shares Held by the Company - - Total Number of Ordinary Shares Authorised 14,000,000 14,000,000
The Company has one class of shares, which is “ordinary shares”. Each ordinary share has a value of $1.00 and ranks equally for voting and
distribution rights. All shares are held by Waitaki Power Trust.
A share premium of $571,119 was paid with the acquisition of shares.
As at the date of authorisation for issue of these financial statements, no dividends have been proposed or declared that are not recognised as a
distribution in the 2015 year (2014 Nil).
13 RETAINED EARNINGS
Balance at Beginning of Year 56,943,437 54,247,392 Net Surplus for Year 5,749,557 2,696,045 Dividend Paid - - Balance at End of Year 62,692,994 56,943,437
14 RECONCILIATION OF NET PROFIT WITH CASHFLOW FROM OPERATING ACTIVITIES Net Profit for the Year 5,749,557 2,696,045 Add/(Less) Non-Cash Items: Depreciation and Amortisation 3,781,729 3,399,753 Assets Scrapped - 367,733 Movement in Foreign Exchange (255,534) - Dividend from Network Waitaki Contracting - - Deferred Taxation 902,822 568,559 4,429,017 4,336,045 10,178,574 7,032,090 Add/(less) Movements in Working Capital Items: (Increase) / Decrease in Trade and Other Receivables (1,221,376) (64,859) (Increase) / Decrease in Inventories (99,610) 65,680 (Increase) / Decrease in Work in Progress 17,800 (343,185) Increase / (Decrease) in Tax Payable 303,940 (279,031) Increase / (Decrease) in Trade and Other Payables 1,598,156 24,334 Increase / (Decrease) in Employee Entitlements 94,164 71,158 693,074 (525,903) Net Cash Flows From Operating Activities: 10,871,648 6,506,187

Network Waitaki Group Annual Report for the year ended 31 March 2015 35
NOTES TO THE FINANCIAL STATEMENTS (CONTINUED)
2015
$ 2014
$
15 LOAN FROM WAITAKI POWER TRUST Opening Balance at 1 April 2014 1,150,000 1,150,000 Amount Drawn Down through to 31 March 2015 - - Closing Balance 1,150,000 1,150,000 The loan is unsecured and interest charged on the loan is at commercial rates.
16 CAPITAL COMMITMENTS
There were no capital commitments as at 31 March 2015 (2014 NIL)
17 RELATED PARTY TRANSACTIONS
Payments from Network Waitaki Limited to Whitestone Contracting Limited
Whitestone Contracting Limited is related to Network Waitaki Limited through its director, John Walker who also holds a directorship at Whitestone Contracting Limited. All contracting services between Whitestone Contracting Limited and Network Waitaki Limited are at commercial rates. Contracting Services 234,080 222,921 Outstanding Balance at Balance Date Trade Payables 30,771 8,093
Payments from Whitestone Contracting Limited to Network Waitaki Limited Whitestone Contracting Limited is related to Network Waitaki Limited through its director John Walker who also holds a directorship at Whitestone Contracting Limited. All contracting services between Whitestone Contracting Limited and Network Waitaki Limited are at commercial rates. Contracting Services 8,016 2,797 Payments from Waitaki Power Trust to Network Waitaki Limited
Loan - - Loan Outstanding at Balance Date 1,150,000 1,150,000 Payments from Network Waitaki Limited to Waitaki Power Trust
Donation 5,000 - Interest 73,104 67,850 Outstanding Balance at Balance Date - - Payments from Waitaki Power Trust to Network Waitaki Limited
Loan - - Loan Outstanding at Balance Date 1,150,000 1,150,000 Payments from Network Waitaki Company to key management personnel Payments to key management personnel are made in accordance with employment agreements. Salaries 833,602 710,732 Outstanding Balance at Balance Date - -

Network Waitaki Group Annual Report for the year ended 31 March 2015 36
NOTES TO THE FINANCIAL STATEMENTS (CONTINUED)
18 ANALYSES OF FINANCIAL LIABILITIES At 31 March 2015
Less than 1 Year Between Between Over 5 Years 1 and 2 Years 2 and 5 Years Loan $73,104 $73,104 $219,000 $1,831,240 Trade and Other Payables $3,816,456 At 31 March 2014
Less than 1 Year Between Between Over 5 Years 1 and 2 Years 2 and 5 Years Loan $68,124 $68,124 $204,000 $1,103,000 Trade and Other Payables $2,218,301 The loan is interest only, with no maturity date. The current interest rate is 5.90%. The over 5 year amounts allow for
payments up to 10 years.
19
OPERATING LEASES
2015
$ 2014
$
LESSORS - OPERATING LEASES No later than one year 437,000 451,015 Later than one year and no later than five years 1,750,000 1,804,060 2,187,000 2,255,075 Network Waitaki leases out the fibre network it purchased in 2011. Its cost and accumulated depreciation values are shown in Note 8. LESSEES - OPERATING LEASES The future minimum lease payments under non-cancellable operating leases are as follows: No later than one year 406,500 552,856 Later than one year and no later than five years 1,626,000 1,693,780 2,032,500 2,246,636
20 CONTINGENT LIABILITIES
The Company has no contingent liabilities as at 31 March 2015 (2014 Nil).
21
AMALGAMATION
Network Waitaki Limited amalgamated with Network Waitaki Contracting Limited on 31 March 2015.
The amalgamation included the amalgamation of the assets and liabilities, financial obligations and commitments of Network
Waitaki Contracting Limited with those of Network Waitaki Limited. The assets and liabilities of Network Waitaki Contracting
Limited were amalgamated at their book values and for nil consideration. The retained earnings are transferred to the retained
earnings and share capital cancelled. There were no gains or losses arising from the amalgamation other than as reflected in the
net earnings.
The assets and liabilities of Network Waitaki Contracting Limited that were amalgamated on 31 March 2015 are as follows:

Network Waitaki Group Annual Report for the year ended 31 March 2015 37
2015 2014
Note $ $
ASSETS
CURRENT ASSETS
Cash and Cash Equivalents 946,858 775,247
Trade and Other Receivables 4 1,457,345 713,806
Inventories 5 502,178 402,568
Work in Progress 1,319 19,196
Property, Plant and Equipment 7 1,787,332 -
Intangible Assets 6 14,463 -
Deferred Tax Assets 3 100,385 90,756
TOTAL CURRENT ASSETS 4,809,879 2,001,573
NON-CURRENT ASSETS
Property, Plant and Equipment 7 - 1,785,833
Intangible Assets 6 - 24,671
TOTAL NON-CURRENT ASSETS - 1,810,504
TOTAL ASSETS 4,809,879 3,812,077
LIABILITIES
CURRENT LIABILITIES
Deferred Tax Liabilities 3 28,464 17,113
Trade and Other Payables 8 1,069,401 538,370
Employee Entitlements 9 350,565 319,328
TOTAL CURRENT LIABILITIES 1,448,430 874,811
TOTAL LIABILITIES 1,448,430 874,811
EQUITY
Share Capital 11 1,000,000 1,000,000
Retained Earnings 12 2,361,449 1,937,265
TOTAL SHAREHOLDERS EQUITY 3,361,449 2,987,375
TOTAL LIABILITIES AND SHAREHOLDERS EQUITY 4,809,879 3,812,076
STATEMENT OF FINANCIAL POSITION – NWCL
as at 31 March 2015

Network Waitaki Group Annual Report for the year ended 31 March 2015 38
PERFORMANCE TARGETS Performance targets, as set out in the Statement of Corporate Intent (SCI) approved by Directors
FINANCIAL PERFORMANCE MEASURES
STATEMENT OF COMPREHENSIVE INCOME FOR YEAR ENDED 31 MARCH 2015
ACTUAL SCI VARIANCE Statement of Comprehensive Income $ $ $
Operating Revenue 23,541,278 18,692,168 4,849,110
Operating Expenses (13,432,407) (9,906,723) (3,525,684)
Operating Profit 10,108,871 8,785,445 1,323,426
Less Depreciation (3,781,729) (3,682,680) (99,049)
Net Profit from Operational Activities 6,327,142 5,102,765 1,224,377
Other Income - - -
Operating Profit after Other Income 6,327,142 5,102,765 1,224,377
Less Discount (1,728,625) (1,500,000) (228,625)
Operating Profit after Discount 4,598,517 3,602,765 995,752
Interest Expenses (73,138) (68,125) (5,013)
Operating Profit after Interest Income & before Tax 4,525,379 3,634,640 890,739
Taxation (2,137,848) (817,794) (1,320,054)
Net Profit after Taxation and before Capital Contributions 2,387,531 2,816,846 (429,315)
Comment
The higher Net Profit after taxation represents higher operating profit due to the number of units transported through the network.
BALANCE SHEET AS AT 31 MARCH 2015
ACTUAL
$ SCI
$ VARIANCE
$
Shareholders' Equity 77,264,113 74,211,221 3,052,892
Current Assets 15,185,549 8,870,920 6,314,629
Current Liabilities 4,695,141 2,698,983 (1,996,158)
Working Capital 10,490,408 6,171,937 4,318,471
Non-Current Assets 79,945,890 80,631,373 (685,483)
Non-Current Liabilities 13,172,185 12,592,089 (580,096)
66,773,705 68,039,284 (1,265,579)
Net Assets 77,264,113 74,211,221 3,052,892
Comment
The current assets balance is higher and the non-current assets balance is lower than allowed for in the SCI, representing changes to the Network Waitaki capital programme for the year and the associated increase in cash and cash equivalents no longer required to fund the programme.

Network Waitaki Group Annual Report for the year ended 31 March 2015 39
PERFORMANCE TARGETS (CONTINUED) Performance targets as set out in the Statement of Corporate Intent (SCI) approved by Directors
FINANCIAL PERFORMANCE MEASURES (CONTINUED)
KEY FINANCIAL REPORTING MEASURES ACTUAL SCI VARIANCE NPBT to Shareholder’ Funds 10.11% 4.96% 5.15% Net Assets per Share $5.51 $5.30 $0.27 NPBT Earnings per Share in cents 56.34 Cents 25.96 Cents 30.38 Cents Ratio of Shareholders’ Funds to Total Assets 81.22% 82.92% (1.70%) Network Operating Cost per ICP $404.00
. $377.72 $26.28
Direct Line Cost per Circuit km of Line $1,931.49 $1,944.45 ($12.96)
Comment
The higher than planned net assets per share are a result of more units being transported through the network and lower ratio of
shareholders’ funds to total assets are the result of the capital programme being changed. The NPBT earnings per share has increased
due to the amount of customer work undertaken and the capital contributions received.
NON-FINANCIAL PERFORMANCE MEASURES
ACTUAL SCI VARIANCE Average Interruption Duration (SAIDI) 51.07 116.50 65.43 Average Interruption Frequency (SAIFI) 1.10 1.54 0.44 Customer Average Interruption Duration (CAIDI) 46.60 75.64 29.04
Comment
The lower level of SAIDI is the result of lower unplanned outages and the use of live line techniques. The results were calculated using
information from the Company's non-financial systems, which due to manual recording processes have inherent limitations relating to the
completeness of interruption data and the accuracy of interconnection point (ICP) numbers included in the SAIDI, SAIFI and CAIDI
calculations.
SOURCES OF INFORMATION
Network Waitaki’s website, www.networkwaitaki.co.nz, contains information about our policies and operations. Paper copies are
available from our office at 10 Chelmer Street Oamaru.
Information available on the
Other websites of interest include: Network Waitaki website includes: www.comcom.govt.nz (Commerce Commission) Network Disclosures www.egcomplaints.co.nz (Electricity & Gas Complaints Commission) Pricing Methodology www.ea.govt.nz (Electricity Authority) Tariff www.med.govt.nz (Ministry of Economic Development) Use of System Agreement www.transpower.co.nz (Transpower) Price Path Threshold www.contactenergy.co.nz (Contact Energy) Tree Management www.genesisenergy.co.nz (Genesis Energy) Network Assets Management Plan www.meridianenergy.co.nz (Meridian Energy) Working Around Overhead Lines www.mightyriverpower.co.nz (Mighty River Power) Statement of Corporate Intent www.trustpower.co.nz (TrustPower)
www.whatsyournumber.org.nz (Consumer Powerswitch) www.eeca.co.nz (Energy Efficiency and Conservation Authority)
Feedback: email [email protected] with suggestions on how we can improve our reporting and consulting with consumers.

Network Waitaki Group Annual Report for the year ended 31 March 2015 40
Auditors Report

Network Waitaki Group Annual Report for the year ended 31 March 2015 41
Auditors Report (CONTINUED)

Network Waitaki Group Annual Report for the year ended 31 March 2015 42
Auditors Report (CONTINUED)

Network Waitaki Group Annual Report for the year ended 31 March 2015 43
Auditors Report (CONTINUED)

Network Waitaki Group Annual Report for the year ended 31 March 2015 44
Network Waitaki Limited 10 Chelmer Street
PO Box 147 Oamaru 9444
Phone 03 433 0065 Fax 03 434 8845
Email: [email protected] Website: www.networkwaitaki.co.nz