annual report 2018 - tailored it solutions for banks ... · gft annual report 2018 bankme: an app...
TRANSCRIPT

ConnectingDigital bridges
Annual Report 2018
How can you ensure the success of a digital transformation process? Driven by the momentum of technological progress, this is a question which companies in all sectors are currently asking themselves. The key factors are speed, efficiency and flexibility. But above all, it is about making the right connections – connections that are stable and unlock new potential.
GFT creates these connections. We deliver more than just technology. We build digital bridges, tread new paths and provide our customers with a secure transition into the future.
2018 was a year of connections for us; in the work with our clients and partners, as well as in the collaboration within our company. We forged new alliances, expanded our network, built bridges between continents and tapped the huge potential of new technologies for financial institutions and industrial companies. And we strengthened our position as a cross-sector partner for digitalisation solutions.
The Helix Bridge in Singapore is a pedestrian bridge connecting the Marina Centre with the new Bayfront area. A helical construction of glass and steel covers the bridge with its inner and outer arches layered in opposite directions. Created as a cooperative project, the bridge received the highest accolades awarded for architecture.
Why did we choose this cover photo? Firstly, because the bridge creates a modern and architecturally unique connection. And secondly, because the helix is a symbol of how we see the financial sector’s path into the future; as a digital evolution in which different strands are interlinked. A challenging process in which adaptability and connections play a crucial role.
Contents
Company 2Letter to our shareholders 2
Connecting: Digital bridges 4
Strong partner for digitalisation 20
GFT in the capital market 22
Administrative Board report 24
Corporate Governance report 28
Combined Management report 31Basic principles of the GFT Group 32
Economic report 35
Risk report 46
Opportunity report 54
Takeover-relevant information 56
Remuneration report 59
Forecast report 62
Explanations on the separate financial statements (HGB) 64
Consolidated financial statements (IFRS) 67
Annual financial statements GFT Technologies SE (HGB) – extract 134
Financial calendar 2019 137
Key figures 139
GFT Annual Report 2018
Letter to our shareholders
2018 was a year for GFT in which we once again demonstrated our ability to constantly evolve. We positioned ourselves as a cross-industry partner for digitalisation and consistently pursued important innovations. We strongly expanded our projects with future technologies, raised the proportion of revenue generated with insurance companies, and helped our industrial clients with their digital transformation. In addition, we intensified our strategic partnerships with leading platform providers.
Thanks to our clear vision, courageous actions and a highly moti vated team of employees, we succeeded in implementing these changes swiftly. Once again, this proved that change is firmly anchored in the company’s values and is one of our greatest strengths. With great determination and a focused strategy, we were able to rise to the challenge of a volatile market environment.
Let us take a look at our financial figures for the financial year 2018: at €412.83 million, consolidated revenue was in line with expectations and 1% below the prior-year figure (2017: €418.81 million). Without our top-2 clients, Deutsche Bank and Barclays, consolidated revenue was up 9% on 2017. Adjusted EBITDA improved by 12% to €39.68 million (2017: €35.37 million). Pre-tax earnings (EBT) amounted to €22.64 million and were thus strongly up on the previous year by 41% (2017: €16.08 million).
The financial year 2018 was dominated by uncer tainties in the global markets. At the same time, 2018 was also a year which offered us a wide range of opportunities due to the almost relentless momentum of the digitalisation process across all industries. Our international team made excellent use of these opportunities.
In 2018, we continued to broaden our client structure and thus further reduced the associated risks. We succeeded in gaining new customers while at the same time expanding our business with existing clients, especially in the retail banking segment and the insurance business.
We can see that above all, new technologies such as: artificial intelligence, cloud, blockchain, DevOps and data analytics are driving exponential growth across all sectors – we define these as exponential technologies. We therefore expanded our technological expertise in these areas throughout the Group in 2018. As planned, we were able to increase business with exponential technologies to 25% of consolidated revenue in 2018;
we expect a further increase to 30% in 2019. This illustrates the tremendous potential that the market for new technologies offers. We intend to consistently exploit this potential.
Based on our technological expertise and the strong demand for IT solutions in the field of Industry 4.0, we are also targeting industrial companies in Germany, Italy and Spain. We increased headcount in our business with IT solutions for the industrial sector and created the necessary structures for dynamic future growth. Our international teams successfully developed a number of promising prototypes for industry, from the real-time analysis of driving data to the monitoring of complex pharmaceutical supply chains – the application possibilities are enormous. With our development centres in Europe and the Americas, we also provide the necessary top IT specialists for industrial companies at a time when skilled workers are in short supply. We are confident that we will be able to implement further projects with industrial clients in 2019.
We also see tremendous growth potential in the insurance industry. With the acquisition of the Canadian IT service provider V-NEO in July 2018, we strengthened our know-how in the insurance sector as well as our market position in North America – a decisive step on the way to positioning GFT as a leading IT partner for digitalisation in the insurance sector, just as we are already in the banking sector. V-NEO is also a long-standing service partner for the insurance platforms Guidewire and Oracle OIPA. There is currently a disproportionately strong demand for both platforms; we have therefore pooled GFT’s existing Guidewire business with V-NEO. V-NEO’s clients include major insurance companies in Canada, Belgium and France. This has further diversified our client portfolio and enabled us to achieve additional international growth.
In rapidly changing markets, cooperation and strong networks play a decisive role. The tremendous opportunities offered by digitalisation can only be fully exploited by working together. Cooperation between organisations with complementary technologies, platforms and competencies is becoming the norm. In 2018, we therefore focused on expanding our strategic partnerships with platform providers. As one of the few IT service providers for the financial services sector, we have established a strategic partnership with Google. Specifically for the insurance sector, we also work together with Guidewire – the leading platform provider in the field of property and casualty insurance. These collaborations give us access to new clients, countries and markets.
Letter to our shareholders 2 – 3
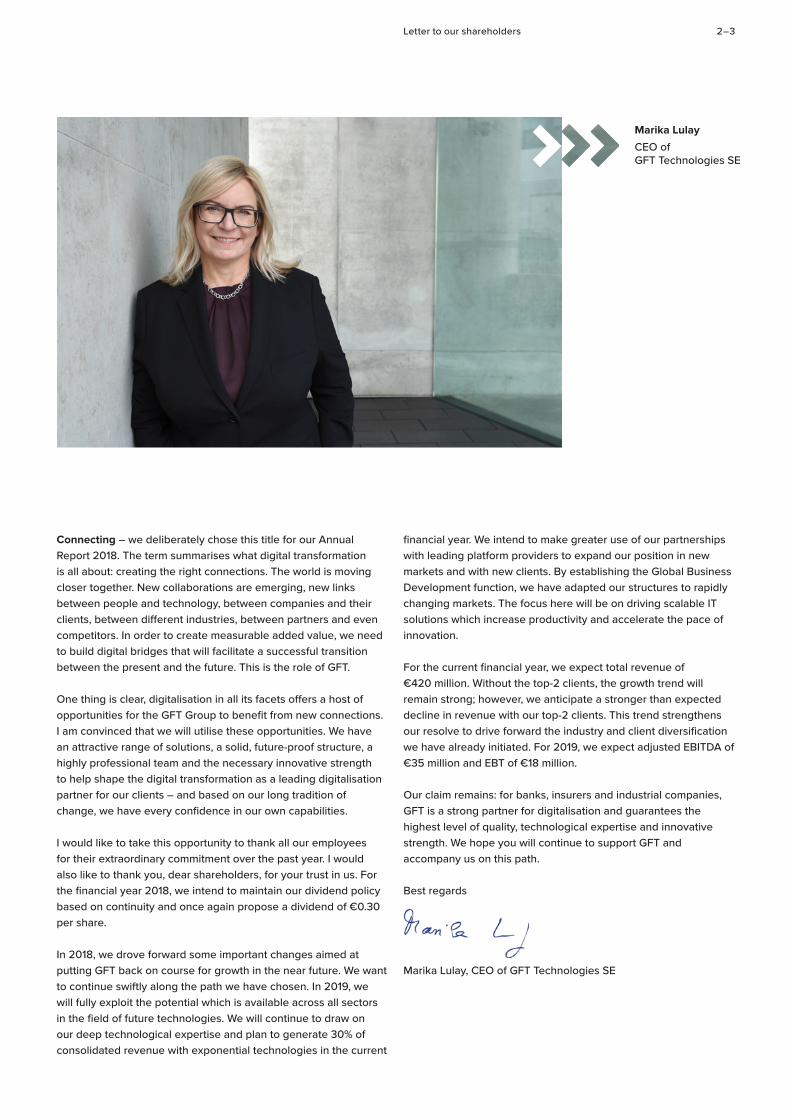
Marika Lulay
CEO of GFT Technologies SE
Connecting – we deliberately chose this title for our Annual Report 2018. The term summarises what digital transformation is all about: creating the right connections. The world is moving closer together. New collaborations are emerging, new links between people and technology, between companies and their clients, between different industries, between partners and even competitors. In order to create measurable added value, we need to build digital bridges that will facilitate a successful transition between the present and the future. This is the role of GFT.
One thing is clear, digitalisation in all its facets offers a host of opportunities for the GFT Group to benefit from new connections. I am convinced that we will utilise these opportunities. We have an attractive range of solutions, a solid, future-proof structure, a highly professional team and the necessary innovative strength to help shape the digital transformation as a leading digitalisation partner for our clients – and based on our long tradition of change, we have every confidence in our own capabilities.
I would like to take this opportunity to thank all our employees for their extraordinary commitment over the past year. I would also like to thank you, dear shareholders, for your trust in us. For the financial year 2018, we intend to maintain our dividend policy based on continuity and once again propose a dividend of €0.30 per share.
In 2018, we drove forward some important changes aimed at putting GFT back on course for growth in the near future. We want to continue swiftly along the path we have chosen. In 2019, we will fully exploit the potential which is available across all sectors in the field of future technologies. We will continue to draw on our deep technological expertise and plan to generate 30% of consolidated revenue with exponential technologies in the current
financial year. We intend to make greater use of our partnerships with leading platform providers to expand our position in new markets and with new clients. By establishing the Global Business Development function, we have adapted our structures to rapidly changing markets. The focus here will be on driving scalable IT solutions which increase productivity and accelerate the pace of innovation.
For the current financial year, we expect total revenue of €420 million. Without the top-2 clients, the growth trend will remain strong; however, we anticipate a stronger than expected decline in revenue with our top-2 clients. This trend strengthens our resolve to drive forward the industry and client diversification we have already initiated. For 2019, we expect adjusted EBITDA of €35 million and EBT of €18 million.
Our claim remains: for banks, insurers and industrial companies, GFT is a strong partner for digitalisation and guarantees the highest level of quality, technological expertise and innovative strength. We hope you will continue to support GFT and accompany us on this path.
Best regards
Marika Lulay, CEO of GFT Technologies SE
GFT Annual Report 2018
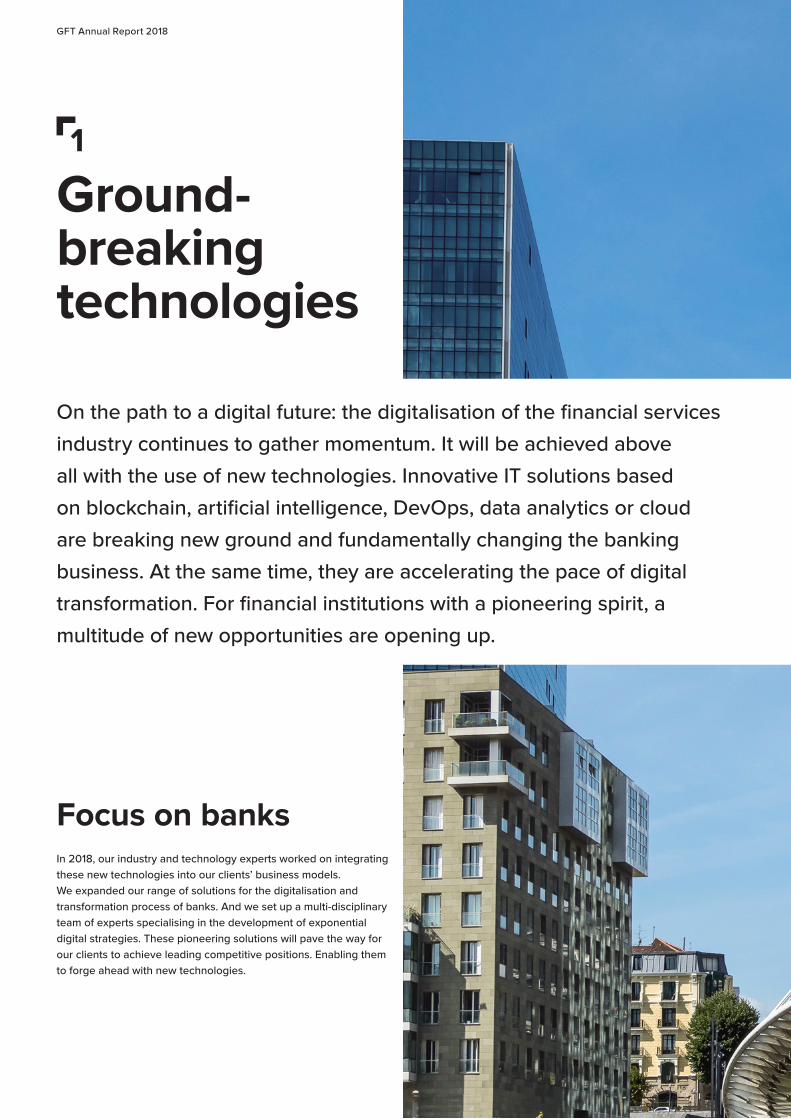
1
Ground-breaking technologies
Focus on banksIn 2018, our industry and technology experts worked on integrating these new technologies into our clients’ business models. We expanded our range of solutions for the digitalisation and transformation process of banks. And we set up a multi-disciplinary team of experts specialising in the development of exponential digital strategies. These pioneering solutions will pave the way for our clients to achieve leading competitive positions. Enabling them to forge ahead with new technologies.
On the path to a digital future: the digitalisation of the financial services
industry continues to gather momentum. It will be achieved above
all with the use of new technologies. Innovative IT solutions based
on blockchain, artificial intelligence, DevOps, data analytics or cloud
are breaking new ground and fundamentally changing the banking
business. At the same time, they are accelerating the pace of digital
transformation. For financial institutions with a pioneering spirit, a
multitude of new opportunities are opening up.

Connecting – Digital bridges 4 – 5
Zubizuri pedestrian bridge, Spain
Exciting crossover to a modern world: the Zubizuri pedestrian
bridge of Santiago Calatrava in Bilbao, Spain, connects the
two districts of Campo Volantin and Uribitarte. This is where
the old town meets the modern financial district.

GFT Annual Report 2018
BankMe: an app that connects generationsYoung adults are the customers and investors of tomorrow. According to recent surveys, however, adolescents are not particularly well informed when it comes to finance. The BankMe app is designed specifically for teenagers and helps them with their day-to-day money management. The benefit for parents is that the application is shared. They can therefore monitor their children and gradually increase the scope of transactions without risk.
Our Italian GFT team developed and implemented the BankMe app together with the French banking group Crédit Agricole. Particular emphasis was placed on the app’s attractive design and user-friendliness. The GFT team utilised cutting-edge technologies for the implementation of the solution: hybrid mobile technologies to simplify application maintenance, cloud-based platforms for chat management, and the “Jiffy” mobile payment method developed by SIA in collaboration with GFT. A mobile server enables the coordination of business processes and the decoupling of the app from the bank’s core systems. Various security levels were integrated into both the app and the mobile server.
Crédit Agricole benefits from BankMe in two ways: the satisfaction and loyalty of the parents and the trust established among their customers of the future.
Artificial intelligence to cope with a rising flood of dataBanks have access to an enormous amount of data which continues to expand rapidly. With the aid of artificial intelligence, they can analyse this unstructured flood of information and gain new insights from it, enabling them to design processes more efficiently.
GFT has developed a Document Processing Accelerator for a private bank. It is capable of sorting huge quantities of unstructured documents and analysing them with regard to relevant text passages. The application combines mathematical methods for pattern recognition (machine learning) with artificial neural networks (deep learning). During the development of the underlying algorithm for the accelerator, around 10,000 legal documents were analysed. The speed of document processing increased by 60%. This solution is not limited to this specialist area, but can be extended for other areas of application.
Connecting – Digital bridges 6 – 7
FINSEC: pan-European innovation project for more securityThe European IT innovation project FINSEC promises a quantum leap in IT security for the financial sector. The goal is to establish an ecosystem of solutions for banks aimed at warding off security risks. These include physical dangers such as theft or vandalism, as well as cyber attacks in which sensitive data is stolen or business processes manipulated.
22 partners from eleven countries are collaborating on the project. The joint solutions will take into account the critical infrastructure of financial institutions while at the same time being easy to integrate, collaborative and forward-looking. Our GFT team in Italy acts as the main link between all parties: it coordinates European financial institutions and large corporations, as well as research centres and the European Commission, which supports FINSEC with funding of €7.8 million.
The core technological principle of the FINSEC project is the application of data-driven artificial intelligence. This enables the detection of anomalies and the use of video surveillance analysis. Before FINSEC can be put into practice, various threat scenarios will be simulated in pilot projects. The performance of the various systems will then be tested by more than 500 security and financial experts.
GFT report: growing trust in the cloud The use of IT resources via cloud computing and the internet offers numerous benefits. As well as being available from any location, it offers storage space and a wealth of services – the ideal way to create a scalable IT infrastructure. Large but also fluctuating data volumes can be processed flexibly and additional computing power can be quickly accessed.
Investment banks have recognised this potential and intend to increase their use of public cloud services by more than half over the next five years. This is the finding of a global survey conducted by GFT among 32 investment banks in the period October 2017 to March 2018. In addition to the cost savings, banks are attracted by the agility and resource flexibility offered by the corresponding solutions. Use of the cloud can also accelerate the development of new and innovative applications.
According to the report, the biggest hurdle for the use of cloud solutions is the lack of clarity regarding regulatory compliance for cloud solutions in investment banking. The interviewees also had some concerns about privacy and security. For their migration to cloud, they plan to bring external technology experts on board.
Future-proof: cloud-based platform for monitoring securities transactions The transparent and secure settlement of equity transactions is ensured by the national supervisory bodies which oversee trading. In addition, there are the internal monitoring systems of the banks themselves which guarantee extra security. GFT has made an existing monitoring system ready for the future. As performance and scalability were two of the main requirements for the new platform, a cloud-based solution was chosen. Its task: to process incoming trading, market and reference data in various formats and from various sources in real time. Artificial intelligence enables the solution to identify structures and patterns – and if any anomalies are detected, the system sounds the alarm.
The GFT team was able to meet these requirements by developing a complex platform based on Google Cloud. The result is a future-proof platform with a high degree of efficiency and flexibility that supports the client’s growth strategy. At the same time, a special tool enables the user to easily monitor the processed data volume and thus keep costs transparent.
GFT Annual Report 2018
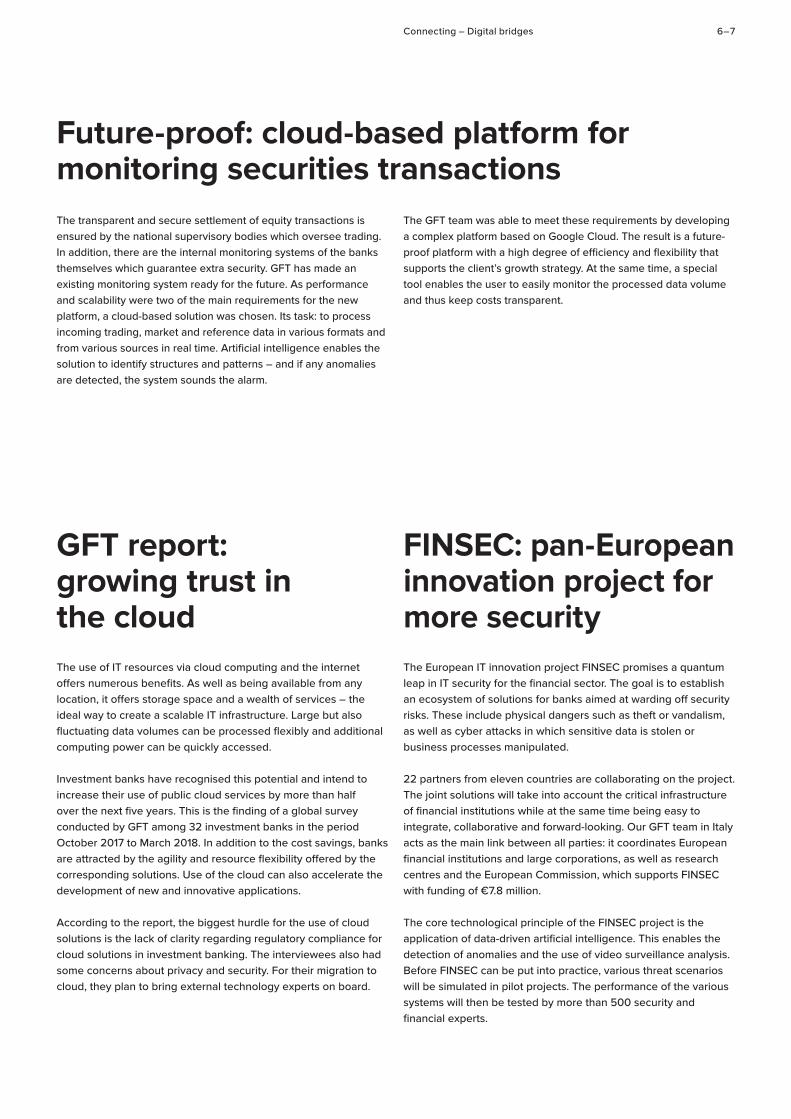
2
Reliable connections
Focus on insurance companies2018 was an important year for GFT as it continues to strengthen its position as a digitalisation partner for the insurance industry. With the acquisition of V-NEO, we have reinforced the links between America and Europe and expanded our team with employees who – like us – combine industry expertise with a passion for technology. We have developed a variety of business models based on new technologies – from innovative methods to combat fraud to powerful insurance portals. Always with a clear focus on those topics that matter most to insurers.
Insurance companies need to meet numerous requirements when
digitalising their business; clients want to communicate directly and
easily with their service provider via various channels. The market is
increasingly calling for personalised insurance products and premiums.
Internal processes have to be made more efficient by the use of
automation. Future-oriented applications based on new technologies
can reliably meet these demands – and at the same time strengthen
long-term customer loyalty.

Connecting – Digital bridges 8 – 9
Charles Kuonen Suspension Bridge, Switzerland
Impressively safe: as part of the ‘Europaweg’ hiking path, the Charles Kuonen Suspension
Bridge reaches a height of 85 metres as it traverses the
‘Grabengufer’ in the Matter valley. At 494 metres, it is the
longest pedestrian suspension bridge in the world.
GFT Annual Report 2018
V-NEO: a new, strong member of the GFT Group
“ The strengths of GFT and V-NEO fit together perfectly. Our industry know-how combined with GFT’s international presence makes us the ideal digitalisation partner for the insurance industry.” – Alain Lamothe, CEO of V-NEO
Our acquisition of the Canadian IT company V-NEO – a specialist for the insurance industry – in July 2018 has significantly expanded our market share in North America. Our goal: to establish GFT as the leading digitalisation partner for the insurance sector.
More than 180 experts in Canada, France and Belgium have joined our international team following the acquisition. V-NEO‘s IT specialists have brought in-depth knowledge of digital solutions for property, accident and life insurance: from strategic consulting to solution design and implementation. They represent a perfect addition to GFT’s existing portfolio. As V-NEO is one of the largest independent Guidewire integrators, we have also intensified our cooperation with this important platform provider.
GFT and V-NEO share the same corporate philosophy: we are both driven by a passion for technology and progress. At the same time, we always maintain a clear focus on the needs of our clients. The spirit of innovation is also firmly anchored in the DNA of both companies. V-NEO was the first North American firm to initiate an ‘Insurance Innovation and Performance Centre’ dedicated to consistently promoting innovation and employee training. This is where the developing, piloting and rolling out of new insurance solutions in the field of artificial intelligence and the Internet of Things is put into practice. Cooperation with GFT’s Digital Innovation Labs will open up additional potential. We still have plenty to achieve together.
Connecting – Digital bridges 10 – 11
Tracking down fraud
The economic loss is huge: in the EMEA region alone, it is estimated that fraud cases account for at least 5 – 10% of insurance payments.
Together with the consultancy firm PricewaterhouseCoopers, GFT has developed an anti-fraud solution in Italy that reduces the number of fraud cases. Unfair practices are detected and prevented at an early stage – both when insurance is taken out and when claims are being processed. Regardless of whether these are one-off crimes or organised fraud cases.
The anti-fraud solution is based on three technologies: big data which utilise information technologies from a variety of sources; machine learning for the identification of recurring patterns and structures that indicate fraudulent behaviour; and document detection to identify forged documents that are often used due to their ease of creation.
The combination of these technologies creates a powerful database which can detect and prevent fraud. The solution comprises more than 1,200 rules derived from market experience that have been fed into the system. In addition, machine learning modules and a number of extra functionalities were integrated for further development. The application has been successfully installed at one of Italy’s largest insurance companies.
Claims management: efficient and customer-oriented
The handling of claims is a critical factor for insurance companies in their interaction with customers. Efficient claims management enables insurers to meet customer requirements while at the same time raising the efficiency of their operations.
For a Belgian insurance company, we implemented an efficient end-to-end claims management solution based on the Guidewire platform. The aim was to transform the claims management process in such a way that it was better tailored to the customer. Efficiency gains were also targeted and the focus on customer satisfaction was to be strengthened by enhancing transparency and predictability.
We also provided claim process optimisation consulting which included a roadmap of value-added projects to further optimise the use of the solution. Therefore, an agile development system was implemented into the claims management process and a comprehensive product and system architecture was created.
The benefits for the insurer: customer service along the entire claims process was improved; productivity was raised by 30% and complete digitalisation was achieved.
Life insurance in the cloud
GFT has implemented an insurance platform for a major North American bank that meets a wide range of requirements – from both the client’s and the operational perspective. For the market launch of a new life insurance policy, the bank had chosen an application based on Google Cloud and commissioned a team of GFT specialists to implement the project.
The result of our intensive development efforts was a future-proof platform solution based on Google Cloud. It works efficiently and adapts flexibly to user demand. In order to take full advantage of Google Cloud’s capabilities, the technologies and processes were systematically coordinated with one another. This included the integration of control and security mechanisms as well as the automated installation of service updates. For the GFT team, it was important that future developments and measures to optimise performance could be implemented quickly. On completion of the development phase, GFT’s experts also provided extensive staff training in cloud technology.
GFT Annual Report 2018
3
Successful transition
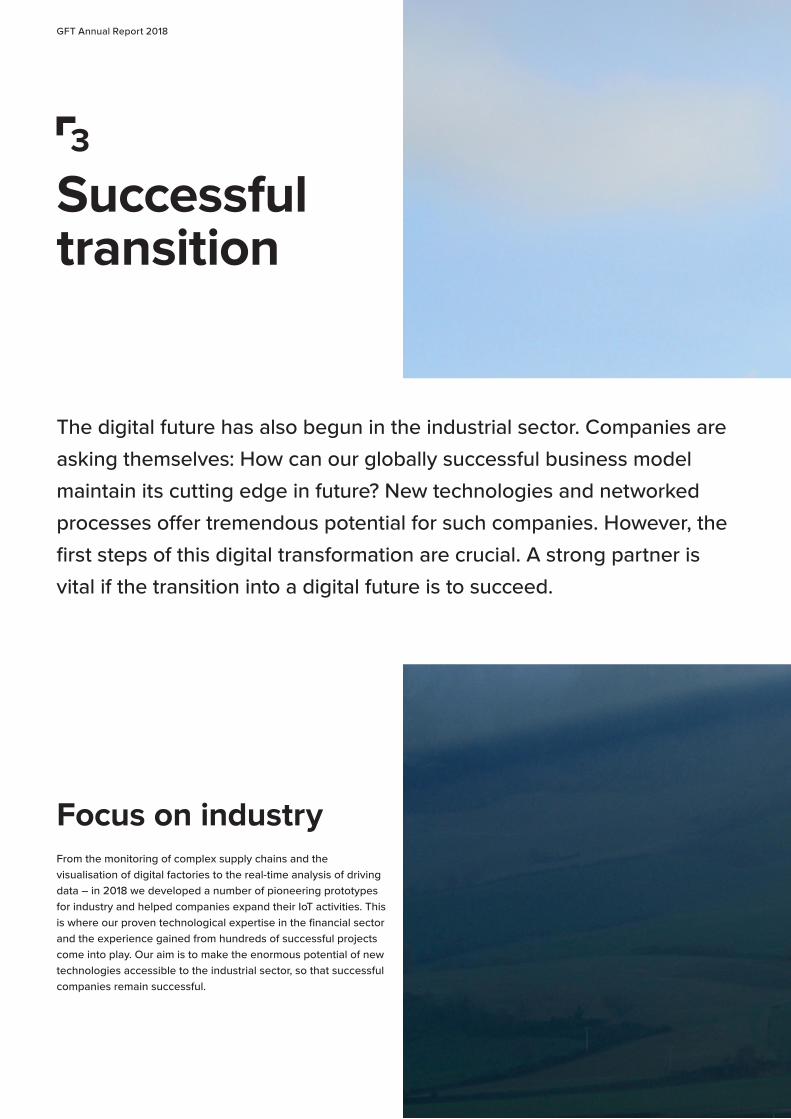
Focus on industryFrom the monitoring of complex supply chains and the visualisation of digital factories to the real-time analysis of driving data – in 2018 we developed a number of pioneering prototypes for industry and helped companies expand their IoT activities. This is where our proven technological expertise in the financial sector and the experience gained from hundreds of successful projects come into play. Our aim is to make the enormous potential of new technologies accessible to the industrial sector, so that successful companies remain successful.
The digital future has also begun in the industrial sector. Companies are
asking themselves: How can our globally successful business model
maintain its cutting edge in future? New technologies and networked
processes offer tremendous potential for such companies. However, the
first steps of this digital transformation are crucial. A strong partner is
vital if the transition into a digital future is to succeed.

Connecting – Digital bridges 12 – 13
Viaduc de Millau, France
Massive record holder: at 2,460 metres, the Millau
Viaduct is the longest cable-stayed bridge in the world and,
with a maximum pylon height of 343 metres, also the tallest
structure in France.
GFT Annual Report 2018
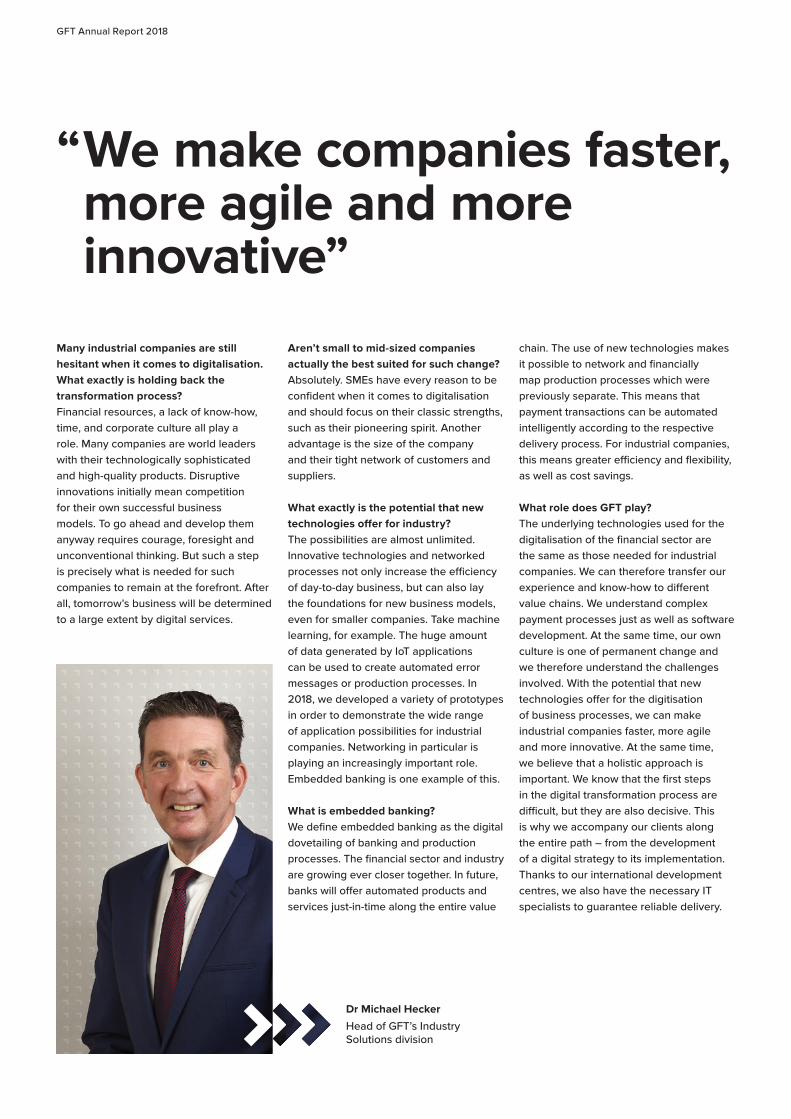
“ We make companies faster, more agile and more innovative”
Dr Michael Hecker
Head of GFT’s Industry Solutions division
Many industrial companies are still hesitant when it comes to digitalisation. What exactly is holding back the transformation process?Financial resources, a lack of know-how, time, and corporate culture all play a role. Many companies are world leaders with their technologically sophisticated and high-quality products. Disruptive innovations initially mean competition for their own successful business models. To go ahead and develop them anyway requires courage, foresight and unconventional thinking. But such a step is precisely what is needed for such companies to remain at the forefront. After all, tomorrow’s business will be determined to a large extent by digital services.
Aren’t small to mid-sized companies actually the best suited for such change?Absolutely. SMEs have every reason to be confident when it comes to digitalisation and should focus on their classic strengths, such as their pioneering spirit. Another advantage is the size of the company and their tight network of customers and suppliers.
What exactly is the potential that new technologies offer for industry?The possibilities are almost unlimited. Innovative technologies and networked processes not only increase the efficiency of day-to-day business, but can also lay the foundations for new business models, even for smaller companies. Take machine learning, for example. The huge amount of data generated by IoT applications can be used to create automated error messages or production processes. In 2018, we developed a variety of prototypes in order to demonstrate the wide range of application possibilities for industrial companies. Networking in particular is playing an increasingly important role. Embedded banking is one example of this.
What is embedded banking?We define embedded banking as the digital dovetailing of banking and production processes. The financial sector and industry are growing ever closer together. In future, banks will offer automated products and services just-in-time along the entire value
chain. The use of new technologies makes it possible to network and financially map production processes which were previously separate. This means that payment transactions can be automated intelligently according to the respective delivery process. For industrial companies, this means greater efficiency and flexibility, as well as cost savings.
What role does GFT play?The underlying technologies used for the digitalisation of the financial sector are the same as those needed for industrial companies. We can therefore transfer our experience and know-how to different value chains. We understand complex payment processes just as well as software development. At the same time, our own culture is one of permanent change and we therefore understand the challenges involved. With the potential that new technologies offer for the digitisation of business processes, we can make industrial companies faster, more agile and more innovative. At the same time, we believe that a holistic approach is important. We know that the first steps in the digital transformation process are difficult, but they are also decisive. This is why we accompany our clients along the entire path – from the development of a digital strategy to its implementation. Thanks to our international development centres, we also have the necessary IT specialists to guarantee reliable delivery.
Connecting – Digital bridges 14 – 15
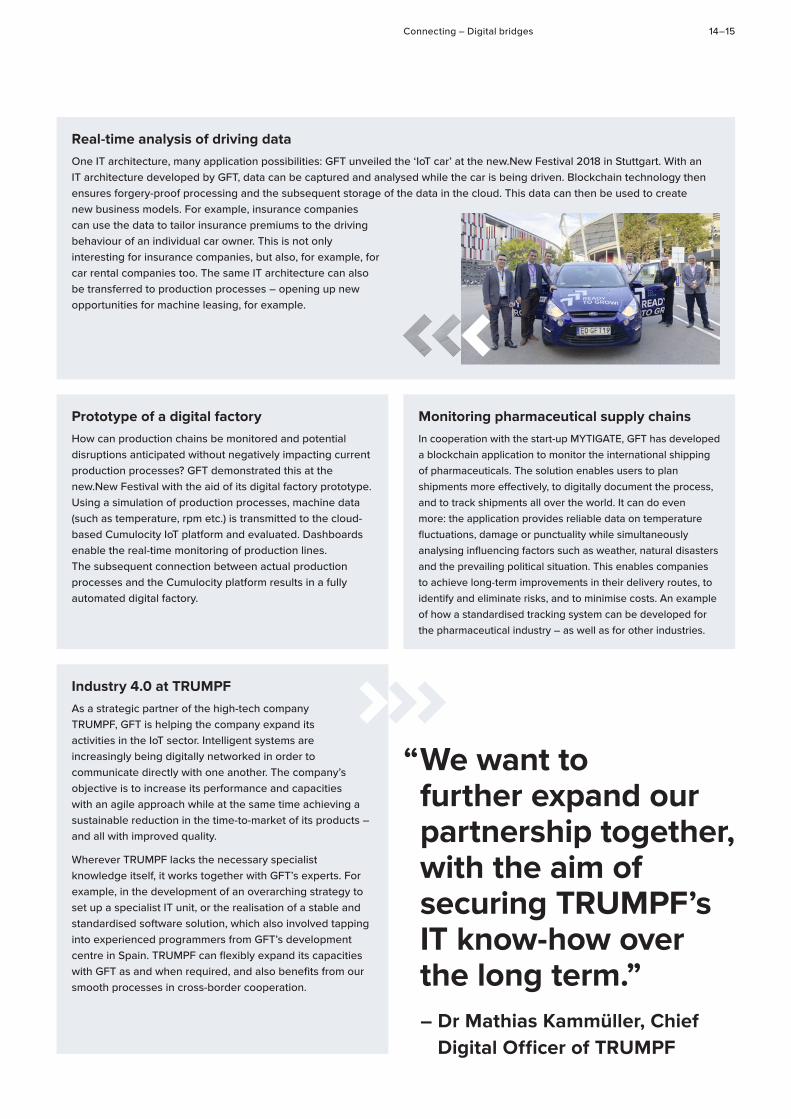
Real-time analysis of driving dataOne IT architecture, many application possibilities: GFT unveiled the ‘IoT car’ at the new.New Festival 2018 in Stuttgart. With an IT architecture developed by GFT, data can be captured and analysed while the car is being driven. Blockchain technology then ensures forgery-proof processing and the subsequent storage of the data in the cloud. This data can then be used to create new business models. For example, insurance companies can use the data to tailor insurance premiums to the driving behaviour of an individual car owner. This is not only interesting for insurance companies, but also, for example, for car rental companies too. The same IT architecture can also be transferred to production processes – opening up new opportunities for machine leasing, for example.
Monitoring pharmaceutical supply chainsIn cooperation with the start-up MYTIGATE, GFT has developed a blockchain application to monitor the international shipping of pharmaceuticals. The solution enables users to plan shipments more effectively, to digitally document the process, and to track shipments all over the world. It can do even more: the application provides reliable data on temperature fluctuations, damage or punctuality while simultaneously analysing influencing factors such as weather, natural disasters and the prevailing political situation. This enables companies to achieve long-term improvements in their delivery routes, to identify and eliminate risks, and to minimise costs. An example of how a standardised tracking system can be developed for the pharmaceutical industry – as well as for other industries.
Prototype of a digital factoryHow can production chains be monitored and potential disruptions anticipated without negatively impacting current production processes? GFT demonstrated this at the new.New Festival with the aid of its digital factory prototype. Using a simulation of production processes, machine data (such as temperature, rpm etc.) is transmitted to the cloud-based Cumulocity IoT platform and evaluated. Dashboards enable the real-time monitoring of production lines. The subsequent connection between actual production processes and the Cumulocity platform results in a fully automated digital factory.
Industry 4.0 at TRUMPFAs a strategic partner of the high-tech company TRUMPF, GFT is helping the company expand its activities in the IoT sector. Intelligent systems are increasingly being digitally networked in order to communicate directly with one another. The company’s objective is to increase its performance and capacities with an agile approach while at the same time achieving a sustainable reduction in the time-to-market of its products – and all with improved quality.
Wherever TRUMPF lacks the necessary specialist knowledge itself, it works together with GFT’s experts. For example, in the development of an overarching strategy to set up a specialist IT unit, or the realisation of a stable and standardised software solution, which also involved tapping into experienced programmers from GFT’s development centre in Spain. TRUMPF can flexibly expand its capacities with GFT as and when required, and also benefits from our smooth processes in cross-border cooperation.
“ We want to further expand our partnership together, with the aim of securing TRUMPF’s IT know-how over the long term.”– Dr Mathias Kammüller, Chief
Digital Officer of TRUMPF
GFT Annual Report 2018
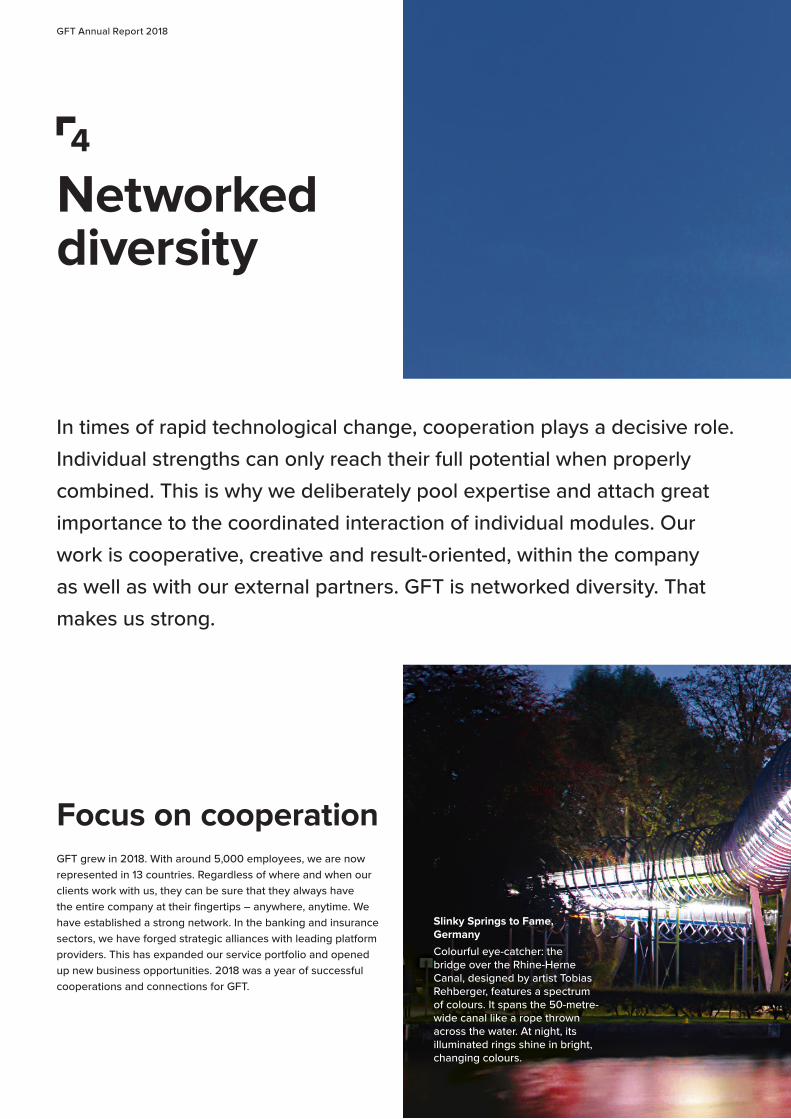
Slinky Springs to Fame, Germany
Colourful eye-catcher: the bridge over the Rhine-Herne Canal, designed by artist Tobias Rehberger, features a spectrum of colours. It spans the 50-metre-wide canal like a rope thrown across the water. At night, its illuminated rings shine in bright, changing colours.
4
Networked diversity
Focus on cooperationGFT grew in 2018. With around 5,000 employees, we are now represented in 13 countries. Regardless of where and when our clients work with us, they can be sure that they always have the entire company at their fingertips – anywhere, anytime. We have established a strong network. In the banking and insurance sectors, we have forged strategic alliances with leading platform providers. This has expanded our service portfolio and opened up new business opportunities. 2018 was a year of successful cooperations and connections for GFT.
In times of rapid technological change, cooperation plays a decisive role.
Individual strengths can only reach their full potential when properly
combined. This is why we deliberately pool expertise and attach great
importance to the coordinated interaction of individual modules. Our
work is cooperative, creative and result-oriented, within the company
as well as with our external partners. GFT is networked diversity. That
makes us strong.

Connecting – Digital bridges 16 – 17
GFT Annual Report 2018
Connections at GFT
Reliable foundation: a strong corporate cultureIn the midst of digital change, it is still people who drive innovation. The heart of GFT is therefore the 5,000 or so people who work for the company. With their varied cultural backgrounds, individual skills and know-how, and unique experiences, they form an extremely strong team. Diversity is the key to our success. In addition to the commitment of each individual, the decisive factor is the collaborative interaction amongst of all our employees.
The basis for this is our corporate culture and the importance of its binding values. They reflect how we work together and with our clients. They connect GFT employees across all countries and cultures. In times of rapid change, they are both a shared foundation and a reliable constant. The core of GFT also includes our passion for innovation, our respect for tried and trusted methods, and our openness for an inspiring exchange of ideas and opinions. That is why we attach such importance to strong networks and are working hard to expand our strategic alliances.
Transnational cooperation: a global delivery modelOur global delivery model pools expertise and regional strengths in order to deploy them flexibly across the company. Colleagues from the entire Group work together across countries and departments on our client projects. This makes us attractive for clients with regard to know-how, flexibility and costs.
To ensure this cooperation is truly seamless, we have professionalised our process and resource management. This includes a shared infrastructure, as well as standardised internal processes and a GFT-wide knowledge management system.
Building bridges to the future: sophisticated innovation managementGFT’s innovation process is open and interactive. The first step is to spot technology trends at an early stage and identify changes in the market. This involves networking with other experts, industry insiders and research institutes. Our Global Business Development unit enables us to react quickly to changing markets and to implement new ideas across all segments.
In the second step, we draw on this inspiration to create new digital business models for our clients. We then simulate future scenarios at GFT’s Digital Innovation Labs using virtual reality components so that we can bring these ideas to life. Our objective here is the rapid development of prototypes and tailored solutions for our clients. We regard the principle of co-innovation with clients and partners as a decisive success factor for pioneering results with a strong practical orientation.
Connecting – Digital bridges 18 – 19
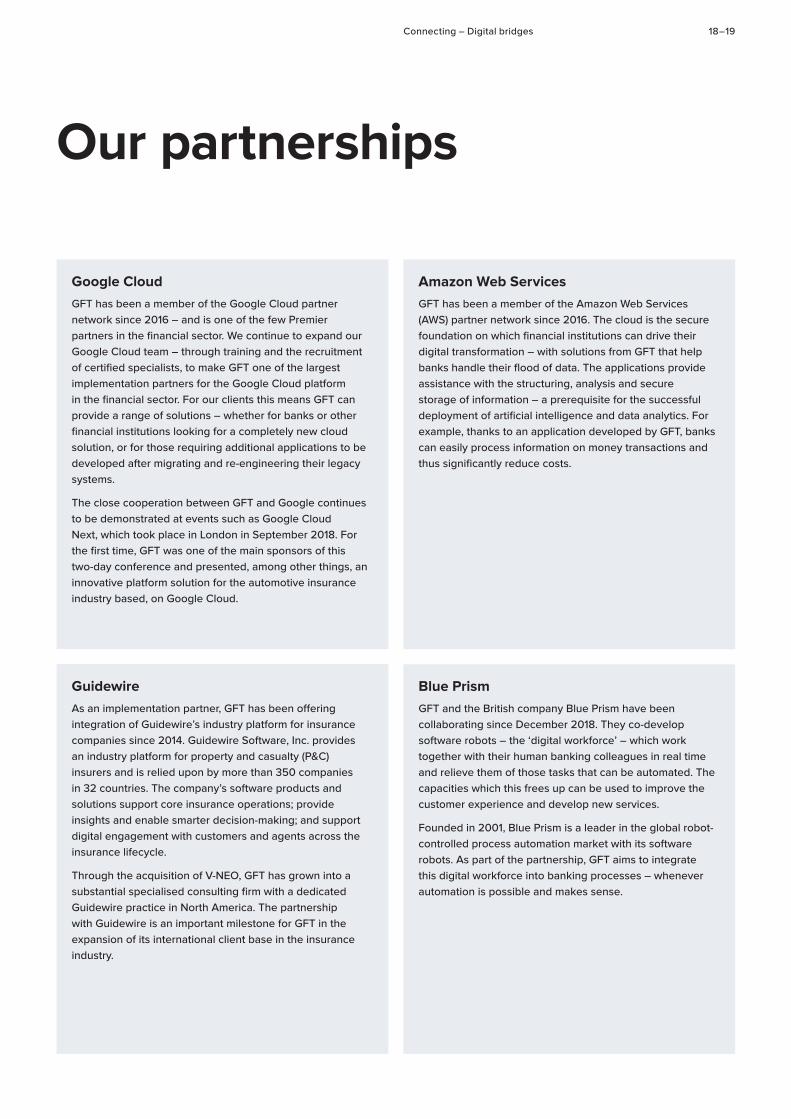
Our partnerships
Google CloudGFT has been a member of the Google Cloud partner network since 2016 – and is one of the few Premier partners in the financial sector. We continue to expand our Google Cloud team – through training and the recruitment of certified specialists, to make GFT one of the largest implementation partners for the Google Cloud platform in the financial sector. For our clients this means GFT can provide a range of solutions – whether for banks or other financial institutions looking for a completely new cloud solution, or for those requiring additional applications to be developed after migrating and re-engineering their legacy systems.
The close cooperation between GFT and Google continues to be demonstrated at events such as Google Cloud Next, which took place in London in September 2018. For the first time, GFT was one of the main sponsors of this two-day conference and presented, among other things, an innovative platform solution for the automotive insurance industry based, on Google Cloud.
GuidewireAs an implementation partner, GFT has been offering integration of Guidewire’s industry platform for insurance companies since 2014. Guidewire Software, Inc. provides an industry platform for property and casualty (P&C) insurers and is relied upon by more than 350 companies in 32 countries. The company’s software products and solutions support core insurance operations; provide insights and enable smarter decision-making; and support digital engagement with customers and agents across the insurance lifecycle.
Through the acquisition of V-NEO, GFT has grown into a substantial specialised consulting firm with a dedicated Guidewire practice in North America. The partnership with Guidewire is an important milestone for GFT in the expansion of its international client base in the insurance industry.
Amazon Web ServicesGFT has been a member of the Amazon Web Services (AWS) partner network since 2016. The cloud is the secure foundation on which financial institutions can drive their digital transformation – with solutions from GFT that help banks handle their flood of data. The applications provide assistance with the structuring, analysis and secure storage of information – a prerequisite for the successful deployment of artificial intelligence and data analytics. For example, thanks to an application developed by GFT, banks can easily process information on money transactions and thus significantly reduce costs.
Blue PrismGFT and the British company Blue Prism have been collaborating since December 2018. They co-develop software robots – the ‘digital workforce’ – which work together with their human banking colleagues in real time and relieve them of those tasks that can be automated. The capacities which this frees up can be used to improve the customer experience and develop new services.
Founded in 2001, Blue Prism is a leader in the global robot-controlled process automation market with its software robots. As part of the partnership, GFT aims to integrate this digital workforce into banking processes – whenever automation is possible and makes sense.
GFT Annual Report 2018
The GFT Group is a global technology partner for the digital transformation of companies. We aim to further expand our international market standing with banks and insurance companies and to strengthen our presence in the new industry sector. Our strategy takes into account the specific requirements of the respective markets; at the same time, we are leveraging our technological expertise to build bridges from the financial sector to the newly targeted industrial sector.
Our key success factors are operational excellence and in-depth knowledge of our clients’ market requirements. This enables GFT to combine competencies within the company in the form of international teams, to advise clients on an equal footing, and to reliably implement highly complex IT projects together with the client. An essential prerequisite for this is our in-depth technological expertise and balanced portfolio of services, which we are systematically expanding across all sectors. Particularly in the use of future technologies, we strive to achieve leadership in our target markets and are therefore committed to investing permanently in our know-how of exponential technologies.
New technologies driving growth
We evaluate technologies according to their market readiness and market growth. Technologies that allow annual growth of more than 20% but have not yet reached full market readiness are defined as exponential technologies 1. With the aid of these technologies, we aim to outperform the market each year. Such trend technologies are typically subject to strong fluctuations: different technologies emerge and some reach market readiness faster than others. In order to ensure sustainable growth, we therefore maintain a balanced portfolio of technologies with different levels of market readiness.
In the long term, we plan to generate around one third of GFT’s consolidated revenue with exponential technologies. We intend to generate a further third of revenue with established technologies, such as Guidewire or Avaloq. The maintenance and ongoing development of existing applications, referred to as application management, is also expected to generate around one third of consolidated revenue and contribute to the stability of the overall revenue trend. In 2019, our aim is to generate 30% of consolidated revenue with exponential technologies. In view of the current strong demand for applications based on cloud technology, we aim to double revenue with cloud solutions to at least €20 million in 2019.
Banks: consolidating our leading role
In the financial sector, GFT is one of the world’s leading IT service providers. Our portfolio of services focuses on digitalisation, which will continue to require considerable IT investments from financial institutions over the coming years. Banks need to develop innovative applications and at the same time modernise their infrastructures and core processes. GFT assists financial institutions with the renewal of their core banking systems, the restructuring of their data architecture and the implementation of their regulatory compliance projects. Since productivity is the decisive factor in times of budget restrictions, our proven reliability and quality in project implementation are key competitive factors. Banks also value us as an IT partner when it comes to efficiently leveraging new technologies. We develop innovative, user-friendly applications which we package into attractive offerings based on exponential technologies – within financial services, we call this ‘exponential banking’.
With the aid of strategic partnerships and our range of services in the field of exponential technologies, we aim to expand our business relationships with existing clients and attract new ones. In 2019, we expect significant growth momentum in the European retail banking sector, where demand for exponential banking solutions is growing. For many European banks the renewal of their core banking systems is also on the agenda in the near future. In North America and the UK, we see growth potential among mid-sized investment banks, and in Mexico in the retail segment – both noticeably driven by strategic partnerships and the application of new technologies.
Insurance companies: expanding our market position
With attractive offerings based on exponential technologies and strong partnerships with platform providers, we can meet the demand from insurance companies for digitalisation solutions, which enhance efficiency and customer loyalty. Our aim is to position the GFT Group as the leading IT service provider for digitalisation in the insurance sector.
In 2018, we were able to strengthen our sector expertise with the acquisition of the Canadian IT service provider V-NEO. We now plan to leverage this strong starting position by expanding our market standing in North America. We have already succeeded in building bridges to Europe via our first transcontinental projects, where we have laid the foundation for expanding our Guidewire activities.
Strong partner for digitalisation

Strategy 20 – 21
Our business continues to be based on the proven model of highly qualified on-site consultants in North America and Europe as well as development teams in Canada. We are also planning to establish a nearshore centre of excellence for Guidewire development capacities in Poland in 2019 as well as establishing additional local development capacity in France, Italy, Spain and Germany in order to minimise the language barrier – especially for mid-sized insurers – when using nearshore capacity.
In 2019, we expect dynamic growth from the development of integrated IT solutions and the implementation of Guidewire services. We plan to expand our group-wide Guidewire business and start generating revenue with Oracle’s solution for life insurance companies. In 2019, we aim to raise the proportion of consolidated revenue generated with solutions for insurance companies from 6% to 10%.
Industry: strengthening our presence
In 2017, we began to offer our technological expertise – already well established in the financial services sector – to industrial companies, in order to meet the growing global demand for IT solutions in the field of Industry 4.0. For the digital transformation of their traditional industrial processes, companies need comprehensive know-how in new information technologies. We believe this offers dynamic growth opportunities for the GFT Group.
Our strategy is aimed at providing industrial companies in various sectors with holistic support for their digital transformation processes – from the development of a digital strategy to its implementation. Our range of services covers the implementation of IoT services for data acquisition and analysis, as well as the integration of technologies and platforms. Against the background of an increasing shortage of IT specialists, our international development centres also offer the necessary capacities for the flexible and high-quality implementation of software projects.
We continue to invest consistently in the development of our solution portfolio and sales team and expect further growth in the field of industrial solutions in 2019. We plan to expand our business relationships with existing clients and win new ones. Our main focus is on mid-sized companies in Germany and industrial companies in Italy and Spain.
Strength to innovate and international network
In order to ensure our innovative strength in the long term, we continue to work on optimising our group-wide innovation management. With the establishment of the Global Business Development unit, we have adapted our structures to the requirements of fast-changing markets. This enables us to react in an even more focused manner and to transfer knowledge from one market, or client to another.
One important success factor is our strategic cooperation with leading platform providers, which gives us access to new countries and markets. We are one of the few IT service providers for banks to maintain a strategic premium partnership with Google. In the insurance business, we cooperate closely with Guidewire. We aim to further expand our partner status with AWS (Amazon Web Services) and continue to invest in strategic partnerships. Together with industry leaders, we plan to cooperate more on pioneering reference projects in 2019.
Medium-term outlook
Our strategic activities are aimed at achieving sustainable growth of the GFT Group’s enterprise value. With the successful implementation of the measures initiated so far, we are still on the path to profitable growth – without the consideration of our top-2 clients 2. Against the backdrop of an ongoing volatile business trend amongst our top-2 clients, we have decided to suspend our medium-term outlook for 2022. However, we do plan to maintain our consistently solid balance sheet structure with a dividend policy based on continuity of 20 – 40% of consolidated net profit. In order to strengthen and expand our position as the technology partner for banks, insurers and industrial companies, we will invest permanently in our know-how of exponential technologies.
1 GFT defines exponential technologies as DLT / blockchain, artificial intelligence, data analytics, cloud and DevOps.
2 GFT’s top-2 clients are defined as Deutsche Bank and Barclays.
GFT Annual Report 2018
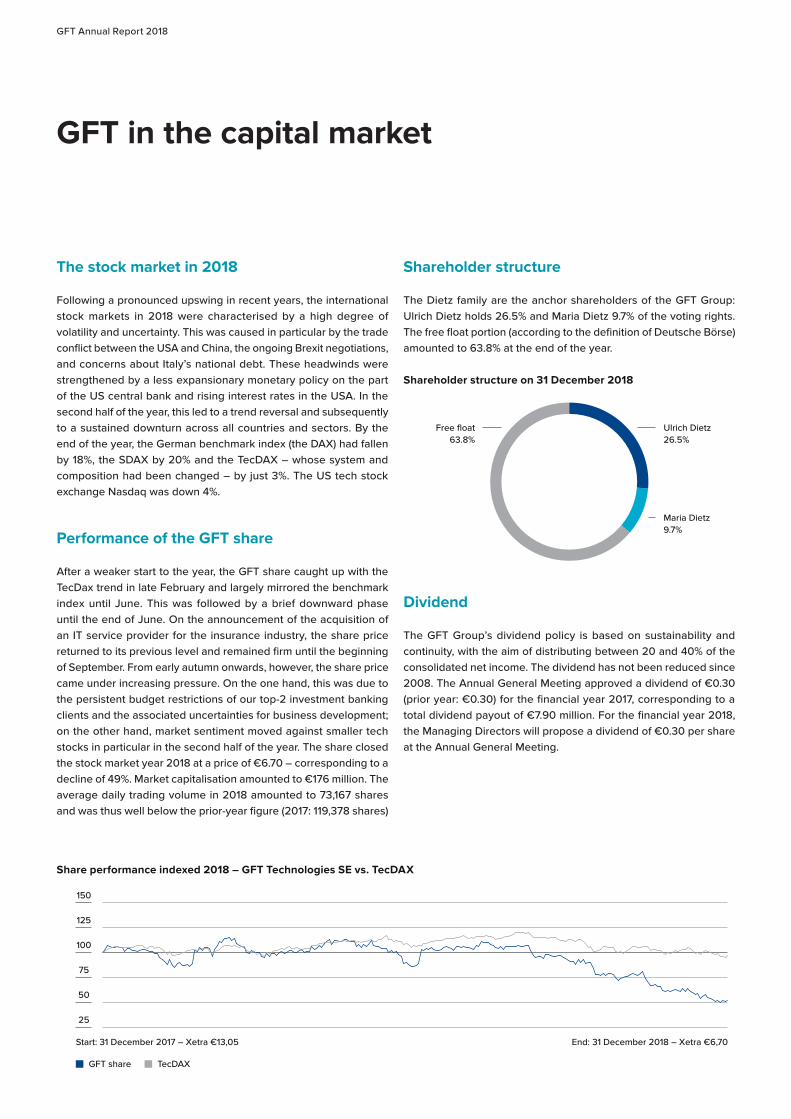
The stock market in 2018
Following a pronounced upswing in recent years, the international stock markets in 2018 were characterised by a high degree of volatility and uncertainty. This was caused in particular by the trade conflict between the USA and China, the ongoing Brexit negotiations, and concerns about Italy’s national debt. These headwinds were strengthened by a less expansionary monetary policy on the part of the US central bank and rising interest rates in the USA. In the second half of the year, this led to a trend reversal and subsequently to a sustained downturn across all countries and sectors. By the end of the year, the German benchmark index (the DAX) had fallen by 18%, the SDAX by 20% and the TecDAX – whose system and composition had been changed – by just 3%. The US tech stock exchange Nasdaq was down 4%.
Performance of the GFT share
After a weaker start to the year, the GFT share caught up with the TecDax trend in late February and largely mirrored the benchmark index until June. This was followed by a brief downward phase until the end of June. On the announcement of the acquisition of an IT service provider for the insurance industry, the share price returned to its previous level and remained firm until the beginning of September. From early autumn onwards, however, the share price came under increasing pressure. On the one hand, this was due to the persistent budget restrictions of our top-2 investment banking clients and the associated uncertainties for business development; on the other hand, market sentiment moved against smaller tech stocks in particular in the second half of the year. The share closed the stock market year 2018 at a price of €6.70 – corresponding to a decline of 49%. Market capitalisation amounted to €176 million. The average daily trading volume in 2018 amounted to 73,167 shares and was thus well below the prior-year figure (2017: 119,378 shares)
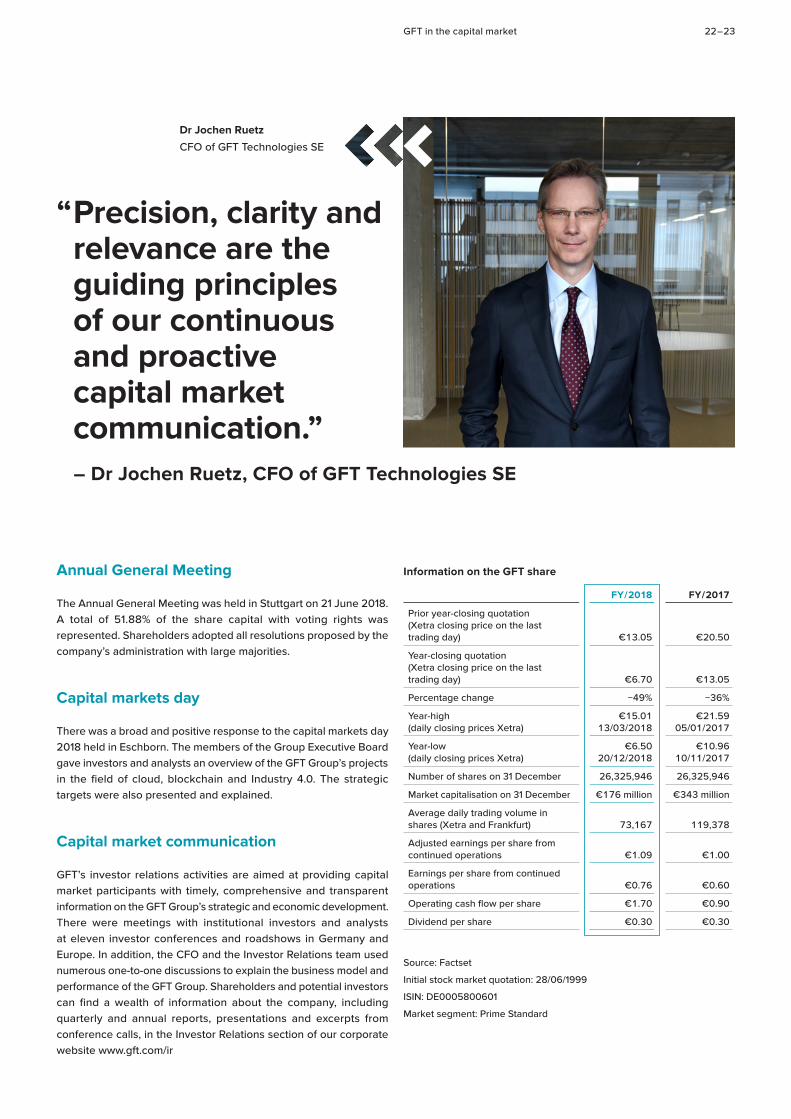
Shareholder structure
The Dietz family are the anchor shareholders of the GFT Group: Ulrich Dietz holds 26.5% and Maria Dietz 9.7% of the voting rights. The free float portion (according to the definition of Deutsche Börse) amounted to 63.8% at the end of the year.
Dividend
The GFT Group’s dividend policy is based on sustainability and continuity, with the aim of distributing between 20 and 40% of the consolidated net income. The dividend has not been reduced since 2008. The Annual General Meeting approved a dividend of €0.30 (prior year: €0.30) for the financial year 2017, corresponding to a total dividend payout of €7.90 million. For the financial year 2018, the Managing Directors will propose a dividend of €0.30 per share at the Annual General Meeting.
Ulrich Dietz26.5%
Free float63.8%
Maria Dietz9.7%
Shareholder structure on 31 December 2018
Share performance indexed 2018 – GFT Technologies SE vs. TecDAX
GFT share TecDAX
Start: 31 December 2017 – Xetra €13,05
50
25
100
75
150
125
End: 31 December 2018 – Xetra €6,70
GFT in the capital market
GFT in the capital market 22 – 23
Annual General Meeting
The Annual General Meeting was held in Stuttgart on 21 June 2018. A total of 51.88% of the share capital with voting rights was represented. Shareholders adopted all resolutions proposed by the company’s administration with large majorities.
Capital markets day
There was a broad and positive response to the capital markets day 2018 held in Eschborn. The members of the Group Executive Board gave investors and analysts an overview of the GFT Group’s projects in the field of cloud, blockchain and Industry 4.0. The strategic targets were also presented and explained.
Capital market communication
GFT’s investor relations activities are aimed at providing capital market participants with timely, comprehensive and transparent information on the GFT Group’s strategic and economic development. There were meetings with institutional investors and analysts at eleven investor conferences and roadshows in Germany and Europe. In addition, the CFO and the Investor Relations team used numerous one-to-one discussions to explain the business model and performance of the GFT Group. Shareholders and potential investors can find a wealth of information about the company, including quarterly and annual reports, presentations and excerpts from conference calls, in the Investor Relations section of our corporate website www.gft.com/ir
Information on the GFT share
FY / 2018 FY / 2017
Prior year-closing quotation (Xetra closing price on the last trading day) €13.05 €20.50
Year-closing quotation (Xetra closing price on the last trading day) €6.70 €13.05
Percentage change −49% −36%
Year-high (daily closing prices Xetra)
€15.01 13/03/2018
€21.59 05/01/2017
Year-low (daily closing prices Xetra)
€6.50 20/12/2018
€10.96 10/11/2017
Number of shares on 31 December 26,325,946 26,325,946
Market capitalisation on 31 December €176 million €343 million
Average daily trading volume in shares (Xetra and Frankfurt) 73,167 119,378
Adjusted earnings per share from continued operations €1.09 €1.00
Earnings per share from continued operations €0.76 €0.60
Operating cash flow per share €1.70 €0.90
Dividend per share €0.30 €0.30
Source: Factset
Initial stock market quotation: 28/06/1999
ISIN: DE0005800601
Market segment: Prime Standard
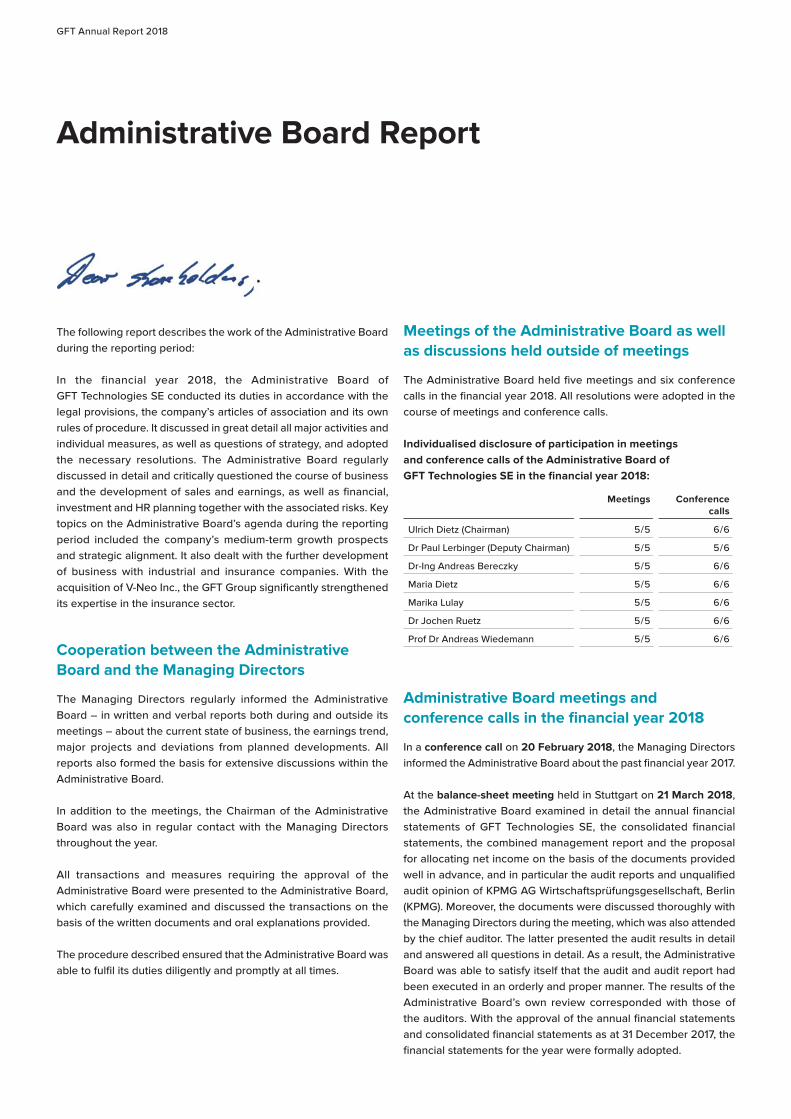
“ Precision, clarity and relevance are the guiding principles of our continuous and proactive capital market communication.”– Dr Jochen Ruetz, CFO of GFT Technologies SE
Dr Jochen Ruetz
CFO of GFT Technologies SE
GFT Annual Report 2018
The following report describes the work of the Administrative Board during the reporting period:
In the financial year 2018, the Administrative Board of GFT Technologies SE conducted its duties in accordance with the legal provisions, the company’s articles of association and its own rules of procedure. It discussed in great detail all major activities and individual measures, as well as questions of strategy, and adopted the necessary resolutions. The Administrative Board regularly discussed in detail and critically questioned the course of business and the development of sales and earnings, as well as financial, investment and HR planning together with the associated risks. Key topics on the Administrative Board’s agenda during the reporting period included the company’s medium-term growth prospects and strategic alignment. It also dealt with the further development of business with industrial and insurance companies. With the acquisition of V-Neo Inc., the GFT Group significantly strengthened its expertise in the insurance sector.
Cooperation between the Administrative Board and the Managing Directors
The Managing Directors regularly informed the Administrative Board – in written and verbal reports both during and outside its meetings – about the current state of business, the earnings trend, major projects and deviations from planned developments. All reports also formed the basis for extensive discussions within the Administrative Board.
In addition to the meetings, the Chairman of the Administrative Board was also in regular contact with the Managing Directors throughout the year.
All transactions and measures requiring the approval of the Administrative Board were presented to the Administrative Board, which carefully examined and discussed the transactions on the basis of the written documents and oral explanations provided.
The procedure described ensured that the Administrative Board was able to fulfil its duties diligently and promptly at all times.
Meetings of the Administrative Board as well as discussions held outside of meetings
The Administrative Board held five meetings and six conference calls in the financial year 2018. All resolutions were adopted in the course of meetings and conference calls.
Individualised disclosure of participation in meetings and conference calls of the Administrative Board of GFT Technologies SE in the financial year 2018:
Meetings Conference calls
Ulrich Dietz (Chairman) 5 / 5 6 / 6
Dr Paul Lerbinger (Deputy Chairman) 5 / 5 5 / 6
Dr-Ing Andreas Bereczky 5 / 5 6 / 6
Maria Dietz 5 / 5 6 / 6
Marika Lulay 5 / 5 6 / 6
Dr Jochen Ruetz 5 / 5 6 / 6
Prof Dr Andreas Wiedemann 5 / 5 6 / 6
Administrative Board meetings and conference calls in the financial year 2018
In a conference call on 20 February 2018, the Managing Directors informed the Administrative Board about the past financial year 2017.
At the balance-sheet meeting held in Stuttgart on 21 March 2018, the Administrative Board examined in detail the annual financial statements of GFT Technologies SE, the consolidated financial statements, the combined management report and the proposal for allocating net income on the basis of the documents provided well in advance, and in particular the audit reports and unqualified audit opinion of KPMG AG Wirtschaftsprüfungsgesellschaft, Berlin (KPMG). Moreover, the documents were discussed thoroughly with the Managing Directors during the meeting, which was also attended by the chief auditor. The latter presented the audit results in detail and answered all questions in detail. As a result, the Administrative Board was able to satisfy itself that the audit and audit report had been executed in an orderly and proper manner. The results of the Administrative Board’s own review corresponded with those of the auditors. With the approval of the annual financial statements and consolidated financial statements as at 31 December 2017, the financial statements for the year were formally adopted.
Administrative Board Report

Administrative Board Report 24 – 25
At the same meeting, the current and future development of business for the GFT Group in the UK and USA was also discussed in detail, as was the Group’s business with industrial clients. Moreover, the Administrative Board adopted the agenda for the Annual General Meeting 2018. The auditors proposed for election had previously confirmed that there were no circumstances which might cast doubt on their independence.
The Administrative Board also set up a committee which decides exclusively on matters concerning a consultancy agreement which GFT Technologies SE concluded with a company whose sole owner and managing director is the Chairman of the Administrative Board.
In the absence of the Managing Directors, the Administrative Board adopted a resolution regarding the personal targets for the Managing Directors for the financial year 2018. With regard to their variable compensation, the Administrative Board also adopted a resolution regarding the degree to which the targets of the Managing Directors had been achieved for the financial year 2017.
In a conference call on 24 April 2018, the Administrative Board discussed the non-financial group report for the financial year 2017, which all members had received in due time prior to the conference call. KMPG audited the separate non-financial corporate report in a “limited assurance” engagement and issued an unqualified audit
“ Digital transformation opens up promising opportunities for us across all industries. As a leading technology partner for our clients, GFT is excellently positioned to play a leading role in the digitalisation process.”– Ulrich Dietz, Chairman of the Administrative Board
Ulrich Dietz
Chairman of the Administrative Board
GFT Annual Report 2018
opinion. The Administrative Board also reviewed the report and raised no objections.
Furthermore, the Managing Directors informed the Administrative Board about the intended acquisition of all shares in V-Neo Inc., domiciled in Québec, Canada.
At a meeting in Eschborn on 7 May 2018, the Managing Directors presented the results for the first quarter of 2018, the quarterly announcement and the current forecast for the financial year. In addition, the Administrative Board was informed about the GFT Group’s business in Germany. The local management team explained in detail the current situation and trend, as well as the strategy regarding the medium- and long-term development and retention of personnel.
During a conference call on 13 June 2018, the Managing Directors informed the Administrative Board in detail about the progress of talks regarding the intended acquisition of V-Neo Inc.
At its meeting in Stuttgart on 20 June 2018, the Administrative Board discussed the Annual General Meeting taking place on the following day. It also dealt with the planned conclusion of a partnership agreement between GFT Technologies SE and CODE_n GmbH with respect to the new.New Festival 2018 in Stuttgart and adopted the necessary resolutions.
Following detailed consultation, the Administrative Board resolved to purchase all shares in V-Neo Inc. during a conference call on 3 July 2018.
The results for the first six months of 2018 and the half-yearly financial report were the topics of the conference call held on 6 August 2018.
In a conference call on 28 September 2018 – held between the regular meetings – the Managing Directors informed the Administrative Board about the current course of business for the GFT Group.
At its meeting in Stuttgart on 5 November 2018, the Administrative Board discussed in detail the results for the third quarter of 2018 and the quarterly statement.
At the meeting held in Stuttgart on 11 December 2018, the Managing Directors reported on the status of budget planning for the financial year 2019 and the company’s medium-term strategy. The Administrative Board issued the Declaration of Compliance with the German Corporate Governance Code (GCGC) according to section 22 (6) SEAG in conjunction with section 161 AktG and adopted a resolution to set the main audit topics for the auditing of the annual financial statements.
Committees
In the past, the Administrative Board refrained from forming any committees. Due to the low number of its members, it was felt that no committees were needed to ensure the efficiency of the Administrative Board’s activities. All members of the Administrative Board are fully informed and involved in all decisions. This continues to apply without restriction.
Nevertheless, at its meeting on 21 March 2018, the Administrative Board set up a committee to decide on matters concerning a consultancy agreement which GFT Technologies SE concluded with a company whose sole owner and managing director is the Chairman of the Administrative Board, Ulrich Dietz. The sole purpose of the committee is to exclude potential conflicts of interest from the outset when deliberating on and adopting resolutions. It consists of three independent Administrative Board members: Prof Dr Andreas Wiedemann, Dr Paul Lerbinger and Dr-Ing Andreas Bereczky.
The committee met once in the financial year 2018, on 28 September 2018. The committee subsequently informed the Administrative Board in detail about its work.
Corporate Governance and Declaration of Compliance
In the financial year 2018, the Administrative Board once again regularly discussed the rules of good corporate governance and their application within the GFT Group. Detailed information on the corporate governance principles and their implementation within the GFT Group is presented in the Corporate Governance Report.
At its meeting on 11 December 2018, the Administrative Board issued its Declaration of Compliance on the German Corporate Governance Code according to section 22 (6) SEAG in conjunction with section 161 AktG. It was published on the company’s website www.gft.com/governance on 12 December 2018 and is also included in the Corporate Governance Statement, which is also available online under the same link.
Conflicts of interest and their treatment
In order to avoid any suspicion of a conflict of interest, Administrative Board members do not participate in discussions or the adoption of resolutions on transactions between themselves and GFT Technologies SE, or companies belonging to the GFT Group. This also applies if the contractual partner is not the member of the Administrative Board himself but a company for which the Administrative Board member works or in which he holds a controlling interest. In order to exclude any potential conflict of interest during consultation and the adoption of resolutions concerning the above mentioned consultancy agreement, the Administrative Board has set up a committee consisting of three independent members of the Administrative Board.
Administrative Board Report 26 – 27
Efficiency review
In accordance with section 5.6 GCGC, the Administrative Board conducted a regular review of the efficiency of its activities in the financial year 2018. This self-evaluation was made on the basis of an extensive company-specific questionnaire. The positive results of this efficiency review were presented and discussed in detail at the meeting on 11 December 2018. It did not result in any need for action.
Annual financial statements and consolidated financial statements 2018
The annual financial statements as at 31 December 2018 of GFT Technologies SE, the consolidated financial statements as at 31 December 2018, and the combined management report for the GFT Group and GFT Technologies SE were audited by KPMG, which awarded an unqualified audit opinion in each case. As part of the audit remit, the auditors also concluded that the Administrative Board had taken appropriate steps to fulfil its tasks pursuant to section 22 (3) sentence 2 SEAG, in particular to establish a monitoring system, and concluded that this monitoring system was suitable for the early detection of developments which might jeopardise the continued existence of the company.
KPMG has audited the Financial Statements of GFT Technologies SE and the Consolidated Financial Statements of the Group since the financial year 2012. Arne Stratmann signed the auditors’ report for the first time for the financial year 2017 and Eduard Bauer for the first time for the financial year 2012.
Each member of the Administrative Board received in good time: the annual financial statements, the consolidated financial statements and the combined management report as at 31 December 2018, the audit reports of the auditors, the other documents to be examined – including the non-financial group report – and the proposal of the Managing Directors for the allocation of net income. All of the documents prepared by the company were explained in detail by the Managing Directors at the Administrative Board meeting of 21 March 2019. In particular, the Administrative Board discussed the key audit matters described in the audit certificates, as well as the audit procedures performed. The meeting was attended by the chief auditor. He reported on the priorities and the results of the audit and explained the audit reports. Moreover, he answered in detail all questions relating to the key audit matters and the audit procedures performed. He also stated that no material weaknesses in the internal control system and risk management system in relation to the financial reporting process had been detected.
The qualification, independence and efficiency of the auditors was checked by the Administrative Board, especially in connection with discussions on the annual financial statements, the half-yearly financial report and the quarterly statements. The chief auditor reported on other services rendered as well as those which have been contractually agreed for the financial year 2019. He declared that pursuant to sections 7.2.1 (1) GCGC there were no circumstances which might have impaired his independent and unbiased audit.
The Administrative Board examined itself all documents submitted on the annual and consolidated financial statements, including the audit reports of the auditors, and discussed any issues – especially with regard to the key audit matters – at length with the Managing Directors and the chief auditor. It is the firm belief of the Administrative Board that these documents were prepared in an orderly manner and comply with statutory requirements. The Administrative Board has no objections and, on the basis of its own review, concurs with the findings of the audit. At its meeting on 21 March 2019, it approved the annual financial statements for 2018 of GFT Technologies SE and the consolidated financial statements of the GFT Group for 2018, as prepared by the Managing Directors, with a corresponding resolution. The annual financial statements of GFT Technologies SE for 2018 were thus adopted. On the basis of its own review, and in consideration of the economic situation of the company, the Administrative Board believes that the proposal of the Managing Directors concerning the allocation of net income and a dividend payment of €0.30 per ordinary share entitled to dividends is reasonable and therefore supports this proposal.
KMPG also audited the non-financial group report in a “limited assurance” engagement and issued an unqualified audit opinion. The Administrative Board also reviewed the report and raised no objections.
Thank you
The Administrative Board would like to thank the Managing Directors and all employees of the GFT Group’s companies in Germany and abroad for their work in the financial year 2018. It is also indebted to the company’s shareholders for their continued trust.
Stuttgart, 21 March 2019
For the Administrative Board
Ulrich DietzChairman of the Administrative Board
GFT Annual Report 2018
The Administrative Board regards corporate governance as a system for good and responsible management of the company. It is an important foundation for the sustainable value creation of the GFT Group.
Corporate governance of GFT Technologies SE and the GFT Group
GFT Technologies SE is a European Company (SE) listed in Germany. It is primarily subject to the guidelines of Regulation (EC) number 2157 / 2001 of 8 October 2001 on the Statute for a European Company (SE Regulation) and the German Act Implementing Regulation (EC) number 2157 / 2001 on the Statute for a European Company (“SE-Ausführungsgesetz” – SEAG). Insofar as the SE Regulation and the SEAG do not contain more specific regulations, the German Stock Corporation Act (Aktiengesetz – AktG) also applies, among others. Further elements of corporate governance are the articles of association of GFT Technologies SE and the rules of procedure for the Administrative Board and the Managing Directors.
With a few justified exceptions, GFT Technologies SE observes the recommendations of the GCGC (www.dcgk.de/en). The latest Declaration of Compliance of the Administrative Board of GFT Technologies SE concerning the recommendations of the “Government Commission on the German Corporate Governance Code” is permanently available on the corporate website of GFT Technologies SE at (www.gft.com/governance). This also applies to declarations of compliance submitted in previous years.
The Administrative Board of GFT Technologies SE regularly considers the structuring of the corporate governance of the company and the Group. It observes all legal regulations and the recommendations of the government commission’s latest German Corporate Governance Code (GCGC), insofar as no deviations are explained in its Declaration of Compliance.
In addition, the respective local legislation applies for the companies belonging to the GFT Group. The rules of procedure for these affiliated companies take both these regulations into account as well as those of the Group’s parent company GFT Technologies SE.
The Managing Directors and all managers of the GFT Group are responsible for the implementation of corporate governance in the consolidated companies.
Shareholders, Annual General Meeting and Investor Relations
Shareholders exercise their rights and cast their votes at the General Meeting of GFT Technologies SE, where they can interact directly with the Administrative Board and the Managing Directors. The Annual General Meeting is held once per calendar year. GFT Technologies SE publishes the necessary documents and information on its website in preparation for the event. Shareholders can cast their votes at the General Meeting either in person or via a proxy of their choice. The company also appoints one or more proxies who are bound by the voting instructions received. Shareholders can issue their instructions to these proxies in writing, by fax or electronically. Those shareholders attending the General Meeting can also instruct a proxy to vote for them in accordance with the conditions announced at the General Meeting.
The company provides its shareholders, as well as financial analysts, shareholders’ associations, the media and interested members of the public, with regular and up-to-date information on the development of business. Information on the company’s extensive Investor Relations activities is presented on the website of GFT Technologies SE (www.gft.com/ir). There is also a financial calendar here with sufficient advance notification of important regular publications (such as the consolidated financial statements and annual financial statements, the half-yearly financial report and the interim statements), as well as the dates of the Annual General Meeting and the analysts’ conferences. The latest investor presentations and analyst assessments are also available here.
Governing, supervisory and management bodies, single-tier management and control structure
GFT Technologies SE has a single-tier management and control structure. It is characterised by the fact that the company is managed and supervised by a single executive body, the Administrative Board. The Managing Directors are responsible for the company’s operating business.
Corporate Governance Report
Corporate Governance Report 28 – 29
Administrative Board
The Administrative Board of GFT Technologies SE consists of seven members. It comprises leading business figures with detailed knowledge and international experience of the IT sector, banking, finance and law. The Administrative Board consists exclusively of shareholder representatives.
Details on the members of the Administrative Board including their CVs are available on the website of GFT Technologies SE (www.gft.com/administrative-board). In the financial year 2018, two of the seven members of the Administrative Board were appointed as Managing Directors; consequently, the non-executive members of the Administrative Board were in the majority.
All members of the Administrative Board were elected by the Annual General Meeting of 23 June 2015 for the period ending on expiry of the Annual General Meeting which decides on discharge for the financial year 2020, but for no longer than six years per term. Two members of the Administrative Board already served on the Supervisory Board of GFT Technologies AG before its conversion to GFT Technologies SE in 2015: Dr Paul Lerbinger as of 14 January 2011 (in the period from 31 May 2011 to 31 May 2017, he was Chairman of the Supervisory Board and after the company’s conversion Chairman of the Administrative Board) and Dr-Ing Andreas Bereczky as of 31 May 2011.
The Administrative Board is responsible for management in a single-tier system, whereas this role is allocated to the Executive Board in a dual-tier system. During the conversion of GFT Technologies AG into a single-tier SE company in 2015, the aim was to achieve the greatest possible continuity in the company’s management. For this reason, the first Administrative Board of GFT Technologies SE includes three former members of the Executive Board of GFT Technologies AG. In the financial year 2018, two of these persons were appointed as Managing Directors.
Information about the meetings of the Administrative Board in the financial year 2018 is published in the Administrative Board Report contained in the Annual Report 2018. Information on the working procedures of the Administrative Board can be found in the combined Corporate Governance Statement. This is published on the website of GFT Technologies SE (www.gft.com/governance).
Skills profile, targets for composition and independenceThe Administrative Board has adopted a skills profile for its members and targets for its composition.
Skills profileThe members of the Administrative Board as a whole should have the essential skills required in view of the GFT Group’s activities. In particular, these include in-depth management experience and knowledge for a capital market-oriented, internationally operating group, in the area of corporate strategy and development, and in other key areas such as controlling and risk management, auditing, legal affairs and compliance.
In accordance with section 27 (1) sentence 4 SEAG in conjunction with section 100 (5) AktG, at least one member of the Administrative Board must also have expertise in the areas of accounting or auditing and the members as a whole must be acquainted with the information technology industry.
Targets for compositionThe Administrative Board of GFT Technologies SE should also be composed in such a way that more than half the members are independent, conflicts of interest are avoided, the ownership structure is reflected, and diversity is taken into account.
The Administrative Board has set targets for the proportion of female members in line with statutory obligations arising from the German law on the equal participation of women and men in leadership positions in the private and the public sectors of 24 April 2015. On 30 May 2017, the Administrative Board resolved that the share of women on the Administrative Board was to be 28.6% on 30 June 2022.
A regular limit to the term of office for Administrative Board members has not been set, in derogation from number 5.4.1 (2) GCGC. A regular limit would contradict the desired continuity in the management of the company by the Administrative Board.
Achievement of composition targetsThe current Administrative Board meets the desired skills profile. The members as a whole are acquainted with the sector in which the company operates. Moreover, the Administrative Board meets all targets regarding composition, including the determined share of female members.
IndependenceThe Administrative Board believes that four of its members are independent as defined by 5.4.2 GCGC: these are Dr Paul Lerbinger, Dr-Ing Andreas Bereczky, Maria Dietz and Prof Dr Andreas Wiedemann. In accordance with the GCGC, the Administrative Board also believes that family or business relations with shareholders or between members of the Administrative Board only call its independence into question if these relations might lead to permanent conflicts of interest. There were no such conflicts in the financial year 2018.
GFT Annual Report 2018
Disclosures on the respective professions of Administrative Board members and a list of the seats they hold on mandatory supervisory boards or comparable committees in Germany and abroad are contained in the CVs provided online (www.gft.com/administrative-board). Disclosures on their relations with related companies and persons are presented in the notes to the consolidated financial statements.
Managing Directors
GFT Technologies SE has two Managing Directors. Marika Lulay is the Chair of the Managing Directors and Chief Executive Officer (CEO). Dr Jochen Ruetz is appointed as a further Managing Director. The divisions they head are presented in the notes to the consolidated financial statements.
Information on the working procedures of the Managing Directors is provided in the combined Corporate Governance Statement for the GFT Group and GFT Technologies SE (www.gft.com/governance).
In addition, a Group Executive Board has been set up to support the Managing Directors in the execution of their tasks. Its remit is to advise and prepare decisions.
Remuneration for members of the Administrative Board and the Managing Directors
Disclosures on remuneration for members of the Administrative Board and the Managing Directors are to be found in the Remuneration Report section of the combined management report for the GFT Group and GFT Technologies SE. There are no stock option programmes or similar equity-based incentive systems.
Managers’ transactions
In accordance with article 19 of regulation (EU) number 596 / 2014 of 16 April 2014 on market abuse (Market Abuse Regulation), all persons performing managerial duties and persons closely related to them must report within three business days all transactions with shares of GFT Technologies SE and related financial instruments to the issuer and the German Federal Financial Supervisory Authority. However, this only applies to transactions made after a total volume of €5,000 within a calendar year has been reached.
GFT Technologies SE must publish the corresponding information without delay, and no later than three business days after receipt.
The information received and published by GFT Technologies SE can be found online at www.gft.com/governance. It is also printed in the Company Register.
Compliance
It is an overriding principle of the Administrative Board that all employees of the GFT Group comply with legally and ethically correct procedures in their daily business. The most important principles of the GFT Group on this matter are summarised in the “Code of Ethics & Code of Conduct”. A compliance management system based on the GFT Group’s risk situation has been introduced. It comprises the following levels of action: prevention, detection, reaction and improvement.
The Compliance Office set up by the Administrative Board is responsible for the group-wide implementation of the compliance management system. The Compliance Office prepares guidelines and instructions, conducts training and provides advice in individual cases.
Employees are encouraged to report infringements of laws or corporate guidelines. Various communication channels are available for this purpose. If there is any suspicion of misconduct, the Compliance Office leads the investigation efforts.
The Administrative Board continuously analyses the business structure, group size, areas of activity, regional orientation and many other aspects. It is assisted by the Compliance Office. Based on this analysis, the Administrative Board assesses the compliance and reputational risks arising from the company’s business operations. Where necessary, it initiates the appropriate adjustments to the compliance management system.
Combined Management Report 30 – 31
1 Basic principles of the Group 32
2 Economic report 35
3 Risk report 46
4 Opportunity report 54
5 Takeover-relevant information 56
6 Remuneration Report 59
7 Forecast report 62
8 Explanations on the separate financial statements (HGB) 64
Combined Management Report
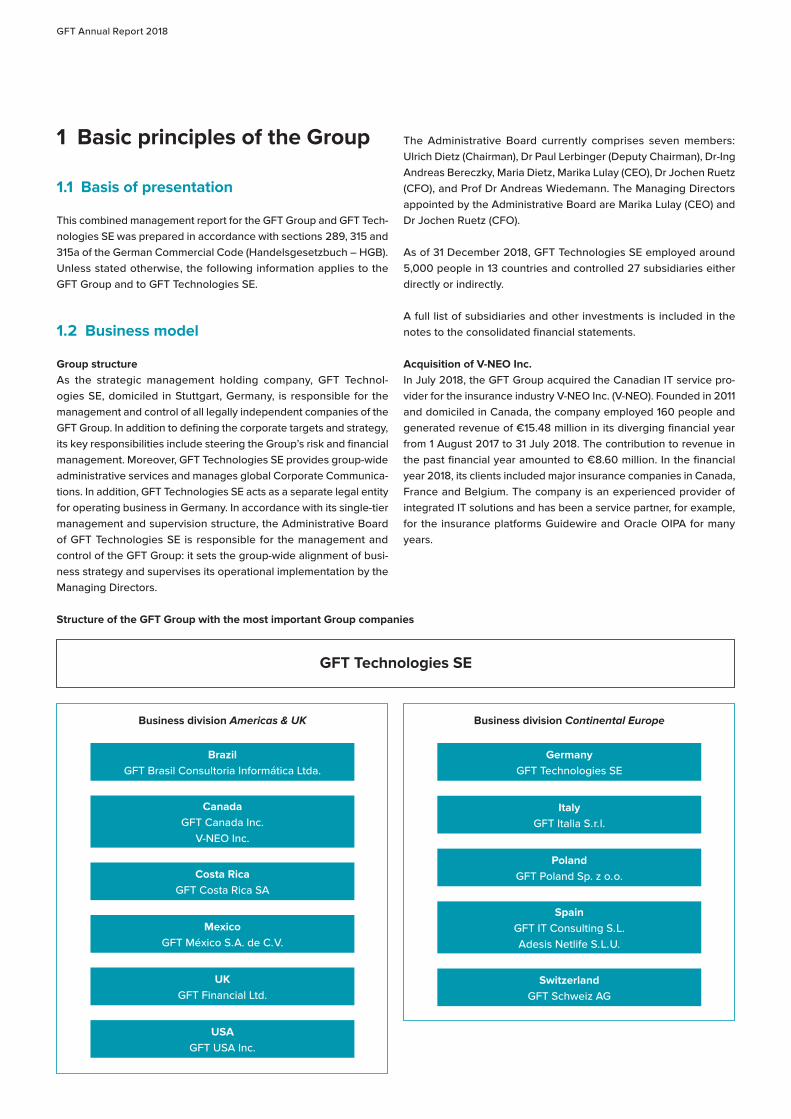
GFT Annual Report 2018
1 Basic principles of the Group
1.1 Basis of presentation
This combined management report for the GFT Group and GFT Tech-nologies SE was prepared in accordance with sections 289, 315 and 315a of the German Commercial Code (Handelsgesetzbuch – HGB). Unless stated otherwise, the following information applies to the GFT Group and to GFT Technologies SE.
1.2 Business model
Group structureAs the strategic management holding company, GFT Technol-ogies SE, domiciled in Stuttgart, Germany, is responsible for the management and control of all legally independent companies of the GFT Group. In addition to defining the corporate targets and strategy, its key responsibilities include steering the Group’s risk and financial management. Moreover, GFT Technologies SE provides group-wide administrative services and manages global Corporate Communica-tions. In addition, GFT Technologies SE acts as a separate legal entity for operating business in Germany. In accordance with its single-tier management and supervision structure, the Administrative Board of GFT Technologies SE is responsible for the management and control of the GFT Group: it sets the group-wide alignment of busi-ness strategy and supervises its operational implementation by the Managing Directors.
The Administrative Board currently comprises seven members: Ulrich Dietz (Chairman), Dr Paul Lerbinger (Deputy Chairman), Dr-Ing Andreas Bereczky, Maria Dietz, Marika Lulay (CEO), Dr Jochen Ruetz (CFO), and Prof Dr Andreas Wiedemann. The Managing Directors appointed by the Administrative Board are Marika Lulay (CEO) and Dr Jochen Ruetz (CFO).
As of 31 December 2018, GFT Technologies SE employed around 5,000 people in 13 countries and controlled 27 subsidiaries either directly or indirectly.
A full list of subsidiaries and other investments is included in the notes to the consolidated financial statements.
Acquisition of V-NEO Inc.In July 2018, the GFT Group acquired the Canadian IT service pro-vider for the insurance industry V-NEO Inc. (V-NEO). Founded in 2011 and domiciled in Canada, the company employed 160 people and generated revenue of €15.48 million in its diverging financial year from 1 August 2017 to 31 July 2018. The contribution to revenue in the past financial year amounted to €8.60 million. In the financial year 2018, its clients included major insurance companies in Canada, France and Belgium. The company is an experienced provider of integrated IT solutions and has been a service partner, for example, for the insurance platforms Guidewire and Oracle OIPA for many years.
Structure of the GFT Group with the most important Group companies
Business division Continental EuropeBusiness division Americas & UK
GFT Technologies SE
BrazilGFT Brasil Consultoria Informática Ltda.
GermanyGFT Technologies SE
Costa RicaGFT Costa Rica SA
ItalyGFT Italia S. r. l.
UKGFT Financial Ltd.
PolandGFT Poland Sp. z o. o.
CanadaGFT Canada Inc.
V-NEO Inc.
SwitzerlandGFT Schweiz AG
MexicoGFT México S. A. de C. V.
SpainGFT IT Consulting S. L.Adesis Netlife S. L. U.
USAGFT USA Inc.
Combined Management Report 32 – 33
Business operationsGFT Technologies SE is a globally aligned technology partner for digital transformation in the banking, insurance and industrial sectors. Its clients include leading retail and investment banks, as well as insurance companies, in Europe, Northern and Southern America, as well as industrial companies in Germany, Italy and Spain. Its range of services includes consulting on the development and realisation of innovative IT strategies, the development of bespoke solutions, the implementation of sector-specific standard software, and the main-tenance and further development of business-critical IT solutions. GFT Technologies SE has many years of experience and extensive specialist knowledge in application development within the frame-work of legacy IT infrastructures – as are typical for major banks.
Growth is currently being driven by the ongoing digitalisation process in the financial services sector with the aim of optimising business processes, reducing operating costs and relieving the competitive pressure created by new fintech providers. The main focus is on future technologies such as blockchain, cloud, artificial intelligence, DevOps and data analytics. In 2017, the GFT Group decided to expand its focus by targeting industrial companies in addition to financial service providers. Due to the huge potential offered by the digital transformation of value chains, the GFT Group is investing heavily in the expansion of its digital solutions for industry. The first successful projects have already been implemented for industrial clients in Germany.
The acquisition of the Canadian IT service provider V-NEO and its combination with existing activities will enable GFT to develop its insurance business more rapidly. The company develops integrated IT solutions for insurance clients and also helps them implement the standard software Guidewire, as well as Oracle’s OIPA solution.
In accordance with the internal management and reporting of GFT Technologies SE, the business activities of the GFT Group are divided into two segments:
The most important companies of the Americas & UK segment are located in the following countries:
■ Brazil ■ Canada ■ Costa Rica ■ Mexico ■ UK ■ USA
The Continental Europe segment comprises significant companies in the countries:
■ Germany ■ Italy ■ Poland ■ Switzerland ■ Spain
The Continental Europe segment is largely dominated by business activities with retail banking clients, while the Americas & UK seg-ment mainly targets clients in the field of investment banking.
With the aid of its tried and trusted Global Delivery Model, which combines customer proximity and quality with attractive cost bene-fits (onshore / nearshore model), GFT Technologies SE can supply its range of solutions to the core markets of Europe and the Americas. The company’s consultants and sales staff are in direct contact with clients (onshore) to provide advice on the development of strategies and to coordinate their projects. Cost-effective services for European clients are provided by the company’s own development centres in Spain and Poland, while highly skilled development teams in Brazil and Costa Rica (nearshore) work on client projects in the USA.
1.3 Management system
The primary strategic objective of the GFT Group is to achieve a sustainable increase in enterprise value by continuously expanding competitive advantages. As part of its strategic planning, measures to achieve this objective in the respective countries and market seg-ments are discussed and implemented. The internal management system comprises regulations and measures for the organisational implementation of management decisions and the permanent moni-toring of their effectiveness. All Group executives are involved in this management process. This includes the Administrative Board, the Managing Directors, the managing directors of the Group’s subsid-iaries, and the managers responsible for group-wide administrative functions.
In mid-2017, the Group Executive Board was founded in order to add weight to the Group’s international presence and promote greater cooperation in the corporate management process. Its tasks include providing advice and preparing decisions, thereby supporting the work of the Managing Directors. In addition to the two Managing Directors, the Group Executive Board has two further members: Carlos Eres, Managing Director with responsibility for Spain and Mexico, as well as Alfio Puglisi, Managing Director for the regions Germany, Switzerland and Italy and responsible for the Global Business Development division. In addition, the new positions Chief Digital Officer, Chief Technology Officer, Chief Operations Officer and Chief Communications Officer have been created in order to pool activities across the Group and leverage synergy effects.
The country organisations provide the Group Executive Board with regular reports on the course of business and the implementation of management decisions, while analysing the opportunities and risks for future development. The development of key performance indicators compared to the respective budgets is monitored via monthly reports provided by the country organisations.
GFT Annual Report 2018
Key performance measures for the GFT GroupThe key performance indicators (KPIs) used to measure the success of strategy implementation in the GFT Group are revenue, adjusted EBITDA (introduced in the financial year 2018; earnings before inter-est, taxes, depreciation and amortisation, as well as before effects from business combinations such as acquisition-related reductions in current assets, acquisition-related compensation for employees or selling shareholders, transaction and integration expenses with an effect on earnings as well as gains / losses from the disposal of com-pany shares) and EBT (earnings before taxes). Other performance measures are also used for the internal management process: these include revenue by country, market segment and industry, as well as contribution margins and account collection targets. The success of the two segments is measured using the segment performance indicators revenue and EBT, amongst others. Segment revenue and segment earnings also include transactions between the business segments. Such transactions are conducted at market prices and on an arm’s-length basis.
A non-financial performance indicator for the GFT Group is the productive utilisation rate. The latter is based solely on the use of staff in client projects and does not include any sales activities or involvement in internal projects.
Target / actual and year-on-year comparisons of key financial perfor-mance indicators, as well as year-on-year figures for the productive utilisation rate are to be found in the Economic Report. This also includes an explanation of further non-financial performance indi-cators which play an important role for the company’s successful development but are not used to steer all areas of the company. These include measures for attracting and retaining skilled employ-ees, as well as quality management during the processing of client projects.
A key component of the internal management process is the Group’s systematic opportunity and risk management aimed at identifying, assessing and steering opportunities and risks which may lead to positive or negative deviations from targets. For further information, please refer to the Risk Report and Opportunities Report sections.
Key performance measures for GFT Technologies SEThe KPIs used to measure the business success of GFT Technolo-gies SE are revenue and EBT. The financial performance measures adjusted EBITDA and EBITDA used by the GFT Group are not among the internal KPIs used by GFT Technologies SE. Further information on the key performance measures used in the annual report can be found on the GFT website at www.gft.com/performancemeasures.
1.4 Research and development
The continuous analysis of technology trends in our target markets Banks, Insurance and Industry has top priority. In cooperation with our clients and partners, we analyse trends and develop new appli-cation solutions based on these trends at the GFT Innovation Labs. These offerings provide support for the GFT Group’s clients with the
digital transformation of their business models and help secure and enhance their competitive position. In the reporting period, the main focus areas for our research and development activities were the fields of cloud, blockchain, data analytics and artificial intelligence – technologies for which exponential growth is expected.
At the development centres in Poland and Spain, work focused on distributed ledger technology (DLT). In addition to the ongoing refinement of existing applications, our technological expertise in the world of DLT (including blockchain) was further broadened. As the trends in this relatively young market are still changing dynamically, our broad-based technological expertise ensures the rapid creation of application solutions.
In the UK, our research and development activities focused on cloud technologies. By shifting core banking systems to the cloud (so-called Lift & Shift), new client-oriented applications can be developed and technologies such as data analytics and artificial intelligence used efficiently.
The successful development of applications for the Internet of Things (IoT) for Industry 4.0 requires extensive technological expertise in the fields of blockchain, cloud, DevOps, data analytics and artificial intelligence. Clusters of expertise in Poland and Spain are already developing the first solution offerings.
In the financial year 2018, the GFT Group invested a total of €3.0 million in research and development (2017: €7.88 million). The reason for the decline was the scheduled completion of research projects in Spain. Personnel expenses accounted for €1.98 million or 66% of total expenses (2017: €6.07 million or 77%). Expenses for external services amounted to €0.18 million (2017: €0.25 million), corresponding to 6% (2017: 3%) of total costs.
1.5 Corporate Governance Statement
The Corporate Governance Statement to be submitted by GFT Tech-nologies SE and the GFT Group pursuant to sections 289f and 315d of the German Commercial Code (HGB) is available online at www.gft.com/governance.
1.6 Separate non-financial report for the Group
The separate non-financial report for the Group pursuant to sec-tion 315b (3) number 2b HGB (CSR Report) is available online as 29 March 2019 at www.gft.com/sustainability.
Combined Management Report 34 – 35
2 Economic report
2.1 General comments
In the course of adopting the new provisions of IFRS 9 Financial Instruments and IFRS 15 Revenue from Contracts with Customers, the GFT Group changed some of its accounting policies as of 1 January 2018. In this context, reference is made to the detailed explanations in the notes (see section 2.3 Change in accounting policies). In accordance with the application of the selected modified retrospective transition method, the previous year’s figures were not adjusted.
The first-time application of the new IFRS pronouncements had no material impact on the GFT Group’s financial position and perfor-mance as at 31 December 2018.
2.2 General conditions
Macro-economic conditionsGlobal economic growth in 2018 was somewhat weaker than expected. In its outlook, the International Monetary Fund (IMF) assumes growth of 3.7% for 2018 – compared to its original forecast of 3.9%. Global economic growth weakened in the second half of the year in particular. The reasons for this included severe storms in Japan and new emission standards for the German automotive industry – factors which hampered the development of two major economies. Economic growth was also impeded by unresolved trade conflicts and uncertainties about the development of the Chinese economy. As a result, global trade fell below the averages of the previous year, while industrial output decreased in all major countries except the USA.
This overall assessment is shared by the economists of the Euro-pean Central Bank (ECB). Despite a continuation of the current favourable financing conditions, growth was slowed by geopolitical uncertainties (such as Brexit) and the fragile economic trends of the emerging markets – all set against a backdrop of imminent trade conflict. According to the ECB, gross domestic product (GDP) in the euro zone grew by 1.9% for 2018 as a whole.
Germany’s central bank (Deutsche Bundesbank) estimates that the German economy grew by 1.5% in 2018. This represents significantly weaker growth than the prior-year figure of 2.2% and is largely attributable to slower growth in the manufacturing sector and the automotive industry. Although the order situation weakened slightly for industrial companies in the fourth quarter of 2018, economists at the Bundesbank believe that the labour market is still in very good shape.
Sector-specific conditionsAccording to the US market research institute Gartner, the global IT market grew by 3.9% in 2018 – and thus more strongly than expected. Gartner’s market experts named data centre systems (11.3%), software (9.3%) and IT services (5.6%) as the main growth drivers. The market researchers identified the use and further devel-opment of artificial intelligence as the most important strategic trend, as this technology could potentially be used in all future applications, objects and services. The increased use and expansion of robotic process automation (RPA) also supported the analysis and processes used to achieve improvements in efficiency and user experience. The Internet of Things (IoT) means that the real world is integrating more and more with the digital world. Various previously separate systems are increasingly being networked, creating new business models and fields of application.
According to Gartner, the world’s financial institutions invested 4.6% more in their IT systems in 2018 than in the previous year, adjusted for currency effects. Whereas investment banks showed significantly higher growth rates than retail banks in 2017, this order was reversed in the past financial year: IT spending in retail banking increased by 4.7% and in investment banking by 4.2% in 2018. According to a Gartner survey, digital transformation was the greatest challenge in 2018 and is seen as the foundation for exploiting the huge potential offered by blockchain and artificial intelligence in the financial sector.
In the insurance industry, high priority is given to the collection and consolidation of data via the digitalisation of processes. According to Gartner, digital transformation is also regarded by this sector as the basis for the use of data analytics. This offers a significant competitive advantage for the sector as it allows companies to serve customer needs more precisely by delivering tailored products.
The German market for information technology and telecommunica-tions (ICT) performed better than expected in 2018. According to the German digital association Bitkom, sales of products and services for IT, telecommunications and consumer electronics rose by 2.0% compared to the previous year. The biggest growth driver continues to be the digitalisation trend in all industries. However, as this growth trend continues, the problems associated with a shortage of skilled workers continue to worsen.
Impact on the GFT GroupThe digital transformation of the financial services sector and the increasing use of new technologies, such as blockchain and cloud, are important growth drivers for the GFT Group. The GFT Group combines industry and technology expertise in order to seamlessly integrate new technologies into the business models of its clients. This has enabled the GFT Group to expand its market position as the technology leader. The decline in revenue caused by the budget restrictions of the top-2 clients 1 was thus almost fully offset.
1 The GFT Group’s top-2 clients (based on the financial year 2016) are defined as Deutsche Bank and Barclays.
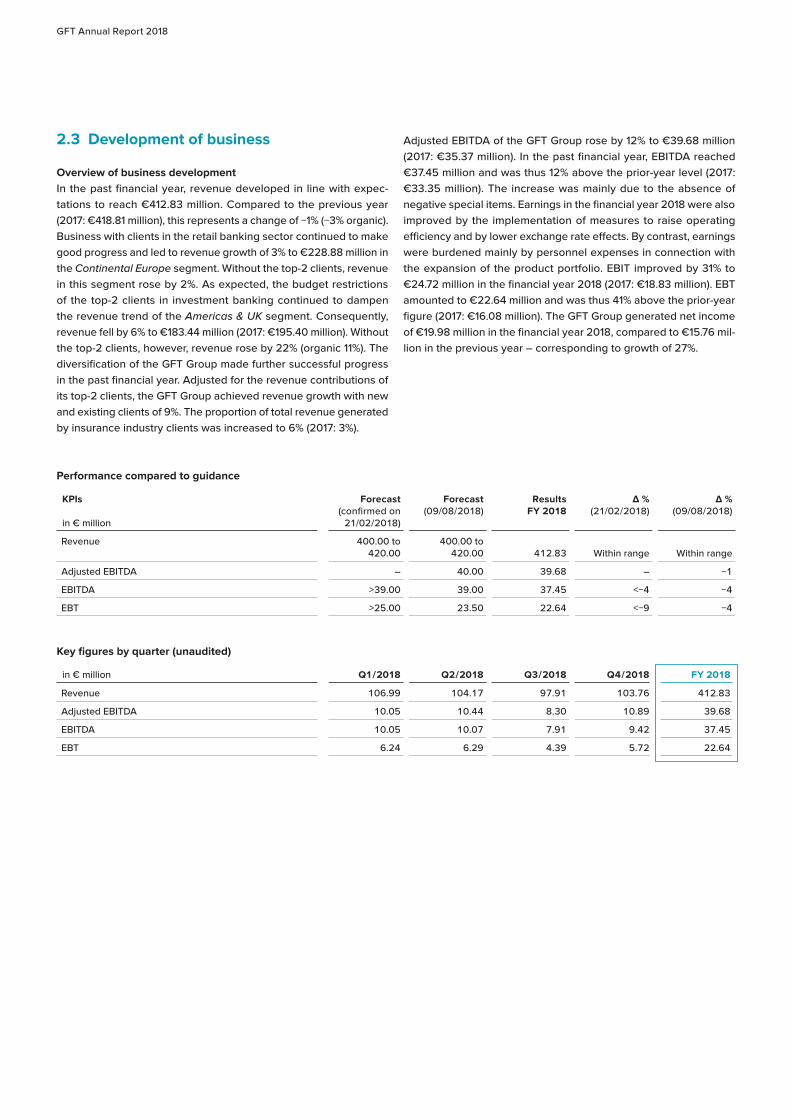
GFT Annual Report 2018
2.3 Development of business
Overview of business developmentIn the past financial year, revenue developed in line with expec-tations to reach €412.83 million. Compared to the previous year (2017: €418.81 million), this represents a change of −1% (−3% organic). Business with clients in the retail banking sector continued to make good progress and led to revenue growth of 3% to €228.88 million in the Continental Europe segment. Without the top-2 clients, revenue in this segment rose by 2%. As expected, the budget restrictions of the top-2 clients in investment banking continued to dampen the revenue trend of the Americas & UK segment. Consequently, revenue fell by 6% to €183.44 million (2017: €195.40 million). Without the top-2 clients, however, revenue rose by 22% (organic 11%). The diversification of the GFT Group made further successful progress in the past financial year. Adjusted for the revenue contributions of its top-2 clients, the GFT Group achieved revenue growth with new and existing clients of 9%. The proportion of total revenue generated by insurance industry clients was increased to 6% (2017: 3%).
Adjusted EBITDA of the GFT Group rose by 12% to €39.68 million (2017: €35.37 million). In the past financial year, EBITDA reached €37.45 million and was thus 12% above the prior-year level (2017: €33.35 million). The increase was mainly due to the absence of negative special items. Earnings in the financial year 2018 were also improved by the implementation of measures to raise operating efficiency and by lower exchange rate effects. By contrast, earnings were burdened mainly by personnel expenses in connection with the expansion of the product portfolio. EBIT improved by 31% to €24.72 million in the financial year 2018 (2017: €18.83 million). EBT amounted to €22.64 million and was thus 41% above the prior-year figure (2017: €16.08 million). The GFT Group generated net income of €19.98 million in the financial year 2018, compared to €15.76 mil-lion in the previous year – corresponding to growth of 27%.
Performance compared to guidance
KPIs
in € million
Forecast (confirmed on
21/02/2018)
Forecast (09/08/2018)
Results FY 2018
Δ % (21/02/2018)
Δ % (09/08/2018)
Revenue 400.00 to 420.00
400.00 to 420.00 412.83 Within range Within range
Adjusted EBITDA – 40.00 39.68 – −1
EBITDA >39.00 39.00 37.45 <−4 −4
EBT >25.00 23.50 22.64 <−9 −4
Key figures by quarter (unaudited)
in € million Q1 / 2018 Q2 / 2018 Q3 / 2018 Q4 / 2018 FY 2018
Revenue 106.99 104.17 97.91 103.76 412.83
Adjusted EBITDA 10.05 10.44 8.30 10.89 39.68
EBITDA 10.05 10.07 7.91 9.42 37.45
EBT 6.24 6.29 4.39 5.72 22.64
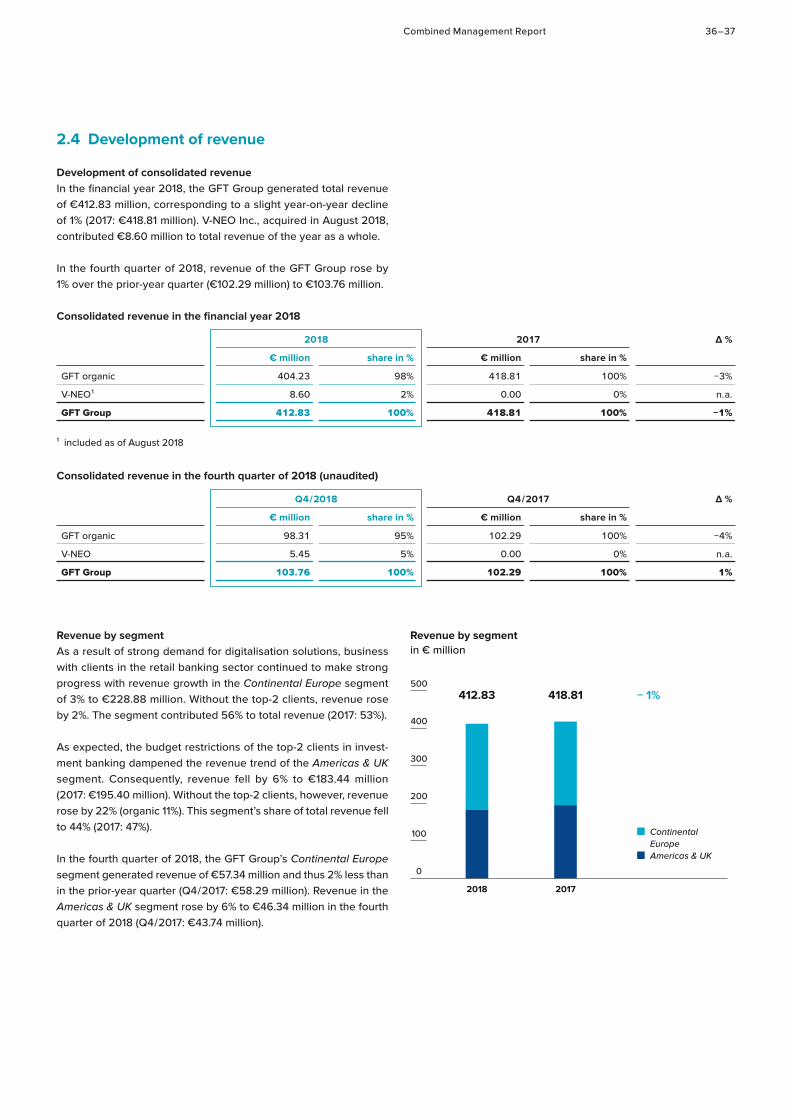
Combined Management Report 36 – 37
2.4 Development of revenue
Development of consolidated revenueIn the financial year 2018, the GFT Group generated total revenue of €412.83 million, corresponding to a slight year-on-year decline of 1% (2017: €418.81 million). V-NEO Inc., acquired in August 2018, contributed €8.60 million to total revenue of the year as a whole.
In the fourth quarter of 2018, revenue of the GFT Group rose by 1% over the prior-year quarter (€102.29 million) to €103.76 million.
Consolidated revenue in the financial year 2018
2018 2017 Δ %
€ million share in % € million share in %
GFT organic 404.23 98% 418.81 100% −3%
V-NEO 1 8.60 2% 0.00 0% n. a.
GFT Group 412.83 100% 418.81 100% −1%
1 included as of August 2018
Consolidated revenue in the fourth quarter of 2018 (unaudited)
Q4 / 2018 Q4 / 2017 Δ %
€ million share in % € million share in %
GFT organic 98.31 95% 102.29 100% −4%
V-NEO 5.45 5% 0.00 0% n. a.
GFT Group 103.76 100% 102.29 100% 1%
Revenue by segmentAs a result of strong demand for digitalisation solutions, business with clients in the retail banking sector continued to make strong progress with revenue growth in the Continental Europe segment of 3% to €228.88 million. Without the top-2 clients, revenue rose by 2%. The segment contributed 56% to total revenue (2017: 53%).
As expected, the budget restrictions of the top-2 clients in invest-ment banking dampened the revenue trend of the Americas & UK segment. Consequently, revenue fell by 6% to €183.44 million (2017: €195.40 million). Without the top-2 clients, however, revenue rose by 22% (organic 11%). This segment’s share of total revenue fell to 44% (2017: 47%).
In the fourth quarter of 2018, the GFT Group’s Continental Europe segment generated revenue of €57.34 million and thus 2% less than in the prior-year quarter (Q4 / 2017: €58.29 million). Revenue in the Americas & UK segment rose by 6% to €46.34 million in the fourth quarter of 2018 (Q4 / 2017: €43.74 million).
Continental EuropeAmericas & UK
Revenue by segmentin € million
20172018
412.83 418.81 − 1%
0
100
200
300
500
400
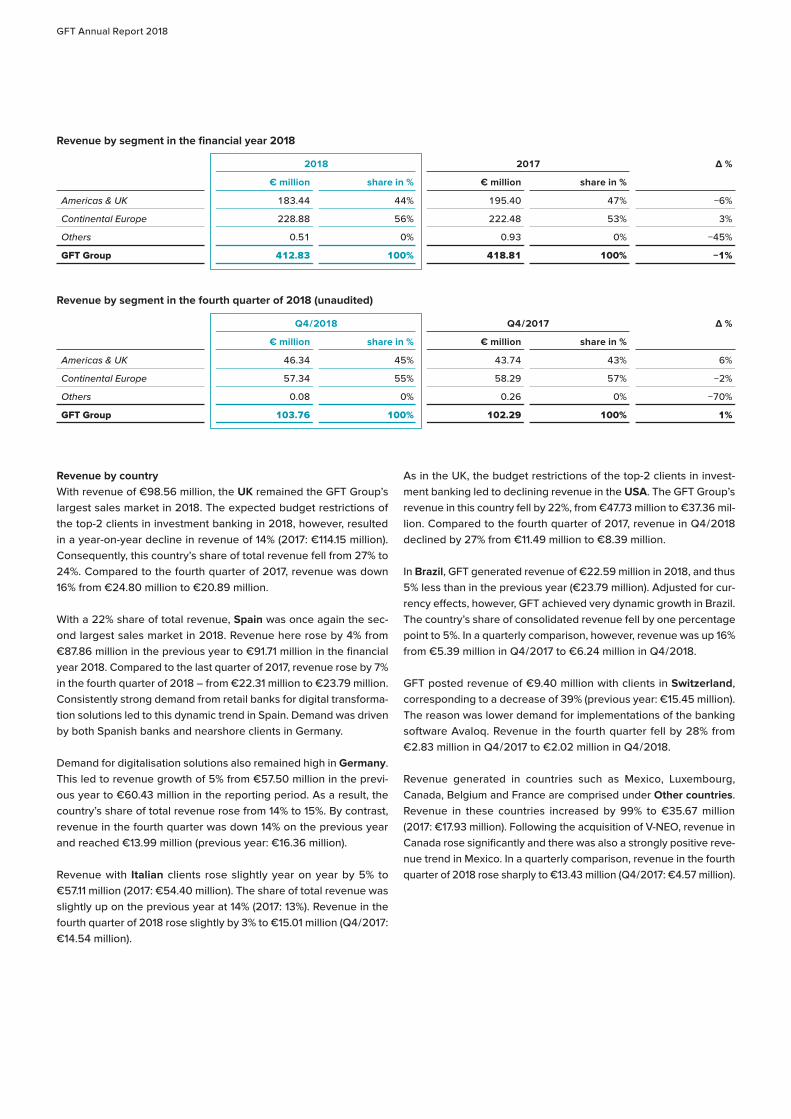
GFT Annual Report 2018
Revenue by segment in the financial year 2018
2018 2017 Δ %
€ million share in % € million share in %
Americas & UK 183.44 44% 195.40 47% −6%
Continental Europe 228.88 56% 222.48 53% 3%
Others 0.51 0% 0.93 0% −45%
GFT Group 412.83 100% 418.81 100% −1%
Revenue by segment in the fourth quarter of 2018 (unaudited)
Q4 / 2018 Q4 / 2017 Δ %
€ million share in % € million share in %
Americas & UK 46.34 45% 43.74 43% 6%
Continental Europe 57.34 55% 58.29 57% −2%
Others 0.08 0% 0.26 0% −70%
GFT Group 103.76 100% 102.29 100% 1%
Revenue by countryWith revenue of €98.56 million, the UK remained the GFT Group’s largest sales market in 2018. The expected budget restrictions of the top-2 clients in investment banking in 2018, however, resulted in a year-on-year decline in revenue of 14% (2017: €114.15 million). Consequently, this country’s share of total revenue fell from 27% to 24%. Compared to the fourth quarter of 2017, revenue was down 16% from €24.80 million to €20.89 million.
With a 22% share of total revenue, Spain was once again the sec-ond largest sales market in 2018. Revenue here rose by 4% from €87.86 million in the previous year to €91.71 million in the financial year 2018. Compared to the last quarter of 2017, revenue rose by 7% in the fourth quarter of 2018 – from €22.31 million to €23.79 million. Consistently strong demand from retail banks for digital transforma-tion solutions led to this dynamic trend in Spain. Demand was driven by both Spanish banks and nearshore clients in Germany.
Demand for digitalisation solutions also remained high in Germany. This led to revenue growth of 5% from €57.50 million in the previ-ous year to €60.43 million in the reporting period. As a result, the country’s share of total revenue rose from 14% to 15%. By contrast, revenue in the fourth quarter was down 14% on the previous year and reached €13.99 million (previous year: €16.36 million).
Revenue with Italian clients rose slightly year on year by 5% to €57.11 million (2017: €54.40 million). The share of total revenue was slightly up on the previous year at 14% (2017: 13%). Revenue in the fourth quarter of 2018 rose slightly by 3% to €15.01 million (Q4 / 2017: €14.54 million).
As in the UK, the budget restrictions of the top-2 clients in invest-ment banking led to declining revenue in the USA. The GFT Group’s revenue in this country fell by 22%, from €47.73 million to €37.36 mil-lion. Compared to the fourth quarter of 2017, revenue in Q4 / 2018 declined by 27% from €11.49 million to €8.39 million.
In Brazil, GFT generated revenue of €22.59 million in 2018, and thus 5% less than in the previous year (€23.79 million). Adjusted for cur-rency effects, however, GFT achieved very dynamic growth in Brazil. The country’s share of consolidated revenue fell by one percentage point to 5%. In a quarterly comparison, however, revenue was up 16% from €5.39 million in Q4 / 2017 to €6.24 million in Q4 / 2018.
GFT posted revenue of €9.40 million with clients in Switzerland, corresponding to a decrease of 39% (previous year: €15.45 million). The reason was lower demand for implementations of the banking software Avaloq. Revenue in the fourth quarter fell by 28% from €2.83 million in Q4 / 2017 to €2.02 million in Q4 / 2018.
Revenue generated in countries such as Mexico, Luxembourg, Canada, Belgium and France are comprised under Other countries. Revenue in these countries increased by 99% to €35.67 million (2017: €17.93 million). Following the acquisition of V-NEO, revenue in Canada rose significantly and there was also a strongly positive reve-nue trend in Mexico. In a quarterly comparison, revenue in the fourth quarter of 2018 rose sharply to €13.43 million (Q4 / 2017: €4.57 million).
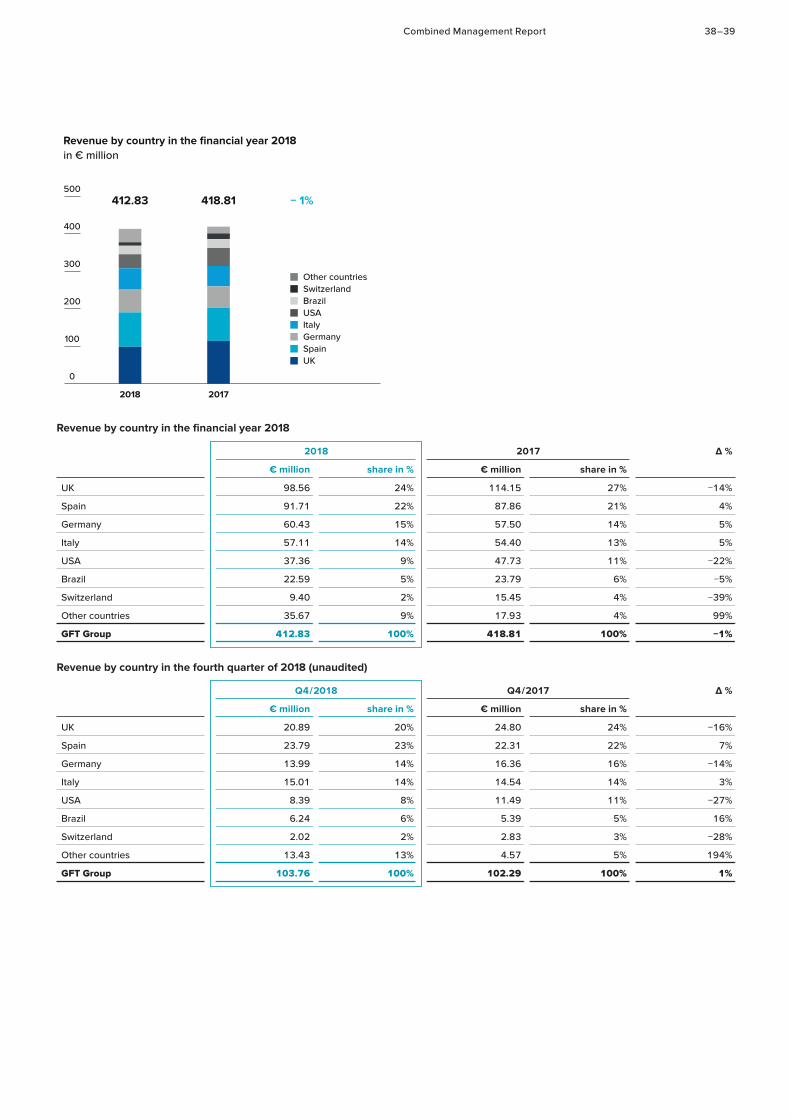
Combined Management Report 38 – 39
Revenue by country in the financial year 2018
2018 2017 Δ %
€ million share in % € million share in %
UK 98.56 24% 114.15 27% −14%
Spain 91.71 22% 87.86 21% 4%
Germany 60.43 15% 57.50 14% 5%
Italy 57.11 14% 54.40 13% 5%
USA 37.36 9% 47.73 11% −22%
Brazil 22.59 5% 23.79 6% −5%
Switzerland 9.40 2% 15.45 4% −39%
Other countries 35.67 9% 17.93 4% 99%
GFT Group 412.83 100% 418.81 100% −1%
Revenue by country in the fourth quarter of 2018 (unaudited)
Q4 / 2018 Q4 / 2017 Δ %
€ million share in % € million share in %
UK 20.89 20% 24.80 24% −16%
Spain 23.79 23% 22.31 22% 7%
Germany 13.99 14% 16.36 16% −14%
Italy 15.01 14% 14.54 14% 3%
USA 8.39 8% 11.49 11% −27%
Brazil 6.24 6% 5.39 5% 16%
Switzerland 2.02 2% 2.83 3% −28%
Other countries 13.43 13% 4.57 5% 194%
GFT Group 103.76 100% 102.29 100% 1%
Other countriesSwitzerlandBrazilUSAItalyGermanySpainUK
Revenue by country in the financial year 2018in € million
20172018
412.83 418.81 − 1%
0
100
200
300
500
400
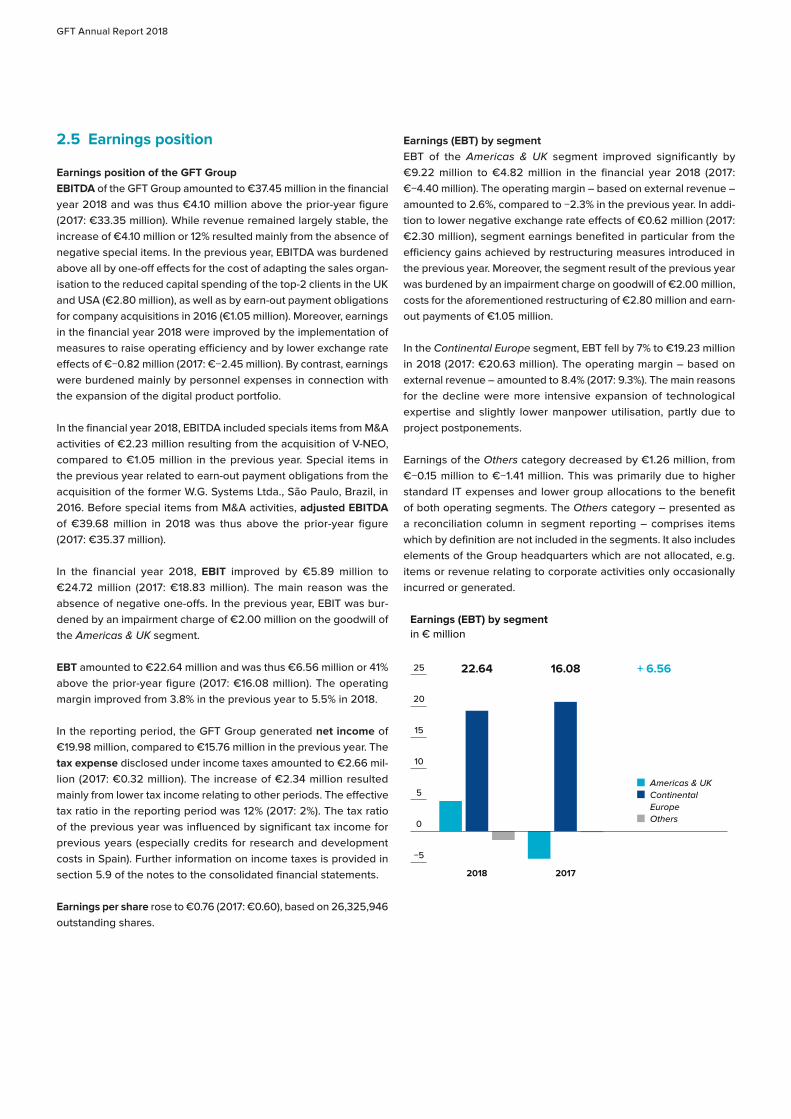
GFT Annual Report 2018
2.5 Earnings position
Earnings position of the GFT Group EBITDA of the GFT Group amounted to €37.45 million in the financial year 2018 and was thus €4.10 million above the prior-year figure (2017: €33.35 million). While revenue remained largely stable, the increase of €4.10 million or 12% resulted mainly from the absence of negative special items. In the previous year, EBITDA was burdened above all by one-off effects for the cost of adapting the sales organ-isation to the reduced capital spending of the top-2 clients in the UK and USA (€2.80 million), as well as by earn-out payment obligations for company acquisitions in 2016 (€1.05 million). Moreover, earnings in the financial year 2018 were improved by the implementation of measures to raise operating efficiency and by lower exchange rate effects of €−0.82 million (2017: €−2.45 million). By contrast, earnings were burdened mainly by personnel expenses in connection with the expansion of the digital product portfolio.
In the financial year 2018, EBITDA included specials items from M&A activities of €2.23 million resulting from the acquisition of V-NEO, compared to €1.05 million in the previous year. Special items in the previous year related to earn-out payment obligations from the acquisition of the former W.G. Systems Ltda., São Paulo, Brazil, in 2016. Before special items from M&A activities, adjusted EBITDA of €39.68 million in 2018 was thus above the prior-year figure (2017: €35.37 million).
In the financial year 2018, EBIT improved by €5.89 million to €24.72 million (2017: €18.83 million). The main reason was the absence of negative one-offs. In the previous year, EBIT was bur-dened by an impairment charge of €2.00 million on the goodwill of the Americas & UK segment.
EBT amounted to €22.64 million and was thus €6.56 million or 41% above the prior-year figure (2017: €16.08 million). The operating margin improved from 3.8% in the previous year to 5.5% in 2018.
In the reporting period, the GFT Group generated net income of €19.98 million, compared to €15.76 million in the previous year. The tax expense disclosed under income taxes amounted to €2.66 mil-lion (2017: €0.32 million). The increase of €2.34 million resulted mainly from lower tax income relating to other periods. The effective tax ratio in the reporting period was 12% (2017: 2%). The tax ratio of the previous year was influenced by significant tax income for previous years (especially credits for research and development costs in Spain). Further information on income taxes is provided in section 5.9 of the notes to the consolidated financial statements.
Earnings per share rose to €0.76 (2017: €0.60), based on 26,325,946 outstanding shares.
Earnings (EBT) by segmentEBT of the Americas & UK segment improved significantly by €9.22 million to €4.82 million in the financial year 2018 (2017: €−4.40 million). The operating margin – based on external revenue – amounted to 2.6%, compared to −2.3% in the previous year. In addi-tion to lower negative exchange rate effects of €0.62 million (2017: €2.30 million), segment earnings benefited in particular from the efficiency gains achieved by restructuring measures introduced in the previous year. Moreover, the segment result of the previous year was burdened by an impairment charge on goodwill of €2.00 million, costs for the aforementioned restructuring of €2.80 million and earn-out payments of €1.05 million.
In the Continental Europe segment, EBT fell by 7% to €19.23 million in 2018 (2017: €20.63 million). The operating margin – based on external revenue – amounted to 8.4% (2017: 9.3%). The main reasons for the decline were more intensive expansion of technological expertise and slightly lower manpower utilisation, partly due to project postponements.
Earnings of the Others category decreased by €1.26 million, from €−0.15 million to €−1.41 million. This was primarily due to higher standard IT expenses and lower group allocations to the benefit of both operating segments. The Others category – presented as a reconciliation column in segment reporting – comprises items which by definition are not included in the segments. It also includes elements of the Group headquarters which are not allocated, e. g. items or revenue relating to corporate activities only occasionally incurred or generated.
Earnings (EBT) by segmentin € million
20172018
22.64 16.08 + 6.56
5
−5
10
15
20
25
Americas & UKContinental EuropeOthers0
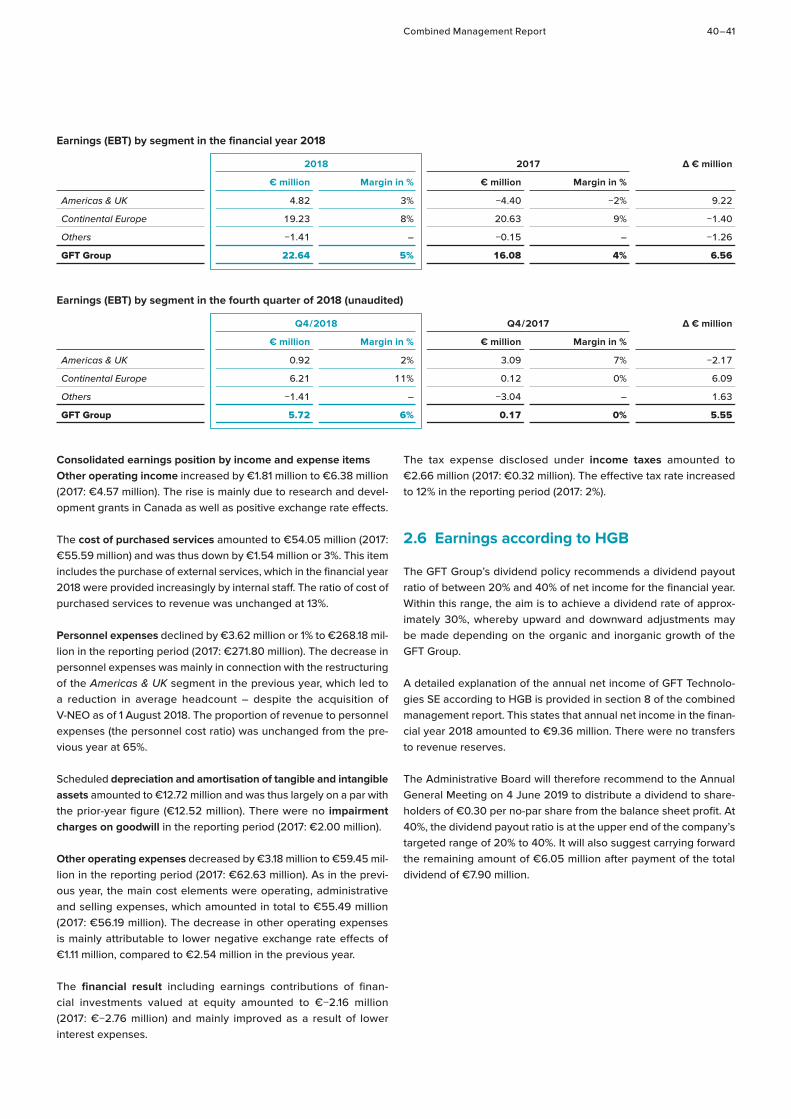
Combined Management Report 40 – 41
Earnings (EBT) by segment in the financial year 2018
2018 2017 ∆ € million
€ million Margin in % € million Margin in %
Americas & UK 4.82 3% −4.40 −2% 9.22
Continental Europe 19.23 8% 20.63 9% −1.40
Others −1.41 – −0.15 – −1.26
GFT Group 22.64 5% 16.08 4% 6.56
Earnings (EBT) by segment in the fourth quarter of 2018 (unaudited)
Q4 / 2018 Q4 / 2017 ∆ € million
€ million Margin in % € million Margin in %
Americas & UK 0.92 2% 3.09 7% −2.17
Continental Europe 6.21 11% 0.12 0% 6.09
Others −1.41 – −3.04 – 1.63
GFT Group 5.72 6% 0.17 0% 5.55
Consolidated earnings position by income and expense itemsOther operating income increased by €1.81 million to €6.38 million (2017: €4.57 million). The rise is mainly due to research and devel-opment grants in Canada as well as positive exchange rate effects.
The cost of purchased services amounted to €54.05 million (2017: €55.59 million) and was thus down by €1.54 million or 3%. This item includes the purchase of external services, which in the financial year 2018 were provided increasingly by internal staff. The ratio of cost of purchased services to revenue was unchanged at 13%.
Personnel expenses declined by €3.62 million or 1% to €268.18 mil-lion in the reporting period (2017: €271.80 million). The decrease in personnel expenses was mainly in connection with the restructuring of the Americas & UK segment in the previous year, which led to a reduction in average headcount – despite the acquisition of V-NEO as of 1 August 2018. The proportion of revenue to personnel expenses (the personnel cost ratio) was unchanged from the pre-vious year at 65%.
Scheduled depreciation and amortisation of tangible and intangible assets amounted to €12.72 million and was thus largely on a par with the prior-year figure (€12.52 million). There were no impairment charges on goodwill in the reporting period (2017: €2.00 million).
Other operating expenses decreased by €3.18 million to €59.45 mil-lion in the reporting period (2017: €62.63 million). As in the previ-ous year, the main cost elements were operating, administrative and selling expenses, which amounted in total to €55.49 million (2017: €56.19 million). The decrease in other operating expenses is mainly attributable to lower negative exchange rate effects of €1.11 million, compared to €2.54 million in the previous year.
The financial result including earnings contributions of finan-cial investments valued at equity amounted to €−2.16 million (2017: €−2.76 million) and mainly improved as a result of lower interest expenses.
The tax expense disclosed under income taxes amounted to €2.66 million (2017: €0.32 million). The effective tax rate increased to 12% in the reporting period (2017: 2%).
2.6 Earnings according to HGB
The GFT Group’s dividend policy recommends a dividend payout ratio of between 20% and 40% of net income for the financial year. Within this range, the aim is to achieve a dividend rate of approx-imately 30%, whereby upward and downward adjustments may be made depending on the organic and inorganic growth of the GFT Group.
A detailed explanation of the annual net income of GFT Technolo-gies SE according to HGB is provided in section 8 of the combined management report. This states that annual net income in the finan-cial year 2018 amounted to €9.36 million. There were no transfers to revenue reserves.
The Administrative Board will therefore recommend to the Annual General Meeting on 4 June 2019 to distribute a dividend to share-holders of €0.30 per no-par share from the balance sheet profit. At 40%, the dividend payout ratio is at the upper end of the company’s targeted range of 20% to 40%. It will also suggest carrying forward the remaining amount of €6.05 million after payment of the total dividend of €7.90 million.
GFT Annual Report 2018
2.7 Financial position
The GFT Group’s central financial management aims to ensure the permanent liquidity of all Group companies. The Treasury division implements financial policy and risk management on the basis of the agreed guidelines and permanently monitors both existing and potential financial risks. The GFT Group uses derivative financial instruments to hedge against currency and interest rate risks as required. The GFT Group pursues a prudent investment strategy which currently focuses exclusively on short-term periods. A detailed presentation on the assessment of liquidity risks and risks from fluctuations in currencies and interest rates, including the counter-measures taken, is provided in section 3 Risk Report.
As the parent company, GFT Technologies SE has concluded a syn-dicated loan agreement and several promissory note agreements to secure the long-term funding of the GFT Group. The syndicated loan agreement was concluded in the financial year 2015 and has a term of seven years. The loan amount of up to €80.00 million comprises two tranches, a Facility A credit line of up to €40.00 million and a Facility B revolving credit line of up to €40.00 million. At the end of the reporting period, the full amount of Facility A and €15.00 million of Facility B had been drawn. The interest rate of the syndicated loan is variable: for both facilities it is set per calendar year depending on the GFT Group’s level of debt as a fixed premium on the respective chosen Euribor rate – 1, 2, 3 or 6 months.
The promissory note agreements have terms of between two and six years. At the end of the reporting period, promissory note agree-ments totalling €59.50 million were drawn in full. Of this amount, €40.50 million are fixed-interest and the remaining €19.00 million variable-interest loans.
During the term of the loan agreements, the GFT Group is subject to specific financial covenants, mainly ancillary loans conditions. These mostly refer to specific financial covenants which must be met. The assumption of financial liabilities and the provision of collateral is also limited. If specific financial covenants and other rules of conduct are not met, this may lead to the immediate termination of the loan agreements. From the current perspective, there are no significant risks relating to the non-achievement of financial covenants or non-compliance with the other rules of conduct which are known to the company.
In the financial year 2018, cash and cash equivalents declined by €10.67 million to €61.57 million (31 December 2017: €72.24 million). This decrease in Group liquidity was influenced by opposing effects. Significantly higher cash flows from operating activities in the report-ing period were offset in particular by purchase price payments for the acquisition of V-NEO Inc. and the takeover of minority sharehold-ings in GFT Italia S.r.l. (formerly Sempla S.r.l.).
At the end of the reporting period, the GFT Group had unused credit lines of €37.05 million. The net liquidity of the GFT Group – cal-culated as the stock of disclosed cash and cash equivalents less financial liabilities – declined from €−39.29 million in the previous year to €−59.67 million as of 31 December 2018.
In the financial year 2018, cash flows from operating activities amounted to €44.83 million (2017: €23.70 million). This strong year-on-year improvement of €21.13 million was largely attributable to cash inflows from changes in other assets of €−0.82 million (2017: €−18.61 million). This was mainly due to the release of funds from tax refunds and lower payments for period-related software licenses. In the previous year, a significant amount of funds had been tied up in other assets. Furthermore, operating cash flow was positively influenced by income tax refunds of €0.94 million (2017: income tax payments of €5.47 million) and the increased consoli-dated net income of €19.98 million (2017: €15.76 million) due to the general course of business. Opposing effects resulted from changes in provisions of €−6.04 million (2017: €1.38 million).
Cash flows from investing activities in the reporting period amounted to €−53.73 million, compared to €−9.01 million in the previous year. The year-on-year change of €44.72 million was largely attributable to net payments for the acquisition of V-NEO Inc. as well as the takeover of minority shareholdings in GFT Italia S.r.l. in the third quarter of 2018. By contrast, there was a positive effect from reduced capital expenditure.
In the financial year 2018, cash flows from financing activities amounted to €−1.56 million (2017:€−2.91 million). Cash receipts from the assumption of financial loans of €15.00 million (2017: €51.99 mil-lion) were opposed in the reporting period by a reduction in financial liabilities of €5.32 million (2017: €44.79 million). The payment to shareholders of €7.90 million agreed at the Annual General Meet-ing of 21 June 2018 (dividend payment for the financial year 2017) resulted in a cash outflow of the same amount as in the previous year. All in all, this resulted in a slight improvement in cash flows from financing activities of €1.35 million.
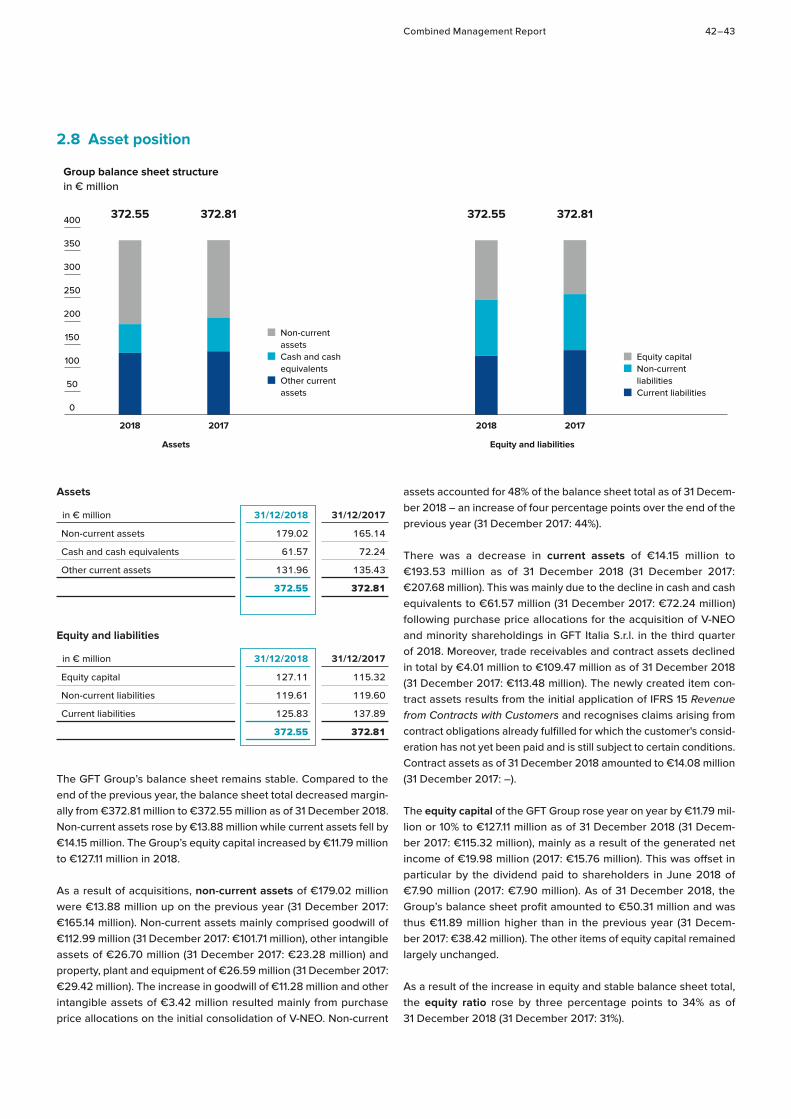
Combined Management Report 42 – 43
2.8 Asset position
Assets
in € million 31/12/2018 31/12/2017
Non-current assets 179.02 165.14
Cash and cash equivalents 61.57 72.24
Other current assets 131.96 135.43
372.55 372.81
Equity and liabilities
in € million 31/12/2018 31/12/2017
Equity capital 127.11 115.32
Non-current liabilities 119.61 119.60
Current liabilities 125.83 137.89
372.55 372.81
The GFT Group’s balance sheet remains stable. Compared to the end of the previous year, the balance sheet total decreased margin-ally from €372.81 million to €372.55 million as of 31 December 2018. Non-current assets rose by €13.88 million while current assets fell by €14.15 million. The Group’s equity capital increased by €11.79 million to €127.11 million in 2018.
As a result of acquisitions, non-current assets of €179.02 million were €13.88 million up on the previous year (31 December 2017: €165.14 million). Non-current assets mainly comprised goodwill of €112.99 million (31 December 2017: €101.71 million), other intangible assets of €26.70 million (31 December 2017: €23.28 million) and property, plant and equipment of €26.59 million (31 December 2017: €29.42 million). The increase in goodwill of €11.28 million and other intangible assets of €3.42 million resulted mainly from purchase price allocations on the initial consolidation of V-NEO. Non-current
assets accounted for 48% of the balance sheet total as of 31 Decem-ber 2018 – an increase of four percentage points over the end of the previous year (31 December 2017: 44%).
There was a decrease in current assets of €14.15 million to €193.53 million as of 31 December 2018 (31 December 2017: €207.68 million). This was mainly due to the decline in cash and cash equivalents to €61.57 million (31 December 2017: €72.24 million) following purchase price allocations for the acquisition of V-NEO and minority shareholdings in GFT Italia S.r.l. in the third quarter of 2018. Moreover, trade receivables and contract assets declined in total by €4.01 million to €109.47 million as of 31 December 2018 (31 December 2017: €113.48 million). The newly created item con-tract assets results from the initial application of IFRS 15 Revenue from Contracts with Customers and recognises claims arising from contract obligations already fulfilled for which the customer's consid-eration has not yet been paid and is still subject to certain conditions. Contract assets as of 31 December 2018 amounted to €14.08 million (31 December 2017: –).
The equity capital of the GFT Group rose year on year by €11.79 mil-lion or 10% to €127.11 million as of 31 December 2018 (31 Decem-ber 2017: €115.32 million), mainly as a result of the generated net income of €19.98 million (2017: €15.76 million). This was offset in particular by the dividend paid to shareholders in June 2018 of €7.90 million (2017: €7.90 million). As of 31 December 2018, the Group’s balance sheet profit amounted to €50.31 million and was thus €11.89 million higher than in the previous year (31 Decem-ber 2017: €38.42 million). The other items of equity capital remained largely unchanged.
As a result of the increase in equity and stable balance sheet total, the equity ratio rose by three percentage points to 34% as of 31 December 2018 (31 December 2017: 31%).
Equity capital Non-current liabilities Current liabilities
Non-current assetsCash and cash equivalentsOther current assets
Group balance sheet structurein € million
2017
400
350
300
250
200
150
100
50
0
2018
Assets
20172018
Equity and liabilities
372.55 372.81 372.55 372.81
GFT Annual Report 2018
Non-current liabilities of €119.61 million as of 31 December 2018 were on a par with the previous year (31 December 2017: €119.60 million).
Current liabilities of €125.83 million as of 31 December 2018 were €12.06 million down on the past year (31 December 2017: €137.89 mil-lion). This decline was largely due to a decrease in other financial liabilities of €31.53 million to €3.20 million (31 December 2017: €34.73 million), resulting mainly from the payment of variable pur-chase price liabilties for the acquisition of the minority shareholdings in GFT Italia S.r.l.. The main opposing effect was the increase in finan-cial liabilities of €10.01 million to €15.30 million (31 December 2017: €5.29 million) to finance the purchase of minority shareholdings in GFT Italia S.r.l. and the acquisition of V-NEO. Moreover, other liabili-ties within the current liabilities – including contract liabilities – rose by €9.89 million to €54.26 million (31 December 2017: €44.37 mil-lion). The newly created item contract liabilities results from the initial application of IFRS 15 Revenue from Contracts with Customers and comprises unrealised revenue from work contracts in connection with the development of customer-specific IT solutions, as well as fixed-price service agreements in connection with IT maintenance projects. Such performance obligations from client contracts were also recognised as liabilities in the past and carried as prepayments received under other liabilities. The net increase in other liabilities and contract liabilities was mainly in connection with closing-date effects on working capital.
The GFT Group’s debt ratio fell by three percentage points to 66% as of 31 December 2018 (31 December 2017: 69%).
2.9 Overall assessment
Revenue was within the expected range in the financial year 2018. Business with clients in the retail banking sector continued to make good progress and led to revenue growth in the Continental Europe segment. As expected, the budget restrictions of the top-2 clients in investment banking dampened the revenue development of the Americas & UK segment. The diversification of the GFT Group’s cli-ents and industries improved in the financial year 2018. Without the top-2 clients, revenue rose in both segments. There was significant year-on-year growth in key earnings figures due to the absence of negative one-offs items and the implementation of measures to enhance operating efficiency.
The equity ratio of 34% as of 31 December 2018 was above the prior-year figure of 31% and reflects the consistently solid capital and balance sheet structure of the GFT Group.
2.10 Non-financial performance indicators
EmployeesHR strategyThe performance, skills and motivation of our employees are the major factors driving the success of GFT as a technology partner for digital transformation in the financial services and insurance sectors, as well as in industry. Our employees have a significant impact on the quality of our services and the satisfaction of our clients, and thus ultimately on the success of our business. Consequently, HR strategy focuses on attracting, developing and retaining highly skilled and motivated employees.
The GFT Group has a globally aligned HR organisation. Group-wide standards are defined for HR activities and cross-company measures are adopted. These measures are then implemented in the respec-tive countries by locally operating HR departments.
Personnel developmentAs of 31 December 2018, GFT employed a total of 4,875 people and thus 3% more in the previous year (31 December 2017: 4,740 employees). In the Americas & UK segment, the takeover of the Canadian IT specialist for the insurance industry (V-NEO) led to an increase in headcount. At the end of 2018, there were 1,417 full-time employees in the Americas & UK segment – 22% more than at the end of the previous year (1,164) and slightly more than on 30 Sep-tember 2018 (1,335). The ongoing budget restrictions of the top-2 clients in investment banking resulted in a decline in headcount at the nearshore locations. Capacity adjustments in Spain, for example, led to a decline in headcount for the Continental Europe segment: the year-end figure of 3,345 in this segment corresponded to a slight decrease on the previous year (3,455) and on the previous quarter (3,405).
Compared to the third quarter of 2018, the main changes in headcount in the fourth quarter of 2018 were in Poland, Brazil and Canada. The ongoing budget restrictions of the top-2 clients and the postponement of projects from the fourth quarter to the new financial year led to a 7% decline in headcount at our nearshore development centre in Poland. By contrast, the number of employees in Brazil rose by 9% over the preceding quarter. This was both a result of stronger domestic demand and increased nearshore activities for the US market. The dynamic development of our insurance business also led to an increase in headcount of 9% in Canada.
Combined Management Report 44 – 45
Employees by country
31/12/2018 31/12/2017 Δ Δ in %
Spain 1,922 2,104 −182 −9%
Brazil 731 686 45 7%
Italy 572 561 11 2%
Poland 536 503 33 7%
Germany 372 355 17 5%
Mexico 226 161 65 40%
Canada 179 5 174 >100%
UK 142 158 −16 −10%
Costa Rica 100 112 −12 −11%
Switzerland 43 53 −10 −19%
USA 39 42 −3 −7%
France 7 0 7 –
Belgium 6 0 6 –
4,875 4,740 135 3%
The holding company employed 113 people at the end of the report-ing period, corresponding to a 7% decline on the previous year (121).
Headcount in Germany rose by 5% to 372 employees as of 31 December 2018 (31 December 2017: 355 employees).
The productive utilisation rate, based on the use of production staff in client projects, was unchanged at 89% in the reporting period (2017: 89%).
The headcount figures displayed above are calculated on the basis of full-time employees. Part-time staff are included on a prorated basis.
Employees by segment
31/12/2018 31/12/2017 Δ Δ in %
Americas & UK 1,417 1,164 253 22%
Continental Europe 3,345 3,455 −110 −3%
Others 113 121 −8 −7%
GFT Group 4,875 4,740 135 3%
Retaining and developing staff The recruitment of highly skilled and motivated employees is a major success factor for GFT – especially in view of the ongoing shortage of IT specialists.
One central project to optimise HR processes is the introduction of a software-based performance management model. Globally standardised and efficient processes simplify data collection and analysis, as well as supporting activities such as recruitment. In addi-tion, the performance management model strengthens employee engagement: career goals are developed individually together with superiors, taking into account corporate values. Both the develop-ment steps and target achievement are stored in the system and can be monitored by employees at any time. This is accompanied by a simplified, embedded feedback process involving colleagues and superiors. This approach benefits both employees – who can actively shape their careers – and GFT, as talented staff can be identified early on and promoted in a more targeted manner. The improvements in performance assessment and personnel develop-ment initiated so far are particularly important for the promotion of international careers, for example by supporting relocations to different countries and project assignments. In the reporting period, the main focus was on data migration and an extensive test phase of the performance management model. The roll-out and training phase has already begun and will be completed in 2019.
GFT has long collaborated closely with universities in Brazil, Ger-many, Poland and Spain. The Group is also a partner company for various dual study programmes in Germany.
Tailored career and working modelsThe tailored solutions developed together with our employees not only focus on career development, but also on the structuring of their working conditions – depending on their respective needs and life situation. Flexible working hours and mobile work enable staff to find the right work-life balance. In addition, GFT offers bespoke part-time options, for example in connection with parental leave, or supports the planning of longer career breaks (sabbaticals).
In-house training options are tailored to GFT’s core areas, such as software development, IT architecture, consulting, sales and project management. International programmes, such as the GFT Accelerated Leadership Program or Cross Cultural Management Training, prepare employees specifically for their next career level. In addition, GFT develops management staff by providing coaching and special mentoring programmes. In addition, the development of technological competence was intensified by means of external training and certification in the reporting period.
GFT Annual Report 2018
Open and direct communicationGFT cultivates open, two-way communication and uses various channels for this purpose. The international team of the digital staff newsletter “Newstime” regularly publish articles from the company’s various countries and locations. In her CEO blog “Connecting the dots”, Marika Lulay provides insights into company activities and the latest trends in the industry and technology, while also encouraging comments and discussion.
Local events promote an ongoing dialogue between top manage-ment and employees from different divisions. In addition, regular events are offered which deal specifically with topics and trends relating to employee satisfaction. During annual appraisal meetings, employees and HR supervisors review the achievement of personal and professional goals during the previous year and define new goals for the year ahead. In addition, feedback can be given and received directly and easily via the performance management model. Once a year, Value Awards are presented to employees at various locations worldwide who exemplify GFT’s values to a particularly high degree. Colleagues and superiors can nominate candidates and submit votes.
Quality managementGFT continuously develops its quality management system and applies strict standards for its software development process. The company has been using the CMMI (Capability Maturity Model Integration) reference model since 2005 – it currently has Level 3 certification. This certification level is achieved if projects are con-ducted according to an adapted standard process with constant group-wide process optimisation in order to guarantee top-quality implementation. In addition to quality management, GFT also meets high standards in the field of data privacy and IT security. The global Information Security Management System (ISMS) has fulfilled the ISO / IEC 27000 standard since 2013.
3 Risk report
3.1 Principles
Aims of the risk management systemThe main objective of the GFT Group’s risk management system is to identify risks at an early stage that may have a negative impact on the Group’s sustainable growth or a direct impact on its finan-cial position and performance. The GFT Group defines negative deviations from its guidance or medium-term planning as risks. The focus is on avoidance of all risks that might endanger the compa-ny’s continued existence. Insofar as risks cannot be avoided, the assessment of their impact on the GFT Group and the likelihood of occurrence is an integral part of the risk management system in order to evaluate risks and derive appropriate measures to minimise them, taking into account the associated opportunities. The Group Risk Committee (GRC), comprising the global risk owner, plays a key role in this matter.
Internal control and risk management organisationThe risk management system of GFT Technologies SE is embedded in the risk management organisation of the GFT Group.
As an internationally operating company, the GFT Group is con-tinually exposed to internal and external risks which need to be monitored and limited. To this end, a group-wide risk management system has been established in order to identify and analyse risks at an early stage and take appropriate counter-measures. The system serves to recognise potential occurrences that might lead to a lasting or significant impairment of the company’s financial position and per-formance. The GFT Group employs suitable controlling instruments to monitor the risks.
The implemented risk management system ensures compliance with the relevant legislation as well as the effective management of risks. In order to guarantee the effectiveness of the GFT Group’s global risk management system and enable the aggregation of risks and transparent reporting, a consistent, integrated approach to the management of corporate risks has been implemented.
The risk management system comprises a variety of control processes and control mechanisms and represents an essential element of the corporate decision-making process. It has therefore been implemented throughout the GFT Group as a fundamental component of the business processes. The main principles and the organisational structures, measurement and monitoring processes are defined in a risk management guideline.
The group-wide risk management function (headed by Group Con-trolling) and the risk owners of the various departments are charged with updating and implementing the risk management guideline. At the same time, the risk inventory is regularly updated and risks assessed on an annual basis. Within the central risk management system of the GFT Group, each employee has the opportunity to report escalations in risk categories, which are then measured by the risk category owners.
Combined Management Report 46 – 47
All managers of the GFT Group are involved in the group-wide risk policy and associated reporting processes. This includes the risk owners of the various departments at a global level, the Managing Directors and the chief executives of Group subsidiaries, as well as those managers responsible for processes and projects.
Risk management systemThe Risk Management Guideline regulates the handling of risks within the GFT Group and defines a uniform methodology valid across the entire Group. The guideline is regularly reviewed and adjusted as required, but at least once a year. The effectiveness of the risk man-agement system and ICS (internal control system) is monitored by regular audits of the Corporate Audit division. Moreover, the external auditors check every year whether the risk management system is suited to recognising existential risks at an early stage.
The GFT Group’s risk management system is integrated into its busi-ness processes and decisions and thus embedded into group-wide planning and controlling processes. Risk management and control mechanisms are precisely coordinated with each other. They ensure that relevant risks for the company are recognised and assessed as early as possible.
The identification of risks takes place at different levels of the company. This is to ensure that risk tendencies are recognised and consistent risk management is practised across all departments. Moreover, each employee is called upon to inform their superiors about foreseeable risks.
The centrally organised GRC, headed by the Chief Financial Officer (CFO), is at the heart of the standardised risk reporting process. It coordinates the various management bodies and ensures they are provided with swift and continual information. The GRC is also responsible for the continual analysis of GFT’s risk profile, for initiating measures to prevent risks and for the corresponding control instruments. In addition, the GFT Group’s management bodies hold regular meetings in dedicated groups (mainly Group Management Board and GRC) in order to exchange risk-relevant information between the operative and central divisions across all levels, locations and countries.
The planning and identification of internal and external risks is car-ried out jointly by the risk category responsibles and the business units or national companies. Depending on the estimated probability of occurrence and potential impact (such as the potential loss or damage amount), risks are classified as “high”, “medium” or “low”. The key risk indicators are summarised in the risk inventory.
Risks are monitored in close cooperation between the global risk owners and the department managers in the operational areas. They also jointly ensure the implementation of effective strategies to minimise risks. Risks can either be reduced by taking pro-active countermeasures or consciously accepted. The department man-agers are responsible for continuously monitoring the risks and the effectiveness of countermeasures. Where possible, risks are hedged against by taking out insurance cover if this is considered useful with regard to the economic benefits.
The GRC receives regular reports on the status of the risk manage-ment system and its implementation in the Group’s various divisions. Moreover, it is informed about the financial outlook, risk-relevant KPIs and the current risk status of operational projects at its regular meetings.
Description of the accounting-related internal control and risk management system according to sections 289 (4) and 315 (4) HGBThe internal control and risk management system for the accounting of the GFT Group and the annual financial statements of GFT Tech-nologies SE is linked with the company-wide risk management system. It includes organisational and monitoring structures to ensure that business items are recorded, processed and analysed in accordance with statutory regulations and are subsequently incorporated into the consolidated financial statements according to IFRS and the annual financial statements of GFT Technologies SE pursuant to the German Commercial Code (Handelsgesetzbuch, HGB) in a compliant manner.
The accounting process of the GFT Group (including GFT Technol-ogies SE) ensures that the full and correct amounts and disclosures are included in the instruments of financial reporting (accounting, components of the financial statements, the Group Management Report and Management Report) and that the relevant legal and statutory requirements are fulfilled. The respective structures and processes also comprise the risk management system and internal control measures in relation to the accounting process.
Key elements of risk management and control in the accounting process include a clear allocation of responsibilities and controls in the preparation of annual financial statements, as well as transparent regulations in the form of accounting guidelines. Further important control principles in the accounting process include the “four-eye principle” and a clear separation of functions.
The Group Consolidation department transfers all relevant changes in the accounting and measurement policies to the group-wide guidelines on accounting and revenue recognition. Together with the financial reporting calendar, these guidelines form the basis for the financial reporting process. The subsidiaries of GFT Technolo-gies SE are responsible for compliance with group-wide accounting standards in their financial statements and are supported and mon-itored to this end by the Group Consolidation department. External service providers are used for the valuation of pension obligations, purchase price allocations in the course of company acquisitions or other complex accounting transactions. The consolidation is performed globally by the Group Consolidation department. Internal Audit performs audits of the accounts prepared by the consolidated companies.
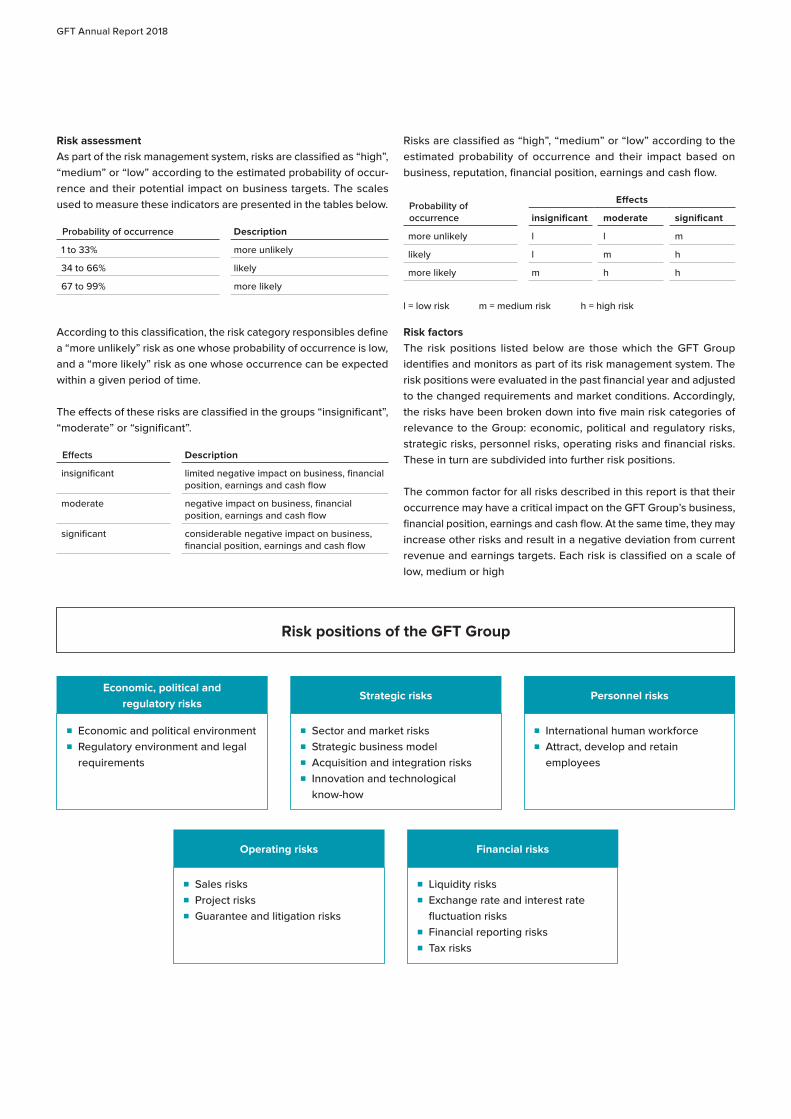
GFT Annual Report 2018
Risk assessmentAs part of the risk management system, risks are classified as “high”, “medium” or “low” according to the estimated probability of occur-rence and their potential impact on business targets. The scales used to measure these indicators are presented in the tables below.
Probability of occurrence Description
1 to 33% more unlikely
34 to 66% likely
67 to 99% more likely
According to this classification, the risk category responsibles define a “more unlikely” risk as one whose probability of occurrence is low, and a “more likely” risk as one whose occurrence can be expected within a given period of time.
The effects of these risks are classified in the groups “insignificant”, “moderate” or “significant”.
Effects Description
insignificant limited negative impact on business, financial position, earnings and cash flow
moderate negative impact on business, financial position, earnings and cash flow
significant considerable negative impact on business, financial position, earnings and cash flow
Risks are classified as “high”, “medium” or “low” according to the estimated probability of occurrence and their impact based on business, reputation, financial position, earnings and cash flow.
Probability of occurrence
Effects
insignificant moderate significant
more unlikely l l m
likely l m h
more likely m h h
l = low risk m = medium risk h = high risk
Risk factorsThe risk positions listed below are those which the GFT Group identifies and monitors as part of its risk management system. The risk positions were evaluated in the past financial year and adjusted to the changed requirements and market conditions. Accordingly, the risks have been broken down into five main risk categories of relevance to the Group: economic, political and regulatory risks, strategic risks, personnel risks, operating risks and financial risks. These in turn are subdivided into further risk positions.
The common factor for all risks described in this report is that their occurrence may have a critical impact on the GFT Group’s business, financial position, earnings and cash flow. At the same time, they may increase other risks and result in a negative deviation from current revenue and earnings targets. Each risk is classified on a scale of low, medium or high
Risk positions of the GFT Group
Financial risks
■ Liquidity risks ■ Exchange rate and interest rate
fluctuation risks ■ Financial reporting risks ■ Tax risks
Operating risks
■ Sales risks ■ Project risks ■ Guarantee and litigation risks
Strategic risks
■ Sector and market risks ■ Strategic business model ■ Acquisition and integration risks ■ Innovation and technological
know-how
Economic, political and regulatory risks
■ Economic and political environment ■ Regulatory environment and legal
requirements
Personnel risks
■ International human workforce ■ Attract, develop and retain
employees
Combined Management Report 48 – 49
3.2 Economic, political and regulatory risks
Economic and political environmentThe main macroeconomic risks of the GFT Group include the overall economic situation, the general propensity to invest and price devel-opments on the IT market. The political and economic development of the economies in core markets has an impact on the investment behaviour of customers. In the financial year 2018, the GFT Group generated 81% of its revenue in Europe, so that in particular the European environment is of importance.
Events such as a regional or global economic crisis, military conflicts, terrorist attacks, fluctuations in national currencies or the creation of trade barriers (e. g. Brexit) can have a lasting impact on demand for solutions and services, for example due to delays in project contracts, rising credit risks of customers, changed refinancing costs or other distortions of competition.
The GFT Group prepares for the occurrence of such macroeconomic risks by taking appropriate measures such as changing its investment priorities, adjusting the portfolio of services, making organisational changes or hedging.
The GFT Group estimates the probability of these macroeconomic risks as likely. The effects on the GFT Group can range from insignif-icant to significant, so that in total these risks are classified as high.
Regulatory environment and legal requirementsThe legal requirements to be observed by the GFT Group have inten-sified significantly over the past years. Even if GFT does not infringe any laws, an alleged violation of laws or an accusation brought forward can have a seriously negative impact on its reputation and thus on its share price.
The wide variety of relevant legal regulations makes it difficult to assess such legal risks. If the relevant laws are not observed or the requirements of customers (e. g. regarding data privacy and informa-tion security) are not sufficiently met, this might lead to investigations by the supervisory authorities, liability claims, fines and the loss of customers and thus affect the business and economic success of the GFT Group.
The Legal department regularly reviews new legal requirements in the business and corporate environment of the GFT Group. Based on this latest information, internal legal processes and corporate guidelines are continuously kept up to date. The GFT Group takes particular care to ensure that all employees are familiar with, and comply with, its code of conduct (Business Conduct Guideline), the data protection rules and the regulations on information security.
The GFT Group estimates the probability of legal risks as not pre-dominantly likely, their impact on the GFT Group may be significant however, and in total these risks are therefore classified as medium.
3.3 Strategic risks
Sector and market risksThe GFT Group has a strong focus on the financial services sector. In the financial year 2018, 92% of revenue was generated with clients in this industry. There are risks, for example, in the form of regional or global financial and economic crises, inadequate or excessive regulation of financial service providers and normal demand cycles in the markets of GFT. In addition, there are political risks, such as a possible Brexit or an increase in trade barriers around the world, which could impair economic activity in our target markets.
In order to minimise the dominant market risks, the GFT Group is diversifying both its client base and service portfolio in the area of its core competencies. For example, the acquisition of a Canadian IT specialist in the insurance business has strengthened GFT’s offerings in the sector and target region. Further measures include the conclusion of long-term contracts, intensive customer support at the level of top management, the strengthening of partnerships with platform providers and the expansion of product offerings with new technologies.
The GFT Group estimates the probability of the risk of focusing on the financial services sector as likely, its impact on the GFT Group can range from insignificant to significant, and the resulting risks in total are therefore classified as high.
Strategic business modelRisks arising from the strategic business model or from grasping strategic opportunities are integrated into the strategic planning process. Strategic risks (including risks from the client portfolio) are given priority in their analysis by top management.
As the long-term impact of strategic risks and their impact on the financial position and performance, as well as cash flow, is difficult to quantify, such qualitative factors as economic and technology trends, compliance requirements and competition are included in risk assessment as strategic factors.
The country managers and risk officers of the individual departments evaluate potential strategic risks in their areas of responsibility and regularly report identified risks at the highest management level (Managing Directors and GRC). There is a particular focus on strate-gic risks during the annual budget process: risks are evaluated and assessed, and corrective measures introduced if necessary in order to avoid or at least minimise the risk.
The GFT Group estimates the probability of risks from its strategic business model as more unlikely, yet their impact on the GFT Group may be significant, so that in total these risks are classified as medium.
GFT Annual Report 2018
Acquisition and integration risksInorganic growth is a component of the GFT Group’s strategy. Targeted acquisitions minimise risks in various areas, expand the range of existing solutions, expand the customer portfolio and reduce dependence on markets. The risks in this field include false assessments regarding the integration concept, potential customers, staff qualifications, management skills, or legal and warranty risks.
The acquisition process is supported by the “Merger & Acquisition” team based on standardised structures, processes and templates. Experience gained from previous acquisitions is used to optimise standards. The GFT Group has made a total of eight acquisitions since 2011.
These risks are dealt with by commissioning external experts in advance of any acquisition to assess the legal and commercial risks and the quality of the customer relationships (due diligence). Moreover, a qualitative evaluation of the employees and managers of the target company is made prior to acquisition. The integration concept is also prepared in detail prior to any corporate acquisition on the basis of experience from previous takeovers.
On the one hand, acquisitions help to minimise risks, for example by increasing industry diversification and reducing client dependency. On the other hand, risks arise during integration into the GFT Group’s existing structures. The post-merger integration process is headed by the COO and is based on a multi-level standard integration process that balances risk and effort and decides between minimal and the various stages up to full integration. The COO is responsible for compliance with standards and has a coordinating role in local post-merger integration processes.
The GFT Group estimates the probability of risks in connection with company acquisitions as likely and their impact on the GFT Group may be significant in certain cases. In total, these risks are therefore classified as high. As a consequence, company acquisitions are examined very thoroughly and the subsequent integration process is well prepared.
Innovation and technological know-howThe demand for the IT solutions offered by GFT depends heavily on market and sector trends in the financial services sector and, in par-ticular, on the strategic alignment of its main clients. The GFT Group safeguards its future market success as a leader in technology and innovation by identifying technological trends early on and introducing corresponding measures to quickly implement suitable technologies. The short life cycles of IT systems, technologies and software solutions are a key element of the business environment. There is a risk that major developments may not be recognised quickly enough, or underestimated and not applied or implemented. This may have a negative impact on the development of business and revenue.
The risks that can arise from changing demand for GFT’s existing solutions are difficult to quantify in terms of impact and probability of occurrence. In order to minimise the risk, GFT’s strategic business model is based on a wide range of services and solutions for our clients.
GFT works with strategic technology partners to identify changes in demand trends as soon as possible. In addition, GFT’s technology experts regularly take part in congresses and panel discussions, particularly in the field of digitalisation, blockchain, cloud, DevOps, data analytics, artificial intelligence and Industry 4.0 (IoT). Innovation enjoys a high priority at GFT, which is why we continuously invest in research and development.
New technologies are evaluated internally according to their matu-rity and relevance to GFT’s core business. In the case of relevant technology trends, measures are taken to ensure that strategic partnerships are reviewed, adapted as necessary or expanded, and that prototypes are created.
The GFT Group estimates the probability of risks in connection with innovations and technological know-how as more unlikely. The impact on the GFT Group can be significant in individual cases, so that these risks can be classified as medium in total.
Combined Management Report 50 – 51
3.4 Personnel risks
International human workforceHighly qualified and motivated employees at our international development centres are a key success factor for the GFT Group. Risks arise if the employees required for the implementation of the acquired projects are not available, if the technological skills of employees do not (or no longer) satisfy market needs, or if team sizes are reduced by above-average staff turnover. The current changes in geopolitical conditions (e. g. protectionism) may limit the global mobility of our employees.
These risks may lead to inadequate utilisation of the Group’s own employees and thus result in fixed costs not being covered. Staff departures may incur additional costs for personnel recruitment measures and overload the remaining employees, which may reduce quality and customer satisfaction.
The GFT Group counters these risks by positioning itself as an attractive and globally operating employer which seeks to retain its specialists and executives. The respective HR policy measures include attractive working conditions, personal space, attractive remuneration systems, tailored career models and extensive training. With the aid of targeted recruitment measures, the Group strives to attract new talent and to develop its positive presence on the job market.
Insofar as customer requirements cannot be met by our own staff, mainly due to capacity bottlenecks or a lack of specialist skills on the part of our staff, targeted external resources are used.
Attract, develop and retain employeesIn connection with the current shortage of specialist staff, particularly in the IT sector, the recruitment of skilled employees is hampered by the ongoing rise in demand. The same applies to the retention of existing employees. Unless we are able to find suitable employees or to retain them, there is a risk that we will no longer be able to implement our operating activities as effectively and successfully, or that our service portfolio and technological know-how will not be able to develop as planned.
Since employees are at the heart of our business model and make an essential contribution to the company’s success, GFT attaches great importance to the issue of employee retention.
For this reason, trends in the world of work are observed and appro-priate measures are taken to continuously develop and increase the attractiveness of the company for employees.
These measures include a regular review of local working time and salary models, the further development of our career model, the performance assessment of employees, and the promotion of employees via internally initiated talent development programmes.
The GFT Group estimates the probability of risks in connection with procuring, training and retaining employees as likely, while their impact on the GFT Group is more moderate so that in total these risks are classified as medium.
3.5 Operating risks
Sales risksThe core business of the GFT Group comprises consulting, the development of software solutions, and the implementation of international IT projects. Depending on the complexity of the project, the type of order or solution offered, this may involve contractual, technological and economic risks.
In order to keep these project risks at a manageable level, the GFT Group employs a standardised and computer-aided bidding process which makes the calculated margins and potential risks transparent for all involved employees. Offers are released by defined specialists and managers at all levels of the hierarchy depending on the economic size and risk profile of the project.
Moreover, as a further risk-reducing measure in the field of operating activities, master contracts drafted by the Group’s own legal depart-ment are used as far as possible. With the exception of companies in Italy, any deviations from the standards and the clients’ own contracts are checked and negotiated by the GFT Group’s legal department. The companies in Italy are supported completely by external legal advisors. These measures ensure that liability risks associated with the contracts (for example, warranties or industrial property rights) are regulated in a clear and transparent way and limited to a reasonable amount. The companies belonging to the GFT division in Italy are supported by external lawyers. Contractual provisions that go beyond the general requirements of the GFT Group (such as the assumption of unlimited liability or the agreement of excessive penalties) require the express approval of the Managing Directors.
The GFT Group estimates the probability of sales risks as more unlikely. The impact on the GFT Group can be significant in individual cases, so that these risks are classified as medium in total.
GFT Annual Report 2018
Project risksThe implementation of IT projects, especially at fixed prices, is associated with technological and economic risks. Project delays, insufficient quality or lack of resources may lead to economic losses, compensation claims, lack of repeat business and damage to the Group’s reputation.
Project processing includes a risk management system integrated into project management methods, which safeguards the imple-mentation or provision of services. The internationally recognised Capability Maturity Model Integration (CMMI®) process model is used. Application of the CMMI® process has in the past enabled us to significantly reduce technical problems such as projects going over budget or deadlines not being met. Project and quality man-agement have been optimised with the successfully certified further development of internal processes according to CMMI® Level 3. The corporate division Risk & Quality Management examines group-wide compliance with the CMMI® model and the implementation of risk management requirements, and reports any deviations to the responsible managers and the Managing Directors.
The staff required for the completion of contracted projects are coordinated by the local staffing managers. The required manpower capacities and technological knowledge for the project are contin-uously planned. The resulting utilisation in the following months is defined on the basis of the in-house workforce and project utilisa-tion. Any lack of capacity is offset by hiring new staff or purchasing external services. Foreseeable surplus capacities are counteracted by early communication to the sales department, which then steps up its sales activities.
The relevant project risks of the GFT Group are made transparent for the manager responsible by means of standardised escalations of the respective departments (Risk & Quality Management, Con-trolling). In the course of standardised monthly reporting, the main project risks are communicated to the Managing Directors who initiate additional countermeasures where appropriate.
The project business of the GFT Group is not possible without project risks – which are generally offset by project opportunities.
GFT estimates the probability of such project risks as likely. Their impact on the GFT Group can be significant in certain cases, and in total this risk is therefore classified as high and extensive methods and processes to manage project risks are employed.
Guarantee and litigation risksThe possible economic harm caused by the infringement of industrial property rights, and in particular third-party rights to patents and software, may lead to considerable damage. Due to the increasingly frequent disputes between licensors and licensees, the growing relevance of patents in the field of software and the ever-increasing use of open source software, the GFT Group has established mech-anisms for the preparation of bids to customers which are designed to reduce legal risks and potential damages claims in this field.
The Chief Information Security Officer of the GFT Group is currently responsible for examining any pre-existing patents. In addition, a technical and legal process has been introduced which accompanies the use of open source components during bid preparation and throughout the project activities. During the bid preparation stage, any open source components which are used are checked by the project managers with regard to licensing using a matrix system; technical alternatives are discussed – where necessary – with the project managers. On the basis of this review, the use of specific open source software is either possible, possible only to a limited extent, or not possible at all.
The GFT Group estimates the probability of operating risks as more unlikely. Their impact on the GFT Group can be significant in certain cases, so that in total these risks are classified as a medium risk.
3.6 Financial risks
Liquidity risksThe liquidity of the GFT Group ensures its ability to conduct busi-ness. Local or global turbulence among banks, customers or capital markets can result in risks for investments made and receivables due and thus adversely affect the liquidity position.
Such risks may arise, for example, from delayed receipt of receiva-bles or the partial or complete loss of receivables from customers. On the investment side, capital market turbulence, rating downgrades and bank failures may lead to write-downs on investments made with an impact on earnings.
The GFT Group has a centralised financial management system with daily financial status reporting. The most important objective is to ensure sufficient liquidity for the Group. Outstanding receivables are analysed as part of the monthly consolidated reporting process so that countermeasures can be initiated at an early stage. In the case of new customers, credit checks are carried out during the bidding process. On the investment side, the GFT Group pursues a conservative investment policy with an exclusively short-term focus at present.
Combined Management Report 52 – 53
In addition to a syndicated loan agreement, GFT Technologies SE has taken out several promissory note loans to secure its long-term funding. There are certain rules of conduct for the GFT Group during the term of the loan agreement. These mainly refer to specific finan-cial covenants which must be met and the assumption of financial liabilities and the provision of collateral is limited. If specific financial covenants and other rules of conduct are not met, this may lead to the immediate termination of the syndicated loan agreement. From the current perspective, there are no significant risks relating to the non-achievement of financial covenants or non-compliance with the other rules of conduct which are known.
The GFT Group estimates the probability of these liquidity risks as more unlikely. However, their impact on the GFT Group may be significant so that in total this risk is classified as medium.
Exchange rate and interest rate fluctuation risksAs an internationally operating company which prepares its accounts in euro, the GFT Group is subject to various financial risks from fluctuations in interest and exchange rates which may have a negative impact on its financial position and performance, as well as its cash flows.
Periodic fluctuations in currencies entail considerable risks for the financial position and performance as well as expected cash flows, in particular due to the mandatory currency translation into euros. As the GFT Group conducts its business around the globe, a significant proportion of its invoicing is in foreign currencies. In the financial year 2018, transactions in foreign currencies which were then translated into the Group's reporting currency, the euro, accounted for around 31% of consolidated revenue. Exchange rate risks resulting from the appreciation or depreciation of currencies arise in the Group’s operating business primarily when revenue is generated in a currency other than that used for the related costs.
The financial structure, investments and other balance sheet items of the GFT Group are subject to interest rate fluctuations on the capital markets which may have a negative impact on earnings, and especially on the interest result and other items of the income statement subject to discounting, as well as on cash flows.
The Treasury department continuously monitors the existing and potential currency risks for revenue, earnings and balance sheet items. Where required, the GFT Group uses financial instruments to hedge against exchange rate fluctuations. In particular, the exchange rates of the Brazilian real, the US dollar and the British pound are closely observed as they are of particular importance for the Group. Interest rate risks are managed by the Group’s treasury manage-ment, which uses financial instruments as required.
In order to limit the risk of interest rate changes for a loan with a nominal amount of €40.00 million and variable interest, an interest cap was concluded with an upper interest rate of 1.00%. Changes in interest rates can lead to fluctuations in the market value of the derivative financial instrument. Such market value fluctuations can-not be viewed in isolation from the hedged underlying transaction
as the derivative and underlying transaction form a valuation unit with regard to their offsetting value development. At the end of the reporting period 2018, there were no further significant financial instruments used for risk management purposes. For a more detailed presentation of financial instruments, see section 9.1 of the notes to the consolidated financial statements.
The GFT Group estimates the probability of interest rate risks as more unlikely and the impact on the GFT Group as moderate so that in total these risks are classified as low. However, the probability of exchange rate risks is estimated as likely, while the impact on the GFT Group can be moderate so that in total these risks are classified as medium.
Financial reporting risksThe GFT Group’s accounts are prepared according to the Inter-national Financial Reporting Standards (IFRS) as applicable in the European Union (EU). Current and future pronouncements on accounting policies and other accounting standards may have a negative impact on the published financial results. Risks arise in particular from delays in adjusting current methods to the new pronouncements on accounting methods and accounting standards as well as unforeseeable changes with regard to the interpretation of standards.
Accounting in accordance with IFRS requires management to make extensive assumptions, estimates and assessments which may have an impact on the financial figures of the GFT Group. Risks may arise in such a way that facts and assumptions on which the estimates and assessments of the management are based, as well as the assessment of these facts change over the course of time. This can lead to significant changes in estimates and judgments and consequently to changes in the financial figures and negative reactions on the capital market.
The GFT Group regularly monitors compliance with the applicable and relevant accounting regulations and reviews new relevant pronouncements or drafts and their interpretation in order to iden-tify and implement any necessary changes to the Group’s internal accounting methods at an early stage.
Risks arising from the use of estimates and judgments are countered by established control mechanisms, for example by applying the dual control principle. In addition, forecasts based on assumptions and estimates, as well as their impact on financial figures, are regularly reviewed and analysed.
The GFT Group estimates the probability of accounting risks as more unlikely, although their impact on the GFT Group can be significant. All in all, these risks are therefore classified as medium.
GFT Annual Report 2018
Tax risksThe GFT Group operates in many countries around the world and is therefore subject to numerous different tax regulations and tax audits. Any changes in legislation and jurisdiction or different legal interpretations by the tax authorities – in particular in the area of cross-border transactions – may involve considerable uncertainties. It is therefore possible that provisions formed may prove to be insufficient and thus lead to a negative impact on the Group’s net income and cash flow.
Any changes or additions by the tax authorities are continuously monitored by the Tax department and the corresponding measures are taken where necessary.
Should such risks nevertheless occur, a moderate impact on the GFT Group's business activities, financial position and performance, and cash flows cannot be excluded. The GFT Group estimates that the occurrence of tax risks is probable, so that the risks must be classified as medium.
3.7 Overall risk assessment
The overall risk assessment is the result of a consolidated examina-tion of the material individual risks explained in this chapter. At the time of preparing this report, there are no recognisable risks that might jeopardise the existence of the GFT Group. No permanent or substantial impairment of the financial position and performance of the company is expected. The early warning system for the detection of risks implemented by the GFT Group is constantly evolving and will be reviewed by the external auditor in accordance with statutory requirements.
4 Opportunity reportOpportunity managementThe GFT Group’s opportunity management records possible devel-opments and events with a positive direct impact on its financial position and performance. Employees and management identify opportunities on the basis of market and competition analyses, industry studies and daily customer contact. On this basis, GFT develops various scenarios for technology and industry trends together with its clients and partners. In regular planning and strat-egy coordination meetings, opportunities that make economic sense are then subjected to a risk analysis and investment evaluation and, where necessary, the research and development department, the range of services offered, and business planning are realigned accordingly.
GFT defines opportunities as possible positive deviations from its guidance for the financial year 2019 and medium-term planning. Developments, trends or events which could have a positive impact on the financial position and performance when they occur are explained in the following sections.
Opportunities from the economic and sector environmentShould macro-economic and sector-based conditions have a more favourable impact on business than expected, this could lead to additional demand and thus have a positive impact on business activity, the financial position and performance, and cash flow.
Opportunities from market developmentsIf the ongoing budget restrictions of the top-2 clients are less pro-nounced than originally expected or even lifted, this would have a positive impact on business activity, the financial position and performance, and cash flow.
Opportunities from research and developmentThe GFT Group’s research and development activities are aimed at identifying or anticipating industry trends and customer needs at an early stage and using these to derive the appropriate solutions. Activities focus in particular on cloud, blockchain, DevOps, data analytics and artificial intelligence – technologies in which expo-nential growth is expected. Opportunities may arise from shorter innovation cycles, faster achievement of market-ready offerings, and subsequent increased scaling.
In addition, reference projects which are completed faster than expected may considerably simplify sales activities and order acquisition.
Combined Management Report 54 – 55
Opportunities from international development centresThe GFT Group’s Delivery Model combines customer proximity and quality with attractive cost benefits and the global utilisation of technological expertise. Strategy concept work and consultation are conducted in direct contact with clients (onshore). Services are provided both onshore and at our nearshore development centres. For the Continental Europe segment, the nearshore development centres are located in Poland and Spain. The nearshore locations in Brazil and Costa Rica serve the North American market. This struc-ture not only offers cost advantages, but also gives our customers access to specialists and technological expertise. If companies are unable to adequately cope with the shortage of skilled workers in their core markets and do not themselves have nearshore capacities as a reservoir of skilled labour, demand for such external services may increase. GFT has a proven nearshore / onshore model and can provide technological expertise and capacities for its global clients. Should the shortage of skilled employees have a greater impact than expected, this could have a positive impact on GFT's business activities.
Opportunities from growth markets and technologiesThe GFT Group’s sales network is constantly being developed in order both to support our clients globally and to attract new clients in high-growth markets. The Group's global positioning enables it to pool local technological expertise at a global level, market this expertise across borders and thus achieve greater scalability.
Opportunities for the GFT Group’s business activities arise both from its various target markets and from its range of solutions based on new technologies. If one or both areas develop more strongly than expected, this could have a positive impact on revenue, earnings and cash flows.
■ Opportunities may arise from the development of new busi-ness models through cooperation between financial service providers and industry. The design of payment processes, for example, offers a variety of approaches for integrating financial transactions into industrial value chains. The GFT Group can support financial service providers and industrial clients with its many years of experience.
■ By making an acquisition during the reporting period, the GFT Group strengthened its expertise in the insurance industry – particularly in the implementation of the platforms Guidewire and Oracle’s OIPA. This enables the Group to exploit its existing expertise more fully and to leverage synergy effects. In addition, a team of experts is being set up in Poland to accom-pany the future growth of nearshore locations. Opportunities may result from stronger than expected growth in solutions for the insurance industry from our partners Guidewire and Oracle. Further positive effects could arise if the integration of the acquired insurance business into existing activities is completed more quickly than expected.
■ The transfer of IT systems to the cloud enables clients in the financial, insurance and industrial sectors to make their IT systems more flexible and cost-effective and also to meet client needs with new applications. Thanks to its strategic partnerships, the GFT Group is excellently positioned to ben-efit from these growth trends. For example, GFT helps clients transfer their systems to the cloud and implement or further develop their applications. Should the market and the business of our partners develop better than expected, this may result in considerable opportunities for the GFT Group.
■ Further potential is offered by Industry 4.0 and the Internet of Things (IoT). The successful development of IoT applications requires comprehensive technological expertise in blockchain, cloud, DevOps, data analytics and artificial intelligence – tech-nologies in which the GFT Group already has expertise, and is already using and continuously expanding. Together with its partners, the GFT Group is developing initial solutions and is also forming clusters of expertise in Poland and Spain. Should the innovation cycles shorten and current projects be market-ready sooner than expected, reference projects may provide further opportunities for the GFT Group's business activities.
GFT Annual Report 2018
5 Takeover-relevant informationDisclosures pursuant to section 289a (1) and section 315a (1) German Commercial Code (HGB) and explanatory report of the Administrative Board according to section 48 (2) sentence 2 SE-Implementation Act (SEAG) in conjunction with section 176 (1) sentence 1 German Stock Corporation Act (AktG)
Structure of the share capital (number 1):At the end of the reporting period, the issued share capital of GFT Technologies SE amounted to €26,325,946.00. It is divided into 26,325,946 shares. The proportionate amount of share capital allocated to each share totals €1.00. All shares of GFT Technolo-gies SE were issued as ordinary bearer shares without nominal value (no-par shares). The shares are fully paid up. All shares have the same rights and obligations. Each share grants one vote at the Annual General Meeting.
Restrictions on voting rights or the transfer of shares (number 2):Legal regulations, in particular section 136 AktG (1) and section 44 German Securities Trading Act (WpHG), exclude voting rights for the affected shares in the respective specified cases. We are not otherwise aware of any restrictions affecting voting rights or the transfer of shares.
Shareholdings exceeding 10 percent of the voting rights (number 3):GFT Technologies SE is aware of the following shareholding that exceed 10 percent of the voting rights: as at 31 December 2018, Ulrich Dietz (Chairman of the Administrative Board of GFT Technol-ogies SE), Germany, held 26.499% directly and 0.004% indirectly of total voting rights.
Shares with special control rights (number 4):There are no shares with special rights conferring control.
System of control over voting rights when employees own shares and their control rights are not exercised directly (number 5):We are not aware of any employees who hold shares and do not exercise their control rights.
Legal regulations and provisions in the articles of association governing the appointment and replacement of executive board members (number 6):As a company with a single-tier management and control structure, GFT Technologies SE applies the disclosure obligations of sec-tion 289a (1) number 6 HGB and section 315a (1) number 6 HGB on the appointment and dismissal of executive board members to the Managing Directors. Their appointment and dismissal is governed by article 43 SE-VO (Council Regulation (EC) number 2157 / 2001 on the Statute for a European Company (SE)) and section 40 SEAG. Reference is made to these regulations. Pursuant to section 16 of the articles of association of GFT Technologies SE, the Administrative Board appoints one or more Managing Directors. The Administra-tive Board can appoint one of these Managing Directors as Chief Executive Officer and one as Deputy Chief Executive Officer. In each case, the appointment and dismissal of Managing Directors requires a majority of two thirds of votes cast by the Administrative Board, whereby abstentions or invalid votes are deemed to be votes not cast. The articles of association of GFT Technologies SE do not contain any further regulations on the appointment and dismissal of Managing Directors. Should one of the required Managing Direc-tors be missing, section 45 SEAG states that a court may appoint a Managing Director on application of one of the persons involved.
Rules governing amendments to the articles of association (number 6):The requirements for amendments to the articles of association are regulated in particular in article 59 SE-VO and section 51 SEAG. Ref-erence is made to these provisions. According to section 51 SEAG, the articles of association may determine, unless binding statutory regulations state otherwise, that a simple majority of votes cast is sufficient for a resolution of the Annual General Meeting to amend the articles of association, providing that at least half of share capital is represented. The articles of association of GFT Technologies SE make use of this provision in section 23 (4). A larger majority is required for an amendment to the company’s object, for a resolution on relocating the registered offices of the SE to a different EU mem-ber state, and for other legally binding cases (section 51 sentence 2 SEAG). The Annual General Meeting can assign the authority to amend the articles of association to the Administrative Board insofar as such amendments merely relate to the wording. This is permitted for GFT Technologies SE by the provisions in section 21 (1) of the articles of association. Moreover, the Administrative Board is authorised by a resolution of the Annual General Meeting to amend the wording of section 4 (1) and (7) of the articles of association in accordance with the respective use of Authorised Capital 2017 and after expiry of the utilisation and authorisation period.
Combined Management Report 56 – 57
Executive board authorities, particularly the issuing and buy-back of shares (number 7):As a company with a single-tier management and control structure, GFT Technologies SE applies the disclosure obligations of sec-tion 289a (1) number 7 HGB and section 315a (1) number 7 HGB to the Administrative Board.
Authorised capital:The Administrative Board is authorised until 13 June 2021 to increase the share capital of GFT Technologies SE by up to €10,000,000.00 through a one-time-only or repeated partial issuance of bearer shares (no-par shares) against cash contributions and / or contribu-tions in kind (Authorised Capital).
The Administrative Board is authorised to exclude the legal subscrip-tion right of shareholders,
■ to remove fractional amounts from subscription rights; ■ in the case of capital increases for contribution in kind for the
granting of shares to acquire companies, company divisions, interests in companies or other assets in connection with the aforementioned company acquisitions (even if a purchase component is paid in cash in addition to shares);
■ in the case of a capital increase for cash contribution if the issue price of the new shares is not significantly lower than the stock exchange price and the total prorated amount of share capital attributable to the new shares, for which subscription rights are excluded, does not exceed 10% of share capital, neither on the effective date nor at the time of exercising this authorisation. This restriction is to be applied to those shares which are issued during the term of this authorisation by utilising an authorisa-tion for the disposal of treasury shares valid at the time this authorisation becomes effective in accordance with section 186 (3) sentence 4 AktG. This restriction is also to be applied to shares that have been, or will be, issued for the purpose of servicing convertible bonds / warrants if these bonds are issued during the effectiveness of this authorisation in accordance with section 186 (3) sentence 4 AktG;
■ in the case of a capital increase for the issue of employee shares if the total prorated amount of share capital attributable to the new shares, for which subscription rights are excluded, does not exceed 10% of share capital, neither on the effective date nor at the time of exercising this authorisation.
The Administrative Board is authorised to determine a start date for dividend rights which differs from the statutory regulations and to determine the further details of a capital increase and its implemen-tation, in particular the issue amount and the fee to be paid for the new shares, as well as the granting of subscription rights by means of indirect subscription rights pursuant to section 186 (5) AktG.
Conditional capital: Conditional Capital 2017 (sections 192 et seq. AktG) is regulated in section 4 (7) of the articles of association of GFT Technologies SE:
A conditional increase in the company’s share capital (Conditional Capital 2017) of up to €10,000,000.00 is authorised through the issue of a maximum of 10,000,000 new bearer shares. A condi-tional increase in share capital is only implemented if the bearers of conversion or warrant rights from convertible or warrant bonds (or a combination of these instrument), which were issued by GFT Technologies SE or a domestic or foreign company in which GFT Technologies SE directly or indirectly holds a majority of voting rights and capital, on the basis of the authorisation adopted by the Annual General Meeting of 31 May 2017 agenda item 6, exercise their conversion or warrant rights or fulfil their conversion or warrant obligations from such convertible or warrant bonds, and insofar as the conversion or warrant rights or conversion or warrant obligations are not settled via treasury shares, nor shares from authorised capital, nor by other consideration.
The new shares participate in the profit from the beginning of the financial year in which they are issued; by way of derogation, the Administrative Board may, to the extent legally permissible, stipulate that the new shares participate in the profit from the beginning of a previous financial year for which no resolution of the Annual General Meeting regarding appropriation of profit has been taken at the time of their issue. The Administrative Board is authorised to determine the further specifics in connection with the issue of shares under this contingency.
Purchase of treasury shares:With a resolution adopted by the Annual General Meeting of 23 June 2015, GFT Technologies SE is authorised to purchase treasury shares up to a total of 10% of share capital as at the time of the Annual General Meeting resolution. The authorisation may be exercised once or several times and in full or in partial amounts. However, the treasury shares purchased on the basis of this authorisation, together with those treasury shares already held by GFT Technologies SE or attributed to it pursuant to sections 71a et seq. AktG, may at no time exceed 10% of the respective share capital. The purchase of treasury shares is made via the stock exchange or as part of a public purchase offer made to all shareholders by GFT Technologies SE. The purchase price per share paid by GFT Technologies SE (exclusive of any ancillary costs) may not exceed, or fall below, the arithmetic mean price for shares of the same class and with the same rights in GFT Technologies SE in the closing auction of Xetra trading (or a comparable successor system) over the ten trading days on which a closing auction was held prior to the purchase of treasury shares or, in the case of a public offer, prior to the day on which the public offer was announced, by more than 10%. In the case of a public offer, the volume of the offer may be limited. The authorisation was granted for every legally permissible purpose, and in particular for the following purposes:
GFT Annual Report 2018
■ to use the treasury shares as an acquisition currency for the acquisition of companies or company divisions by GFT Tech-nologies SE;
■ to cancel shares; ■ to offer the corresponding shares for purchase to employees
of GFT Technologies SE and affiliated companies of GFT Tech-nologies SE as defined by section 15 AktG;
■ to sell the shares with the exclusion of shareholder subscrip-tion rights while meeting the requirements of section 186 (3) sentence 4 AktG.
The sale of purchased treasury shares must always be made via the stock exchange or by means of a public offer made to all shareholders. GFT Technologies SE was authorised, however, to employ a different selling method, with the exclusion of shareholder subscription rights, should this be necessary in the interests of GFT Technologies SE, in order to use the shares as follows:
■ to use the treasury shares as an acquisition currency for the acquisition of companies or company divisions by GFT Tech-nologies SE;
■ to offer the corresponding shares for purchase to employees of the company and affiliated companies of GFT Technologies SE as defined by section 15 AktG.
The Administrative Board was also authorised, with the exclusion of shareholder subscription rights, to sell the acquired treasury shares in ways other than via the stock exchange or by way of a public offer to all shareholders, provided that the shares issued with the exclusion of shareholder subscription rights pursuant to section 186 (3) sentence 4 AktG do not exceed 10% in total of share capital, neither at the time this authorisation becomes effective nor at the time when this authorisation is exercised. Those shares issued during the term of this authorisation, utilising an authorisation to issue new shares from Authorised Capital pursuant to section 186 (3) sentence 4 AktG with the exclusion of shareholder subscription rights valid at the time this authorisation became effective, are to be included in this limitation. Also to be included are those shares issued, or still to be issued, for the settlement of warrant / convertible bonds, providing such bonds were issued during the effective term of this authorisation pursuant to section 186 (3) sentence 4 AktG.
In all the above cases, the selling price of a company share (excluding transaction costs) may not be significantly lower than the arithmetic mean price for shares of the same class and with the same rights in GFT Technologies SE in the closing auction of XETRA trading (or a comparable successor system) over the ten trading days on which a closing auction was held prior to the sale of treasury shares or prior to the date on which contract for the sale of treasury shares is concluded. The authorisations to sell may be exercised separately or together, in whole or in part. If exercised in part, the authorisation may be utilised on several occasions. The authorisation applies to shares of GFT Technologies SE already held by GFT Technologies SE at the time this authorisation was granted.
The Administrative Board was also authorised to cancel treasury shares without any further resolution of the Annual General Meeting. The authorisation to cancel shares may be exercised in whole or in part. If exercised in part, the authorisation may be utilised on several occasions. The authorisation applies to shares of GFT Technologies SE already held by GFT Technologies SE at the time this authorisation was granted. Cancellation results in a capital reduction. Contrary to the aforementioned, the Administrative Board may determine that share capital is not reduced, but that the proportion of the remaining shares in the share capital is increased pursuant to section 8 (3) AktG. In this case, the Administrative Board is authorised to adjust the number of shares stated in the articles of association.
The authorisation to purchase treasury shares became effective on 23 June 2015 and is valid until 22 June 2020.
Material agreements of the parent company conditional to a change of control following a takeover bid (number 8):GFT Technologies SE has signed several promissory note agree-ments totalling €59.5 million which grant termination rights to the respective lender in the event that, without prior consent of the respective lender, a person or a number of people acting in unison as defined by section 2 (5) German Takeover Act (Wertpapiererwerbs und Übernahmegesetz – WpÜG), or persons acting on behalf of such persons (with the exception of those defined “Permitted Own-ers” defined below) directly or indirectly acquire, at any time, control of more than 50% of the voting capital of GFT Technologies SE. The term “Permitted Owners” refers to (i) Mr Ulrich Dietz, Mrs Maria Dietz and their offspring, as well as (ii) persons acting on behalf of one or more of the aforementioned persons.
A banking consortium has provided GFT Technologies SE with a syndicated, half-revolving credit line for a total amount of up to €80 million, of which €55 million had been drawn at the end of the reporting period. The consortium members were granted the right to terminate their portion if a person or a group of people who have coordinated their actions pursuant to section 2 (5) WpÜG, or persons acting on behalf of such persons (with the exception of Ulrich Dietz and / or Maria Dietz and / or their offspring) directly or indirectly acquire, at any time, control of more than 50% of the voting capital of GFT Technologies SE.
GFT Technologies SE provides services under a master agreement with Deutsche Bank AG, which also grants Deutsche Bank AG the right to terminate the master agreement and the attendant separate agreements in the case of a change of control. Under this definition, a change of control occurs if (i) a competitor of Deutsche Bank AG buys shares in GFT Technologies SE, and / or an affiliated company which has concluded one or more separate agreements under the master agreement, to the extent that the competitor is able to assume decisive positions within GFT Technologies SE or (ii) a third person who is listed in the embargo list of Deutsche Bank AG purchases half or more of the shares in GFT Technologies SE, or one of the aforementioned affiliated companies, or gains control of their business.
Combined Management Report 58 – 59
In the service contracts of its Managing Directors, GFT Technol-ogies SE has granted the latter special termination rights in the event of a change of control. Further details are provided in the explanations below.
Compensation agreements with executive board members and employees in the event of a change of control (number 9):As a company with a single-tier management and control structure, GFT Technologies SE exclusively applies the disclosure obligations of section 289a (1) number 9 HGB and section 315a (1) number 9 HGB, regarding compensation agreements made with executive board members for the case of a takeover offer, to its Managing Directors.
For the event of a change of control, GFT Technologies SE has agreed identical, time-limited special termination rights with each Managing Director. A change of control exists after the purchase of a minimum of 30% of voting rights in GFT Technologies SE by a third party or by several third parties acting together. A change of control is also deemed to exist on conclusion of an affiliation agreement (as defined by section 291 AktG) by GFT Technologies SE as a depend-ent company, or if GFT Technologies SE merges with a non-group legal entity, or in other comparable situations. If a Managing Director should justifiably exercise his or her special termination rights, they shall have a one-off claim to severance pay. This amounts to 50% of the fixed salary which would have accrued without exercising the special termination right up to the end of the regular contract period, but at least 50% and a maximum of 100% of a full annual fixed salary.
6 Remuneration ReportPrinciples of the compensation system pursuant to section 289a (2) HGB and section 315a (2) HGB and disclosures pursuant to section 285 number 9 HGB and section 314 (1) number 6 HGB, as well as in compliance with the recommenda-tions in section 4.2.5 (3) German Commercial Code (GCGC)This report explains the principles of the remuneration system for the Administrative Board and the Managing Directors of GFT Tech-nologies SE in accordance with the requirements of the German Commercial Code (HGB), the German Accounting Standards and the International Financial Reporting Standards (IFRS). It follows the rec-ommendations of the German Corporate Governance Code (GCGC), insofar as the Administrative Board has not stated deviations to the latter in its Declaration of Compliance. This remuneration report provides disclosures according to section 285 number 9 HGB and section 314 (1) number 6 HGB, which are applied pursuant to article 61 of the Statute for a European Company (SE-VO).
The Remuneration Report contains all disclosures required by sec-tion 4.2.5 GCGC with the exception, however, of the model tables pursuant to the GCGC recommendations. In its latest Declaration of Compliance of 11 December 2018, the Administrative Board of GFT Technologies SE declared that the company had waived the use of model tables as it believes this would not provide any further informational content to the shareholders.
Administrative Board In accordance with section 15 of the articles of association of GFT Technologies SE, remuneration for the members of the Admin-istrative Board is set by the Annual General Meeting. The Annual General Meeting may adopt a higher payment for the chair and deputy chair of the Administrative Board. Payment is due at the end of each financial year. Members of the Administrative Board who only served on the Administrative Board for part of the financial year, receive one-twelfth of annual remuneration for each month of their membership they commenced.
The Annual General Meeting of GFT Technologies SE on 14 June 2016 adopted a resolution that the Administrative Board members of GFT Technologies SE should receive fixed remuneration retroactively for the full financial year 2016 of €43,000.00, while the Chairman of the Administrative Board should receive €86,000.00 and the Deputy Chairman of the Administrative Board should receive remuneration of €64,500.00 – in each case for the respective financial year and in addition to the reimbursement of expenses and the reimbursement of any VAT due on the remuneration and expenses. Those Administrative Board members – including the Chairman and his Deputy – who have been appointed Managing Directors of the company do not receive any Administrative Board remuneration insofar as they already receive remuneration for their duties as Managing Directors. This compensation regulation applies until the Annual General Meeting decides otherwise.
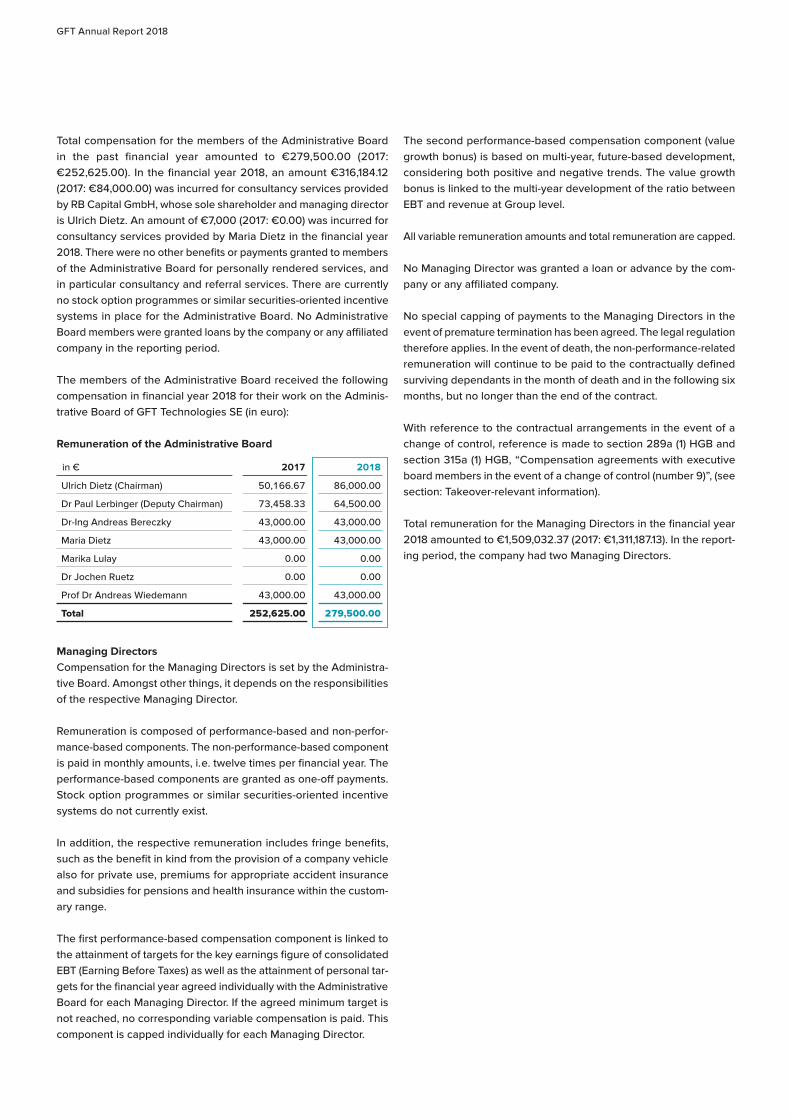
GFT Annual Report 2018
Total compensation for the members of the Administrative Board in the past financial year amounted to €279,500.00 (2017: €252,625.00). In the financial year 2018, an amount €316,184.12 (2017: €84,000.00) was incurred for consultancy services provided by RB Capital GmbH, whose sole shareholder and managing director is Ulrich Dietz. An amount of €7,000 (2017: €0.00) was incurred for consultancy services provided by Maria Dietz in the financial year 2018. There were no other benefits or payments granted to members of the Administrative Board for personally rendered services, and in particular consultancy and referral services. There are currently no stock option programmes or similar securities-oriented incentive systems in place for the Administrative Board. No Administrative Board members were granted loans by the company or any affiliated company in the reporting period.
The members of the Administrative Board received the following compensation in financial year 2018 for their work on the Adminis-trative Board of GFT Technologies SE (in euro):
Remuneration of the Administrative Board
in € 2017 2018
Ulrich Dietz (Chairman) 50,166.67 86,000.00
Dr Paul Lerbinger (Deputy Chairman) 73,458.33 64,500.00
Dr-Ing Andreas Bereczky 43,000.00 43,000.00
Maria Dietz 43,000.00 43,000.00
Marika Lulay 0.00 0.00
Dr Jochen Ruetz 0.00 0.00
Prof Dr Andreas Wiedemann 43,000.00 43,000.00
Total 252,625.00 279,500.00
Managing DirectorsCompensation for the Managing Directors is set by the Administra-tive Board. Amongst other things, it depends on the responsibilities of the respective Managing Director.
Remuneration is composed of performance-based and non-perfor-mance-based components. The non-performance-based component is paid in monthly amounts, i. e. twelve times per financial year. The performance-based components are granted as one-off payments. Stock option programmes or similar securities-oriented incentive systems do not currently exist.
In addition, the respective remuneration includes fringe benefits, such as the benefit in kind from the provision of a company vehicle also for private use, premiums for appropriate accident insurance and subsidies for pensions and health insurance within the custom-ary range.
The first performance-based compensation component is linked to the attainment of targets for the key earnings figure of consolidated EBT (Earning Before Taxes) as well as the attainment of personal tar-gets for the financial year agreed individually with the Administrative Board for each Managing Director. If the agreed minimum target is not reached, no corresponding variable compensation is paid. This component is capped individually for each Managing Director.
The second performance-based compensation component (value growth bonus) is based on multi-year, future-based development, considering both positive and negative trends. The value growth bonus is linked to the multi-year development of the ratio between EBT and revenue at Group level.
All variable remuneration amounts and total remuneration are capped.
No Managing Director was granted a loan or advance by the com-pany or any affiliated company.
No special capping of payments to the Managing Directors in the event of premature termination has been agreed. The legal regulation therefore applies. In the event of death, the non-performance-related remuneration will continue to be paid to the contractually defined surviving dependants in the month of death and in the following six months, but no longer than the end of the contract.
With reference to the contractual arrangements in the event of a change of control, reference is made to section 289a (1) HGB and section 315a (1) HGB, “Compensation agreements with executive board members in the event of a change of control (number 9)”, (see section: Takeover-relevant information).
Total remuneration for the Managing Directors in the financial year 2018 amounted to €1,509,032.37 (2017: €1,311,187.13). In the report-ing period, the company had two Managing Directors.
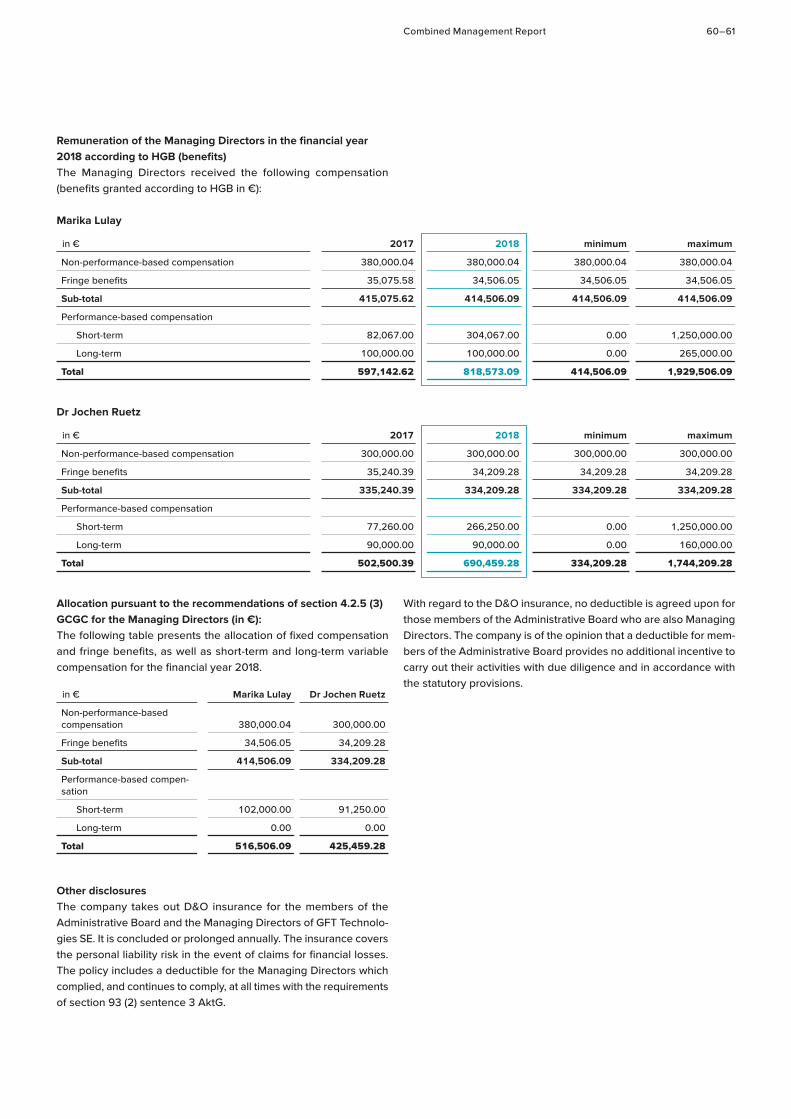
Combined Management Report 60 – 61
Remuneration of the Managing Directors in the financial year 2018 according to HGB (benefits)The Managing Directors received the following compensation (benefits granted according to HGB in €):
Marika Lulay
in € 2017 2018 minimum maximum
Non-performance-based compensation 380,000.04 380,000.04 380,000.04 380,000.04
Fringe benefits 35,075.58 34,506.05 34,506.05 34,506.05
Sub-total 415,075.62 414,506.09 414,506.09 414,506.09
Performance-based compensation
Short-term 82,067.00 304,067.00 0.00 1,250,000.00
Long-term 100,000.00 100,000.00 0.00 265,000.00
Total 597,142.62 818,573.09 414,506.09 1,929,506.09
Dr Jochen Ruetz
in € 2017 2018 minimum maximum
Non-performance-based compensation 300,000.00 300,000.00 300,000.00 300,000.00
Fringe benefits 35,240.39 34,209.28 34,209.28 34,209.28
Sub-total 335,240.39 334,209.28 334,209.28 334,209.28
Performance-based compensation
Short-term 77,260.00 266,250.00 0.00 1,250,000.00
Long-term 90,000.00 90,000.00 0.00 160,000.00
Total 502,500.39 690,459.28 334,209.28 1,744,209.28
Allocation pursuant to the recommendations of section 4.2.5 (3) GCGC for the Managing Directors (in €):The following table presents the allocation of fixed compensation and fringe benefits, as well as short-term and long-term variable compensation for the financial year 2018.
in € Marika Lulay Dr Jochen Ruetz
Non-performance-based compensation 380,000.04 300,000.00
Fringe benefits 34,506.05 34,209.28
Sub-total 414,506.09 334,209.28
Performance-based compen-sation
Short-term 102,000.00 91,250.00
Long-term 0.00 0.00
Total 516,506.09 425,459.28
Other disclosuresThe company takes out D&O insurance for the members of the Administrative Board and the Managing Directors of GFT Technolo-gies SE. It is concluded or prolonged annually. The insurance covers the personal liability risk in the event of claims for financial losses. The policy includes a deductible for the Managing Directors which complied, and continues to comply, at all times with the requirements of section 93 (2) sentence 3 AktG.
With regard to the D&O insurance, no deductible is agreed upon for those members of the Administrative Board who are also Managing Directors. The company is of the opinion that a deductible for mem-bers of the Administrative Board provides no additional incentive to carry out their activities with due diligence and in accordance with the statutory provisions.
GFT Annual Report 2018
7 Forecast report
7.1 Macroeconomic and sector development
Macroeconomic developmentCompared to its last estimates in autumn 2018, the International Monetary Fund (IMF) has downgraded its outlook for the global economy in 2019 and beyond. The IMF’s economists cite the German automotive industry, the uncertainty surrounding Italy’s national debt, economic instability in Turkey and declining momentum in China as the main reasons for this weaker growth. The IMF also identified further risks: these include a weaker trend on the capital markets, geopolitical risks such as Brexit and trade conflicts, and the high level of private and public debt combined with possibly more difficult refinancing conditions. Global economic growth is expected to reach 3.5% in 2019, with slower growth in the developed nations.
The economists at the World Bank come to a similar conclusion. Trade barriers and a decrease in trading activity, dwindling economic momentum, rising debt and instability in the emerging markets have all increased the downside risks. The global economy is expected to grow by 2.9% in 2019.
According to the ECB’s economists, eurozone growth will continue to be driven by the global economic trend – although this is weakening and foreign demand is declining. Favourable financing conditions and employment growth, coupled with wage increases, will con-tinue to stimulate the eurozone economy. However, the risks have increased: due to the persistent uncertainties caused by geopolitical factors, the risk of protectionism, vulnerabilities in the emerging markets and the volatility of the financial markets. The ECB expects eurozone growth to reach 1.7% in 2019.
The Bundesbank's forecast assumes a high level of domestic demand due to wage increases, high consumer spending and an expansive monetary policy. Provided that foreign trade conditions remain stable, the Bundesbank's economists expect GDP growth of 1.6% for Germany in 2019. However, they also forecast that the downside risks will increase.
Sector developmentDespite the growing uncertainty caused by fears of recession, Brexit and trade barriers, the market research institute Gartner forecasts further growth for the IT sector. Its researchers expect global IT spending to rise by 3.2% with above-average growth of 4.7% for IT services. According to Gartner, artificial intelligence will be the most important technology in the coming years as every modern IT solution represents a potential application field. Moreover, the increased dovetailing of the real world with the digital world that IoT applications will bring is expected to provide fresh momentum and create new business models. As companies progress further along their path to digitalisation, they will be able to exploit ever more possibilities for the use of blockchain, data analytics, robotic process automation (RPA) and artificial intelligence.
Financial institutions are expected to invest less in their IT systems in 2019 but the expenses will still be above-average compared with other sectors. According to Gartner, IT spending in the financial sector will grow by 4.2% – following a rate of 4.6% in the previous year. Investment banks will increase their expenditure by 3.5% (pre-vious year: 4.2%) while retail banks are expected to raise spending by 4.4% (previous year: 4.7%). Digital transformation will remain a high priority for the financial sector. As the maintenance of in-house hardware systems is no longer regarded as a core competency, the demand for cloud-based solutions will continue to grow. Moreover, the use of artificial intelligence, data analytics and blockchain offer considerable potential for further efficiency gains in the value chain. Blockchain technology is the least advanced with regard to market readiness. Although the benefits for the financial industry are undisputed, many projects are still at an early stage. In contrast to the financial sector, Gartner’s analysts believe that the insurance industry continues to lag behind with regard to digitisation.
The digital association Bitkom expects growth of 1.5% for the Ger-man ICT market in 2019. The digitalisation trend will continue to drive demand for IT consulting, IT project business and applications. According to Bitkom, this will lead to above-average growth of 6.3% in the software segment and 2.3% in IT services. Bitkom’s experts also forecast above-average growth in the field of artificial intelli-gence in the coming years: the market volume is expected to rise from €3 billion in 2019 to €10 billion in 2022. However, the shortage of IT specialists is expected to worsen significantly and will have a dampening effect on the growth of the entire ICT market.
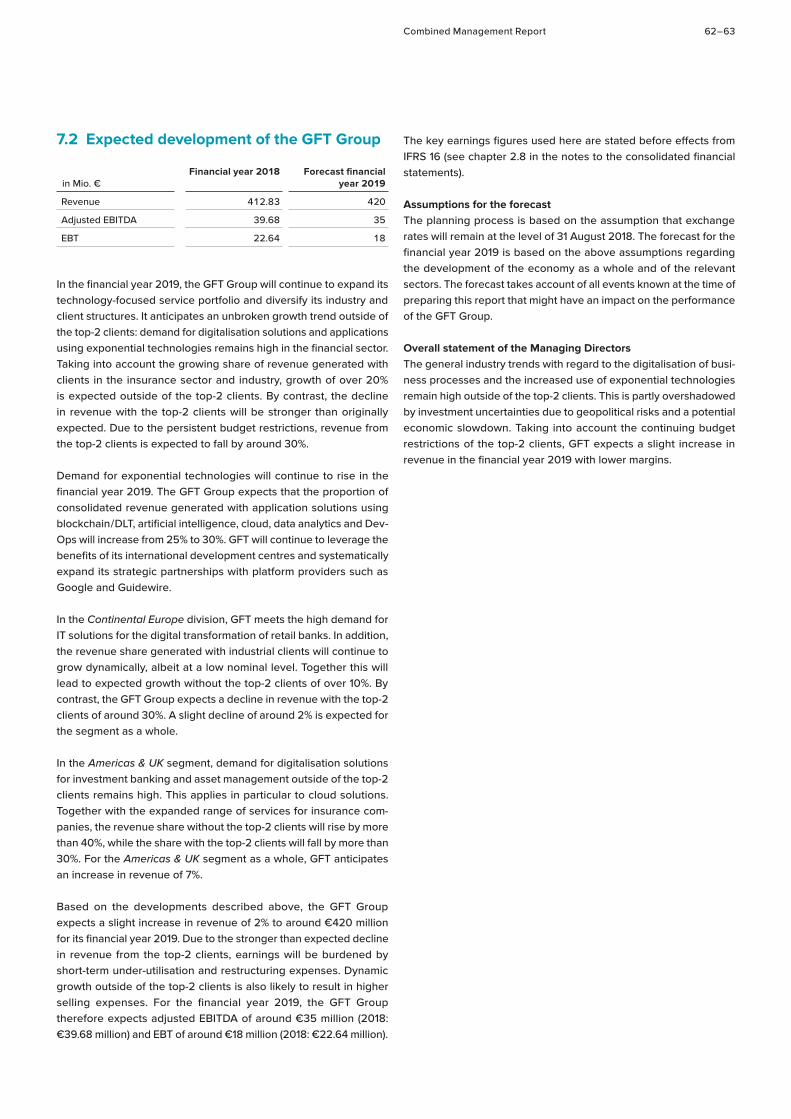
Combined Management Report 62 – 63
7.2 Expected development of the GFT Group
in Mio. €Financial year 2018 Forecast financial
year 2019
Revenue 412.83 420
Adjusted EBITDA 39.68 35
EBT 22.64 18
In the financial year 2019, the GFT Group will continue to expand its technology-focused service portfolio and diversify its industry and client structures. It anticipates an unbroken growth trend outside of the top-2 clients: demand for digitalisation solutions and applications using exponential technologies remains high in the financial sector. Taking into account the growing share of revenue generated with clients in the insurance sector and industry, growth of over 20% is expected outside of the top-2 clients. By contrast, the decline in revenue with the top-2 clients will be stronger than originally expected. Due to the persistent budget restrictions, revenue from the top-2 clients is expected to fall by around 30%.
Demand for exponential technologies will continue to rise in the financial year 2019. The GFT Group expects that the proportion of consolidated revenue generated with application solutions using blockchain / DLT, artificial intelligence, cloud, data analytics and Dev-Ops will increase from 25% to 30%. GFT will continue to leverage the benefits of its international development centres and systematically expand its strategic partnerships with platform providers such as Google and Guidewire.
In the Continental Europe division, GFT meets the high demand for IT solutions for the digital transformation of retail banks. In addition, the revenue share generated with industrial clients will continue to grow dynamically, albeit at a low nominal level. Together this will lead to expected growth without the top-2 clients of over 10%. By contrast, the GFT Group expects a decline in revenue with the top-2 clients of around 30%. A slight decline of around 2% is expected for the segment as a whole.
In the Americas & UK segment, demand for digitalisation solutions for investment banking and asset management outside of the top-2 clients remains high. This applies in particular to cloud solutions. Together with the expanded range of services for insurance com-panies, the revenue share without the top-2 clients will rise by more than 40%, while the share with the top-2 clients will fall by more than 30%. For the Americas & UK segment as a whole, GFT anticipates an increase in revenue of 7%.
Based on the developments described above, the GFT Group expects a slight increase in revenue of 2% to around €420 million for its financial year 2019. Due to the stronger than expected decline in revenue from the top-2 clients, earnings will be burdened by short-term under-utilisation and restructuring expenses. Dynamic growth outside of the top-2 clients is also likely to result in higher selling expenses. For the financial year 2019, the GFT Group therefore expects adjusted EBITDA of around €35 million (2018: €39.68 million) and EBT of around €18 million (2018: €22.64 million).
The key earnings figures used here are stated before effects from IFRS 16 (see chapter 2.8 in the notes to the consolidated financial statements).
Assumptions for the forecastThe planning process is based on the assumption that exchange rates will remain at the level of 31 August 2018. The forecast for the financial year 2019 is based on the above assumptions regarding the development of the economy as a whole and of the relevant sectors. The forecast takes account of all events known at the time of preparing this report that might have an impact on the performance of the GFT Group.
Overall statement of the Managing Directors The general industry trends with regard to the digitalisation of busi-ness processes and the increased use of exponential technologies remain high outside of the top-2 clients. This is partly overshadowed by investment uncertainties due to geopolitical risks and a potential economic slowdown. Taking into account the continuing budget restrictions of the top-2 clients, GFT expects a slight increase in revenue in the financial year 2019 with lower margins.
GFT Annual Report 2018
8 Explanations on the separate financial statements of GFT Technologies SE (HGB)
8.1 General
The annual financial statements of GFT Technologies SE were pre-pared in accordance with the regulations of the German Commercial Code (HGB), taking into account the supplementary provisions of the German Stock Corporation Act (AktG). They are published elec-tronically in the Federal Gazette. The annual financial statements are permanently available online at www.gft.com/financialreports.
The management report of GFT Technologies SE has been combined with the management report of the GFT Group. GFT Technologies SE and its results also include the Group’s headquarters with the central functions for Corporate Development, Finance, Communications, Public Relations, Human Resources, Legal and Compliance, as well as Data Protection and Procurement. The economic conditions of GFT Technologies SE are largely identical to those of the Group as described in detail in section 2.2 General economic and sector-spe-cific conditions:
8.2 Research and development
GFT Technologies SE invested a total of €1.19 million in research and development during the financial year 2018 (2017: €1.62 million). Personnel expenses of €0.48 million accounted for 40% of this total (2017: €0.17 million or 11%). Expenses for external services amounted to €0.18 million (2017: €0.25 million), corresponding to 15% (2017: 15%) of total research and development costs.
8.3 Development of business
In the financial year 2018, total revenue amounted to €77.95 million and was thus 6% above the prior-year figure of €73.72 million. Taking into account the change in work in progress and other operating income, total performance rose year on year by 6% in the reporting period.
EBT of GFT Technologies SE decreased year on year by €0.95 mil-lion or 9% to €9.66 million (2017: €10.61 million) and thus fell short of the forecast, which anticipated slight growth. The decline in earnings resulted mainly from increased personnel expenses and other oper-ating expenses. The productive utilisation rate of operating business in Germany amounted to 80% in the financial year and was thus just one percentage point below the expected figure.
8.4 Development of revenue
In its financial year 2018, GFT Technologies SE generated revenue of €77.95 million (2017: €73.72 million), corresponding to a year-on-year increase of €4.23 million or 6%.
The revenue of GFT Technologies SE mainly comprises income from the provision of customer-specific IT services and from group-wide service functions for the subsidiaries. Income from group-wide services stem from sales-related license fees, management fees, central support services and other cost allocations.
Revenue adjusted for income from group-wide services was slightly below the previous year at €54.50 million for the financial year 2018 (2017: €54.87 million). The revenue trend of GFT Technologies SE in connection with IT services depends heavily on the completion of projects and thus on closing-date effects, especially in connection with major orders.
Income from corporate services for subsidiaries included in total revenue amounted to €23.45 million in 2018 compared with €18.85 million in the previous year. The increase was mainly due to higher Group cost allocations for IT services.
With the exception of group-wide services, GFT Technologies SE once again generated most of its revenue in Germany.
8.5 Earnings position
Overview of earnings positionEarnings before taxes (EBT) of GFT Technologies SE declined by €0.95 million to €9.66 million in the reporting period (2017: €10.61 million). This trend was primarily due to a strong increase in personnel expenses (13%) and other operating expenses (11%), which could not be fully offset by the rise in total performance (6%) and a 23% improvement in the financial result.
The productive utilisation rate of operating business (without holding activities) of GFT Technologies SE fell slightly by one percentage point from 81% to 80%. The productive utilisation rate is a non-finan-cial performance indicator. It refers solely to the use of production staff in client projects and does not include any sales activities or internal projects.
Combined Management Report 64 – 65
Earnings position by income and expense itemsDue mainly to closing-date effects for projects not yet completed or accepted, changes in inventories of work in progress rose by €4.04 million to €5.28 million in the financial year 2018 (2017: €1.24 million).
Other operating income decreased year on year by €3.20 million to €6.80 million (2017: €10.00 million), mainly as a result of lower IT overhead allocations.
The cost of purchased services rose by 6% to €33.02 million in the financial year 2018 (2017: €31.24 million) and thus developed in line with revenue growth. The Spanish subsidiary GFT IT Consulting S.L. is still the most important supplier.
As a result of newly hired staff, personnel expenses increased year on year by 13% to €34.74 million in the reporting period (2017: €30.82 million). The new hires were mainly in connection with manpower investments to expand the range of digital services for existing and industrial clients.
In the reporting period, other operating expenses amounted to €21.14 million and were thus 11% higher than in the previous year (2017: €19.03 million). Other operating expenses still mainly comprised expenses for services received, licence fees, legal and consulting fees, expenses in connection with external finance and travel expenses. The increase in the financial year 2018 was due in particular to higher administrative expenses for services purchased from subsidiaries.
The financial result improved by €1.92 million or 23% to €10.11 million in the financial year 2018 (2017: €8.19 million). The increased resulted in particular from lower expenses from profit transfer agreements of German Group companies amounting to €0.44 million (2017: €1.26 million) as well as increased investment income of €10.08 mil-lion (2017: €9.62 million). In the previous year, the financial result was also burdened by writedowns on financial assets of €0.54 million.
Income taxes totalled €0.30 million (2017: €0.44 million). The imputed tax ratio in the financial year 2018 was 3% (2017: 4%).
Annual net income fell by €0.80 million to €9.36 million (2017: €10.16 million), mainly due to the decline in the operating result.
8.6 Financial position
The financial management of GFT Technologies SE ensures the per-manent liquidity of all Group companies. Please refer to section 2.7 Financial position for a more detailed description of the GFT Group’s financial structure.
As of 31 December 2018, GFT Technologies SE held cash and cash equivalents amounting to €7.52 million (31 December 2017: €31.71 million). The strong cash outflow in the financial year 2018 was due to Group financing of purchase price payments for the acquisition of V-NEO Inc. and the takeover of minority interests in GFT Italia S.r.l..
Due to investments in financial assets, the net liquidity of GFT Tech-nologies SE – a product of cash and cash equivalents disclosed in the balance sheet less bank borrowing – declined from €−72.79 million in the previous year to €−106.98 million as of 31 December 2018.
8.7 Asset position
The balance sheet total of GFT Technologies SE rose by 6% or €12.91 million to €212.55 million as of 31 December 2018. The main changes compared to the previous year are presented below.
Non-current assets increased year on year by €50.95 million to €147.77 million (31 December 2017: €96.82 million). The increase is mainly due to investments in financial assets amounting to €49.96 million in connection with the acquisition of V-NEO Inc. and the takeover of minority interests in GFT Italia S.r.l. by subsidiaries of GFT Technologies SE.
Inventories rose year on year in line with the increase in work in progress by €5.28 million to €10.13 million (31 December 2017: €4.85 million).
Current assets decreased by €36.08 million to €60.08 million as of 31 December 2018 (31 December 2017: €96.16 million). This resulted in particular from the year-on-year decline in cash and cash equivalents of €24.19 million to €7.52 million (31 December 2017: €31.71 million) and the year-on-year decrease in trade receivables of €16.17 million to €8.39 million (31 December 2017: €24.56 million). The reduction in cash and cash equivalents is mainly attributable to the Group’s internal financing of acquisitions. The decrease in trade receivables was mainly due to a settlement payment of €11.00 million made by a customer in connection with a legal dispute.
On the liabilities side, shareholders’ equity increased by €1.46 mil-lion to €65.17 million in the reporting period (31 December 2017: €63.71 million). The increase was largely due to net income of €9.36 million (2017: €10.16 million). There was an opposing nega-tive effect on equity from the dividend payment to shareholders of €7.90 million (2017: €7.90 million). The equity rate at the end of the reporting period amounted to 31% (31 December 2017: 32%).
GFT Annual Report 2018
As of 31 December 2018, provisions amounted to €11.24 million and were thus only slightly higher than in the previous year (31 December 2017: €10.81 million). The increase was largely due to tax provisions, which increased year on year by €0.29 million to €0.62 million (31 December 2017: €0.33 million).
Liabilities as of 31 December 2018 were up €11.12 million to €136.13 million (31 December 2017: €125.01 million), mainly due to an increase in bank liabilities. The increase in banks liabilities of €10.00 million to €114.50 million (31 December 2017: €104.50 million) is largely attributable to the partial external financing of acquisitions made by two subsidiaries. Within liabilities, advance payments on orders increased in particular by €3.98 million to €11.21 million (31 December 2017: €7.23 million). This development is related to the increase in work in progress. The increase in liabilities was offset by a decrease in trade payables of €2.90 million to €3.41 million as of 31 December 2018 (31 December 2017: €6.31 million), mainly as a result of closing-date effects.
Due in particular to the increase in borrowing, the debt ratio of GFT Technologies SE increased by one percentage point to 69% as of 31 December 2018 (31 December 2017: 68%).
8.8 Overall assessment
With an increase in total performance of 6% and stable EBT, GFT Technologies SE made solid progress in its financial year 2018. The main growth driver in its operating business – excluding holding activities – was demand for solutions to digitise retail banks.
As of 31 December 2018, GFT Technologies SE had an equity ratio of 31% (2017: 32%) and thus continued to have a solid capital and balance sheet structure.
The economic position of GFT Technologies SE is still dominated by its operating activities and those of its subsidiaries. GFT Technolo-gies SE participates in the operating results of its subsidiaries via dividend payments. As a result, the economic position of GFT Tech-nologies SE is fundamentally the same as that of the GFT Group, as explained in section 2.9.
8.9 Risk and opportunity report
The business development of GFT Technologies SE is mainly subject to the same risks and opportunities as those of the GFT Group. In principle, GFT Technologies SE participates in the risks of its subsidiaries in proportion to its respective shareholding. The risks and opportunities are described in sections 3 Risk Report and 4 Opportunity Report. In addition, legal or contractual contingencies, in particular financing, charges and write-downs on shares in affil-iated companies may result from relationships with the company’s investments.
8.10 Forecast report
The future business trend of GFT Technologies SE is largely sub-ject to the same influencing factors as those of the GFT Group. Detailed information on the expected macro-economic and sector developments, as well as the development of the GFT Group, and the assumptions on which Group guidance is based is provided in section 7 Forecast Report. The future earnings position of GFT Tech-nologies SE is based on the earnings situation of the GFT Group and the decisions regarding the distribution of intra-group dividends.
For the financial year 2019, the revenue and EBT of GFT Technol-ogies SE is expected to be slightly below the prior-year level. The expected decline in the operating result, due mainly to increased investments in staffing for the expansion of digital service offerings for industrial clients, will only be offset in part by investment income.
Stuttgart, 21 March 2019
GFT Technologies SEThe Managing Directors
Marika Lulay Dr Jochen RuetzCEO CFO
Consolidated Financial Statements 66 – 67
Consolidated Balance Sheet 68
Consolidated Income Statement 70
Consolidated Statement of Comprehensive Income 71
Consolidated Statement of Changes in Equity 72
Consolidated Cash Flow Statement 74
Notes to the Consolidated Financial Statements 75
1 General information 75
2 Accounting methods 75
3 Composition of the Group 93
4 Explanations on items of the consolidated balance sheet 96
5 Explanations on items of the consolidated income statement 110
6 Explanations on items of the consolidated statement of comprehensive income 113
7 Explanations on items of the consolidated cash flow statement 114
8 Segment reporting 115
9 Other disclosures 117
Responsibility Statement 129
Independent Auditor’s Report 130
Consolidated Financial Statements (IFRS)
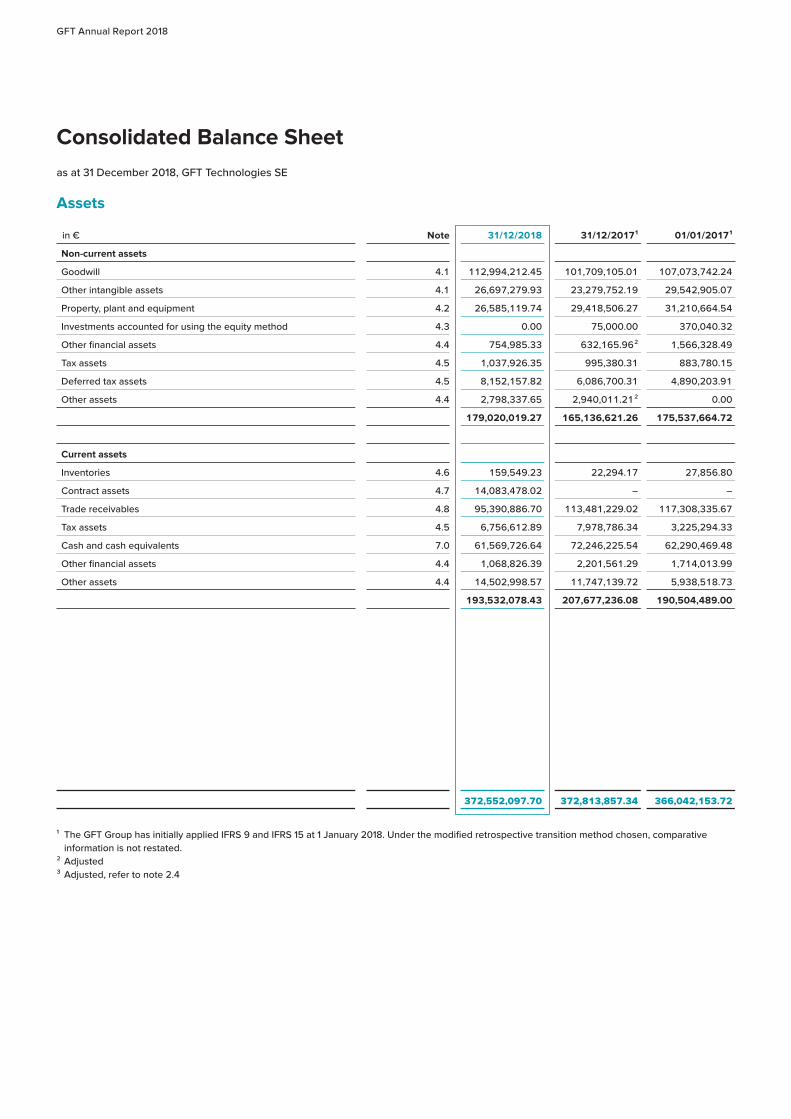
GFT Annual Report 2018
Consolidated Balance Sheetas at 31 December 2018, GFT Technologies SE
Assets
in € Note 31/12/2018 31/12/2017 1 01/01/2017 1
Non-current assets
Goodwill 4.1 112,994,212.45 101,709,105.01 107,073,742.24
Other intangible assets 4.1 26,697,279.93 23,279,752.19 29,542,905.07
Property, plant and equipment 4.2 26,585,119.74 29,418,506.27 31,210,664.54
Investments accounted for using the equity method 4.3 0.00 75,000.00 370,040.32
Other financial assets 4.4 754,985.33 632,165.96 2 1,566,328.49
Tax assets 4.5 1,037,926.35 995,380.31 883,780.15
Deferred tax assets 4.5 8,152,157.82 6,086,700.31 4,890,203.91
Other assets 4.4 2,798,337.65 2,940,011.21 2 0.00
179,020,019.27 165,136,621.26 175,537,664.72
Current assets
Inventories 4.6 159,549.23 22,294.17 27,856.80
Contract assets 4.7 14,083,478.02 – –
Trade receivables 4.8 95,390,886.70 113,481,229.02 117,308,335.67
Tax assets 4.5 6,756,612.89 7,978,786.34 3,225,294.33
Cash and cash equivalents 7.0 61,569,726.64 72,246,225.54 62,290,469.48
Other financial assets 4.4 1,068,826.39 2,201,561.29 1,714,013.99
Other assets 4.4 14,502,998.57 11,747,139.72 5,938,518.73
193,532,078.43 207,677,236.08 190,504,489.00
372,552,097.70 372,813,857.34 366,042,153.72
1 The GFT Group has initially applied IFRS 9 and IFRS 15 at 1 January 2018. Under the modified retrospective transition method chosen, comparative information is not restated.
2 Adjusted3 Adjusted, refer to note 2.4
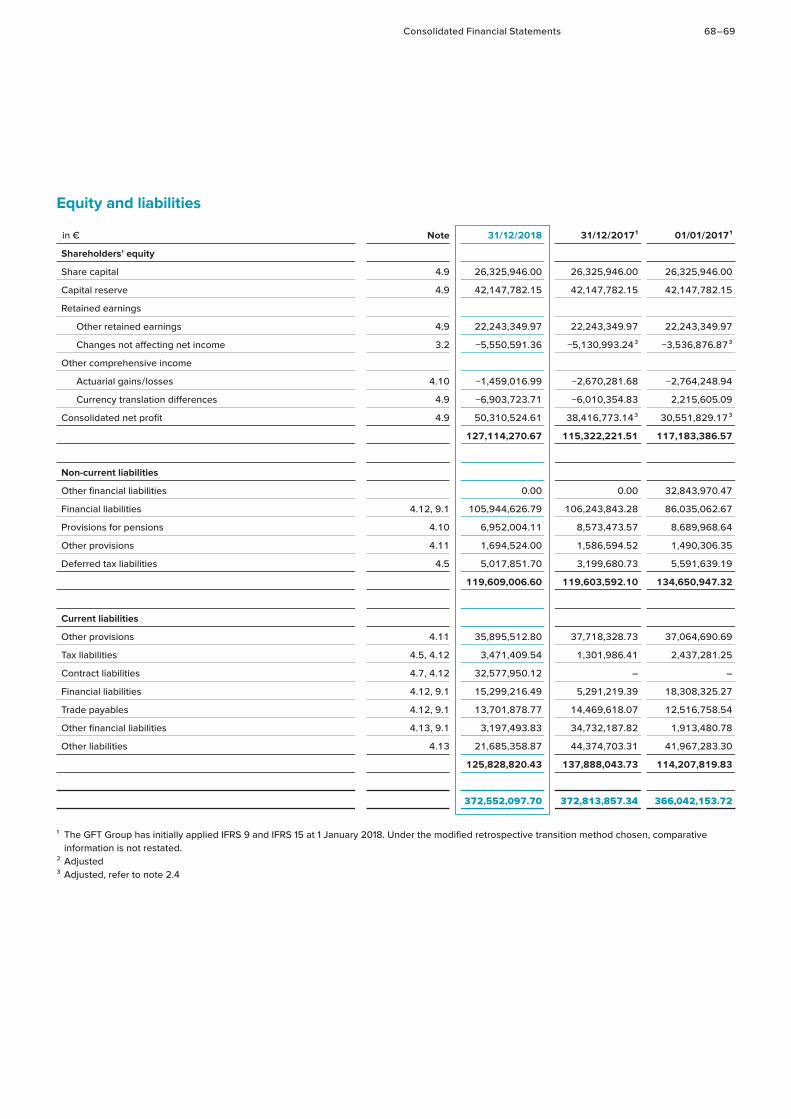
Consolidated Financial Statements 68 – 69
Equity and liabilities
in € Note 31/12/2018 31/12/2017 1 01/01/2017 1
Shareholders’ equity
Share capital 4.9 26,325,946.00 26,325,946.00 26,325,946.00
Capital reserve 4.9 42,147,782.15 42,147,782.15 42,147,782.15
Retained earnings
Other retained earnings 4.9 22,243,349.97 22,243,349.97 22,243,349.97
Changes not affecting net income 3.2 −5,550,591.36 −5,130,993.24 3 −3,536,876.87 3
Other comprehensive income
Actuarial gains / losses 4.10 −1,459,016.99 −2,670,281.68 −2,764,248.94
Currency translation differences 4.9 −6,903,723.71 −6,010,354.83 2,215,605.09
Consolidated net profit 4.9 50,310,524.61 38,416,773.14 3 30,551,829.17 3
127,114,270.67 115,322,221.51 117,183,386.57
Non-current liabilities
Other financial liabilities 0.00 0.00 32,843,970.47
Financial liabilities 4.12, 9.1 105,944,626.79 106,243,843.28 86,035,062.67
Provisions for pensions 4.10 6,952,004.11 8,573,473.57 8,689,968.64
Other provisions 4.11 1,694,524.00 1,586,594.52 1,490,306.35
Deferred tax liabilities 4.5 5,017,851.70 3,199,680.73 5,591,639.19
119,609,006.60 119,603,592.10 134,650,947.32
Current liabilities
Other provisions 4.11 35,895,512.80 37,718,328.73 37,064,690.69
Tax liabilities 4.5, 4.12 3,471,409.54 1,301,986.41 2,437,281.25
Contract liabilities 4.7, 4.12 32,577,950.12 – –
Financial liabilities 4.12, 9.1 15,299,216.49 5,291,219.39 18,308,325.27
Trade payables 4.12, 9.1 13,701,878.77 14,469,618.07 12,516,758.54
Other financial liabilities 4.13, 9.1 3,197,493.83 34,732,187.82 1,913,480.78
Other liabilities 4.13 21,685,358.87 44,374,703.31 41,967,283.30
125,828,820.43 137,888,043.73 114,207,819.83
372,552,097.70 372,813,857.34 366,042,153.72
1 The GFT Group has initially applied IFRS 9 and IFRS 15 at 1 January 2018. Under the modified retrospective transition method chosen, comparative information is not restated.
2 Adjusted3 Adjusted, refer to note 2.4
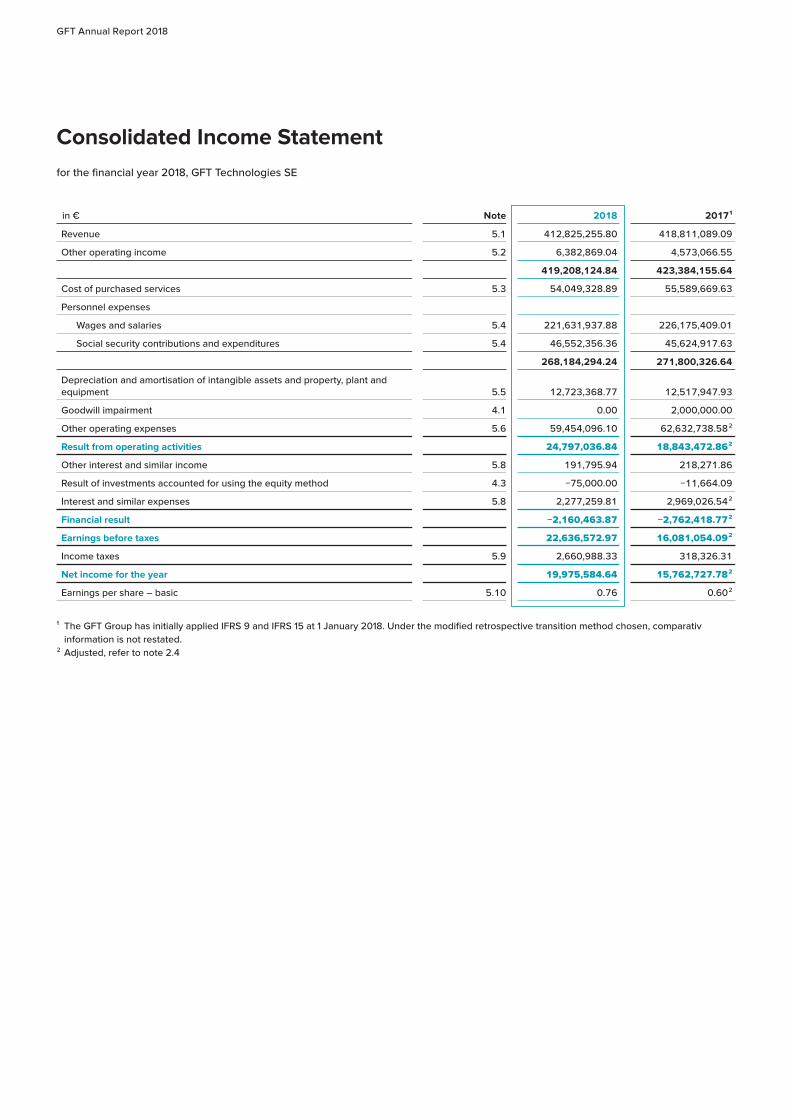
GFT Annual Report 2018
Consolidated Income Statementfor the financial year 2018, GFT Technologies SE
in € Note 2018 2017 1
Revenue 5.1 412,825,255.80 418,811,089.09
Other operating income 5.2 6,382,869.04 4,573,066.55
419,208,124.84 423,384,155.64
Cost of purchased services 5.3 54,049,328.89 55,589,669.63
Personnel expenses
Wages and salaries 5.4 221,631,937.88 226,175,409.01
Social security contributions and expenditures 5.4 46,552,356.36 45,624,917.63
268,184,294.24 271,800,326.64
Depreciation and amortisation of intangible assets and property, plant and equipment 5.5 12,723,368.77 12,517,947.93
Goodwill impairment 4.1 0.00 2,000,000.00
Other operating expenses 5.6 59,454,096.10 62,632,738.58 2
Result from operating activities 24,797,036.84 18,843,472.86 2
Other interest and similar income 5.8 191,795.94 218,271.86
Result of investments accounted for using the equity method 4.3 −75,000.00 −11,664.09
Interest and similar expenses 5.8 2,277,259.81 2,969,026.54 2
Financial result −2,160,463.87 −2,762,418.77 2
Earnings before taxes 22,636,572.97 16,081,054.09 2
Income taxes 5.9 2,660,988.33 318,326.31
Net income for the year 19,975,584.64 15,762,727.78 2
Earnings per share – basic 5.10 0.76 0.60 2
1 The GFT Group has initially applied IFRS 9 and IFRS 15 at 1 January 2018. Under the modified retrospective transition method chosen, comparativ information is not restated.
2 Adjusted, refer to note 2.4
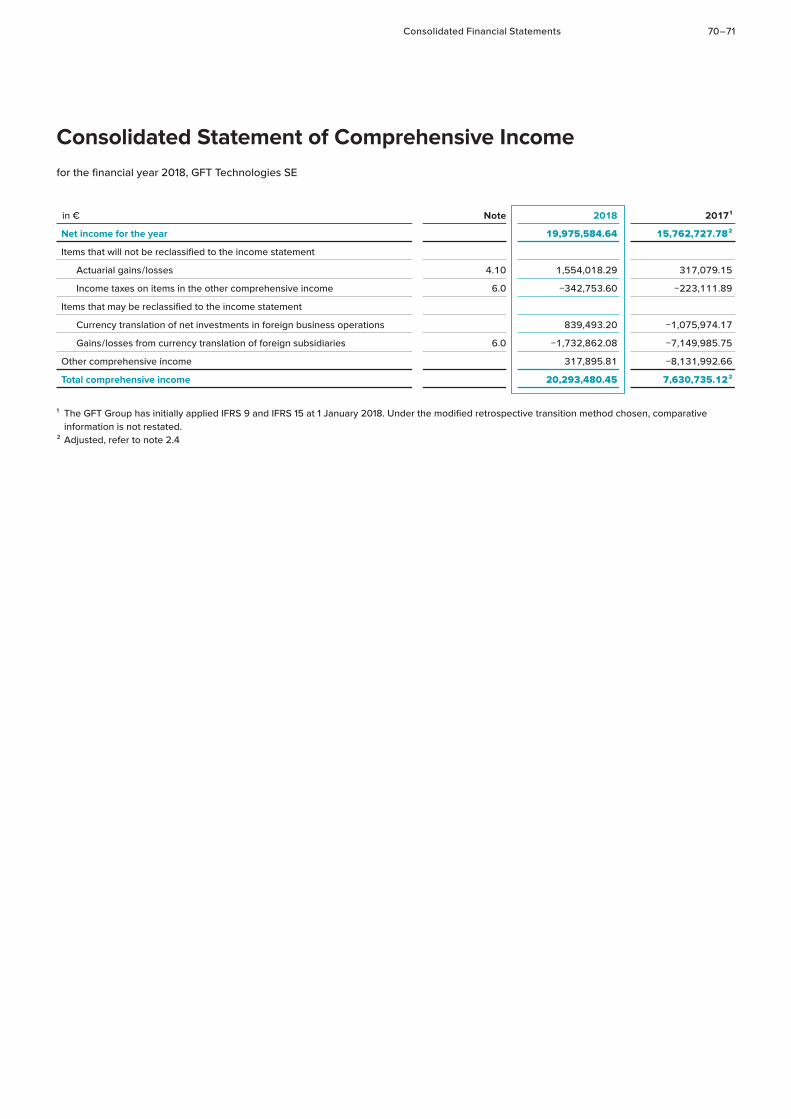
Consolidated Financial Statements 70 – 71
Consolidated Statement of Comprehensive Incomefor the financial year 2018, GFT Technologies SE
in € Note 2018 2017 1
Net income for the year 19,975,584.64 15,762,727.78 2
Items that will not be reclassified to the income statement
Actuarial gains / losses 4.10 1,554,018.29 317,079.15
Income taxes on items in the other comprehensive income 6.0 −342,753.60 −223,111.89
Items that may be reclassified to the income statement
Currency translation of net investments in foreign business operations 839,493.20 −1,075,974.17
Gains / losses from currency translation of foreign subsidiaries 6.0 −1,732,862.08 −7,149,985.75
Other comprehensive income 317,895.81 −8,131,992.66
Total comprehensive income 20,293,480.45 7,630,735.12 2
1 The GFT Group has initially applied IFRS 9 and IFRS 15 at 1 January 2018. Under the modified retrospective transition method chosen, comparative information is not restated.
2 Adjusted, refer to note 2.4
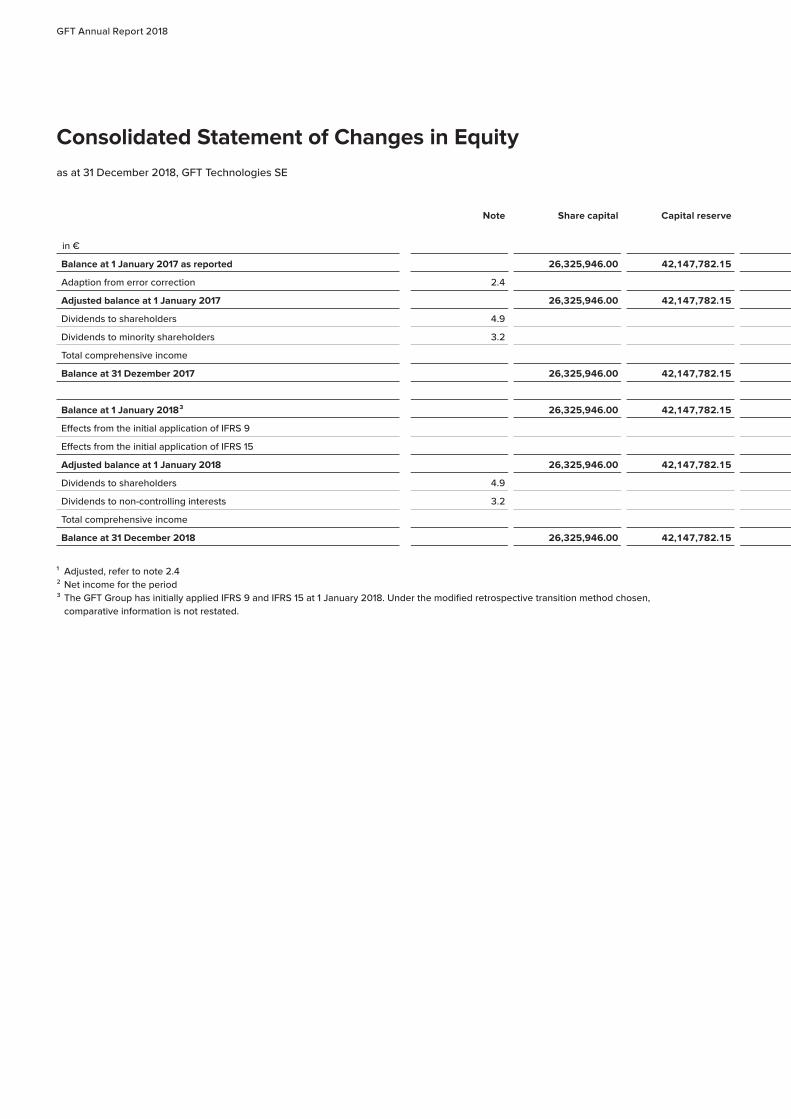
GFT Annual Report 2018
Consolidated Statement of Changes in Equityas at 31 December 2018, GFT Technologies SE
in €
Note Share capital Capital reserve Retained earnings Other comprehensive income Consolidated net profit / loss
Total equity
Other retained earnings
Changes not affecting net income
Actuarial gains / losses
Currency translation differences
Balance at 1 January 2017 as reported 26,325,946.00 42,147,782.15 22,243,349.97 −20,296,182.84 −2,764,248.94 2,215,605.09 47,311,135.14 117,183,386.57
Adaption from error correction 2.4 16,759,305.97 1 −16,759,305.97 1 0.00
Adjusted balance at 1 January 2017 26,325,946.00 42,147,782.15 22,243,349.97 −3,536,876.87 1 −2,764,248.94 2,215,605.09 30,551,829.17 1 117,183,386.57
Dividends to shareholders 4.9 −7,897,783.80 −7,897,783.80
Dividends to minority shareholders 3.2 −1,594,116.38 −1,594,116.38
Total comprehensive income 93,967.26 −8,225,959.92 15,762,727.78 1.2 7,630,735.12 1
Balance at 31 Dezember 2017 26,325,946.00 42,147,782.15 22,243,349.97 −5,130,993.25 −2,670,281.68 −6,010,354.83 38,416,773.15 115,322,221.51
Balance at 1 January 2018 3 26,325,946.00 42,147,782.15 22,243,349.97 −5,130,993.25 1 −2,670,281.68 −6,010,354.83 38,416,773.15 1 115,322,221.51
Effects from the initial application of IFRS 9 −184,049.38 −184,049.38
Effects from the initial application of IFRS 15 0.00 0.00
Adjusted balance at 1 January 2018 26,325,946.00 42,147,782.15 22,243,349.97 −5,130,993.25 −2,670,281.68 −6,010,354.83 38,232,723.77 115,138,172.13
Dividends to shareholders 4.9 −7,897,783.80 −7,897,783.80
Dividends to non-controlling interests 3.2 −419,598.11 −419,598.11
Total comprehensive income 1,211,264.69 −893,368.88 19,975,584.64 2 20,293,480.45
Balance at 31 December 2018 26,325,946.00 42,147,782.15 22,243,349.97 −5,550,591.36 −1,459,016.99 −6,903,723.71 50,310,524.61 127,114,270.67
1 Adjusted, refer to note 2.42 Net income for the period3 The GFT Group has initially applied IFRS 9 and IFRS 15 at 1 January 2018. Under the modified retrospective transition method chosen,
comparative information is not restated.
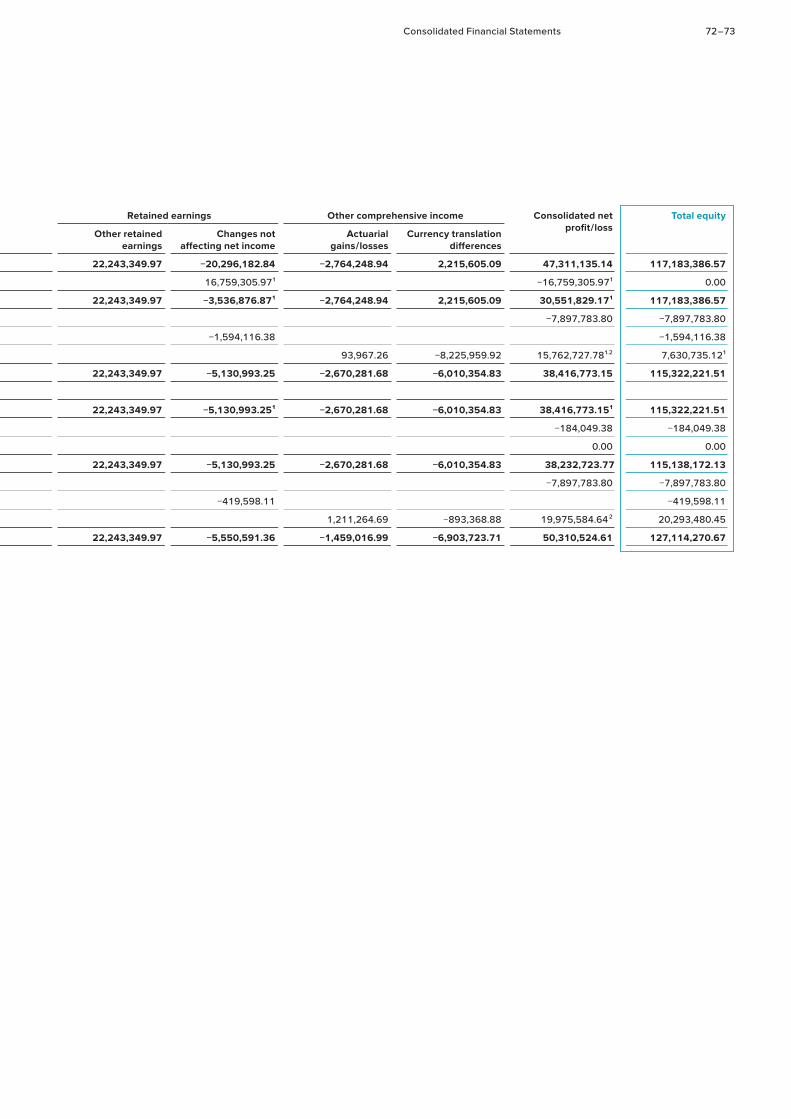
Consolidated Financial Statements 72 – 73
Consolidated Statement of Changes in Equityas at 31 December 2018, GFT Technologies SE
in €
Note Share capital Capital reserve Retained earnings Other comprehensive income Consolidated net profit / loss
Total equity
Other retained earnings
Changes not affecting net income
Actuarial gains / losses
Currency translation differences
Balance at 1 January 2017 as reported 26,325,946.00 42,147,782.15 22,243,349.97 −20,296,182.84 −2,764,248.94 2,215,605.09 47,311,135.14 117,183,386.57
Adaption from error correction 2.4 16,759,305.97 1 −16,759,305.97 1 0.00
Adjusted balance at 1 January 2017 26,325,946.00 42,147,782.15 22,243,349.97 −3,536,876.87 1 −2,764,248.94 2,215,605.09 30,551,829.17 1 117,183,386.57
Dividends to shareholders 4.9 −7,897,783.80 −7,897,783.80
Dividends to minority shareholders 3.2 −1,594,116.38 −1,594,116.38
Total comprehensive income 93,967.26 −8,225,959.92 15,762,727.78 1.2 7,630,735.12 1
Balance at 31 Dezember 2017 26,325,946.00 42,147,782.15 22,243,349.97 −5,130,993.25 −2,670,281.68 −6,010,354.83 38,416,773.15 115,322,221.51
Balance at 1 January 2018 3 26,325,946.00 42,147,782.15 22,243,349.97 −5,130,993.25 1 −2,670,281.68 −6,010,354.83 38,416,773.15 1 115,322,221.51
Effects from the initial application of IFRS 9 −184,049.38 −184,049.38
Effects from the initial application of IFRS 15 0.00 0.00
Adjusted balance at 1 January 2018 26,325,946.00 42,147,782.15 22,243,349.97 −5,130,993.25 −2,670,281.68 −6,010,354.83 38,232,723.77 115,138,172.13
Dividends to shareholders 4.9 −7,897,783.80 −7,897,783.80
Dividends to non-controlling interests 3.2 −419,598.11 −419,598.11
Total comprehensive income 1,211,264.69 −893,368.88 19,975,584.64 2 20,293,480.45
Balance at 31 December 2018 26,325,946.00 42,147,782.15 22,243,349.97 −5,550,591.36 −1,459,016.99 −6,903,723.71 50,310,524.61 127,114,270.67
1 Adjusted, refer to note 2.42 Net income for the period3 The GFT Group has initially applied IFRS 9 and IFRS 15 at 1 January 2018. Under the modified retrospective transition method chosen,
comparative information is not restated.
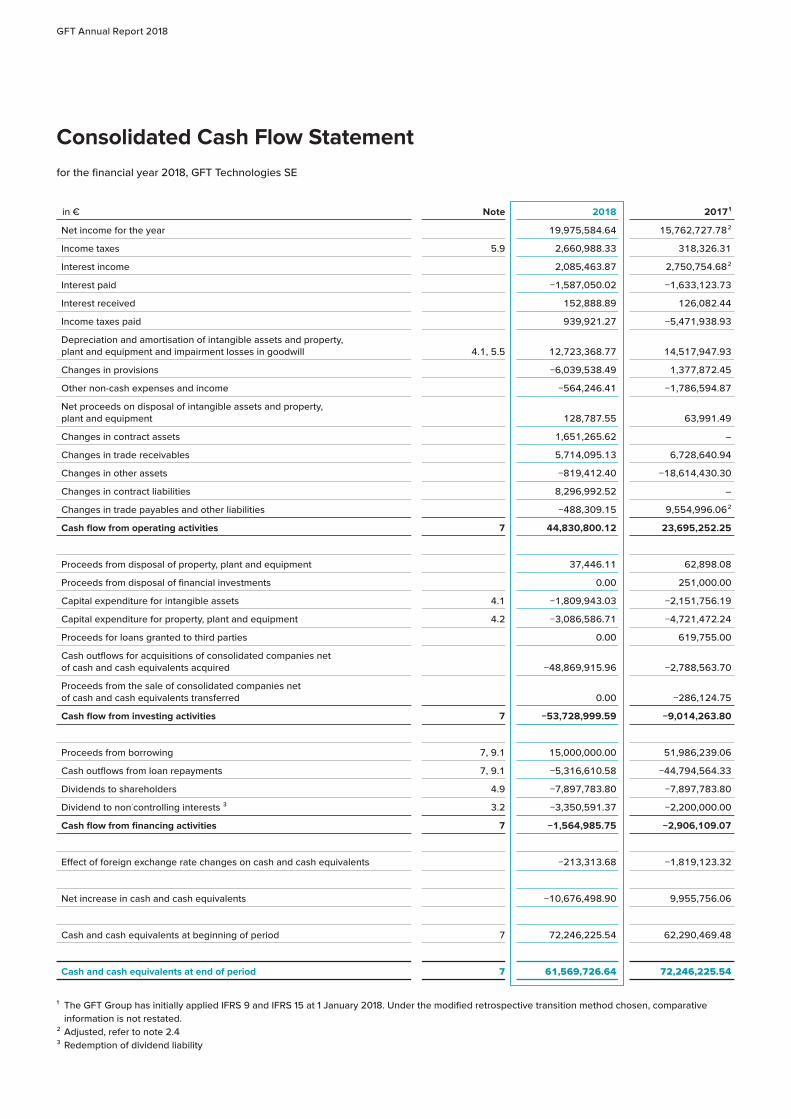
GFT Annual Report 2018
Consolidated Cash Flow Statementfor the financial year 2018, GFT Technologies SE
in € Note 2018 2017 1
Net income for the year 19,975,584.64 15,762,727.78 2
Income taxes 5.9 2,660,988.33 318,326.31
Interest income 2,085,463.87 2,750,754.68 2
Interest paid −1,587,050.02 −1,633,123.73
Interest received 152,888.89 126,082.44
Income taxes paid 939,921.27 −5,471,938.93
Depreciation and amortisation of intangible assets and property, plant and equipment and impairment losses in goodwill 4.1, 5.5 12,723,368.77 14,517,947.93
Changes in provisions −6,039,538.49 1,377,872.45
Other non-cash expenses and income −564,246.41 −1,786,594.87
Net proceeds on disposal of intangible assets and property, plant and equipment 128,787.55 63,991.49
Changes in contract assets 1,651,265.62 –
Changes in trade receivables 5,714,095.13 6,728,640.94
Changes in other assets −819,412.40 −18,614,430.30
Changes in contract liabilities 8,296,992.52 –
Changes in trade payables and other liabilities −488,309.15 9,554,996.06 2
Cash flow from operating activities 7 44,830,800.12 23,695,252.25
Proceeds from disposal of property, plant and equipment 37,446.11 62,898.08
Proceeds from disposal of financial investments 0.00 251,000.00
Capital expenditure for intangible assets 4.1 −1,809,943.03 −2,151,756.19
Capital expenditure for property, plant and equipment 4.2 −3,086,586.71 −4,721,472.24
Proceeds for loans granted to third parties 0.00 619,755.00
Cash outflows for acquisitions of consolidated companies net of cash and cash equivalents acquired −48,869,915.96 −2,788,563.70
Proceeds from the sale of consolidated companies net of cash and cash equivalents transferred 0.00 −286,124.75
Cash flow from investing activities 7 −53,728,999.59 −9,014,263.80
Proceeds from borrowing 7, 9.1 15,000,000.00 51,986,239.06
Cash outflows from loan repayments 7, 9.1 −5,316,610.58 −44,794,564.33
Dividends to shareholders 4.9 −7,897,783.80 −7,897,783.80
Dividend to non-controlling interests 3 3.2 −3,350,591.37 −2,200,000.00
Cash flow from financing activities 7 −1,564,985.75 −2,906,109.07
Effect of foreign exchange rate changes on cash and cash equivalents −213,313.68 −1,819,123.32
Net increase in cash and cash equivalents −10,676,498.90 9,955,756.06
Cash and cash equivalents at beginning of period 7 72,246,225.54 62,290,469.48
Cash and cash equivalents at end of period 7 61,569,726.64 72,246,225.54
1 The GFT Group has initially applied IFRS 9 and IFRS 15 at 1 January 2018. Under the modified retrospective transition method chosen, comparative information is not restated.
2 Adjusted, refer to note 2.43 Redemption of dividend liability
Group Notes 74 – 75
Notes to the Consolidated Financial Statementsfor the financial year 2018, GFT Technologies SE
1 General information
The consolidated financial statements of GFT Technologies SE and its subsidiaries for the financial year ending 31 December 2018 have been drawn up in accordance with the International Financial Report-ing Standards (IFRS), as they are to be applied in the European Union (EU), and the additional requirements of German commercial law pursuant to section 315e (1) of the German Commercial Code (HGB).
GFT Technologies SE is a European public limited company (Societas Europea, SE) with headquarters in Stuttgart, Germany. The company is registered in the Commercial Register of the District Court of Stuttgart under number HRB 753709 with its registered offices at Schelmenwasenstrasse 34, 70567 Stuttgart. The GFT Technolo-gies SE share is listed in the Prime Standard segment of the Frankfurt Stock Exchange and is publicly traded. GFT Technologies SE is the ultimate parent company of the GFT Group, an international tech-nology partner for digital transformation in the banking, insurance and industrial sectors. Its range of services includes consulting for the development and implementation of innovative IT strategies, the development of customer-specific solutions, the implementation of industry-specific standard software and the maintenance and further development of business-critical IT solutions. The functional currency of GFT Technologies SE is the euro.
The consolidated financial statements for the year ending 31 Decem-ber 2018 were approved and released for publication by the Admin-istrative Board on 21 March 2019.
2 Accounting methods
2.1 Basis of preparation of the financial statements
The consolidated financial statements of the GFT Group were prepared in accordance with the International Financial Reporting Standards (IFRS) as published by the International Accounting Standards Board (IASB).
The consolidated financial statements of GFT Technologies SE are prepared in euros (€). Unless stated otherwise, figures are stated in thousands of euros (€ thousand). Amounts are rounded using standard commercial methods.
With the exception of certain items, e. g. financial assets at fair value through profit or loss, derivative financial instruments or hedged items, contingent consideration from business combinations, as well as pensions and similar obligations, the consolidated financial statements have been prepared in accordance with the principle of historical cost. The valuation methods applied for the exceptions are described below.
The presentation of the consolidated balance sheet distinguishes between current and non-current assets and liabilities. Assets and liabilities are classified as current if they fall due within one year or within a longer normal business cycle. Deferred tax assets and liabilities, as well as assets and provisions for pensions and similar obligations are presented as non-current items. The consolidated income statement has been prepared using the nature of expense method.
The GFT Group has consistently applied the following accounting methods to all periods presented in these consolidated financial statements unless otherwise stated. Changes in accounting methods in these consolidated financial statements resulted from the first-time application of new accounting standards, which are described in note 2.3, and from the retrospective implementation of an error finding by Deutsche Prüfstelle für Rechnungslegung e. V. (German Financial Reporting Enforcement Panel) (see section 2.4).
The consolidated financial statements contain comparative informa-tion for the previous reporting period. In addition, the GFT Group reports an additional balance sheet at the beginning of the previous reporting period if an accounting method is applied retrospectively or items in the financial statements are adjusted or reclassified retroactively. An additional balance sheet as of 1 January 2017 was included in these consolidated financial statements due to retro-spective error correction (see note 2.4).
GFT Annual Report 2018
2.2 Discretionary decisions, estimates and assumptions
The preparation of the consolidated financial statements requires management to make judgements, estimates and assumptions to a certain extent. These may affect the amount and presentation of assets and liabilities recognised in the balance sheet, disclosures of contingent assets and liabilities as of the balance sheet date, and disclosed income and expenses for the reporting period. Due to the uncertainty associated with these assumptions and estimates, actual results in future periods could lead to significant adjustments in the carrying amounts of the assets or liabilities concerned.
Discretionary decisions, estimates and underlying assumptions are based on experience and are reviewed by management on an ongoing basis. Revisions to estimates are recognised prospectively.
Discretionary decisionsDiscretionary decisions must be taken when applying accounting methods. One significant item affected by discretionary decisions is the recognition of revenue for fixed-price contracts in connection with the development of customer-specific IT solutions over a period or at a moment in time. Information on discretionary decisions taken by the GFT Group in this regard can be found in section 2.7 of the notes to the consolidated financial statements.
Estimates and assumptions The most important future-related assumptions and other key sources of estimation uncertainty as of the balance sheet date with a significant risk of causing a material adjustment to the carrying amounts of assets and liabilities within the next financial year are described in the accounting methods applied (see note 2.7) and in the notes to the consolidated balance sheet (see note 4) and to the income statement (see note 5).
The main application areas for estimates and assumptions when applying accounting methods in the financial statements of the GFT Group are:
■ acquisition of subsidiaries: determination of the fair value of the consideration transferred (including contingent consideration) as well as the preliminary determination of the fair values of identifiable assets acquired and liabilities assumed;
■ impairment test of goodwill and other intangible assets: signifi-cant underlying assumptions used to determine the recoverable amount;
■ allowance for expected credit losses on trade receivables and contract assets: key assumptions used to determine the weighted average loss rate;
■ revenue recognition: estimate of the stage of completion of unfinished customer projects;
■ recognition of deferred tax assets: availability of future taxable income against which deductible temporary differences and tax loss carryforwards can be utilised;
■ recognition and measurement of provisions and contingent assets and liabilities: significant assumptions about the prob-ability and extent of an inflow or outflow of economic benefits.
The Group’s assumptions and estimates are based on parameters available at the time the consolidated financial statements were prepared. However, these conditions and assumptions about future developments may change as a result of market movements and conditions outside the sphere of influence of the GFT Group. Such changes are only reflected in the assumptions when they occur.
2.3 Changes in accounting methods
New and amended standards and interpretationsAs of 1 January 2018, the Group applied IFRS 15 Revenue from Con-tracts with Customers and IFRS 9 Financial Instruments for the first time. The nature and effects of the changes resulting from the initial adoption of these new accounting standards are described below.
As of 1 January 2018, certain additional IFRS pronouncements are to be applied for the first time, but have no material impact on the consolidated financial statements. The GFT Group has not prema-turely applied any standards, interpretations or amendments which have been published but not yet come into force.
IFRS 15 Revenue from Contracts with CustomersThe IASB published IFRS 15 in May 2014. It replaces existing guid-ance for revenue recognition, including IAS 18 Revenue and IAS 11 Construction Contracts. The new standard lays down a comprehen-sive framework for determining in which amount and on which date revenue is recognised. IFRS 15 specifies a uniform, five-step model for revenue recognition which is to be applied to all contracts with customers. Under IFRS 15, revenue is recognised when a customer obtains control of goods or services. The determination of whether control is transferred on a point-in-time or period basis requires discretionary decisions.
The GFT Group applied IFRS 15 for the first time in the financial year beginning on 1 January 2018. Initial application was made accord-ing to the modified retrospective method, according to which the cumulative effect is recognised directly in equity as an adjustment to the opening balance sheet value. There was no adjustment to the opening balance sheet amounts as of 1 January 2018 as there were no cumulative effects from the initial application of the IFRS 15 reg-ulations. Comparative information was not adjusted and continues to be disclosed according to IAS 18 Revenue and IAS 11 Construction Contracts.
The initial application of IFRS 15 by the GFT Group resulted in the following changes in particular.
Group Notes 76 – 77
Contract assets / contract liabilitiesIFRS 15 includes guidance on the disclosure of contract fulfilment and contract obligations. These are assets and liabilities from contracts with customers which arise dependent on the relationship between the entity’s performance and the customer’s payment. Accordingly, claims arising from contract obligations already fulfilled for which the customer’s consideration has not yet been paid are carried as a contract asset if the claim to consideration is still subject to certain conditions. However, if the claim to consideration from the customer is unconditional and only dependent on the passage of time, the item is carried as a trade receivable. A contractual liability, on the other hand, is the entity’s obligation to transfer goods or services to a customer for which the entity has received or will receive consideration from that customer. If the customer has rendered the consideration or paid part of it before the delivery or service has been provided, a liability item (contractual liability) is recognised in the balance sheet accordingly.
In application of these requirements, reclassifications were made from the balance sheet item trade receivables to contract assets and from the balance sheet item other liabilities to contract liabil-ities. In the case of the GFT Group, contract assets and contract liabilities result in particular from fixed-price contracts in connection with the development of customer-specific IT solutions and service contracts in connection with IT maintenance projects. Contract liabilities include unrealised sales and advance payments received in connection with the aforementioned contracts.
The initial application of the new IFRS 15 provisions did not result in any changes for the GFT Group with regard to the amount and timing of the recognition of revenue or other income.
The following table shows the effects on the consolidated balance sheet as of 31 December 2018 from the application of IFRS 15.
Effects on the consolidated balance sheet from the change to IFRS 15
in €
31/12/2018as reported
Adjustment 31/12/2018Without application
of IFRS 15
Contract assets 14,083,478.02 −14,083,478.02 –
Trade receivables 95,390,886.70 13,345,550.85 108,736,437.55
Current assets 193,532,078.43 −737,927.17 192,794,151.26
Contract liabilities 32,577,950.12 −32,577,950.12 –
Other liabilities 21,685,358.87 31,840,022.96 53,525,381.83
Current liabilities 125,828,820.43 −737,927.17 125,090,893.26
The initial application of IFRS 15 had no impact on items of the consolidated income statement (including earnings per share), on the consolidated statement of comprehensive income or on net cash flow from operating activities.
GFT Annual Report 2018
IFRS 9 Financial InstrumentsIn July 2014, the International Accounting Standards Board (IASB) published IFRS 9 Financial Instruments, which replaces the existing guidance contained in IAS 39. IFRS 9 includes a uniform model for classification and measurement methods (including impairments) for financial instruments. IFRS 9 also includes regulations for general hedge accounting. IFRS 9 requires additional notes disclosure resulting from the amendment to IFRS 7 Disclosure Initiative.
The GFT Group applied IFRS 9 for the first time in the financial year beginning on 1 January 2018. Initial application was made according to the modified retrospective method, which requires that the cumu-lative effect is recognised in equity as an adjustment to the opening balance sheet value. In accordance with the transitional provisions, the GFT Group has opted not to adjust comparative information and to continue to disclose according to IAS 39.
The initial application of IFRS 9 resulted in the following changes for the GFT Group.
Classification and measurement of financial assets and financial liabilitiesIFRS 9 introduces a uniform model for classifying financial assets, which classifies financial assets into three categories: financial assets measured at amortised cost, financial assets measured at fair value through other comprehensive income and financial assets measured at fair value through profit or loss. Under IAS 39, financial assets were divided into loans and receivables, available-for-sale financial assets and financial assets at fair value through profit or loss. The classification of financial assets in accordance with IFRS 9 is based on the entity’s business model for managing financial assets and the characteristics of contractual cash flows.
Trade receivables and contract assets (from the application of IFRS 15), which were classified as loans and receivables under IAS 39, are now classified at amortised cost. An increase of €184 thousand in value adjustments to trade receivables was recognised in equity as of 1 January 2018 on transition to IFRS 9.
IFRS 9 largely retains the existing requirements of IAS 39 for the classification of financial liabilities. The initial application of IFRS 9 had no material impact on the GFT Group’s accounting methods with regard to financial liabilities.
Impairment of financial assetsIFRS 9 introduces an impairment model based on expected credit losses which is to be applied to all financial assets (debt instruments) measured either at amortised cost or at fair value through other comprehensive income. Under IAS 39, these instruments were tested for objective evidence of impairment. Objective evidence may include significant financial difficulties of the debtor, as well as significant changes in the technological, economic, legal and market environment of the debtor. Losses incurred were recognised as an impairment of financial assets. Under IFRS 9, the new approach also takes future expectations into consideration. The expected cred-it-loss approach uses three stages for allocating impairment losses:
Stage 1: expected credit losses within the next twelve months
Stage 1 includes all contracts with no significant increase in credit risk since initial recognition and regularly includes new contracts and those whose payments are less than 31 days overdue. The portion of the expected credit losses over the lifetime of the instrument resulting from a default within the next 12 months is recognised as an expense.
Stage 2: expected credit losses over the entire lifetime – not cred-it-impaired
If, after initial recognition, a financial asset experiences a significant increase in credit risk but is not yet credit-impaired, it is allocated to stage 2. The expected credit losses, which are measured over possible payment defaults over the entire term of the financial asset, are recorded as value adjustments.
Stage 3: expected credit losses over the entire lifetime – credit-im-paired
If a financial asset is credit-impaired or in default, it is allocated to stage 3. The expected credit losses over the entire lifetime of the financial asset are recognised as a value adjustment. Objective indications of a credit-impaired financial asset include an external credit rating of C or higher for large customers and 181 days past due date for other customers, as well as other information about significant financial difficulties of the borrower.
The determination of whether a financial asset has experienced a significant increase in credit risk is based on an assessment of the probability of default, which is made at least half-yearly, incorporat-ing external credit rating information as well as internal information on the credit quality of the financial asset. In the case of trade receivables, a significant increase in credit risk is determined for major customers on the basis of external credit ratings and for other customers on the basis of overdue information.
Group Notes 78 – 79
A financial asset is transferred to stage 2, if the credit risk has increased significantly compared to its credit risk at initial recog-nition. The credit risk is assessed on the basis of the probability of default. For contract assets and trade receivables, the simplified approach is applied under which expected credit losses are recog-nised over the entire term of the asset when it is initially recognised.
Measurement of expected credit lossesExpected credit losses are measured on the basis of the following factors:
1. the unbiased and probability-weighted amount;2. the time value of money;3. and reasonable and supportable information as of the
reporting date about past events, current conditions and forecasts of future economic conditions, insofar as this is available without undue cost or time effort.
The estimation of these risk parameters incorporates all available relevant information. In addition to historical and current loss data, reasonable and supportable forward-looking information about factors is also included. The time value of money is neglected in the case of current assets without any significant underlying financing component.
The measurement of expected credit losses is of particular signifi-cance for the GFT Group with regard to contract assets and trade receivables. The concept of lifelong default is applied, which takes into account all possible default events during the expected lifetime of the financial instruments. The GFT Group has decided to apply the concept of lifelong default for contract assets and trade receivables with a significant financing component.
When measuring expected credit losses, the GFT Group distin-guishes between contract assets and trade receivables due from major clients and other clients. Major clients are determined on the basis of their share of total consolidated revenue. The measurement of expected losses relating to financial assets from business trans-actions with major clients is based on a probability-weighted default rate. The default rate uses an average external credit rating. In order to calculate impairment, the probability-weighted default rate as a percentage is multiplied with the nominal value of the financial assets. In the case of contract assets and trade receivables due from other clients, the expected loss over the lifetime is determined as a lump-sum percentage based on the overdue period. The default rate based on the overdue period is calculated using historical data and adjusted on the closing date according to current information and expectations. A financial instrument is derecognised when there is no reasonable expectation of full or partial recovery, e. g. before or after insolvency proceedings or court decisions.
For assets within the scope of the impairment model of IFRS 9, the impairments will increase and become more volatile. The GFT Group has determined that the additional impairment losses arising from the application of the impairment provisions of IFRS 9 as of 1 Janu-ary 2018 amounted to €184 thousand.
Accounting for hedging transactionsApplication of the new regulations relating to derivative financial instruments and hedge accounting had no significant impact on the GFT Group.
The following table shows the effects of the transition to IFRS 9 on the opening balance sheet values of equity.
Effects on consolidated equity from initial application of IFRS 9
in € thsd.
Consolidated balance sheet profit
Balance as of 31 December 2017 in accordance with IAS 39 38,417
Change in default risk on financial instruments −204
Deferred taxes on first-time application effects 20
Balance as of 1 January 2018 in accordance with IFRS 9 38,233
The change in default risk for financial instruments comprises the recognition of expected credit losses in accordance with IFRS 9 for trade receivables.
The effects from initial application of IFRS 9 on components of consolidated equity as of 1 January 2018 are also presented in full in the consolidated statement of changes in equity (see annex 1.4).
The following table and the accompanying disclosures explain the original measurement category according to IAS 39 and the new IFRS 9 measurement category as of 1 January 2018 for each class of financial asset and financial liability formed by the GFT Group.
GFT Annual Report 2018
Measurement categories of financial instruments
in € thsd.
Measurement category according
to IAS 39
Measurement category according
to IFRS 9
Original carrying amount according
to IAS 39
New carrying amount according
to IFRS 9
Financial assets
Trade receivables Loans and receivables Amortised cost 113,481 113,277
Cash and cash equivalents Loans and receivables Amortised cost 72,246 72,246
Other financial assets Loans and receivables Amortised cost 2,834 2,834
188,561 188,357
Financial liabilities
Financial liabilities Amortised cost Amortised cost 111,535 111,535
Trade payables Amortised cost Amortised cost 14,470 14,470
Other financial liabilities Amortised cost Amortised cost 34,732 34,732
160,737 160,737
The effects from initial application of IFRS 9 relate exclusively to the carrying amounts of trade receivables and result from the new regulations on the recognition of impairment losses.
The following table shows the reconciliation of the carrying amounts of financial assets and liabilities according to IAS 39 as of 31 December 2017 to the carrying amounts according to IFRS 9 as of 1 January 2018.
Reconciliation of carrying amounts from IAS 39 to IFRS 9
in € thsd.
IAS 39 carrying
amount as of 31 Decem-
ber 2017
Restatement effect
IFRS 9 carrying
amount as of 1 Janu-ary 2018
Amortised cost
Trade receivables 113,481 −204 113,277
Cash and cash equivalents 72,246 – 72,246
Other financial assets 2,834 – 2,834
188,561 −204 188,357
The initial application of IFRS 9 had no material impact on the con-solidated cash flow statement for the financial year 2018.
2.4 Error correction
In 2013, GFT Technologies SE acquired 80% of shares in GFT Italia S.r.l. (formerly Sempla S.r.l.). At the same time, put / call options were agreed for the remaining 20% of shares. In the balance sheet, the acquisition of all shares was assumed and the so-called anticipated acquisition method was applied. Non-controlling interests were not reported in the balance sheet or in relation to the consolidated result. As of 2013, the increase in the value of the variable purchase price liability was offset against changes within retained earnings of Group equity without affecting income. The purchase price liability to be settled upon exercising the options depends on the future earnings situation of the acquired company. Consideration not only includes the purchase price for the 20% stake, but also the change in value of the 80% stake already acquired.
In the course of a spot check performed by the German Financial Reporting Enforcement Panel (Deutsche Prüfstelle für Rechnungsle-gung e. V. – DPR) pursuant to section 342b (2) sentence 3 number 3 HGB, DPR criticised the fact that the increase in value of a variable purchase price liability was recognised in equity rather than through profit or loss in the 2016 financial year. As a result, the net income reported for 2016 was €15,665 thousand higher than it should have been. GFT Technologies SE concurs with the legal opinion of DPR and has retroactively changed its accounting practice in these consolidated financial statements as of 31 December 2018. The total effect of the retroactive correction based on the consolidated balance sheet profit as of 31 December 2017 amounts to €18,805 thousand, and as of 1 January 2017 amounted to €16,759 thousand. The error was corrected by adjusting the relevant items in the consolidated financial statements for previous years accordingly. The adjusted amounts are marked accordingly.
The change in value of the variable purchase price liability was recognised in other operating expenses; compounding effects in the item interest and similar expenses.
Group Notes 80 – 81
The following tables summarise the effects of the error correction on the consolidated financial statements.
Consolidated balance sheet as of 1 January 2017
in €
01/01/2017As previously
reported
Correction 01/01/2017Adjusted
Retained earnings
Changes not affecting net income −20,296,182.84 16,759,305.97 −3,536,876.87
Consolidated net profit 47,311,135.14 −16,759,305.97 30,551,829.17
Consolidated balance sheet as of 31 December 2017
in €
31/12/2017As previously
reported
Correction 31/12/2017Adjusted
Retained earnings
Changes not affecting net income −23,936,399.37 18,805,406.13 −5,130,993.24
Consolidated net profit 57,222,179.27 −18,805,406.13 38,416,773.14
Consolidated income statement for the financial year 2017
in €
2017As previously
reported
Correction 2017Adjusted
Other operating expenses 61,672,860.58 959,878.00 62,632,738.58
Result from operating activities 19,803,350.86 −959,878.00 18,843,472.86
Interest and similar expenses 1,882,804.39 1,086,222.15 2,969,026.54
Financial result −1,676,196.62 −1,086,222.15 −2,762,418.77
Earnings before taxes 18,127,154.24 −2,046,100.15 16,081,054.09
Net income 17,808,827.93 −2,046,100.15 15,762,727.78
Earnings per share – basic 0.68 −0.08 0.60
With effect from 10 July 2018, the GFT Group acquired the remain-ing 20% of shares in GFT Italia S.r.l.. In the financial year 2018, the measurement of the purchase price liability resulted in compounding effects of €556 thousand which, contrary to the previous accounting practice, were not offset against equity but were recognised in the income statement within the item interest and similar expenses and as such had a negative impact on net income.
2.5 Consolidation principles
SubsidiariesThe consolidated financial statements comprise the financial statements of GFT Technologies SE and the financial statements of all subsidiaries over which GFT Technologies SE can exercise direct or indirect control. Control exists when the parent company has decision-making power over the subsidiary based on voting rights or other rights, participates in variable positive and negative returns of the subsidiary and can influence these returns through its decision-making power.
GFT Annual Report 2018
The consolidation of a subsidiary begins on the day on which the GFT Group gains control of the subsidiary. It ends when the Group loses control of the subsidiary. Assets, liabilities, income and expenses of a subsidiary acquired or disposed of during the report-ing period are recognised in the consolidated financial statements from the date on which the Group gains control of the subsidiary until the date on which control ceases.
Business combinations are accounted for using the purchase method. Non-controlling interests are initially measured at their proportionate share of the net identifiable assets of the acquired company as of the acquisition date.
Changes in shares in subsidiaries that decrease or increase the shareholding of the GFT Group without a change in control are shown as transactions between equity providers with no effect on income.
If the GFT Group loses control over a subsidiary, it derecognises the assets and liabilities of the subsidiary and all related non-controlling interests and other equity components. Any resulting gain or loss is recognised in the income statement. Any retained interest in the former subsidiary is measured at fair value as of the date on which control is lost.
The financial statements of the consolidated subsidiaries included in the consolidated financial statements are prepared as of the balance sheet date of the consolidated financial statements. The financial statements of GFT Technologies SE and its subsidiaries included in the consolidated financial statements are prepared in accordance with uniform recognition and measurement principles. All intragroup assets and liabilities, equity, income and expenses and cash flows from transactions between the companies included in the consolidated financial statements are eliminated in full on consolidation.
Shares in associated companiesShares in associated companies are accounted for using the equity method. Associated companies are companies in which the GFT Group has a significant influence but not control or joint control over the financial and operating policies. As a rule, significant influence is exerted when the company holds direct or indirect voting rights of between 20% and 50%.
Investments in financial assets accounted for using the equity method are initially recognised at cost, which includes transaction costs. After initial recognition, the consolidated financial statements include the Group’s share of the comprehensive income of financial assets accounted for using the equity method until the date on which significant influence or joint control ceases.
The financial statements of associated companies are prepared as of the same reporting date as the consolidated financial statements. Where necessary, adjustments are made to uniform Group account-ing methods.
2.6 Foreign currency translation
Foreign currency transactions and balancesForeign currency transactions are translated by Group companies into the functional currency at the spot rate prevailing at the time when the transaction is first recognised, if different from the local currency in the country of domicile. Monetary assets and liabilities in a foreign currency are translated into the functional currency on each balance sheet date using the spot rate on the balance sheet date.
Differences arising from the settlement or translation of monetary items are recognised in other operating income or other operating expenses. This excludes monetary items that are designated as the Group’s net investment in a foreign operation. These are recog-nised in other comprehensive income until the disposal of the net investment; the cumulative amount is not reclassified to the income statement until their disposal.
Non-monetary items measured at historical cost in a foreign currency are translated at the rate prevailing on the date of the transaction, while those measured at fair value in a foreign currency are translated at the rate prevailing on the date the fair value is determined. The accounting treatment of the gain or loss on the translation of non-monetary items measured at fair value is based on the recognition of the gain or loss on the change in the fair value of the item. Translation differences from items in which the gain or loss on measurement at fair value is recognised in other comprehensive income or in profit or loss are also recognised in other comprehen-sive income or in profit or loss.
For the purpose of determining the exchange rate to be used on initial recognition of the related asset, liability or income (or part thereof) when derecognising a non-monetary asset or liability from prepaid consideration, the date of the transaction shall be the date of initial recognition of the non-monetary asset or liability from the prepayment. If there are multiple incoming or outgoing prepayments, the Group will determine the transaction date for each consideration paid in advance.
Group companiesThe assets and liabilities of foreign operations are translated into euros at the closing rate on the balance sheet date as part of con-solidation. Income and expenses are translated at the exchange rate prevailing on the date of the transaction. The translation differences resulting from consolidation are recognised in other comprehensive income and reported in the currency translation adjustment in equity. The amount recognised in other comprehensive income for a foreign operation is reclassified to the income statement on disposal of that foreign operation.
Any goodwill arising on the acquisition of a foreign operation and any fair value adjustments to the carrying amounts of assets and lia-bilities arising on the acquisition of that foreign operation are treated as assets and liabilities of the foreign operation and translated at the spot rate on the reporting date.
Group Notes 82 – 83
On disposal of a foreign operation resulting in a loss of control or significant influence, the corresponding cumulative amount previ-ously recognised in the foreign currency translation reserve (foreign currency translation adjustment) is reclassified to profit or loss as part of the gain or loss on disposal.
2.7 Significant accounting and valuation methods
Business combinations and goodwill Business combinations are accounted for using the acquisition method. The cost of an acquisition is measured as the aggregate of the consideration transferred, which is measured at acquisition date fair value, and the amount of any non-controlling interests in the acquiree. For each business combination, the Group elects whether to measure the non-controlling interests in the acquiree at fair value or at the proportionate share of the acquiree’s identifiable net assets. Acquisition-related costs are expensed as incurred and included in administrative expenses.
When the Group acquires a business, it assesses the financial assets and liabilities assumed for appropriate classification and designation in accordance with the contractual terms, economic circumstances and pertinent conditions as of the acquisition date. This includes the separation of embedded derivatives in host contracts by the acquiree.
Any contingent consideration to be transferred by the acquirer will be recognised at fair value at the acquisition date. Contingent con-sideration classified as equity is not remeasured and its subsequent settlement is accounted for within equity. Contingent consideration classified as an asset or liability that is a financial instrument and within the scope of IFRS 9 Financial Instruments, is measured at fair value with the changes in fair value recognised in the statement of profit or loss in accordance with IFRS 9. Other contingent con-sideration that is not within the scope of IFRS 9 is measured at fair value at each reporting date with changes in fair value recognised in profit or loss.
Goodwill is initially measured at cost (being the excess of the aggre-gate of the consideration transferred and the amount recognised for non-controlling interests) and any previous interest held over the net identifiable assets acquired and liabilities assumed (purchase price allocation). If the fair value of the net assets acquired is in excess of the aggregate consideration transferred, the Group re-assesses whether it has correctly identified all of the assets acquired and all of the liabilities assumed and reviews the procedures used to measure the amounts to be recognised at the acquisition date. If the reassessment still results in an excess of the fair value of net assets acquired over the aggregate consideration transferred, then the gain is recognised in profit or loss. Goodwill at subsidiaries is carried in their functional currency.
After initial recognition, goodwill is measured at cost less any accu-mulated impairment losses. Goodwill is not subject to scheduled amortisation, but is tested for impairment annually. A review is also performed when events or circumstances arise that indicate that the carrying amount may not be recoverable. Goodwill is tested for impairment at the level of a cash-generating unit, which is generally represented by a segment. The cash-generating unit is the lowest level at which goodwill is monitored for internal management purposes.
For the purpose of impairment testing, goodwill acquired in a busi-ness combination is allocated to the cash-generating unit that is expected to benefit from the synergies of the business combination. If the carrying amount of the cash-generating unit to which the good-will was allocated exceeds its recoverable amount, an impairment loss is recognised for the goodwill allocated to this cash-generating unit. The recoverable amount is the higher of the fair value less costs to sell and the value in use of the cash-generating unit. If one of these values exceeds the book value, it is not always necessary to determine both values. These values are generally based on discounted cash flows (discounted cash flow valuations). There are no reversals of impairment losses on amortised goodwill.
The determination of the recoverable amount of a cash-generating unit to which goodwill has been allocated involves estimates by management. The earnings forecast on the basis of these estimates is influenced, for example, by the successful integration of acquired companies, volatility on the capital markets, interest rate develop-ments, fluctuations in exchange rates or expected economic devel-opments. The discounted cash flow valuations used to determine the recoverable amount are subject to five-year projections based on financial forecasts. The cash flow forecasts take past experience into account and are based on management’s best estimate of future developments. Cash flows beyond the planning period are extrapolated using individual growth rates. The key assumptions on which the calculation of fair value less costs to sell and value in use is based include estimated growth rates and weighted average cost of capital. These estimates and the underlying methodology can have a significant impact on the respective values and ultimately on the amount of a possible impairment of goodwill.
Where goodwill has been allocated to a cash-generating unit (CGU) and part of the operation within that unit is disposed of, the goodwill associated with the disposed operation is included in the carrying amount of the operation when determining the gain or loss on dis-posal. Goodwill disposed in these circumstances is measured based on the relative values of the disposed operation and the portion of the cash-generating unit retained.
GFT Annual Report 2018
Other intangible assetsIntangible assets are measured at cost less accumulated amortisa-tion. If necessary, accumulated impairment losses are recognised.
Intangible assets with a finite useful life are amortised on a straight-line basis over their expected useful lives. The expected useful life for licenses and similar rights is generally 3 to 5 years, except for intangible assets with finite useful lives acquired in business combinations. These consist in particular of customer relationships with useful lives of between four-and-a-half and ten years for certain transactions.
The GFT Group tests other intangible assets for impairment if events or changed circumstances indicate that the carrying amount of an asset may not be recoverable. In addition, the GFT Group tests intan-gible assets not yet ready for use for impairment each year. When testing other intangible assets for impairment, the determination of the recoverable amount of the assets involves estimates. This can have a significant impact on the respective values and ultimately on the amount of a possible impairment.
Research and non-capitalised development costsResearch and development expenses that do not have to be capi-talised under IAS 38 Intangible Assets are recognised in the income statement at the time they are incurred.
Borrowing costsBorrowing costs are expensed as incurred unless they are directly attributable to the acquisition or production of a qualifying asset and are therefore included in the cost of that asset.
Property, plant and equipment Property, plant and equipment are carried at cost less accumulated depreciation and impairment losses.
The GFT Group applies the straight-line method of depreciation. Scheduled depreciation of property, plant and equipment is based on assumed useful lives of between 3 and 33 years. Maintenance and repair costs for property, plant and equipment are recognised immediately in profit or loss.
Property, plant and equipment are derecognised either on disposal (i. e. at the time when the recipient obtains control) or when no further economic benefit is expected from the continued use or disposal of the recognised asset. The gains or losses resulting from the derecognition of the asset are determined as the difference between the net disposal proceeds and the carrying amount of the asset and recognised in profit or loss in the period in which the asset is derecognised.
The GFT Group reviews property, plant and equipment for impair-ment whenever events or changes in circumstances indicate that the carrying amount of an asset may not be recoverable. When testing property, plant and equipment for impairment, the determination of the recoverable amount of the assets is associated with estimates. This can have a significant impact on the respective values and ultimately on the amount of a possible impairment.
LeasingLeasing includes all agreements that transfer the right to use a spe-cific asset for a specified period in return for a payment, even if the right to use such asset is not explicitly described in the arrangement. The GFT Group is a lessee of property, plant and equipment and a lessor – to an insignificant extent – of real estate or business premises. The risks and rewards incidental to ownership of a leased asset are assessed to determine whether the lessee (finance lease) or the lessor (operating lease) is the beneficial owner of the leased asset.
GFT Group as lesseeIn the case of an operating lease, the lease instalments or rental pay-ments are expensed in the income statement on a straight-line basis. Assets carried as finance leases are measured at the beginning of the lease at the lower of the present value of the minimum lease payments and the fair value of the leased asset, and in subsequent periods less accumulated depreciation and other accumulated impairment losses. Depreciation is calculated using the straight-line method; residual values of the assets are given due consideration. Payment obligations resulting from future lease instalments are discounted and disclosed under financial liabilities.
Shares in associated companiesThe Group’s shares in associated companies are accounted for using the equity method. Under the equity method, investments in associates are initially recognised at cost. The carrying amount of the investment is adjusted to reflect changes in the Group’s share of the associate’s net assets since the acquisition date. Goodwill relating to the associate is included in the carrying amount of the investment and is not amortised or tested for impairment.
The income statement reflects the Group’s share of the associate’s profit or loss for the period. Changes in other comprehensive income of associated companies are presented as part of the Group’s other comprehensive income. In addition, changes recognised directly in the equity of the associate are recognised by the Group to the extent of its interest and, where necessary, presented in the statement of changes in equity. Unrealised gains and losses from transactions between the Group and the associate are eliminated in proportion to the interest in the associate.
Group Notes 84 – 85
The Group’s total share of the profit or loss of an associate is shown on the face of the income statement operating profit and represents profit or loss before tax and after non-controlling interests in the subsidiaries of the associate.
After applying the equity method, the Group determines whether it is necessary to recognise an impairment loss for its investment in an associate. It determines at each balance sheet date whether there is objective evidence that the investment in an associate may be impaired. If such evidence exists, the amount of the impairment loss is determined as the difference between the recoverable amount of the investment in the associate and the carrying amount, and the loss is then recognised in profit or loss as ‘Result from financial assets accounted for using the equity method’.
If the Group loses significant influence over an associate, it measures all its investments in the former associate at fair value. Any difference between the carrying amount of the investment in the associate at the date of loss of significant influence and the fair value of the investment retained and the proceeds from the disposal is recog-nised in the income statement.
Financial instrumentsA financial instrument is any contract that gives rise to both a finan-cial asset of one entity and a financial liability or equity instrument of another entity. Financial instruments recognised as financial assets or financial liabilities are generally reported separately. Financial instruments are recognised as soon as the GFT Group becomes a contracting party to the financial instrument. A normal market purchase or sale of financial assets is recognised on the trading date. With the exception of contract assets and trade receivables, financial instruments are initially recognised at fair value. Contract assets and trade receivables are initially measured at the transaction price. For subsequent measurement, financial instruments are allocated to one of the measurement categories listed in IFRS 9 Financial Instruments (financial assets at amortised cost, financial assets at fair value through other comprehensive income and financial assets at fair value through profit or loss). Transaction costs directly attributable to the acquisition or issue are taken into account in determining the carrying amount if the financial instruments are not measured at fair value through profit or loss.
Financial assetsFinancial assets primarily comprise contract assets, trade receiv-ables, cash and cash equivalents, derivative financial assets and financial investments. The classification of financial instruments is based on the business model in which the instruments are held and the composition of their contractual cash flows.
The determination of the business model is based on management’s intention and past transaction patterns. Cash flows are reviewed on the basis of the individual instruments.
Financial assets at fair value through profit or lossFinancial assets at fair value through profit or loss comprise financial assets whose cash flows do not consist exclusively of interest and principal payments on the nominal amount outstanding. It also includes financial assets that were neither allocated to the ‘hold to collect’ business model nor to the ‘hold to collect and sell’ business model.
Financial assets at amortised costFinancial assets at amortised cost are non-derivative financial assets with contractual cash flows that consist exclusively of interest and principal payments on the outstanding nominal amount and are held with the objective of receiving the contractually agreed cash flows, such as contract assets, trade receivables or cash and cash equivalents.
Contract assets are claims from performance obligations already fulfilled for which the customer’s consideration has not yet been received and the company’s claim to consideration is still linked to a condition other than maturity. In the GFT Group, contract assets result in particular from fixed-price contracts in connection with the creation of customer-specific IT solutions and from service contracts in connection with IT maintenance projects.
Cash and cash equivalents comprise in particular cash in hand and bank balances. Cash and cash equivalents correspond to the cash fund in the consolidated cash flow statement.
After initial recognition, these financial assets are measured at amortised cost using the effective interest method less impairment. Gains and losses are recognised in net income when the loans and receivables are impaired or derecognised. Interest effects from the application of the effective interest method and effects from currency translation are also recognised in profit or loss.
Financial assets at fair value through other comprehensive incomeFinancial assets at fair value through other comprehensive income are non-derivative financial assets with contractual cash flows that consist solely of interest and principal payments on the nominal amount outstanding and which are held both to collect the con-tractually agreed cash flows and to sell, for example to achieve a defined liquidity target (‘hold to collect and sell’ business model). This category also includes equity instruments not held for trading for which the option to recognise changes in fair value within other comprehensive income has been applied.
GFT Annual Report 2018
After initial measurement, financial assets in this category are measured at fair value through other comprehensive income, with unrealised gains or losses being recognised in other comprehensive income. Upon disposal of debt instruments in this category, the cumulative gains and losses from fair value measurement recog-nised in other comprehensive income are recognised in profit or loss. Interest received on financial assets at fair value through other comprehensive income is generally recognised as interest income using the effective interest method. Changes in the fair value of equity instruments measured at fair value through other compre-hensive income are not recognised in profit or loss but reclassified to retained earnings upon disposal. Dividends are recognised in the income statement when the right to payment has been established.
The GFT Group derecognises a financial asset when the contractual rights to the cash flows from the financial asset expire or when it transfers the rights to receive the cash flows in a transaction in which all material risks and rewards incidental to ownership of the financial asset are transferred. Derecognition also takes place if the GFT Group neither transfers nor retains all material risks and rewards of ownership and does not retain control over the transferred asset.
Impairment of financial assetsAt each balance sheet date, an impairment loss is recognised for financial assets that are not measured at fair value through profit or loss, which reflects the expected credit losses on these instruments. The same method is also used to determine the allowance for irrev-ocable loan commitments and financial guarantees. The expected credit-loss approach uses three stages for allocating impairment losses:
Stage 1: expected credit losses within the next twelve months
Stage 1 includes all contracts with no significant increase in credit risk since initial recognition and regularly includes new contracts and those whose payments are less than 31 days overdue. The portion of the expected credit losses over the lifetime of the instrument resulting from a default within the next 12 months is recognised as an expense.
Stage 2: expected credit losses over the entire lifetime – not cred-it-impaired
If, after initial recognition, a financial asset experiences a significant increase in credit risk but is not yet credit-impaired, it is allocated to stage 2. The expected credit losses, which are measured over possible payment defaults over the entire term of the financial asset, are recorded as value adjustments.
Stage 3: expected credit losses over the entire lifetime – credit-im-paired
If a financial asset is credit-impaired or in default, it is allocated to stage 3. The expected credit losses over the entire lifetime of the financial asset are recognised as a value adjustment. Objective indications of a credit-impaired financial asset include an external credit rating of C or higher for large customers and 181 days past due date for other customers, as well as other information about significant financial difficulties of the borrower.
The determination of whether a financial asset has experienced a significant increase in credit risk is based on an assessment of the probability of default, which is made at least half-yearly, incorporat-ing external credit rating information as well as internal information on the credit quality of the financial asset. In the case of trade receivables, a significant increase in credit risk is determined for major customers on the basis of external credit ratings and for other customers on the basis of overdue information.
A financial asset is transferred to stage 2, if the credit risk has increased significantly compared to its credit risk at initial recog-nition. The credit risk is assessed on the basis of the probability of default. For contract assets and trade receivables, the simplified approach is applied under which expected credit losses are recog-nised over the entire term of the asset when it is initially recognised.
Expected credit losses are measured on the basis of the following factors:
1. the unbiased and probability-weighted amount;2. the time value of money;3. and reasonable and supportable information as of the reporting
date about past events, current conditions and forecasts of future economic conditions, insofar as this is available without undue cost or time effort.
The estimation of these risk parameters incorporates all available relevant information. In addition to historical and current loss data, reasonable and supportable forward-looking information about factors is also included. The time value of money is neglected in the case of current assets without any significant underlying financing component.
The measurement of expected credit losses is of particular signifi-cance for the GFT Group with regard to contract assets and trade receivables. The concept of lifelong default is applied, which takes into account all possible default events during the expected lifetime of the financial instruments. The GFT Group has decided to apply the concept of lifelong default for contract assets and trade receivables with a significant financing component.
Group Notes 86 – 87
When measuring expected credit losses, the GFT Group distin-guishes between contract assets and trade receivables due from major clients and other clients. Major clients are determined on the basis of their share of total consolidated revenue. The measurement of expected losses relating to financial assets from business trans-actions with major clients is based on a probability-weighted default rate. The default rate uses an average external credit rating. In order to calculate impairment, the probability-weighted default rate as a percentage is multiplied with the nominal value of the financial assets. In the case of contract assets and trade receivables due from other clients, the expected loss over the lifetime is determined as a lump-sum percentage based on the overdue period. The default rate based on the overdue period is calculated using historical data and adjusted on the closing date according to current information and expectations. For contractual assets and trade receivables from major customers, this is done using external credit ratings.
A financial instrument is derecognised when there is no reasonable expectation of full or partial recovery, e. g. before or after insolvency proceedings or court decisions and legal recovery measures are judged to be unsuccessful.
Offsetting of financial instrumentsFinancial assets and financial liabilities are offset and the net amount reported in the consolidated balance sheet if there is currently an enforceable legal right to offset the recognised amounts against each other and the intention is either to settle on a net basis or to settle the related liability simultaneously with the realisation of the asset in question.
Financial liabilitiesFinancial liabilities include in particular liabilities to banks, contingent purchase price liabilities from company acquisitions, trade payables, derivative financial liabilities and other liabilities.
Financial liabilities measured at amortised costAfter initial recognition, financial liabilities are measured at amortised cost using the effective interest method.
Financial liabilities at fair value through profit or lossFinancial liabilities at fair value through profit or loss include financial liabilities held for trading. Gains or losses on financial liabilities held for trading are included in consolidated net income.
The GFT Group derecognises a financial liability when the con-tractual obligations have been fulfilled, cancelled or expired. The GFT Group also derecognises a financial liability if its contractual terms are changed and the cash flows of the adjusted liability are significantly different. In this case, a new financial liability is rec-ognised at fair value based on the revised terms. When a financial liability is derecognised, the difference between the carrying amount of the liability extinguished and the consideration paid (including non-cash assets transferred or liabilities assumed) is recognised in profit or loss.
Derivative financial instruments and hedge accounting The GFT Group uses derivative financial instruments exclusively to hedge financial risks resulting from its operating business or refinancing activities. These are primarily interest rate and currency risks.
Derivative financial instruments are measured at fair value upon initial recognition and at each subsequent reporting date. The fair value corresponds to their positive or negative market value. If a market value is not available, fair value is calculated using standard financial valuation models, such as discounted cash flow models or option pricing models.
If the requirements of IFRS 9 for hedge accounting are met, the GFT Group designates and documents the hedging relationship as a fair value hedge or cash flow hedge as of this date. In a fair value hedge, the fair value of a recognised asset or liability or an unrecognised firm commitment is hedged. In a cash flow hedge, highly probable future cash flows from expected transactions or fluctuating cash flows to be paid or received in connection with a recognised asset or liability are hedged. The documentation of the hedging relationship includes the objectives and strategy of risk management, the type of hedging relationship, the hedged risk, the designation of the hedging instrument and the hedged item, as well as an assessment of the effectiveness requirements comprising the risk-mitigating economic relationship, the effects of the credit risk and the appropriate hedge ratio. The effectiveness of the hedge is assessed at the beginning of and during the hedging relationship.
Changes in the fair value of derivatives are regularly recognised in consolidated net income or in other comprehensive income, depend-ing on whether the hedging relationships are fair value hedges or cash flow hedges. Changes in the fair value of non-designated derivatives are recognised in profit or loss. In the case of fair value hedges, changes in the fair value of derivative financial instruments and the related hedged items are recognised in the consolidated income statement. Changes in the fair value of derivative financial instruments designated as cash flow hedges are initially recognised in other comprehensive income in the amount of the hedge-effective portion after taxes.
GFT Annual Report 2018
The recognition of an individual hedging relationship must be discon-tinued prospectively if it no longer meets the qualifying criteria under IFRS 9. Possible reasons for the termination of hedge accounting include the discontinuation of the economic relationship between the hedged item and the hedging instrument, the sale or termination of the hedging instrument, or a change in the documented risk management objective of an individual hedging relationship.
If derivative financial instruments are not or no longer included in hedge accounting because the conditions for hedge accounting are not or are no longer met, they are classified as held for trading and measured at fair value through profit or loss.
Provisions for pensions and similar obligationsDefined benefit and defined contribution pension plans and other similar post-employment benefits are measured using the projected unit credit method in accordance with IAS 19 Employee Benefits. Plan assets invested to cover pension commitments and other similar benefits are measured at fair value and offset against the corresponding obligations. For the valuation of pension plans and similar obligations, differences between the assumptions made and the actual developments, as well as changes in assumptions, result in actuarial gains and losses which have a direct impact on the consolidated balance sheet or the consolidated statement of comprehensive income.
The balance of pension commitments and other similar post-em-ployment benefits and plan assets (net pension obligation or net pension assets) accrues interest at the discount rate used to measure the gross pension obligation. The resulting net interest expense or income is recognised in profit or loss as interest expense or interest income in the consolidated income statement. The other expenses resulting from the granting of pension commitments and other similar post-employment benefits, which mainly result from entitlements acquired in the financial year, are included in personnel expenses within the consolidated income statement.
Other provisionsProvisions are recognised when there is an obligation to a third party, it is probable that an outflow of resources will be required to settle the obligation and the amount of the obligation can be reliably estimated. The amount recognised as a provision represents the best estimate of the obligation at the reporting date. Provisions with an original term of more than one year are carried at their set-tlement amount discounted to the reporting date. If the recognition criteria for provisions are not met and the possibility of an outflow of resources is not unlikely, a contingent liability is disclosed (to the extent that it can be adequately measured). The amount disclosed as a contingent liability corresponds to the best estimate of the possible obligation at the reporting date. Provisions and contingent liabilities are reviewed regularly and adjusted in the event of new knowledge or changed circumstances.
Contract liabilitiesA contract liability is the obligation of an entity to transfer goods or services to a customer for which the entity has received (or will receive) consideration from that customer. In the case of the GFT Group, contract liabilities arise in particular for unrealised revenues and advance payments received in connection with fixed-price contracts for the creation of customer-specific IT solutions and service contracts.
Revenue recognitionThe GFT Group recognises revenue when control of the identifiable goods or services passes to the client, i. e. when the client has the ability to control the use of the goods or services transferred and derives substantially all the remaining benefits from them. The prerequisite for this is that a contract with enforceable rights and obligations exists and that, among other things, it is probable that the consideration will be received – taking into account the credit-worthiness of the customer. Revenue corresponds to the transaction price at which the GFT Group is expected to be entitled. Variable consideration is included in the transaction price when it is highly probable that there will be no significant reversal of revenue once the uncertainty surrounding the variable consideration no longer exists. If the period between the transfer of the goods or services and the payment date exceeds twelve months and a significant benefit results from the financing for the client or the GFT Group, the consideration is adjusted by the fair value of the money. If a contract comprises several identifiable goods or services, the transaction price is allocated to the performance obligations on the basis of the relative individual sale prices. If individual sale prices are not directly observable, the GFT Group estimates these at an appropriate level. For each performance obligation, revenue is recognised either at a specific point in time or over a specific period of time.
The GFT Group retroactively grants volume discounts to certain cli-ents as soon as the quantity of products or services purchased in the period exceeds a contractually agreed minimum purchase quantity. Discounts are offset against the amounts payable by the customer. The estimation of the variable consideration for the expected future discounts is generally based on the most probable amount method. The GFT Group then applies the rules for limiting the estimate of variable consideration and recognises a reimbursement liability for the expected future discounts.
IFRS 15 requires additional costs to initiate a contract and certain contract performance costs to be recognised as an asset if certain criteria are met. All capitalised contract costs are to be depreciated systematically using a method that follows the transfer of control of the goods or services to the client. The GFT Group recognises the cost of initiating and fulfilling contracts under other assets. Imputed cost rates are used to calculate contract fulfilment costs. Depreciation is based on the stage of completion.
Group Notes 88 – 89
The GFT Group generates revenue primarily from the develop-ment of tailored IT solutions, consulting on the development and implementation of innovative IT strategies, the implementation of industry-specific standard software and the maintenance and further development of business-critical IT solutions. The corresponding revenue streams are mainly based on service contracts, fixed-price contracts and maintenance contracts. In the case of the GFT Group, revenue recognition according to the type of contract for the under-lying service follows the principles described below. In addition to the nature and timing of performance obligations from contracts with clients, the principles also comprise the main terms of payment.
Service contractsService contracts exist in particular for consulting on the develop-ment and implementation of innovative IT strategies as well as the implementation of industry-specific standard software and are based on the time spent (time & material).
In the case of service contracts, the client receives the benefit of the service directly or simultaneously with the provision of the service by the GFT Group. Revenue from service contracts is generally recognised in the amount of the consideration receivable based on the time spent and invoiced. The claim for consideration is based on contractually agreed hourly rates. Invoices are issued in accordance with the terms of the contract; payment terms usually provide for payment between 30 and 60 days after invoicing.
Fixed-price contractsFixed-price contracts are concluded primarily for the development of tailored IT solutions, the implementation of industry-specific standard software and occasionally for the further development of business-critical IT solutions.
Revenue from fixed-price contracts is recognised over a specified period of time according to the stage of completion (ratio of costs already incurred to estimated total costs). An expected loss on a con-tract is recognised immediately as an expense. Invoices are issued in accordance with the contractual terms and conditions, sometimes based on defined payment plans including advance payments. Any excess of payments or services is recognised as a contract liability or contract asset. The terms of payment for fixed-price agreements usually provide for payment between 30 and 60 days after invoicing.
In the case of revenue recognition in connection with fixed-price contracts, the assessment of the stage of completion is of particu-lar importance; it may include estimates of the scope of supplies and services required to fulfil the contractual obligations. These significant estimates include estimated total costs, estimated total revenues, order risks – including technical, political and regulatory risks – and other significant items. The estimate of the stage of completion may increase or decrease revenues due to changes in estimates. It must also be assessed whether the most likely scenario for a contract is that it will be continued or terminated. For the pur-poses of that assessment, all relevant facts and circumstances are taken into account individually for each contract.
As a rule, fixed-price contracts are based on a customer-specific performance promise. The power of disposal is gained directly or simultaneously with the provision of the service, since this is gener-ally provided on the customer’s IT system. Performance obligations of the GFT Group in connection with fixed-price contracts can essentially only be considered as a whole; any partial performance does not enable the client to derive a corresponding benefit from the services provided. In the event of a premature project termination for which the GFT Group is not responsible, a claim against the client for appropriate remuneration for services already rendered is regularly contractually guaranteed.
Maintenance contractsServices provided by the GFT Group for the maintenance and further development of business-critical IT solutions are mainly provided within the framework of maintenance contracts at fixed prices.
In the case of maintenance contracts, the client generally receives the benefit directly or simultaneously with the provision of the service by the GFT Group. Revenue from maintenance contracts is recognised on a straight-line basis over a specified period or – if the service is not provided on a straight-line basis – according to the rendering of the service, i. e. according to the stage of completion as described above. Invoices are issued in accordance with the terms of the contract; payment terms usually provide for payment between 30 and 60 days after invoicing.
Recognition of other incomeOther income mainly relates to income from rental transactions that do not fall within the scope of IFRS 15, as well as interest.
Revenue from rental transactions that does not fall within the scope of IFRS 15 is recognised within revenue on a straight-line basis over the term of the contract.
Revenue from royalties, license fees and interest is recognised in other operating income on an accrual basis in accordance with the economic content of the underlying contract.
Government grantsGovernment grants are recognised as income at the point in time at which the entitlement to the grant has arisen with sufficient certainty or the conditions associated with the grant have been fulfilled.
GFT Annual Report 2018
Interest income and interest expenseInterest income and interest expense includes interest income from securities investments and from cash and cash equivalents, as well as interest expenses from debt. These items also include interest and changes in market values in connection with interest rate hedges as well as income and expenses from the distribution of premiums and discounts. The interest components from pension commitments and other similar obligations, as well as from the plan assets available to cover these obligations, and interest in connection with income tax arrears or refunds are also included in this item.
Financial resultThe financial result includes all expenses and income from financial transactions included in interest income or interest expenses. For example, this item includes expenses from the compounding of financial liabilities or other provisions. Income and expenses in connection with financial investments accounted for using the equity method are also included in the financial result.
Income taxesIncome taxes include both current income taxes and deferred taxes.
Current income taxes are calculated on the basis of the respective national tax results and regulations for the year. In addition, the current taxes reported in the financial year also include adjustment amounts for any tax payments or refunds for years not yet finally assessed, but excluding interest payments or interest refunds and penalties for subsequent tax payments. Due to their complexity, the tax items presented in the financial statements may be subject to different interpretations by taxpayers on the one hand and local tax authorities on the other. In the event that amounts recognised in the tax returns are unlikely to be realised (uncertain tax items), tax provi-sions are recognised. The amount is determined on the basis of the best possible estimate of the expected tax payment (expected value or most probable value of tax uncertainty). Tax receivables from uncertain tax items are recognised if it is predominantly probable and therefore sufficiently certain that they can be realised. No tax provision or asset is recognised for such uncertain tax positions only in the case that there is a tax loss carryforward or unused tax credit. In such cases, the deferred tax asset is adjusted for the unused tax loss carryforward and unused tax credit.
Changes in deferred tax assets and liabilities are generally reflected in the income statement under deferred taxes. An exception to this are the changes to be made in other comprehensive income or directly in equity.
Deferred tax assets and liabilities are determined for temporary dif-ferences between the tax base of an asset or liability and its carrying amount in the balance sheet, including consolidation differences, and for unused tax loss carryforwards and tax credits. Measurement is based on the tax rates expected to apply in the period in which an asset is realised or a liability settled. This is based on the tax rates and regulations valid on the reporting date or which will apply shortly. The GFT Group assesses the recoverability of deferred tax assets on each reporting date on the basis of planned taxable income in future financial years. If the Group assumes that future tax benefits with a probability of more than 50% cannot be partially or completely realised, a valuation allowance is made on the deferred tax assets. Among other things, the planned results from operating activities, the effects on earnings of the reversal of taxable temporary differences and realisable tax strategies are taken into account. As future business developments are uncertain and in some cases cannot be controlled by the Group, the assumptions to be made in connection with the recognition of deferred tax assets are subject to considerable uncertainty.
Deferred tax liabilities on taxable temporary differences from investments in subsidiaries and associated companies are not recognised if the Group can determine the timing of the reversal and it is probable that the temporary difference will not reverse in the foreseeable future.
Earnings per shareBasic earnings per share are calculated by dividing the profit attrib-utable to shareholders of GFT Technologies SE by the weighted average number of shares outstanding. As there were no events in 2018 and 2017 that had a dilutive effect, diluted earnings per share in these years correspond to basic earnings per share.
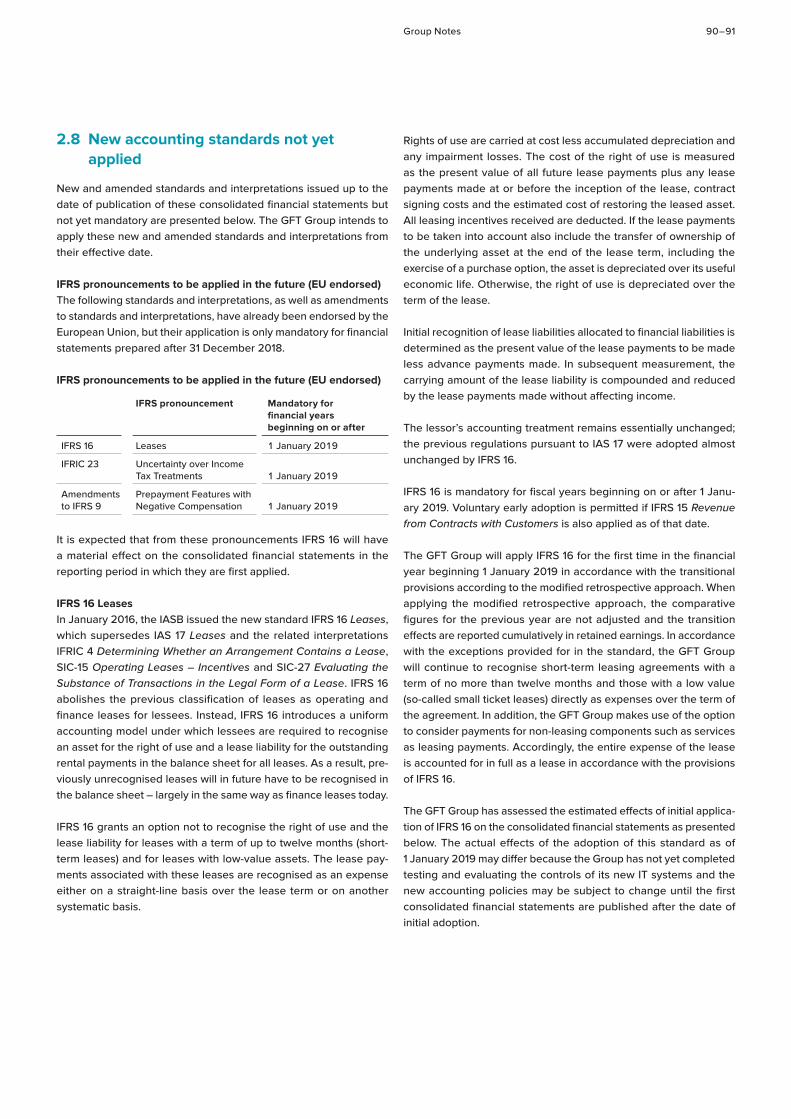
Group Notes 90 – 91
2.8 New accounting standards not yet applied
New and amended standards and interpretations issued up to the date of publication of these consolidated financial statements but not yet mandatory are presented below. The GFT Group intends to apply these new and amended standards and interpretations from their effective date.
IFRS pronouncements to be applied in the future (EU endorsed)The following standards and interpretations, as well as amendments to standards and interpretations, have already been endorsed by the European Union, but their application is only mandatory for financial statements prepared after 31 December 2018.
IFRS pronouncements to be applied in the future (EU endorsed)
IFRS pronouncement Mandatory for financial years beginning on or after
IFRS 16 Leases 1 January 2019
IFRIC 23 Uncertainty over Income Tax Treatments 1 January 2019
Amendments to IFRS 9
Prepayment Features with Negative Compensation 1 January 2019
It is expected that from these pronouncements IFRS 16 will have a material effect on the consolidated financial statements in the reporting period in which they are first applied.
IFRS 16 LeasesIn January 2016, the IASB issued the new standard IFRS 16 Leases, which supersedes IAS 17 Leases and the related interpretations IFRIC 4 Determining Whether an Arrangement Contains a Lease, SIC-15 Operating Leases – Incentives and SIC-27 Evaluating the Substance of Transactions in the Legal Form of a Lease. IFRS 16 abolishes the previous classification of leases as operating and finance leases for lessees. Instead, IFRS 16 introduces a uniform accounting model under which lessees are required to recognise an asset for the right of use and a lease liability for the outstanding rental payments in the balance sheet for all leases. As a result, pre-viously unrecognised leases will in future have to be recognised in the balance sheet – largely in the same way as finance leases today.
IFRS 16 grants an option not to recognise the right of use and the lease liability for leases with a term of up to twelve months (short-term leases) and for leases with low-value assets. The lease pay-ments associated with these leases are recognised as an expense either on a straight-line basis over the lease term or on another systematic basis.
Rights of use are carried at cost less accumulated depreciation and any impairment losses. The cost of the right of use is measured as the present value of all future lease payments plus any lease payments made at or before the inception of the lease, contract signing costs and the estimated cost of restoring the leased asset. All leasing incentives received are deducted. If the lease payments to be taken into account also include the transfer of ownership of the underlying asset at the end of the lease term, including the exercise of a purchase option, the asset is depreciated over its useful economic life. Otherwise, the right of use is depreciated over the term of the lease.
Initial recognition of lease liabilities allocated to financial liabilities is determined as the present value of the lease payments to be made less advance payments made. In subsequent measurement, the carrying amount of the lease liability is compounded and reduced by the lease payments made without affecting income.
The lessor’s accounting treatment remains essentially unchanged; the previous regulations pursuant to IAS 17 were adopted almost unchanged by IFRS 16.
IFRS 16 is mandatory for fiscal years beginning on or after 1 Janu-ary 2019. Voluntary early adoption is permitted if IFRS 15 Revenue from Contracts with Customers is also applied as of that date.
The GFT Group will apply IFRS 16 for the first time in the financial year beginning 1 January 2019 in accordance with the transitional provisions according to the modified retrospective approach. When applying the modified retrospective approach, the comparative figures for the previous year are not adjusted and the transition effects are reported cumulatively in retained earnings. In accordance with the exceptions provided for in the standard, the GFT Group will continue to recognise short-term leasing agreements with a term of no more than twelve months and those with a low value (so-called small ticket leases) directly as expenses over the term of the agreement. In addition, the GFT Group makes use of the option to consider payments for non-leasing components such as services as leasing payments. Accordingly, the entire expense of the lease is accounted for in full as a lease in accordance with the provisions of IFRS 16.
The GFT Group has assessed the estimated effects of initial applica-tion of IFRS 16 on the consolidated financial statements as presented below. The actual effects of the adoption of this standard as of 1 January 2019 may differ because the Group has not yet completed testing and evaluating the controls of its new IT systems and the new accounting policies may be subject to change until the first consolidated financial statements are published after the date of initial adoption.
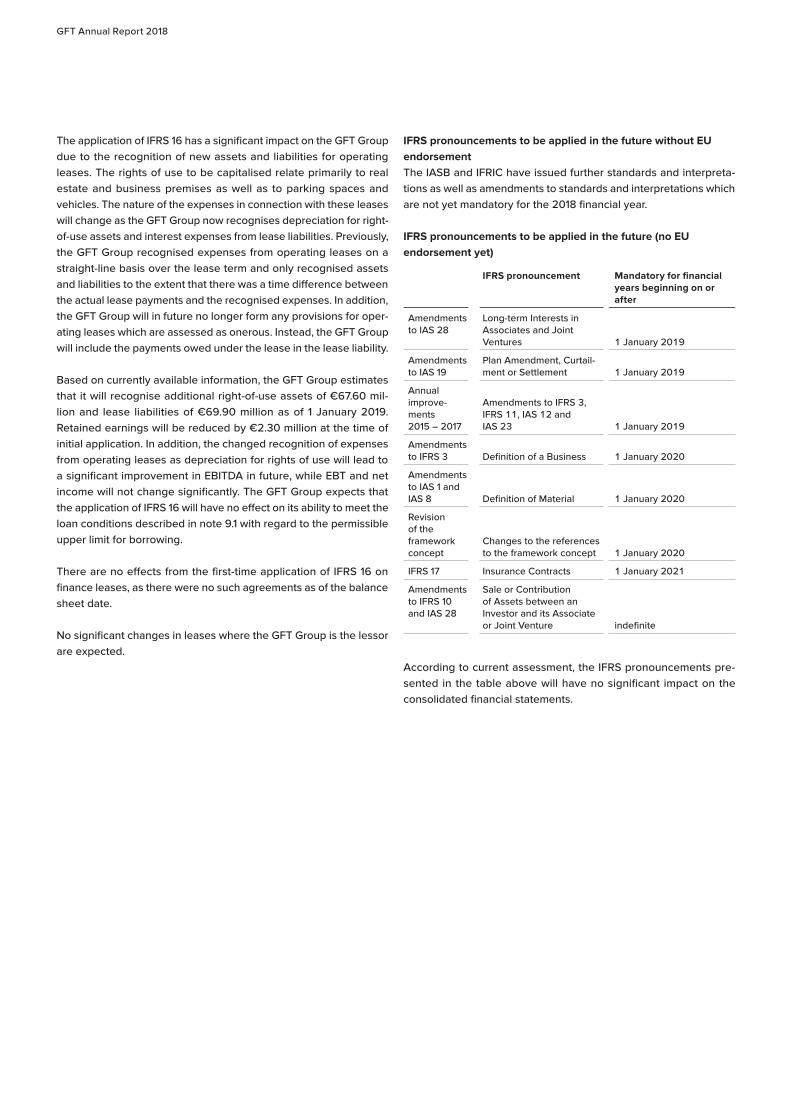
GFT Annual Report 2018
The application of IFRS 16 has a significant impact on the GFT Group due to the recognition of new assets and liabilities for operating leases. The rights of use to be capitalised relate primarily to real estate and business premises as well as to parking spaces and vehicles. The nature of the expenses in connection with these leases will change as the GFT Group now recognises depreciation for right-of-use assets and interest expenses from lease liabilities. Previously, the GFT Group recognised expenses from operating leases on a straight-line basis over the lease term and only recognised assets and liabilities to the extent that there was a time difference between the actual lease payments and the recognised expenses. In addition, the GFT Group will in future no longer form any provisions for oper-ating leases which are assessed as onerous. Instead, the GFT Group will include the payments owed under the lease in the lease liability.
Based on currently available information, the GFT Group estimates that it will recognise additional right-of-use assets of €67.60 mil-lion and lease liabilities of €69.90 million as of 1 January 2019. Retained earnings will be reduced by €2.30 million at the time of initial application. In addition, the changed recognition of expenses from operating leases as depreciation for rights of use will lead to a significant improvement in EBITDA in future, while EBT and net income will not change significantly. The GFT Group expects that the application of IFRS 16 will have no effect on its ability to meet the loan conditions described in note 9.1 with regard to the permissible upper limit for borrowing.
There are no effects from the first-time application of IFRS 16 on finance leases, as there were no such agreements as of the balance sheet date.
No significant changes in leases where the GFT Group is the lessor are expected.
IFRS pronouncements to be applied in the future without EU endorsementThe IASB and IFRIC have issued further standards and interpreta-tions as well as amendments to standards and interpretations which are not yet mandatory for the 2018 financial year.
IFRS pronouncements to be applied in the future (no EU endorsement yet)
IFRS pronouncement Mandatory for financial years beginning on or after
Amendments to IAS 28
Long-term Interests in Associates and Joint Ventures 1 January 2019
Amendments to IAS 19
Plan Amendment, Curtail-ment or Settlement 1 January 2019
Annual improve-ments 2015 – 2017
Amendments to IFRS 3, IFRS 11, IAS 12 and IAS 23 1 January 2019
Amendments to IFRS 3 Definition of a Business 1 January 2020
Amendments to IAS 1 and IAS 8 Definition of Material 1 January 2020
Revision of the framework concept
Changes to the references to the framework concept 1 January 2020
IFRS 17 Insurance Contracts 1 January 2021
Amendments to IFRS 10 and IAS 28
Sale or Contribution of Assets between an Investor and its Associate or Joint Venture indefinite
According to current assessment, the IFRS pronouncements pre-sented in the table above will have no significant impact on the consolidated financial statements.
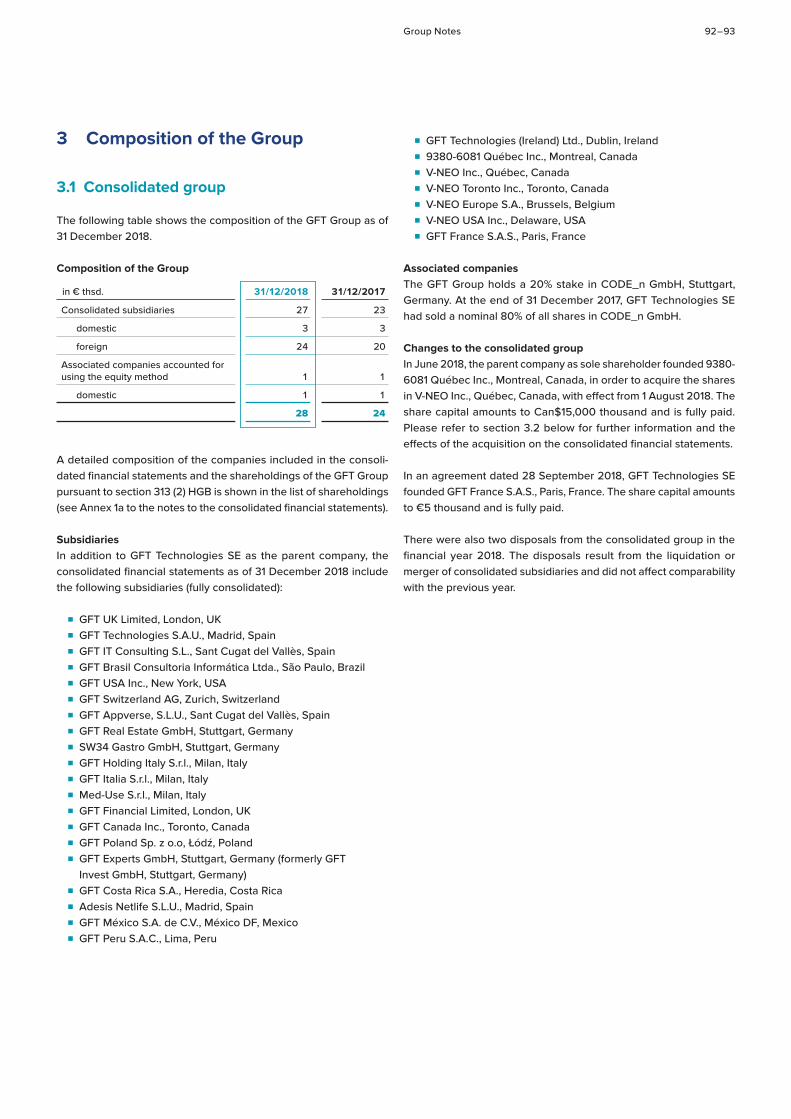
Group Notes 92 – 93
3 Composition of the Group
3.1 Consolidated group
The following table shows the composition of the GFT Group as of 31 December 2018.
Composition of the Group
in € thsd. 31/12/2018 31/12/2017
Consolidated subsidiaries 27 23
domestic 3 3
foreign 24 20
Associated companies accounted for using the equity method 1 1
domestic 1 1
28 24
A detailed composition of the companies included in the consoli-dated financial statements and the shareholdings of the GFT Group pursuant to section 313 (2) HGB is shown in the list of shareholdings (see Annex 1a to the notes to the consolidated financial statements).
SubsidiariesIn addition to GFT Technologies SE as the parent company, the consolidated financial statements as of 31 December 2018 include the following subsidiaries (fully consolidated):
■ GFT UK Limited, London, UK ■ GFT Technologies S.A.U., Madrid, Spain ■ GFT IT Consulting S.L., Sant Cugat del Vallès, Spain ■ GFT Brasil Consultoria Informática Ltda., São Paulo, Brazil ■ GFT USA Inc., New York, USA ■ GFT Switzerland AG, Zurich, Switzerland ■ GFT Appverse, S.L.U., Sant Cugat del Vallès, Spain ■ GFT Real Estate GmbH, Stuttgart, Germany ■ SW34 Gastro GmbH, Stuttgart, Germany ■ GFT Holding Italy S.r.l., Milan, Italy ■ GFT Italia S.r.l., Milan, Italy ■ Med-Use S.r.l., Milan, Italy ■ GFT Financial Limited, London, UK ■ GFT Canada Inc., Toronto, Canada ■ GFT Poland Sp. z o.o, Łódź, Poland ■ GFT Experts GmbH, Stuttgart, Germany (formerly GFT
Invest GmbH, Stuttgart, Germany) ■ GFT Costa Rica S.A., Heredia, Costa Rica ■ Adesis Netlife S.L.U., Madrid, Spain ■ GFT México S.A. de C.V., México DF, Mexico ■ GFT Peru S.A.C., Lima, Peru
■ GFT Technologies (Ireland) Ltd., Dublin, Ireland ■ 9380-6081 Québec Inc., Montreal, Canada ■ V-NEO Inc., Québec, Canada ■ V-NEO Toronto Inc., Toronto, Canada ■ V-NEO Europe S.A., Brussels, Belgium ■ V-NEO USA Inc., Delaware, USA ■ GFT France S.A.S., Paris, France
Associated companiesThe GFT Group holds a 20% stake in CODE_n GmbH, Stuttgart, Germany. At the end of 31 December 2017, GFT Technologies SE had sold a nominal 80% of all shares in CODE_n GmbH.
Changes to the consolidated groupIn June 2018, the parent company as sole shareholder founded 9380-6081 Québec Inc., Montreal, Canada, in order to acquire the shares in V-NEO Inc., Québec, Canada, with effect from 1 August 2018. The share capital amounts to Can$15,000 thousand and is fully paid. Please refer to section 3.2 below for further information and the effects of the acquisition on the consolidated financial statements.
In an agreement dated 28 September 2018, GFT Technologies SE founded GFT France S.A.S., Paris, France. The share capital amounts to €5 thousand and is fully paid.
There were also two disposals from the consolidated group in the financial year 2018. The disposals result from the liquidation or merger of consolidated subsidiaries and did not affect comparability with the previous year.
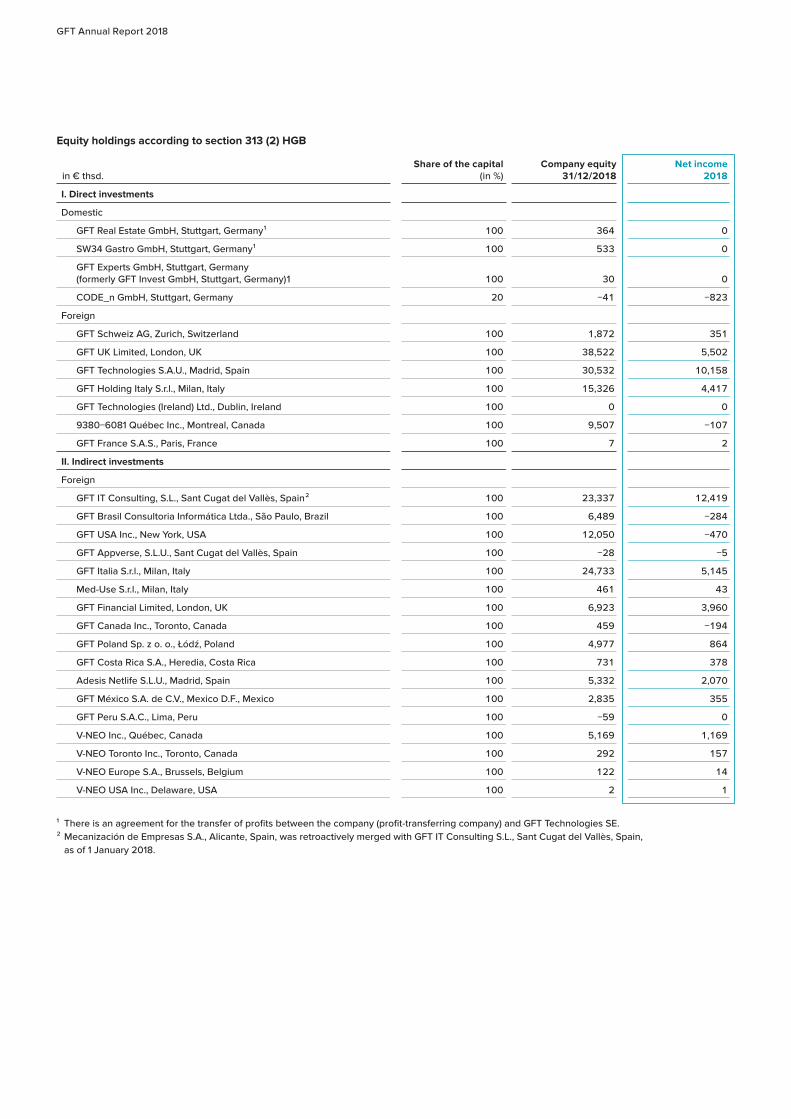
GFT Annual Report 2018
Equity holdings according to section 313 (2) HGB
in € thsd. Share of the capital
(in %)Company equity
31/12/2018Net income
2018
I. Direct investments
Domestic
GFT Real Estate GmbH, Stuttgart, Germany 1 100 364 0
SW34 Gastro GmbH, Stuttgart, Germany 1 100 533 0
GFT Experts GmbH, Stuttgart, Germany (formerly GFT Invest GmbH, Stuttgart, Germany) 1 100 30 0
CODE_n GmbH, Stuttgart, Germany 20 −41 −823
Foreign
GFT Schweiz AG, Zurich, Switzerland 100 1,872 351
GFT UK Limited, London, UK 100 38,522 5,502
GFT Technologies S.A.U., Madrid, Spain 100 30,532 10,158
GFT Holding Italy S.r.l., Milan, Italy 100 15,326 4,417
GFT Technologies (Ireland) Ltd., Dublin, Ireland 100 0 0
9380−6081 Québec Inc., Montreal, Canada 100 9,507 −107
GFT France S.A.S., Paris, France 100 7 2
II. Indirect investments
Foreign
GFT IT Consulting, S.L., Sant Cugat del Vallès, Spain 2 100 23,337 12,419
GFT Brasil Consultoria Informática Ltda., São Paulo, Brazil 100 6,489 −284
GFT USA Inc., New York, USA 100 12,050 −470
GFT Appverse, S.L.U., Sant Cugat del Vallès, Spain 100 −28 −5
GFT Italia S.r.l., Milan, Italy 100 24,733 5,145
Med-Use S.r.l., Milan, Italy 100 461 43
GFT Financial Limited, London, UK 100 6,923 3,960
GFT Canada Inc., Toronto, Canada 100 459 −194
GFT Poland Sp. z o. o., Łódź, Poland 100 4,977 864
GFT Costa Rica S.A., Heredia, Costa Rica 100 731 378
Adesis Netlife S.L.U., Madrid, Spain 100 5,332 2,070
GFT México S.A. de C.V., Mexico D.F., Mexico 100 2,835 355
GFT Peru S.A.C., Lima, Peru 100 −59 0
V-NEO Inc., Québec, Canada 100 5,169 1,169
V-NEO Toronto Inc., Toronto, Canada 100 292 157
V-NEO Europe S.A., Brussels, Belgium 100 122 14
V-NEO USA Inc., Delaware, USA 100 2 1
1 There is an agreement for the transfer of profits between the company (profit-transferring company) and GFT Technologies SE.2 Mecanización de Empresas S.A., Alicante, Spain, was retroactively merged with GFT IT Consulting S.L., Sant Cugat del Vallès, Spain,
as of 1 January 2018.
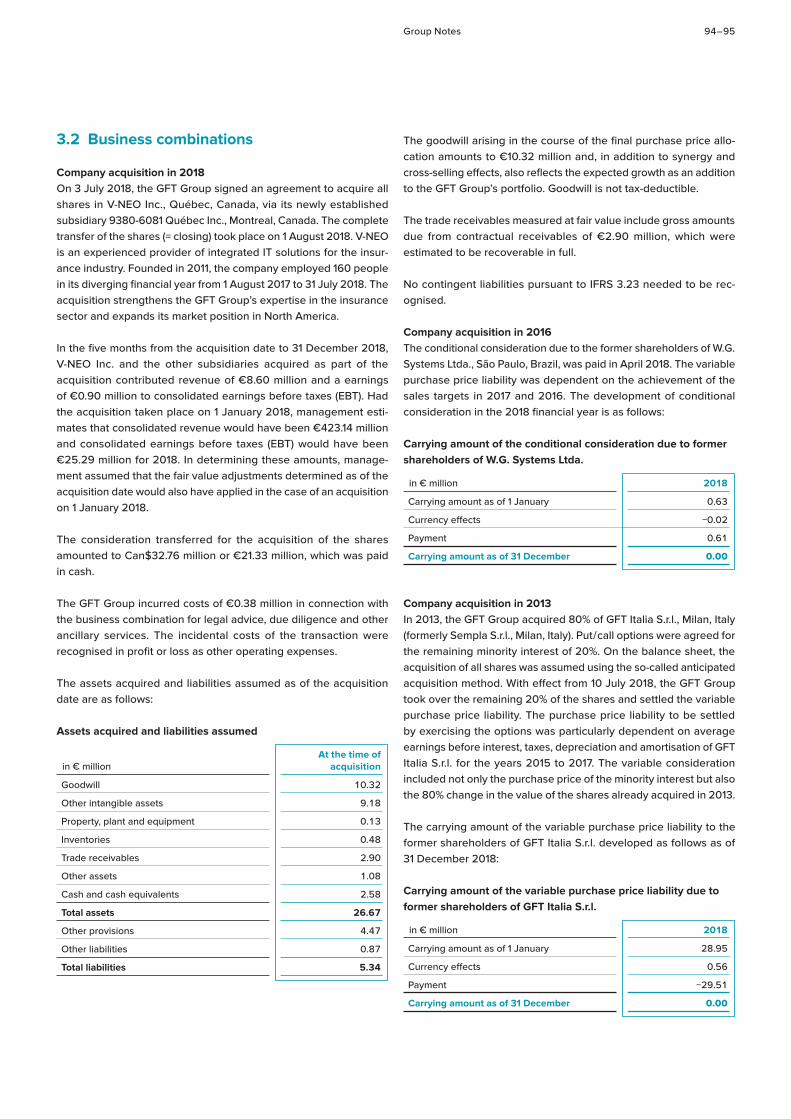
Group Notes 94 – 95
3.2 Business combinations
Company acquisition in 2018On 3 July 2018, the GFT Group signed an agreement to acquire all shares in V-NEO Inc., Québec, Canada, via its newly established subsidiary 9380-6081 Québec Inc., Montreal, Canada. The complete transfer of the shares (= closing) took place on 1 August 2018. V-NEO is an experienced provider of integrated IT solutions for the insur-ance industry. Founded in 2011, the company employed 160 people in its diverging financial year from 1 August 2017 to 31 July 2018. The acquisition strengthens the GFT Group’s expertise in the insurance sector and expands its market position in North America.
In the five months from the acquisition date to 31 December 2018, V-NEO Inc. and the other subsidiaries acquired as part of the acquisition contributed revenue of €8.60 million and a earnings of €0.90 million to consolidated earnings before taxes (EBT). Had the acquisition taken place on 1 January 2018, management esti-mates that consolidated revenue would have been €423.14 million and consolidated earnings before taxes (EBT) would have been €25.29 million for 2018. In determining these amounts, manage-ment assumed that the fair value adjustments determined as of the acquisition date would also have applied in the case of an acquisition on 1 January 2018.
The consideration transferred for the acquisition of the shares amounted to Can$32.76 million or €21.33 million, which was paid in cash.
The GFT Group incurred costs of €0.38 million in connection with the business combination for legal advice, due diligence and other ancillary services. The incidental costs of the transaction were recognised in profit or loss as other operating expenses.
The assets acquired and liabilities assumed as of the acquisition date are as follows:
Assets acquired and liabilities assumed
in € millionAt the time of
acquisition
Goodwill 10.32
Other intangible assets 9.18
Property, plant and equipment 0.13
Inventories 0.48
Trade receivables 2.90
Other assets 1.08
Cash and cash equivalents 2.58
Total assets 26.67
Other provisions 4.47
Other liabilities 0.87
Total liabilities 5.34
The goodwill arising in the course of the final purchase price allo-cation amounts to €10.32 million and, in addition to synergy and cross-selling effects, also reflects the expected growth as an addition to the GFT Group’s portfolio. Goodwill is not tax-deductible.
The trade receivables measured at fair value include gross amounts due from contractual receivables of €2.90 million, which were estimated to be recoverable in full.
No contingent liabilities pursuant to IFRS 3.23 needed to be rec-ognised.
Company acquisition in 2016The conditional consideration due to the former shareholders of W.G. Systems Ltda., São Paulo, Brazil, was paid in April 2018. The variable purchase price liability was dependent on the achievement of the sales targets in 2017 and 2016. The development of conditional consideration in the 2018 financial year is as follows:
Carrying amount of the conditional consideration due to former shareholders of W.G. Systems Ltda.
in € million 2018
Carrying amount as of 1 January 0.63
Currency effects −0.02
Payment 0.61
Carrying amount as of 31 December 0.00
Company acquisition in 2013In 2013, the GFT Group acquired 80% of GFT Italia S.r.l., Milan, Italy (formerly Sempla S.r.l., Milan, Italy). Put / call options were agreed for the remaining minority interest of 20%. On the balance sheet, the acquisition of all shares was assumed using the so-called anticipated acquisition method. With effect from 10 July 2018, the GFT Group took over the remaining 20% of the shares and settled the variable purchase price liability. The purchase price liability to be settled by exercising the options was particularly dependent on average earnings before interest, taxes, depreciation and amortisation of GFT Italia S.r.l. for the years 2015 to 2017. The variable consideration included not only the purchase price of the minority interest but also the 80% change in the value of the shares already acquired in 2013.
The carrying amount of the variable purchase price liability to the former shareholders of GFT Italia S.r.l. developed as follows as of 31 December 2018:
Carrying amount of the variable purchase price liability due to former shareholders of GFT Italia S.r.l.
in € million 2018
Carrying amount as of 1 January 28.95
Currency effects 0.56
Payment −29.51
Carrying amount as of 31 December 0.00
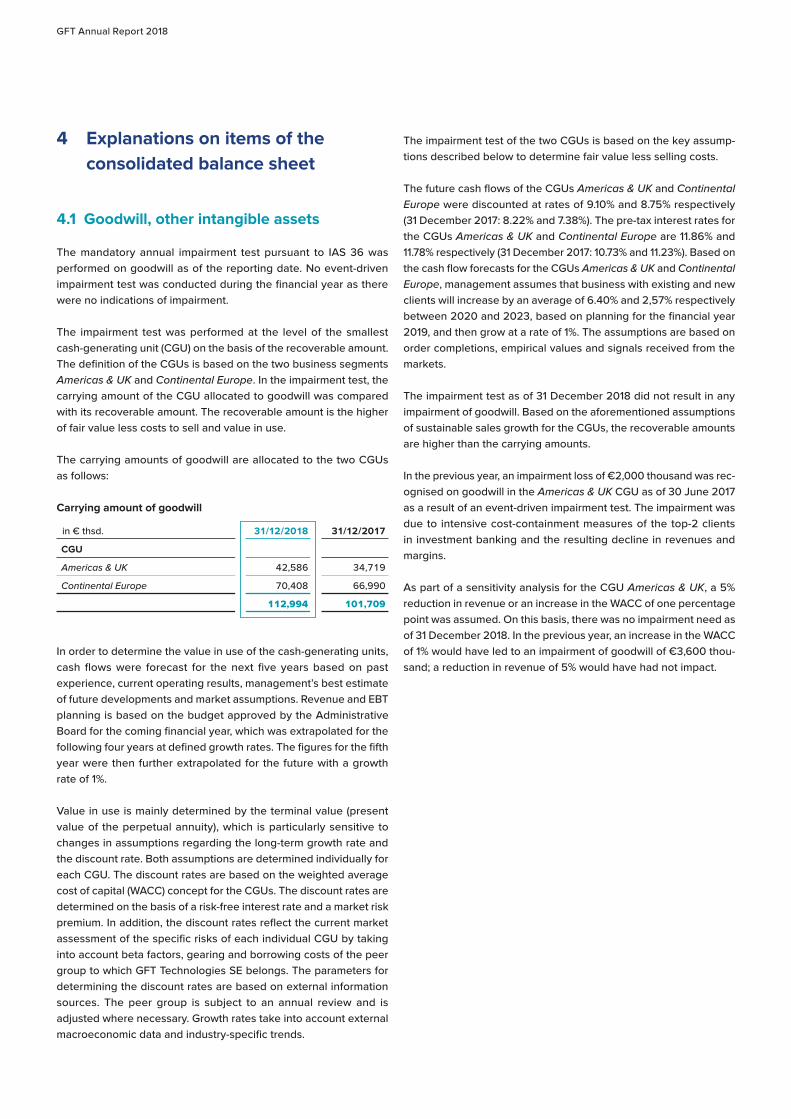
GFT Annual Report 2018
4 Explanations on items of the consolidated balance sheet
4.1 Goodwill, other intangible assets
The mandatory annual impairment test pursuant to IAS 36 was performed on goodwill as of the reporting date. No event-driven impairment test was conducted during the financial year as there were no indications of impairment.
The impairment test was performed at the level of the smallest cash-generating unit (CGU) on the basis of the recoverable amount. The definition of the CGUs is based on the two business segments Americas & UK and Continental Europe. In the impairment test, the carrying amount of the CGU allocated to goodwill was compared with its recoverable amount. The recoverable amount is the higher of fair value less costs to sell and value in use.
The carrying amounts of goodwill are allocated to the two CGUs as follows:
Carrying amount of goodwill
in € thsd. 31/12/2018 31/12/2017
CGU
Americas & UK 42,586 34,719
Continental Europe 70,408 66,990
112,994 101,709
In order to determine the value in use of the cash-generating units, cash flows were forecast for the next five years based on past experience, current operating results, management’s best estimate of future developments and market assumptions. Revenue and EBT planning is based on the budget approved by the Administrative Board for the coming financial year, which was extrapolated for the following four years at defined growth rates. The figures for the fifth year were then further extrapolated for the future with a growth rate of 1%.
Value in use is mainly determined by the terminal value (present value of the perpetual annuity), which is particularly sensitive to changes in assumptions regarding the long-term growth rate and the discount rate. Both assumptions are determined individually for each CGU. The discount rates are based on the weighted average cost of capital (WACC) concept for the CGUs. The discount rates are determined on the basis of a risk-free interest rate and a market risk premium. In addition, the discount rates reflect the current market assessment of the specific risks of each individual CGU by taking into account beta factors, gearing and borrowing costs of the peer group to which GFT Technologies SE belongs. The parameters for determining the discount rates are based on external information sources. The peer group is subject to an annual review and is adjusted where necessary. Growth rates take into account external macroeconomic data and industry-specific trends.
The impairment test of the two CGUs is based on the key assump-tions described below to determine fair value less selling costs.
The future cash flows of the CGUs Americas & UK and Continental Europe were discounted at rates of 9.10% and 8.75% respectively (31 December 2017: 8.22% and 7.38%). The pre-tax interest rates for the CGUs Americas & UK and Continental Europe are 11.86% and 11.78% respectively (31 December 2017: 10.73% and 11.23%). Based on the cash flow forecasts for the CGUs Americas & UK and Continental Europe, management assumes that business with existing and new clients will increase by an average of 6.40% and 2,57% respectively between 2020 and 2023, based on planning for the financial year 2019, and then grow at a rate of 1%. The assumptions are based on order completions, empirical values and signals received from the markets.
The impairment test as of 31 December 2018 did not result in any impairment of goodwill. Based on the aforementioned assumptions of sustainable sales growth for the CGUs, the recoverable amounts are higher than the carrying amounts.
In the previous year, an impairment loss of €2,000 thousand was rec-ognised on goodwill in the Americas & UK CGU as of 30 June 2017 as a result of an event-driven impairment test. The impairment was due to intensive cost-containment measures of the top-2 clients in investment banking and the resulting decline in revenues and margins.
As part of a sensitivity analysis for the CGU Americas & UK, a 5% reduction in revenue or an increase in the WACC of one percentage point was assumed. On this basis, there was no impairment need as of 31 December 2018. In the previous year, an increase in the WACC of 1% would have led to an impairment of goodwill of €3,600 thou-sand; a reduction in revenue of 5% would have had not impact.
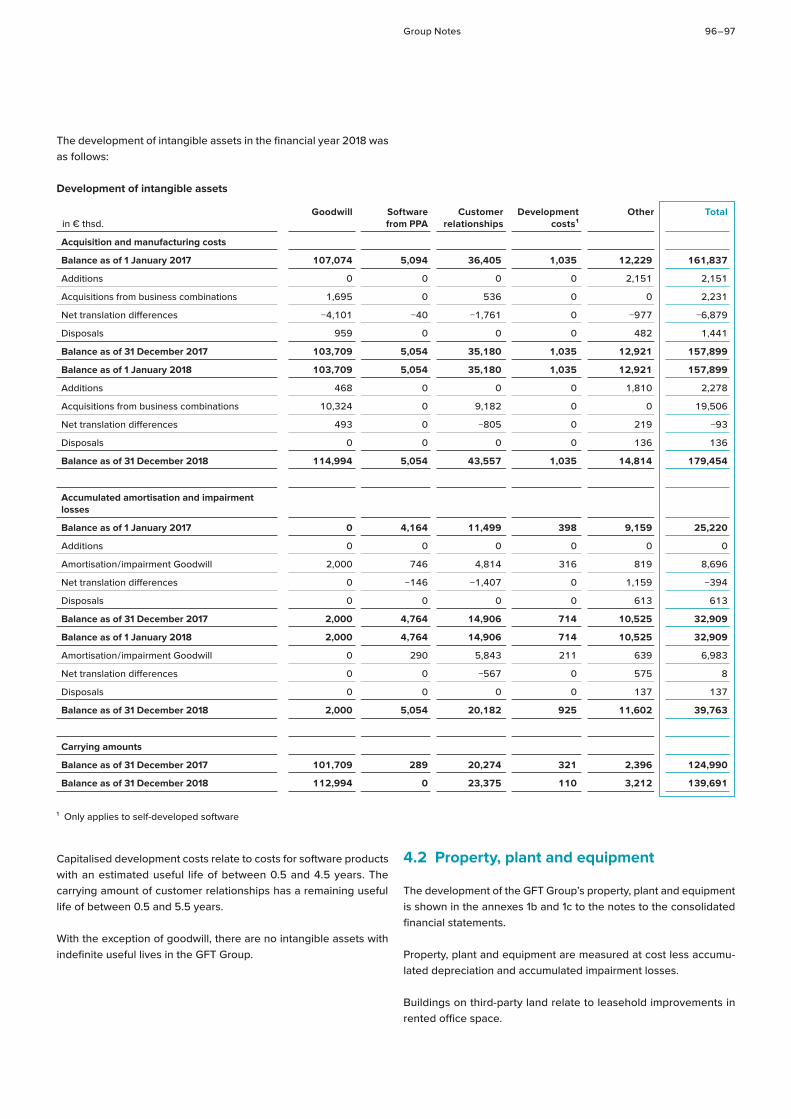
Group Notes 96 – 97
The development of intangible assets in the financial year 2018 was as follows:
Development of intangible assets
in € thsd. Goodwill Software
from PPACustomer
relationships Development
costs 1Other Total
Acquisition and manufacturing costs
Balance as of 1 January 2017 107,074 5,094 36,405 1,035 12,229 161,837
Additions 0 0 0 0 2,151 2,151
Acquisitions from business combinations 1,695 0 536 0 0 2,231
Net translation differences −4,101 −40 −1,761 0 −977 −6,879
Disposals 959 0 0 0 482 1,441
Balance as of 31 December 2017 103,709 5,054 35,180 1,035 12,921 157,899
Balance as of 1 January 2018 103,709 5,054 35,180 1,035 12,921 157,899
Additions 468 0 0 0 1,810 2,278
Acquisitions from business combinations 10,324 0 9,182 0 0 19,506
Net translation differences 493 0 −805 0 219 −93
Disposals 0 0 0 0 136 136
Balance as of 31 December 2018 114,994 5,054 43,557 1,035 14,814 179,454
Accumulated amortisation and impairment losses
Balance as of 1 January 2017 0 4,164 11,499 398 9,159 25,220
Additions 0 0 0 0 0 0
Amortisation / impairment Goodwill 2,000 746 4,814 316 819 8,696
Net translation differences 0 −146 −1,407 0 1,159 −394
Disposals 0 0 0 0 613 613
Balance as of 31 December 2017 2,000 4,764 14,906 714 10,525 32,909
Balance as of 1 January 2018 2,000 4,764 14,906 714 10,525 32,909
Amortisation / impairment Goodwill 0 290 5,843 211 639 6,983
Net translation differences 0 0 −567 0 575 8
Disposals 0 0 0 0 137 137
Balance as of 31 December 2018 2,000 5,054 20,182 925 11,602 39,763
Carrying amounts
Balance as of 31 December 2017 101,709 289 20,274 321 2,396 124,990
Balance as of 31 December 2018 112,994 0 23,375 110 3,212 139,691
1 Only applies to self-developed software
Capitalised development costs relate to costs for software products with an estimated useful life of between 0.5 and 4.5 years. The carrying amount of customer relationships has a remaining useful life of between 0.5 and 5.5 years.
With the exception of goodwill, there are no intangible assets with indefinite useful lives in the GFT Group.
4.2 Property, plant and equipment
The development of the GFT Group’s property, plant and equipment is shown in the annexes 1b and 1c to the notes to the consolidated financial statements.
Property, plant and equipment are measured at cost less accumu-lated depreciation and accumulated impairment losses.
Buildings on third-party land relate to leasehold improvements in rented office space.
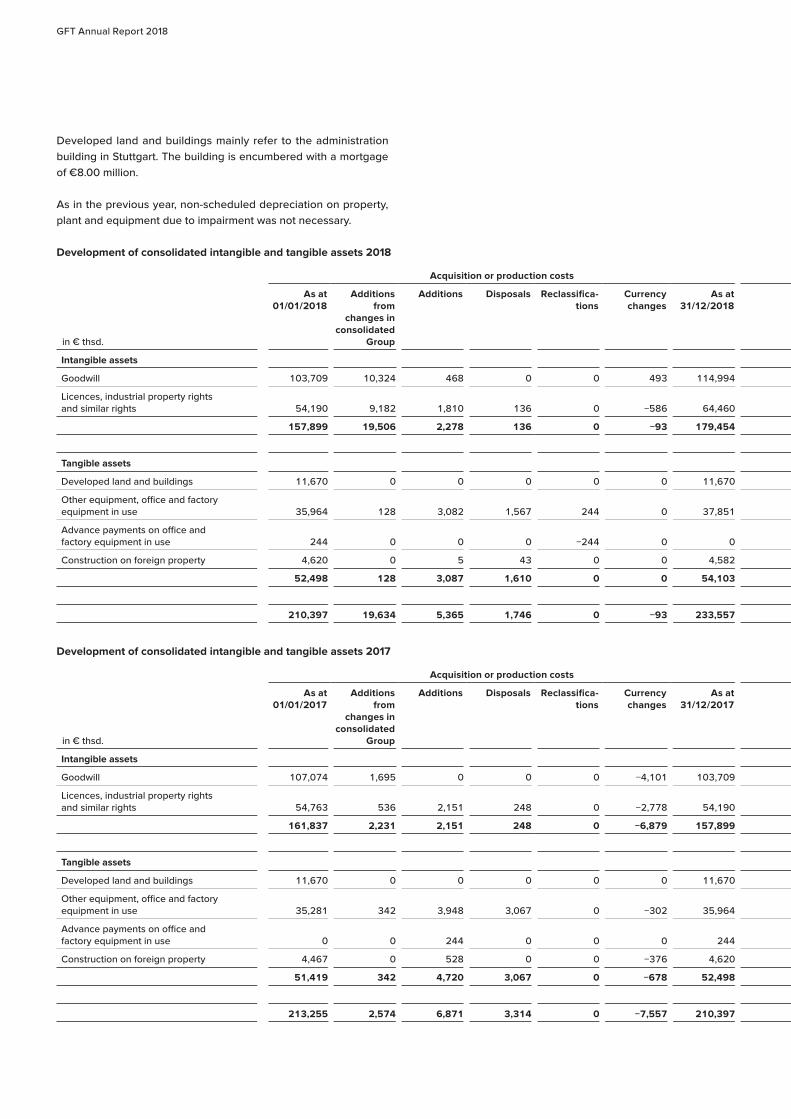
GFT Annual Report 2018
Developed land and buildings mainly refer to the administration building in Stuttgart. The building is encumbered with a mortgage of €8.00 million.
As in the previous year, non-scheduled depreciation on property, plant and equipment due to impairment was not necessary.
Development of consolidated intangible and tangible assets 2018
in € thsd.
Acquisition or production costs Depreciation Book values
As at 01/01/2018
Additions from
changes in consolidated
Group
Additions Disposals Reclassifica-tions
Currency changes
As at 31/12/2018
As at 01/01/2018
Additions from
changes in consolidated
Group
Depreciation of the
financial year
scheduled
Disposals Currency changes
As at 31/12/2018
As at 31/12/2018
As at 31/12/2017
Intangible assets
Goodwill 103,709 10,324 468 0 0 493 114,994 2,000 0 0 0 0 2,000 112,994 101,709
Licences, industrial property rights and similar rights 54,190 9,182 1,810 136 0 −586 64,460 30,910 0 6,984 137 6 37,763 26,697 23,280
157,899 19,506 2,278 136 0 −93 179,454 32,910 0 6,984 137 6 39,763 139,691 124,989
Tangible assets
Developed land and buildings 11,670 0 0 0 0 0 11,670 1,239 0 402 0 0 1,641 10,029 10,432
Other equipment, office and factory equipment in use 35,964 128 3,082 1,567 244 0 37,851 20,169 0 4,561 1,432 142 23,441 14,410 15,795
Advance payments on office and factory equipment in use 244 0 0 0 −244 0 0 0 0 0 0 0 0 0 244
Construction on foreign property 4,620 0 5 43 0 0 4,582 1,671 0 776 10 −2 2,435 2,147 2,949
52,498 128 3,087 1,610 0 0 54,103 23,079 0 5,739 1,442 140 27,517 26,585 29,419
210,397 19,634 5,365 1,746 0 −93 233,557 55,989 0 12,723 1,579 146 67,280 166,277 154,408
Development of consolidated intangible and tangible assets 2017
in € thsd.
Acquisition or production costs Depreciation Book values
As at 01/01/2017
Additions from
changes in consolidated
Group
Additions Disposals Reclassifica-tions
Currency changes
As at 31/12/2017
As at 01/01/2017
Additions from
changes in consolidated
Group
Depreciation of the
financial year
scheduled
Depreciation of the
financial year
unscheduled
Disposals Disposals from
changes in consolidated
Group
Currency changes
As at 31/12/2017
As at 31/12/2017
As at 31/12/2016
Intangible assets
Goodwill 107,074 1,695 0 0 0 −4,101 103,709 0 0 0 2,000 0 0 0 2,000 101,709 107,074
Licences, industrial property rights and similar rights 54,763 536 2,151 248 0 −2,778 54,190 25,220 0 6,695 0 383 231 −393 30,910 23,280 29,543
161,837 2,231 2,151 248 0 −6,879 157,899 25,220 0 6,695 2,000 383 231 −393 32,910 124,989 136,617
Tangible assets
Developed land and buildings 11,670 0 0 0 0 0 11,670 790 0 449 0 0 0 0 1,239 10,432 10,880
Other equipment, office and factory equipment in use 35,281 342 3,948 3,067 0 −302 35,964 18,213 323 4,598 0 2,844 92 −29 20,169 15,795 17,068
Advance payments on office and factory equipment in use 0 0 244 0 0 0 244 0 0 0 0 0 0 0 0 244 0
Construction on foreign property 4,467 0 528 0 0 −376 4,620 1,205 0 776 0 0 0 −310 1,671 2,949 3,262
51,419 342 4,720 3,067 0 −678 52,498 20,208 323 5,823 0 2,844 92 −339 23,079 29,419 31,211
213,255 2,574 6,871 3,314 0 −7,557 210,397 45,428 323 12,518 2,000 3,227 322 −732 55,989 154,408 167,827
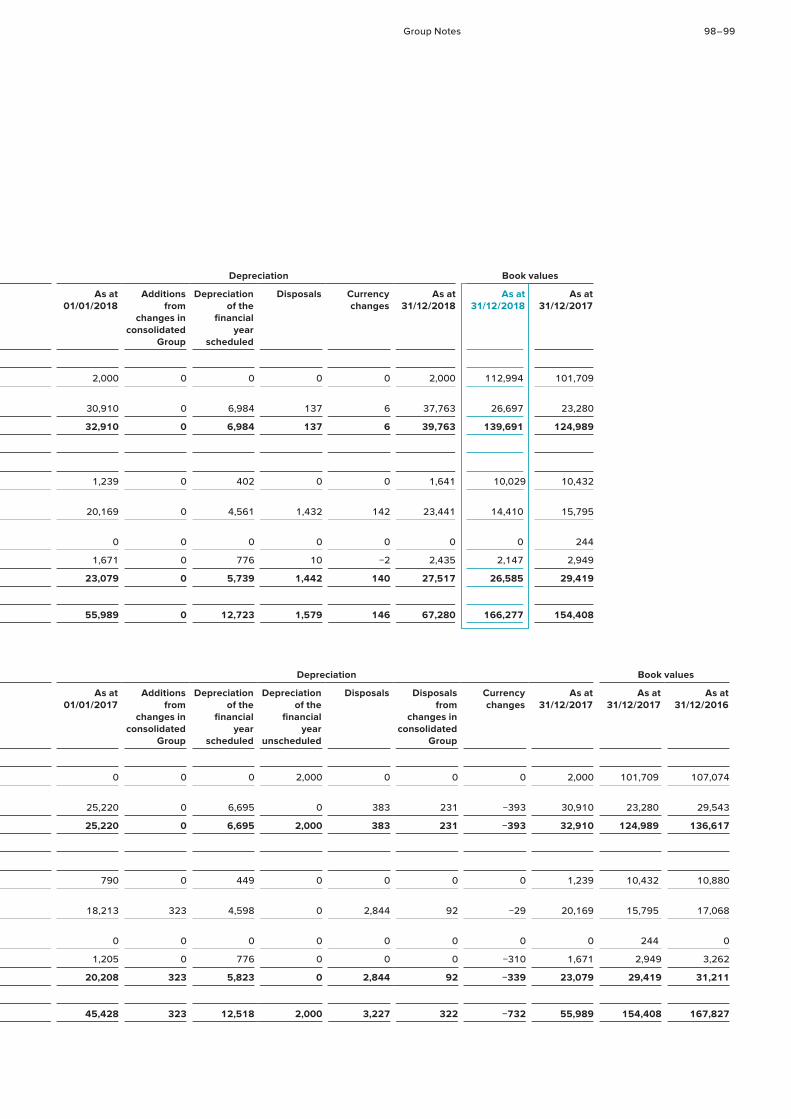
Group Notes 98 – 99
in € thsd.
Acquisition or production costs Depreciation Book values
As at 01/01/2018
Additions from
changes in consolidated
Group
Additions Disposals Reclassifica-tions
Currency changes
As at 31/12/2018
As at 01/01/2018
Additions from
changes in consolidated
Group
Depreciation of the
financial year
scheduled
Disposals Currency changes
As at 31/12/2018
As at 31/12/2018
As at 31/12/2017
Intangible assets
Goodwill 103,709 10,324 468 0 0 493 114,994 2,000 0 0 0 0 2,000 112,994 101,709
Licences, industrial property rights and similar rights 54,190 9,182 1,810 136 0 −586 64,460 30,910 0 6,984 137 6 37,763 26,697 23,280
157,899 19,506 2,278 136 0 −93 179,454 32,910 0 6,984 137 6 39,763 139,691 124,989
Tangible assets
Developed land and buildings 11,670 0 0 0 0 0 11,670 1,239 0 402 0 0 1,641 10,029 10,432
Other equipment, office and factory equipment in use 35,964 128 3,082 1,567 244 0 37,851 20,169 0 4,561 1,432 142 23,441 14,410 15,795
Advance payments on office and factory equipment in use 244 0 0 0 −244 0 0 0 0 0 0 0 0 0 244
Construction on foreign property 4,620 0 5 43 0 0 4,582 1,671 0 776 10 −2 2,435 2,147 2,949
52,498 128 3,087 1,610 0 0 54,103 23,079 0 5,739 1,442 140 27,517 26,585 29,419
210,397 19,634 5,365 1,746 0 −93 233,557 55,989 0 12,723 1,579 146 67,280 166,277 154,408
in € thsd.
Acquisition or production costs Depreciation Book values
As at 01/01/2017
Additions from
changes in consolidated
Group
Additions Disposals Reclassifica-tions
Currency changes
As at 31/12/2017
As at 01/01/2017
Additions from
changes in consolidated
Group
Depreciation of the
financial year
scheduled
Depreciation of the
financial year
unscheduled
Disposals Disposals from
changes in consolidated
Group
Currency changes
As at 31/12/2017
As at 31/12/2017
As at 31/12/2016
Intangible assets
Goodwill 107,074 1,695 0 0 0 −4,101 103,709 0 0 0 2,000 0 0 0 2,000 101,709 107,074
Licences, industrial property rights and similar rights 54,763 536 2,151 248 0 −2,778 54,190 25,220 0 6,695 0 383 231 −393 30,910 23,280 29,543
161,837 2,231 2,151 248 0 −6,879 157,899 25,220 0 6,695 2,000 383 231 −393 32,910 124,989 136,617
Tangible assets
Developed land and buildings 11,670 0 0 0 0 0 11,670 790 0 449 0 0 0 0 1,239 10,432 10,880
Other equipment, office and factory equipment in use 35,281 342 3,948 3,067 0 −302 35,964 18,213 323 4,598 0 2,844 92 −29 20,169 15,795 17,068
Advance payments on office and factory equipment in use 0 0 244 0 0 0 244 0 0 0 0 0 0 0 0 244 0
Construction on foreign property 4,467 0 528 0 0 −376 4,620 1,205 0 776 0 0 0 −310 1,671 2,949 3,262
51,419 342 4,720 3,067 0 −678 52,498 20,208 323 5,823 0 2,844 92 −339 23,079 29,419 31,211
213,255 2,574 6,871 3,314 0 −7,557 210,397 45,428 323 12,518 2,000 3,227 322 −732 55,989 154,408 167,827
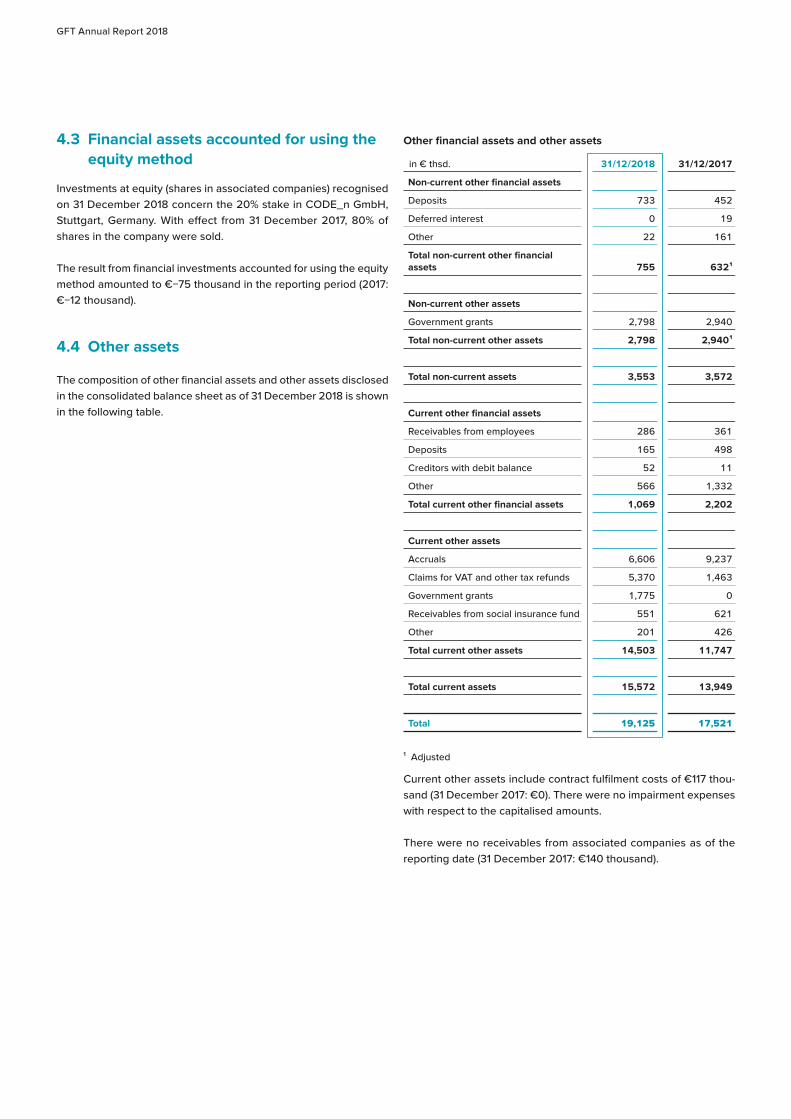
GFT Annual Report 2018
4.3 Financial assets accounted for using the equity method
Investments at equity (shares in associated companies) recognised on 31 December 2018 concern the 20% stake in CODE_n GmbH, Stuttgart, Germany. With effect from 31 December 2017, 80% of shares in the company were sold.
The result from financial investments accounted for using the equity method amounted to €−75 thousand in the reporting period (2017: €−12 thousand).
4.4 Other assets
The composition of other financial assets and other assets disclosed in the consolidated balance sheet as of 31 December 2018 is shown in the following table.
Other financial assets and other assets
in € thsd. 31/12/2018 31/12/2017
Non-current other financial assets
Deposits 733 452
Deferred interest 0 19
Other 22 161
Total non-current other financial assets 755 632 1
Non-current other assets
Government grants 2,798 2,940
Total non-current other assets 2,798 2,940 1
Total non-current assets 3,553 3,572
Current other financial assets
Receivables from employees 286 361
Deposits 165 498
Creditors with debit balance 52 11
Other 566 1,332
Total current other financial assets 1,069 2,202
Current other assets
Accruals 6,606 9,237
Claims for VAT and other tax refunds 5,370 1,463
Government grants 1,775 0
Receivables from social insurance fund 551 621
Other 201 426
Total current other assets 14,503 11,747
Total current assets 15,572 13,949
Total 19,125 17,521
1 Adjusted
Current other assets include contract fulfilment costs of €117 thou-sand (31 December 2017: €0). There were no impairment expenses with respect to the capitalised amounts.
There were no receivables from associated companies as of the reporting date (31 December 2017: €140 thousand).
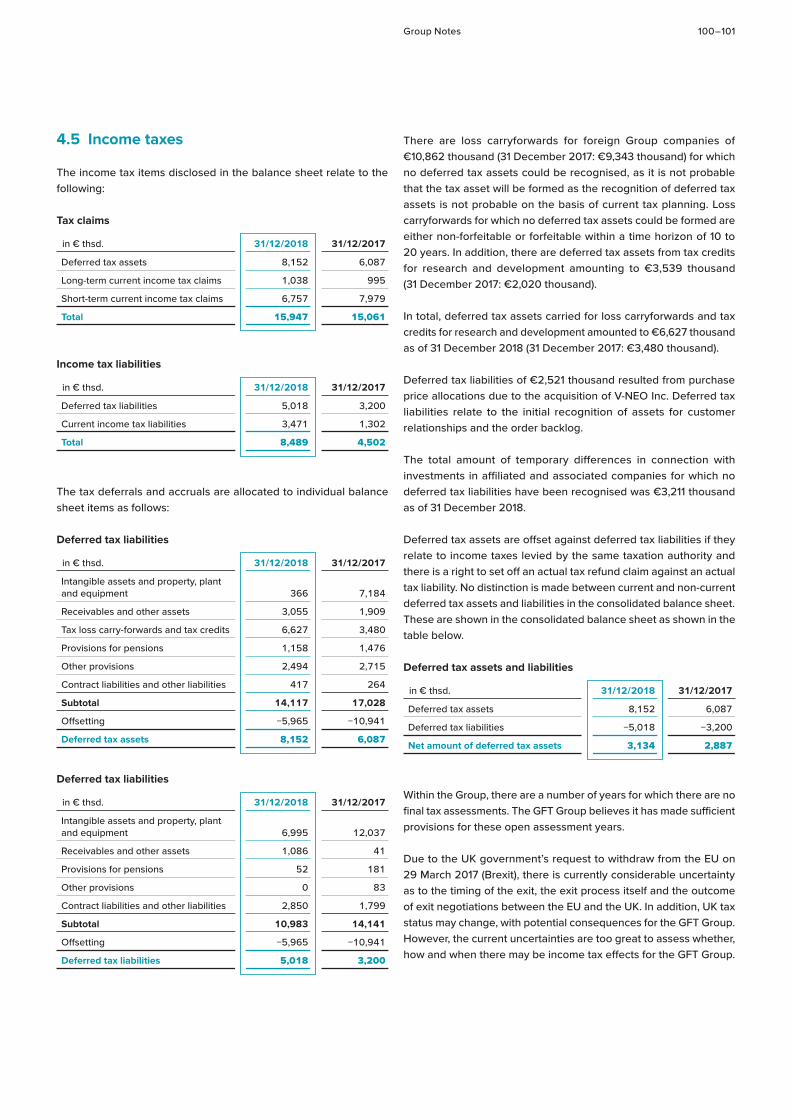
Group Notes 100 – 101
4.5 Income taxes
The income tax items disclosed in the balance sheet relate to the following:
Tax claims
in € thsd. 31/12/2018 31/12/2017
Deferred tax assets 8,152 6,087
Long-term current income tax claims 1,038 995
Short-term current income tax claims 6,757 7,979
Total 15,947 15,061
Income tax liabilities
in € thsd. 31/12/2018 31/12/2017
Deferred tax liabilities 5,018 3,200
Current income tax liabilities 3,471 1,302
Total 8,489 4,502
The tax deferrals and accruals are allocated to individual balance sheet items as follows:
Deferred tax liabilities
in € thsd. 31/12/2018 31/12/2017
Intangible assets and property, plant and equipment 366 7,184
Receivables and other assets 3,055 1,909
Tax loss carry-forwards and tax credits 6,627 3,480
Provisions for pensions 1,158 1,476
Other provisions 2,494 2,715
Contract liabilities and other liabilities 417 264
Subtotal 14,117 17,028
Offsetting −5,965 −10,941
Deferred tax assets 8,152 6,087
Deferred tax liabilities
in € thsd. 31/12/2018 31/12/2017
Intangible assets and property, plant and equipment 6,995 12,037
Receivables and other assets 1,086 41
Provisions for pensions 52 181
Other provisions 0 83
Contract liabilities and other liabilities 2,850 1,799
Subtotal 10,983 14,141
Offsetting −5,965 −10,941
Deferred tax liabilities 5,018 3,200
There are loss carryforwards for foreign Group companies of €10,862 thousand (31 December 2017: €9,343 thousand) for which no deferred tax assets could be recognised, as it is not probable that the tax asset will be formed as the recognition of deferred tax assets is not probable on the basis of current tax planning. Loss carryforwards for which no deferred tax assets could be formed are either non-forfeitable or forfeitable within a time horizon of 10 to 20 years. In addition, there are deferred tax assets from tax credits for research and development amounting to €3,539 thousand (31 December 2017: €2,020 thousand).
In total, deferred tax assets carried for loss carryforwards and tax credits for research and development amounted to €6,627 thousand as of 31 December 2018 (31 December 2017: €3,480 thousand).
Deferred tax liabilities of €2,521 thousand resulted from purchase price allocations due to the acquisition of V-NEO Inc. Deferred tax liabilities relate to the initial recognition of assets for customer relationships and the order backlog.
The total amount of temporary differences in connection with investments in affiliated and associated companies for which no deferred tax liabilities have been recognised was €3,211 thousand as of 31 December 2018.
Deferred tax assets are offset against deferred tax liabilities if they relate to income taxes levied by the same taxation authority and there is a right to set off an actual tax refund claim against an actual tax liability. No distinction is made between current and non-current deferred tax assets and liabilities in the consolidated balance sheet. These are shown in the consolidated balance sheet as shown in the table below.
Deferred tax assets and liabilities
in € thsd. 31/12/2018 31/12/2017
Deferred tax assets 8,152 6,087
Deferred tax liabilities −5,018 −3,200
Net amount of deferred tax assets 3,134 2,887
Within the Group, there are a number of years for which there are no final tax assessments. The GFT Group believes it has made sufficient provisions for these open assessment years.
Due to the UK government’s request to withdraw from the EU on 29 March 2017 (Brexit), there is currently considerable uncertainty as to the timing of the exit, the exit process itself and the outcome of exit negotiations between the EU and the UK. In addition, UK tax status may change, with potential consequences for the GFT Group. However, the current uncertainties are too great to assess whether, how and when there may be income tax effects for the GFT Group.
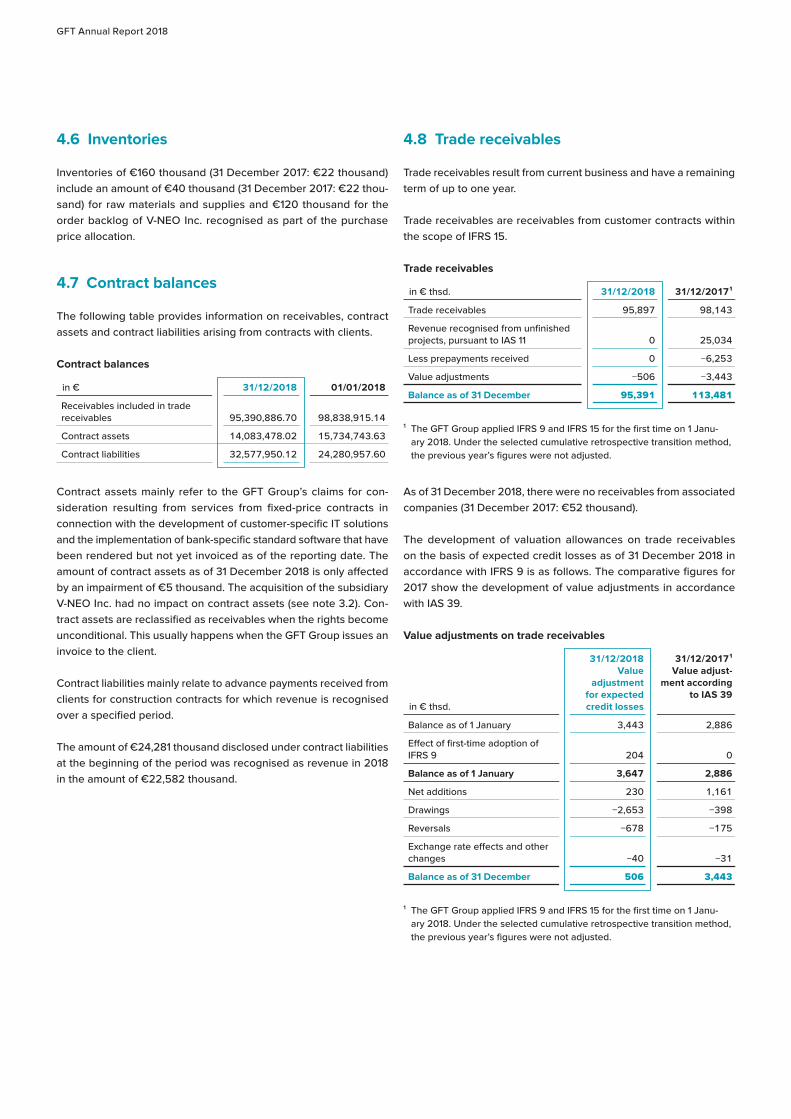
GFT Annual Report 2018
4.6 Inventories
Inventories of €160 thousand (31 December 2017: €22 thousand) include an amount of €40 thousand (31 December 2017: €22 thou-sand) for raw materials and supplies and €120 thousand for the order backlog of V-NEO Inc. recognised as part of the purchase price allocation.
4.7 Contract balances
The following table provides information on receivables, contract assets and contract liabilities arising from contracts with clients.
Contract balances
in € 31/12/2018 01/01/2018
Receivables included in trade receivables 95,390,886.70 98,838,915.14
Contract assets 14,083,478.02 15,734,743.63
Contract liabilities 32,577,950.12 24,280,957.60
Contract assets mainly refer to the GFT Group’s claims for con-sideration resulting from services from fixed-price contracts in connection with the development of customer-specific IT solutions and the implementation of bank-specific standard software that have been rendered but not yet invoiced as of the reporting date. The amount of contract assets as of 31 December 2018 is only affected by an impairment of €5 thousand. The acquisition of the subsidiary V-NEO Inc. had no impact on contract assets (see note 3.2). Con-tract assets are reclassified as receivables when the rights become unconditional. This usually happens when the GFT Group issues an invoice to the client.
Contract liabilities mainly relate to advance payments received from clients for construction contracts for which revenue is recognised over a specified period.
The amount of €24,281 thousand disclosed under contract liabilities at the beginning of the period was recognised as revenue in 2018 in the amount of €22,582 thousand.
4.8 Trade receivables
Trade receivables result from current business and have a remaining term of up to one year.
Trade receivables are receivables from customer contracts within the scope of IFRS 15.
Trade receivables
in € thsd. 31/12/2018 31/12/2017 1
Trade receivables 95,897 98,143
Revenue recognised from unfinished projects, pursuant to IAS 11 0 25,034
Less prepayments received 0 −6,253
Value adjustments −506 −3,443
Balance as of 31 December 95,391 113,481
1 The GFT Group applied IFRS 9 and IFRS 15 for the first time on 1 Janu-ary 2018. Under the selected cumulative retrospective transition method, the previous year’s figures were not adjusted.
As of 31 December 2018, there were no receivables from associated companies (31 December 2017: €52 thousand).
The development of valuation allowances on trade receivables on the basis of expected credit losses as of 31 December 2018 in accordance with IFRS 9 is as follows. The comparative figures for 2017 show the development of value adjustments in accordance with IAS 39.
Value adjustments on trade receivables
in € thsd.
31/12/2018Value
adjustment for expected credit losses
31/12/2017 1Value adjust-
ment according to IAS 39
Balance as of 1 January 3,443 2,886
Effect of first-time adoption of IFRS 9 204 0
Balance as of 1 January 3,647 2,886
Net additions 230 1,161
Drawings −2,653 −398
Reversals −678 −175
Exchange rate effects and other changes −40 −31
Balance as of 31 December 506 3,443
1 The GFT Group applied IFRS 9 and IFRS 15 for the first time on 1 Janu-ary 2018. Under the selected cumulative retrospective transition method, the previous year’s figures were not adjusted.
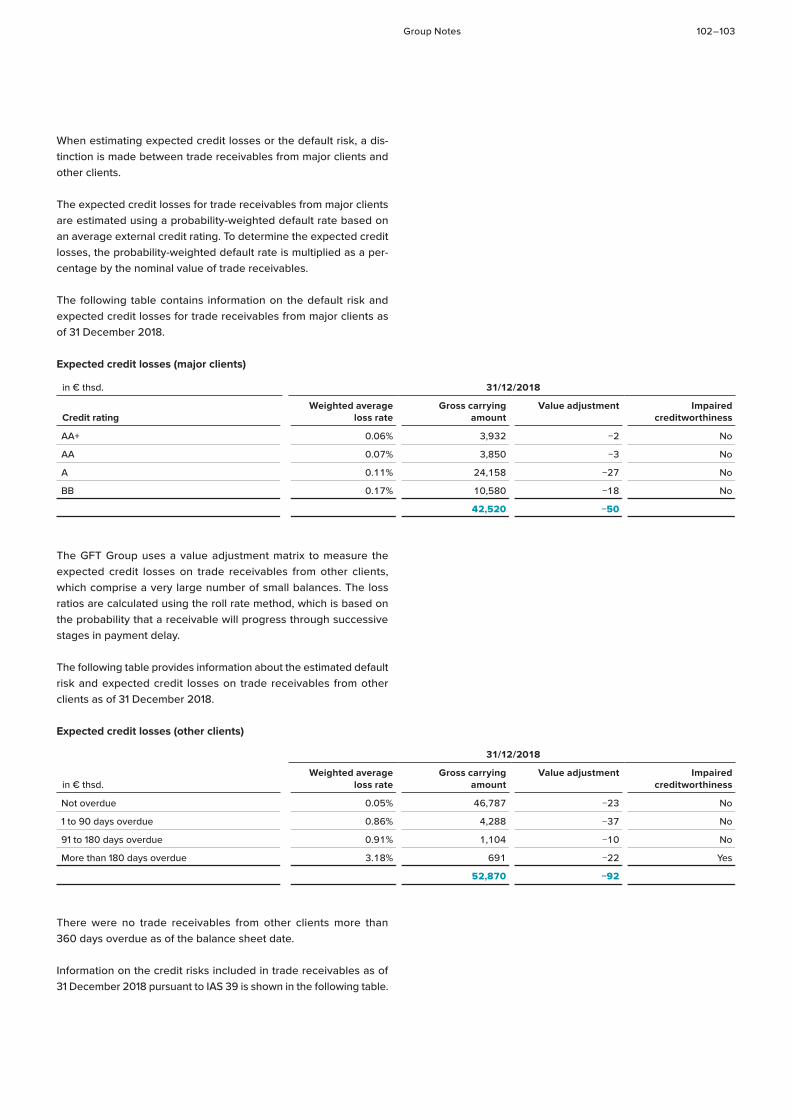
Group Notes 102 – 103
When estimating expected credit losses or the default risk, a dis-tinction is made between trade receivables from major clients and other clients.
The expected credit losses for trade receivables from major clients are estimated using a probability-weighted default rate based on an average external credit rating. To determine the expected credit losses, the probability-weighted default rate is multiplied as a per-centage by the nominal value of trade receivables.
The following table contains information on the default risk and expected credit losses for trade receivables from major clients as of 31 December 2018.
Expected credit losses (major clients)
in € thsd. 31/12/2018
Credit ratingWeighted average
loss rateGross carrying
amountValue adjustment Impaired
creditworthiness
AA+ 0.06% 3,932 −2 No
AA 0.07% 3,850 −3 No
A 0.11% 24,158 −27 No
BB 0.17% 10,580 −18 No
42,520 −50
The GFT Group uses a value adjustment matrix to measure the expected credit losses on trade receivables from other clients, which comprise a very large number of small balances. The loss ratios are calculated using the roll rate method, which is based on the probability that a receivable will progress through successive stages in payment delay.
The following table provides information about the estimated default risk and expected credit losses on trade receivables from other clients as of 31 December 2018.
Expected credit losses (other clients)
in € thsd.
31/12/2018
Weighted average loss rate
Gross carrying amount
Value adjustment Impaired creditworthiness
Not overdue 0.05% 46,787 −23 No
1 to 90 days overdue 0.86% 4,288 −37 No
91 to 180 days overdue 0.91% 1,104 −10 No
More than 180 days overdue 3.18% 691 −22 Yes
52,870 −92
There were no trade receivables from other clients more than 360 days overdue as of the balance sheet date.
Information on the credit risks included in trade receivables as of 31 December 2018 pursuant to IAS 39 is shown in the following table.
GFT Annual Report 2018
Credit risks for trade receivables pursuant to IAS 39
in € thsd. 31/12/2017
Receivables neither overdue nor impaired 95,743
Overdue receivables not impaired
less than 90 days 2,683
90 to 180 days 879
181 to 360 days 0
more than 360 days 14,183
Impaired receivables 15,510
Carrying amount (net) 113,488
Receivables more than 360 days overdue as of 31 December 2017 mainly relate to receivables from a client with whom there was a legal dispute. A settlement payment was obtained and received in January 2018 as a result of this legal dispute, essentially in the amount of the portion not impaired.
Further information on financial risks and risk types is provided in note 9.1.
4.9 Equity capital
Please refer to the separately presented consolidated statement of changes in equity for the development of equity during the financial years 2018 and 2017 (see annex 1.4).
Subscribed capitalAs of 31 December 2018, the subscribed capital (share capital) of €26,325,946.00 consisted of 26,325,946 no-par value shares (unchanged from the previous year). The shares are bearer shares and all grant the same rights.
Authorised capitalAs of 31 December 2018, there was unused authorised capital of €10,000,000.00 (2017: €10,000,000.00).
Conditional capitalThe conditional capital as of 31 December 2018 amounts to €10,000,000.00 (2017: €10,000,000.00).
Capital reserve The capital reserve comprises the amount generated by the issue of shares in excess of the arithmetical value.
Retained earningsRetained earnings relate to amounts formed from earnings in finan-cial year 2018 and earlier financial years.
Changes recognised directly in equityChanges recognised directly in equity include income and expenses to be recognised in other comprehensive income. The balance sheet item ‘Actuarial gains / losses’ includes changes in pension provisions to be recognised in equity, the item ‘Currency translation differences’ includes unrealised currency effects.
DividendAccording to the German Stock Corporation Act (Aktiengesetz – AktG), the dividend is distributed from the balance sheet profit reported in the annual financial statements of GFT Technologies SE (separate financial statements). In the financial year 2018, a dividend of €0.30 per share totalling €7,898 thousand (2017: €0.30 per share, total €7,898 thousand) was distributed to the shareholders of the parent company from the balance sheet profit of the parent company for the 2017 financial year.
A proposal will be made to the Annual General Meeting to distribute €7,898 thousand (€0.30 per share) to shareholders from the balance sheet profit of GFT Technologies SE for 2018.
Capital managementThe GFT Group’s capital management comprises the consolidated equity attributable to the shareholders of the parent company GFT Technologies SE, whose structure and possible uses are largely determined by the capital structure of GFT Technologies SE. As there are no shares of non-controlling interests, the equity attributable to the shareholders of GFT Technologies SE corresponds to total consolidated equity. The aim of capital management is to secure the sustainable provision of equity for the Group under considera-tion of appropriate dividend payments to the shareholders. GFT is subject to external minimum capital requirements due to covenants in connection with the promissory note loans and syndicated loan. The covenants were met in full. The quantitative statements as to managed capital and the changes compared to the previous year are presented in the consolidated statement of changes in equity of the GFT Group.
4.10 Provisions for pensions
There are several forms of company pension within the GFT Group: employee benefits are provided through defined contribution and defined benefit plans as well as one-off payments on termination of employment. For defined contribution plans, contributions are paid by the company based on legal or contractual regulations, or on a voluntary basis, to state or private pension insurance institutes. The contributions paid in the financial year 2018 for defined con-tribution plans to public and private pensions regulatory authority of €26,391 thousand (2017: €23,905 thousand) are included in personnel expenses.
Defined benefit plans in Germany exist due to direct individual com-mitments to retirement benefits, invalidity benefits, and provisions for dependents for an active manager and a manager who has left the company, as well as for a former Managing Director of a former subsidiary (pension recipient).
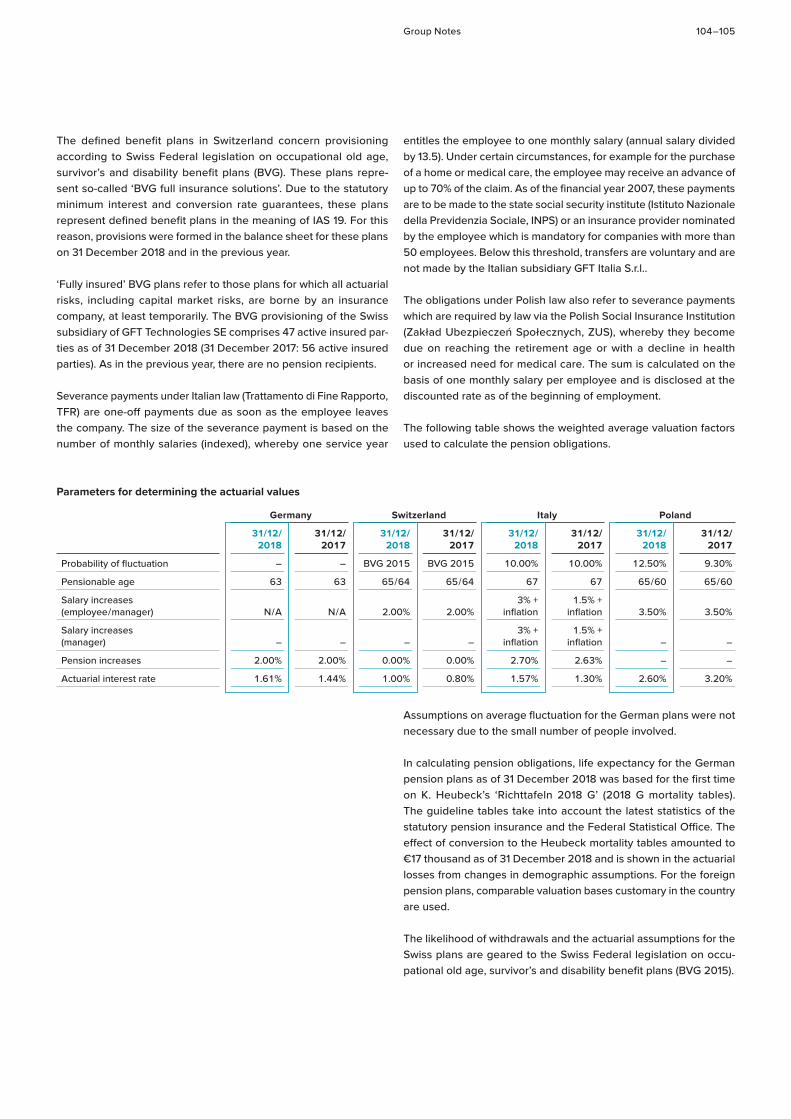
Group Notes 104 – 105
The defined benefit plans in Switzerland concern provisioning according to Swiss Federal legislation on occupational old age, survivor’s and disability benefit plans (BVG). These plans repre-sent so-called ‘BVG full insurance solutions’. Due to the statutory minimum interest and conversion rate guarantees, these plans represent defined benefit plans in the meaning of IAS 19. For this reason, provisions were formed in the balance sheet for these plans on 31 December 2018 and in the previous year.
‘Fully insured’ BVG plans refer to those plans for which all actuarial risks, including capital market risks, are borne by an insurance company, at least temporarily. The BVG provisioning of the Swiss subsidiary of GFT Technologies SE comprises 47 active insured par-ties as of 31 December 2018 (31 December 2017: 56 active insured parties). As in the previous year, there are no pension recipients.
Severance payments under Italian law (Trattamento di Fine Rapporto, TFR) are one-off payments due as soon as the employee leaves the company. The size of the severance payment is based on the number of monthly salaries (indexed), whereby one service year
entitles the employee to one monthly salary (annual salary divided by 13.5). Under certain circumstances, for example for the purchase of a home or medical care, the employee may receive an advance of up to 70% of the claim. As of the financial year 2007, these payments are to be made to the state social security institute (Istituto Nazionale della Previdenzia Sociale, INPS) or an insurance provider nominated by the employee which is mandatory for companies with more than 50 employees. Below this threshold, transfers are voluntary and are not made by the Italian subsidiary GFT Italia S.r.l..
The obligations under Polish law also refer to severance payments which are required by law via the Polish Social Insurance Institution (Zakład Ubezpieczeń Społecznych, ZUS), whereby they become due on reaching the retirement age or with a decline in health or increased need for medical care. The sum is calculated on the basis of one monthly salary per employee and is disclosed at the discounted rate as of the beginning of employment.
The following table shows the weighted average valuation factors used to calculate the pension obligations.
Parameters for determining the actuarial values
Germany Switzerland Italy Poland
31/12/ 2018
31/12/ 2017
31/12/ 2018
31/12/ 2017
31/12/ 2018
31/12/ 2017
31/12/ 2018
31/12/ 2017
Probability of fluctuation – – BVG 2015 BVG 2015 10.00% 10.00% 12.50% 9.30%
Pensionable age 63 63 65 / 64 65 / 64 67 67 65 / 60 65 / 60
Salary increases (employee / manager) N / A N / A 2.00% 2.00%
3% +inflation
1.5% +inflation 3.50% 3.50%
Salary increases (manager) – – – –
3% +inflation
1.5% +inflation – –
Pension increases 2.00% 2.00% 0.00% 0.00% 2.70% 2.63% – –
Actuarial interest rate 1.61% 1.44% 1.00% 0.80% 1.57% 1.30% 2.60% 3.20%
Assumptions on average fluctuation for the German plans were not necessary due to the small number of people involved.
In calculating pension obligations, life expectancy for the German pension plans as of 31 December 2018 was based for the first time on K. Heubeck’s ‘Richttafeln 2018 G’ (2018 G mortality tables). The guideline tables take into account the latest statistics of the statutory pension insurance and the Federal Statistical Office. The effect of conversion to the Heubeck mortality tables amounted to €17 thousand as of 31 December 2018 and is shown in the actuarial losses from changes in demographic assumptions. For the foreign pension plans, comparable valuation bases customary in the country are used.
The likelihood of withdrawals and the actuarial assumptions for the Swiss plans are geared to the Swiss Federal legislation on occu-pational old age, survivor’s and disability benefit plans (BVG 2015).
GFT Annual Report 2018
The likelihood of withdrawals in Italy is assessed at 10.0%. The actu-arial assumptions for mortality rates are prescribed by surveys of the Italian statistics office (Istituto Nazionale di Statistica, Istat 2004). The actuarial assumptions for disability incidence rates are based on the tables of the National Institute for Social Security (Istituto Nazionale della Previdenza Sociale, INPS).
For Poland, the likelihood of withdrawals is assessed at 12.5%. The actuarial assumptions for mortality rates are prescribed by the Main Statistical Office (Główny Urząd Statystyczny, GUS) (GUS 2017: multiplied by 60%). The actuarial assumptions for disability incidence rates are based on the table of the Polish Social Insurance Institution (ZUS 2008).
The present values of the defined benefit obligations, the fair values of the plan assets and the respective excessive and / or insufficient cover of the reporting year and the preceding year can be taken from the following table:
Net liability of pension obligations
in € thsd. 31/12/2018 31/12/2017
Fair value of plan assets −6,953 −6,495
Present value of defined benefit obligations 13,905 15,068
Underfunding (net debt) 6,952 8,573
Of the present value of the defined benefit obligation, €10,358 thou-sand (31 December 2017: €11,446 thousand) relate to pension plans that are financed completely or partially by plan assets and €3,547 thousand (31 December 2017: €3,623 thousand) to pension plans that are not financed by plan assets. Experience adjustments to pension plan liabilities amounted to €1,524 thousand (2017: €49 thousand) and are mainly attributable to departures from the Swiss company; experience adjustments to plan assets amounted to €41 thousand (2017: €9 thousand).
The present value of the pension obligations is reconciled as follows:
Present value of pension obligations
in € thsd. 31/12/2018 31/12/2017
Pension obligation as of 1 January 15,068 13,186
Current service cost 1,054 1,109
Past service cost −604 0
Interest expense / income 145 127
Restatements −1,560 −81
Contributions to pension plan 757 2,582
Benefits paid −1,316 −1,002
Exchange rate changes 361 −853
Pension obligation as of 31 December 13,905 15,068
The fair value of the plan assets is reconciled as follows:
Fair value of plan assets
in € thsd. 31/12/2018 31/12/2017
Fair value of plan assets as of 1 January 6,495 4,496
Income from plan assets (without interest income) 50 32
Premiums paid less benefits received −404 1,817
Contributions by employer 265 309
Contributions by entitled employees 265 309
Exchange rate changes 283 −468
Fair value of plan assets as of 31 December 6,953 6,495
Plan assets concern the BVG provisioning in Switzerland and an amount of €250 thousand in term deposits pledged to the pension recipient (‘Plan Assets GFT Technologies SE’). In the following year (2019), employer contributions to the plan assets of €268 thousand and employee contributions of €268 thousand are expected. As in the previous year, the calculation of the obligation and the generally expected return of the plan assets in Switzerland was based on the valid insurance regulations, databases and cash flow disclosures for 2018 of the two Swiss companies. The expected income from plan assets of GFT Technologies SE results from interest and is insignifi-cant. There are no plan assets for the Italian and Polish companies.
Under IAS 19R, companies must classify the fair value of plan assets according to the nature and risks of these assets. The breakdown of plan assets is as follows:
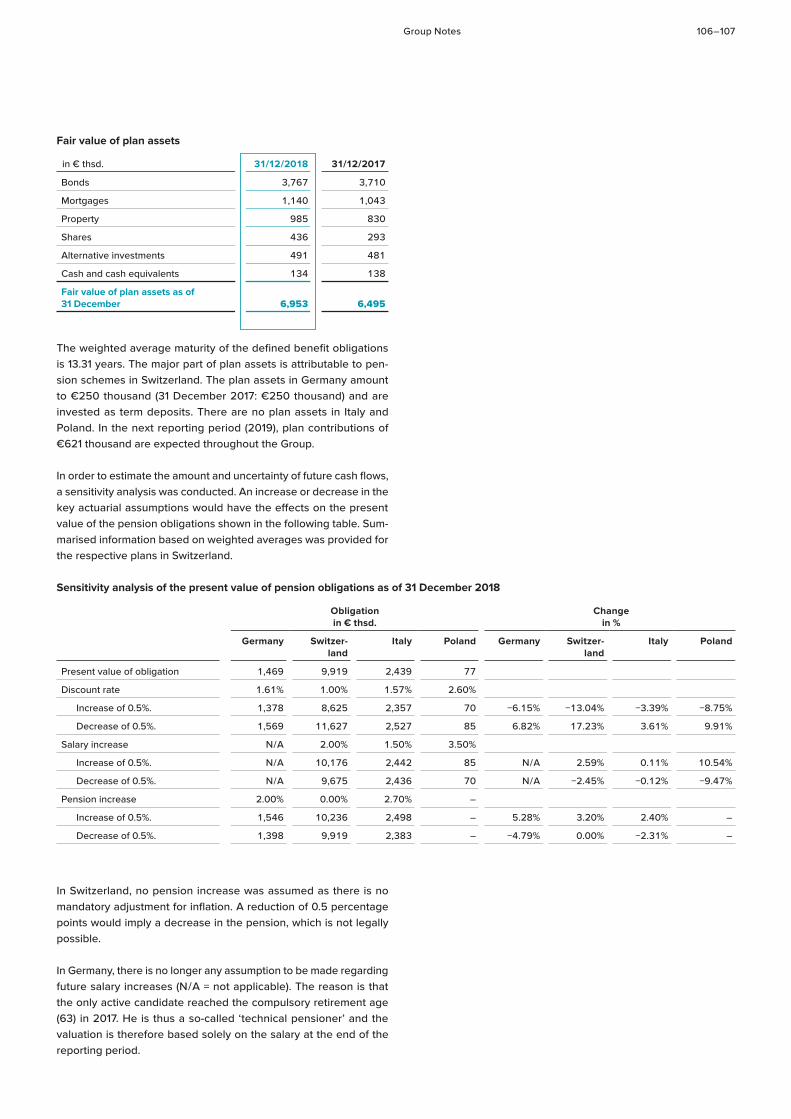
Group Notes 106 – 107
Fair value of plan assets
in € thsd. 31/12/2018 31/12/2017
Bonds 3,767 3,710
Mortgages 1,140 1,043
Property 985 830
Shares 436 293
Alternative investments 491 481
Cash and cash equivalents 134 138
Fair value of plan assets as of 31 December 6,953 6,495
The weighted average maturity of the defined benefit obligations is 13.31 years. The major part of plan assets is attributable to pen-sion schemes in Switzerland. The plan assets in Germany amount to €250 thousand (31 December 2017: €250 thousand) and are invested as term deposits. There are no plan assets in Italy and Poland. In the next reporting period (2019), plan contributions of €621 thousand are expected throughout the Group.
In order to estimate the amount and uncertainty of future cash flows, a sensitivity analysis was conducted. An increase or decrease in the key actuarial assumptions would have the effects on the present value of the pension obligations shown in the following table. Sum-marised information based on weighted averages was provided for the respective plans in Switzerland.
Sensitivity analysis of the present value of pension obligations as of 31 December 2018
Obligation in € thsd.
Change in %
Germany Switzer-land
Italy Poland Germany Switzer-land
Italy Poland
Present value of obligation 1,469 9,919 2,439 77
Discount rate 1.61% 1.00% 1.57% 2.60%
Increase of 0.5%. 1,378 8,625 2,357 70 −6.15% −13.04% −3.39% −8.75%
Decrease of 0.5%. 1,569 11,627 2,527 85 6.82% 17.23% 3.61% 9.91%
Salary increase N / A 2.00% 1.50% 3.50%
Increase of 0.5%. N / A 10,176 2,442 85 N / A 2.59% 0.11% 10.54%
Decrease of 0.5%. N / A 9,675 2,436 70 N / A −2.45% −0.12% −9.47%
Pension increase 2.00% 0.00% 2.70% –
Increase of 0.5%. 1,546 10,236 2,498 – 5.28% 3.20% 2.40% –
Decrease of 0.5%. 1,398 9,919 2,383 – −4.79% 0.00% −2.31% –
In Switzerland, no pension increase was assumed as there is no mandatory adjustment for inflation. A reduction of 0.5 percentage points would imply a decrease in the pension, which is not legally possible.
In Germany, there is no longer any assumption to be made regarding future salary increases (N / A = not applicable). The reason is that the only active candidate reached the compulsory retirement age (63) in 2017. He is thus a so-called ‘technical pensioner’ and the valuation is therefore based solely on the salary at the end of the reporting period.
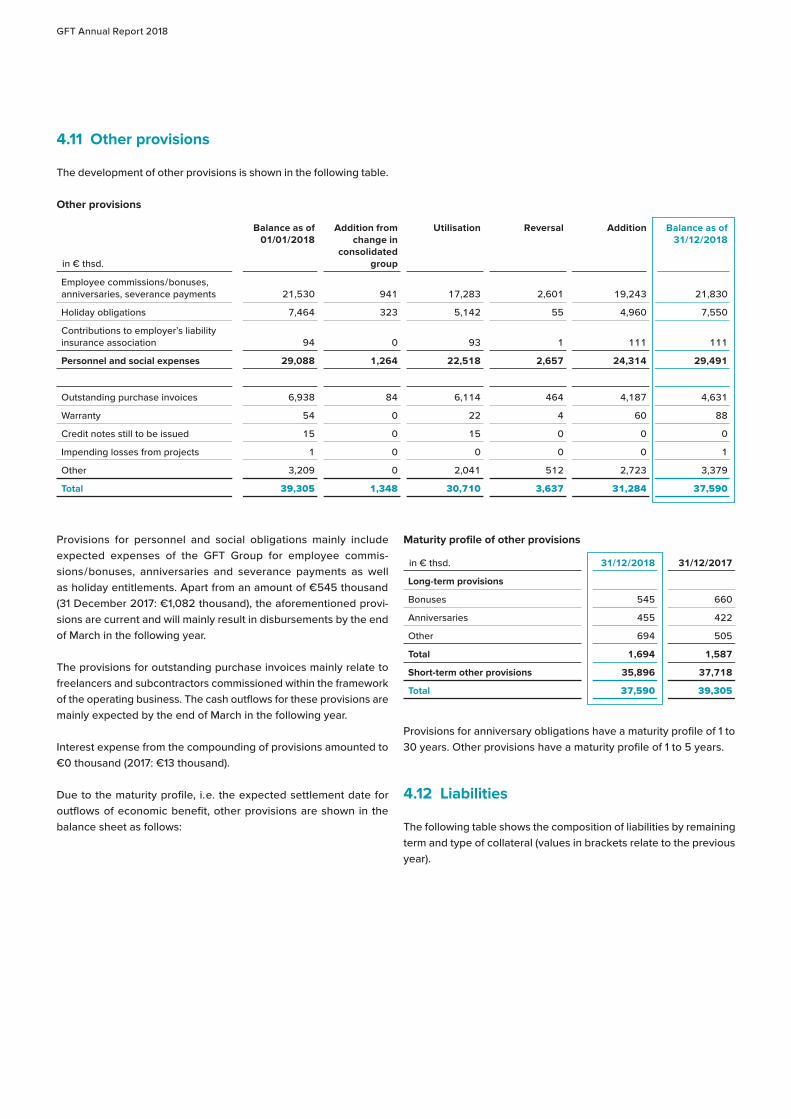
GFT Annual Report 2018
4.11 Other provisions
The development of other provisions is shown in the following table.
Other provisions
in € thsd.
Balance as of 01/01/2018
Addition from change in
consolidated group
Utilisation Reversal Addition Balance as of 31/12/2018
Employee commissions / bonuses, anniversaries, severance payments 21,530 941 17,283 2,601 19,243 21,830
Holiday obligations 7,464 323 5,142 55 4,960 7,550
Contributions to employer’s liability insurance association 94 0 93 1 111 111
Personnel and social expenses 29,088 1,264 22,518 2,657 24,314 29,491
Outstanding purchase invoices 6,938 84 6,114 464 4,187 4,631
Warranty 54 0 22 4 60 88
Credit notes still to be issued 15 0 15 0 0 0
Impending losses from projects 1 0 0 0 0 1
Other 3,209 0 2,041 512 2,723 3,379
Total 39,305 1,348 30,710 3,637 31,284 37,590
Provisions for personnel and social obligations mainly include expected expenses of the GFT Group for employee commis-sions / bonuses, anniversaries and severance payments as well as holiday entitlements. Apart from an amount of €545 thousand (31 December 2017: €1,082 thousand), the aforementioned provi-sions are current and will mainly result in disbursements by the end of March in the following year.
The provisions for outstanding purchase invoices mainly relate to freelancers and subcontractors commissioned within the framework of the operating business. The cash outflows for these provisions are mainly expected by the end of March in the following year.
Interest expense from the compounding of provisions amounted to €0 thousand (2017: €13 thousand).
Due to the maturity profile, i. e. the expected settlement date for outflows of economic benefit, other provisions are shown in the balance sheet as follows:
Maturity profile of other provisions
in € thsd. 31/12/2018 31/12/2017
Long-term provisions
Bonuses 545 660
Anniversaries 455 422
Other 694 505
Total 1,694 1,587
Short-term other provisions 35,896 37,718
Total 37,590 39,305
Provisions for anniversary obligations have a maturity profile of 1 to 30 years. Other provisions have a maturity profile of 1 to 5 years.
4.12 Liabilities
The following table shows the composition of liabilities by remaining term and type of collateral (values in brackets relate to the previous year).
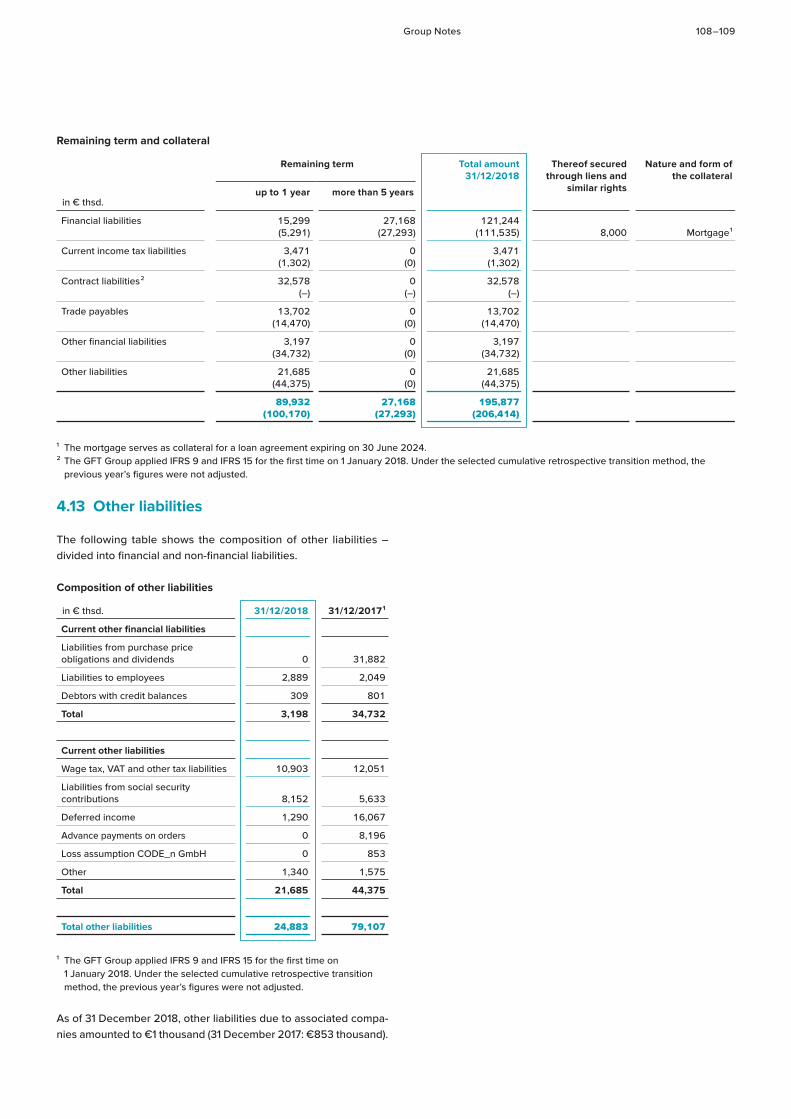
Group Notes 108 – 109
Remaining term and collateral
in € thsd.
Remaining term Total amount31/12/2018
Thereof secured through liens and
similar rights
Nature and form of the collateral
up to 1 year more than 5 years
Financial liabilities 15,299(5,291)
27,168(27,293)
121,244(111,535) 8,000 Mortgage 1
Current income tax liabilities 3,471(1,302)
0(0)
3,471(1,302)
Contract liabilities 2 32,578(–)
0(–)
32,578(–)
Trade payables 13,702(14,470)
0(0)
13,702(14,470)
Other financial liabilities 3,197 (34,732)
0(0)
3,197(34,732)
Other liabilities 21,685(44,375)
0(0)
21,685(44,375)
89,932(100,170)
27,168(27,293)
195,877(206,414)
1 The mortgage serves as collateral for a loan agreement expiring on 30 June 2024.2 The GFT Group applied IFRS 9 and IFRS 15 for the first time on 1 January 2018. Under the selected cumulative retrospective transition method, the
previous year’s figures were not adjusted.
4.13 Other liabilities
The following table shows the composition of other liabilities – divided into financial and non-financial liabilities.
Composition of other liabilities
in € thsd. 31/12/2018 31/12/2017 1
Current other financial liabilities
Liabilities from purchase price obligations and dividends 0 31,882
Liabilities to employees 2,889 2,049
Debtors with credit balances 309 801
Total 3,198 34,732
Current other liabilities
Wage tax, VAT and other tax liabilities 10,903 12,051
Liabilities from social security contributions 8,152 5,633
Deferred income 1,290 16,067
Advance payments on orders 0 8,196
Loss assumption CODE_n GmbH 0 853
Other 1,340 1,575
Total 21,685 44,375
Total other liabilities 24,883 79,107
1 The GFT Group applied IFRS 9 and IFRS 15 for the first time on 1 January 2018. Under the selected cumulative retrospective transition method, the previous year’s figures were not adjusted.
As of 31 December 2018, other liabilities due to associated compa-nies amounted to €1 thousand (31 December 2017: €853 thousand).
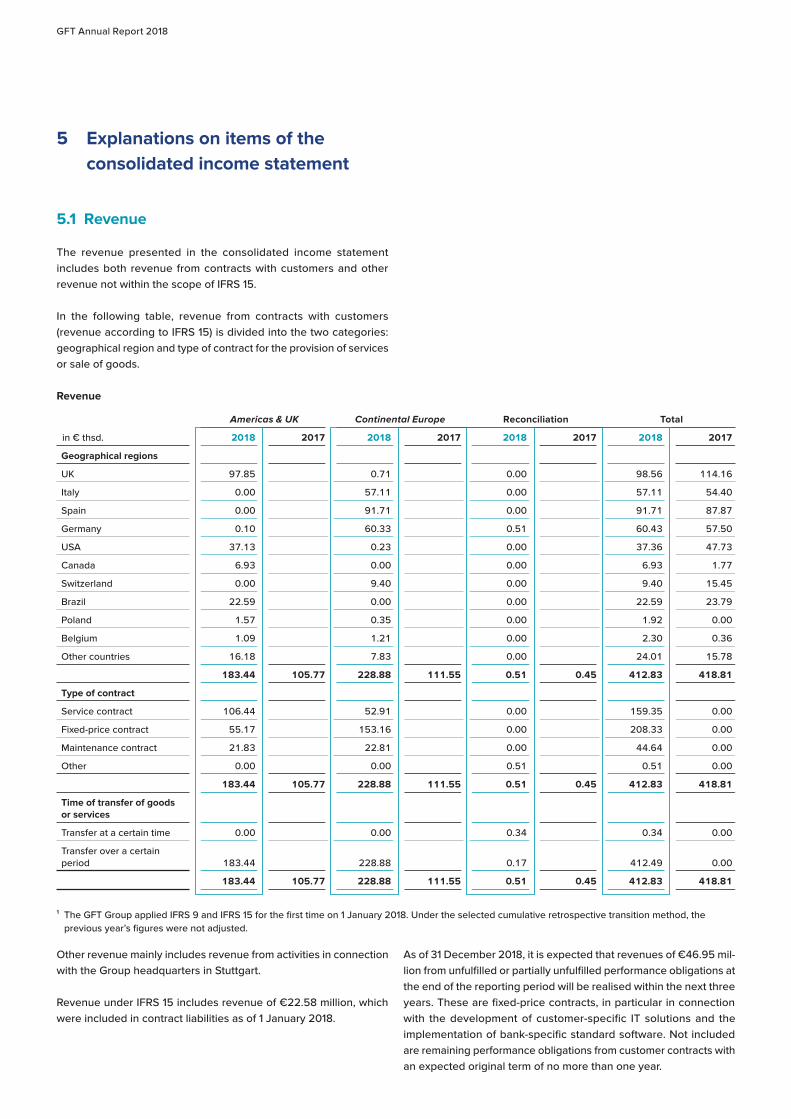
GFT Annual Report 2018
5 Explanations on items of the consolidated income statement
5.1 Revenue
The revenue presented in the consolidated income statement includes both revenue from contracts with customers and other revenue not within the scope of IFRS 15.
In the following table, revenue from contracts with customers (revenue according to IFRS 15) is divided into the two categories: geographical region and type of contract for the provision of services or sale of goods.
Revenue
in € thsd.
Americas & UK Continental Europe Reconciliation Total
2018 2017 2018 2017 2018 2017 2018 2017
Geographical regions
UK 97.85 0.71 0.00 98.56 114.16
Italy 0.00 57.11 0.00 57.11 54.40
Spain 0.00 91.71 0.00 91.71 87.87
Germany 0.10 60.33 0.51 60.43 57.50
USA 37.13 0.23 0.00 37.36 47.73
Canada 6.93 0.00 0.00 6.93 1.77
Switzerland 0.00 9.40 0.00 9.40 15.45
Brazil 22.59 0.00 0.00 22.59 23.79
Poland 1.57 0.35 0.00 1.92 0.00
Belgium 1.09 1.21 0.00 2.30 0.36
Other countries 16.18 7.83 0.00 24.01 15.78
183.44 105.77 228.88 111.55 0.51 0.45 412.83 418.81
Type of contract
Service contract 106.44 52.91 0.00 159.35 0.00
Fixed-price contract 55.17 153.16 0.00 208.33 0.00
Maintenance contract 21.83 22.81 0.00 44.64 0.00
Other 0.00 0.00 0.51 0.51 0.00
183.44 105.77 228.88 111.55 0.51 0.45 412.83 418.81
Time of transfer of goods or services
Transfer at a certain time 0.00 0.00 0.34 0.34 0.00
Transfer over a certain period 183.44 228.88 0.17 412.49 0.00
183.44 105.77 228.88 111.55 0.51 0.45 412.83 418.81
1 The GFT Group applied IFRS 9 and IFRS 15 for the first time on 1 January 2018. Under the selected cumulative retrospective transition method, the previous year’s figures were not adjusted.
Other revenue mainly includes revenue from activities in connection with the Group headquarters in Stuttgart.
Revenue under IFRS 15 includes revenue of €22.58 million, which were included in contract liabilities as of 1 January 2018.
As of 31 December 2018, it is expected that revenues of €46.95 mil-lion from unfulfilled or partially unfulfilled performance obligations at the end of the reporting period will be realised within the next three years. These are fixed-price contracts, in particular in connection with the development of customer-specific IT solutions and the implementation of bank-specific standard software. Not included are remaining performance obligations from customer contracts with an expected original term of no more than one year.
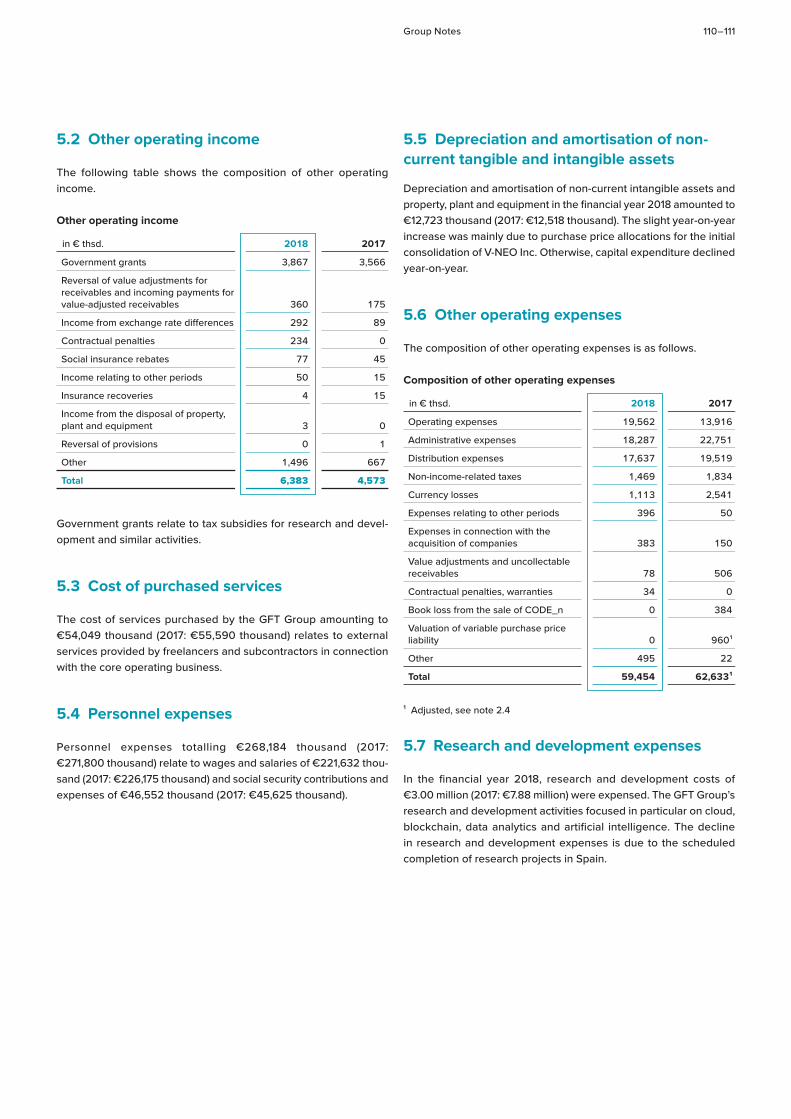
Group Notes 110 – 111
5.2 Other operating income
The following table shows the composition of other operating income.
Other operating income
in € thsd. 2018 2017
Government grants 3,867 3,566
Reversal of value adjustments for receivables and incoming payments for value-adjusted receivables 360 175
Income from exchange rate differences 292 89
Contractual penalties 234 0
Social insurance rebates 77 45
Income relating to other periods 50 15
Insurance recoveries 4 15
Income from the disposal of property, plant and equipment 3 0
Reversal of provisions 0 1
Other 1,496 667
Total 6,383 4,573
Government grants relate to tax subsidies for research and devel-opment and similar activities.
5.3 Cost of purchased services
The cost of services purchased by the GFT Group amounting to €54,049 thousand (2017: €55,590 thousand) relates to external services provided by freelancers and subcontractors in connection with the core operating business.
5.4 Personnel expenses
Personnel expenses totalling €268,184 thousand (2017: €271,800 thousand) relate to wages and salaries of €221,632 thou-sand (2017: €226,175 thousand) and social security contributions and expenses of €46,552 thousand (2017: €45,625 thousand).
5.5 Depreciation and amortisation of non-current tangible and intangible assets
Depreciation and amortisation of non-current intangible assets and property, plant and equipment in the financial year 2018 amounted to €12,723 thousand (2017: €12,518 thousand). The slight year-on-year increase was mainly due to purchase price allocations for the initial consolidation of V-NEO Inc. Otherwise, capital expenditure declined year-on-year.
5.6 Other operating expenses
The composition of other operating expenses is as follows.
Composition of other operating expenses
in € thsd. 2018 2017
Operating expenses 19,562 13,916
Administrative expenses 18,287 22,751
Distribution expenses 17,637 19,519
Non-income-related taxes 1,469 1,834
Currency losses 1,113 2,541
Expenses relating to other periods 396 50
Expenses in connection with the acquisition of companies 383 150
Value adjustments and uncollectable receivables 78 506
Contractual penalties, warranties 34 0
Book loss from the sale of CODE_n 0 384
Valuation of variable purchase price liability 0 960 1
Other 495 22
Total 59,454 62,633 1
1 Adjusted, see note 2.4
5.7 Research and development expenses
In the financial year 2018, research and development costs of €3.00 million (2017: €7.88 million) were expensed. The GFT Group’s research and development activities focused in particular on cloud, blockchain, data analytics and artificial intelligence. The decline in research and development expenses is due to the scheduled completion of research projects in Spain.
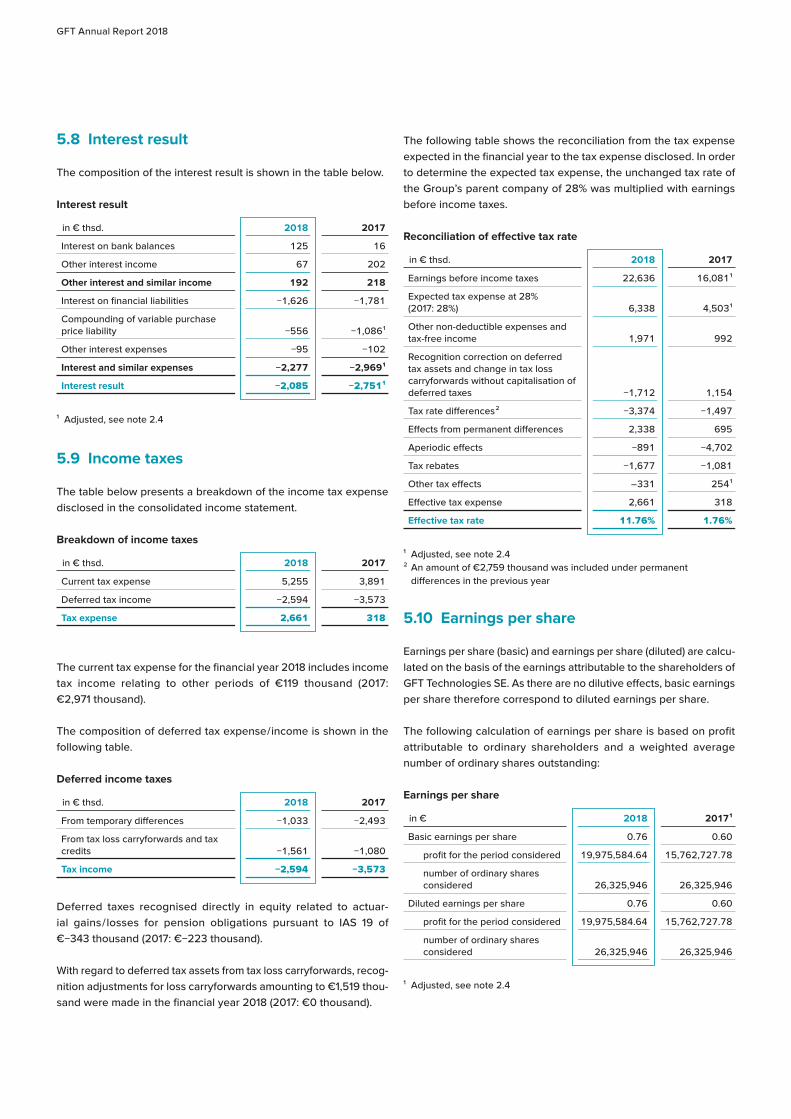
GFT Annual Report 2018
5.8 Interest result
The composition of the interest result is shown in the table below.
Interest result
in € thsd. 2018 2017
Interest on bank balances 125 16
Other interest income 67 202
Other interest and similar income 192 218
Interest on financial liabilities −1,626 −1,781
Compounding of variable purchase price liability −556 −1,086 1
Other interest expenses −95 −102
Interest and similar expenses −2,277 −2,969 1
Interest result −2,085 −2,751 1
1 Adjusted, see note 2.4
5.9 Income taxes
The table below presents a breakdown of the income tax expense disclosed in the consolidated income statement.
Breakdown of income taxes
in € thsd. 2018 2017
Current tax expense 5,255 3,891
Deferred tax income −2,594 −3,573
Tax expense 2,661 318
The current tax expense for the financial year 2018 includes income tax income relating to other periods of €119 thousand (2017: €2,971 thousand).
The composition of deferred tax expense / income is shown in the following table.
Deferred income taxes
in € thsd. 2018 2017
From temporary differences −1,033 −2,493
From tax loss carryforwards and tax credits −1,561 −1,080
Tax income −2,594 −3,573
Deferred taxes recognised directly in equity related to actuar-ial gains / losses for pension obligations pursuant to IAS 19 of €−343 thousand (2017: €−223 thousand).
With regard to deferred tax assets from tax loss carryforwards, recog-nition adjustments for loss carryforwards amounting to €1,519 thou-sand were made in the financial year 2018 (2017: €0 thousand).
The following table shows the reconciliation from the tax expense expected in the financial year to the tax expense disclosed. In order to determine the expected tax expense, the unchanged tax rate of the Group’s parent company of 28% was multiplied with earnings before income taxes.
Reconciliation of effective tax rate
in € thsd. 2018 2017
Earnings before income taxes 22,636 16,081 1
Expected tax expense at 28% (2017: 28%) 6,338 4,503 1
Other non-deductible expenses and tax-free income 1,971 992
Recognition correction on deferred tax assets and change in tax loss carryforwards without capitalisation of deferred taxes −1,712 1,154
Tax rate differences 2 −3,374 −1,497
Effects from permanent differences 2,338 695
Aperiodic effects −891 −4,702
Tax rebates −1,677 −1,081
Other tax effects –331 254 1
Effective tax expense 2,661 318
Effective tax rate 11.76% 1.76%
1 Adjusted, see note 2.42 An amount of €2,759 thousand was included under permanent
differences in the previous year
5.10 Earnings per share
Earnings per share (basic) and earnings per share (diluted) are calcu-lated on the basis of the earnings attributable to the shareholders of GFT Technologies SE. As there are no dilutive effects, basic earnings per share therefore correspond to diluted earnings per share.
The following calculation of earnings per share is based on profit attributable to ordinary shareholders and a weighted average number of ordinary shares outstanding:
Earnings per share
in € 2018 2017 1
Basic earnings per share 0.76 0.60
profit for the period considered 19,975,584.64 15,762,727.78
number of ordinary shares considered 26,325,946 26,325,946
Diluted earnings per share 0.76 0.60
profit for the period considered 19,975,584.64 15,762,727.78
number of ordinary shares considered 26,325,946 26,325,946
1 Adjusted, see note 2.4
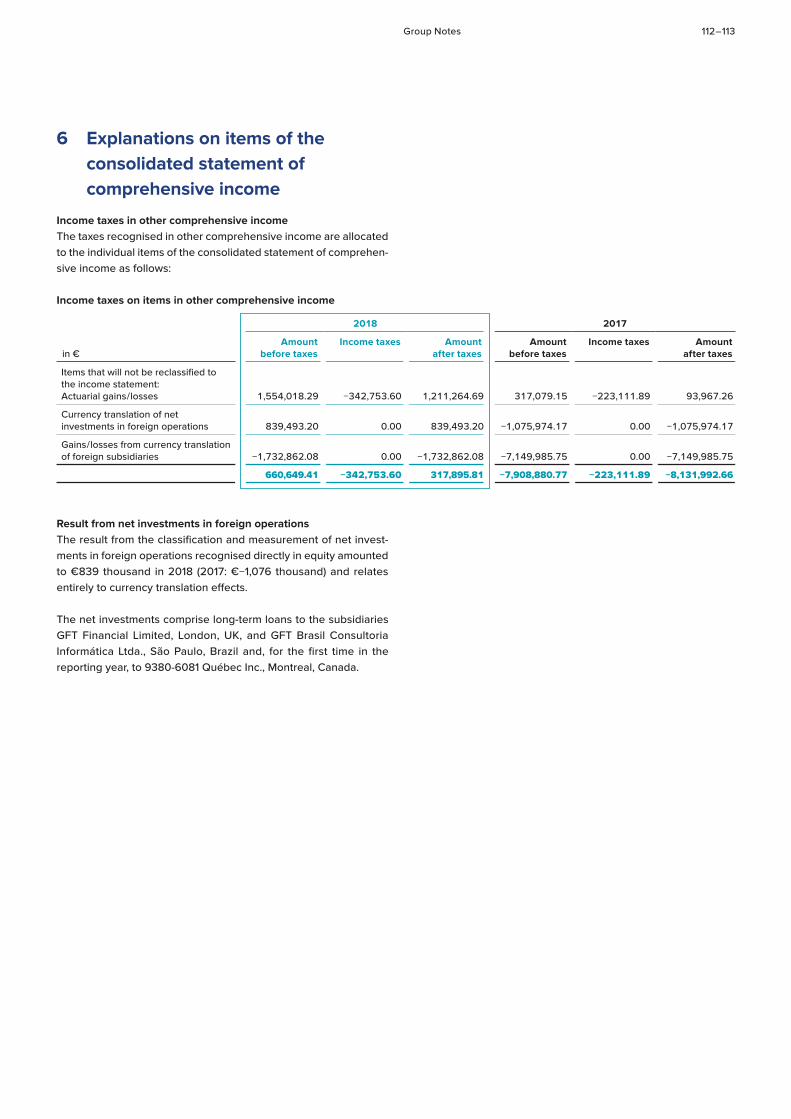
Group Notes 112 – 113
6 Explanations on items of the consolidated statement of comprehensive income
Income taxes in other comprehensive incomeThe taxes recognised in other comprehensive income are allocated to the individual items of the consolidated statement of comprehen-sive income as follows:
Income taxes on items in other comprehensive income
in €
2018 2017
Amount before taxes
Income taxes Amount after taxes
Amount before taxes
Income taxes Amount after taxes
Items that will not be reclassified to the income statement:Actuarial gains / losses 1,554,018.29 −342,753.60 1,211,264.69 317,079.15 −223,111.89 93,967.26
Currency translation of net investments in foreign operations 839,493.20 0.00 839,493.20 −1,075,974.17 0.00 −1,075,974.17
Gains / losses from currency translation of foreign subsidiaries −1,732,862.08 0.00 −1,732,862.08 −7,149,985.75 0.00 −7,149,985.75
660,649.41 −342,753.60 317,895.81 −7,908,880.77 −223,111.89 −8,131,992.66
Result from net investments in foreign operationsThe result from the classification and measurement of net invest-ments in foreign operations recognised directly in equity amounted to €839 thousand in 2018 (2017: €−1,076 thousand) and relates entirely to currency translation effects.
The net investments comprise long-term loans to the subsidiaries GFT Financial Limited, London, UK, and GFT Brasil Consultoria Informática Ltda., São Paulo, Brazil and, for the first time in the reporting year, to 9380-6081 Québec Inc., Montreal, Canada.
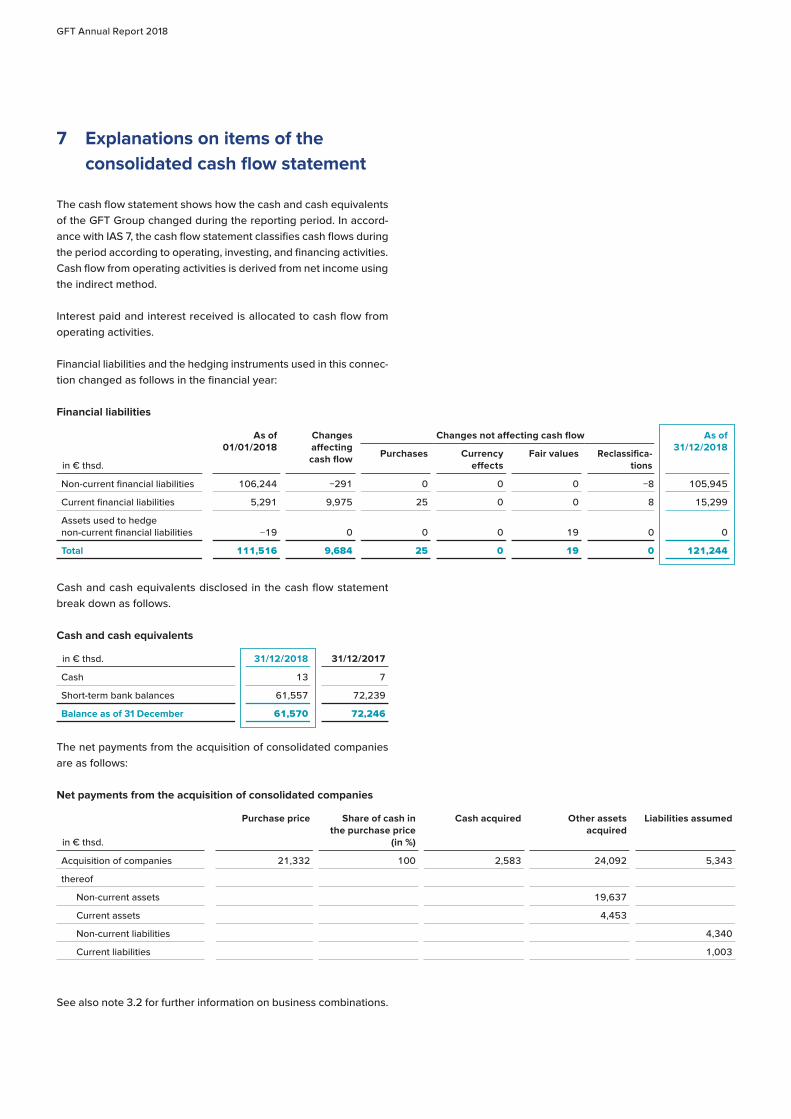
GFT Annual Report 2018
7 Explanations on items of the consolidated cash flow statement
The cash flow statement shows how the cash and cash equivalents of the GFT Group changed during the reporting period. In accord-ance with IAS 7, the cash flow statement classifies cash flows during the period according to operating, investing, and financing activities. Cash flow from operating activities is derived from net income using the indirect method.
Interest paid and interest received is allocated to cash flow from operating activities.
Financial liabilities and the hedging instruments used in this connec-tion changed as follows in the financial year:
Financial liabilities
in € thsd.
As of 01/01/2018
Changes affecting cash flow
Changes not affecting cash flow As of 31/12/2018
Purchases Currency effects
Fair values Reclassifica-tions
Non-current financial liabilities 106,244 −291 0 0 0 −8 105,945
Current financial liabilities 5,291 9,975 25 0 0 8 15,299
Assets used to hedge non-current financial liabilities −19 0 0 0 19 0 0
Total 111,516 9,684 25 0 19 0 121,244
Cash and cash equivalents disclosed in the cash flow statement break down as follows.
Cash and cash equivalents
in € thsd. 31/12/2018 31/12/2017
Cash 13 7
Short-term bank balances 61,557 72,239
Balance as of 31 December 61,570 72,246
The net payments from the acquisition of consolidated companies are as follows:
Net payments from the acquisition of consolidated companies
in € thsd.
Purchase price Share of cash in the purchase price
(in %)
Cash acquired Other assets acquired
Liabilities assumed
Acquisition of companies 21,332 100 2,583 24,092 5,343
thereof
Non-current assets 19,637
Current assets 4,453
Non-current liabilities 4,340
Current liabilities 1,003
See also note 3.2 for further information on business combinations.
Group Notes 114 – 115
8 Segment reporting
8.1 General information
The GFT Group has two reporting segments. As the chief operating decision-makers responsible for assessing the company’s results of operations and allocating resources, the Managing Directors regularly assess the business activities of these two segments.
The Americas & UK segment comprises operating companies in the following countries:
■ Brazil ■ Costa Rica ■ UK ■ Canada ■ Mexico ■ USA
The Continental Europe segment comprises operating companies in the following countries:
■ Belgium ■ Germany ■ France ■ Italy ■ Poland ■ Switzerland ■ Spain
Segment reporting complies with the accounting principles set out in IFRS 8 and is based on the Group’s internal controlling and reporting structures. The GFT Group measures the success of its segments on the basis of revenue and EBT. Segment revenue and earnings also include transactions between the business segments. Transactions between segments are conducted at market prices and on an arm’s-length basis.
The types of services with which the reporting segments generate their income are all activities related to IT services.
The Managing Directors do not receive regular information on segment assets, segment liabilities or the capital expenditure of each segment.
Detailed information on the business segments for the financial years 2018 and 2017 is presented in annex 6d to the notes to the consolidated financial statements.
8.2 Reconciliation
The reconciliation discloses items which per definition are not components of the segments. It also includes non-allocated items of Group HQ, e. g. from centrally managed issues, or revenue which only occasionally occurs for company activities. Business transac-tions between the segments are also eliminated in the reconciliation. The reconciliation of segment figures is as follows:
Reconciliation of segment figures
in € million 2018 2017
Total segment revenue 480.04 495.84
Elimination of inter-segment revenue −67.71 −77.96
Occasionally occurring revenue 0.50 0.93
Group revenue 412.83 418.81
Total segment earnings (EBT) 24.05 16.23 1
Non-allocated expenses / income of Group HQ −0.91 1.15
Other −0.50 −1.30
Group net income before taxes 22.64 16.08 1
1 Adjusted, see note 2.4
8.3 Geographical information
The following table shows the revenue of the GFT Group as well as other non-current assets and property, plant and equipment, broken down by the company’s country of domicile. This geographical infor-mation discloses segment revenue based on customer location and segment assets based on the locations of assets.
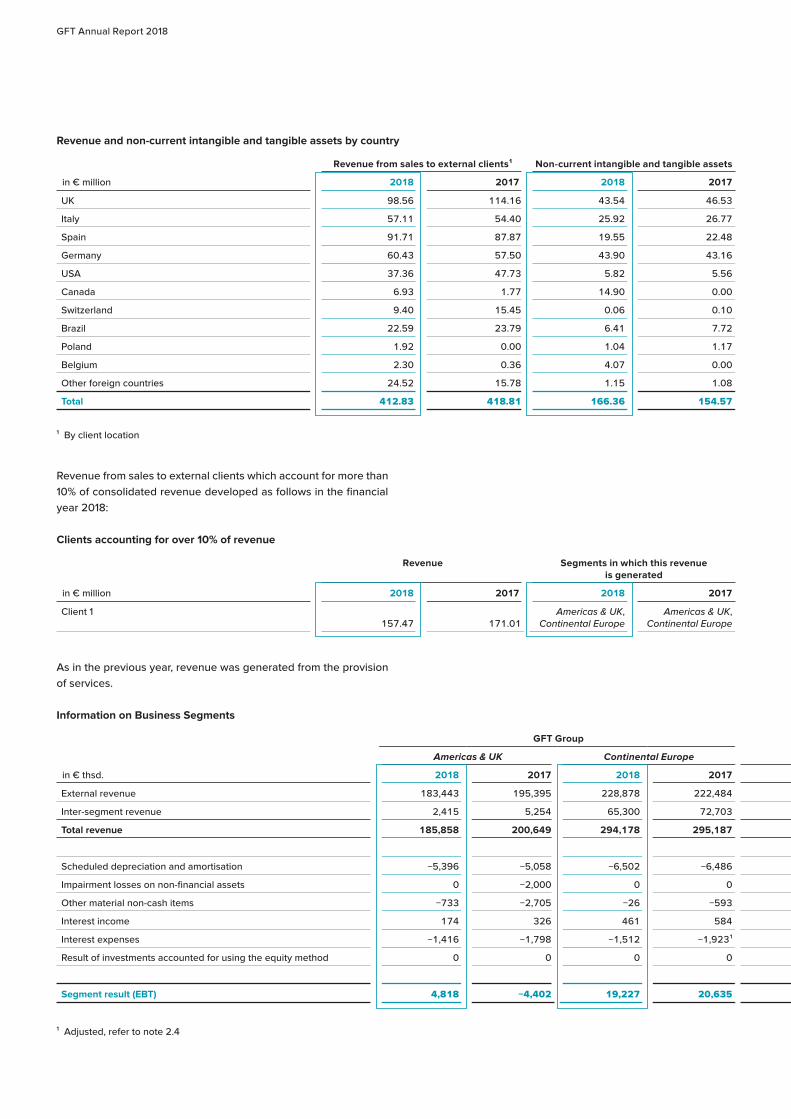
GFT Annual Report 2018
Revenue and non-current intangible and tangible assets by country
in € million
Revenue from sales to external clients 1 Non-current intangible and tangible assets
2018 2017 2018 2017
UK 98.56 114.16 43.54 46.53
Italy 57.11 54.40 25.92 26.77
Spain 91.71 87.87 19.55 22.48
Germany 60.43 57.50 43.90 43.16
USA 37.36 47.73 5.82 5.56
Canada 6.93 1.77 14.90 0.00
Switzerland 9.40 15.45 0.06 0.10
Brazil 22.59 23.79 6.41 7.72
Poland 1.92 0.00 1.04 1.17
Belgium 2.30 0.36 4.07 0.00
Other foreign countries 24.52 15.78 1.15 1.08
Total 412.83 418.81 166.36 154.57
1 By client location
Revenue from sales to external clients which account for more than 10% of consolidated revenue developed as follows in the financial year 2018:
Clients accounting for over 10% of revenue
in € million
Revenue Segments in which this revenue is generated
2018 2017 2018 2017
Client 1157.47 171.01
Americas & UK, Continental Europe
Americas & UK, Continental Europe
As in the previous year, revenue was generated from the provision of services.
Information on Business Segments
in € thsd.
GFT Group Total Reconciliation GFT Group
Americas & UK Continental Europe
2018 2017 2018 2017 2018 2017 2018 2017 2018 2017
External revenue 183,443 195,395 228,878 222,484 412,321 417,879 504 932 412,825 418,811
Inter-segment revenue 2,415 5,254 65,300 72,703 67,715 77,957 −67,715 −77,957 0 0
Total revenue 185,858 200,649 294,178 295,187 480,036 495,836 −67,211 −77,025 412,825 418,811
Scheduled depreciation and amortisation −5,396 −5,058 −6,502 −6,486 −11,898 −11,544 −825 −974 −12,723 −12,518
Impairment losses on non-financial assets 0 −2,000 0 0 0 −2,000 0 0 0 −2,000
Other material non-cash items −733 −2,705 −26 −593 −759 −3,298 1,323 5,085 564 1,787
Interest income 174 326 461 584 635 910 −443 −692 192 218
Interest expenses −1,416 −1,798 −1,512 −1,923 1 −2,928 −3,721 1 651 752 −2,277 −2,969 1
Result of investments accounted for using the equity method 0 0 0 0 0 0 −75 −12 −75 −12
Segment result (EBT) 4,818 −4,402 19,227 20,635 24,045 16,233 1 −1,408 −152 22,637 16,081 1
1 Adjusted, refer to note 2.4
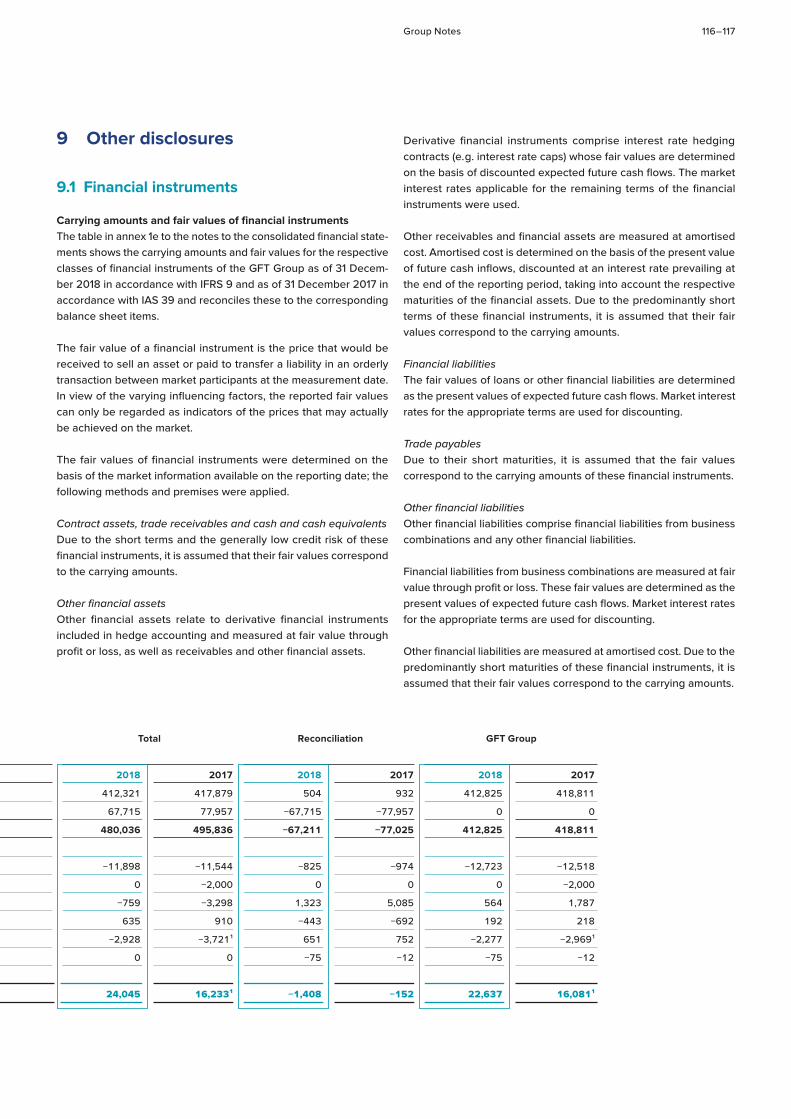
Group Notes 116 – 117
in € thsd.
GFT Group Total Reconciliation GFT Group
Americas & UK Continental Europe
2018 2017 2018 2017 2018 2017 2018 2017 2018 2017
External revenue 183,443 195,395 228,878 222,484 412,321 417,879 504 932 412,825 418,811
Inter-segment revenue 2,415 5,254 65,300 72,703 67,715 77,957 −67,715 −77,957 0 0
Total revenue 185,858 200,649 294,178 295,187 480,036 495,836 −67,211 −77,025 412,825 418,811
Scheduled depreciation and amortisation −5,396 −5,058 −6,502 −6,486 −11,898 −11,544 −825 −974 −12,723 −12,518
Impairment losses on non-financial assets 0 −2,000 0 0 0 −2,000 0 0 0 −2,000
Other material non-cash items −733 −2,705 −26 −593 −759 −3,298 1,323 5,085 564 1,787
Interest income 174 326 461 584 635 910 −443 −692 192 218
Interest expenses −1,416 −1,798 −1,512 −1,923 1 −2,928 −3,721 1 651 752 −2,277 −2,969 1
Result of investments accounted for using the equity method 0 0 0 0 0 0 −75 −12 −75 −12
Segment result (EBT) 4,818 −4,402 19,227 20,635 24,045 16,233 1 −1,408 −152 22,637 16,081 1
1 Adjusted, refer to note 2.4
9 Other disclosures
9.1 Financial instruments
Carrying amounts and fair values of financial instrumentsThe table in annex 1e to the notes to the consolidated financial state-ments shows the carrying amounts and fair values for the respective classes of financial instruments of the GFT Group as of 31 Decem-ber 2018 in accordance with IFRS 9 and as of 31 December 2017 in accordance with IAS 39 and reconciles these to the corresponding balance sheet items.
The fair value of a financial instrument is the price that would be received to sell an asset or paid to transfer a liability in an orderly transaction between market participants at the measurement date. In view of the varying influencing factors, the reported fair values can only be regarded as indicators of the prices that may actually be achieved on the market.
The fair values of financial instruments were determined on the basis of the market information available on the reporting date; the following methods and premises were applied.
Contract assets, trade receivables and cash and cash equivalents Due to the short terms and the generally low credit risk of these financial instruments, it is assumed that their fair values correspond to the carrying amounts.
Other financial assetsOther financial assets relate to derivative financial instruments included in hedge accounting and measured at fair value through profit or loss, as well as receivables and other financial assets.
Derivative financial instruments comprise interest rate hedging contracts (e. g. interest rate caps) whose fair values are determined on the basis of discounted expected future cash flows. The market interest rates applicable for the remaining terms of the financial instruments were used.
Other receivables and financial assets are measured at amortised cost. Amortised cost is determined on the basis of the present value of future cash inflows, discounted at an interest rate prevailing at the end of the reporting period, taking into account the respective maturities of the financial assets. Due to the predominantly short terms of these financial instruments, it is assumed that their fair values correspond to the carrying amounts.
Financial liabilitiesThe fair values of loans or other financial liabilities are determined as the present values of expected future cash flows. Market interest rates for the appropriate terms are used for discounting.
Trade payablesDue to their short maturities, it is assumed that the fair values correspond to the carrying amounts of these financial instruments.
Other financial liabilitiesOther financial liabilities comprise financial liabilities from business combinations and any other financial liabilities.
Financial liabilities from business combinations are measured at fair value through profit or loss. These fair values are determined as the present values of expected future cash flows. Market interest rates for the appropriate terms are used for discounting.
Other financial liabilities are measured at amortised cost. Due to the predominantly short maturities of these financial instruments, it is assumed that their fair values correspond to the carrying amounts.
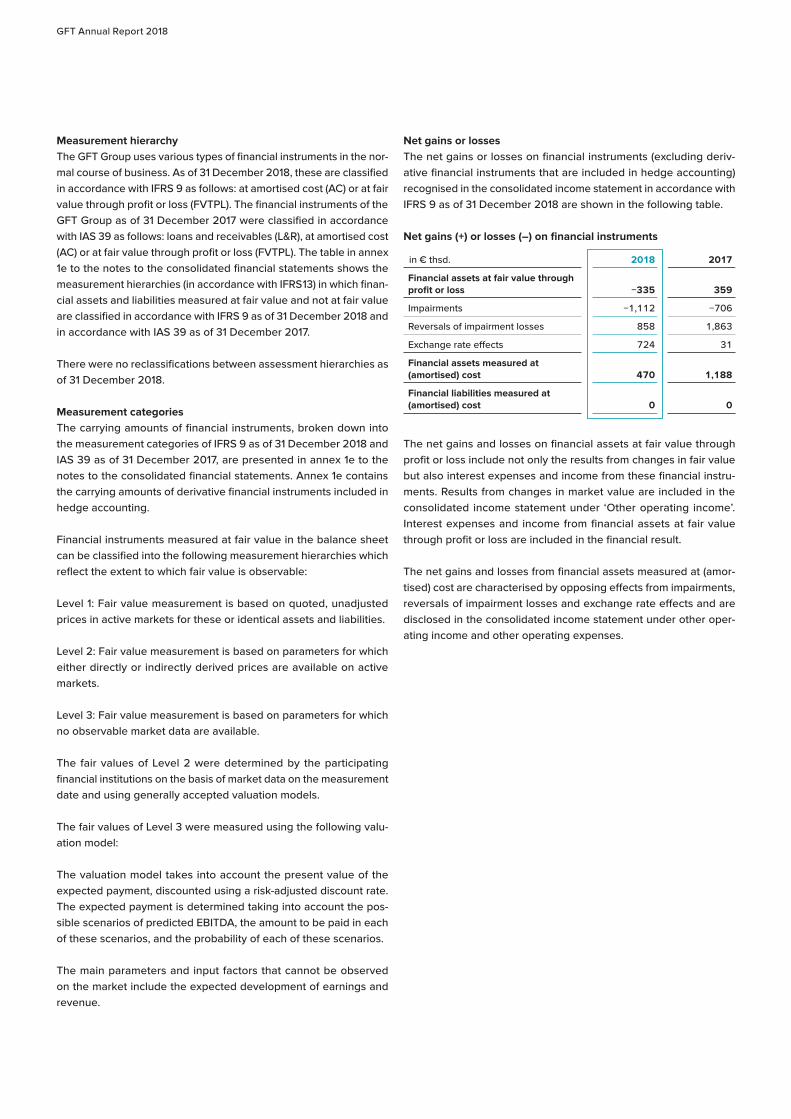
GFT Annual Report 2018
Measurement hierarchyThe GFT Group uses various types of financial instruments in the nor-mal course of business. As of 31 December 2018, these are classified in accordance with IFRS 9 as follows: at amortised cost (AC) or at fair value through profit or loss (FVTPL). The financial instruments of the GFT Group as of 31 December 2017 were classified in accordance with IAS 39 as follows: loans and receivables (L&R), at amortised cost (AC) or at fair value through profit or loss (FVTPL). The table in annex 1e to the notes to the consolidated financial statements shows the measurement hierarchies (in accordance with IFRS 13) in which finan-cial assets and liabilities measured at fair value and not at fair value are classified in accordance with IFRS 9 as of 31 December 2018 and in accordance with IAS 39 as of 31 December 2017.
There were no reclassifications between assessment hierarchies as of 31 December 2018.
Measurement categoriesThe carrying amounts of financial instruments, broken down into the measurement categories of IFRS 9 as of 31 December 2018 and IAS 39 as of 31 December 2017, are presented in annex 1e to the notes to the consolidated financial statements. Annex 1e contains the carrying amounts of derivative financial instruments included in hedge accounting.
Financial instruments measured at fair value in the balance sheet can be classified into the following measurement hierarchies which reflect the extent to which fair value is observable:
Level 1: Fair value measurement is based on quoted, unadjusted prices in active markets for these or identical assets and liabilities.
Level 2: Fair value measurement is based on parameters for which either directly or indirectly derived prices are available on active markets.
Level 3: Fair value measurement is based on parameters for which no observable market data are available.
The fair values of Level 2 were determined by the participating financial institutions on the basis of market data on the measurement date and using generally accepted valuation models.
The fair values of Level 3 were measured using the following valu-ation model:
The valuation model takes into account the present value of the expected payment, discounted using a risk-adjusted discount rate. The expected payment is determined taking into account the pos-sible scenarios of predicted EBITDA, the amount to be paid in each of these scenarios, and the probability of each of these scenarios.
The main parameters and input factors that cannot be observed on the market include the expected development of earnings and revenue.
Net gains or lossesThe net gains or losses on financial instruments (excluding deriv-ative financial instruments that are included in hedge accounting) recognised in the consolidated income statement in accordance with IFRS 9 as of 31 December 2018 are shown in the following table.
Net gains (+) or losses (–) on financial instruments
in € thsd. 2018 2017
Financial assets at fair value through profit or loss −335 359
Impairments −1,112 −706
Reversals of impairment losses 858 1,863
Exchange rate effects 724 31
Financial assets measured at (amortised) cost 470 1,188
Financial liabilities measured at (amortised) cost 0 0
The net gains and losses on financial assets at fair value through profit or loss include not only the results from changes in fair value but also interest expenses and income from these financial instru-ments. Results from changes in market value are included in the consolidated income statement under ‘Other operating income’. Interest expenses and income from financial assets at fair value through profit or loss are included in the financial result.
The net gains and losses from financial assets measured at (amor-tised) cost are characterised by opposing effects from impairments, reversals of impairment losses and exchange rate effects and are disclosed in the consolidated income statement under other oper-ating income and other operating expenses.
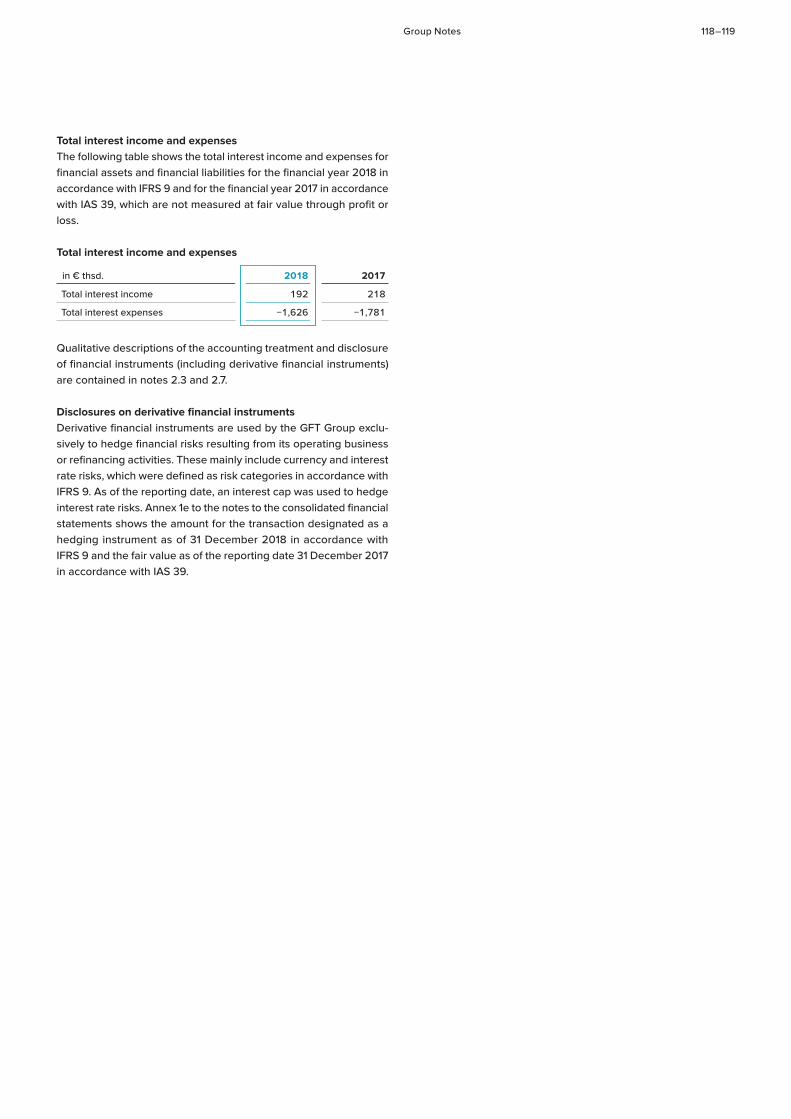
Group Notes 118 – 119
Total interest income and expensesThe following table shows the total interest income and expenses for financial assets and financial liabilities for the financial year 2018 in accordance with IFRS 9 and for the financial year 2017 in accordance with IAS 39, which are not measured at fair value through profit or loss.
Total interest income and expenses
in € thsd. 2018 2017
Total interest income 192 218
Total interest expenses −1,626 −1,781
Qualitative descriptions of the accounting treatment and disclosure of financial instruments (including derivative financial instruments) are contained in notes 2.3 and 2.7.
Disclosures on derivative financial instrumentsDerivative financial instruments are used by the GFT Group exclu-sively to hedge financial risks resulting from its operating business or refinancing activities. These mainly include currency and interest rate risks, which were defined as risk categories in accordance with IFRS 9. As of the reporting date, an interest cap was used to hedge interest rate risks. Annex 1e to the notes to the consolidated financial statements shows the amount for the transaction designated as a hedging instrument as of 31 December 2018 in accordance with IFRS 9 and the fair value as of the reporting date 31 December 2017 in accordance with IAS 39.
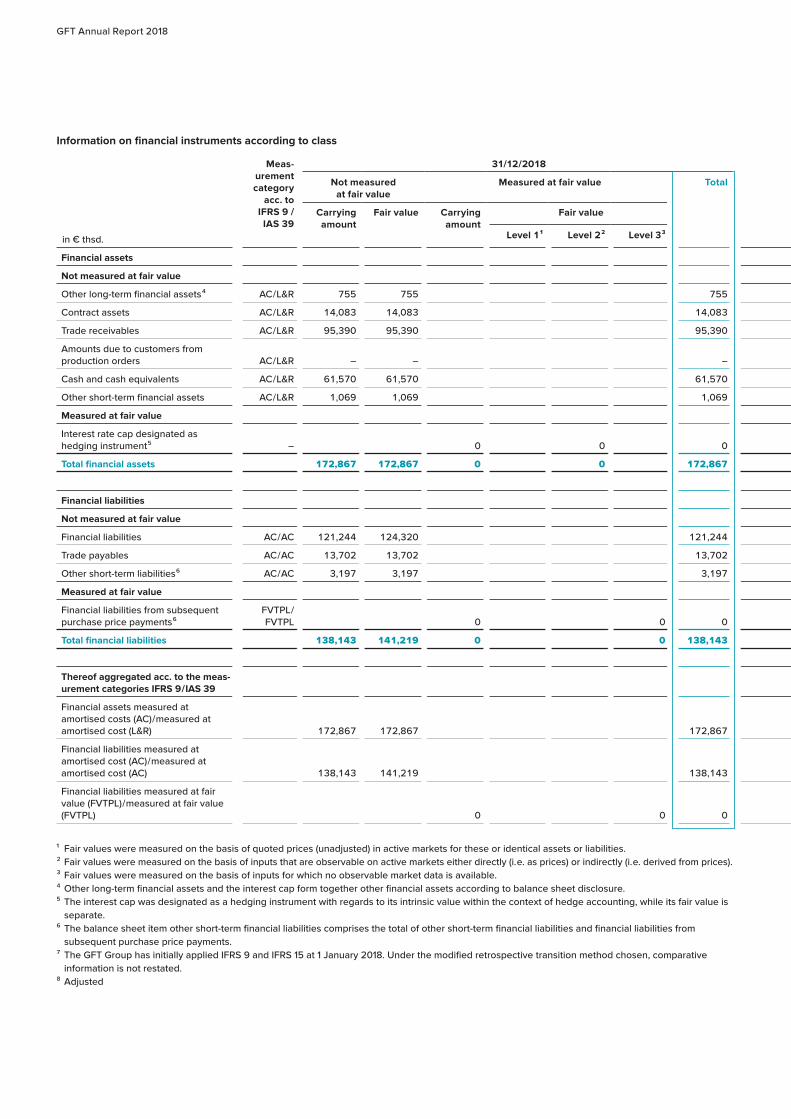
GFT Annual Report 2018
Information on financial instruments according to class
in € thsd.
Meas-urement category
acc. to IFRS 9 / IAS 39
31/12/2018 31/12/2017
Not measured at fair value
Measured at fair value Total Not measured at fair value
Measured at fair value Total
Carrying amount
Fair value Carrying amount
Fair value Carrying amount
Fair value Carrying amount
Fair value
Level 1 1 Level 2 2 Level 3 3 Level 1 1 Level 2 2 Level 3 3
Financial assets
Not measured at fair value
Other long-term financial assets 4 AC / L&R 755 755 755 632 632 8 632 8
Contract assets AC / L&R 14,083 14,083 14,083 – – –
Trade receivables AC / L&R 95,390 95,390 95,390 94,699 94,699 94,699
Amounts due to customers from production orders AC / L&R – – – 18,782 18,782 18,782
Cash and cash equivalents AC / L&R 61,570 61,570 61,570 72,246 72,246 72,246
Other short-term financial assets AC / L&R 1,069 1,069 1,069 2,202 2,202 2,202
Measured at fair value
Interest rate cap designated as hedging instrument 5 – 0 0 0 19 19 19
Total financial assets 172,867 172,867 0 0 172,867 188,561 188,561 19 19 188,580
Financial liabilities
Not measured at fair value
Financial liabilities AC / AC 121,244 124,320 121,244 111,535 115,426
Trade payables AC / AC 13,702 13,702 13,702 14,469 14,469
Other short-term liabilities 6 AC / AC 3,197 3,197 3,197 2,850 2,850
Measured at fair value
Financial liabilities from subsequent purchase price payments 6
FVTPL / FVTPL 0 0 0 31,882 31,882 31,882
Total financial liabilities 138,143 141,219 0 0 138,143 128,854 132,745 31,882 31,882 160,736
Thereof aggregated acc. to the meas-urement categories IFRS 9 / IAS 39
Financial assets measured at amortised costs (AC) / measured at amortised cost (L&R) 172,867 172,867 172,867 188,561 188,561 188,561
Financial liabilities measured at amortised cost (AC) / measured at amortised cost (AC) 138,143 141,219 138,143 128,854 132,745 128,854
Financial liabilities measured at fair value (FVTPL) / measured at fair value (FVTPL) 0 0 0 31,882 31,882 31,882
1 Fair values were measured on the basis of quoted prices (unadjusted) in active markets for these or identical assets or liabilities.2 Fair values were measured on the basis of inputs that are observable on active markets either directly (i. e. as prices) or indirectly (i. e. derived from prices).3 Fair values were measured on the basis of inputs for which no observable market data is available.4 Other long-term financial assets and the interest cap form together other financial assets according to balance sheet disclosure. 5 The interest cap was designated as a hedging instrument with regards to its intrinsic value within the context of hedge accounting, while its fair value is
separate.6 The balance sheet item other short-term financial liabilities comprises the total of other short-term financial liabilities and financial liabilities from
subsequent purchase price payments.7 The GFT Group has initially applied IFRS 9 and IFRS 15 at 1 January 2018. Under the modified retrospective transition method chosen, comparative
information is not restated.8 Adjusted
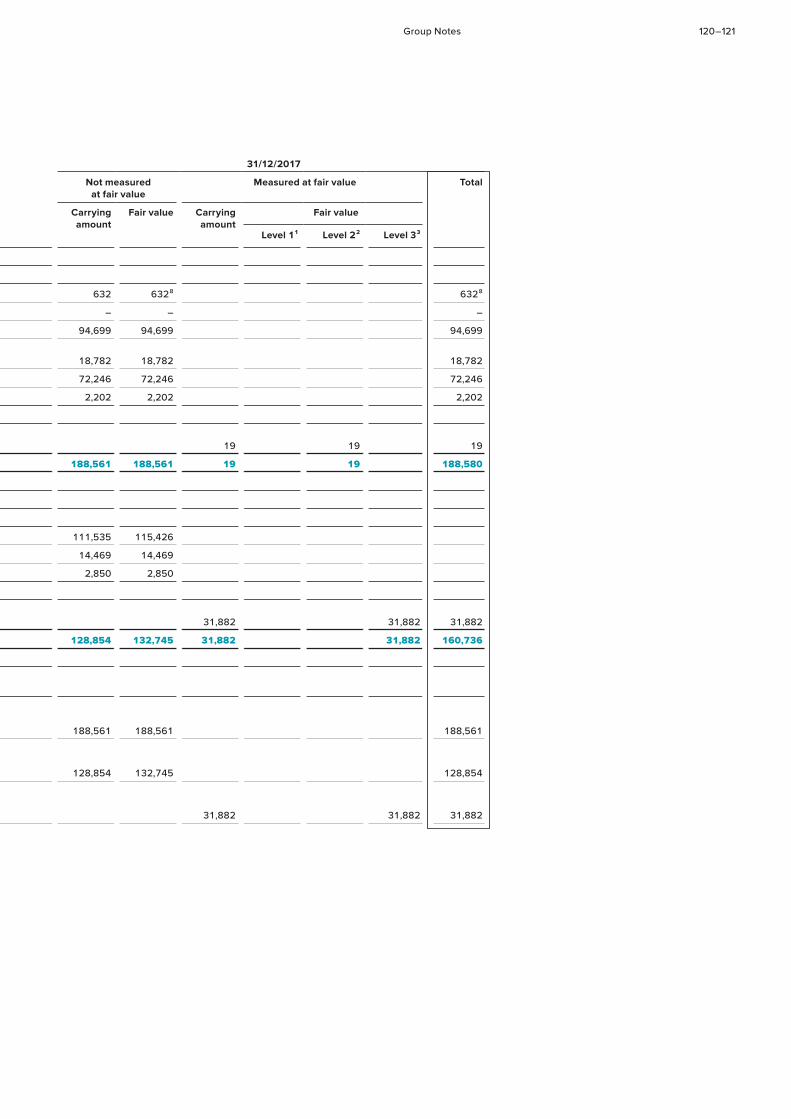
Group Notes 120 – 121
in € thsd.
Meas-urement category
acc. to IFRS 9 / IAS 39
31/12/2018 31/12/2017
Not measured at fair value
Measured at fair value Total Not measured at fair value
Measured at fair value Total
Carrying amount
Fair value Carrying amount
Fair value Carrying amount
Fair value Carrying amount
Fair value
Level 1 1 Level 2 2 Level 3 3 Level 1 1 Level 2 2 Level 3 3
Financial assets
Not measured at fair value
Other long-term financial assets 4 AC / L&R 755 755 755 632 632 8 632 8
Contract assets AC / L&R 14,083 14,083 14,083 – – –
Trade receivables AC / L&R 95,390 95,390 95,390 94,699 94,699 94,699
Amounts due to customers from production orders AC / L&R – – – 18,782 18,782 18,782
Cash and cash equivalents AC / L&R 61,570 61,570 61,570 72,246 72,246 72,246
Other short-term financial assets AC / L&R 1,069 1,069 1,069 2,202 2,202 2,202
Measured at fair value
Interest rate cap designated as hedging instrument 5 – 0 0 0 19 19 19
Total financial assets 172,867 172,867 0 0 172,867 188,561 188,561 19 19 188,580
Financial liabilities
Not measured at fair value
Financial liabilities AC / AC 121,244 124,320 121,244 111,535 115,426
Trade payables AC / AC 13,702 13,702 13,702 14,469 14,469
Other short-term liabilities 6 AC / AC 3,197 3,197 3,197 2,850 2,850
Measured at fair value
Financial liabilities from subsequent purchase price payments 6
FVTPL / FVTPL 0 0 0 31,882 31,882 31,882
Total financial liabilities 138,143 141,219 0 0 138,143 128,854 132,745 31,882 31,882 160,736
Thereof aggregated acc. to the meas-urement categories IFRS 9 / IAS 39
Financial assets measured at amortised costs (AC) / measured at amortised cost (L&R) 172,867 172,867 172,867 188,561 188,561 188,561
Financial liabilities measured at amortised cost (AC) / measured at amortised cost (AC) 138,143 141,219 138,143 128,854 132,745 128,854
Financial liabilities measured at fair value (FVTPL) / measured at fair value (FVTPL) 0 0 0 31,882 31,882 31,882
1 Fair values were measured on the basis of quoted prices (unadjusted) in active markets for these or identical assets or liabilities.2 Fair values were measured on the basis of inputs that are observable on active markets either directly (i. e. as prices) or indirectly (i. e. derived from prices).3 Fair values were measured on the basis of inputs for which no observable market data is available.4 Other long-term financial assets and the interest cap form together other financial assets according to balance sheet disclosure. 5 The interest cap was designated as a hedging instrument with regards to its intrinsic value within the context of hedge accounting, while its fair value is
separate.6 The balance sheet item other short-term financial liabilities comprises the total of other short-term financial liabilities and financial liabilities from
subsequent purchase price payments.7 The GFT Group has initially applied IFRS 9 and IFRS 15 at 1 January 2018. Under the modified retrospective transition method chosen, comparative
information is not restated.8 Adjusted
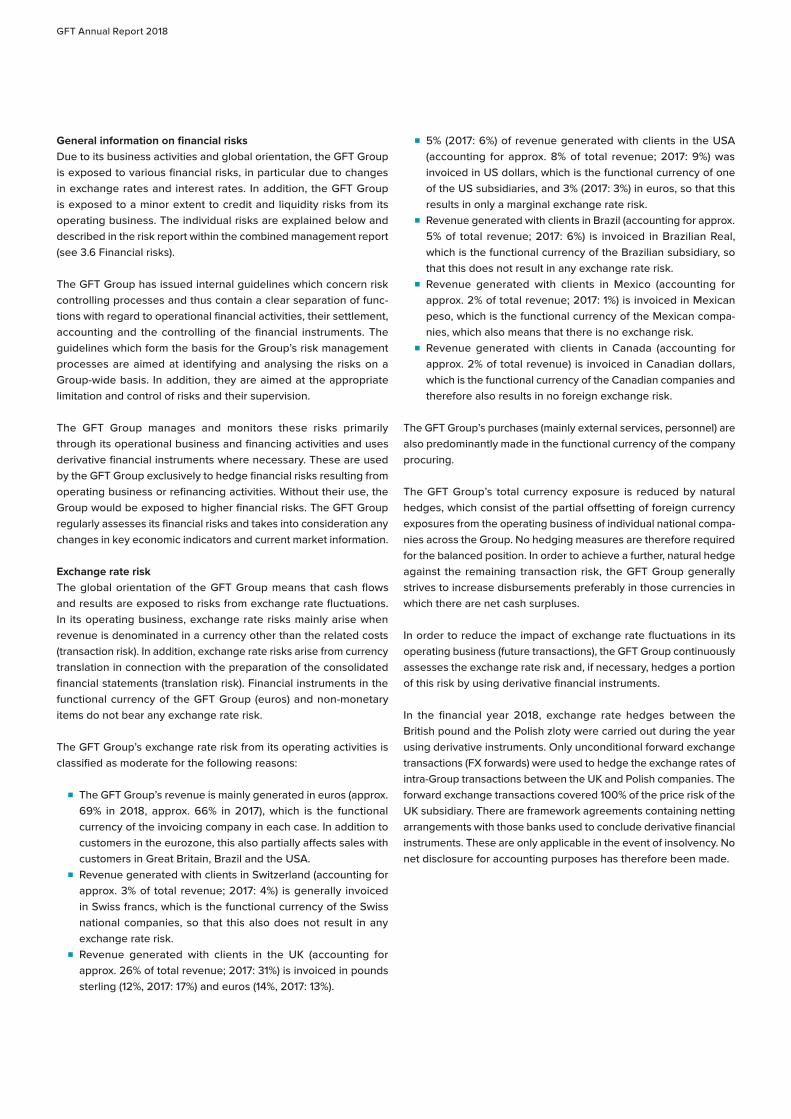
GFT Annual Report 2018
General information on financial risksDue to its business activities and global orientation, the GFT Group is exposed to various financial risks, in particular due to changes in exchange rates and interest rates. In addition, the GFT Group is exposed to a minor extent to credit and liquidity risks from its operating business. The individual risks are explained below and described in the risk report within the combined management report (see 3.6 Financial risks).
The GFT Group has issued internal guidelines which concern risk controlling processes and thus contain a clear separation of func-tions with regard to operational financial activities, their settlement, accounting and the controlling of the financial instruments. The guidelines which form the basis for the Group’s risk management processes are aimed at identifying and analysing the risks on a Group-wide basis. In addition, they are aimed at the appropriate limitation and control of risks and their supervision.
The GFT Group manages and monitors these risks primarily through its operational business and financing activities and uses derivative financial instruments where necessary. These are used by the GFT Group exclusively to hedge financial risks resulting from operating business or refinancing activities. Without their use, the Group would be exposed to higher financial risks. The GFT Group regularly assesses its financial risks and takes into consideration any changes in key economic indicators and current market information.
Exchange rate riskThe global orientation of the GFT Group means that cash flows and results are exposed to risks from exchange rate fluctuations. In its operating business, exchange rate risks mainly arise when revenue is denominated in a currency other than the related costs (transaction risk). In addition, exchange rate risks arise from currency translation in connection with the preparation of the consolidated financial statements (translation risk). Financial instruments in the functional currency of the GFT Group (euros) and non-monetary items do not bear any exchange rate risk.
The GFT Group’s exchange rate risk from its operating activities is classified as moderate for the following reasons:
■ The GFT Group’s revenue is mainly generated in euros (approx. 69% in 2018, approx. 66% in 2017), which is the functional currency of the invoicing company in each case. In addition to customers in the eurozone, this also partially affects sales with customers in Great Britain, Brazil and the USA.
■ Revenue generated with clients in Switzerland (accounting for approx. 3% of total revenue; 2017: 4%) is generally invoiced in Swiss francs, which is the functional currency of the Swiss national companies, so that this also does not result in any exchange rate risk.
■ Revenue generated with clients in the UK (accounting for approx. 26% of total revenue; 2017: 31%) is invoiced in pounds sterling (12%, 2017: 17%) and euros (14%, 2017: 13%).
■ 5% (2017: 6%) of revenue generated with clients in the USA (accounting for approx. 8% of total revenue; 2017: 9%) was invoiced in US dollars, which is the functional currency of one of the US subsidiaries, and 3% (2017: 3%) in euros, so that this results in only a marginal exchange rate risk.
■ Revenue generated with clients in Brazil (accounting for approx. 5% of total revenue; 2017: 6%) is invoiced in Brazilian Real, which is the functional currency of the Brazilian subsidiary, so that this does not result in any exchange rate risk.
■ Revenue generated with clients in Mexico (accounting for approx. 2% of total revenue; 2017: 1%) is invoiced in Mexican peso, which is the functional currency of the Mexican compa-nies, which also means that there is no exchange risk.
■ Revenue generated with clients in Canada (accounting for approx. 2% of total revenue) is invoiced in Canadian dollars, which is the functional currency of the Canadian companies and therefore also results in no foreign exchange risk.
The GFT Group’s purchases (mainly external services, personnel) are also predominantly made in the functional currency of the company procuring.
The GFT Group’s total currency exposure is reduced by natural hedges, which consist of the partial offsetting of foreign currency exposures from the operating business of individual national compa-nies across the Group. No hedging measures are therefore required for the balanced position. In order to achieve a further, natural hedge against the remaining transaction risk, the GFT Group generally strives to increase disbursements preferably in those currencies in which there are net cash surpluses.
In order to reduce the impact of exchange rate fluctuations in its operating business (future transactions), the GFT Group continuously assesses the exchange rate risk and, if necessary, hedges a portion of this risk by using derivative financial instruments.
In the financial year 2018, exchange rate hedges between the British pound and the Polish zloty were carried out during the year using derivative instruments. Only unconditional forward exchange transactions (FX forwards) were used to hedge the exchange rates of intra-Group transactions between the UK and Polish companies. The forward exchange transactions covered 100% of the price risk of the UK subsidiary. There are framework agreements containing netting arrangements with those banks used to conclude derivative financial instruments. These are only applicable in the event of insolvency. No net disclosure for accounting purposes has therefore been made.
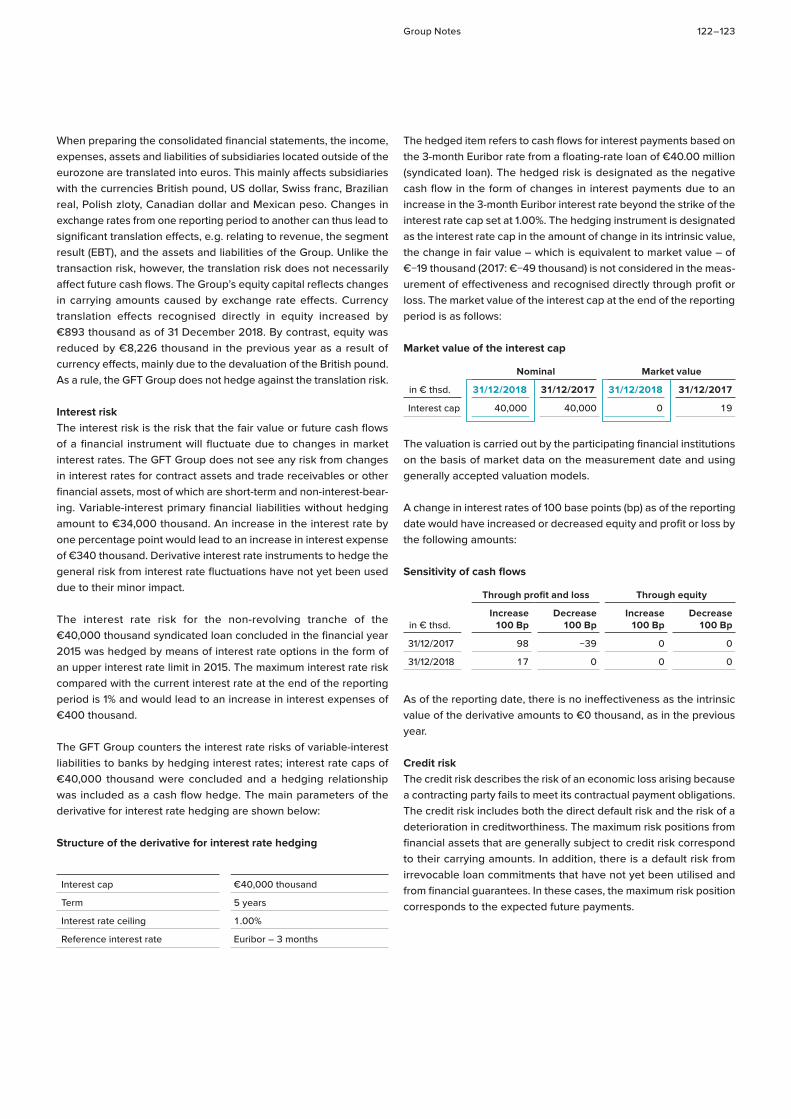
Group Notes 122 – 123
When preparing the consolidated financial statements, the income, expenses, assets and liabilities of subsidiaries located outside of the eurozone are translated into euros. This mainly affects subsidiaries with the currencies British pound, US dollar, Swiss franc, Brazilian real, Polish zloty, Canadian dollar and Mexican peso. Changes in exchange rates from one reporting period to another can thus lead to significant translation effects, e. g. relating to revenue, the segment result (EBT), and the assets and liabilities of the Group. Unlike the transaction risk, however, the translation risk does not necessarily affect future cash flows. The Group’s equity capital reflects changes in carrying amounts caused by exchange rate effects. Currency translation effects recognised directly in equity increased by €893 thousand as of 31 December 2018. By contrast, equity was reduced by €8,226 thousand in the previous year as a result of currency effects, mainly due to the devaluation of the British pound. As a rule, the GFT Group does not hedge against the translation risk.
Interest riskThe interest risk is the risk that the fair value or future cash flows of a financial instrument will fluctuate due to changes in market interest rates. The GFT Group does not see any risk from changes in interest rates for contract assets and trade receivables or other financial assets, most of which are short-term and non-interest-bear-ing. Variable-interest primary financial liabilities without hedging amount to €34,000 thousand. An increase in the interest rate by one percentage point would lead to an increase in interest expense of €340 thousand. Derivative interest rate instruments to hedge the general risk from interest rate fluctuations have not yet been used due to their minor impact.
The interest rate risk for the non-revolving tranche of the €40,000 thousand syndicated loan concluded in the financial year 2015 was hedged by means of interest rate options in the form of an upper interest rate limit in 2015. The maximum interest rate risk compared with the current interest rate at the end of the reporting period is 1% and would lead to an increase in interest expenses of €400 thousand.
The GFT Group counters the interest rate risks of variable-interest liabilities to banks by hedging interest rates; interest rate caps of €40,000 thousand were concluded and a hedging relationship was included as a cash flow hedge. The main parameters of the derivative for interest rate hedging are shown below:
Structure of the derivative for interest rate hedging
Interest cap €40,000 thousand
Term 5 years
Interest rate ceiling 1.00%
Reference interest rate Euribor – 3 months
The hedged item refers to cash flows for interest payments based on the 3-month Euribor rate from a floating-rate loan of €40.00 million (syndicated loan). The hedged risk is designated as the negative cash flow in the form of changes in interest payments due to an increase in the 3-month Euribor interest rate beyond the strike of the interest rate cap set at 1.00%. The hedging instrument is designated as the interest rate cap in the amount of change in its intrinsic value, the change in fair value – which is equivalent to market value – of €−19 thousand (2017: €−49 thousand) is not considered in the meas-urement of effectiveness and recognised directly through profit or loss. The market value of the interest cap at the end of the reporting period is as follows:
Market value of the interest cap
in € thsd.
Nominal Market value
31/12/2018 31/12/2017 31/12/2018 31/12/2017
Interest cap 40,000 40,000 0 19
The valuation is carried out by the participating financial institutions on the basis of market data on the measurement date and using generally accepted valuation models.
A change in interest rates of 100 base points (bp) as of the reporting date would have increased or decreased equity and profit or loss by the following amounts:
Sensitivity of cash flows
in € thsd.
Through profit and loss Through equity
Increase 100 Bp
Decrease 100 Bp
Increase 100 Bp
Decrease 100 Bp
31/12/2017 98 −39 0 0
31/12/2018 17 0 0 0
As of the reporting date, there is no ineffectiveness as the intrinsic value of the derivative amounts to €0 thousand, as in the previous year.
Credit riskThe credit risk describes the risk of an economic loss arising because a contracting party fails to meet its contractual payment obligations. The credit risk includes both the direct default risk and the risk of a deterioration in creditworthiness. The maximum risk positions from financial assets that are generally subject to credit risk correspond to their carrying amounts. In addition, there is a default risk from irrevocable loan commitments that have not yet been utilised and from financial guarantees. In these cases, the maximum risk position corresponds to the expected future payments.
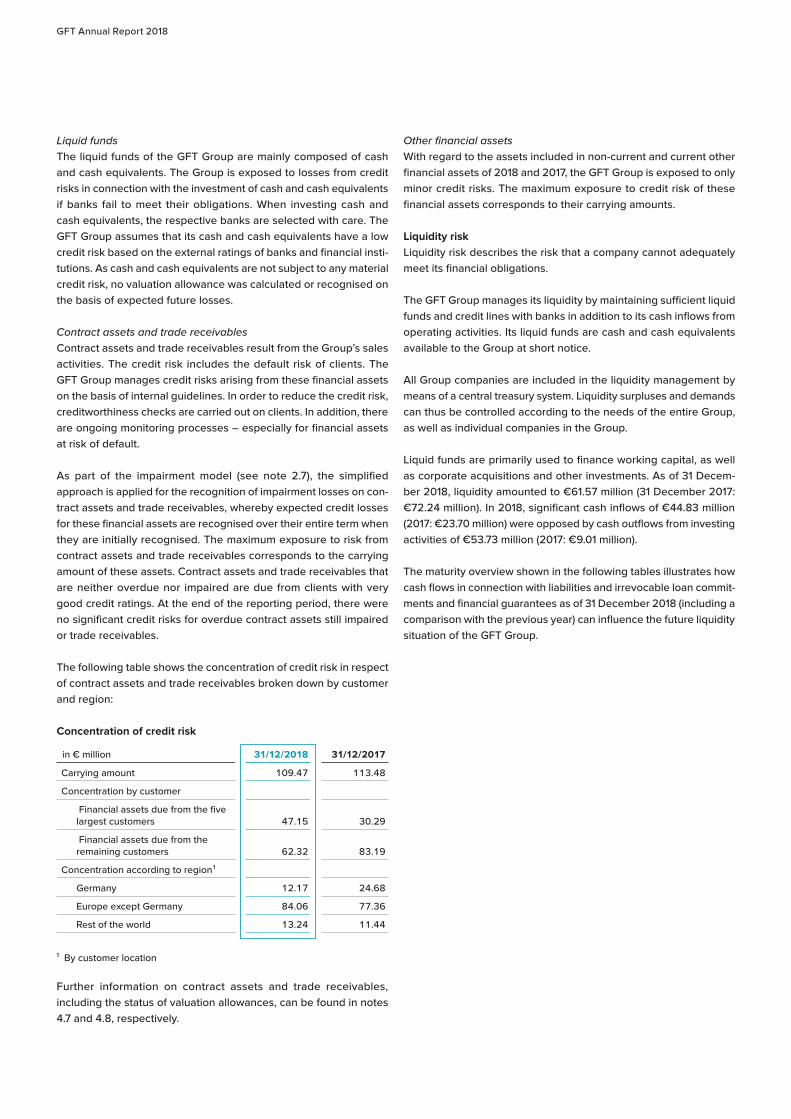
GFT Annual Report 2018
Liquid fundsThe liquid funds of the GFT Group are mainly composed of cash and cash equivalents. The Group is exposed to losses from credit risks in connection with the investment of cash and cash equivalents if banks fail to meet their obligations. When investing cash and cash equivalents, the respective banks are selected with care. The GFT Group assumes that its cash and cash equivalents have a low credit risk based on the external ratings of banks and financial insti-tutions. As cash and cash equivalents are not subject to any material credit risk, no valuation allowance was calculated or recognised on the basis of expected future losses.
Contract assets and trade receivablesContract assets and trade receivables result from the Group’s sales activities. The credit risk includes the default risk of clients. The GFT Group manages credit risks arising from these financial assets on the basis of internal guidelines. In order to reduce the credit risk, creditworthiness checks are carried out on clients. In addition, there are ongoing monitoring processes – especially for financial assets at risk of default.
As part of the impairment model (see note 2.7), the simplified approach is applied for the recognition of impairment losses on con-tract assets and trade receivables, whereby expected credit losses for these financial assets are recognised over their entire term when they are initially recognised. The maximum exposure to risk from contract assets and trade receivables corresponds to the carrying amount of these assets. Contract assets and trade receivables that are neither overdue nor impaired are due from clients with very good credit ratings. At the end of the reporting period, there were no significant credit risks for overdue contract assets still impaired or trade receivables.
The following table shows the concentration of credit risk in respect of contract assets and trade receivables broken down by customer and region:
Concentration of credit risk
in € million 31/12/2018 31/12/2017
Carrying amount 109.47 113.48
Concentration by customer
Financial assets due from the five largest customers 47.15 30.29
Financial assets due from the remaining customers 62.32 83.19
Concentration according to region 1
Germany 12.17 24.68
Europe except Germany 84.06 77.36
Rest of the world 13.24 11.44
1 By customer location
Further information on contract assets and trade receivables, including the status of valuation allowances, can be found in notes 4.7 and 4.8, respectively.
Other financial assetsWith regard to the assets included in non-current and current other financial assets of 2018 and 2017, the GFT Group is exposed to only minor credit risks. The maximum exposure to credit risk of these financial assets corresponds to their carrying amounts.
Liquidity riskLiquidity risk describes the risk that a company cannot adequately meet its financial obligations.
The GFT Group manages its liquidity by maintaining sufficient liquid funds and credit lines with banks in addition to its cash inflows from operating activities. Its liquid funds are cash and cash equivalents available to the Group at short notice.
All Group companies are included in the liquidity management by means of a central treasury system. Liquidity surpluses and demands can thus be controlled according to the needs of the entire Group, as well as individual companies in the Group.
Liquid funds are primarily used to finance working capital, as well as corporate acquisitions and other investments. As of 31 Decem-ber 2018, liquidity amounted to €61.57 million (31 December 2017: €72.24 million). In 2018, significant cash inflows of €44.83 million (2017: €23.70 million) were opposed by cash outflows from investing activities of €53.73 million (2017: €9.01 million).
The maturity overview shown in the following tables illustrates how cash flows in connection with liabilities and irrevocable loan commit-ments and financial guarantees as of 31 December 2018 (including a comparison with the previous year) can influence the future liquidity situation of the GFT Group.
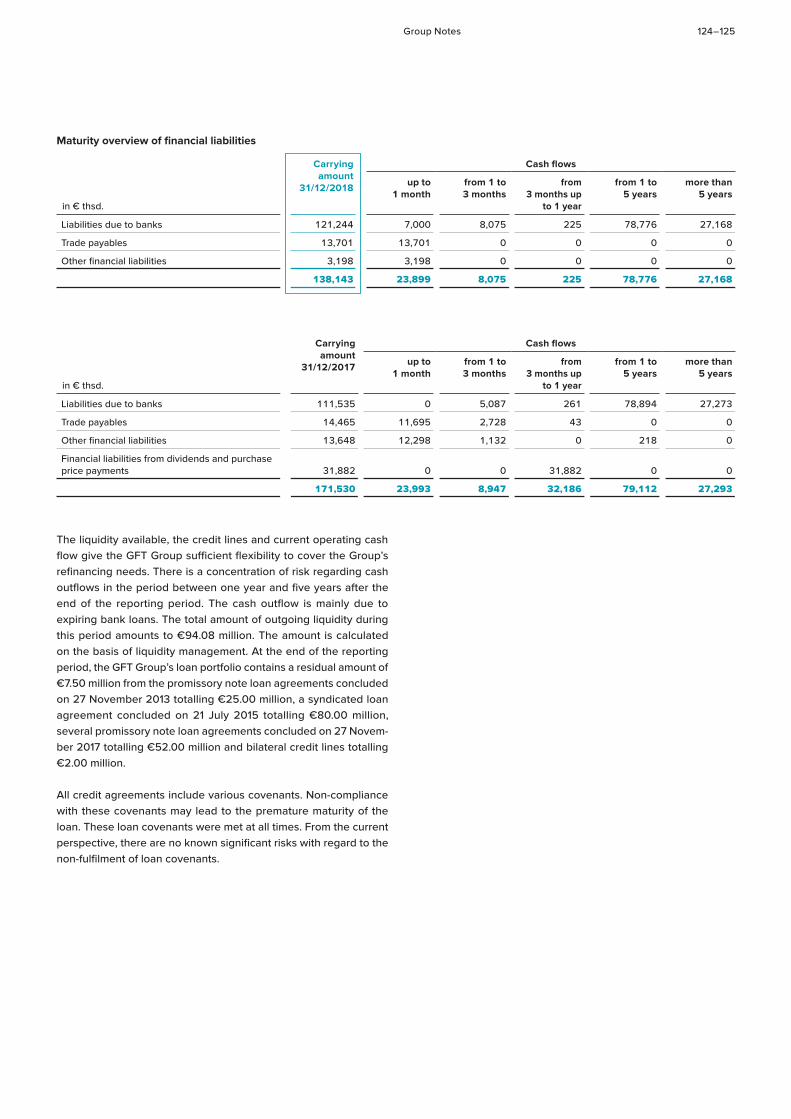
Group Notes 124 – 125
Maturity overview of financial liabilities
in € thsd.
Carrying amount
31/12/2018
Cash flows
up to 1 month
from 1 to 3 months
from 3 months up
to 1 year
from 1 to 5 years
more than 5 years
Liabilities due to banks 121,244 7,000 8,075 225 78,776 27,168
Trade payables 13,701 13,701 0 0 0 0
Other financial liabilities 3,198 3,198 0 0 0 0
138,143 23,899 8,075 225 78,776 27,168
in € thsd.
Carrying amount
31/12/2017
Cash flows
up to 1 month
from 1 to 3 months
from 3 months up
to 1 year
from 1 to 5 years
more than 5 years
Liabilities due to banks 111,535 0 5,087 261 78,894 27,273
Trade payables 14,465 11,695 2,728 43 0 0
Other financial liabilities 13,648 12,298 1,132 0 218 0
Financial liabilities from dividends and purchase price payments 31,882 0 0 31,882 0 0
171,530 23,993 8,947 32,186 79,112 27,293
The liquidity available, the credit lines and current operating cash flow give the GFT Group sufficient flexibility to cover the Group’s refinancing needs. There is a concentration of risk regarding cash outflows in the period between one year and five years after the end of the reporting period. The cash outflow is mainly due to expiring bank loans. The total amount of outgoing liquidity during this period amounts to €94.08 million. The amount is calculated on the basis of liquidity management. At the end of the reporting period, the GFT Group’s loan portfolio contains a residual amount of €7.50 million from the promissory note loan agreements concluded on 27 November 2013 totalling €25.00 million, a syndicated loan agreement concluded on 21 July 2015 totalling €80.00 million, several promissory note loan agreements concluded on 27 Novem-ber 2017 totalling €52.00 million and bilateral credit lines totalling €2.00 million.
All credit agreements include various covenants. Non-compliance with these covenants may lead to the premature maturity of the loan. These loan covenants were met at all times. From the current perspective, there are no known significant risks with regard to the non-fulfilment of loan covenants.
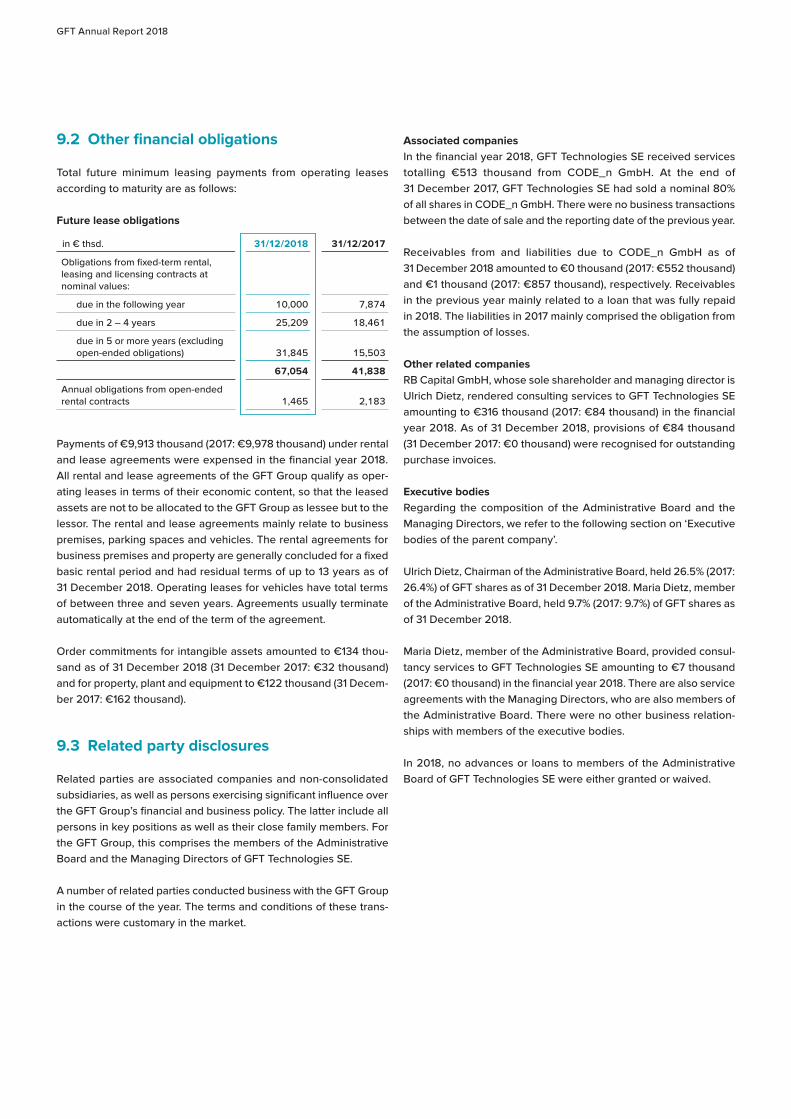
GFT Annual Report 2018
9.2 Other financial obligations
Total future minimum leasing payments from operating leases according to maturity are as follows:
Future lease obligations
in € thsd. 31/12/2018 31/12/2017
Obligations from fixed-term rental, leasing and licensing contracts at nominal values:
due in the following year 10,000 7,874
due in 2 – 4 years 25,209 18,461
due in 5 or more years (excluding open-ended obligations) 31,845 15,503
67,054 41,838
Annual obligations from open-ended rental contracts 1,465 2,183
Payments of €9,913 thousand (2017: €9,978 thousand) under rental and lease agreements were expensed in the financial year 2018. All rental and lease agreements of the GFT Group qualify as oper-ating leases in terms of their economic content, so that the leased assets are not to be allocated to the GFT Group as lessee but to the lessor. The rental and lease agreements mainly relate to business premises, parking spaces and vehicles. The rental agreements for business premises and property are generally concluded for a fixed basic rental period and had residual terms of up to 13 years as of 31 December 2018. Operating leases for vehicles have total terms of between three and seven years. Agreements usually terminate automatically at the end of the term of the agreement.
Order commitments for intangible assets amounted to €134 thou-sand as of 31 December 2018 (31 December 2017: €32 thousand) and for property, plant and equipment to €122 thousand (31 Decem-ber 2017: €162 thousand).
9.3 Related party disclosures
Related parties are associated companies and non-consolidated subsidiaries, as well as persons exercising significant influence over the GFT Group’s financial and business policy. The latter include all persons in key positions as well as their close family members. For the GFT Group, this comprises the members of the Administrative Board and the Managing Directors of GFT Technologies SE.
A number of related parties conducted business with the GFT Group in the course of the year. The terms and conditions of these trans-actions were customary in the market.
Associated companiesIn the financial year 2018, GFT Technologies SE received services totalling €513 thousand from CODE_n GmbH. At the end of 31 December 2017, GFT Technologies SE had sold a nominal 80% of all shares in CODE_n GmbH. There were no business transactions between the date of sale and the reporting date of the previous year.
Receivables from and liabilities due to CODE_n GmbH as of 31 December 2018 amounted to €0 thousand (2017: €552 thousand) and €1 thousand (2017: €857 thousand), respectively. Receivables in the previous year mainly related to a loan that was fully repaid in 2018. The liabilities in 2017 mainly comprised the obligation from the assumption of losses.
Other related companiesRB Capital GmbH, whose sole shareholder and managing director is Ulrich Dietz, rendered consulting services to GFT Technologies SE amounting to €316 thousand (2017: €84 thousand) in the financial year 2018. As of 31 December 2018, provisions of €84 thousand (31 December 2017: €0 thousand) were recognised for outstanding purchase invoices.
Executive bodiesRegarding the composition of the Administrative Board and the Managing Directors, we refer to the following section on ‘Executive bodies of the parent company’.
Ulrich Dietz, Chairman of the Administrative Board, held 26.5% (2017: 26.4%) of GFT shares as of 31 December 2018. Maria Dietz, member of the Administrative Board, held 9.7% (2017: 9.7%) of GFT shares as of 31 December 2018.
Maria Dietz, member of the Administrative Board, provided consul-tancy services to GFT Technologies SE amounting to €7 thousand (2017: €0 thousand) in the financial year 2018. There are also service agreements with the Managing Directors, who are also members of the Administrative Board. There were no other business relation-ships with members of the executive bodies.
In 2018, no advances or loans to members of the Administrative Board of GFT Technologies SE were either granted or waived.
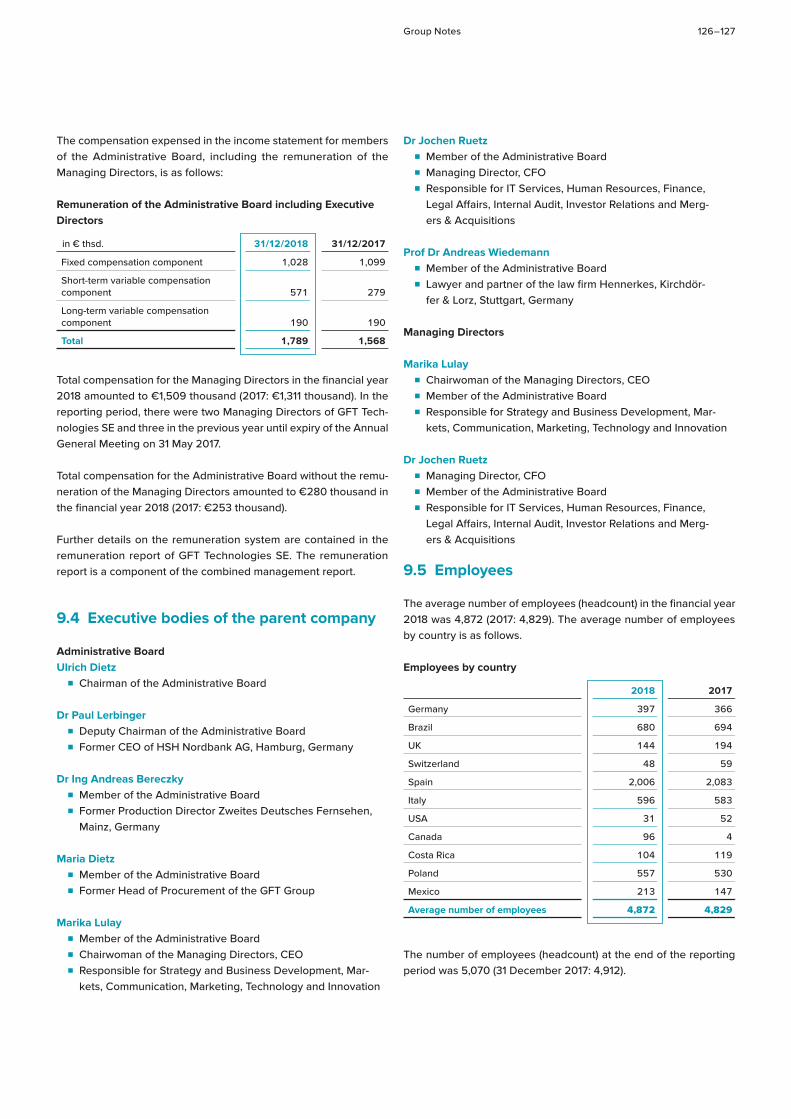
Group Notes 126 – 127
The compensation expensed in the income statement for members of the Administrative Board, including the remuneration of the Managing Directors, is as follows:
Remuneration of the Administrative Board including Executive Directors
in € thsd. 31/12/2018 31/12/2017
Fixed compensation component 1,028 1,099
Short-term variable compensation component 571 279
Long-term variable compensation component 190 190
Total 1,789 1,568
Total compensation for the Managing Directors in the financial year 2018 amounted to €1,509 thousand (2017: €1,311 thousand). In the reporting period, there were two Managing Directors of GFT Tech-nologies SE and three in the previous year until expiry of the Annual General Meeting on 31 May 2017.
Total compensation for the Administrative Board without the remu-neration of the Managing Directors amounted to €280 thousand in the financial year 2018 (2017: €253 thousand).
Further details on the remuneration system are contained in the remuneration report of GFT Technologies SE. The remuneration report is a component of the combined management report.
9.4 Executive bodies of the parent company
Administrative BoardUlrich Dietz
■ Chairman of the Administrative Board
Dr Paul Lerbinger ■ Deputy Chairman of the Administrative Board ■ Former CEO of HSH Nordbank AG, Hamburg, Germany
Dr Ing Andreas Bereczky ■ Member of the Administrative Board ■ Former Production Director Zweites Deutsches Fernsehen,
Mainz, Germany
Maria Dietz ■ Member of the Administrative Board ■ Former Head of Procurement of the GFT Group
Marika Lulay ■ Member of the Administrative Board ■ Chairwoman of the Managing Directors, CEO ■ Responsible for Strategy and Business Development, Mar-
kets, Communication, Marketing, Technology and Innovation
Dr Jochen Ruetz ■ Member of the Administrative Board ■ Managing Director, CFO ■ Responsible for IT Services, Human Resources, Finance,
Legal Affairs, Internal Audit, Investor Relations and Merg-ers & Acquisitions
Prof Dr Andreas Wiedemann ■ Member of the Administrative Board ■ Lawyer and partner of the law firm Hennerkes, Kirchdör-
fer & Lorz, Stuttgart, Germany
Managing Directors
Marika Lulay ■ Chairwoman of the Managing Directors, CEO ■ Member of the Administrative Board ■ Responsible for Strategy and Business Development, Mar-
kets, Communication, Marketing, Technology and Innovation
Dr Jochen Ruetz ■ Managing Director, CFO ■ Member of the Administrative Board ■ Responsible for IT Services, Human Resources, Finance,
Legal Affairs, Internal Audit, Investor Relations and Merg-ers & Acquisitions
9.5 Employees
The average number of employees (headcount) in the financial year 2018 was 4,872 (2017: 4,829). The average number of employees by country is as follows.
Employees by country
2018 2017
Germany 397 366
Brazil 680 694
UK 144 194
Switzerland 48 59
Spain 2,006 2,083
Italy 596 583
USA 31 52
Canada 96 4
Costa Rica 104 119
Poland 557 530
Mexico 213 147
Average number of employees 4,872 4,829
The number of employees (headcount) at the end of the reporting period was 5,070 (31 December 2017: 4,912).
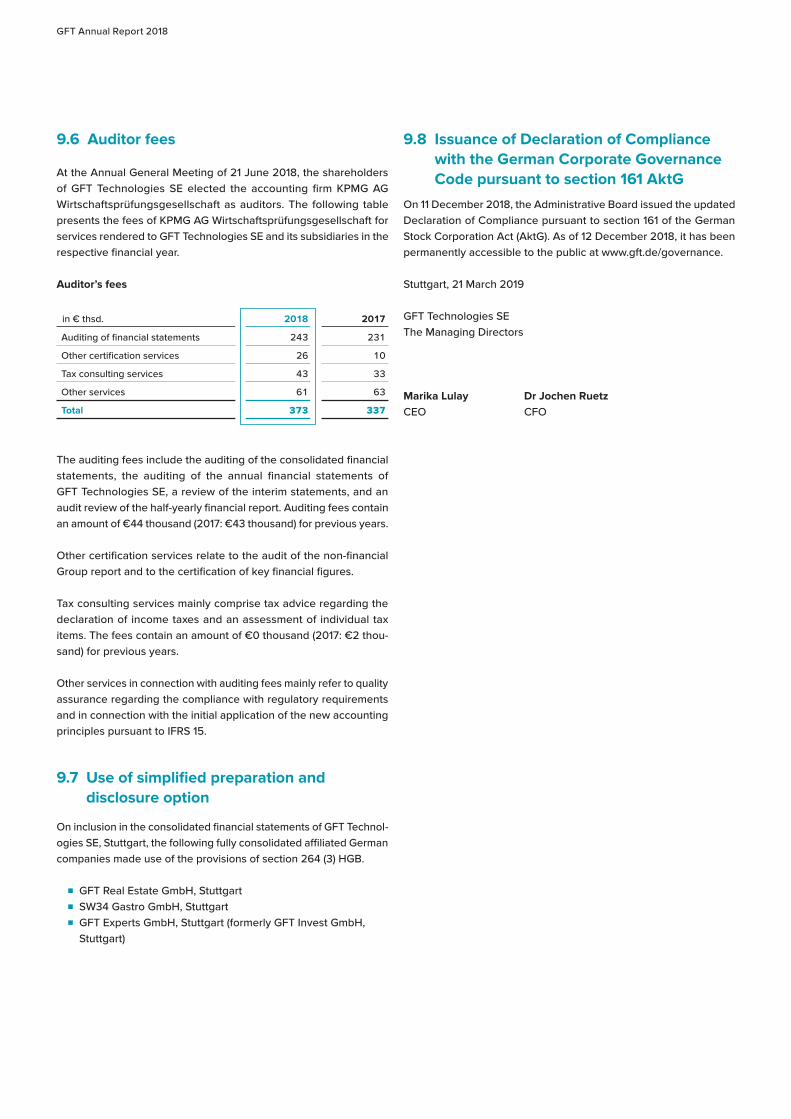
GFT Annual Report 2018
9.6 Auditor fees
At the Annual General Meeting of 21 June 2018, the shareholders of GFT Technologies SE elected the accounting firm KPMG AG Wirtschaftsprüfungsgesellschaft as auditors. The following table presents the fees of KPMG AG Wirtschaftsprüfungsgesellschaft for services rendered to GFT Technologies SE and its subsidiaries in the respective financial year.
Auditor’s fees
in € thsd. 2018 2017
Auditing of financial statements 243 231
Other certification services 26 10
Tax consulting services 43 33
Other services 61 63
Total 373 337
The auditing fees include the auditing of the consolidated financial statements, the auditing of the annual financial statements of GFT Technologies SE, a review of the interim statements, and an audit review of the half-yearly financial report. Auditing fees contain an amount of €44 thousand (2017: €43 thousand) for previous years.
Other certification services relate to the audit of the non-financial Group report and to the certification of key financial figures.
Tax consulting services mainly comprise tax advice regarding the declaration of income taxes and an assessment of individual tax items. The fees contain an amount of €0 thousand (2017: €2 thou-sand) for previous years.
Other services in connection with auditing fees mainly refer to quality assurance regarding the compliance with regulatory requirements and in connection with the initial application of the new accounting principles pursuant to IFRS 15.
9.7 Use of simplified preparation and disclosure option
On inclusion in the consolidated financial statements of GFT Technol-ogies SE, Stuttgart, the following fully consolidated affiliated German companies made use of the provisions of section 264 (3) HGB.
■ GFT Real Estate GmbH, Stuttgart ■ SW34 Gastro GmbH, Stuttgart ■ GFT Experts GmbH, Stuttgart (formerly GFT Invest GmbH,
Stuttgart)
9.8 Issuance of Declaration of Compliance with the German Corporate Governance Code pursuant to section 161 AktG
On 11 December 2018, the Administrative Board issued the updated Declaration of Compliance pursuant to section 161 of the German Stock Corporation Act (AktG). As of 12 December 2018, it has been permanently accessible to the public at www.gft.de/governance.
Stuttgart, 21 March 2019
GFT Technologies SEThe Managing Directors
Marika Lulay Dr Jochen RuetzCEO CFO
Group Notes 128 – 129
Responsibility StatementTo the best of our knowledge, and in accordance with the applicable reporting principles, the consolidated financial statements give a true and fair view of the assets, liabilities, financial position and profit or loss of the Group, and the Group management report – which is combined with the management report of GFT Technologies SE – includes a fair review of the development and performance of the business and the position of the Group, together with a description of the principal opportunities and risks associated with the expected development of the Group.
Stuttgart, 21 March 2019
GFT Technologies SEThe Managing Directors
Marika Lulay Dr Jochen RuetzCEO CFO
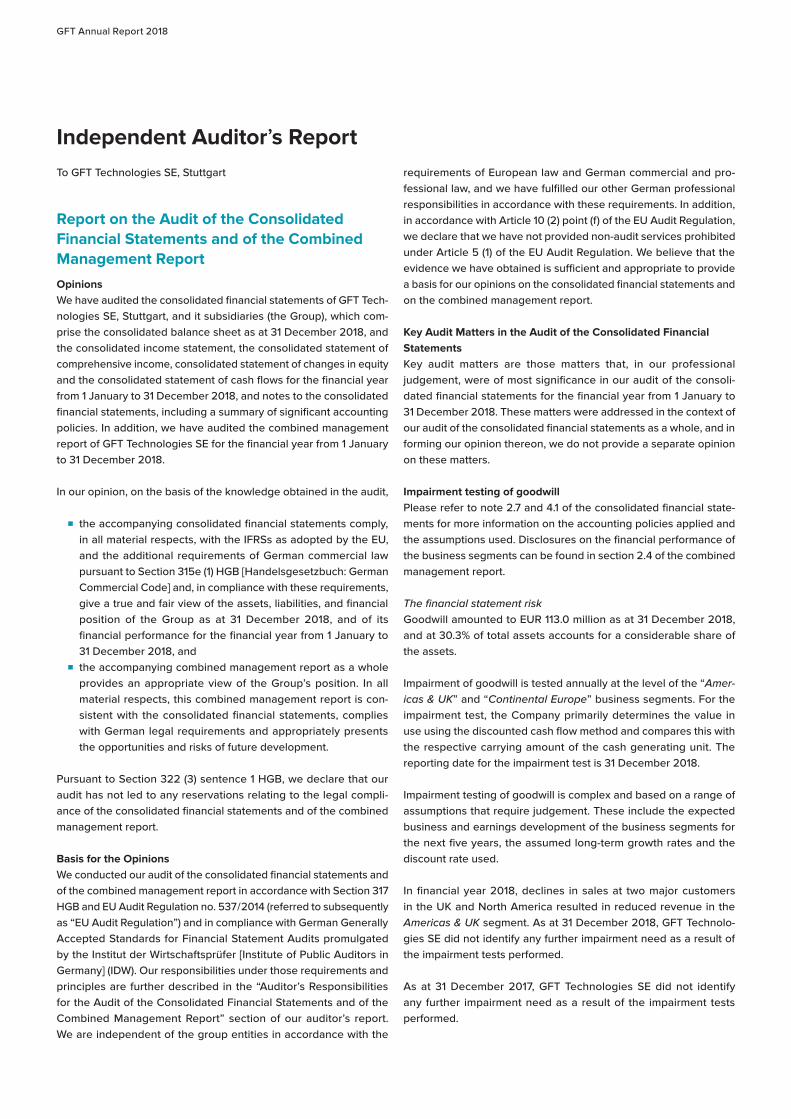
GFT Annual Report 2018
Independent Auditor’s ReportTo GFT Technologies SE, Stuttgart
Report on the Audit of the Consolidated Financial Statements and of the Combined Management Report
OpinionsWe have audited the consolidated financial statements of GFT Tech-nologies SE, Stuttgart, and it subsidiaries (the Group), which com-prise the consolidated balance sheet as at 31 December 2018, and the consolidated income statement, the consolidated statement of comprehensive income, consolidated statement of changes in equity and the consolidated statement of cash flows for the financial year from 1 January to 31 December 2018, and notes to the consolidated financial statements, including a summary of significant accounting policies. In addition, we have audited the combined management report of GFT Technologies SE for the financial year from 1 January to 31 December 2018.
In our opinion, on the basis of the knowledge obtained in the audit,
■ the accompanying consolidated financial statements comply, in all material respects, with the IFRSs as adopted by the EU, and the additional requirements of German commercial law pursuant to Section 315e (1) HGB [Handelsgesetzbuch: German Commercial Code] and, in compliance with these requirements, give a true and fair view of the assets, liabilities, and financial position of the Group as at 31 December 2018, and of its financial performance for the financial year from 1 January to 31 December 2018, and
■ the accompanying combined management report as a whole provides an appropriate view of the Group’s position. In all material respects, this combined management report is con-sistent with the consolidated financial statements, complies with German legal requirements and appropriately presents the opportunities and risks of future development.
Pursuant to Section 322 (3) sentence 1 HGB, we declare that our audit has not led to any reservations relating to the legal compli-ance of the consolidated financial statements and of the combined management report.
Basis for the OpinionsWe conducted our audit of the consolidated financial statements and of the combined management report in accordance with Section 317 HGB and EU Audit Regulation no. 537 / 2014 (referred to subsequently as “EU Audit Regulation”) and in compliance with German Generally Accepted Standards for Financial Statement Audits promulgated by the Institut der Wirtschaftsprüfer [Institute of Public Auditors in Germany] (IDW). Our responsibilities under those requirements and principles are further described in the “Auditor’s Responsibilities for the Audit of the Consolidated Financial Statements and of the Combined Management Report” section of our auditor’s report. We are independent of the group entities in accordance with the
requirements of European law and German commercial and pro-fessional law, and we have fulfilled our other German professional responsibilities in accordance with these requirements. In addition, in accordance with Article 10 (2) point (f) of the EU Audit Regulation, we declare that we have not provided non-audit services prohibited under Article 5 (1) of the EU Audit Regulation. We believe that the evidence we have obtained is sufficient and appropriate to provide a basis for our opinions on the consolidated financial statements and on the combined management report.
Key Audit Matters in the Audit of the Consolidated Financial StatementsKey audit matters are those matters that, in our professional judgement, were of most significance in our audit of the consoli-dated financial statements for the financial year from 1 January to 31 December 2018. These matters were addressed in the context of our audit of the consolidated financial statements as a whole, and in forming our opinion thereon, we do not provide a separate opinion on these matters.
Impairment testing of goodwillPlease refer to note 2.7 and 4.1 of the consolidated financial state-ments for more information on the accounting policies applied and the assumptions used. Disclosures on the financial performance of the business segments can be found in section 2.4 of the combined management report.
The financial statement riskGoodwill amounted to EUR 113.0 million as at 31 December 2018, and at 30.3% of total assets accounts for a considerable share of the assets.
Impairment of goodwill is tested annually at the level of the “Amer-icas & UK” and “Continental Europe” business segments. For the impairment test, the Company primarily determines the value in use using the discounted cash flow method and compares this with the respective carrying amount of the cash generating unit. The reporting date for the impairment test is 31 December 2018.
Impairment testing of goodwill is complex and based on a range of assumptions that require judgement. These include the expected business and earnings development of the business segments for the next five years, the assumed long-term growth rates and the discount rate used.
In financial year 2018, declines in sales at two major customers in the UK and North America resulted in reduced revenue in the Americas & UK segment. As at 31 December 2018, GFT Technolo-gies SE did not identify any further impairment need as a result of the impairment tests performed.
As at 31 December 2017, GFT Technologies SE did not identify any further impairment need as a result of the impairment tests performed.
Group Notes 130 – 131
There is the risk for the consolidated financial statements that further impairment existing as at the reporting date was not recognised. In addition, there is the risk that the related disclosures in the notes to the consolidated financial statements – in particular the disclosures on sensitivities to a reasonably possible change of the significant assumptions underlying measurement – are not appropriate.
Our audit approachWith the involvement of our valuation experts, we assessed the appropriateness of the significant assumptions and calculation methods of the Group, among other things. For this purpose we discussed the expected business and earnings development and the assumed long-term growth rates with those responsible for planning. We also reconciled this information with the budget prepared by the managing directors and approved by the administrative board. Furthermore, we carried out an audit of the structure of the planning process for the following year and assessed the consistency of the growth rates defined for the detail planning phase as well as the long-term growth rates and the discount rate with external market estimates.
We also confirmed the accuracy of the Company’s previous forecasts by comparing the budgets of previous financial years with actual results and analysing deviations. Since changes to the discount rate can have a significant impact on the results of impairment testing in the Americas & UK segment, we compared the assumptions and parameters underlying the discount rate, in particular the risk-free rate, the market risk premium and the beta coefficient, with our own assumptions and publicly available data.
To ensure the computational accuracy of the valuation model used, we verified the Company’s calculations.
In order to take forecast uncertainty into account, we examined the impact of potential changes in the discount rate and / or cash flows on the value in use (sensitivity analysis) by determining the value in use for alternative scenarios and comparing these with the values stated by the Company. The risk-based focus of our analysis was on the Americas & UK segment.
Finally, we assessed whether the disclosures in the notes to the consolidated financial statements regarding the impairment of goodwill were appropriate. This also included an assessment of the appropriateness of disclosures according to IAS 36.134(f) on sensitivity in the event of a reasonably possible change in the key assumptions used for measurement.
Our observationsThe calculation method used for impairment testing of goodwill is appropriate and in line with the accounting policies to be applied. The Company’s assumptions and parameters used for measurement are appropriate. The related disclosures in the notes to the consol-idated financial statements are appropriate.
Recognition of revenue from fixed price contracts
Please refer to note 2.7 in the notes to the consolidated financial statements for more information on the accounting policies applied.
The financial statement riskThe income from fixed price contracts amounted to EUR 208.3 mil-lion in financial year 2018. Revenue from fixed price contracts as a share of total Group revenue was 50.5%.
GFT Group recognises revenue from fixed price contracts over the period by using the time of the transfer of control of assets to the customer. This involves revenue and earnings being recognised by reference to the stage of completion. The stage of completion is calculated in accordance with the input method in which costs already incurred are stated as a ratio of the total costs expected to render the performance obligation (cost to cost method). In the opinion of GFT Technologies SE, this method best reflects the stage of completion and the transfer of assets to the customer. If an overall loss is expected to result from the contract, this loss is recognised in full.
The recognition over time of revenue from fixed price contracts is complex and subject to judgements. Estimation uncertainties exist particularly in respect of the total project costs to be estimated for the determination of the stage of contract completion; at the GFT Group these costs mostly consist of internal staff costs. In addition, there is the risk that costs are recorded for the wrong projects.
There is the risk for the consolidated financial statements that the revenue and outcomes from fixed price contracts are inaccurately allocated to the financial years.
Our audit approachBased on our understanding of the process, we assessed the design, establishment and functionality of the identified internal controls, especially in terms of the correct allocation of costs to the individual projects. We also assessed whether costs were correctly allocated to projects for a specific sample of costs.
We examined the significant cases of judgement, such as the esti-mate of costs still due and the follow-up costs, and assessed their appropriateness. In addition, we discussed the fixed price contracts with the Company, inclusive of their existing risks (e. g. legal risks or warranty risks) and analysed the project costing.
Based on the knowledge already obtained, we assessed whether the respective stage of completion and the amount of revenue deduced from this were properly determined, and evaluated how this was recognised in profit or loss.
Our observationsThe Group’s approach to the recognition of revenue and outcomes from fixed price contracts is appropriate. The assumptions underly-ing the financial reporting are reasonable.
GFT Annual Report 2018
Other InformationManagement is responsible for the other information. The other information comprises: the annual report, with the exception of the audited consolidated financial statements and combined manage-ment report and our auditor’s report.
Our opinions on the consolidated financial statements and on the combined management report do not cover the other information, and consequently we do not express an opinion or any other form of assurance conclusion thereon.
In connection with our audit, our responsibility is to read the other information and, in so doing, to consider whether the other infor-mation
■ is materially inconsistent with the consolidated financial statements, with the combined management report or our knowledge obtained in the audit, or
■ otherwise appears to be materially misstated.
Responsibilities of Management and the Administrative Board for the Consolidated Financial Statements and the Combined Management ReportManagement is responsible for the preparation of the consolidated financial statements that comply, in all material respects, with IFRSs as adopted by the EU and the additional requirements of German com-mercial law pursuant to Section 315e (1) HGB and that the consolidated financial statements, in compliance with these requirements, give a true and fair view of the assets, liabilities, financial position, and finan-cial performance of the Group. In addition, management is responsible for such internal control as they have determined necessary to enable the preparation of consolidated financial statements that are free from material misstatement, whether due to fraud or error.
In preparing the consolidated financial statements, management is responsible for assessing the Group’s ability to continue as a going concern. They also have the responsibility for disclosing, as applicable, matters related to going concern. In addition, they are responsible for financial reporting based on the going concern basis of accounting unless there is an intention to liquidate the Group or to cease operations, or there is no realistic alternative but to do so.
Furthermore, management is responsible for the preparation of the combined management report that, as a whole, provides an appro-priate view of the Group’s position and is, in all material respects, consistent with the consolidated financial statements, complies with German legal requirements, and appropriately presents the oppor-tunities and risks of future development. In addition, management is responsible for such arrangements and measures (systems) as they have considered necessary to enable the preparation of a combined management report that is in accordance with the applicable German legal requirements, and to be able to provide sufficient appropriate evidence for the assertions in the combined management report.
The administrative board is responsible for overseeing the Group’s financial reporting process for the preparation of the consolidated financial statements and of the combined management report.
Auditor’s Responsibilities for the Audit of the Consolidated Financial Statements and of the Combined Management ReportOur objectives are to obtain reasonable assurance about whether the consolidated financial statements as a whole are free from mate-rial misstatement, whether due to fraud or error, and whether the combined management report as a whole provides an appropriate view of the Group’s position and, in all material respects, is consist-ent with the consolidated financial statements and the knowledge obtained in the audit, complies with the German legal requirements and appropriately presents the opportunities and risks of future development, as well as to issue an auditor’s report that includes our opinions on the consolidated financial statements and on the combined management report.
Reasonable assurance is a high level of assurance, but is not a guarantee that an audit conducted in accordance with Section 317 HGB and the EU Audit Regulation and in compliance with German Generally Accepted Standards for Financial Statement Audits promulgated by the Institut der Wirtschaftsprüfer (IDW) will always detect a material misstatement. Misstatements can arise from fraud or error and are considered material if, individually or in the aggre-gate, they could reasonably be expected to influence the economic decisions of users taken on the basis of these consolidated financial statements and this combined management report.
We exercise professional judgement and maintain professional scepticism throughout the audit. We also:
■ Identify and assess the risks of material misstatement of the consolidated financial statements and of the combined manage-ment report, whether due to fraud or error, design and perform audit procedures responsive to those risks, and obtain audit evidence that is sufficient and appropriate to provide a basis for our opinions. The risk of not detecting a material misstatement resulting from fraud is higher than for one resulting from error, as fraud may involve collusion, forgery, intentional omissions, misrepresentations, or the override of internal control.
■ Obtain an understanding of internal control relevant to the audit of the consolidated financial statements and of arrangements and measures (systems) relevant to the audit of the combined management report in order to design audit procedures that are appropriate in the circumstances, but not for the purpose of expressing an opinion on the effectiveness of these systems.
■ Evaluate the appropriateness of accounting policies used by management and the reasonableness of estimates made by management and related disclosures.
■ Conclude on the appropriateness of management’s use of the going concern basis of accounting and, based on the audit evidence obtained, whether a material uncertainty exists related to events or conditions that may cast significant doubt on the Group’s ability to continue as a going concern. If we conclude that a material uncertainty exists, we are required to draw attention in the auditor’s report to the related disclosures in the consolidated financial statements and in the combined management report or, if such disclosures are inadequate, to modify our respective opinions. Our conclusions are based on the audit evidence obtained up to the date of our auditor’s
Group Notes 132 – 133
report. However, future events or conditions may cause the Group to cease to be able to continue as a going concern.
■ Evaluate the overall presentation, structure and content of the consolidated financial statements, including the disclosures, and whether the consolidated financial statements present the underlying transactions and events in a manner that the consolidated financial statements give a true and fair view of the assets, liabilities, financial position and financial performance of the Group in compliance with IFRSs as adopted by the EU and the additional requirements of German commercial law pursuant to Section 315e (1) HGB.
■ Obtain sufficient appropriate audit evidence regarding the financial information of the entities or business activities within the Group to express opinions on the consolidated financial statements and on the combined management report. We are responsible for the direction, supervision and performance of the group audit. We remain solely responsible for our opinions.
■ Evaluate the consistency of the combined management report with the consolidated financial statements, its conformity with [German] law, and the view of the Group’s position it provides.
■ Perform audit procedures on the prospective information presented by management in the combined management report. On the basis of sufficient appropriate audit evidence we evaluate, in particular, the significant assumptions used by management as a basis for the prospective information, and evaluate the proper derivation of the prospective information from these assumptions. We do not express a separate opinion on the prospective information and on the assumptions used as a basis. There is a substantial unavoidable risk that future events will differ materially from the prospective information.
We communicate with those charged with governance regarding, among other matters, the planned scope and timing of the audit and significant audit findings, including any significant deficiencies in internal control that we identify during our audit.
We also provide those charged with governance with a statement that we have complied with the relevant independence requirements, and communicate with them all relationships and other matters that may reasonably be thought to bear on our independence, and where applicable, the related safeguards.
From the matters communicated with those charged with govern-ance, we determine those matters that were of most significance in the audit of the consolidated financial statements of the current period and are therefore the key audit matters. We describe these matters in our auditor’s report unless law or regulation precludes public disclosure about the matter.
Other Legal and Regulatory Requirements
Further information pursuant to Article 10 of the EU Audit RegulationWe were elected as group auditor by the annual general meeting on 21 June 2018. We were engaged by the Administrative Board on 20 February 2019. We have been the group auditor of GFT Technol-ogies SE without interruption since financial year 2012.
We declare that the opinions expressed in this auditor’s report are consistent with the additional report to the administrative board pursuant to Article 11 of the EU Audit Regulation (long-form audit report).
German Public Auditor Responsible for the Engagement
The German Public Auditor responsible for the engagement is Arne Stratmann.
Stuttgart, 21 March 2019
KPMG AGWirtschaftsprüfungsgesellschaft
[Signature] Stratmann [Signature] BauerWirtschaftsprüfer Wirtschaftsprüfer[German Public Auditor] [German Public Auditor]
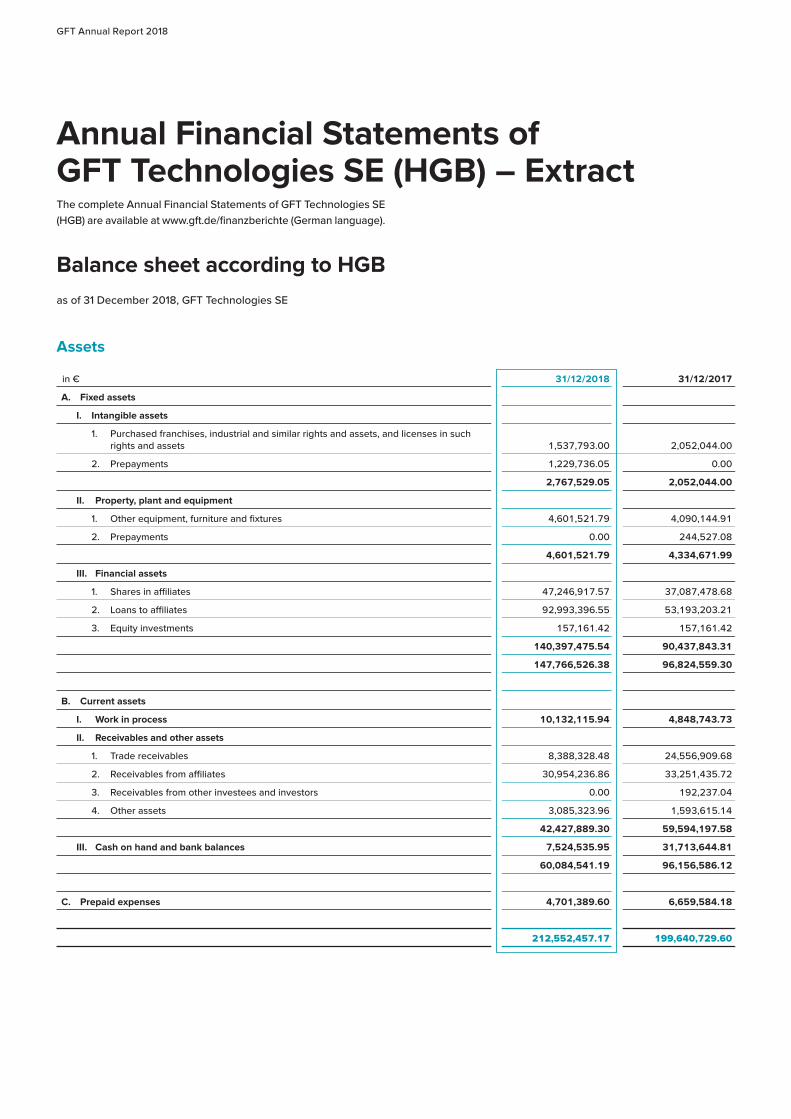
GFT Annual Report 2018
Balance sheet according to HGBas of 31 December 2018, GFT Technologies SE
Assets
in € 31/12/2018 31/12/2017
A. Fixed assets
I. Intangible assets
1. Purchased franchises, industrial and similar rights and assets, and licenses in such rights and assets 1,537,793.00 2,052,044.00
2. Prepayments 1,229,736.05 0.00
2,767,529.05 2,052,044.00
II. Property, plant and equipment
1. Other equipment, furniture and fixtures 4,601,521.79 4,090,144.91
2. Prepayments 0.00 244,527.08
4,601,521.79 4,334,671.99
III. Financial assets
1. Shares in affiliates 47,246,917.57 37,087,478.68
2. Loans to affiliates 92,993,396.55 53,193,203.21
3. Equity investments 157,161.42 157,161.42
140,397,475.54 90,437,843.31
147,766,526.38 96,824,559.30
B. Current assets
I. Work in process 10,132,115.94 4,848,743.73
II. Receivables and other assets
1. Trade receivables 8,388,328.48 24,556,909.68
2. Receivables from affiliates 30,954,236.86 33,251,435.72
3. Receivables from other investees and investors 0.00 192,237.04
4. Other assets 3,085,323.96 1,593,615.14
42,427,889.30 59,594,197.58
III. Cash on hand and bank balances 7,524,535.95 31,713,644.81
60,084,541.19 96,156,586.12
C. Prepaid expenses 4,701,389.60 6,659,584.18
212,552,457.17 199,640,729.60
Annual Financial Statements of GFT Technologies SE (HGB) – ExtractThe complete Annual Financial Statements of GFT Technologies SE (HGB) are available at www.gft.de/finanzberichte (German language).
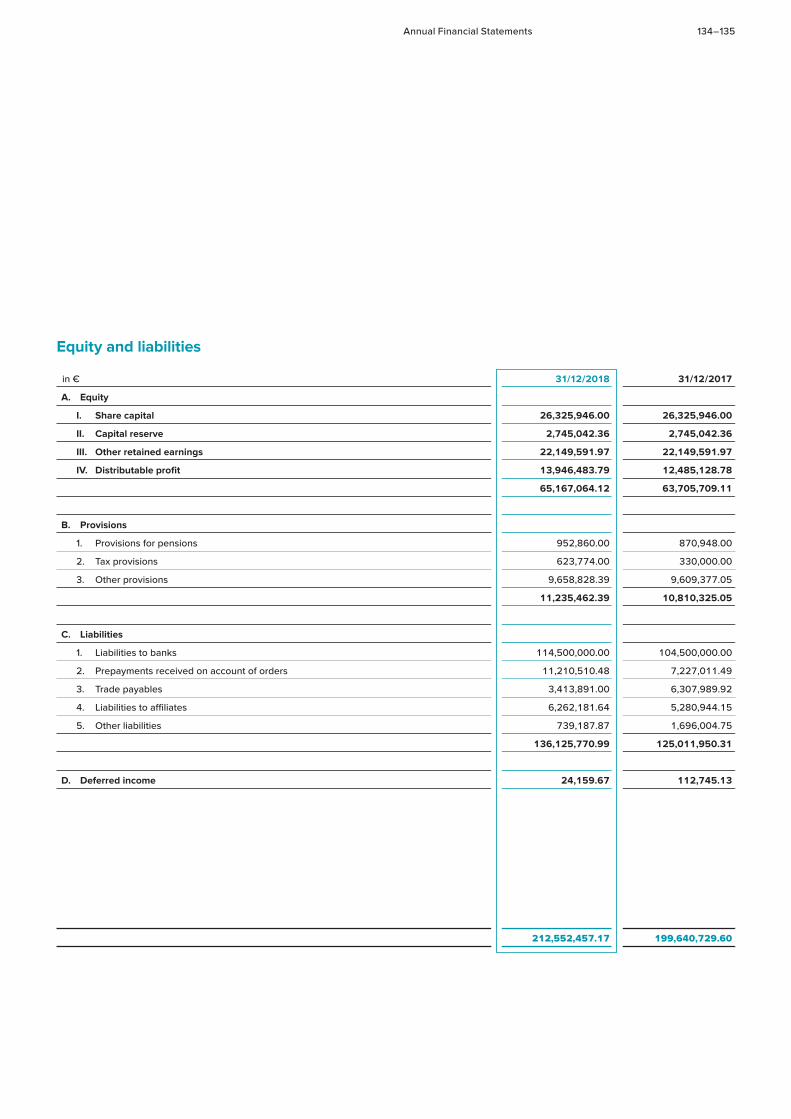
Annual Financial Statements 134 – 135
Equity and liabilities
in € 31/12/2018 31/12/2017
A. Equity
I. Share capital 26,325,946.00 26,325,946.00
II. Capital reserve 2,745,042.36 2,745,042.36
III. Other retained earnings 22,149,591.97 22,149,591.97
IV. Distributable profit 13,946,483.79 12,485,128.78
65,167,064.12 63,705,709.11
B. Provisions
1. Provisions for pensions 952,860.00 870,948.00
2. Tax provisions 623,774.00 330,000.00
3. Other provisions 9,658,828.39 9,609,377.05
11,235,462.39 10,810,325.05
C. Liabilities
1. Liabilities to banks 114,500,000.00 104,500,000.00
2. Prepayments received on account of orders 11,210,510.48 7,227,011.49
3. Trade payables 3,413,891.00 6,307,989.92
4. Liabilities to affiliates 6,262,181.64 5,280,944.15
5. Other liabilities 739,187.87 1,696,004.75
136,125,770.99 125,011,950.31
D. Deferred income 24,159.67 112,745.13
212,552,457.17 199,640,729.60
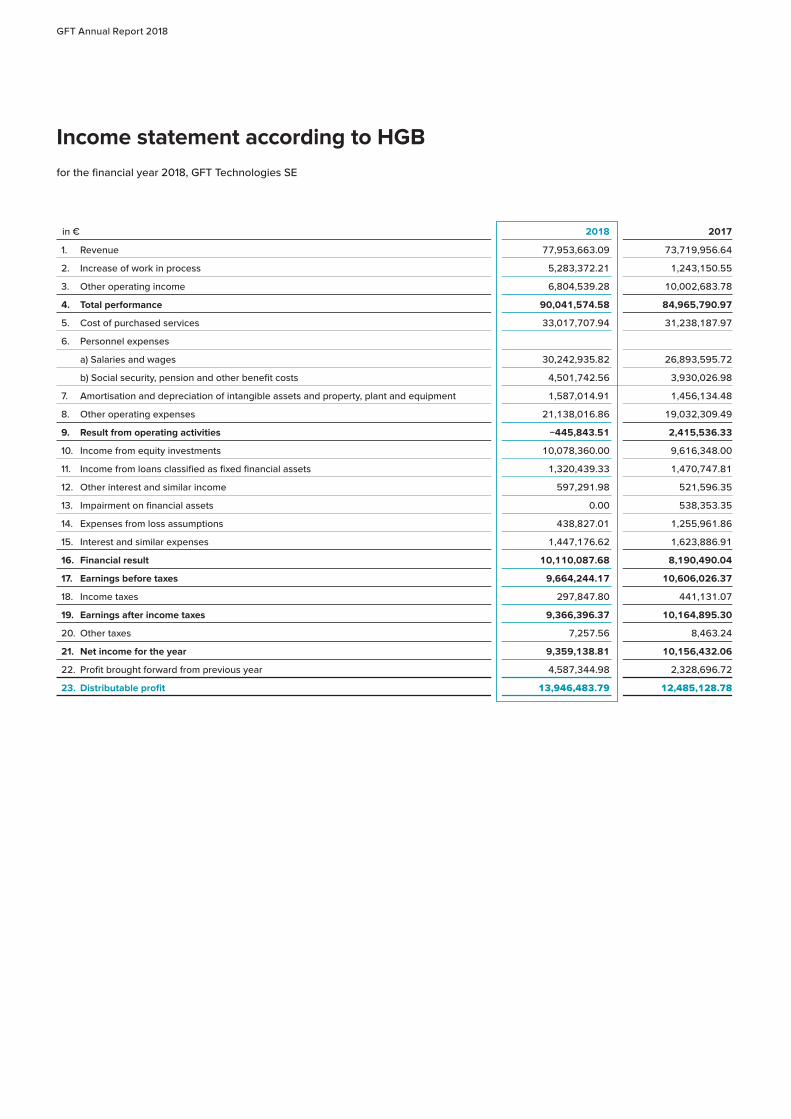
GFT Annual Report 2018
Income statement according to HGBfor the financial year 2018, GFT Technologies SE
in € 2018 2017
1. Revenue 77,953,663.09 73,719,956.64
2. Increase of work in process 5,283,372.21 1,243,150.55
3. Other operating income 6,804,539.28 10,002,683.78
4. Total performance 90,041,574.58 84,965,790.97
5. Cost of purchased services 33,017,707.94 31,238,187.97
6. Personnel expenses
a) Salaries and wages 30,242,935.82 26,893,595.72
b) Social security, pension and other benefit costs 4,501,742.56 3,930,026.98
7. Amortisation and depreciation of intangible assets and property, plant and equipment 1,587,014.91 1,456,134.48
8. Other operating expenses 21,138,016.86 19,032,309.49
9. Result from operating activities −445,843.51 2,415,536.33
10. Income from equity investments 10,078,360.00 9,616,348.00
11. Income from loans classified as fixed financial assets 1,320,439.33 1,470,747.81
12. Other interest and similar income 597,291.98 521,596.35
13. Impairment on financial assets 0.00 538,353.35
14. Expenses from loss assumptions 438,827.01 1,255,961.86
15. Interest and similar expenses 1,447,176.62 1,623,886.91
16. Financial result 10,110,087.68 8,190,490.04
17. Earnings before taxes 9,664,244.17 10,606,026.37
18. Income taxes 297,847.80 441,131.07
19. Earnings after income taxes 9,366,396.37 10,164,895.30
20. Other taxes 7,257.56 8,463.24
21. Net income for the year 9,359,138.81 10,156,432.06
22. Profit brought forward from previous year 4,587,344.98 2,328,696.72
23. Distributable profit 13,946,483.79 12,485,128.78
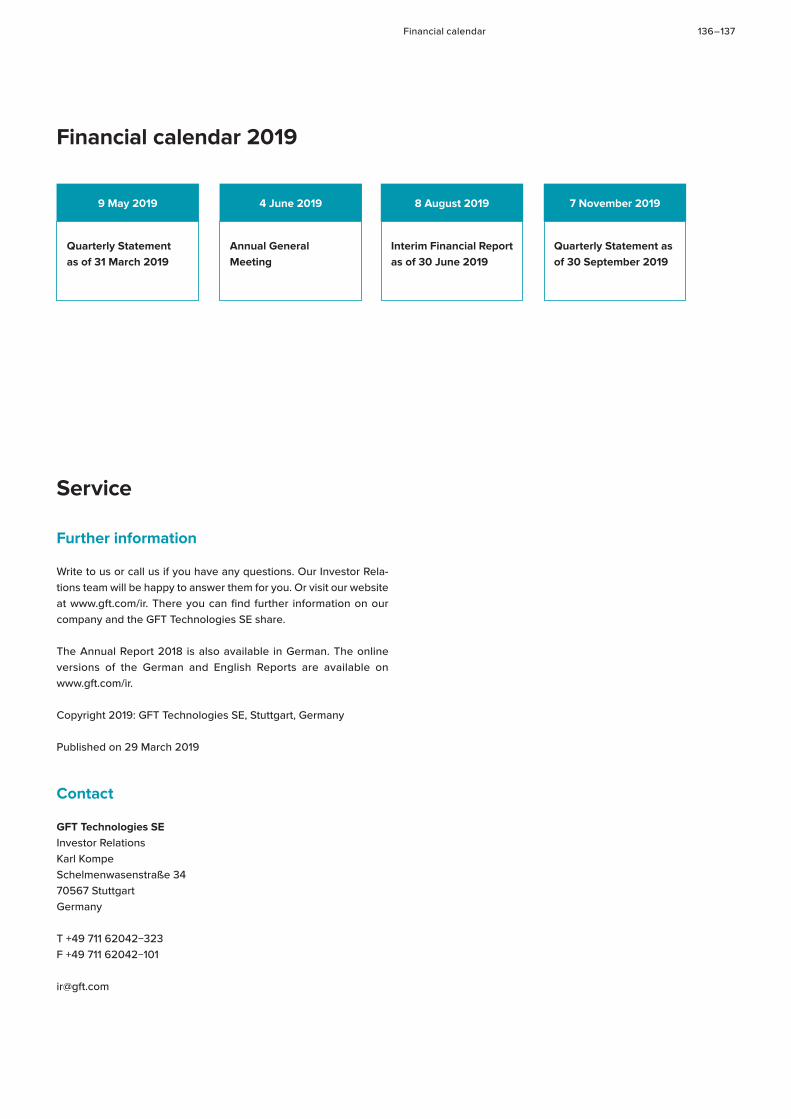
Financial calendar 136 – 137
Financial calendar 2019
Service
Further information
Write to us or call us if you have any questions. Our Investor Rela-tions team will be happy to answer them for you. Or visit our website at www.gft.com/ir. There you can find further information on our company and the GFT Technologies SE share.
The Annual Report 2018 is also available in German. The online versions of the German and English Reports are available on www.gft.com/ir.
Copyright 2019: GFT Technologies SE, Stuttgart, Germany
Published on 29 March 2019
Contact
GFT Technologies SEInvestor RelationsKarl KompeSchelmenwasenstraße 3470567 StuttgartGermany
T +49 711 62042−323F +49 711 62042−101
9 May 2019 7 November 20198 August 20194 June 2019
Annual General Meeting
Quarterly Statement as of 30 September 2019
Quarterly Statement as of 31 March 2019
Interim Financial Report as of 30 June 2019
GFT Annual Report 2018
ImprintConceptGFT Technologies SE, Stuttgart, Germanywww.gft.com
TextGFT Technologies SE, Stuttgart, Germanywww.gft.comcandid communications, Augsburg, Germany
Creative concept, design and settingsam waikiki, Hamburg, Germanywww.samwaikiki.de
PhotographyCover: UnsplashPages 4 / 5: shutterstockPage 6: iStockphotoPages 8 / 9: Getty ImagesPages 12 / 13, 16 / 17: AlamyPages 3, 23, 25: Michael DannenmannPages 14, 15: GFT Technologies SE
PrintHartung Druck + Medien GmbH, Hamburg, Germany
The report was printed on responsibility-sourced FSC® paper bearing the EU Ecolabel.
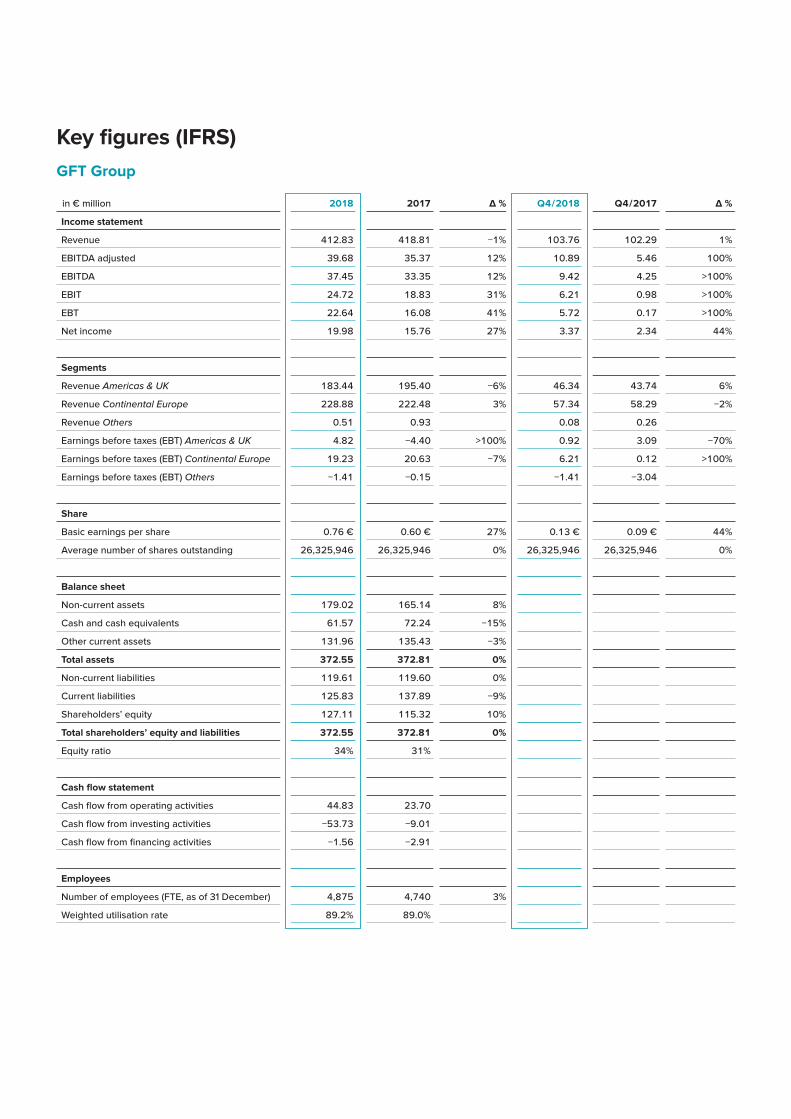
Key figures (IFRS) GFT Group
in € million 2018 2017 Δ % Q4 / 2018 Q4 / 2017 Δ %
Income statement
Revenue 412.83 418.81 −1% 103.76 102.29 1%
EBITDA adjusted 39.68 35.37 12% 10.89 5.46 100%
EBITDA 37.45 33.35 12% 9.42 4.25 >100%
EBIT 24.72 18.83 31% 6.21 0.98 >100%
EBT 22.64 16.08 41% 5.72 0.17 >100%
Net income 19.98 15.76 27% 3.37 2.34 44%
Segments
Revenue Americas & UK 183.44 195.40 −6% 46.34 43.74 6%
Revenue Continental Europe 228.88 222.48 3% 57.34 58.29 −2%
Revenue Others 0.51 0.93 0.08 0.26
Earnings before taxes (EBT) Americas & UK 4.82 −4.40 >100% 0.92 3.09 −70%
Earnings before taxes (EBT) Continental Europe 19.23 20.63 −7% 6.21 0.12 >100%
Earnings before taxes (EBT) Others −1.41 −0.15 −1.41 −3.04
Share
Basic earnings per share 0.76 € 0.60 € 27% 0.13 € 0.09 € 44%
Average number of shares outstanding 26,325,946 26,325,946 0% 26,325,946 26,325,946 0%
Balance sheet
Non-current assets 179.02 165.14 8%
Cash and cash equivalents 61.57 72.24 −15%
Other current assets 131.96 135.43 −3%
Total assets 372.55 372.81 0%
Non-current liabilities 119.61 119.60 0%
Current liabilities 125.83 137.89 −9%
Shareholders’ equity 127.11 115.32 10%
Total shareholders’ equity and liabilities 372.55 372.81 0%
Equity ratio 34% 31%
Cash flow statement
Cash flow from operating activities 44.83 23.70
Cash flow from investing activities −53.73 −9.01
Cash flow from financing activities −1.56 −2.91
Employees
Number of employees (FTE, as of 31 December) 4,875 4,740 3%
Weighted utilisation rate 89.2% 89.0%

www.gft.com