annual report 2017 for personal use only · designed user experience that is intuitive and...
TRANSCRIPT

ANNUAL REPORT2017
OB
JECTIVE AN
NUA
L REPO
RT 2017
For
per
sona
l use
onl
y

OUR PURPOSE
Bringing governance and efficiency to the organisations our community depends on.
Highlights 1Life at Objective 2Our Business Model 4Delivering Value to Customers 5Product Innovation 6Financial Performance 7CEO’s Review 8Business Line Review 10Directors’ Report 12Financial Statements 18Notes to the Financial Statements 23Directors’ Declaration 46Independent Auditor’s Report 47Auditor’s Independence Declaration 52Shareholder Information 53Corporate Directory 54
IN THIS REPORT
For
per
sona
l use
onl
y

ANNUAL REPORT 2017 | 1
25% 67%
$62.6M$10.5M
EBITDA GROWTH REVENUE GROWTH
$12.9M
9.0CPS
5.0CPS
TOTAL DIVIDENDSRESEARCH & DEVELOPMENT INVESTMENT
EARNINGS PER SHARE
4.0CPS fully franked21% of revenue
55%
Tony WallsCEO, Objective Corporation
The 2017 financial year was transformational for Objective Corporation with the launch of outstanding software across the solution portfolio and record financial performance.
HIGHLIGHTSF
or p
erso
nal u
se o
nly

LIFE AT OBJECTIVE
6 VALUES DEFINE US. DRIVE US. INSPIRE US. WE GROW AND SUCCEED BY...Behaving with integrity
Demonstrating expertise in everything we do
Championing great people and great teams
Fostering tenacity
Applying entrepreneurial spirit
Knowing results matter most
2 | OBJECTIVE CORPORATION LIMITED AND ITS CONTROLLED ENTITIES
For
per
sona
l use
onl
y

ANNUAL REPORT 2017 | 3
For
per
sona
l use
onl
y

FINANCIAL PEFORMANCE
OUTSTANDING PRODUCTS & SOLUTIONS
THE BEST OUTCOMES FOR OUR CUSTOMERS
INVESTMENT IN RESEARCH & DEVELOPMENT
DELIVERING OUTSTANDING SOLUTIONS IS CENTRAL TO EVERYTHING
WE DO
FY13 FY14 FY15 FY16 FY17
63
505049
41
Leads to.. .
Delivering.. .
Resulting in. . .
So that we can.. .
Cumulative R&D ($M)
Revenue ($M)
FY07
8.7
FY08
17.4
FY09
27.1
FY10
36.5
FY12
54.9
FY13
64.3
FY14
74.0
FY15
84.9
FY16
96.2
FY11
45.8
FY17
109.0
OUR BUSINESS MODEL CYCLE OF INNOVATION
4 | OBJECTIVE CORPORATION LIMITED AND ITS CONTROLLED ENTITIES
For
per
sona
l use
onl
y

Our product lines have been freed from manual check processes.
You can’t make the right decisions unless you’ve got the right information at your disposal.
Trapeze has been phenomenal. It saves the assessment team a huge amount of time and effort.
Agata JarbinExecutive General Manager and Project Sponsor, State Trustees, Victoria
Joseph StablumFAA Information Management Project, Navy Fleet Air Arm
Simone PlummerDevelopment Assessment Manager, Sutherland Shire Council
THE BEST OUTCOMES FOR OUR CUSTOMERS
71027891
YEARS OF SUCCESS
46
ELIMINATED
HOURS PER DAYOF MANUAL PROCESSES
?
OBJECTIVE APPROVAL MECHANISM
BECOMES STANDARD SIGNATURE METHOD ALLOWING FOR DIGITAL APPROVAL
36%PRODUCTIVITY
IN ONE YEAR
DELIVERING VALUE TO CUSTOMERS
GREAT GOVERNANCE. BETTER BUSINESS.
80%REDUCTION IN PAPER USAGE
DA PR
OC
ESS 1 PREVIOUSLY TOOK
14 DAYS
4 DAYSNOW
98% ON TIME DELIVERYOF MINISTERIALS(increased from 0%)
ANNUAL REPORT 2017 | 5
For
per
sona
l use
onl
y

PRODUCT INNOVATION
PRODUCT LAUNCHESDuring FY2017, our commitment to developing outstanding products resulted in major launches across the portfolio. We’ve responded to existing market demand while expanding addressable markets with solutions that complement products we previously competed against.
INDUSTRY SOLUTIONSSolutions proven to add value for specific industries.
We continue to develop solutions for specific, repeatable scenarios faced by the public sector and regulated industries.
These solutions meet known demand within the key vertical markets that we operate, and are brought to market built on proven software together with deep domain knowledge and experience in working with customers in these industries.
The solutions combine multiple Objective core products and process-specific technology. They are proven to deliver value and are significantly faster to implement than platform-only technology, representing excellent value for customers.
ECM 10 – major generational upgrade of our core solution with a significantly enhanced user experience, passionately embraced by customers.
Objective Insights – visual reporting dashboards and analytics empowering managers to monitor and improve information governance in their organisation.
Objective Perform – a stand-alone solution that automates and streamlines content-driven processes, regardless of the underlying information management repository.
Perform for HPE Content Manager – process automation for HPE Content Manager customers that retains their information governance and security models.
Objective Insights for Perform – visual reporting dashboards and analytics that empower managers to monitor and improve process governance throughout their organisation.
Keystone 5 – accelerates the document production process for customers with an updated and re-designed user experience that is intuitive and appealing to all content contributors.
Connect for SharePoint – secure external collaboration for SharePoint customers globally, increasing our addressable market.
Multi Workgroups – provides collaboration as a service for clusters of agencies or multiple departments regardless of their underlying information management platform; Objective ECM, HPE Content Manager, Microsoft SharePoint.
Trapeze 10 – completely re-designed user experience that simplifies users’ engagement with the solution trimming assessment times while improving accuracy.
6 | OBJECTIVE CORPORATION LIMITED AND ITS CONTROLLED ENTITIES
For
per
sona
l use
onl
y

FINANCIAL PERFORMANCE
Total revenue
Cumulative R&D
Recurrent revenue
FY13 FY14 FY15 FY16 FY17
63
505049
41
2225 27
3134
FY13 FY14 FY15 FY16 FY17
5.00
4.003.75
3.50
3.00
FY13 FY14 FY15 FY16 FY17
9.0
5.85.0
6.0
3.9
$38M
CONTRACTED ANNUAL RECURRING REVENUE
TOTAL REVENUE & RECURRING REVENUE ($M)
FY07 FY08 FY09 FY10 FY11 FY12 FY13 FY14 FY15 FY16 FY17
45.854.9
64.374.0
84.9
96.2
109.0
36.527.1
17.48.7
RESEARCH & DEVELOPMENT INVESTMENT ($M)
TOTAL DIVIDENDS (CPS) EARNINGS PER SHARE (CPS)
ANNUAL REPORT 2017 | 7
For
per
sona
l use
onl
y
CEO’S REVIEW
Dear fellow shareholders,I am pleased to present Objective Corporation’s annual report for the financial year ending 30 June 2017.
This year marks the 30th anniversary of the founding of Objective Corporation. Through constant innovation and investment, we have built a globally competitive software company with millions of users in over 60 countries.
In creating outstanding software, we expect constant change; we expect to respond to market forces, we expect to be pushed by our customers and through investment in research and development we compel ourselves to continually innovate; yet it is refreshing to observe that our fundamental purpose; to bring governance and efficiency to the organisations our community depends on, remains core to all that we do here at Objective.
FY2017 was truly transformative for Objective CorporationOverall, FY2017 was a significant year in proving our ability to execute on our strategy. We delivered outstanding new products across our portfolio, had great success with customers, grew revenue and profits to record levels while establishing partner relationships that open new markets for Objective.
The company’s performance over the year is the result of the incredible effort made every day by our staff. We hire intelligent, talented people; and their commitment over many years, to deliver value to our customers is the foundation of our success. I take this opportunity to thank each of them for their valued contribution.
Group revenue grew by 25% to $62.6 million (FY2016: $50.2 million). Net profit after tax increased by 56% to $8.2 million (FY2016: $5.3 million). Our cash balance at 30 June 2017 was $16.9 million, an increase of $4.5 million over 30 June 2016.
Maintaining these high levels of growth while transitioning a greater proportion of our revenue to annual subscription-based contracts was a challenge we met. The annual recurring revenue (ARR) balance at 30 June 2017 of $38 million, reflecting an increase of 15% over 30 June 2016, increases the stability of earnings and underpins our future financial performance.
Through constant innovation and investment, we have built a globally competitive software company with millions of users in over 60 countries.
8 | OBJECTIVE CORPORATION LIMITED AND ITS CONTROLLED ENTITIES
For
per
sona
l use
onl
y

We launched Objective Perform for HPE Content Manager – a process automation solution that utilises content stored in HPE Content Manager, a solution which is used by more than 2,000 organisations around the globe.
We also launched Objective Connect for Microsoft SharePoint, allowing 75,000 SharePoint customers to securely and quickly collaborate with people external to their organisations.
Developing solutions that complement and enhance such widely used technology creates significant growth opportunities for our product portfolio.
We enter FY2018 with confidence. The outlook is very positive, albeit with the historical skew to H2. We will continue to build on the progress and successes of the past year to grow each of our business lines.
Our loyal customers, staff and shareholders are the foundation of our success. The Board and management of Objective Corporation would like to thank each of them for their support. We are excited by the position we are in at this time and we look forward to sharing our future success with you.
Tony Walls Chief Executive Officer
25%
REVENUE GROWTH
56%
INCREASEIN NPAT
Our long-term investment philosophy in research and development translated into major launches across our product portfolio. Feedback from customers was extremely positive and this is reflected in the record financial performance for the year, where all business lines increased revenue and operating margins.
During the year we invested $12.9 million in research and development (R&D), up 14% on the previous year. The company fully expenses R&D in the year that it is incurred. While this is an increasingly unpopular trend in the sector, we believe this conservative accounting treatment best represents true profitability after factoring in all strategic investments.
This investment produced major new versions in all product lines; Objective ECM 10, Objective Perform, Objective Keystone Version 5, Objective Trapeze 10 and significant new functionality within Objective Connect.
Whilst these product updates introduced enhanced functionality to existing customers, they also increased the size of our addressable market with new solutions designed to work with other document and records repositories.
The company’s performance over the year is the result of the incredible effort made every day by our staff. We hire intelligent, talented people; and their commitment over many years, to deliver value to our customers is the foundation of our success. I take this opportunity to thank each of them for their valued contribution.
ANNUAL REPORT 2017 | 9
For
per
sona
l use
onl
y

$13.0M
OPERATING PROFIT
BUSINESS LINE REVIEW
Strong revenue growth, reduced operating lossesAs customers increased the intensity and frequency of their use of Objective Connect, revenue increased by 40% to $1.5 million. Annual Recurring Revenue (ARR) at 30 June 2017, was $2.1 million, an increase of 49% over 30 June 2016. Progress toward profitability continues, as will investment in this business line to maximise the opportunities it has created.
Research & Development – major product launchesObjective Connect for Microsoft SharePoint expands the addressable market for this product. With seamless integration into Microsoft SharePoint and rapid installation, Objective Connect is positioned to move into new markets through a partner led global sales model.
Multi-Workgroup functionality delivers much larger contracts supporting government agency clusters, multi-departmental use and large, complex projects. For example, Glasgow City Council is using one of its 20+ workgroups to bring multiple parties together to deliver the 2018 European Games.
Collaboration platform of choice for the public sectorObjective Connect has built an enviable reputation in the market, consistently praised by customers for its ease of use and functionality. It has become the collaboration solution of choice among public sector customers providing the security they need to be able to work with external parties along with the flexibility to work with any information management repository they have in place. It is rapid to deploy, highly scalable and optimised to operate on the Microsoft Azure platform, squarely positioning it for growth.
Larger contractsEvidence of larger sized contracts for Objective Connect came from Western Australia following machinery of government changes in the state. Objective Connect was contracted by the “Communities” cluster, comprising: Department of Communities, Child Protection and Family Support, Department of Housing and the Department of Local Government.
OpportunityAt year end FY17, Objective Connect had 56,000 users in 65 countries and a strong pipeline of opportunities for FY18. Organic growth is expected to continue through the network effect created by increased use of Objective Connect.
Expanding the partner sales model, new partners were added in Australia, New Zealand and Europe. In FY18 we will add new partners in North America.
Objective management continues to believe that the scale of the opportunity for Objective Connect is significant.
Leverage information and processes across the enterprise
Record financial performanceGrowth in both perpetual and subscription licence revenue drove a 20% increase in total revenue to $52 million, together with an operating margin of 25% continued the strong financial performance for this business line.
Research & Development – major product launchesObjective ECM 10 was released to unprecedented customer demand, with more than half of our ECM customers now upgraded to take advantage of its significantly enhanced user experience and mobile capability.
Expanding our addressable market, Objective Perform was launched. De-coupling Objective’s proven workflow technology from Objective ECM and injecting a modern, redesigned user experience, Objective Perform is a process automation solution that works with other information or content repositories such as the widely used HPE Content Manager and globally pervasive Microsoft SharePoint. It allows customers to automate content driven business processes whilst retaining their existing information governance platform.
Cloud transition for customersObjective Managed Services continued to grow. Evolving from hybrid cloud and on-premise environments, several customers transitioned to full ECM as a Service hosted in the Microsoft Azure hyper-cloud. It is a significant step forward for this business and evidence of a maturing trend we expect to continue.
Major contractsProgress continued on the $10+ million contract with IBM to deliver the End User Compute project at the Australian Department of Defence. This contract cements the 10 year plus relationship between Objective and Defence, transitioning the organisation to Objective ECM 10, providing more than 85,000 users with access to our latest product innovations.
The Scottish Government extended its contract for a further 5 years, re-launching Objective ECM in the Browser to 8000 users across the government, for improved business process automation and mobile access together with external collaboration through Objective Connect.
New customersNew Objective ECM customers included the South Australian Attorney-General’s Department, the Australian Electoral Commission, Goulburn Murray Water and SA Water in Australia; and Kent County, South Lanarkshire and West Lothian councils in the UK.
Secure external collaboration
$52.0M
SALES REVENUE
$1.5M
$(2.4)M
SALES REVENUE
OPERATING PROFIT
20% 40%
35% 8%
10 | OBJECTIVE CORPORATION LIMITED AND ITS CONTROLLED ENTITIES
For
per
sona
l use
onl
y

Author, verify and publish on-brand content, with ease
Digitally transform plan approval collaboration
Improved financial performanceThis business line produced strong growth in revenue in FY17 and operating losses decreased by 67%. The 100% subscription revenue model of this business delivers a substantial base of contracted revenue for FY18 and there is a solid sales pipeline of opportunities.
Strong market position in Financial Services & Insurance FY17 was dedicated to establishing position in the Financial Services and Insurance (FSI) vertical in Australia. Six out of the top 10 financial services institutions and three out of the top four banks are now Objective Keystone customers. As its reputation is cemented within the wealth management units of these institutions, the value Objective Keystone delivers is generating demand beyond the production of disclosure and offer documents.
Protected market share in Local GovernmentSeveral hundred local government customers around the world continue to use Objective Keystone to accelerate complex document production and engage stakeholders and their communities. Customer retention remains strong and we continue to add new customers, predominantly in the UK, Australia and New Zealand.
Research & Development – major product launchThe release of Objective Keystone 5.1 delivered a vastly improved user experience for all customers. It also added finance sector-specific functionality such as Verification, Attestation and Legal Comment management, illustrating Objective’s commitment to the FSI market. In FY18, investment will be made to further enhance the offering to both the FSI and local government markets.
Market position and opportunityObjective Keystone is now a proven tool, to assist companies comply with increasing regulation in the wealth management sector. Similar regulatory and business imperatives exist in other areas of the industry. From an established customer footprint, focus in sales will move to exploring the opportunity in retail banking, commercial banking and mortgage processing.
To address expanding markets, relationships with channel partners were established throughout FY17 including; disclosure document specialists, Mayflower Consulting and customer communication management experts, Customer Centrics International.
Demand from Local Government continues. Newly released and planned product features for this customer group, particularly in the area of stakeholder engagement, will increase customers’ use of the product and open new opportunities.
Financial performanceFY17 performance for Objective Trapeze was in line with expectations, with revenue growing over FY16 and a strong profit margin was maintained.
Business integrationDuring FY17 Objective Trapeze was fully integrated into Objective Corporation following the acquisition of Onstream Systems the previous year. Objective Corporation bolstered operations and invested in the development lab in Palmerston North, New Zealand, as well as corporate support in the form of product design, finance, human resources and marketing. This resulted in an alignment of strategy and culture culminating in the successful launch of a new generation of Trapeze.
Research & Development – major product releaseObjective Trapeze 10 was released to customer acclaim. It features a completely redesigned user experience and powerful new functionality to assist councils digitise plan assessments. Built with the Objective Design Language (ODL) framework, this version facilitates seamless integration of Trapeze into other Objective products.
Market position and opportunityWith 76% market share in New Zealand and more than 300 UK customers, Objective Trapeze is firmly established as market leader in local government and proven to add value to council planning processes. In partnership with Redman Solutions, Australian customers grew 31% to 143 councils, representing 31% market share.
OpportunityOpportunity for Objective Trapeze will come from expanding its use within the existing customer base, by integrating it with other Objective products to deliver broader industry-specific solutions for end-to-end processing of Development Applications and Building Consents.
New customersGlobally, Objective Trapeze added more than 45 new customers during FY17. These included the Victorian Department of Environment, Land, Water and Planning, Melbourne City Council, Campbelltown City Council (South Australia), Mornington Peninsula Shire Council, Southland District Council (New Zealand) Bournemouth Council (United Kingdom) and Cambridgeshire Council (United Kingdom).
$5.8M
$(0.4)M
$2.9M
$0.4M
SALES REVENUE
SALES REVENUE
OPERATING PROFIT OPERATING PROFIT
38%
67%
ANNUAL REPORT 2017 | 11
For
per
sona
l use
onl
y

12 | OBJECTIVE CORPORATION LIMITED AND ITS CONTROLLED ENTITIES
Your Directors present their report on the consolidated entity consisting of Objective Corporation Limited and the entities it controlled at the end of, or during, the year ended 30 June 2017. Throughout the report, the consolidated entity is referred to as the Group.
DIRECTORSThe following persons were Directors of Objective Corporation Limited during the whole of the financial year and up to the date of this report:
Mr Tony Walls
Mr Gary Fisher
Mr Leigh Warren
Mr Nick Kingsbury
INFORMATION ON DIRECTORS
L-R: Mr Tony Walls, Mr Gary Fisher, Mr Leigh Warren and Mr Nick Kingsbury
MR TONY WALLSChairman and Chief Executive OfficerTony founded the business in 1987 and has extensive experience in the IT industry. Tony has a B.Math (Computing Science), a Grad.Dip in Applied Finance (SIA) and is a Fellow of the Australian Institute of Company Directors.
MR GARY FISHERNon-Executive DirectorGary was appointed a Director of Objective Corporation Limited in March 1991. In October 2007 Gary became a Non-Executive Director. Gary has an extensive background in Finance, IT Management and global product software sales. Gary has a B.Economics and further tertiary education in Law and Business Administration.
MR LEIGH WARRENIndependent Non-Executive DirectorLeigh was appointed as a Non-Executive Director in August 2007 and is Chairman of the Audit Committee. Leigh has over 20 years’ experience in the IT Industry and has held Executive roles for several multinational companies, including SAP where he was Chief Operating Officer for North Asia, Oracle where he was the Managing Director for Australia and New Zealand, Ventyx where he was President for the EMEA region and Bluecoat Systems where he was Vice President Asia Pacific Field Operations. Leigh also serves on the Board of ASX/NZX listed Gentrack and Hong Kong based Solution Access.
MR NICK KINGSBURYIndependent Non-Executive DirectorNick was appointed as a Non-Executive Director in July 2008 and is a member of the Audit Committee. Nick is an experienced international software entrepreneur, strategist and venture capitalist. Nick founded, led and then sold a leading UK Business Process Management company. Nick then spent 7 years with the international venture capital company 3i, where he headed up the software sector. From October 2011 to June 2015 he chaired a UK AIM listed cyber security company Accumuli, plc, which was successfully sold to NCC Group. As well as his role with Objective, he sits on the boards of three early stage businesses Pushfor Limited, Loot Financial Services Limited and Tailored Media Ventures (UK) Limited, and is an advisor to Growthpoint Technology Partners, a US investment bank.
MR BEN TREGONINGCompany SecretaryBen was appointed Company Secretary in July 2016. Ben has over 12 years’ experience in financial roles within Financial Services and corporate finance businesses both in Australia and the UK. He is responsible for company secretarial and corporate governance support at Objective.
MR MARK KATZCompany SecretaryMark was appointed Company Secretary in August 2015. Mark has over 20 years’ experience in financial roles within the Financial Services and Travel sectors in Australia and South Africa, most recently with American Express. Mark is a member of the Institute of Chartered Accountants, Australia & New Zealand. Mark resigned as Company Secretary in July 2016.
DIRECTORS’ REPORT
For
per
sona
l use
onl
y

ANNUAL REPORT 2017 | 13
PRINCIPAL ACTIVITIESThe principal activity of the Group during the year was the supply of information technology software and services. There was no significant change in the nature of the Group’s activities during the year.
DIVIDENDSAn ordinary final fully franked dividend of $3,665,000 was paid on 14 September 2016.
Since the end of the financial year, the directors have recommended the payment of a final fully franked dividend of 4.0 cents per ordinary share and a special unfranked dividend of 1.0 cent per ordinary share (2016: fully franked dividend of 4.0 cents per ordinary share). The aggregate amount of the dividends expected to be paid by 14 September 2017 is $4,588,000 (2016: $3,665,000). There is no conduit foreign income attributed to the final dividend declared.
REVIEW OF OPERATIONS AND FINANCIAL RESULTSA review of the Group operations and the results for the year ended 30 June 2017 is set out on the inside front cover to page 46 of the annual report and forms part of the Directors’ Report. This includes the summary of consolidated results as well as an overview of the Group’s strategy.
SIGNIFICANT CHANGES IN STATE OF AFFAIRSThere were no significant changes in the state of affairs of the Group during the financial year.
SHARE CAPITALAs at 30 June 2017 the Company had 91,768,041 (2016: 91,165,169) fully paid ordinary shares on issue.
Voting rights are detailed in Note 16 to the financial statements.
UNISSUED SHARES UNDER OPTIONSThe number of options over the unissued ordinary shares of Objective Corporation Limited at the date of this report were:
2017 2016
Options on Issue at Balance Date Number Expiry Date Number Expiry Date
Employee options exercisable at $0.50 – – 204,000 01/09/2016
Employee options exercisable at $0.50 – – 250,000 05/02/2024
Employee options exercisable at $0.50 200,000 07/10/2024 200,000 07/10/2024
Employee options exercisable at $0.75 125,000 24/03/2024 500,000 24/03/2024
Employee options exercisable at $1.00 80,000 07/10/2024 80,000 07/10/2024
Employee options exercisable at $1.17 150,000 24/02/2025 150,000 24/02/2025
Employee options exercisable at $1.20 675,000 05/03/2025 1,000,000 05/03/2025
Employee options exercisable at $1.50 250,000 29/07/2026 – –
Employee options exercisable at $1.80 500,000 02/01/2027 – –
Total options on issue 1,980,000 2,384,000
Details of the options on issue are contained in Notes 16 and 25 to the financial statements. 750,000 new options were issued, 150,000 options expired and 1,004,000 options were exercised during the financial year ended 30 June 2017.
The holders of these options do not have the right, by virtue of the option, to participate in any share issue or interest issue of the Company.
EXERCISE OF SHARE OPTIONSIn the period since 1 July 2016 to the date of this report, the following share options granted in prior years under the Employee Incentive Plan were exercised during the financial year:
Issuing entityNumber of
shares issued Class of sharesAmount paid
for shares
Amountunpaid
on shares
Objective Corporation Limited 454,000 Ordinary shares $227,000 –
Objective Corporation Limited 375,000 Ordinary shares $281,250 –
Objective Corporation Limited 175,000 Ordinary shares $210,000 –
Total 1 1,004,000 $718,250 –
1 Total proceeds from issue of shares represented by $185,000 received in cash and $102,000 funded by way of interest free limited recourse loans provided by the issuing entity to employees under the terms of arrangement of the Employee Incentive Plan that is no longer in effect and $431,250 funded by way of interest free limited recourse loans provided by the issuing entity to employees under the current Employee Incentive Plan. For accounting purposes, $431,250 in share loans are treated as part of the options to purchase shares, until the loans are repaid or extinguished at which point the shares are recognised.
DIRECTORS’ REPORT CONTINUED
For
per
sona
l use
onl
y

14 | OBJECTIVE CORPORATION LIMITED AND ITS CONTROLLED ENTITIES
DIRECTORS’ REPORT CONTINUED
LIKELY DEVELOPMENTSThe Company produced strong financial and operational results for FY2017. We continued to invest in our product portfolio, expand our workforce and develop new markets for our products.
The Directors have identified opportunities to continue to grow the business in FY2018 across all business lines and the Company will be pursuing these whilst maintaining a focus on increasing profitability. Through product innovation we have expanded our addressable market in the regions which we are well established and our globally competitive products provide an opportunity for us to expand our presence beyond our current geographic footprint.
ENVIRONMENTAL REGULATIONThe Group is not subject to any significant environmental regulation under Australian Commonwealth or State law.
EVENTS AFTER BALANCE SHEET DATEThe Directors have not become aware of any matter or circumstance not otherwise dealt with in the report or in the financial statements that has significantly or may significantly affect the operations of the Group, the results of those operations or the state of affairs of the Group in subsequent financial years.
INDEMNIFYING OFFICERS OR AUDITORDuring the financial year the Company has paid an insurance premium for a Directors’ and Officers’ insurance policy. The liabilities insured are legal costs that may be incurred in defending civil or criminal proceedings that may be brought against the Directors or Company Secretary as a result of the work performed in their capacity as officers of entities in the Group to the extent permitted by law. The Directors have not disclosed the amount of the premium as such disclosure is prohibited under the terms of the contract.
The Company has not otherwise, during or since the financial year, indemnified or agreed to indemnify an officer or auditor of the Company or any related body corporate against a liability incurred.
CORPORATE GOVERNANCE STATEMENTThe Company’s Directors and management are committed to conducting the Group’s business in an ethical manner and in accordance with the highest standards of corporate governance. The Company has adopted and substantially complies with the ASX Corporate Governance Principles and Recommendations, 3rd Edition (Recommendations), to the extent appropriate to the size and nature of the Group’s operations.
The Company has prepared a Corporate Governance Statement which sets out the corporate governance practices that were in operation throughout the financial year for the Company, identifies any Recommendations that have not been followed, and provides reasons for not following such Recommendations. The Company’s Corporate Governance Statement and policies will be approved at the same time as the Annual Report and will be found on its website: http://www.objective.com/about/investors.
DIRECTORS’ INTERESTDirectors’ beneficial interest in shares and options at the date of this report were:
Director
Number of ordinary
shares Number of
options
Tony Walls 62,000,000 –
Gary Fisher 9,000,000 –
Nick Kingsbury 320,000 –
Leigh Warren 335,443 –
Total directors’ interest 71,655,443 –
MEETINGS OF DIRECTORS’The number of Directors’ and Audit Committee meetings held during the financial year and the number of meetings attended by each of the Directors are as follows:
Directors’ Meeting Audit Committee Meetings
Director
Number of Meetings
Held
Number of Meetings Attended
Number of Meetings
Held
Number of Meetings Attended
Tony Walls 12 12 2 2
Gary Fisher 12 10 – –
Nick Kingsbury 12 11 2 1
Leigh Warren 12 12 2 2
For
per
sona
l use
onl
y

ANNUAL REPORT 2017 | 15
DIRECTORS’ REPORT CONTINUED
AUDITOR’S INDEPENDENCE DECLARATIONA copy of the auditor’s independence declaration in relation to the financial year is included on page 52.
AUDITOR’S NON-AUDIT SERVICESThe Company has not engaged the Group auditor, Pitcher Partners, to provide non-audit services during the financial year.
ROUNDING OF AMOUNTSThe Company is an entity to which ASIC Corporations (Rounding in Financial/Directors’ Reports) Instrument 2016/191 applies and accordingly, amounts in the financial statements and Directors’ Report have been rounded to the nearest thousand dollars, unless specifically stated to be otherwise.
PROCEEDINGS ON BEHALF OF THE COMPANYNo person has applied to the Court for leave to bring proceedings on behalf of the Company, or to intervene in any proceedings to which the Company is a party, for the purpose of taking responsibility on behalf of the Company for all or part of those proceedings. The Company was not a party to any such proceedings during the year.
REMUNERATION REPORTThis remuneration report details the key management personnel (KMP) remuneration arrangements for the Group, in accordance with the requirements of the Corporations Act 2001 and its Regulations.
Following the change in the Group’s segmental reporting of its financial results at the start of the financial year, the Group undertook a fresh assessment of the definition of KMP as set out under the accounting standards, being those persons who have the authority and responsibility for planning, directing and controlling the activities of the Company and the Group. As a result of this assessment, the Group’s Executive KMP has changed since the FY2016 report and the new KMP structure detailed below aligns with the requirements of the accounting standards.
The table below lists the Executives of the Group for the year ended 30 June 2017 and whose remuneration details are outlined in this Remuneration Report.
Directors
Tony Walls Chairman and Chief Executive Officer
Gary Fisher Non-Executive Director
Nick Kingsbury Independent Non-Executive Director
Leigh Warren Independent Non-Executive Director
Executive Key Management Personnel
Ben Tregoning Chief Financial Officer (appointed 29 July 2016)
Overview of remuneration approach and frameworkThe Board from time to time reviews the remuneration packages of all Directors and Executive Officers with due regard to performance and other relevant factors. The remuneration policy generally is to ensure the remuneration package properly reflects the person’s duties and responsibilities and that the remuneration is competitive to attract, retain and motivate employees of the highest calibre.
The remuneration of Directors and other KMP is not directly linked to the company’s performance.
The remuneration of Directors and the other KMP is fixed annually. Bonuses are structured to reward outstanding performance against agreed Key Performance Indicators (KPIs) including financial and non-financial metrics. Ultimately, bonuses and discretionary payments to KMP are at the discretion of the Board.
Non-Executive Directors’ retirement payments are limited to compulsory employer superannuation. There are no retirement and termination benefits for Executive Directors or Executives apart from those that accrue from the relevant laws such as unpaid annual leave, superannuation, long service leave and notice of termination. The Group may consider payments on termination even though legally not required, to protect its rights if it is commercially beneficial to its interests.
Remuneration and other terms of employment of the Executive Director and the other KMP are formalised in employment agreements. These agreements may be terminated by either party with between one and three months’ notice. In the event of termination of Mr Walls’ services, Mr Walls is entitled to be paid six months’ salary.
Voting and comments made at the company’s 25 November 2016 Annual General Meeting (AGM)At the 2016 AGM, 81.3% of the votes received supported the adoption of the remuneration report for the year ended 2016. The Company did not receive any specific feedback at the AGM regarding its remuneration practices.
The Group did not engage a remuneration consultant to provide recommendations in respect of the remuneration of KMP.
For
per
sona
l use
onl
y

16 | OBJECTIVE CORPORATION LIMITED AND ITS CONTROLLED ENTITIES
DIRECTORS’ REPORT CONTINUED
Actual remuneration received by Executive KMP is set out in the tables below.
Short-termShare based
paymentsPost
employment
Salary and fees
$
Cash bonus
$Other
$Options
$
Super-annuation
$Total
$
Portion ofremunerationperformance
related%
Value of options as
proportion ofremuneration
%
2017
G Fisher – – – – – – n/a n/a
N Kingsbury 59,869 – 14,266 3,172 – 77,307 – 4.1%
T Walls 280,000 – – – 20,049 300,049 – –
L Warren 32,877 – – 3,172 3,123 39,172 – 8.1%
B Tregoning 1 232,356 20,513 – 48,933 20,049 321,850 – 15.2%
2016
G Fisher – – 6,383 – – 6,383 – –
N Kingsbury 43,025 – – 7,402 – 50,427 – 14.7
T Walls 280,000 – – – 19,308 299,308 – –
S Mclntyre 276,712 73,107 – 14,031 15,373 379,223 19.3 3.7
L Warren 32,877 – – 7,402 3,123 43,402 – 17.1
F Volckmar 3 207,500 111,171 – – 19,308 337,979 32.9 –
S Bool 2 110,496 163,768 – – 19,308 293,572 55.8 –
J Goddard 235,692 206,260 – 18,889 19,308 480,149 43.0 3.9
R Mills 220,692 60,000 – – 19,308 300,000 20.0 –
A Rudman 212,892 – – – 19,308 232,200 – –
1 B Tregoning appointed on 29 July 2016.
2 S Bool resigned on 28 August 2015.
3 F Volckmar appointed on 10 August 2015.
The bonuses in the above tables are short-term incentives fully vested to the Executive for that year. The bonuses were based on KPIs determined by the Board. Bonuses are structured to reward outstanding performance against agreed KPIs including financial and non-financial metrics. Ultimately, bonuses and discretionary payments to KMP are at the discretion of the Board.
The fair value of options has been determined using the Black-Scholes method, taking into account the exercise price, the term of the option, the vesting criteria, the impact of dilution, the non-tradeable nature of the option, the price at grant date of the underlying share and the expected price volatility of that share, the expected dividend yield and the risk free interest rate for the term of the option. The value of the option at grant date is then amortised over the relevant vesting period. The value included in remuneration of KMP above relates to the amortised value of options granted that have either vested in the current year or are yet to vest.
A summary of the movement, by value, of options over ordinary shares granted, exercised and lapsed for Directors and other KMP during the year ended 30 June 2017 are set out below:
KMP
Value ofoptions
granted atgrant date 1
$
Value ofoptions
exercisedat the
exercise date 2
$
Value ofoptions
lapsed at the lapse date
$
N Kingsbury – 268,263 –
L Warren – 67,066 –
B Tregoning 102,492 – –
1 The value of options granted during the year is recognised in compensation over the vesting period of the grant, in accordance with Australian Accounting Standards.
2 The value of options exercised during the year is calculated as the market price of the Company’s shares on the ASX as at the close of trading on the date the options were exercised, after deducting any exercise price.
For
per
sona
l use
onl
y

ANNUAL REPORT 2017 | 17
DIRECTORS’ REPORT CONTINUED
Details of options over ordinary shares granted, vested and lapsed for Directors or other KMP during the year ended 30 June 2017 are set out below:
KMP
Number ofoptions at
30 June 2016 Number granted
Numberexercised
Number lapsed
Number ofoptions at
30 June 2017
Numbervested and
available forexercise at
30 June 2017
N Kingsbury 200,000 – (200,000) – – –
L Warren 50,000 – (50,000) – – –
B Tregoning – 250,000 – – 250,000 –
KMP
Number ofoptionsgranted
during FY17 Grant date Fair valueExercise
price Vesting date Expiry date
B Tregoning 250,000 29/07/2016 $0.41 $1.50 29/07/2016 29/07/2026
Details of options over ordinary shares granted, vested and lapsed for Directors or other KMP during the year ended 30 June 2016 are set out below:
KMP
Number of options at
30 June 2015 Number granted
Number exercised
Number lapsed
Number of options at
30 June 2016
Number vested at
30 June 2016
N Kingsbury 200,000 – – – 200,000 150,000
L Warren 100,000 – (50,000) – 50,000 –
S Mclntyre 200,000 – – – 200,000 100,000
F Volckmar 500,000 – – – 500,000 500,000
R Mills 300,000 – – – 300,000 300,000
J Goddard 500,000 – – – 500,000 500,000
Shareholdings of Key Management Personnel
KMP
Number ofshares at
30 June 2016Share options
exercisedPurchase of shares Shares sold
Number ofshares at
30 June 2017
T Walls 62,000,000 – – – 62,000,000
G Fisher 11,000,000 – – (2,000,000) 9,000,000
N Kingsbury 120,000 200,000 – – 320,000
L Warren 285,443 50,000 – – 335,443
The 250,000 shares exercised during the financial year ended 30 June 2017 were issued at 50 cents each and were fully paid in cash.
KMP
Number ofshares at
30 June 2015Share options
exercisedPurchase of shares Shares sold
Number ofshares at
30 June 2016
T Walls 62,000,000 – – – 62,000,000
G Fisher 11,000,000 – – – 11,000,000
N Kingsbury 120,000 – – – 120,000
L Warren 235,443 50,000 – – 285,443
S Bool 497,291 – – (497,291) –
A Rudman 500,000 – – – 500,000
J Goddard 113,357 – – – 113,357
Signed in accordance with a resolution of the Board of Directors.
Tony Walls Director
30 August 2017
For
per
sona
l use
onl
y

18 | OBJECTIVE CORPORATION LIMITED AND ITS CONTROLLED ENTITIES
CONSOLIDATED STATEMENT OF PROFIT OR LOSSFOR THE YEAR ENDED 30 JUNE 2017
CONSOLIDATED
Notes2017
$’0002016
$’000
Revenue 4 62,599 50,150
Cost of sales (2,025) (1,403)
Gross profit 60,574 48,747
Other gains and losses (236) 203
Distribution expenses (30,703) (24,697)
Research and development expenses 4 (12,852) (11,259)
Administration and other operating expenses (6,950) (6,929)
Profit before income tax 4 9,833 6,065
Income tax expense 5 (1,631) (802)
Profit for the year attributable to shareholders of Objective Corporation Limited 8,202 5,263
Cents Cents
Basic earnings per share 3 9.0 5.8
Diluted earnings per share 3 8.9 5.7
The above consolidated statement of profit or loss should be read in conjunction with the accompanying notes.
For
per
sona
l use
onl
y

ANNUAL REPORT 2017 | 19
CONSOLIDATED STATEMENT OF COMPREHENSIVE INCOMEFOR THE YEAR ENDED 30 JUNE 2017
CONSOLIDATED
Notes2017
$’0002016
$’000
Profit for the year 8,202 5,263
Other comprehensive income/(expense)
Items that may be reclassified subsequently to profit or loss:
Exchange differences on translation of foreign operations 18 (909) 122
Other comprehensive income/(expense) for the year, net of tax (909) 122
Total comprehensive income for the year 7,293 5,385
Total comprehensive income for the year attributable to shareholders of Objective Corporation Limited 7,293 5,385
The above consolidated statement of comprehensive income should be read in conjunction with the accompanying notes.
For
per
sona
l use
onl
y

20 | OBJECTIVE CORPORATION LIMITED AND ITS CONTROLLED ENTITIES
CONSOLIDATED STATEMENT OF FINANCIAL POSITIONAS AT 30 JUNE 2017
CONSOLIDATED
Notes2017
$’0002016
$’000
Current assets
Cash and cash equivalents 6 16,852 12,372
Trade and other receivables 7 8,488 6,712
Current tax assets 296 373
Other assets 8 4,953 5,784
Total current assets 30,589 25,241
Non-current assets
Trade and other receivables 7 805 755
Property, plant and equipment 9 4,439 602
Deferred tax assets 11 913 342
Intangible assets 10 9,452 10,754
Total non-current assets 15,609 12,453
Total assets 46,198 37,694
Current liabilities
Trade and other payables 12 4,836 5,633
Current tax liabilities 1,152 12
Provisions 13 2,587 2,233
Deferred revenue 14 12,723 11,422
Other liabilities 15 458 33
Total current liabilities 21,756 19,333
Non-current liabilities
Provisions 13 273 261
Deferred revenue 14 – 32
Other liabilities 15 2,835 108
Total non-current liabilities 3,108 401
Total liabilities 24,864 19,734
Net assets 21,334 17,960
Equity
Share capital 16 3,920 3,631
Reserves 18 (11,075) (9,623)
Retained earnings 19 28,489 23,952
Total equity 21,334 17,960
The above consolidated statement of financial position should be read in conjunction with the accompanying notes.
For
per
sona
l use
onl
y

ANNUAL REPORT 2017 | 21
CONSOLIDATED STATEMENT OF CHANGES IN EQUITYFOR THE YEAR ENDED 30 JUNE 2017
CONSOLIDATED
Notes
Share capital
$’000Reserves
$’000
Retained earnings
$’000Total
$’000
As at 1 July 2015 3,048 (9,524) 22,098 15,622
Profit for the period 19 – – 5,263 5,263
Exchange differences on translation of foreign operations 18 – 122 – 122
Total comprehensive income for the period – 122 5,263 5,385
Transactions with owners in their capacity as owners:
Share-based payments 18 – 48 – 48
Exercise of share options 16 246 – – 246
Issue of ordinary shares 16 337 – – 337
Buy-back of ordinary shares 18 – (269) – (269)
Dividends provided for or paid 17 – – (3,409) (3,409)
Total transactions with owners in their capacity as owners 583 (221) (3,409) (3,047)
As at 30 June 2016 3,631 (9,623) 23,952 17,960
Profit for the period 19 – – 8,202 8,202
Exchange differences on translation of foreign operations 18 – (909) – (909)
Total comprehensive income for the period – (909) 8,202 7,293
Transactions with owners in their capacity as owners:
Share-based payments 18 – 163 – 163
Exercise of share options 16 289 – – 289
Buy-back of ordinary shares 18 – (706) – (706)
Dividends provided for or paid 17 – – (3,665) (3,665)
Total transactions with owners in their capacity as owners 289 (543) (3,665) (3,919)
As at 30 June 2017 3,920 (11,075) 28,489 21,334
The above consolidated statement of changes in equity should be read in conjunction with the accompanying notes.
For
per
sona
l use
onl
y
22 | OBJECTIVE CORPORATION LIMITED AND ITS CONTROLLED ENTITIES
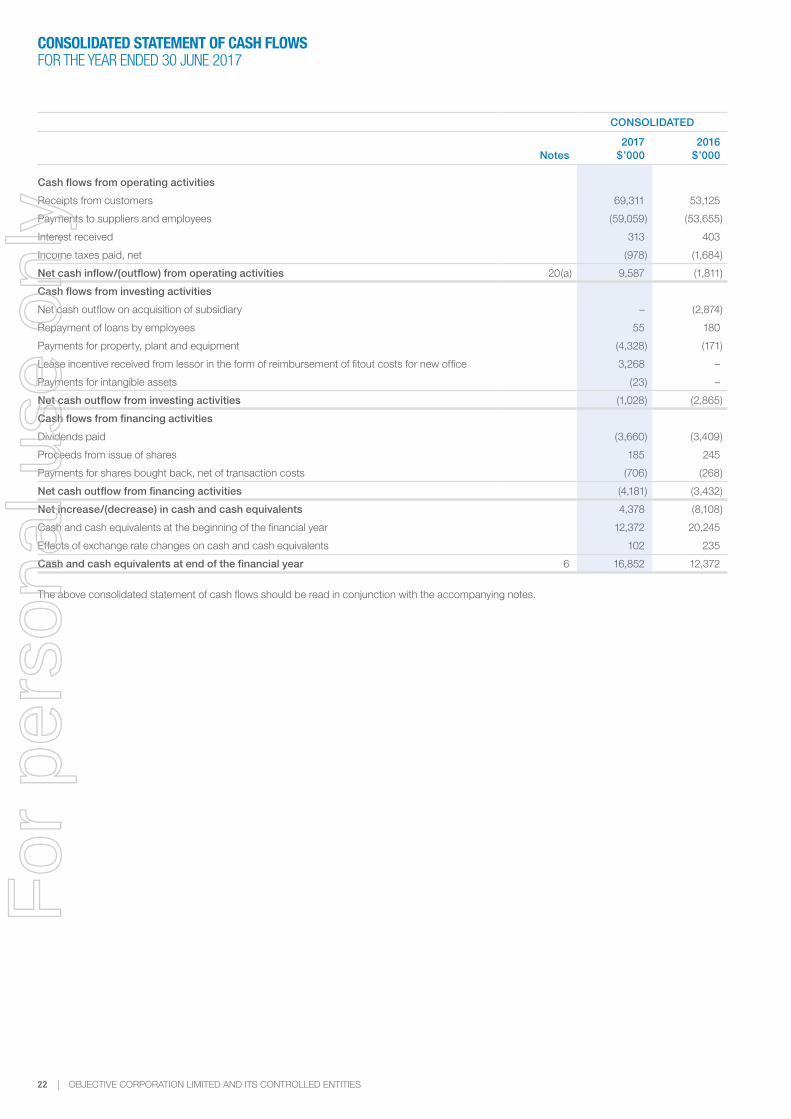
CONSOLIDATED STATEMENT OF CASH FLOWSFOR THE YEAR ENDED 30 JUNE 2017
CONSOLIDATED
Notes2017
$’0002016
$’000
Cash flows from operating activities
Receipts from customers 69,311 53,125
Payments to suppliers and employees (59,059) (53,655)
Interest received 313 403
Income taxes paid, net (978) (1,684)
Net cash inflow/(outflow) from operating activities 20(a) 9,587 (1,811)
Cash flows from investing activities
Net cash outflow on acquisition of subsidiary – (2,874)
Repayment of loans by employees 55 180
Payments for property, plant and equipment (4,328) (171)
Lease incentive received from lessor in the form of reimbursement of fitout costs for new office 3,268 –
Payments for intangible assets (23) –
Net cash outflow from investing activities (1,028) (2,865)
Cash flows from financing activities
Dividends paid (3,660) (3,409)
Proceeds from issue of shares 185 245
Payments for shares bought back, net of transaction costs (706) (268)
Net cash outflow from financing activities (4,181) (3,432)
Net increase/(decrease) in cash and cash equivalents 4,378 (8,108)
Cash and cash equivalents at the beginning of the financial year 12,372 20,245
Effects of exchange rate changes on cash and cash equivalents 102 235
Cash and cash equivalents at end of the financial year 6 16,852 12,372
The above consolidated statement of cash flows should be read in conjunction with the accompanying notes.
For
per
sona
l use
onl
y

ANNUAL REPORT 2017 | 23
NOTES TO THE FINANCIAL STATEMENTSFOR THE YEAR ENDED 30 JUNE 2017
NOTE 1. BASIS OF PREPARATIONThis section sets out the basis upon which the Group’s consolidated financial statements are prepared as a whole. Significant and other accounting policies that summarise the measurement basis used and are relevant to an understanding of the consolidated financial statements are provided throughout the notes to the consolidated financial statements. All other accounting policies are outlined in Note 30.
Statement of complianceObjective Corporation Limited is a limited company incorporated in Australia whose shares are publicly traded on the Australian Securities Exchange.
This general purpose financial report is prepared in accordance with the Corporations Act 2001 and applicable Accounting Standards and Interpretations, and complies with other requirements of the law. Objective Corporation Limited is a ‘for profit’ entity. The financial report includes the consolidated financial statements of Objective Corporation Limited and its controlled entities (the “Group”).
Accounting Standards include Australian Accounting Standards. Compliance with Australian Accounting Standards ensures that the financial statements and notes of the Group comply with International Financial Reporting Standards.
Basis of measurementThe financial report is based on historical cost, except for certain financial assets which are at fair value. In preparing this financial report, the Group is required to make estimates and assumptions about carrying values of assets and liabilities. These estimates and assumptions are based on historical experience and various other factors that are believed to be reasonable under the circumstances. Actual results may differ from these estimates. The estimates and underlying assumptions are reviewed on an ongoing basis.
The accounting policies adopted are consistent with those of the previous year, unless otherwise stated.
Basis of consolidationThe consolidated financial statements have been prepared by aggregating the financial statements of all the entities that comprise the Group, being Objective Corporation Limited and its controlled entities. In these consolidated financial statements:
• results of each controlled entity are included from the date Objective Corporation Limited obtains control and until such time as it ceases to control an entity; and
• all inter-entity balances and transactions are eliminated.
Control is achieved where Objective Corporation Limited is exposed to, or has rights to, variable returns from its involvement with an entity and has the ability to affect those returns through its power to direct the activities of the entity. Entities controlled by Objective Corporation Limited are under no obligation to accept responsibility for liabilities of other common controlled entities except where such an obligation has been specifically undertaken.
Business combinationThe Group applies the acquisition method to account for business combinations. The consideration transferred for the acquisition of a subsidiary is the fair values of the assets transferred, the liabilities incurred to the former owners of the acquiree and the equity interests issued by the Group. The consideration transferred includes the fair value of any asset or liability resulting from a contingent consideration arrangement. Identifiable assets acquired and liabilities and contingent liabilities assumed in a business combination are measured initially at their fair values at the acquisition date.
Acquisition-related costs are expensed as incurred.
CurrencyItems included in the financial statements of each of the Group’s entities are measured using the currency of the primary economic environment in which the entity operates (“the functional currency”). The consolidated financial statements are presented in Australian dollars, which is Objective Corporation Limited’s functional and presentation currency.
RoundingIn accordance with ASIC Corporations (Rounding in Financial/Directors’ Reports) Instrument 2016/191, amounts in the Directors’ Report and Financial Report have been rounded off to the nearest thousand Australian dollars unless otherwise indicated.
Comparative informationWhere applicable, comparative information has been reclassified in order to comply with current period disclosure requirements, the impact of which is not material to the financial report.
New or revised accounting standardsThe Group has adopted all amendments to Australian Accounting Standards which became applicable from 1 July 2016. There have been no new or revised accounting standards which materially impacted the financial report. New standards not yet applicable are discussed in Note 30.
Critical accounting judgments and key sources of estimation uncertaintyCritical judgments and key assumptions that management has made in the process of applying the Group’s accounting policies and that have the most significant effect on the amounts recognised in the consolidated financial statements are detailed in the notes below:
Note Judgement/Estimation
7, 10 Asset impairment
11 Recoverability of deferred tax assets
9, 10 Useful life for depreciable assets
13 Employee benefits assumptions
Estimates and judgements are continually evaluated and are based on historical experience and other factors, including reasonable expectations of future events.
Notes to the financial reportThe notes to the financial report are organised into the following sections.
Financial performance overview: provides a breakdown of individual line items in the statement of financial performance, and other information that is considered most relevant to users of the annual report.
Balance sheet items: provides a breakdown of individual line items in the statement of financial position that are considered most relevant to users of the annual report.
Capital structure and risk management: provides information about the capital management practices of the Group including the Group’s exposure to various financial risks, explains how these affect the Group’s financial position and performance and what the Group does to manage these risks.
Group structure: explains aspects of the Group structure and the impact of this structure on the financial position and performance of the Group.
Other: provides information on items which require disclosure to comply with Australian Accounting Standards and other regulatory pronouncements.
NOTE 2. SEGMENT INFORMATION
Operating and reportable segmentsThe Group has identified its operating segments based on the internal reports that are reviewed and used by the board of directors in their role as the chief operating decision makers (CODM) in assessing performance and in determining the allocation of resources. Operating segments are identified by management and the board of directors based on the nature of the core products and services offered. Reportable segments are based on operating segments determined by the similarity of the products produced and sold as these are the sources of the Group’s major risks and have the most effect on the rates of return. Each of the business units disclosed below has been determined as both an operating segment and reportable segment.
For
per
sona
l use
onl
y

24 | OBJECTIVE CORPORATION LIMITED AND ITS CONTROLLED ENTITIES
NOTES TO THE FINANCIAL STATEMENTSFOR THE YEAR ENDED 30 JUNE 2017
NOTE 2. SEGMENT INFORMATION CONTINUED
Operating segment Description
Objective ECM Includes results from the sale of Objective Enterprise Content Management related products which allow customers to manage information and process governance across the enterprise.
Objective Keystone Includes results from the sale of Objective Keystone products that improve efficiency and deliver governance in the process of authoring, reviewing, engaging with and publishing documents.
Objective Connect Includes results from the sale of Objective Connect products which enable customers to extend their information governance to the cloud.
Objective Trapeze Includes results from the sale of Objective Trapeze products which digitally transform development application plan reviews and assessments.
Corporate This segment is not considered an operating group, includes head office and central service groups including treasury function.
This represents a change from previous periods where management and the board of directors considered the financial performance of the business from a geographical perspective. As such, comparative information has been restated to reflect the reportable segments identified in the current year.
Management and the board of directors continue to consider the financial position of the business from a geographical perspective and as such the assets and liabilities of the Group are presented by geographical region for both the year ended 30 June 2017 and the comparative period.
Segment revenue represent invoiced sales subsequently adjusted for the deferred component which is recognised over the service period to arrive at revenue. Revenue from segments comprise product or licence sales, subscription services, professional services, training service and interest income.
The CODM assesses the performance of individual segments on the basis of earnings before interest expense, tax expense, depreciation and amortisation (EBITDA).
Allocation to segmentsSegment revenues and expenses are those that are directly attributable to a segment and the relevant portion that can be allocated to the segment on a reasonable basis.
Segment assets include all non-current assets and current assets with the exception of net deferred tax assets, current tax assets and other corporate assets including intangible assets, goodwill and investments.
The following is an analysis of the Group’s revenue and results by reportable segment for the financial year. Prior financial year comparative information has been reclassified to conform to current financial year presentation.
Year ended 30 June 2017
Objective ECM
$’000
ObjectiveKeystone
$’000
ObjectiveConnect
$’000
Objective Trapeze
$’000Corporate
$’000Total
$’000
Revenue from external customers 52,019 5,842 1,512 2,882 79 62,334
Interest revenue – – – – 265 265
Total revenue 52,019 5,842 1,512 2,882 344 62,599
Segment expenses (38,970) (6,230) (3,952) (2,481) (243) (51,876)
EBITDA 13,049 (388) (2,440) 401 101 10,723
Depreciation and amortisation (890)
Profit before income tax expense 9,833
Income tax expense (1,631)
Profit for the year 8,202
Year ended 30 June 2016*
Objective ECM
$’000
ObjectiveKeystone
$’000
ObjectiveConnect
$’000
Objective Trapeze
$’000Corporate
$’000Total
$’000
Revenue from external customers 43,356 4,248 1,077 970 – 49,651
Interest revenue – – – – 499 499
Total revenue 43,356 4,248 1,077 970 499 50,150
Segment expenses (33,760) (5,454) (3,632) (791) 265 (43,372)
EBITDA 9,596 (1,206) (2,555) 179 764 6,778
Depreciation and amortisation (713)
Profit before income tax expense 6,065
Income tax expense (802)
Profit for the year 5,263
* Comparative amounts have been restated for consistency with current year presentation.
For
per
sona
l use
onl
y

ANNUAL REPORT 2017 | 25
NOTES TO THE FINANCIAL STATEMENTSFOR THE YEAR ENDED 30 JUNE 2017
NOTE 2. SEGMENT INFORMATION CONTINUED
Reconciliation of revenue by locationRevenue is recognised in a subsidiary based on where the services are performed for a particular project. In the majority of cases, revenue per subsidiary will match the region in which the subsidiary operates.
CONSOLIDATED
2017$’000
2016$’000
Revenue by location
Australia 49,751 39,161
United Kingdom 7,779 8,053
New Zealand 5,037 2,893
Rest of world 32 43
Total revenue 62,599 50,150
Year ended 30 June 2017Asia Pacific
$’000Europe
$’000Total
$’000
Reportable segment assets 33,304 2,233 35,537
Reportable segment liabilities 19,532 4,180 23,712
Year ended 30 June 2016*Asia Pacific
$’000Europe
$’000Total
$’000
Reportable segment assets 24,078 2,147 26,225
Reportable segment liabilities 15,396 4,326 19,722
Reconciliation of reportable segment assets and liabilities
2017$’000
2016*$’000
Assets
Reportable segment assets 35,537 26,225
Intangible assets 9,452 10,754
Current tax assets 296 373
Deferred tax assets 913 342
Consolidated total assets 46,198 37,694
Liabilities
Reportable segment liabilities 23,712 19,722
Current tax liabilities 1,152 12
Consolidated total liabilities 24,864 19,734
Reconciliation of non-current assetsNon-current assets for this purpose consist of property, plant and equipment, intangible assets, deferred taxes and other receivables. Deferred taxes are not allocated to a specific location as they are also managed on a group basis. * Comparative amounts have been restated for consistency with current year presentation.
2017$’000
2016*$’000
Non-current assets by location of assets
Australia 5,066 1,242
United Kingdom 5,940 7,324
New Zealand 3,690 3,545
Unallocated non-current assets 913 342
Total non-current assets 15,609 12,453
For
per
sona
l use
onl
y

26 | OBJECTIVE CORPORATION LIMITED AND ITS CONTROLLED ENTITIES
NOTES TO THE FINANCIAL STATEMENTSFOR THE YEAR ENDED 30 JUNE 2017
NOTE 3. EARNINGS PER SHARE
CONSOLIDATED
2017 2016
Basic earnings per share – cents 9.0 5.8
Profit for the year attributable to shareholders of Objective Corporation Limited ($’000) 8,202 5,263
Weighted average number of ordinary shares used in the calculation of basic earnings per share 91,546,787 91,018,670
CONSOLIDATED
2017 2016
Diluted earnings per share – cents 8.9 5.7
Profit for the year attributable to shareholders of Objective Corporation Limited ($’000) 8,202 5,263
Weighted average number of ordinary shares used in the calculation of basic earnings per share1 92,214,400 92,186,125
1 Calculated by increasing the total weighted average number of shares used in calculating basic earnings per share by net outstanding options of 667,614. Options granted under the Employee Incentive Plan are included in the determination of diluted earnings per share to the extent to which they are dilutive.
NOTE 4. MATERIAL PROFIT OR LOSS ITEMSThe Group has identified a number of items which are material due to the significance of their nature and/or amount. These are listed separately here to provide a better understanding of the financial performance of the Group.
CONSOLIDATED
2017$’000
2016$’000
Product and service revenue 62,255 49,651
Other revenue:
Interest income 265 499
Sundry revenue 79 –
Total revenue 62,599 50,150
Expenses:
Depreciation expenses – property, plant and equipment (646) (484)
Amortisation expenses – intangible assets (244) (229)
Operating lease expenses (1,962) (2,032)
Employee benefits expenses (38,775) (31,592)
Superannuation expenses (2,444) (2,130)
Share based payment expenses (163) (48)
Research and development expenses (12,852) (11,259)
Other gains and losses:
Net foreign exchange gains/(losses) (150) 203
Net loss on disposal of property, plant and equipment (86) –
Recognition and measurementRevenue is measured at the fair value of the consideration receivable, and is recognised when each of the following conditions is met:
• persuasive evidence that an arrangement exists, which is usually in the form of a contractual arrangement;
• the seller’s price to the buyer is fixed or determinable;
• the significant risks and rewards of ownership of the goods have transferred from the Group to the buyer; and collectability is reasonably assured.For
per
sona
l use
onl
y

ANNUAL REPORT 2017 | 27
NOTES TO THE FINANCIAL STATEMENTSFOR THE YEAR ENDED 30 JUNE 2017
NOTE 4. MATERIAL PROFIT OR LOSS ITEMS CONTINUED
Product salesRevenue from the sale of product or licence fees is recognised at the earliest of when the Group has passed control of the relevant product or granted a right or licence for the use of the product to the buyer.
Subscription revenueIncome in respect of subscription licence, hosting and support services is deferred and released over the period of the contract with the customer.
Upgrade and support program (USP)/maintenance supportRevenue from USP and maintenance support is recognised over the period during which the relevant service is provided.
Rendering of servicesRevenue from cost plus contracts is recognised by reference to the recoverable costs incurred during the period plus time spent on each contract.
Interest incomeInterest income is earned from financial assets that are held for cash management purposes and recognised as it accrues, taking into account the effective yield on the financial asset.
Operating lease expensesPayments made under operating leases (net of any incentives received by the lessor) are expensed on a straight-line basis over the period of the lease unless another systematic basis is more representative of the time pattern of the benefit.
In the event that lease incentives are received to enter into operating leases, such incentives are recognised as a liability. The aggregate benefits of incentives are recognised as a reduction of rental expense on a straight-line basis over the term of the lease, except where another systematic basis is more representative of the time pattern in which economic benefits from the leased asset are consumed.
Employee benefits expenseEmployee benefits expense includes salaries, wages and other employment related entitlements.
Research and development expensesExpenditure on research and development activities is recognised in the consolidated statement of profit or loss as an expense when incurred.
Finance costsFinance costs relating to interest expenses are expensed in the period in which they are incurred.
Foreign currency transactions and balancesForeign currency transactions are translated into functional currency using the exchange rates prevailing at the date of the transaction. Foreign currency monetary items are translated at the year-end exchange rate. Non-monetary items measured at historical cost continue to be carried at the exchange rate at the date of the transaction. Non-monetary items measured at fair value are reported at the exchange rate at the date when fair values were determined.
Exchange differences arising on the translation of monetary items are recognised in profit or loss, except where deferred in equity as a qualifying cash flow or net investment hedge.
Exchange differences arising on the translation of non-monetary items are recognised directly in other comprehensive income to the extent that the underlying gain or loss is recognised in other comprehensive income; otherwise the exchange difference is recognised in profit or loss.
Gain/(loss) on disposal of property, plant and equipmentGains or losses arising from the retirement or disposal of tangible assets are determined as the difference between the estimated net disposal proceeds and the carrying amount of the assets and are recognised in profit or loss on the date of retirement or disposal.
For
per
sona
l use
onl
y

28 | OBJECTIVE CORPORATION LIMITED AND ITS CONTROLLED ENTITIES
NOTES TO THE FINANCIAL STATEMENTSFOR THE YEAR ENDED 30 JUNE 2017
NOTE 5. INCOME TAX EXPENSE
(a) Reconciliation of income tax expense to prima facie tax payable
CONSOLIDATED
2017$’000
2016$’000
Profit before income tax expense 9,833 6,065
Prima facie income tax expense calculated at the tax rate of 30% 2,950 1,819
Tax effect of amounts which are not deductible/(taxable) in calculating taxable income:
Amortisation expenses – intangibles 73 69
Share based payment expenses 49 14
Other non-allowable deductions 64 15
Subtotal 3,136 1,917
Different tax rates of subsidiaries operating in other jurisdictions 15 (10)
Adjustments for current tax of prior periods (94) (160)
Research and development tax credit (1,101) (786)
Previously unrecognised deductible temporary differences now recognised as deferred tax assets (298) (159)
Unused tax losses not recognised as deferred tax assets 58 –
Previously unrecognised tax losses now recouped to reduce current tax expense (85) –
Income tax expense 1,631 802
(b) Components of income tax expense
CONSOLIDATED
2017$’000
2016$’000
Current tax expense on profits for the year 2,297 934
Deferred tax expense related to movements in deferred tax balances (572) 28
Income tax (over)/under provided in prior years (94) (160)
Income tax expense 1,631 802
Recognition and measurementCurrent and deferred tax is recognised as an expense or income in the consolidated statement of profit or loss, except when it relates to items credited or debited directly to equity, in which case the deferred tax is also recognised directly in equity, or where it arises from the initial accounting for a business combination, in which case it is taken into account in the determination of goodwill.
Current tax represents the amount expected to be paid in relation to taxable income for the financial year measured using tax rates and tax laws that have been enacted or substantively enacted by the reporting date. Current tax for current and prior periods is recognised as a liability (or asset) to the extent that it is unpaid (or refundable).
Deferred income tax is provided in full, using the balance sheet liability method, on temporary differences arising between the carrying amounts of assets and liabilities for financial reporting and tax purposes. Deferred tax assets and liabilities are measured at the tax rates that are expected to apply to the period(s) when the asset and liability giving rise to them are realised or settled, based on tax rates (and tax laws) that have been enacted or substantively enacted by reporting date.
For
per
sona
l use
onl
y

ANNUAL REPORT 2017 | 29
NOTES TO THE FINANCIAL STATEMENTSFOR THE YEAR ENDED 30 JUNE 2017
BALANCE SHEET OVERVIEW
NOTE 6. CASH AND CASH EQUIVALENTSCash and cash equivalents at the end of the financial year are reflected in the related items in the consolidated statement of financial position as follows:
CONSOLIDATED
2017$’000
2016$’000
Current assets
Cash at bank and in hand 5,476 5,488
Short term bank deposits 11,376 6,884
Total cash and cash equivalents 1 16,852 12,372
1 The cash and cash equivalents disclosed above and in the consolidated statement of cash flows include $1,040,000 (2016: $426,000) in short term bank deposits which are restricted for use and held as security for rental guarantees.
Classification as cash equivalentsCash and cash equivalents comprise cash, bank balances and short term deposits with an original maturity of 4 months or less from acquisition.
NOTE 7. TRADE AND OTHER RECEIVABLES
CONSOLIDATED
2017 2016
Current $’000
Non-current$’000
Current $’000
Non-current$’000
Trade receivables 7,542 – 5,317 –
Allowance for impairment – – – –
7,542 – 5,317 –
Other receivables 946 – 1,395 –
Loans to employees – 805 – 755
Total trade and other receivables 8,488 805 6,712 755
Recognition and measurementTrade and other receivables are recognised initially at fair value and subsequently measured at amortised cost, less any allowance for impairment. An allowance for impairment is raised based on a review of outstanding balances at balance date. Bad debts are written off against the allowance for impairment account and any other change in the allowance for impairment account is recognised in the consolidated statement of profit or loss. An allowance for impairment is established when there is objective evidence that the Group will not be able to collect all amounts due according to the original terms of the receivables. Objective evidence that trade and other receivables are impaired includes default or delinquency by a debtor or indications that a debtor will enter administration.
Classification as trade and other receivablesTrade receivables are amounts due from customers for goods sold or services performed in the ordinary course of business. Loans and other receivables are non-derivative financial assets with fixed or determinable payments that are not quoted in an active market. If collection of the amounts is expected in one year or less they are classified as current assets. If not, they are presented as non-current assets. Trade receivables are generally due for settlement within 30 days and therefore are all classified as current. Further information relating to loans to employees is set out in Note 25.
The ageing of the Group’s trade and other receivables at reporting date together with impairment and other accounting policies for trade and other receivables are outlined in Note 21.
For
per
sona
l use
onl
y

30 | OBJECTIVE CORPORATION LIMITED AND ITS CONTROLLED ENTITIES
NOTES TO THE FINANCIAL STATEMENTSFOR THE YEAR ENDED 30 JUNE 2017
NOTE 8. OTHER ASSETS
CONSOLIDATED
2017$’000
2016$’000
Current assets
Accrued revenue 3,725 4,218
Prepayments 1,069 1,413
Rental deposits 159 153
Total other assets 4,953 5,784
Recognition and measurementRevenue from cost plus contracts with customers is recognised by reference to the recoverable costs incurred during the period plus time spent on each contract. Revenue accrual estimates are made to account for the unbilled period between the customer’s last billing date and the reporting date.
Prepayments are recognised for amounts paid whereby goods have not transferred ownership to the Group or where services have not yet been provided. Upon receipt of goods or the service the corresponding asset is recognised in the consolidated statement of profit or loss.
Rental deposits are bond payments made to the lessor under a lease agreement and may be refunded in whole or in part at the end of the leasing arrangement.
NOTE 9. PROPERTY, PLANT AND EQUIPMENT
CONSOLIDATED
Plant andequipment
$’000
Leaseholdimprovements
$’000Total
$’000
At 30 June 2017
Gross carrying amount – cost 3,177 4,064 7,241
Accumulated depreciation (2,197) (605) (2,802)
Total property, plant and equipment, net 980 3,459 4,439
Represented by:
Net carrying amount at 1 July 2016 447 155 602
Additions 1 823 3,748 4,571
Disposals (57) (29) (86)
Depreciation expenses (231) (415) (646)
Exchange differences (2) – (2)
Net carrying amount at 30 June 2017 980 3,459 4,439
At 30 June 2016
Gross carrying amount – cost 4,939 1,289 6,228
Accumulated depreciation (4,492) (1,134) (5,626)
Total property, plant and equipment, net 447 155 602
Represented by:
Net carrying amount at 1 July 2015 631 252 883
Additions 174 – 174
Acquisition of subsidiary (Note 23) 39 – 39
Disposals – – –
Depreciation expenses (387) (97) (484)
Exchange differences (10) – (10)
Net carrying amount at 30 June 2016 447 155 602
1 The office move by the Company to 177 Pacific Highway in December 2016 resulted in the recognition of additions to leasehold improvements of $3,268,000 and a corresponding lease incentive liability arising from lessor reimbursement for the costs incurred by the Company to complete fitout works. Refer Note 15 for further details.
For
per
sona
l use
onl
y

ANNUAL REPORT 2017 | 31
NOTES TO THE FINANCIAL STATEMENTSFOR THE YEAR ENDED 30 JUNE 2017
NOTE 9. PROPERTY, PLANT AND EQUIPMENT CONTINUED
Recognition and measurementProperty, plant and equipment are recorded at historical cost of acquisition less singular depreciation. Historical cost includes expenditure that is directly attributable to the acquisition of items. Subsequent costs are included in an asset’s carrying amount or recognised as a separate asset, as appropriate, only when it is probable that future economic benefits associated with the item will flow to the group and the cost of the item can be measured reliably. All other repairs and maintenance are charged to profit or loss during the reporting period in which they are incurred. The assets’ residual values and useful lives are reviewed, and adjusted if appropriate, at the end of each reporting period. An asset’s carrying amount is written down immediately to its recoverable amount if the asset’s carrying amount is greater than its estimated recoverable amount.
Critical accounting estimates and judgements – depreciation methods and useful livesProperty, plant and equipment comprises of furniture and fittings, office equipment, computer equipment and leasehold improvements. Depreciation is calculated using the straight-line method to allocate their cost, net of their residual values, over their estimated useful lives as follows:
Asset class Useful life
Plant and equipment 2 – 10 years
Leasehold improvements 2 – 7 years or shorter of lease term
Estimates of remaining useful lives, residual values and depreciation methods require significant management judgement, are reviewed annually, and where changes are made, their effects are accounted for on a prospective basis.
NOTE 10. INTANGIBLE ASSETS
CONSOLIDATED
Intellectualproperty
$’000
Brandnames$’000
Other intangibles
$’000Goodwill
$’000Total
$’000
30 June 2017
Gross carrying amount – cost 2,060 177 396 8,547 11,180
Accumulated amortisation (1,690) – (38) – (1,728)
Total intangible assets, net 370 177 358 8,547 9,452
Represented by:
Net carrying amount at 1 July 2016 774 171 359 9,450 10,754
Additions – – 23 – 23
Amortisation expenses (206) – (38) – (244)
Foreign exchange differences (198) 6 14 (903) (1,081)
Net carrying amount at 30 June 2017 370 177 358 8,547 9,452
30 June 2016
Gross carrying amount – cost 2,440 171 359 9,450 12,420
Accumulated amortisation (1,666) – – – (1,666)
Total intangible assets, net 774 171 359 9,450 10,754
Represented by:
Net carrying amount at 1 July 2015 950 – – 6,654 7,604
Acquisition of subsidiary (Note 23) – 171 359 2,955 3,485
Amortisation expenses (229) – – – (229)
Foreign exchange differences 53 – – (159) (106)
Net carrying amount at 30 June 2016 774 171 359 9,450 10,754
Recognition and measurementIntangible assets acquired in a business combination is recognised at fair value at the acquisition date. Intangible assets with finite useful life is stated at cost less accumulated amortisation and impairment losses.
GoodwillGoodwill represents the excess of the cost of an acquisition over the fair value of the share of the net identifiable assets acquired in a business combination. Goodwill is not amortised, but tested annually for impairment.
Intellectual propertyThe intellectual property was obtained through acquiring Limehouse Software in April 2009 and amortised over its estimated useful life.
Other intangible assetsIncludes customer relationship list arising from the acquisition of Onstream Systems Limited and measured at fair value at the date of acquisition and patents. Brand names of $177,000 (2016: $171,000) that have an indefinite life are assessed for recoverability annually. Customer relationship lists that have a defined useful life are amortised and subsequently carried net of accumulated amortisation. The carrying value of other intangible assets is allocated to the Group’s cash generating units (CGU) identified as Onstream Systems Limited.
For
per
sona
l use
onl
y
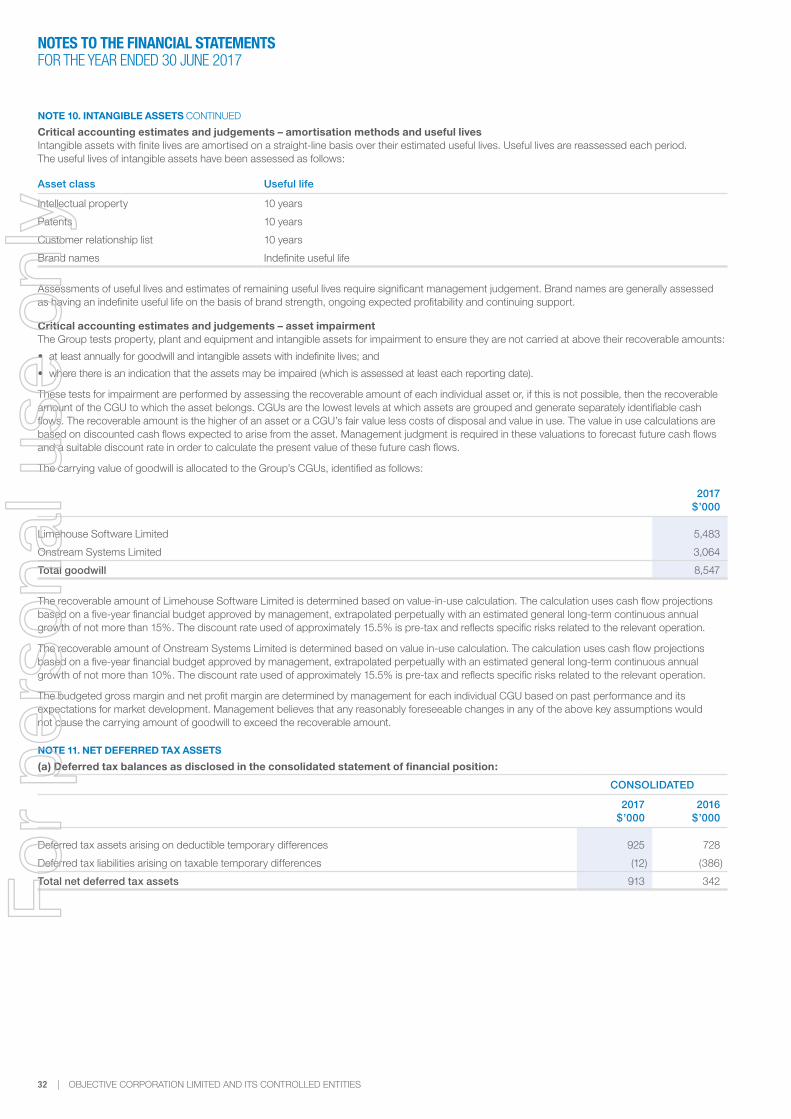
32 | OBJECTIVE CORPORATION LIMITED AND ITS CONTROLLED ENTITIES
NOTES TO THE FINANCIAL STATEMENTSFOR THE YEAR ENDED 30 JUNE 2017
NOTE 10. INTANGIBLE ASSETS CONTINUED
Critical accounting estimates and judgements – amortisation methods and useful livesIntangible assets with finite lives are amortised on a straight-line basis over their estimated useful lives. Useful lives are reassessed each period. The useful lives of intangible assets have been assessed as follows:
Asset class Useful life
Intellectual property 10 years
Patents 10 years
Customer relationship list 10 years
Brand names Indefinite useful life
Assessments of useful lives and estimates of remaining useful lives require significant management judgement. Brand names are generally assessed as having an indefinite useful life on the basis of brand strength, ongoing expected profitability and continuing support.
Critical accounting estimates and judgements – asset impairmentThe Group tests property, plant and equipment and intangible assets for impairment to ensure they are not carried at above their recoverable amounts:
• at least annually for goodwill and intangible assets with indefinite lives; and
• where there is an indication that the assets may be impaired (which is assessed at least each reporting date).
These tests for impairment are performed by assessing the recoverable amount of each individual asset or, if this is not possible, then the recoverable amount of the CGU to which the asset belongs. CGUs are the lowest levels at which assets are grouped and generate separately identifiable cash flows. The recoverable amount is the higher of an asset or a CGU’s fair value less costs of disposal and value in use. The value in use calculations are based on discounted cash flows expected to arise from the asset. Management judgment is required in these valuations to forecast future cash flows and a suitable discount rate in order to calculate the present value of these future cash flows.
The carrying value of goodwill is allocated to the Group’s CGUs, identified as follows:
2017$’000
Limehouse Software Limited 5,483
Onstream Systems Limited 3,064
Total goodwill 8,547
The recoverable amount of Limehouse Software Limited is determined based on value-in-use calculation. The calculation uses cash flow projections based on a five-year financial budget approved by management, extrapolated perpetually with an estimated general long-term continuous annual growth of not more than 15%. The discount rate used of approximately 15.5% is pre-tax and reflects specific risks related to the relevant operation.
The recoverable amount of Onstream Systems Limited is determined based on value in-use calculation. The calculation uses cash flow projections based on a five-year financial budget approved by management, extrapolated perpetually with an estimated general long-term continuous annual growth of not more than 10%. The discount rate used of approximately 15.5% is pre-tax and reflects specific risks related to the relevant operation.
The budgeted gross margin and net profit margin are determined by management for each individual CGU based on past performance and its expectations for market development. Management believes that any reasonably foreseeable changes in any of the above key assumptions would not cause the carrying amount of goodwill to exceed the recoverable amount.
NOTE 11. NET DEFERRED TAX ASSETS
(a) Deferred tax balances as disclosed in the consolidated statement of financial position:
CONSOLIDATED
2017$’000
2016$’000
Deferred tax assets arising on deductible temporary differences 925 728
Deferred tax liabilities arising on taxable temporary differences (12) (386)
Total net deferred tax assets 913 342For
per
sona
l use
onl
y

ANNUAL REPORT 2017 | 33
NOTES TO THE FINANCIAL STATEMENTSFOR THE YEAR ENDED 30 JUNE 2017
NOTE 11. NET DEFERRED TAX ASSETS CONTINUED
(b) Movement in deferred tax balances
CONSOLIDATED
30 June 2017
Opening balance
$’000
Charged to profit or loss
$’000
Exchange difference
$’000
Closing balance
$’000
Property, plant and equipment (34) 22 – (12)
Unrealised foreign exchange (333) 342 – 9
Employee benefits provision 696 139 (1) 834
Rent incentive provision 32 6 – 38
Other individually insignificant balances (19) 63 – 44
Total net deferred assets 342 572 (1) 913
(c) Tax losses
CONSOLIDATED
2017$’000
2016$’000
Unused tax losses for which no deferred tax asset has been recognised 3,311 3,669
Potential tax benefit 785 889
Potential tax assets of approximately $785,000 (2016: $889,000) attributable to unused tax losses carried forward by foreign owned subsidiaries have not been recognised as the availability of future taxable profits against which the assets can be utilised is not considered to be probable at 30 June 2017. The benefit for tax losses will only be obtained if the relevant member entities:
(i) derive future assessable income of a nature and amount sufficient to enable the benefit from the deductions for the losses to be realised; or
(ii) continue to comply with the conditions of deductibility imposed by tax legislation and no change in tax legislation adversely affects the relevant entities in realising the benefit from the deductions for the losses.
Recognition and measurementDeferred tax assets are recognised when temporary differences arise between the tax bases of assets and liabilities and their respective carrying amounts which give rise to a future tax benefit, or when a benefit arises due to unused tax losses. In both cases, deferred tax assets are recognised only to the extent that it is probable that future taxable amounts will be available to utilise those temporary differences or tax losses. Deferred tax liabilities are recognised when such temporary differences will give rise to taxable amounts that are payable in future periods.
Deferred tax assets and liabilities are recognised at the tax rates expected to apply when the assets are recovered or the liabilities are settled under enacted or substantively enacted tax law.
Deferred tax assets and liabilities are offset when there is a legally enforceable right to offset current tax assets and liabilities and when the deferred tax balances relate to the same taxation authority. Current tax assets and liabilities are offset when there is a legally enforceable right to offset and an intention to either settle on a net basis, or realise the asset and settle the liability simultaneously. Current and deferred taxes attributable to amounts recognised directly in equity are also recognised directly in equity.
Critical accounting estimates and judgements – recoverability of deferred tax assetsThe Group exercises judgement in determining whether deferred tax assets, particularly in relation to tax losses, are probable of recovery. Factors considered include the ability to offset tax losses within the groups of entities in different tax jurisdictions, the nature of the tax loss, the length of time that tax losses are eligible for carry forward to offset against future taxable profits and whether future taxable profits are expected to be sufficient to allow recovery of deferred tax assets.
The Group is subject to income taxes in Australia and jurisdictions where it has foreign operations. The tax expense and deferred tax balances assume certain tax outcomes and values of assets in relation to the application of tax legislation as it applies to the Group’s entities. Judgement is required in determining the provisions for income taxes and in assessing whether deferred tax balances are to be recognised in the statement of financial position. Changes in tax legislation or the interpretation of tax laws by tax authorities may affect the amount of provision for income taxes and deferred tax balances recognised.
For
per
sona
l use
onl
y

34 | OBJECTIVE CORPORATION LIMITED AND ITS CONTROLLED ENTITIES
NOTES TO THE FINANCIAL STATEMENTSFOR THE YEAR ENDED 30 JUNE 2017
NOTE 12. TRADE AND OTHER PAYABLES
CONSOLIDATED
2017$’000
2016$’000
Trade payables and accruals 3,691 3,354
Goods and services tax payable, net 1,074 2,212
Dividends payable 71 67
Total trade and other payables 4,836 5,633
Recognition and measurementTrade and other payables are recognised when the Group becomes obliged to make future payments resulting from the purchase of goods and services. Payables are stated at their amortised cost.
Accruals comprised largely of accruals for staff costs, advertising and promotion expenses and miscellaneous operating expenses. Other creditors and accruals are expected to be settled or recognised as income within one year or are repayable on demand.
Revenues, expenses and assets are recognised net of the amount of goods and services tax (GST), except where the amount of GST incurred is not recoverable from the taxation authority. In these circumstances, the GST is recognised as part of the cost of purchase of the asset or as part of the expense.
Receivables and payables are stated with the amount of GST included. The net amount of GST recoverable from or payable to the taxation authority is included as a current asset or liability. Cash flows are included in the statement of cash flows on a gross basis. The GST components of cash flows arising from investing and financing activities which are recoverable from or payable to the taxation authority are classified as operating cash flows.
NOTE 13. PROVISIONS
CONSOLIDATED
2016$’000
Charged to profit or loss
$’000
Settled/paid$’000
2017$’000
Current
Employee benefits 2,233 709 (355) 2,587
Total current provisions 2,233 709 (355) 2,587
Non-current
Employee benefits 261 12 – 273
Total non-current provisions 261 12 – 273
Total provisions 2,494 721 (355) 2,860
Recognition and measurementProvision is recognised when the Group has a present legal or constructive obligation as a result of a past event, it is probable that an outflow of economic benefits will be required to settle the obligation, and a reliable estimate can be made as to the amount of the obligation. The amount recognised is the best estimate of the consideration required to settle the present obligation at the reporting date, taking into account the risks and uncertainties surrounding the obligation.
A provision is made for benefits accruing to employees in respect of annual leave and long service leave. Liabilities expected to be settled within 12 months are measured at their nominal values using the remuneration rate expected to apply at the time of settlement.
Liabilities which are not expected to be settled within 12 months are measured as the present value of the estimated future cash outflows to be made by the Group in respect of services provided by employees up to the reporting date.
Critical accounting estimates and judgements – employee benefits assumptionsIn estimating the value of employee benefits, consideration is given to expected future salary and wage levels (including on-cost rates), experience of employee departures and periods of service. The assumptions are reviewed periodically and given the nature of the estimate, reasonably possible changes in assumptions are not considered likely to have a material impact.
Where a provision is measured using the cash flows estimated to settle the obligation, the cash flows are discounted using a pre-tax rate that reflects current market assessments of the time value of money and the risks specific to the liability. Discount rates are reviewed periodically and given the nature of the estimate, reasonably possible changes are not considered likely to have a material impact.
For
per
sona
l use
onl
y

ANNUAL REPORT 2017 | 35
NOTES TO THE FINANCIAL STATEMENTSFOR THE YEAR ENDED 30 JUNE 2017
NOTE 14. DEFERRED REVENUE
CONSOLIDATED
2017 2016
Current $’000
Non-current$’000
Current $’000
Non-current$’000
Deferred revenue 12,723 – 11,422 32
Total deferred revenue 12,723 – 11,422 32
Recognition and measurementThe Group recognises revenue for its subscription based products and services over the related service period. The Group generally invoices customers in advance of the services either through upfront fees, fixed fees or through annual, quarterly or monthly instalments. Deferred revenue represents the billed, receipted and unearned portion of existing fees which will be recorded as revenue in the consolidated statement of profit or loss over the contract period or as the services are delivered.
NOTE 15. OTHER LIABILITIES
CONSOLIDATED
2017 2016
Current $’000
Non-current$’000
Current $’000
Non-current$’000
Lease incentives 458 2,835 33 108
Total other liabilities 458 2,835 33 108
Recognition and measurementThe provision for lease incentives represents the unamortised balance of incentives received to enter into an operating lease. The incentive received is recognised as a reduction of rental expense on a straight-line basis over the term of the operating lease.
NOTE 16. ISSUED CAPITAL
CONSOLIDATED
2017 2016
Number ofshares $’000
Number ofshares $’000
Share capital
91,768,041 fully paid ordinary shares (2016: 91,165,169)
Movement:
Opening balance 91,165,169 3,631 90,797,277 3,048
Issue of shares 1 1,004,000 289 330,000 246
Acquisition of subsidiary (Note 23) – – 200,000 337
Share buy-backs 2 (401,128) – (162,108) –
Closing balance 91,768,041 3,920 91,165,169 3,631
1 Represents issue of ordinary shares as a result of options exercised under the Group’s Employee Incentive Plan. Refer Note 25.
2 The payment for share buy backs are recognised in a share buy-back reserve within equity.
Share capitalHolders of ordinary shares are entitled to receive dividends as declared and are entitled to one vote per share at shareholders’ meetings. In the event of winding up of the Company, ordinary shareholders rank after all other shareholders and creditors and are fully entitled to any proceeds of liquidation. The ordinary shares have no par value and the Company does not have a limited amount of authorised capital. Capital raising costs are deducted from contributed equity.
Options issued during the year under the Employee Incentive PlanThe Company issues employee share options pursuant to the Employee Incentive Plan. Under the terms and conditions of the current Employee Incentive Plan, selected employees are granted the right to acquire shares at a nominated exercise price subject to agreed service and performance criteria (i.e. vesting conditions) being satisfied. On satisfaction of the vesting conditions the shares are issued to the employee with the exercise price being financed by a limited recourse loan. No amount is paid or payable by the employee on receipt of these shares. Dividends declared and paid on the issued shares are for the benefit of the employee. The employee is not permitted to deal in the shares until the limited recourse loan has been repaid.
Specific terms of the option and loan agreement previously offered to employees, but no longer in effect result in loans to these employees being recognised as a loan receivable until fully repaid and the value of the shares acquired included in share capital. Limited recourse loans issued under the current terms of the Employee Incentive Plan are characterised as options for reporting purposes.
Each option entitles the holder to the right to acquire one ordinary share at the nominated exercise price during the period commencing on the vesting date of the options.
For
per
sona
l use
onl
y

36 | OBJECTIVE CORPORATION LIMITED AND ITS CONTROLLED ENTITIES
NOTES TO THE FINANCIAL STATEMENTSFOR THE YEAR ENDED 30 JUNE 2017
NOTE 16. ISSUED CAPITAL CONTINUED
Options issued during the year under the Employee Incentive Plan continuedAt 30 June 2017 a total of 1,980,000 (2016: 2,384,000) employee share options are outstanding.
2017 2016
Numberof options
outstanding Expiry dateExercise
price
Fair value per option at
grant date
Numberof options
outstanding
1 September 2006 – 01/09/2016 $0.50 $0.25 204,000
5 February 2014 – 05/02/2024 $0.50 $0.25 250,000
7 October 2014 200,000 07/10/2024 $0.50 $0.61 200,000
24 March 2014 125,000 24/03/2024 $0.75 $0.18 500,000
7 October 2014 80,000 07/10/2024 $1.00 $0.52 80,000
24 February 2015 150,000 24/02/2025 $1.17 $0.43 150,000
5 March 2015 675,000 05/03/2025 $1.20 $0.33 1,000,000
29 July 2016 250,000 29/07/2026 $1.50 $0.41 –
2 January 2017 500,000 02/01/2027 $1.80 $0.41 –
Total options on issue 1,980,000 2,384,000
During the year 750,000 new options were granted (2016: nil) and 1,004,000 options were exercised into ordinary shares (2016: 330,000). The weighted average exercise price for options exercised was $0.72 and the weighted average share price at the date of issue was $1.90. The weighted average fair value of options issued in FY2017 was $0.41 per option. The weighted average exercise price on issue was $1.67 and the weighted average share price at grant date was $1.69. The fair value was determined using Black-Scholes option pricing model using a 10-year time period to expiration. Assumptions for expected volatility and dividend yield were based on historic data. Inputs for risk free rate and grant date share price was determined by the prevailing prices on the day of issue.
NOTE 17. DIVIDENDS AND FRANKING CREDITS
(a) Dividends
Dividend typeCents per
share Franking
Total amount
$’000 Date paid/payable
2013 Final 2.00 100% 2,015 13 September 2013
2013 Special 1.00 Nil 1,008 13 September 2013
2014 Final 3.50 100% 3,089 15 September 2014
2015 Final 3.75 100% 3,409 9 September 2015
2016 Final 4.00 100% 3,665 14 September 2016
2017 Final 1 4.00 100% 3,671 14 September 2017
2017 Special 1 1.00 Nil 918 14 September 2017
1 The final dividend and special dividend for the year ended 30 June 2017 has not been recognised in this financial report because it was resolved to be paid after 30 June 2017.
(b) Franking credits
2017$’000
2016$’000
The balance of franking credit account at balance date adjusted for the payment of provision for income tax 278 712
For
per
sona
l use
onl
y

ANNUAL REPORT 2017 | 37
NOTES TO THE FINANCIAL STATEMENTSFOR THE YEAR ENDED 30 JUNE 2017
NOTE 18. RESERVES
CONSOLIDATED
Share buy-back
reserve$’000
Share-based
payments reserve
$’000
Foreign currency
translationreserve
$’000Total
$’000
30 June 2017
Opening balance (9,569) 290 (344) (9,623)
Share-based payment – 163 – 163
Share buy-backs (706) – – (706)
Translation of foreign operations – – (909) (909)
Closing balance (10,275) 453 (1,253) (11,075)
30 June 2016
Opening balance (9,300) 242 (466) (9,524)
Share-based payments – 48 – 48
Share buy-backs (269) – – (269)
Translation of foreign operations – – 122 122
Closing balance (9,569) 290 (344) (9,623)
Nature and purpose of reservesShare buy-back reserveThe share buy-back reserve represents the value of the Company’s shares which were purchased and subsequently cancelled. The cancellation of the shares creates a non-distributable reserve. During the financial year, the Company bought back and cancelled 401,128 (2016: 162,108) of its ordinary shares at a total cost of $706,000 (2016: $269,000).
Foreign currency translation reserveExchange differences arising on translation of the financial statements of the Group’s foreign controlled entities into Australian dollars are in other comprehensive income and accumulated in a separate reserve within equity.
Share-based payments reserveThe share-based payments reserve is used to recognise the share based payments expense resulting from the value of share options issued to key management personnel and employees under the Group’s Employee Incentive Plan. Further information about share-based payments to employees is made in Note 25.
NOTE 19. RETAINED EARNINGS
(a) Summary of movement in consolidated retained earnings
CONSOLIDATED
2017$’000
2016$’000
Balance at 1 July 23,952 22,098
Profit for the year 8,202 5,263
Dividends paid for or provided (Note 17(a)) (3,665) (3,409)
Balance at 30 June 28,489 23,952
For
per
sona
l use
onl
y

38 | OBJECTIVE CORPORATION LIMITED AND ITS CONTROLLED ENTITIES
NOTES TO THE FINANCIAL STATEMENTSFOR THE YEAR ENDED 30 JUNE 2017
NOTE 20. CASH FLOW INFORMATION
(a) Reconciliation of profit for the year to net cash inflow/(outflow) from operating activities
CONSOLIDATED
2017$’000
2016$’000
Profit for the year 8,202 5,263
Adjustments:
Depreciation and amortisation expenses 890 713
Non-cash employee benefits expense – share based payments 163 48
Net loss on disposal of property, plant and equipment 86 –
Net unrealised foreign exchange differences 63 –
Change in operating assets and liabilities:
(Increase)/decrease in trade and other receivables (1,991) 2,058
Decrease/(increase) in other operating assets 843 (3,544)
(Decrease)/increase in trade and other payables (601) 28
Increase/(decrease) in deferred revenue 1,269 (5,130)
Increase/(decrease) in current tax balances 1,225 (776)
(Increase)/decrease in deferred tax assets (572) (13)
Increase/(decrease) in provisions 367 (136)
(Decrease)/increase in other operating liabilities (357) (322)
Net cash inflow/(outflow) from operating activities 9,587 (1,811)
(b) Non-cash investing activitiesDuring the current year, the Group entered into the following non-cash investing activities which are not reflected in the consolidated statement of cash flows:
CONSOLIDATED
2017$’000
2016$’000
Recognition of non-cash lease incentives received from lessors 243 –
For
per
sona
l use
onl
y

ANNUAL REPORT 2017 | 39
NOTES TO THE FINANCIAL STATEMENTSFOR THE YEAR ENDED 30 JUNE 2017
NOTE 21. FINANCIAL RISK MANAGEMENT AND FAIR VALUESExposure to credit, liquidity, interest rate and currency risks arises in the normal course of the Group’s business. The Group’s exposure to these risks and the financial risk management policies and practices used by the Group to manage these risks are described below.
(a) Credit riskFinancial assets which potentially subject the Group to credit risk consist principally of cash, short-term deposits and trade debtors. The Group’s deposits and cash are placed with major financial institutions with sound credit ratings. Trade debtors are presented net of the allowance for impairment losses.
Credit risk with respect to trade debtors is limited due to the large number of customers comprising the Group’s customer base are government organisations or their diverse dispersion across different industries and geographical areas. Accordingly, the Group has no significant concentration of credit risk. The Group manages credit risks by monitoring credit ratings and limiting the aggregate risk to any individual counterparty.
The below table summarises the Group’s exposure to credit risk at the end of the reporting period:
CONSOLIDATED
2017$’000
2016$’000
Cash and cash equivalents 16,852 12,372
Trade and other receivables 8,488 6,712
Ageing analysis of trade and other receivables is as follows:
Fully performing debts 6,013 6,338
Past due more than 30 days 1 1,800 134
Past due more than 60 days 1 81 99
Past due more than 90 days 1 594 141
Total 8,488 6,712
1 The Group did not consider a credit risk on the aggregate balances after reviewing the credit terms of customers based on recent collection practices. Trade receivables past due and not impaired at 30 June 2017 is $2,475,000.
(b) Currency riskThe Group is exposed to foreign currency risk primarily as a result of its global operations. The Group also has transactional currency exposures arising from sales and purchases that are denominated in currencies other than the functional currency of the operations to which they relate. The currencies giving rise to foreign currency risk are primarily denominated in Pounds Sterling (GBP), United Stated dollars (USD), New Zealand dollars (NZD) and Singapore dollars (SGD).
Foreign currency risk is defined as the fair value of future cash flows of a financial instrument fluctuating because of changes in foreign exchange rates. The sensitivity analysis provided does not include the currency risk of financial assets and liabilities of the controlled entities denominated in the controlled entity’s functional currency or their conversion into the functional currency of Objective Corporation Limited on consolidation as outside the scope of the definition. The conversion of these financial assets and liabilities on consolidation may result in a gain or loss to the consolidated entity.
The Group’s exposure is to the movement in foreign exchange rates is partly mitigated by a natural hedge arising from operations in these countries. The Group regularly monitors its foreign currency exposure which includes considering the level of cash in foreign currency and cash flow forecasting.
Sensitivity analysisThe table below summarises the instantaneous change in the Group’s profit after tax and total equity that would arise had the Australian dollar strengthened/weakened by 10% against the respective foreign currencies to which the Group has significant exposure at the end of the reporting period, assuming all other risk variables remained constant. The 10% sensitivity is based on reasonably possible changes, over a financial year.
CONSOLIDATED
Movement inexchange rate
%
Sensitivityof profitafter tax
$’000
Sensitivity oftotal equity
$’000
30 June 2017
New Zealand dollars +10% 120 120
Total 120 120
New Zealand dollars –10% (147) (147)
Total (147) (147)
30 June 2016
New Zealand dollars +10% 228 228
Total 228 228
New Zealand dollars –10% (228) (228)
Total (228) (228)
For
per
sona
l use
onl
y

40 | OBJECTIVE CORPORATION LIMITED AND ITS CONTROLLED ENTITIES
NOTES TO THE FINANCIAL STATEMENTSFOR THE YEAR ENDED 30 JUNE 2017
NOTE 21. FINANCIAL RISK MANAGEMENT AND FAIR VALUES CONTINUED
(c) Liquidity riskLiquidity risk management requires maintaining sufficient cash by continuously monitoring forecast and actual cash flows and matching the maturity profiles of financial assets and liabilities. The Group’s approach to managing liquidity is to ensure, as far as possible, that it will always have sufficient liquidity to meet its liabilities when due, without incurring unacceptable losses or risking damage to the Group’s reputation.
The Group continues to assess its liquidity risk as low. The below table summarises the exposure of the Group to liquidity risk for all financial assets and liabilities of the Group at reporting date and which fall due within 12 months.
CONSOLIDATED
30 June 2017 $’000 $’000
Cash and cash equivalents 16,852 12,372
Receivables 8,488 6,712
Payables (4,836) (5,633)
Net financial assets 20,504 13,451
As the Group is in a net financial assets position, the Directors are of the opinion that the Group is in low risk and will be able to pay off its debts as and when they are due and payable.
Capital managementThe Board’s policy is to maintain a strong capital base so as to maintain investor, creditor and market confidence and to sustain future development of business. The Board monitors the return on capital and the level of dividends to ordinary shareholders. There were no significant changes in the Group’s approach to capital management during the year.
Fair values measurement of financial instrumentsThe fair values of trade debtors, deposits and cash and trade creditors and accruals approximate their carrying amounts due to the short-term maturities of these assets and liabilities.
All financial instruments are carried at amounts not materially different from their fair values as at 30 June 2016 and 30 June 2017.
Financial instruments carried at fair valueThe Group’s financial instruments are measured at fair value at the end of the reporting period on a recurring basis, categorised into three-level fair value hierarchy as defined in IFRS 13, Fair Value Measurement. The level into which a fair value measurement is classified and determined with reference to the observability and significance of the inputs used in the valuation technique as follows:
• Level 1 valuations: Fair values measured using only Level 1 inputs i.e. unadjusted quoted prices in active markets for identical assets or liabilities at the measurement date
• Level 2 valuations: Fair values measured using Level 2 inputs i.e. observable inputs which fail to meet Level 1, and not using significant unobservable inputs. Unobservable inputs are inputs for which market data are not available
• Level 3 valuations: Fair values measured using significant unobservable inputs
During the year ended 30 June 2017, there were no transfers between Level 1 and Level 2, or transfers into or out of Level 3 of the fair value hierarchy classifications.
For
per
sona
l use
onl
y

ANNUAL REPORT 2017 | 41
NOTES TO THE FINANCIAL STATEMENTSFOR THE YEAR ENDED 30 JUNE 2017
GROUP STRUCTURE
NOTE 22. SUBSIDIARIESDetails of the Company’s interest in all subsidiaries as at each reporting date are set out below:
Ownership
Name of subsidiary Country of Incorporation 2017 2016
Objective Corporation Solutions NZ Limited New Zealand 100% 100%
Objective Corporation Singapore Pte Limited Singapore 100% 100%
Objective Corporation North America Inc United States of America 100% 100%
Objective Corporation USA Inc United States of America 100% 100%
Objective Corporation UK Limited United Kingdom 100% 100%
Limehouse Software Limited United Kingdom 100% 100%
Onstream Systems Limited New Zealand 100% 100%
NOTE 23. BUSINESS COMBINATIONS
Acquisition of Onstream Systems LimitedOn 26 February 2016, the Group acquired 100% of the shares in Onstream Systems Limited (Onstream), a New Zealand headquartered company which specialises in the capture, collaboration and manipulation of large documents, complex drawings, maps and plans. The total cash consideration was $2,873,911. The acquisition was strategic as it enhances the Group’s product offering.
Details of the net assets acquired and goodwill in respect of the acquisition of Onstream at acquisition date were:
$’000
Cash paid 2,874
Ordinary shares issued 337
Total consideration 3,211
Assets acquired and liabilities assumed
Trade receivables 393
Other receivables 76
Property, plant and equipment 39
Deferred tax assets 156
Trade and other payables (172)
Provisions (82)
Deferred revenue (684)
Identifiable intangible assets 1 530
Fair value of net assets acquired 256
Goodwill arising on acquisition 1 2,955
1 On acquisition of the subsidiary, the company acquired identifiable intangible assets including brand names and customer relationship lists. At the date of issue of the 30 June 2016 annual report, the necessary acquisition accounting calculations had not been finalised. Subsequently, the fair value of intangible assets acquired have been determined as soon as practicable and within one year as required under AASB 3: Business Combinations. Details of this business combination are reflected in this consolidated financial statements on a retrospective basis.
For
per
sona
l use
onl
y

42 | OBJECTIVE CORPORATION LIMITED AND ITS CONTROLLED ENTITIES
NOTES TO THE FINANCIAL STATEMENTSFOR THE YEAR ENDED 30 JUNE 2017
NOTE 23. BUSINESS COMBINATIONS CONTINUED
Acquisition-related costsThe Group incurred acquisition related costs of $34,000 related to legal fees and other costs on acquisition of Onstream Systems Limited. These costs have been recorded as expenses as the costs were incurred except where the costs related to the issue of shares and have been recorded as a reduction to equity.
Revenue and profit contributionFrom the date of acquisition to 30 June 2016, Onstream contributed a total revenue of $968,035 and a net profit after tax of $193,850 to the Group.
Critical accounting estimates and judgements – purchase price allocationFor the business combinations undertaken by the Group, the Group allocates the costs of the acquisition to the assets acquired and the liabilities assumed based on their estimated fair value on the date of acquisition. This process is commonly referred to as the purchase price allocation. As part of the purchase price allocation, the Group is required to determine the fair value of any identifiable intangible assets acquired.
The determination of the fair value of the intangible assets acquired involves certain judgement and estimates. These judgements can include, but are not limited to, the cash flows that an asset is expected to generate in the future.
The fair values of the identifiable intangible assets were determined by the Group with inputs from the independent appraisers using mainly the income approach. Future cash flows are predominantly based on the historical pricing and expense levels, taking into consideration the relevant market size and growth factors, and involves making a number of assumptions including growth rates, royalty rates and product life cycles. The resulting cash flows are then discounted at a rate reflecting specific risks related to the relevant operation.
A change in the amount allocated to identifiable intangible assets would have an offsetting effect on the amount of goodwill recognised from the acquisition and would change the amount of amortisation expense recognised related to those identifiable intangible assets.
NOTE 24. PARENT ENTITY DISCLOSURES
(a) Summary statement of financial position
2017$’000
2016$’000
Current assets 22,326 18,821
Non-current assets 16,689 10,793
Total assets 39,015 29,614
Current liabilities 18,866 13,313
Non-current liabilities 273 401
Total liabilities 19,139 13,714
Share capital 3,920 3,631
Reserves (9,822) (9,279)
Retained earnings 25,778 21,548
Total equity 19,876 15,900
(b) Summary statement of profit or loss and other comprehensive income
2017$’000
2016$’000
Profit for the year 7,895 4,727
Total comprehensive income for the year 7,895 4,727
(c) Contingent liabilitiesThe parent entity, Objective Corporation Limited (the Company) has entered into commercial property leases as Lessee. In the event the Company ceases to be the Lessee under the lease or occupy the premises, whether by virtue of default and termination of the lease or otherwise, the Company may be subject to claims for payment of liquidated damages based on a percentage of the lease incentives initially received under the lease. Refer Note 28 for details.
Additionally, a performance guarantee has been provided by the Company to Objective Corporation UK Limited (subsidiary) with regards to the provision of software support services on the signing of the new 5 year contract with the Scottish Government.
The Company continues to support its subsidiaries in their operations, by way of financial support.
(d) Company detailsThe registered office and principal place of business of the Company is:
Level 30, 177 Pacific Highway, North Sydney NSW 2060, Australia.
For
per
sona
l use
onl
y

ANNUAL REPORT 2017 | 43
NOTES TO THE FINANCIAL STATEMENTSFOR THE YEAR ENDED 30 JUNE 2017
OTHER
NOTE 25. SHARE BASED PAYMENTS
Employee Incentive PlanObjective Corporation Limited has an Employee Incentive Plan (the Plan) which was approved at the 2003 Annual General Meeting of the Company. The Plan is described as follows:
OffersUnder the Plan the Board may offer to any employee either options to acquire shares or loans to acquire shares in the Company. Tony Walls, Chief Executive Officer and Gary Fisher, Non-Executive Director will not be participating in the Plan.
The options expire ten years after the date of grant and vest upon grant; however, they are not exercisable until one year after grant and released in four equal tranches on each anniversary of grant date. If a participant under the Plan ceases to be employed by the Company, any unexercised option will be forfeited immediately.
PriceThe Board has discretion to grant options for a fee and set the exercise price and term of the options.
QuotationOptions issued under the Plan will not be quoted on the ASX. Where the Company issues options and the options are exercised, the Company will apply to have the issued shares quoted on the ASX.
Maximum number of shares or optionsThe Company must not issue shares or options to any employee if to do so would contravene applicable laws or result in any employee holding an interest in more than 5% of the shares in the Company.
Sales restrictionsOptions issued under the Plan are not transferable. Shares acquired under the Plan are not transferable unless any loan to acquire the shares has been repaid in full.
New sharesAll shares issued on the exercise of options will rank equally with all existing shares from the date of issue.
DividendsAll shares acquired pursuant to the Plan rank equal in all respects and will be entitled to any dividends declared by the Company. Any dividends paid on shares acquired under the Plan will be offset against the loan balance outstanding to acquire shares under the Plan. Options issued under the Plan are not entitled to dividends.
RestrictionsThe Board may impose vesting and performance conditions before which options cannot be exercised or the shares sold. The options issued pursuant to the Plan will usually lapse and the loans to acquire shares will usually become repayable if the holder ceases to be an employee.
Participation in future issuesUnder the Employee Option Plan’s rules, the number of shares over which an option is granted and/or the exercise price of the options may be altered in the event of a reconstruction of the Company’s share capital or a bonus or rights issue of shares to shareholders. Shares acquired under the Plan will rank equal in all respects with existing shares.
LoansThe Board has discretion to provide a loan for the acquisition of shares in the Company under terms and conditions as set out in the loan agreement.
NOTE 26. RELATED PARTY DISCLOSURESThe parent entity in the Group is Objective Corporation Limited. Details of transactions between the Group and other related parties are disclosed below.
(a) Loans to management personnelDetails of loan balances to management personnel and loan repayments, if any, are set out in Notes 7, 25 and the Remuneration Report. Loans are provided interest free. There have been no write downs or allowances for impairment losses.
(b) Other transactions with directors or other key management personnelOther transactions entered into during the financial year with directors of Objective Corporation Limited and other key management personnel of the Group and with their closely related entities which are within normal customer or employee relationships on terms and conditions no more favourable than those available to other customers, employees or shareholders included:
• contracts of employment (refer Remuneration Report) and reimbursement of expenses;
• equity holdings and acquisition of shares in Objective Corporation Limited under the employee share plans; and
• dividends from shares in Objective Corporation Limited.
(c) Key management personnel remunerationTotal remuneration paid or payable to directors and key management personnel is set out below:
CONSOLIDATED
2017$
2016$
Short-term employee benefits 639,879 2,240,575
Post-employment benefits 43,221 134,344
Share-based payments expense 55,277 47,724
Total remuneration paid or payable 738,377 2,422,643
Details of remuneration and the Objective Corporation Limited equity holdings of directors and other key management personnel are shown in the Remuneration Report on pages 15 to 16.
(d) Other related partiesDuring the year the Group was provided management consulting services and was charged $39,966 (2016: $32,445) by Kingsbury Ventures Limited, a company associated with Nick Kingsbury, a Non-Executive Director of the Company. These transactions were conducted on normal commercial terms and conditions. At 30 June 2017 there were no amounts owing to Kingsbury Ventures Limited (2016: nil). No other material amounts were receivable from, or payable to, other related parties as at 30 June 2017 (2016: nil), and no material transactions with other related parties occurred during those years.
For
per
sona
l use
onl
y

44 | OBJECTIVE CORPORATION LIMITED AND ITS CONTROLLED ENTITIES
NOTES TO THE FINANCIAL STATEMENTSFOR THE YEAR ENDED 30 JUNE 2017
NOTE 27. COMMITMENTSCommitments in relation to non-cancellable operating leases and capital expenditure contracted but not provided for in the consolidated financial statements are payable as follows:
CONSOLIDATED
2017$’000
2016$’000
Capital expenditure commitments – –
Operating lease commitments:
Not later than one year 2,513 1,325
Later than one year and not later than five years 7,739 1,413
Later than 5 years 3,430 –
Total operating lease commitments 13,682 2,738
The Group pays rental on property as occupancy costs under operating leases. Leases generally provide the Group with rights of renewals at which time all terms will be renegotiated.
NOTE 28. CONTINGENT LIABILITIES
CONSOLIDATED
2017$’000
2016$’000
Contingent liabilities, capable of estimation, arise in respect of the following categories:
Liquidated damages (Note 24) 3,268 –
Bank guarantees 1,040 426
Total contingent liabilities 4,308 426
Bank guarantees are issued to contract counterparties in the normal course of business as security for the performance by Group entities of various contractual obligations.
Additionally, a performance guarantee has been provided by the Company to Objective Corporation UK Limited (subsidiary) with regards to the provision of software support services on the signing of the new 5 year contract with the Scottish Government.
As at 30 June 2017, the Directors do not consider it is probable that a claim will be made against the Group under any of the guarantees or liquidated damages.
NOTE 29. AUDITOR’S REMUNERATION
CONSOLIDATED
2017$
2016$
Pitcher Partners
Audit and review of financial statements 74,100 72,000
Total remuneration of Pitcher Partners 74,100 72,000
CONSOLIDATED
2017$
2016$
Non-Pitcher Partners
Audit and review of financial statements 24,064 35,000
Tax compliance services 10,486 11,000
Total remuneration of non-Pitcher Partners 34,550 46,000For
per
sona
l use
onl
y

ANNUAL REPORT 2017 | 45
NOTES TO THE FINANCIAL STATEMENTSFOR THE YEAR ENDED 30 JUNE 2017
NOTE 30. OTHER ACCOUNTING POLICIES
Foreign currency transactions and balancesForeign currency transactions are translated into functional currency using the exchange rates prevailing at the date of the transaction. Foreign currency monetary items are translated at the year-end exchange rate. Non-monetary items measured at historical cost continue to be carried at the exchange rate at the date of the transaction. Non-monetary items measured at fair value are reported at the exchange rate at the date when fair values were determined.
Exchange differences arising on the translation of monetary items are recognised in profit or loss, except where deferred in equity as a qualifying cash flow or net investment hedge.
Exchange differences arising on the translation of non-monetary items are recognised directly in other comprehensive income to the extent that the underlying gain or loss is recognised in other comprehensive income; otherwise the exchange difference is recognised in profit or loss.
Accounting standards and interpretations issued but not operative at 30 June 2017Up to the date of issue of these financial statements, a number of amendments, new standards and interpretations have been issued which are not yet effective for the financial year ended 30 June 2017 and which have not been adopted in these consolidated financial statements.
Of these developments, the following relate to matters that may be relevant to the Group’s operations and consolidated financial statements:
AASB 9: Financial Instruments and associated Amending Standards (applicable to annual reporting periods beginning on or after 1 January 2018). AASB 15: Revenue from Contracts with Customers (applicable to annual reporting periods commencing on or after 1 January 2018). AASB 16: Leases (applicable to annual reporting periods commencing on or after 1 January 2019).
AASB 9: Financial InstrumentsThis Standard will be applicable retrospectively and includes revised requirements for the classification and measurement of financial instruments, revised recognition and derecognition requirements for financial instruments and simplified requirements for hedge accounting.
The key changes that may affect the Group on initial application include certain simplifications to the classification of financial assets and upfront accounting for expected credit loss.
Although the Directors anticipate that the adoption of AASB 9 may have an impact on the Group’s financial instruments it is impracticable at this stage to provide a reasonable estimate of such impact.
AASB 15: Revenue from Contracts with CustomersWhen effective, this Standard will replace the current accounting requirements applicable to revenue with a single, principles-based model. Except for a limited number of exceptions, including leases, the new revenue model in AASB 15 will apply to all contracts with customers as well as non-monetary exchanges between entities in the same line of business to facilitate sales to customers and potential customers.
The core principle of this Standard is that an entity will recognise revenue to depict the transfer of promised goods or services to customers in an amount that reflects the consideration to which the entity expects to be entitled in exchange for the goods or services. To achieve this objective, AASB 15 provides the following five-step process:
1. identify the contract(s) with a customer;
2. identify the performance obligations in the contract(s);
3. determine the transaction price;
4. allocate the transaction price to the performance obligations in the contract(s); and
5. recognise revenue when (or as) the performance obligations are satisfied.
This Standard will become mandatory for the Group’s 30 June 2019 consolidated financial statements and will require retrospective restatement, as well as enhanced disclosures regarding revenue.
It is expected that AASB 15 will impact the treatment and recognition of the Group’s revenue. AASB 15 will also require an alignment in the recognition of commissions expense and contract revenue, which will represent a change from the Group’s current policy of expensing these costs as incurred. The Group is currently in the process of assessing the impact of AASB 15 and is not yet able to reasonably estimate the overall impact on its consolidated financial statements.
AASB 16: LeasesAASB 16: Leases will replace the current standard AASB 117: Leases. The main changes include:
• Recognition of a “right to use” asset and liability for all leases, excluding leases less than 12 months of tenure and leases relating to low value assets
• Depreciation of “right to use” assets in line with AASB 116: Property, Plant and Equipment and unwinding of the liability in principal and interest components over the life of the lease
• Variable lease payments that depend on an index or a rate are included in the initial measurement of the lease liability using the index or rate at the commencement of the lease
• A lessee is permitted to elect not to separate non-lease components and instead account for all components as a lease
• Additional disclosure requirements.
The transitional provisions of the standard allow a lessee to either retrospectively apply the standard or recognise the cumulative effect of retrospective application as an adjustment to opening equity on initial application.
This standard will become mandatory for the Group’s 30 June 2020 consolidated financial statements. The impact of this standard will be that the majority of operating lease contracts disclosed in Note 27 will be present valued and recognised as a “right to use” asset, with a corresponding liability also recognised. In addition, the majority of the operating lease expenses will no longer be recognised and will be replaced with amortisation/interest expense.
NOTE 31. SUBSEQUENT EVENTSWith the exception of the items disclosed below, there has not arisen in the interval between 30 June 2017 and the date of this report, any other matter or circumstance that has significantly affected or may significantly affect the operations of the Group, the results of those operations or the state of affairs of the Group in subsequent financial years.
DividendsFor dividends resolved to be paid after 30 June 2017, refer to Note 17.
NOTE 32. APPROVAL OF FINANCIAL STATEMENTSThe financial statements were approved by the board of directors and authorised for issue on 30 August 2017.
For
per
sona
l use
onl
y

46 | OBJECTIVE CORPORATION LIMITED AND ITS CONTROLLED ENTITIES
DIRECTORS’ DECLARATION
The Directors of the Company declare that:
1. The attached financial statements and notes set out on pages 18 to 45 are in accordance with the Corporations Act 2001; and
a) Comply with Accounting Standards in Australian and the Corporations Regulations 2001;
b) As stated in Note 1, the consolidated financial statements also comply with International Reporting Standards; and
c) Give a true and fair view of the financial position of the consolidated entity as at 30 June 2017 and its performance for the year ended on that date.
2. The Chief Executive Officer and Chief Financial Officer have each declared that:
a) The financial records of the company for the financial year have been properly maintained in accordance with section 286 of the Corporations Act 2001;
b) The financial statements and notes for the financial year comply with the Accounting Standards; and
c) The financial statements and notes for the financial year give a true and fair view.
3. In the Directors’ opinion, there are reasonable grounds to believe that the Company will be able to pay their debts as and when they become due and payable.
This declaration is made in accordance with a resolution of Directors.
Tony Walls Director
30 August 2017
For
per
sona
l use
onl
y
ANNUAL REPORT 2017 | 47
INDEPENDENT AUDITOR’S REPORT
OBJECTIVECORPORATIONLIMITEDABN16050539350
INDEPENDENTAUDITOR’SREPORTTOTHEMEMBERSOFOBJECTIVECORPORATIONLIMITED
Page59
AnindependentNewSouthWalesPartnershipABN35415759892 PitcherPartnersisanassociationofindependentfirms Level22MLCCentre,19MartinPlace,SydneyNSW2000 Sydney|Melbourne|Perth|Adelaide|Brisbane|NewcastleLiabilitylimitedbyaschemeapprovedunderProfessionalStandardsLegislation AnindependentmemberofBakerTillyInternational
ReportontheAuditoftheFinancialReport
Opinion
WehaveauditedthefinancialreportofObjectiveCorporationLimited“theCompany”anditscontrolledentities“the Group”, which comprises the consolidated statement of financial position as at 30 June 2017, theconsolidatedstatementofprofitorloss,theconsolidatedstatementofcomprehensiveincome,theconsolidatedstatementofchangesinequityandtheconsolidatedcashflowstatementfortheyearthenended,andnotestothefinancialstatements,includingasummaryofsignificantaccountingpolicies,andthedirectors’declaration.
Inouropinion,theaccompanyingfinancialreportoftheGroupisinaccordancewiththeCorporationsAct2001,including:
(a) giving a true and fair view of the Group’s financial position as at 30 June 2017 and of its financialperformancefortheyearthenended;and
(b) complyingwithAustralianAccountingStandardsandtheCorporationsRegulations2001.
BasisforOpinion
We conducted our audit in accordance with Australian Auditing Standards. Our responsibilities under thosestandardsarefurtherdescribedintheAuditor’sResponsibilitiesfortheAuditoftheFinancialReportsectionofourreport. We are independent of the Group in accordance with the auditor independence requirements of theCorporationsAct2001andtheethicalrequirementsoftheAccountingProfessionalandEthicalStandardsBoard’sAPES110CodeofEthics forProfessionalAccountants“theCode” thatare relevant toourauditof the financialreportinAustralia.WehavealsofulfilledourotherethicalresponsibilitiesinaccordancewiththeCode.
We believe that the audit evidence we have obtained is sufficient and appropriate to provide a basis for ouropinion.F
or p
erso
nal u
se o
nly

48 | OBJECTIVE CORPORATION LIMITED AND ITS CONTROLLED ENTITIES
Page60
KeyAuditMattersKeyauditmattersarethosemattersthat,inourprofessionaljudgement,wereofmostsignificanceinourauditofthefinancialreportofthecurrentyear.Thesematterswereaddressedinthecontextofourauditofthefinancialreport as a whole, and in forming our opinion thereon, and we do not provide a separate opinion on thesematters.KeyAuditMatter HowourauditaddressedtheKeyAuditMatterRevenue–ProductandServiceRevenueRefertoNote4intheNotestotheFinancialStatements.
Product and service revenue is recognised inaccordance with contractual arrangementsandisrecognisedasthe:
• significant risks and rewards of ownershiparetransferredtothecustomer;
• milestones are achieved based on internalmeasurementoracknowledgementby thecustomer;or
• servicesareprovidedtothecustomer;
depending on the nature of the product orservice.
Ourproceduresincluded,amongstothers:• Documenting and testing the design and operating
effectiveness of relevant controls over timing of revenuerecognition.
• Testing a sample of revenue transactions to customercontracts, work in progress records, milestoneacknowledgements and receipts from customer, whereapplicable.
• Reviewing and analysing general journals that impactrevenue.
ImpairmentofIntangibleAssetsRefertoNote10intheNotestotheFinancialStatements.
At 30 June 2017 the statement of financialposition of the Group includes goodwillamountingto$8.547million.In assessing impairment of intangible assets,management have estimated value in use foreachcashgeneratingunit (CGU)–LimehouseSoftware Limited and Onstream SystemsLimited.The value in use model for impairmentincludessignificantmanagementjudgementinrespect of assumptions and estimatesincluding discount rates, estimated futurecashflowsandforeigncurrencyrates.
Ourproceduresincluded,amongstothers:• Assessingmanagement’sdeterminationofCGUsbasedon
our understanding of the nature of the group’s businessandtheeconomicenvironment.
• Reviewingandchallenging judgementsbymanagement inrespect of the key assumptions and estimates used todeterminetherecoverablevalueoftheassetsofeachCGU(valueinusemodel).
• Testing the mathematical accuracy of the value in usemodels.
• Assessingthehistoricalaccuracyofforecasting.
• Performing sensitivity analysis on key assumptions in thevalue in use models including discount rates, future cashflowsandforeigncurrencyrates.
• Considering the adequacy of the financial reportdisclosuresinNote10.
INDEPENDENT AUDITOR’S REPORT CONTINUED
For
per
sona
l use
onl
y

ANNUAL REPORT 2017 | 49
Page61
KeyAuditMatter HowourauditaddressedtheKeyAuditMatterAcquisitionAccountingRefertoNote23intheNotestotheFinancialStatements.
During the 2016 financial year, the Groupacquired Onstream Systems Limited andfinalisedtheacquisitionaccountingduringthe2017financialyearaspermittedbyAustralianAccountingStandards.The accounting for this business combinationresulted in the recognition of goodwill of$2.955 million and other identifiableintangibleassetsof$0.530million.The final purchase price allocation includes adegree of judgement in respect of growthrates,attritionrates,EBITmargin,royaltyrateanddiscountrate.The Group utilised an external expert infinalisationofthepurchasepriceallocation.
Ourproceduresincluded,amongstothers:• ExaminingtheassetpurchaseagreementsandtheGroup’s
assessment of the identification of intangible assetsacquired based on our understanding of the businessacquired.
• Assessing thecompetencyof theexternalexpertengagedbytheGrouptoassistwiththepurchasepriceallocation.
• Reviewingandchallengingthesignificantjudgementsusedby the Group’s expert in the allocation of purchase pricebased on our understanding of the acquired businessesincludinginputfromourvaluationspecialist.
• Considering the adequacy of the financial reportdisclosuresinNote23.
OtherInformation–Theannualreportisnotcompleteatthedateoftheauditreport.The directors are responsible for the other information. The other information comprises the informationincludedintheDirectorsReport,whichwasobtainedasatthedateofourauditreport,andanyadditionalotherinformationincludedintheCompany’sannualreportfortheyearended30June2017,butdoesnotincludethefinancial reportandourauditor’s report thereon.Ouropinionon the financial reportdoesnotcover theotherinformationandaccordinglywedonotexpressanyformofassuranceconclusionthereon.Inconnectionwithourauditofthefinancialreport,ourresponsibilityistoreadtheotherinformationaboveand,in doing so, consider whether the other information is materially inconsistent with the financial report or ourknowledgeobtainedintheauditorotherwiseappearstobemateriallymisstated.If,basedontheworkwehaveperformed, we conclude that there is a material misstatement of this other information, we are required toreportthatfact.Wehavenothingtoreportinthisregard.Whenwereadtheotherinformationnotyetreceivedasidentifiedabove,ifweconcludethatthereisamaterialmisstatementtherein,wearerequiredtocommunicatethemattertothedirectorsanduseourprofessionaljudgmenttodeterminetheappropriateactiontotake.ResponsibilitiesoftheDirectorsfortheFinancialReportThedirectorsoftheCompanyareresponsibleforthepreparationofthefinancialreportthatgivesatrueandfairview in accordance with Australian Accounting Standards and theCorporationsAct 2001and for such internalcontrolasthedirectorsdetermineisnecessarytoenablethepreparationofthefinancialreportthatgivesatrueandfairviewandisfreefrommaterialmisstatement,whetherduetofraudorerror.
INDEPENDENT AUDITOR’S REPORT CONTINUED
For
per
sona
l use
onl
y

50 | OBJECTIVE CORPORATION LIMITED AND ITS CONTROLLED ENTITIES
Page62
Inpreparingthefinancialreport,thedirectorsareresponsibleforassessingtheabilityoftheGrouptocontinueasagoingconcern,disclosing,asapplicable,mattersrelatedtogoingconcernandusingthegoingconcernbasisofaccounting unless the directors either intend to liquidate the Group or to cease operations, or has no realisticalternativebuttodoso.Auditor’sResponsibilitiesfortheAuditoftheFinancialReportOurobjectivesaretoobtainreasonableassuranceaboutwhetherthefinancialreportasawholeisfreefrommaterialmisstatement,whetherduetofraudorerror,andtoissueanauditor’sreportthatincludesouropinion.Reasonableassuranceisahighlevelofassurance,butisnotaguaranteethatanauditconductedinaccordancewiththeAustralianAuditingStandardswillalwaysdetectamaterialmisstatementwhenitexists.Misstatementscanarisefromfraudorerrorandareconsideredmaterialif,individuallyorintheaggregate,theycouldreasonablybeexpectedtoinfluencetheeconomicdecisionsofuserstakenonthebasisofthisfinancialreport.AspartofanauditinaccordancewiththeAustralianAuditingStandards,weexerciseprofessionaljudgementandmaintainprofessionalscepticismthroughouttheaudit.Wealso:• Identifyandassesstherisksofmaterialmisstatementofthefinancialreport,whetherduetofraudorerror,
designandperformauditproceduresresponsivetothoserisks,andobtainauditevidencethatissufficientandappropriatetoprovideabasisforouropinion.Theriskofnotdetectingamaterialmisstatementresultingfromfraudishigherthanforoneresultingfromerror,asfraudmayinvolvecollusion,forgery,intentionalomissions,misrepresentations,ortheoverrideofinternalcontrol.
• Obtainanunderstandingofinternalcontrolrelevanttotheauditinordertodesignauditproceduresthatareappropriateinthecircumstances,butnotforthepurposeofexpressinganopinionontheeffectivenessoftheGroup’sinternalcontrol.
• Evaluatetheappropriatenessofaccountingpoliciesusedandthereasonablenessofaccountingestimatesandrelateddisclosuresmadebythedirectors.
• Concludeontheappropriatenessofthedirectors’useofthegoingconcernbasisofaccountingand,basedontheauditevidenceobtained,whetheramaterialuncertaintyexistsrelatedtoeventsorconditionsthatmaycastsignificantdoubtontheGroup’sabilitytocontinueasagoingconcern. Ifweconcludethatamaterialuncertaintyexists,wearerequiredtodrawattentioninourauditor’sreporttotherelateddisclosuresinthefinancialreportor, ifsuchdisclosuresareinadequate,tomodifyouropinion.Ourconclusionsarebasedontheauditevidenceobtaineduptothedateofourauditor’sreport.However,futureeventsorconditionsmaycausetheGrouptoceasetocontinueasagoingconcern.
• Evaluatetheoverallpresentation,structureandcontentofthefinancialreport,includingthedisclosures,andwhetherthefinancialreportrepresentstheunderlyingtransactionsandeventsinamannerthatachievesfairpresentation.
• Obtain sufficientappropriateauditevidence regarding the financial informationof theentitiesorbusinessactivities within the Group to express an opinion on the financial report. We are responsible for thedirection, supervision and performance of the Group audit. We remain solely responsible for our auditopinion.
Wecommunicatewiththedirectorsregarding,amongothermatters,theplannedscopeandtimingoftheauditandsignificantauditfindings,includinganysignificantdeficienciesininternalcontrolthatweidentifyduringouraudit.We also provide the directors with a statement that we have complied with relevant ethical requirementsregardingindependence,andtocommunicatewiththemallrelationshipsandothermattersthatmayreasonablybethoughttobearonourindependence,andwhereapplicable,relatedsafeguards.
INDEPENDENT AUDITOR’S REPORT CONTINUED
For
per
sona
l use
onl
y
ANNUAL REPORT 2017 | 51
INDEPENDENT AUDITOR’S REPORT CONTINUED
Page63
Fromthematterscommunicatedwiththedirectors,wedeterminethosemattersthatwereofmostsignificancein theauditof the financial reportof thecurrentperiodandare therefore thekeyauditmatters.Wedescribethese matters in our auditor’s report unless law or regulation precludes public disclosure about the matter orwhen, inextremelyrarecircumstances,wedeterminethatamattershouldnotbecommunicated inourreportbecause the adverse consequences of doing so would reasonably be expected to outweigh the public interestbenefitsofsuchcommunication.ReportontheRemunerationReportOpinionontheRemunerationReportWehaveauditedtheRemunerationReportincludedinpages14to17ofthedirectors’reportfortheyearended30June2017.Inouropinion,theRemunerationReportofObjectiveCorporationLimited,fortheyearended30June2017,complieswithsection300AoftheCorporationsAct2001.ResponsibilitiesThedirectorsoftheCompanyareresponsibleforthepreparationandpresentationoftheRemunerationReportinaccordancewithsection300AoftheCorporationsAct2001.OurresponsibilityistoexpressanopinionontheRemunerationReport,basedonourauditconductedinaccordancewithAustralianAuditingStandards.
RMSHANLEY PITCHERPARTNERSSYDNEYPartner Sydney
30August2017
15
For
per
sona
l use
onl
y

52 | OBJECTIVE CORPORATION LIMITED AND ITS CONTROLLED ENTITIES
AUDITOR’S INDEPENDENCE DECLARATION
Page 58
Pitcher Partners is an association of independent firms Melbourne | Sydney | Perth | Adelaide | Brisbane| Newcastle An independent member of Baker Tilly International
An independent New South Wales Partnership. ABN 35 415 759 892 Level 22 MLC Centre, 19 Martin Place, Sydney NSW 2000 Liability limited by a scheme approved under Professional Standards Legislation
AUDITOR'S INDEPENDENCE DECLARATION TO THE DIRECTORS OF OBJECTIVE CORPORATION LIMITED In relation to the independent audit for the year ended 30 June 2017, to the best of my knowledge and belief there have been: (i) no contraventions of the auditor independence requirements of the Corporations Act 2001; and (ii) no contraventions of any applicable code of professional conduct.
R M SHANLEY
Partner
PITCHER PARTNERS
Sydney 30 August 2017
OBJECTIVECORPORATIONLIMITEDABN16050539350
INDEPENDENTAUDITOR’SREPORTTOTHEMEMBERSOFOBJECTIVECORPORATIONLIMITED
Page59
AnindependentNewSouthWalesPartnershipABN35415759892 PitcherPartnersisanassociationofindependentfirms Level22MLCCentre,19MartinPlace,SydneyNSW2000 Sydney|Melbourne|Perth|Adelaide|Brisbane|NewcastleLiabilitylimitedbyaschemeapprovedunderProfessionalStandardsLegislation AnindependentmemberofBakerTillyInternational
ReportontheAuditoftheFinancialReport
Opinion
WehaveauditedthefinancialreportofObjectiveCorporationLimited“theCompany”anditscontrolledentities“the Group”, which comprises the consolidated statement of financial position as at 30 June 2017, theconsolidatedstatementofprofitorloss,theconsolidatedstatementofcomprehensiveincome,theconsolidatedstatementofchangesinequityandtheconsolidatedcashflowstatementfortheyearthenended,andnotestothefinancialstatements,includingasummaryofsignificantaccountingpolicies,andthedirectors’declaration.
Inouropinion,theaccompanyingfinancialreportoftheGroupisinaccordancewiththeCorporationsAct2001,including:
(a) giving a true and fair view of the Group’s financial position as at 30 June 2017 and of its financialperformancefortheyearthenended;and
(b) complyingwithAustralianAccountingStandardsandtheCorporationsRegulations2001.
BasisforOpinion
We conducted our audit in accordance with Australian Auditing Standards. Our responsibilities under thosestandardsarefurtherdescribedintheAuditor’sResponsibilitiesfortheAuditoftheFinancialReportsectionofourreport. We are independent of the Group in accordance with the auditor independence requirements of theCorporationsAct2001andtheethicalrequirementsoftheAccountingProfessionalandEthicalStandardsBoard’sAPES110CodeofEthics forProfessionalAccountants“theCode” thatare relevant toourauditof the financialreportinAustralia.WehavealsofulfilledourotherethicalresponsibilitiesinaccordancewiththeCode.
We believe that the audit evidence we have obtained is sufficient and appropriate to provide a basis for ouropinion.
For
per
sona
l use
onl
y

ANNUAL REPORT 2017 | 53
SHAREHOLDER INFORMATION
The shareholder information set out below was applicable on the 14th September 2017.
Additional information required by the Australian Stock Exchange Limited Listing Rules and not disclosed elsewhere in this report is set out below:
A) DISTRIBUTION OF EQUITY SECURITIES
SecuritiesFully paid ordinary shares
Holdings rangesNo. of
Holders
TotalOrdinary
Shares
1–1,000 154 82,744
1,001–5,000 252 714,590
5,001–10,000 103 839,643
10,001–100,000 150 4,669,925
100,001+ 34 8,546,1139
Totals 693 91,768,041
There were 30 holders of less than a marketable parcel of ordinary shares.
B) VOTING RIGHTS The voting rights attaching to ordinary shares are that every member in person or by proxy, attorney or representative shall have one vote on a show of hangs and one vote for each share held on a poll. There are no voting rights attaching to options over unissued shares.
C) TWENTY LARGEST QUOTED EQUITY SECURITY HOLDERS
Ordinary shares
Name
No. ofOrdinary
Shares Held
% of
ListedShares
TBW TRUSTEES LIMITED 62,000,000 67.6
HSBC CUSTODY NOMINEES (AUSTRALIA) LIMITED 9,008,000 9.8
ONE MANAGED INVESTMENT FUNDS LIMITED 2,168,807 2.4
MIRRABOOKA INVESTMENTS LIMITED 2,100,000 2.3
AMCIL LIMITED 1,394,513 1.5
SANDHURST TRUSTEES LTD 1,067,423 1.2
CLAPSY PTY LTD 724,546 0.8
ARRAS PTY LTD 543,832 0.6
MRS ELAINE WALLS & MS MICHELLE ROBYN WALLS 535,000 0.6
MR ADRIAN RUDMAN 500,000 0.5
AUST EXECUTOR TRUSTEES LTD 448,467 0.5
ANACACIA PTY LTD 431,000 0.5
MR DAVID GORDON 400,000 0.4
MR JEREMY JOHN GODDARD 375,000 0.4
POAL PTY LTD 360,849 0.4
AUST EXECUTOR TRUSTEES LTD 273,391 0.3
MOAT INVESTMENTS PTY LTD 272,355 0.3
MR MITCHELL JAMES HARRISON & DR ROSALIND FRANCES MENZIES 237,609 0.3
MAST FINANCIAL PTY LTD 235,000 0.3
MR ANDREW JAMES BOWEN 224,000 0.2
83,299,792 90.8
D) SUBSTANTIAL HOLDERS IN THE COMPANY
Ordinary shares
Name
Number of Ordinary
Shares Held
%of Listed Shares
TBW TRUSTEES LIMITED 62,000,000 67.6
HSBC CUSTODY NOMINEES (AUSTRALIA) LIMITED 9,008,000 9.8
For
per
sona
l use
onl
y

54 | OBJECTIVE CORPORATION LIMITED AND ITS CONTROLLED ENTITIES
CORPORATE DIRECTORY
REGISTERED OFFICELevel 30 177 Pacific Highway North Sydney NSW 2060 Australia
Tel: +61 2 9955 2288
ASX CODEOCL
ABN16 050 539 350
DIRECTORSTony Walls Gary Fisher Nick Kingsbury Leigh Warren
COMPANY SECRETARYBen Tregoning
STOCK EXCHANGE LISTINGThe Company’s shares are listed on the Australian Securities Exchange (ASX).
ELECTRONIC ANNOUNCEMENTSShareholders who wish to receive a copy of announcements made to the ASX are invited to provide their email address to the Company. This can be done by emailing us at [email protected] or writing to us at our registered office.
SHARE REGISTRYBoardroom Pty Ltd Grosvenor Place Level 12, 225 George Street Sydney NSW 2000
GPO Box 3993 Sydney NSW 2001
Tel: +61 (0)2 9290 9600
AUDITORPitcher Partners Level 22, MLC Centre 19 Martin Place Sydney NSW 2000
WEBSITEwww.objective.com
For
per
sona
l use
onl
y

INFORMATION GOVERNANCE AWARD:Department of Planning, Lands and Heritage WADigitisation Project – Crown Land
COLLABORATION AWARD:Primary Industries and Regions SAImplementation of GDS21 and Ezescan integration with Objective ECM
PROCESS GOVERNANCE AWARD:Barwon WaterIntegrated web portal to manage inspection services (Objective ECM, Objective Connect)
MICROSOFT AWARD FOR EXCELLENCE:Department of Communities WAObjective ECM upgrade and implementation of ECM for Browser, Workflow, Applink and Objective Connect
INFORMATION GOVERNANCE:Primary Industries and Regions SA
PIRSA Intranet, Internet website and SharePoint document publishing initiatives
PROCESS GOVERNANCE:Counties Manukau District Health Board NZ
Contracts Approval Process
MICROSOFT AWARD FOR EXCELLENCE:Welsh Government
Microsoft Azure migration
CERTIFICATES OF MERIT
For
per
sona
l use
onl
y

OB
JECTIVE AN
NUA
L REPO
RT 2017
www.objective.com
For
per
sona
l use
onl
y