annual report 2016 - zonebourse.com de velde... · | 8 | 2. fitting room channel/wholesale -...
TRANSCRIPT
Annual report 2016


OUR MISSION
Shaping the bodies and minds of women

Photography
Petrovsky & Ramone (Marie Jo)
Daniel Kennedy (PrimaDonna)
Jonas Bresnan (Andres Sarda)
Form, typesetting, printing and finishing
L. capitan
125102 | www.lcapitan.be
Deze jaarbrochure is eveneens beschikbaar in het Nederlands, bij de
hoofdzetel van de onderneming.
Contact
For clarification of the information in this annual report please contact:
Bart Rabaey Consulting VOF,
always represented by Bart Rabaey
CFO
Tel.: (09) 365 21 00
Fax: (09) 365 21 70
Editor
Van de Velde NV
Lageweg 4
9260 Wichelen
Tel.: (09) 365 21 00
Fax: (09) 365 21 70
VAT number: BE0448 746 744
Company number RPR 0448 746 744
Dendermonde
website: www.vandevelde.eu
Our gratitude goes out to all of our employees. Their involvement in the realization of the company objectives and their dynamism enable us to achieve the reported results and to have confidence in the future.

1. The year 2016 5
Message from the Chairman 5
Activity report and prospects for 2017 7
2. Description of the company and its activities 13
3. Corporate Governance 15
Remuneration report 18
Information to shareholders 22
4 Consolidated key figures 2016 24
5. Consolidated financial statements and related notes 29
6. Auditor’s report on the consolidated financial statements 64
7. Concise version of the statutory financial statements and the statutory annual report of Van de Velde NV 66
8. Statement of responsible persons 70
9. Employment, environment and contribution to the Belgian Treasury 72
Social accounting 72
Environmental report 78
Contribution to the Belgian Treasury 80
Table of contents


| 5 |
Message from the ChairmanOur company has experienced continuous year-on-year growth in recent decades. Unfortunately we were unable to maintain this trend in 2016. While we are not searching for excuses, the fall of sterling was not to our advantage and we were unable to counterbalance the poor results of our retail chain in the United States to a sufficient degree. On an optimistic note, our traditional independent retailer channel has continued to grow in spite of the unfavourable retail climate and our European Retail companies realized growth.
Our new CEO, Erwin Van Laethem, took over the helm at the end of 2016. There are a number of major challenges, particularly because of how retail is changing. Advancing digitization has a huge impact on shopping behaviour. Industry-wide, online stores account for more than 10% of all purchases and their share is rising spectacularly year on year. Yet that is only the tip of the digital iceberg. A recent study of the luxury goods sector shows that three in every four purchases are influenced by what consumers read, hear or do online, regardless of whether they shop in the high street or on the internet. In other words, digital has become the engine of the shopping experience. In the meantime some initiatives already started.
Our company is committed to responding nimbly to these develop-ments and we have allocated extra funds to enable us to do this. This money will be used to invest in technology, to attract digital talent and to improve the digital skills of our staff. We absolutely do not want to miss the digital train, but we will discuss any initiatives we do take with our customers and roll them out in partnership with them.
In 2016 we also finished the major renovation of our premises in Schellebelle. The project has taken a lot of time and energy, but the
results are worth it. Due to this investment we are not only better able to receive customers and visitors in general, we can also provide our staff with a much more pleasant working environment. Great facili-ties are not enough. Our ambition is to develop an organization and a culture in which people in various stages of their life and career come to work with passion and pleasure. To that end, we are working in three areas:
1) We want to provide meaningful work, which is why we give atten-tion to employability, variety in staff duties, autonomy and training possibilities.
2) Quality of relationships: we have opted for professional manage-ment but cherish the family culture. It is certainly not a conservative or paternalistic culture, but rather one in which people – just like a family – enjoy being together and are concerned about each other.
3) Lastly, we want to strengthen the sense of leadership: leaders who inspire and show confidence in their people, who are skilled listen-ers.
The coming year will not be an easy one for the new management. These are turbulent times and the environment is changing very fast, but we are confident that they, with the support of the Board of Directors, will take the right decisions and ensure the planned invest-ments have the desired effect.
Herman Van de VeldeChairman of the Board of Directors
1 | The year 2016

| 7 |
Activity report The result in 2016 was ‘modest’ compared with previous years. This is mainly due to the retail results in the United States and the exchange rate effect due to Brexit. Other countries and parts of the business made respectable or good progress, especially given the tough retail market. New eCommerce and innovation initiatives centred on Lingerie Styling and consumers were launched, while others were continued. Our supply chain was impacted by the growth in eCom-merce and a few longstanding difficulties, such as supplier quality and delivery reliability, remained.
A number of changes were made to the Management Committee in 2016. Bart Rabaey succeeded Stefaan Van Damme as CFO on 1 May 2016, while Erwin Van Laethem took over from Ignace Van Doorselaere as CEO on 1 November 2016. These two changes became effective after an introduction and handover period, with a view to continuing and deepening the initiatives already launched. Yan Aerts joined the team and took up his duties as retail director on 1 September. His priority is developing retail in Europe and the United States.
The focus in 2016 remained on growth and continuous improvement – better service with clear solutions to meet the needs of both consum-ers and customers. The self-image of women is central to the brand experience and the fitting room vision. We are convinced that feeling and radiating confidence when wearing fashionable high-quality lin-gerie, supported by a contemporary fitting room concept, remains an enduring attractive proposition for women.
1. Brands
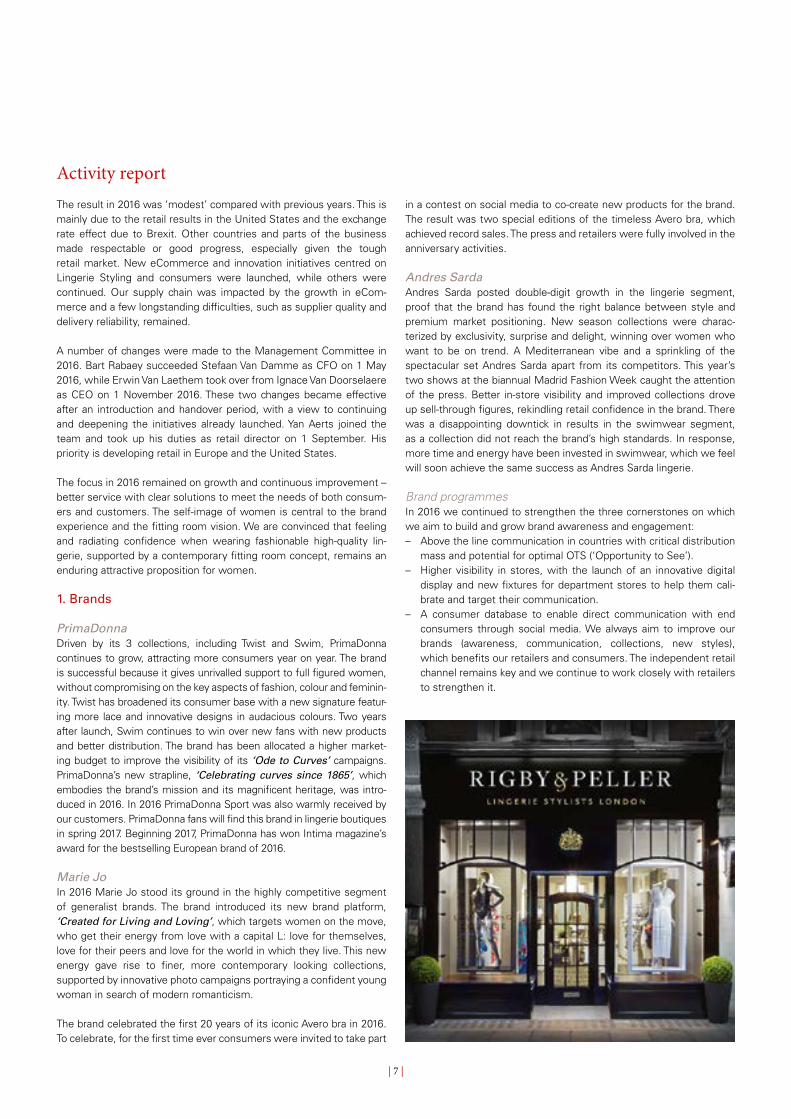
PrimaDonnaDriven by its 3 collections, including Twist and Swim, PrimaDonna continues to grow, attracting more consumers year on year. The brand is successful because it gives unrivalled support to full figured women, without compromising on the key aspects of fashion, colour and feminin-ity. Twist has broadened its consumer base with a new signature featur-ing more lace and innovative designs in audacious colours. Two years after launch, Swim continues to win over new fans with new products and better distribution. The brand has been allocated a higher market-ing budget to improve the visibility of its ‘Ode to Curves’ campaigns. PrimaDonna’s new strapline, ‘Celebrating curves since 1865’, which embodies the brand’s mission and its magnificent heritage, was intro-duced in 2016. In 2016 PrimaDonna Sport was also warmly received by our customers. PrimaDonna fans will find this brand in lingerie boutiques in spring 2017. Beginning 2017, PrimaDonna has won Intima magazine’s award for the bestselling European brand of 2016.
Marie Jo In 2016 Marie Jo stood its ground in the highly competitive segment of generalist brands. The brand introduced its new brand platform, ‘Created for Living and Loving’, which targets women on the move, who get their energy from love with a capital L: love for themselves, love for their peers and love for the world in which they live. This new energy gave rise to finer, more contemporary looking collections, supported by innovative photo campaigns portraying a confident young woman in search of modern romanticism.
The brand celebrated the first 20 years of its iconic Avero bra in 2016. To celebrate, for the first time ever consumers were invited to take part
in a contest on social media to co-create new products for the brand. The result was two special editions of the timeless Avero bra, which achieved record sales. The press and retailers were fully involved in the anniversary activities.
Andres SardaAndres Sarda posted double-digit growth in the lingerie segment, proof that the brand has found the right balance between style and premium market positioning. New season collections were charac-terized by exclusivity, surprise and delight, winning over women who want to be on trend. A Mediterranean vibe and a sprinkling of the spectacular set Andres Sarda apart from its competitors. This year’s two shows at the biannual Madrid Fashion Week caught the attention of the press. Better in-store visibility and improved collections drove up sell-through figures, rekindling retail confidence in the brand. There was a disappointing downtick in results in the swimwear segment, as a collection did not reach the brand’s high standards. In response, more time and energy have been invested in swimwear, which we feel will soon achieve the same success as Andres Sarda lingerie.
Brand programmesIn 2016 we continued to strengthen the three cornerstones on which we aim to build and grow brand awareness and engagement: – Above the line communication in countries with critical distribution
mass and potential for optimal OTS (‘Opportunity to See’). – Higher visibility in stores, with the launch of an innovative digital
display and new fixtures for department stores to help them cali-brate and target their communication.
– A consumer database to enable direct communication with end consumers through social media. We always aim to improve our brands (awareness, communication, collections, new styles), which benefits our retailers and consumers. The independent retail channel remains key and we continue to work closely with retailers to strengthen it.
| 8 |
2. Fitting room channel/wholesale - Business-to-business
In 2016 Van de Velde was able to continue the positive trend of 2015 in most markets in spite of a generally tough retail climate and a notice-able fall in the number of shoppers in the second half of the year.
Core markets such as Europe and North America all experienced growth. The qualities and involvement of our people and the contin-ued development and rollout of programmes that add value for our customers drive these advances.
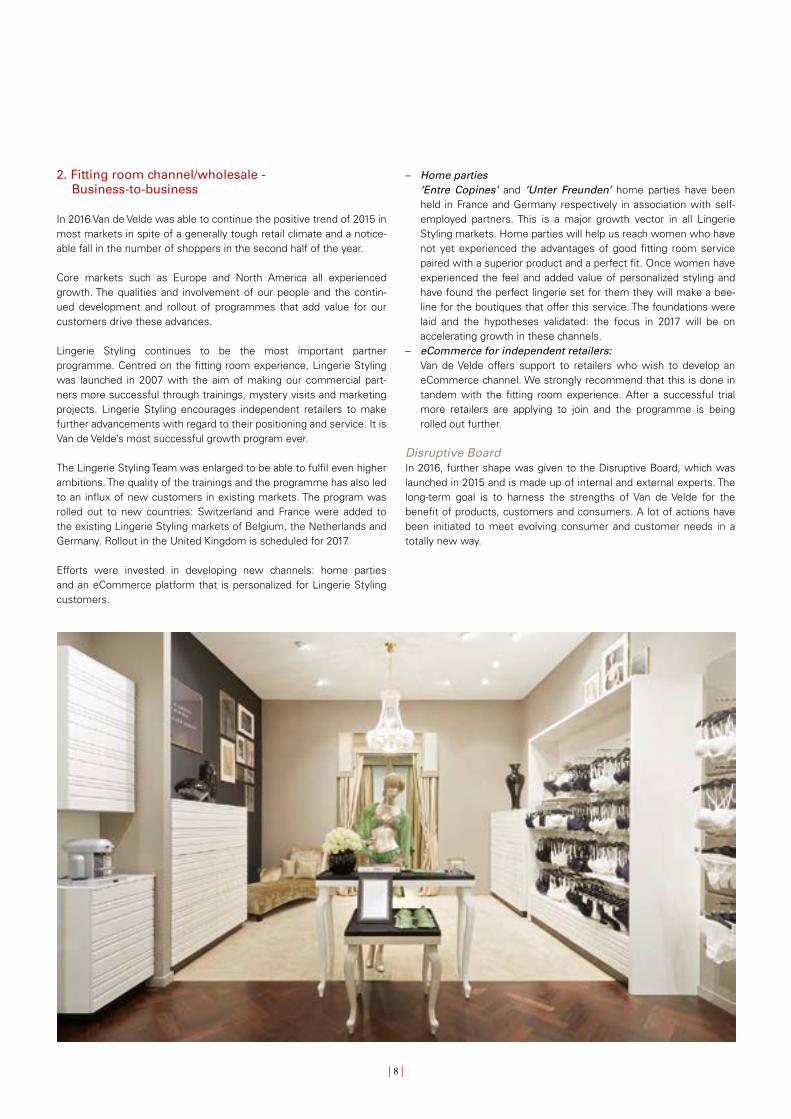
Lingerie Styling continues to be the most important partner programme. Centred on the fitting room experience, Lingerie Styling was launched in 2007 with the aim of making our commercial part-ners more successful through trainings, mystery visits and marketing projects. Lingerie Styling encourages independent retailers to make further advancements with regard to their positioning and service. It is Van de Velde’s most successful growth program ever.
The Lingerie Styling Team was enlarged to be able to fulfil even higher ambitions. The quality of the trainings and the programme has also led to an influx of new customers in existing markets. The program was rolled out to new countries: Switzerland and France were added to the existing Lingerie Styling markets of Belgium, the Netherlands and Germany. Rollout in the United Kingdom is scheduled for 2017.
Efforts were invested in developing new channels: home parties and an eCommerce platform that is personalized for Lingerie Styling customers.
– Home parties ‘Entre Copines’ and ‘Unter Freunden’ home parties have been
held in France and Germany respectively in association with self-employed partners. This is a major growth vector in all Lingerie Styling markets. Home parties will help us reach women who have not yet experienced the advantages of good fitting room service paired with a superior product and a perfect fit. Once women have experienced the feel and added value of personalized styling and have found the perfect lingerie set for them they will make a bee-line for the boutiques that offer this service. The foundations were laid and the hypotheses validated: the focus in 2017 will be on accelerating growth in these channels.
– eCommerce for independent retailers:Van de Velde offers support to retailers who wish to develop an eCommerce channel. We strongly recommend that this is done in tandem with the fitting room experience. After a successful trial more retailers are applying to join and the programme is being rolled out further.
Disruptive BoardIn 2016, further shape was given to the Disruptive Board, which was launched in 2015 and is made up of internal and external experts. The long-term goal is to harness the strengths of Van de Velde for the benefit of products, customers and consumers. A lot of actions have been initiated to meet evolving consumer and customer needs in a totally new way.

| 9 |
A number of innovation projects have been set up within three focus areas: – Digital fitting room: translating the fitting room experience into a
digital world online, including mobile. – Digital consumers: responding to the changing behaviour of con-
sumers who want to communicate directly and digitally with their brand.
– Products: research into new technologies and applications with a view to personalization to create an even better style and fit.
Within these programmes we conduct studies, build prototypes and set up pilots to test new concepts and business models. Concepts that are ready for market: our interactive 3D mirror has already been introduced in our retail channel in the Netherlands, Germany, the United Kingdom and the United States. An eCommerce size & style quiz was launched to give consumers size advice and personalize their online shopping experience in a user-friendly way.
We plan to expand this programme further in 2017. We will team up with more external partners and we want to link up with innovative ecosystems. We are currently trialling chatbots, 3D and virtual fitting room concepts among other things. The goal is to achieve a smooth transition between today and tomorrow, with the needs of consumers as starting point.
eCommerceA global structure was set up at Van de Velde in early 2016 to give further shape to eCommerce within both retail and wholesale. The eCommerce team, which is made up of a number of centralized expert roles and a number of local functions in the United Kingdom and United States, was enlarged. The local United States eCommerce busi-ness was integrated into the global eCommerce platform to improve service to the United States, where a new online store went live on 1 September. Since then, the United States has experienced the fast-est growth within Van de Velde’s eCommerce business, driven by a richer product range and a better online user experience. A hundred or so independent retailers in Belgium, the Netherlands and Germany have now joined the wholesale eCommerce platform.
Digital consumer communication channels have been further improved with greater investment in social media and mobile. We want to continue along the same path in 2017, developing eCommerce and digital communication within our own stores and for independent retailers. The eCommerce team will be strengthened and various initiatives will be rolled out to further improve digital services to consumers and retailers going forward. Our ambition is to surpass the turnover growth we achieved in 2016.
3. Retail - Business-to-Consumer
Continental Europe Continental Europe experienced a good year, meeting expecta-tions in like-for-like (LFL) sales, the planned expansion and profitabil-ity. Considerable improvement was posted in the Netherlands and Germany in particular. A Lincherie Styling Experience Center opened in Amsterdam in the autumn, responding to increased digitization and omni/multi-channel shopping trend among consumers.
United KingdomThe new United Kingdom management team managed to speed up the turnaround that began in 2015 until the Brexit vote and its con-sequences for the exchange rate started to negatively impact results in the second half of the year. We saw positive stability in the United Kingdom stores, with the acceleration of eCommerce after the growth vision was fleshed out in mid 2016.
| 10 |
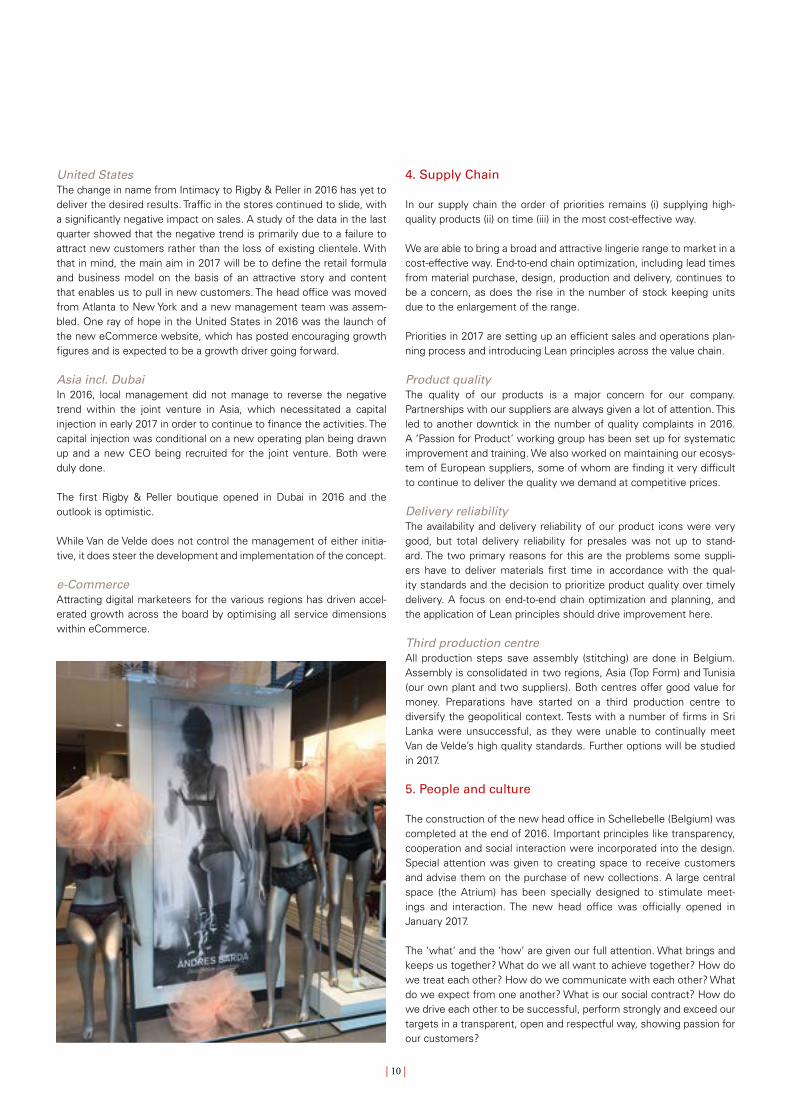
United StatesThe change in name from Intimacy to Rigby & Peller in 2016 has yet to deliver the desired results. Traffic in the stores continued to slide, with a significantly negative impact on sales. A study of the data in the last quarter showed that the negative trend is primarily due to a failure to attract new customers rather than the loss of existing clientele. With that in mind, the main aim in 2017 will be to define the retail formula and business model on the basis of an attractive story and content that enables us to pull in new customers. The head office was moved from Atlanta to New York and a new management team was assem-bled. One ray of hope in the United States in 2016 was the launch of the new eCommerce website, which has posted encouraging growth figures and is expected to be a growth driver going forward.
Asia incl. DubaiIn 2016, local management did not manage to reverse the negative trend within the joint venture in Asia, which necessitated a capital injection in early 2017 in order to continue to finance the activities. The capital injection was conditional on a new operating plan being drawn up and a new CEO being recruited for the joint venture. Both were duly done.
The first Rigby & Peller boutique opened in Dubai in 2016 and the outlook is optimistic.
While Van de Velde does not control the management of either initia-tive, it does steer the development and implementation of the concept.
e-CommerceAttracting digital marketeers for the various regions has driven accel-erated growth across the board by optimising all service dimensions within eCommerce.
4. Supply Chain
In our supply chain the order of priorities remains (i) supplying high-quality products (ii) on time (iii) in the most cost-effective way.
We are able to bring a broad and attractive lingerie range to market in a cost-effective way. End-to-end chain optimization, including lead times from material purchase, design, production and delivery, continues to be a concern, as does the rise in the number of stock keeping units due to the enlargement of the range.
Priorities in 2017 are setting up an efficient sales and operations plan-ning process and introducing Lean principles across the value chain.
Product qualityThe quality of our products is a major concern for our company. Partnerships with our suppliers are always given a lot of attention. This led to another downtick in the number of quality complaints in 2016. A ‘Passion for Product’ working group has been set up for systematic improvement and training. We also worked on maintaining our ecosys-tem of European suppliers, some of whom are finding it very difficult to continue to deliver the quality we demand at competitive prices.
Delivery reliabilityThe availability and delivery reliability of our product icons were very good, but total delivery reliability for presales was not up to stand-ard. The two primary reasons for this are the problems some suppli-ers have to deliver materials first time in accordance with the qual-ity standards and the decision to prioritize product quality over timely delivery. A focus on end-to-end chain optimization and planning, and the application of Lean principles should drive improvement here.
Third production centreAll production steps save assembly (stitching) are done in Belgium. Assembly is consolidated in two regions, Asia (Top Form) and Tunisia (our own plant and two suppliers). Both centres offer good value for money. Preparations have started on a third production centre to diversify the geopolitical context. Tests with a number of firms in Sri Lanka were unsuccessful, as they were unable to continually meet Van de Velde’s high quality standards. Further options will be studied in 2017.
5. People and culture
The construction of the new head office in Schellebelle (Belgium) was completed at the end of 2016. Important principles like transparency, cooperation and social interaction were incorporated into the design. Special attention was given to creating space to receive customers and advise them on the purchase of new collections. A large central space (the Atrium) has been specially designed to stimulate meet-ings and interaction. The new head office was officially opened in January 2017.
The ‘what’ and the ‘how’ are given our full attention. What brings and keeps us together? What do we all want to achieve together? How do we treat each other? How do we communicate with each other? What do we expect from one another? What is our social contract? How do we drive each other to be successful, perform strongly and exceed our targets in a transparent, open and respectful way, showing passion for our customers?

| 11 |
In a changing world, it remains important to respond fast and always adapt to customers and the market. Dealing with change, being flex-ible and working independently are important aspects of employee development. The annual performance interviews for office work-ers were dropped in 2015 and replaced with a permanent feedback system. Each employee has a responsibility in this, but the role of the manager is key.
The training and leadership programmes set up in recent years on dialogue (‘conversation company’), customer focus, self-knowledge, feedback, entrepreneurship and teamwork were developed further in 2016. Van de Velde is committed to treating people right, not only informally but also formally. Van de Velde NV first earned SA8000 certification in 2013 and our production plant in Tunisia was audited in accordance with the ETI standard in 2016.
Prospects for 2017Van de Velde’s mid-term ambition and the important themes for 2017 were fleshed out in December 2016 during a two-day conference in Amsterdam (Netherlands). This was done in an international cross-functional group comprising the Management Committee, the 35 middle managers and 15 employees. This group also drew inspiration from visits to companies, start-ups and innovative organizations in the ecosystem in and around Amsterdam.
Five themes and initiatives were defined and elaborated within a context and mindset of ‘more consumer’, ‘more connected’ and ‘more inclusive & international’: 1. Brands and channels: defining the customer and consumer journey
across the various channels and identifying aspects that can make the customer experience even more attractive.
2. eCommerce: continuing the development of this channel to sup-port our customers, commercial partners and consumers.
3. Supply Chain: introducing Lean principles and end-to-end chain con-trol.
4. Sourcing: strengthening the European ecosystem of suppliers and developing alternative options.
5. Customer and consumer central: providing an optimal, personalized customer and consumer experience, based on simple and transpar-ent processes and supported by a flexible digital environment.
These five initiatives will be refined and implemented in 2017. Expenditure and investments relating to these themes will be oriented to and justified by the company’s sustainable growth.
The 2016 result was obtained in a challenging environment and quite a few challenges are ahead of us in 2017 too. However, we look forward to the future with confidence: – The orders for spring/summer 2017 are stronger than in 2016.
Swimwear continues to grow. PrimaDonna Sport, a new product category, will be delivered for the first time in 2017. All lingerie brands show growth and marketing budgets for all brands will be increased further. We do still expect a negative impact on the UK pound in the first half of 2017.
– Retail in Continental Europe and the United Kingdom entered the year up slightly and we anticipate growth (in local currency) in 2017, driven in part by eCommerce. The decline of the British pound will influence turnover in the first half of 2017. Retail in the United States remains a priority. The new team will focus on attracting new cus-tomers, achieving operational excellence in stores and developing a profitable store formula in combination with eCommerce.
– Consumer engagement and consumer insight across all channels remain key and employee satisfaction and engagement initiatives are planned.
Erwin Van Laethem – CEO as of 1/11/16, with thanks to Ignace Van Doorselaere – CEO up to 31/10/16 – and the Management Committee.

| 13 |
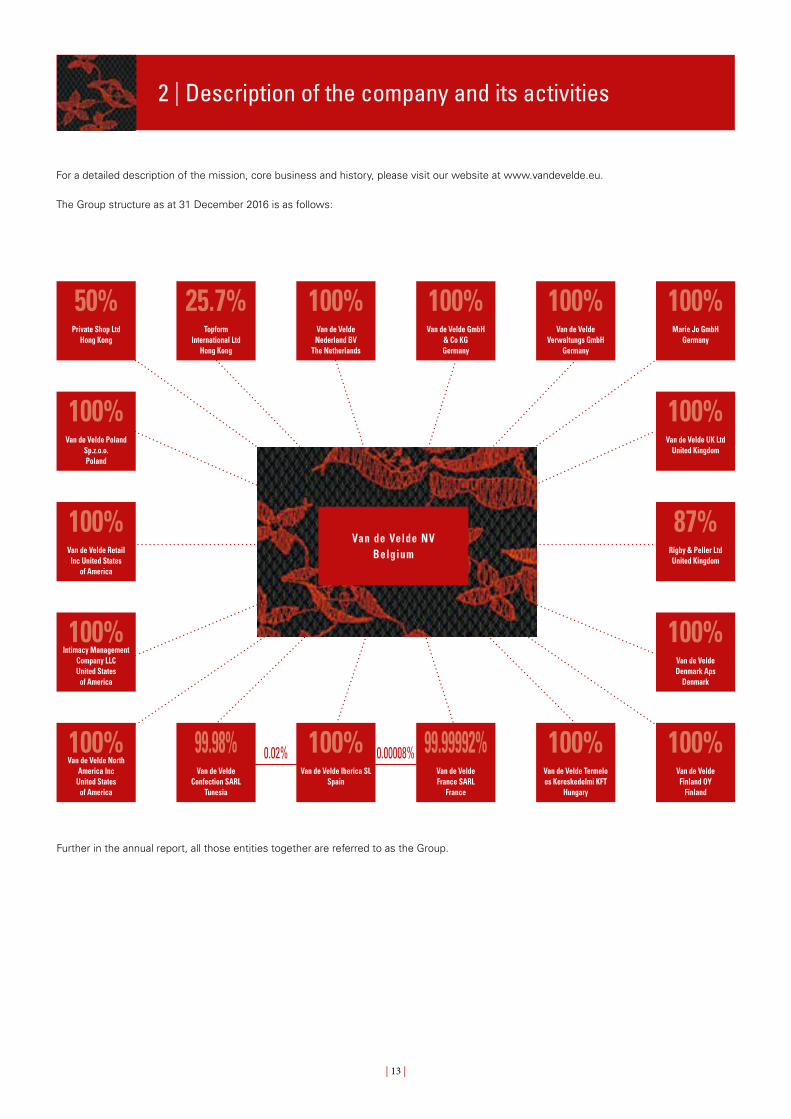
2 | Description of the company and its activities
Further in the annual report, all those entities together are referred to as the Group.
0.00008%0.02%
Van de Velde NVBelgium
For a detailed description of the mission, core business and history, please visit our website at www.vandevelde.eu.
The Group structure as at 31 December 2016 is as follows:
50%Private Shop Ltd
Hong Kong
100%Van de Velde Nederland BV
The Netherlands
25.7%Topform
International LtdHong Kong
100%Marie Jo GmbH
Germany
100%Van de Velde
Verwaltungs GmbHGermany
100%Van de Velde GmbH
& Co KGGermany
100%Van de Velde UK Ltd
United Kingdom
87%Rigby & Peller Ltd United Kingdom
100%Van de Velde Denmark Aps
Denmark
100%Van de Velde Finland OY
Finland
100%Van de Velde Termelo es Kereskedelmi KFT
Hungary
100%Intimacy Management
Company LLC United States
of America
99.99992%Van de Velde France SARL
France
100%Van de Velde Iberica SL
Spain
99.98%Van de Velde
Confection SARLTunesia
100%Van de Velde North
America Inc United States
of America
100%Van de Velde Poland
Sp.z.o.o. Poland
100%Van de Velde Retail
Inc United States of America

| 15 |
1 | Het Jaar 20113 | Corporate Governance
Van de Velde is a listed family company and as such it gives special attention to gearing its operations and organization to the provisions of the Corporate Governance Code. On 17 February 2017 the Board of Directors of Van de Velde NV approved the Corporate Governance Charter, which is available on the company’s website.
The company’s family nature is also an important ingredient in good governance. That is because the family has an interest in the company being managed in a professional and transparent way. That is expressed among other things by the presence of experienced family members on the Board of Directors.
Corporate governance and transparency are also discussed in other chapters of this annual report.
The Board of Directors
Composition of the Board of DirectorsThe Board of Directors of Van de Velde NV is composed as follows:
– Herman Van de Velde NV, always represented by Herman Van de Velde, chairman (tenure expires at the Ordinary General Meeting of 2018);
– Lucas Laureys, director (tenure expires at the Ordinary General Meeting of 2019);
– Bénédicte Laureys, director (tenure expires at the Ordinary General Meeting of 2018);
– Positron BVBA1, always represented by Erwin Van Laethem, man-aging director (tenure expires at the Ordinary General Meeting of 2017);
– EBVBA Benoit Graulich, always represented by Benoit Graulich, director (tenure expires at the Ordinary General Meeting of 2019);
– BVBA Dirk Goeminne, always represented by Dirk Goeminne, director (tenure expires at the Ordinary General Meeting of 2017);
– Emetico NV, always represented by Yvan Jansen, director (tenure expires at the Ordinary General Meeting of 2019);
– Mavac BVBA, always represented by Marleen Vaesen, director (tenure expires at the Ordinary General Meeting of 2019).
Honorary director: Henri-William Van de Velde, son of the founder, Doctor of Laws.
EBVBA Benoit Graulich, BVBA Dirk Goeminne and Emetico NV are considered to be independent directors.
Lucas Laureys, Bénédicte Laureys, Mavac BVBA and Herman Van de Velde NV represent Van de Velde Holding NV, the majority shareholder of Van de Velde NV, and are non-executive directors.
Positron BVBA is since 1 November 2016 managing director and member of the Management Committee. As of 1 November 2016 EBVBA 4F resigned as director and managing director.
Since the Act of 28 July 20112 the general meeting of Van de Velde NV appointed one additional female director.
As from 1 January 2016 Herman Van de Velde NV chairs the Board of Directors.
The company secretary is Nathalie De Kerpel, legal counsel.
Operation and activity report of the Board of DirectorsVan de Velde’s Board of Directors directs the company in accordance with the principles laid down in Belgium’s Companies Code and makes decisions on the general policy. These comprise the assessment and approval of strategic plans and budgets, supervision of reports and internal controls and other tasks assigned by law to the Board of Directors.
Pursuant to Article 524bis of Belgium’s Companies Code, the Board of Directors has established a Management Committee to which it has delegated its managerial powers, with the exception of general policy and all actions that are reserved to the Board of Directors by statutory provisions.
The Board of Directors has also established the following advisory committees: an Audit Committee, a Nomination and Remuneration Committee and a Strategic Committee.
For a detailed description of the operation and responsibilities of the Board of Directors we refer you to the company’s Corporate Governance Charter, which is published on the company’s website.
In 2016 the Board of Directors met eight times. There was an additional meeting of the Board of Directors attended only by the non-executive directors for the purpose of evaluating the interaction between the Board of Directors and the Management Committee. Mavac BVBA was excused during one board meeting. Otherwise, all board meet-ings were fully attended. .
Committees within the Board of Directors(a) Audit Committee The objective of the Audit Committee is to assist the Board of
Directors in carrying out its control tasks with respect to Van de Velde’s financial reporting process, including supervision of the integrity of the financial statements, and the qualifications, inde-pendence and performance of the statutory auditor.
The Audit Committee advises the Board of Directors on the follo-wing: – Appointment (and dismissal) and remuneration of the statutory
auditor; – Preparation of bi-annual and annual results; – Internal control and risk management; – External audit.
1 Nominated by means of co-optation as from 1 November 2016 as replacement of EBVBA 4F, who resigned as of the same date.2 This Act aims to ensure that there is gender balance in board of directors.

| 16 |
The chairman of the Nomination and Remuneration Committee is BVBA Dirk Goeminne, represented by Dirk Goeminne. All mem-bers of the committee possess sound knowledge of remuneration policy.
The Nomination and Remuneration Committee meets as often as is needed for its proper operation, but never less than two times every year. The Nomination and Remuneration Committee met six times in 2016. All members attended these meetings.
No director attends the meetings of the Nomination and Remuneration Committee in which his or her own remuneration is discussed or may be involved in any decision concerning his or her remuneration.
For a detailed summary of the responsibilities and the operation of the various committees established by the Board of Directors, see the company’s Corporate Governance Charter, which is published on the company’s website.
(d) Management Committee In accordance with Article 23.4 of the Articles of Association and
Article 524bis of Belgium’s Companies Code, the Board of Directors established a Management Committee on 2 March 2004.
The Management Committee meets on average every three weeks and is responsible for managing the company. It exercises the man-agerial powers that the Board of Directors has delegated to the Management Committee.
The Management Committee is composed as follows:
– Positron BVBA, always represented by Erwin Van Laethem, CEO;
– Bart Rabaey Consulting VOF, always represented by Bart Rabaey, CFO, as of 1 May 2016;
– Isabelle Massagé, global sales director; – Karlien Vanommeslaeghe, people & organization director; – Hedwig Schockaert, ICT & supply chain director; – YWMA BVBA, always represented by Yan Aerts, global retail
director, as of 1 September 2016; – Louis de Saint Michel, global brand director and chief marketing
officer.
During 2016 the following persons left the Management Committee: – Dirk De Vos as of 1 February, 2016; – Peter Bynens as of 1 July, 2016; – Stefaan Vandamme as of 24 June 2016.
EBVBA 4F, permanently represented by Ignace Van Doorselaere, had a fixed term agreement as chairman of the Management Committee (CEO), which expired on 31 December 2016.
Since 1 November 2016 the chairman of the Management
Committee (CEO) is Positron BVBA, always represented by Erwin Van Laethem.
The Audit Committee is composed as follows: – Lucas Laureys; – BVBA Dirk Goeminne, always represented by Dirk Goeminne (inde-
pendent director); – EBVBA Benoit Graulich, always represented by Benoit Graulich
(independent director). The members of the committee possess sound knowledge of
financial management. The chairman of the Audit Committee is EBVBA Benoit Graulich,
always represented by Benoit Graulich.
The Audit Committee meets no fewer than three times a year and as often as considered necessary for its proper operation. In 2016 the Audit Committee met four times. All Audit Committees were fully attended.
(b) Strategic Committee The role of the Strategic Committee is to assist the Board of
Directors in establishing the company’s strategic direction. Other important strategic themes can be discussed ad hoc, including: – Mergers and acquisitions; – Developments at competitors, customers or suppliers that may/
will impact the company; – Important regional developments for the company; – Technological opportunities and/or threats for the company; – Budget assessment.
The Strategic Committee is composed as follows: – Lucas Laureys; – Positron BVBA, always represented by Erwin Van Laethem; – Herman Van de Velde NV, always represented by Herman Van de
Velde.
The chairman of the Strategic Committee is Herman Van de Velde. Other members of the Board of Directors can be invited to participate in the Strategic Committee on an ad hoc basis.
The Strategic Committee meets no fewer than two times a year and as often as considered necessary for its proper operation. (c) Nomination and Remuneration Committee The Nomination and Remuneration Committee formulates recom-
mendations to the Board of Directors concerning the company’s remuneration policy, the remuneration of the directors and mem-bers of the Management Committee and the appointment of the directors and members of the Management Committee, and is responsible for the selection of suitable candidate directors.
The Nomination and Remuneration Committee is composed as fol-lows:
– Herman Van de Velde NV, always represented by Herman Van de Velde;
– EBVBA Benoit Graulich, always represented by Benoit Graulich; – BVBA Dirk Goeminne, always represented by Dirk Goeminne.

| 17 |
tees, as well as the interaction with the Management Committee. The directors give their full cooperation to the Nomination and Remuneration Committee and any other persons, within or outside the company, responsible for this evaluation. Based on the findings of the evaluation, the Nomination and Remuneration Committee will, where applicable and in consultation with any external experts, submit to the Board of Directors a report of the strengths and weaknesses and any proposal to appoint new directors or refrain from renewing a directorship.
The Board of Directors evaluates the performance of the commit-tees at least every three years.
The non-executive directors evaluate their interaction with the Management Committee annually.
The CEO together with the Nomination and Remuneration Committee evaluates the functioning and performance of the Management Committee annually.
The members of the Management Committee are appointed and dismissed by the Board of Directors on the basis of the recom-mendations of the Nomination and Remuneration Committee. The members of the Management Committee are appointed for an indefinite period, unless the Board of Directors decides other-wise. The ending of the tenure of a member of the Management Committee has no impact on the agreements between the com-pany and the person involved as regards additional duties over and above this tenure.
(e) Daily management In addition to the Management Committee, Van de Velde’s daily
management is in the hands of Positron BVBA, always represented by Erwin Van Laethem, managing director.
(f) Evaluation At least every three years, the Board of Directors, headed by its
chairman, conducts an evaluation of its size, composition and per-formance, and the size, composition and performance of its commit-
| 18 |
A directorship may be terminated at any time without any form of compensation. There are no employment contracts or service contracts that provide for notice periods or severance payments between the company and the members of the Board of Directors who are not members of the Management Committee.
3. The remuneration of the members of the Management Committee
The level and structure of the remuneration for the members of the Management Committee must be such that qualified and expert pro-fessionals can be attracted, retained and motivated, bearing in mind the nature and scope of their individual responsibilities. To this end, an international HR consultant is given the task of proposing the job weighting and the corresponding customary salary package in the rele-vant market. The compensation is regularly benchmarked on the basis of a relevant sampling of listed companies.
The managing director makes proposals to the Nomination and Remuneration Committee with regard to members’ remuneration on an individual basis.
Other principles on which the remuneration policy is based: – A member of the Management Committee who is also a member
of the Board of Directors shall receive no remuneration for being a member of the Board of Directors.
– A member of the Management Committee who is also a mana-ging director shall receive no remuneration for being a managing director.
– An appropriate part of the remuneration package of the members of the Management Committee must be linked to the performance of the company and individual performance, to the extent that the interests of the Management Committee are aligned with the inte-rests of the company and its shareholders.
– If members of the Management Committee are eligible for a bonus based on the performances of the company or its subsidiaries or on individual performance, the remuneration report will state the crite-ria applied to evaluate the performance against the targets as well as the evaluation period. These details shall be published in such a way that no confidential information is disclosed with regard to the company’s strategy.
– In principle, granted shares or other forms of deferred remunera-tion are not deemed to be acquired and options may not be exer-cised within three years of their grant date.
– Obligations of the company in the framework of premature exit arrangements will be closely investigated to ensure poor perfor-mance is not rewarded.
Remuneration report 1. IntroductionThe remuneration report provides transparent information on Van de Velde’s remuneration policy for its directors and members of the Management Committee, in accordance with the Belgian Corporate Governance Act of 6 April 2010 and the Belgian Corporate Governance Code. The underlying remuneration report will be submitted for approval to the General Meeting of 26 April 2017 and presented to the works council, in accordance with the provisions of the Act.
The company’s remuneration policy is focused on attracting and retain-ing profiles with the experience needed to ensure the continuity and growth of the company. The aim of the reward policy is to ensure employees are properly compensated, based on the performance of the employee and the company. The evolution of the total reward is linked to the results of the company and individual performance.
2. Remuneration of the directorsThe Nomination and Remuneration Committee makes recommenda-tions to the Board of Directors with regard to the compensation for directors, including the chairman of the Board of Directors. These recommendations are subject to the approval of the Board of Directors.
The compensation for the non-executive directors is proposed to the General Meeting. They receive only fixed remuneration for their membership of the Board of Directors and the advisory committees on which they have a seat1. The amount of the remuneration will only take into account their role in the Board of Directors and various committees, the ensuing responsibilities and time spent.
The non-executive directors receive no performance-related remu-neration such as bonuses, long-term payments, non-cash benefits or pension plans. Non-executive directors are not granted any options or warrants.
As from 1 January 2016 Herman Van de Velde NV, permanently repre-sented by Herman Van de Velde, was appointed as chairman. Herman Van de Velde NV receives an annual gross remuneration of 25,000 euro for its chairmanship, his membership of the Nomination and Remuneration Committee and the Strategic Committee. The other non-executive members receive annual remuneration of 15,000 euro for their membership of the Board of Directors and 2,500 euro for their membership of the Audit and/or Nomination and Remuneration Committee respectively. BVBA Dirk Goeminne and EBVBA Benoit Graulich are both a member of the Nomination and Remuneration Committee and Audit Committee, and therefore receive a total annual remuneration of 20,000 euro. Lucas Laureys is a member of the Audit Committee and receives an annual remuneration of 17,500 euro.
The members of the Board of Directors who are also members of the Management Committee receive no remuneration for their member-ship of the Board of Directors.
1 Audit Committee and Nomination and Remuneration Committee

| 19 |
Plans in which members of the Management Committee are compen-sated in shares, share options or any other rights to acquire shares are subject to prior shareholder approval at the Annual General Meeting. The approval relates to the plan itself and not to the individual grant of share-based benefits under the plan. In principle, shares are not permanently acquired and options are not exercisable within less than three years.
The total gross remuneration (in ’000 euro) (including remunerations received from other companies that form part of the Group) awarded in 2016 to the members of the Management Committee and the CEO were as follows:
Management Committee 3 CEO 4
Basic remuneration 1,107 5 688 6
Variable remuneration 199 276 7
Pensions/disability/ guaranteed income
21 0
Other benefits 23 0
The variable remuneration is the bonus acquired during the year under review. There are various types of grant, including cash, deferred payment and deposit into a supplementary pension plan. The members of the Management Committee who are also employees are also enti-tled to a company car with fuel card as per the company car policy, meal vouchers, a group insurance (pension plan including a disability and decease coverage) and hospitalization insurance.
Currently, four members of the Management Committee are employed on the basis of an employment contract, which can (with the excep-tion of the employment contract of Isabelle Massagé) be terminated, subject to the notice term calculated in accordance with the applica-ble labour laws. This notice term can be replaced by a corresponding termination indemnity as the company sees fit. No other termination indemnity is provided for. The employment agreement of Isabelle Massagé can be terminated by the company, with due regard for a notice term or corresponding termination indemnity of 8 months’ fixed and variable salary, provided Isabelle Massagé has been employed within the Group for less than 10 years8. As from the moment Isabelle Massagé has been employed within the Group for 10 years or more, this notice period will be increased to 12 months. However, in the event of a termination for urgent cause, the contract can be termi-nated with immediate effect.
A variable annual remuneration (‘team bonus’) is granted to the CEO and the members of the Management Committee. This is based on the attainment of annual targets relating to the fiscal year for which the variable remuneration is payable, as set by the Nomination and Remuneration Committee. These targets are based on objective parameters and are closely linked to the results of the Group. Every year, the Nomination and Remuneration Committee evaluates the degree to which the targets1 have been met and submits this report to the Board of Directors for approval. The maximum amount of this team bonus, not including the CEO, is 37,500 euro per member. For the CEO the maximum amount is 300,000 euro.
There is also an individual bonus scheme for some members of the Management Committee, including the CEO, based on the attainment of individual targets relating to the fiscal year for which the variable remuneration is payable, as set down every year in writing by the Nomination and Remuneration Committee. These targets are based on objective parameters and are closely dependent on the responsi-bilities of the member in question. The Nomination and Remuneration Committee evaluates the degree to which these individual targets have been attained and submits this report to the Board of Directors for approval. This individual variable remuneration may not exceed 37.5% of the annual brut salary2 (with exception for the CEO). The CEO’s individual variable remuneration may not exceed 150,000 euro.
In addition to the variable remuneration system, the Board of Directors retains the discretionary power to grant an additional bonus to the CEO and one or more members of the Management Committee to reward a specific performance or merit, on the proposal of the Nomination and Remuneration Committee.
For the CEO 2/3 of the total earned bonus is paid after the closure of the financial year. 1/3 of this bonus is paid as follows, provided the CEO is still working for Van de Velde at the time of the scheduled payment: – 33% of this 1/3: in February of the second year after the financial
year to which the bonus relates; – 33% of this 1/3: in February of the third year after the financial year
to which the bonus relates; – 33% of this 1/3: in February of the fourth year after the financial
year to which the bonus relates.
There are no special agreements or systems that entitle the company to claim back variable remuneration that has been paid out if it has been granted erroneously on the basis of data that subsequently proves to be incorrect. In such cases, the company will invoke the possibilities found in common law.
1 In respect of the targets related to the results of the Group, the audited accounts are used as a basis to determine whether these targets have been reached. In respect of the targets related to the results of the Group, the audited accounts are used as a basis to determine whether these targets have been reached.
2 For some members of the Management Committee, the maximum is lower.3 Excluding the CEO. If remunerated through a management agreement, the total cost of company is included. If remunerated through an employment contract, the social security charges
paid by the employer are not included. 4 CEO (EBVBA 4F) until 31 October 2016. Released from performance from 1 November 2016 until 31 December 2016. CEO (Positron BVBA) appointed CEO on 1 November 2016,
remuneration for the period 1 September 2016 until 31 December 2016.5 Departure holiday pay is included in the figures6 The figures display the cost for the company7 The figures display the cost for the company.8 Only the basic salary shall be taken into account for the calculation of any termination indemnity, which shall not exceed 8 or 12 months’ basic salary if the employee in question has not
satisfied the performance criteria established to determine entitlement to any bonus.

| 20 |
Major characteristics of internal control and risk management systems
The Management Committee leads the company within the frame-work of careful and effective control, which makes it possible to evalu-ate and manage risks. The Management Committee develops and maintains appropriate internal controls that offer reasonable assurance on the attainment of the goals, the reliability of the financial informa-tion, compliance with applicable laws and regulations, and the execu-tion of internal control processes.
The Board of Directors oversees the proper functioning of the control systems through the Audit Committee. The Audit Committee evalu-ates the effectiveness of the internal control and risk management systems at least once a year. It must ensure that significant risks are properly identified, managed and brought to its attention.
In monitoring the financial reporting, the Audit Committee espe-cially evaluates the relevance and coherence of the financial state-ment standards applied by the company and its Group. This entails an assessment of the accuracy, completeness and consistency of the financial information. The Audit Committee discusses significant financial reporting issues with executive management and the external auditor.
The Board of Directors bears responsibility for analysis and proac-tive measures and plans with regard to strategic risks. The Board of Directors approves the strategy and goals every year. An annual growth
plan for the following year is presented to the Board of Directors for approval. The growth plan is monitored systematically during the meet-ings of the Board of Directors, and may be adapted on the basis of changed prospects.
Operational risks are regularly identified, updated and evaluated. The operational risks were documented and a number of actions are taken to manage the risks. The financial department is responsible for moni-toring and reporting these. The Management Committee bears the responsibility for analysis, proactive measures and plans with regard to operational risks.
For each process, internal controls should be in place guaranteeing, where possible, the proper functioning of this process. The effective-ness of the internal controls that are important for the completeness and correctness of the reported figures is regularly verified by the financial department, on the basis of random sampling. An example is the permanent stock system for raw materials and finished products.
Additional information is provided in the company’s Corporate Governance Charter as published on the website.
With respect to risk management, we also refer to note 30 related to ‘Business risks with respect to IFRS 7’.
The CEO and two other members of the Management Committee are engaged on an independent basis. The notice period in the manage-ment agreements is no more than 6 months.
During 2016 no termination indemnity was granted to any of the mem-bers of the Management Committee.
4. Remuneration policy for coming yearsNo extraordinary changes are expected to be made to the remunera-tion policy for coming years and the above-mentioned provisions will remain in force.
5. Share-based paymentsThe General Meeting of 29 April 2015 approved the 2015 option plan giving the Nomination and Remuneration Committee the power
Options end 2015 Granted and accepted in 2016 Exercised in 2016 Options end 2016
Number Number Exercise price
EBVBA 4F 13,500 0 5,000 34.88 8,500
Herman Van de Velde NV 10,000 0 0 10,000
Hedwig Schockaert 10,000 5,000 5,000 34.88 10,000
YWMA BVBA 0 5,000 0 5,000
Positron BVBA 0 5,000 0 5,000
Bart Rabaey Consulting VOF 0 5,000 0 5,000
33,500 20,000 10,000 43,500
to grant options on the company’s shares to the members of the Management Committee for a term of five years. These options are granted at no charge. The exercise price per share of the options is equal to (i) the average closing price of the share in the course of the thirty calendar days prior to the date of the offer or (ii) the closing price of the final trading day preceding the date of the offer, whichever is lowest. An option remains valid for ten years. The company and the option holder may decide by mutual agreement to reduce the terms of validity of the option below ten years but never below five years. The options cannot be exercised before the end of the third calendar year after the year in which they are offered.
In 2016 20,000 options in total were granted to the members of the Management Committee and 10,000 options were exercised. No unexercised options expired.
| 21 |
Transactions between the company and its directorsThe company’s Corporate Governance Charter, which is published on the company’s website, explains the rules applicable to transac-tions and other contractual links between the company, includ-ing its affiliated companies, and its directors and members of the Management Committee that are not covered by the conflict of inter-ests scheme.
During 2016 no such transactions or other contractual links occurred.
Statutory auditorThe General Meeting of 27 April 2016 of Van de Velde NV appointed Ernst & Young Bedrijfsrevisoren BVCBA, Moutstraat 54, 9000 Ghent, represented by Paul Eelen, as the statutory auditor. This appointment runs until the Ordinary General Meeting of 2019.
Regular consultations are held with the statutory auditor, who is also invited to the Audit Committee for the half-year and annual reporting. The statutory auditor has no relationship with Van de Velde that could impact his opinion.
The annual remuneration in 2016 for auditing of the statutory and consolidated financial statements of Van de Velde NV was 57,500 euro (excl. VAT). The total costs for 2016 for the auditing of the annual accounts of all companies of the Van de Velde Group were 163,803 euro (excl. VAT), including the aforementioned 57,500 euro.
In accordance with Article 134 of Belgium’s Companies Code, Van de Velde announces that the remuneration given to the statutory auditor for exceptional and special tasks and to the persons with whom the statutory auditor has a professional relationship was 41,155 euro (excl. VAT), all of which was for tax advice and compliance tasks.
Belgian Code on Corporate GovernanceVan de Velde NV complied with the principles laid down in the Belgian Code on Corporate Governance.
Conflict of Interests SchemeIn 2016 no conflicts of interests were declared in the Board of Directors within the meaning of Article 523 of Belgium’s Companies Code.
Shareholding structure on the balance sheet dateThe subscribed capital is 1,936,173.73 euro. It is represented by 13,322,480 shares.
Within the framework of Belgium’s Transparency Act of 2 May 2007 stakes must be made public in accordance with the thresholds provided for by the Articles of Association. The thresholds in Van de Velde’s Articles of Association are: – 3%; – 5%; – multiples of 5%.
Van de Velde Holding NV holds 7,496,250 (56.27%) shares. It does so through the Vesta foundation as well as Hestia Holding NV and Ambo Holding NV. Vesta foundation and Hestia Holding NV together repre-sent the interests of the Van de Velde family; Ambo Holding NV repre-sents the interests of the Laureys family.
Information about specific safeguardsA majority of Van de Velde NV’s directors are appointed from the candi-dates nominated by Van de Velde Holding NV, as long as it directly or indirectly holds no less than 35% of the company’s shares.
Miscellanea
Insider trading The members of the Board of Directors and some employees that may possess important information (‘insiders’) have signed the protocol preventing abuse of privileged information. This means that anyone wishing to trade in Van de Velde shares must first request the permis-sion of the Compliance Officer.
Insiders are not permitted to trade in securities in the following periods:(i) The period between the final meeting of the Board of Directors
prior to the end of the year and the moment the annual results are announced;
(ii) The period of two months immediately prior to the announcement of the company’s half-year results or the period commencing at the time of closure of the half year in question and ending at the time of publication of the half-year results, whichever is shorter.
The Board of Directors can impose a general transaction ban on all insiders in other periods that may be considered to be sensitive.
All other staff at Van de Velde have been notified in writing of the statu-tory stipulations concerning abuse of insider knowledge.

| 22 |
Acquisition of own shares
On 30 April 2014 the Extraordinary General Meeting of Shareholders authorized the Board of Directors to buy or sell its own shares. This authorization is valid for a period of (i) three years as from 27 May 2014 if the acquisition is necessary to avoid a serious threatened disadvan-tage and (ii) five years as from 30 April 2014 if the Board of Directors, in accordance with Article 620 of Belgium’s Companies Code, acquires the legally permitted number of its own shares at a price equal to the price at which they are listed on Euronext Brussels.
In 2016 15,000 own shares were acquired by Van de Velde NV. At the end of 2016 Van de Velde NV has no own shares in its possession.
The treasury shares owned by Van de Velde NV are held with the inten-tion of offering them to the management within the framework of a stock option programme initiated in 2005. See note 13 to the consoli-dated financial statements for more information.
Dividend Policy
Van de Velde’s objective is to pay out a stable and gradually increasing annual dividend. In doing so, it takes the following factors into consid-eration: – Appropriate payment to shareholders in comparison with other
companies listed on Euronext Brussels; – Retention of sufficient self-financing capacity to respond to attrac-
tive investment opportunities; – Remuneration proportionate to cash flow expectations.
The dividend policy of Van de Velde consists in paying out at least 40% of the consolidated profit, Group share, excluding the result based on the equity method. Furthermore, Van de Velde does not retain excess cash in the organization.
Based on a decision of the Board of Directors of 31 August 2016 Van de Velde paid out an interim dividend of 1.3500 euro gross per share.
Financial Services
The financial services are provided by ING as main payment agent.
Proposed profit distribution
The dividend on distributable profit will be allocated to the shares with rights that are not suspended. In other words, the treasury shares held for which no profit share is retained are not taken into account to reduce distributable profit. This concerns zero treasury shares purchased within the framework of the option programme (see above). Reference is made to Article 622 of Belgium’s Companies Code.
Information to shareholdersShare listing
The shares of Van de Velde have been quoted on the Brussels stock exchange, currently Euronext Brussels, since 1 October 1997, under the abbreviation ‘VAN’ (MNENO). Van de Velde’s shares can be traded using the ISIN code BE 0003839561.
Euronext Brussels lists Van de Velde on the spot market (continuous market) of Euronext Brussels in compartment B (market capitalization between 150 million and 1 billion euro).
In line with its series of local indexes, Euronext Brussels maintains a BEL20, BEL Mid and BEL Small index, the components of which are selected on the basis of liquidity and free float market capitalization.
Van de Velde is listed in the BEL Mid index. The weight in this index was 1.77% at the end of 2016.
Liquidity provider
Van de Velde concluded a liquidity agreement with Bank Degroof in July 2002.
A liquidity provider guarantees the constant presence of bid and offer prices at which investors can conduct transactions and sets a perma-nent maximum spread between purchase and selling price of 5%. This allows the increase in share velocity and the reduction of the spreads between bid and offer prices. Major price fluctuations can be avoided on small traded volumes and the listing on the continuous segment of Euronext Brussels can be guaranteed.
General Meeting
The General Meeting of Shareholders is held at the seat of the company (unless another place is mentioned in the convocation) at 5 pm on the last Wednesday of April. If this day is an official holiday the meeting is held on the next working day.
An Extraordinary General Meeting can be convened whenever the interests of the company so demand it and must be convened when-ever the shareholders representing one-fifth of the capital so demand it.
Authorized capital
The Board of Directors is authorized for a period of five years from the announcement in the annexes to Belgisch Staatsblad/Moniteur belge (21 May 2012) to raise the subscribed capital one or more times by a total amount of 1,936,173.73 euro, under the conditions stated in the Articles of Association.
| 23 |
The number of shares with dividend rights is accordingly not reduced and amounts to 13,322,480 shares.
The application of the pay-out percentage (40% of consolidated profit, Group share, excluding result based on the equity method) produces a dividend per share of 1.02 euro.
Van de Velde has the policy of not retaining excess cash in the organi-zation, but distributing it in one way or another to the shareholders. Cash required for operating and investing activities is evaluated on an annual basis. For 2016 this implies that the Board of Directors will propose to the General Meeting the payment of a gross dividend for the fiscal year 2016 of 3.5000 euro per share. After the payment of withholding tax, this represents a net dividend of 2.4905 euro per share. Of this amount, 1.3500 euro per share (or 0.9855 euro net per share) was paid out as an interim dividend in November 2016. After approval by the General Meeting of Shareholders, the final dividend of 2.1500 euro per share (net dividend of 1.505 euro per share) will be paid out as from 4 May 2017.
Financial Calendar Closing of fiscal year 2016 31 December 2016
Announcement of 2016 turnover figures 9 January 2017
Announcement of annual results 2016 20 February 2017
Publication of annual financial report 24 March 2017
General Meeting of Shareholders 26 April 2017
Ex-coupon date 2 May 2017
Record date 3 May 2017
Dividend payment date 4 May 2017
Announcement of H1 2017 turnover figures 7 July 2017
Publication of 2017 half-year results 31 August 2017
Closing of fiscal year 2017 31 December 2017

| 24 |
4 | Consolidated key figures 2016
Profit and loss account (in millions of euro) 2016 2015 2014 2013 2012
Operating income 211.9 214.5 203.3 186.8 186.8
Turnover 206.6 209.0 198.4 182.4 181.8
Turnover on a comparable basis (1) 206.8 206.7 195.6 182.4 181.8
Recurring EBITDA (2) 61.9 61.9 57.7 48.7 48.8
Recurring EBITDA on a comparable basis (3) 62.0 60.4 55.9 48.7 48.8
Recurring EBIT (4) 53.6 53.7 49.5 41.1 42.7
Consolidated result before taxes (5) 53.3 54.0 18.8 40.5 38.0
Consolidated result after taxes (5) 34.0 40.6 2.5 31.7 28.0
Profit for the period (6) 33.6 41.0 2.5 31.8 25.6
Operating cash flow (7) 45.1 50.3 45.9 34.8 30.8
(1) Turnover on a comparable basis is turnover excluding early deliveries, to enable seasons to be compared.
(2) EBITDA is earnings before interest, taxes, depreciation and amortization on tangible and intangible assets. The recurring EBITDA for 2013 does not include the non-recurring restructuring cost for Eurocorset in the amount of 1.7 million euro.
(3) EBITDA on a comparable basis is EBITDA excluding the impact of early deliveries, to enable seasons to be compared.
(4) EBIT is earnings before interest and taxes. The recurring EBIT for 2013 does not include the non-recurring restructuring costs.
(5) Result of the Group (Group share) before share in the profit / (the loss) of associates (equity method). An impairment of 31.4 million euro was recognized in 2014. An impair-ment of 8 million euro was recognized in 2012.
(6) Result of the Group (Group share) after share in the profit / (the loss) of associates (equity method).
(7) Operating cash flow is net cash from operating activities.
Balance sheet (in miljoen euro) 2016 2015 2014 2013 2012
Fixed assets 71.9 70.8 68.0 100.9 109.4
Current assets 84.8 90.9 91.9 96.3 87.7
Shareholders’ equity 116.6 129.2 134.0 173.5 170.0
Balance sheet total 156.7 161.7 159.9 197.2 197.1
Net debt position (1) -18.0 -27.8 -34.2 -38.9 -31.1
Working capital (2) 32.2 35.9 37.2 42.3 39.0
Capital employed (3) 104.1 106.8 105.2 143.2 148.4
(1) Financial debts less cash and cash equivalents (a negative position refers to a cash position; a positive position refers to a debt position).
(2) Current assets (excluding cash and cash equivalents) less current liabilities (excluding financial debts).
(3) Fixed assets plus working capital.
| 25 |
(1) Consolidated result after taxes / Average of equity at end of fiscal year and previous fiscal year. In case impairment in 2014 is not taken into account, the return on equity is 22.0%.
(2) Consolidated result after taxes / Average of capital employed at end of fiscal year and previous fiscal year. In case impairment in 2014 is not taken into account, the return on capital employed is 27.3%.
(3) Equity / Balance sheet total.(4) Current assets / Current liabilities.
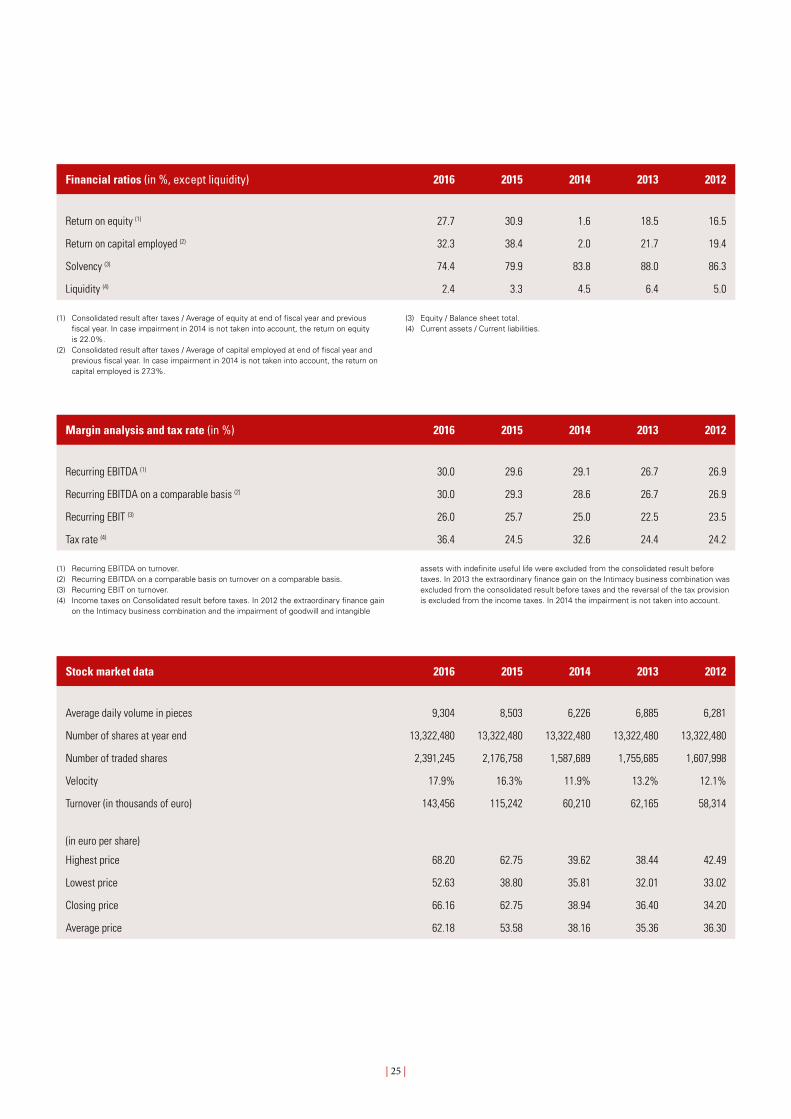
Financial ratios (in %, except liquidity) 2016 2015 2014 2013 2012
Return on equity (1) 27.7 30.9 1.6 18.5 16.5
Return on capital employed (2) 32.3 38.4 2.0 21.7 19.4
Solvency (3) 74.4 79.9 83.8 88.0 86.3
Liquidity (4) 2.4 3.3 4.5 6.4 5.0
Margin analysis and tax rate (in %) 2016 2015 2014 2013 2012
Recurring EBITDA (1) 30.0 29.6 29.1 26.7 26.9
Recurring EBITDA on a comparable basis (2) 30.0 29.3 28.6 26.7 26.9
Recurring EBIT (3) 26.0 25.7 25.0 22.5 23.5
Tax rate (4) 36.4 24.5 32.6 24.4 24.2
(1) Recurring EBITDA on turnover.(2) Recurring EBITDA on a comparable basis on turnover on a comparable basis. (3) Recurring EBIT on turnover.(4) Income taxes on Consolidated result before taxes. In 2012 the extraordinary finance gain
on the Intimacy business combination and the impairment of goodwill and intangible
assets with indefinite useful life were excluded from the consolidated result before taxes. In 2013 the extraordinary finance gain on the Intimacy business combination was excluded from the consolidated result before taxes and the reversal of the tax provision is excluded from the income taxes. In 2014 the impairment is not taken into account.
Stock market data 2016 2015 2014 2013 2012
Average daily volume in pieces 9,304 8,503 6,226 6,885 6,281
Number of shares at year end 13,322,480 13,322,480 13,322,480 13,322,480 13,322,480
Number of traded shares 2,391,245 2,176,758 1,587,689 1,755,685 1,607,998
Velocity 17.9% 16.3% 11.9% 13.2% 12.1%
Turnover (in thousands of euro) 143,456 115,242 60,210 62,165 58,314
(in euro per share)
Highest price 68.20 62.75 39.62 38.44 42.49
Lowest price 52.63 38.80 35.81 32.01 33.02
Closing price 66.16 62.75 38.94 36.40 34.20
Average price 62.18 53.58 38.16 35.36 36.30
| 26 |
(1) Enterprise value / Recurring EBITDA.(2) Enterprise value / Recurring EBITDA on a comparable basis.(3) Closing price / Profit for the period. In case impairment in 2014 is not taken into account,
the price/profit multiple is 15.3.
(4) Market capitalization / Book value.
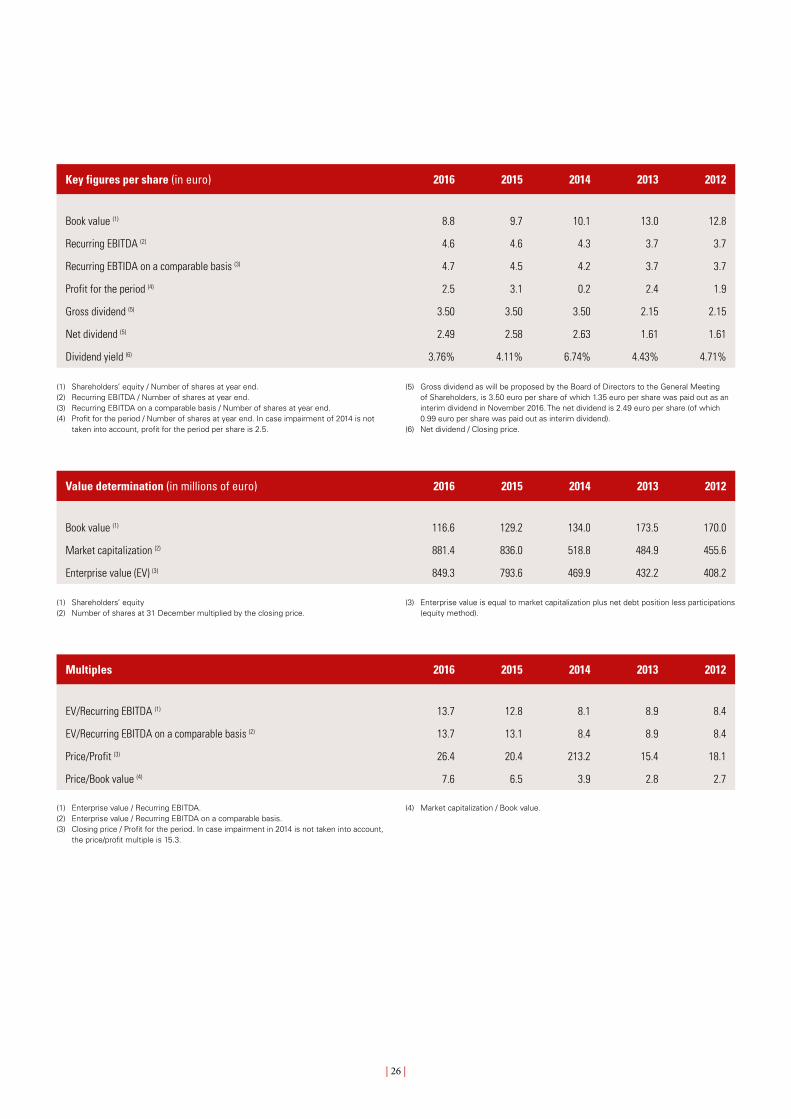
Key figures per share (in euro) 2016 2015 2014 2013 2012
Book value (1) 8.8 9.7 10.1 13.0 12.8
Recurring EBITDA (2) 4.6 4.6 4.3 3.7 3.7
Recurring EBTIDA on a comparable basis (3) 4.7 4.5 4.2 3.7 3.7
Profit for the period (4) 2.5 3.1 0.2 2.4 1.9
Gross dividend (5) 3.50 3.50 3.50 2.15 2.15
Net dividend (5) 2.49 2.58 2.63 1.61 1.61
Dividend yield (6) 3.76% 4.11% 6.74% 4.43% 4.71%
(1) Shareholders’ equity / Number of shares at year end.(2) Recurring EBITDA / Number of shares at year end.(3) Recurring EBITDA on a comparable basis / Number of shares at year end.(4) Profit for the period / Number of shares at year end. In case impairment of 2014 is not
taken into account, profit for the period per share is 2.5.
(5) Gross dividend as will be proposed by the Board of Directors to the General Meeting of Shareholders, is 3.50 euro per share of which 1.35 euro per share was paid out as an interim dividend in November 2016. The net dividend is 2.49 euro per share (of which 0.99 euro per share was paid out as interim dividend).
(6) Net dividend / Closing price.
Value determination (in millions of euro) 2016 2015 2014 2013 2012
Book value (1) 116.6 129.2 134.0 173.5 170.0
Market capitalization (2) 881.4 836.0 518.8 484.9 455.6
Enterprise value (EV) (3) 849.3 793.6 469.9 432.2 408.2
(1) Shareholders’ equity(2) Number of shares at 31 December multiplied by the closing price.
(3) Enterprise value is equal to market capitalization plus net debt position less participations (equity method).
Multiples 2016 2015 2014 2013 2012
EV/Recurring EBITDA (1) 13.7 12.8 8.1 8.9 8.4
EV/Recurring EBITDA on a comparable basis (2) 13.7 13.1 8.4 8.9 8.4
Price/Profit (3) 26.4 20.4 213.2 15.4 18.1
Price/Book value (4) 7.6 6.5 3.9 2.8 2.7
105
110
115
120
100
95
90
85
80
900
850
800
750
700
650
600
550
500
450
400
350
300
250
200
150
100
50
0
80
85
90
95
100
105
110
115
120
| 27 |
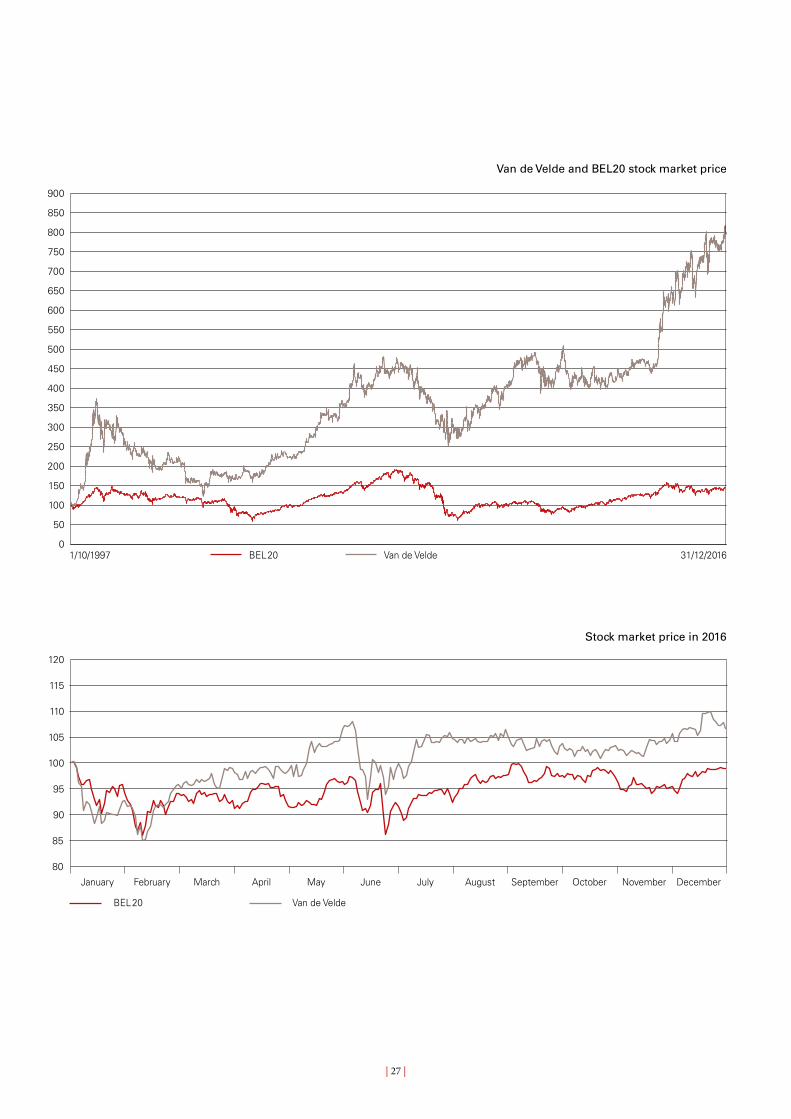
Stock market price in 2016
January February March April May June July August September October November December
Van de VeldeBEL 20
Van de Velde and BEL20 stock market price
1/10/1997 BEL20 Van de Velde 31/12/2016

| 29 |
1 | Het Jaar 2011
Consolidated balance sheet
Consolidated income statement
Consolidated statement of changes in equity
Consolidated cash flow statement
Notes to the financial statements
1. General information
2. Summary of significant accounting policies
3. Goodwill
4. Intangible assets
5. Tangible fixed assets
6. Investments in associates
7. Other fixed assets
8. Grants
9. Inventories
10. Trade and other receivables
11. Other current assets
12. Cash and cash equivalents
13. Share capital
14. Provisions
15. Pensions
16. Other non-current liabilities
17. Deferred taxes
18. Trade and other payables
19. Other current liabilities and taxes payable
20. Financial instruments
21. Financial result
22. Personnel expenses
23. Income taxes
24. Earnings per share
25. Dividends paid and proposed
26. Commitments and contingent liabilities
27. Related party disclosures
28. Segment information
29. Events after balance sheet date
30. Business risks with respect to IFRS 7
5 | Consolidated financial statements and related notes

| 30 |
Consolidated balance sheet
000 euro 2016 2015 (Note)
AssetsTotal fixed assets 71,904 70,836
Goodwill 4,546 4,546 3
Intangible assets 15,137 16,518 4
Tangible fixed assets 37,206 34,204 5
Participations (equity method) 14,188 14,628 6
Deferred tax asset 0 0 17
Other fixed assets 827 940 7
Total current assets 84,812 90,898
Inventories 42,494 39,158 9
Trade and other receivables 17,487 16,733 10
Other current assets 6,293 6,859 11
Cash and cash equivalents 18,538 28,148 12
Total assets 156,716 161,734
Equity and liabilitiesShareholders’ equity 116,620 129,231
Share capital 1,936 1,936 13
Treasury shares 0 0 13
Share premium 743 743 13
Other comprehensive income -8,492 -9,132
Retained earnings 122,433 135,684
Non-controlling interests 609 865 13
Total non-current liabilities 4,845 4,461
Provisions 893 841 14
Pensions 474 30 15
Other non-current liabilities 3,126 3,284 16
Deferred tax liability 352 306 17
Total current liabilities 34,642 27,177
Trade and other payables 16,560 15,822 18
Other current liabilities 1,211 1,632 19
Income taxes payable 16,871 9,723 19
Total equity and liabilities 156,716 161,734
| 31 |
Consolidated income statement
000 euro 2016 2015 (Note)
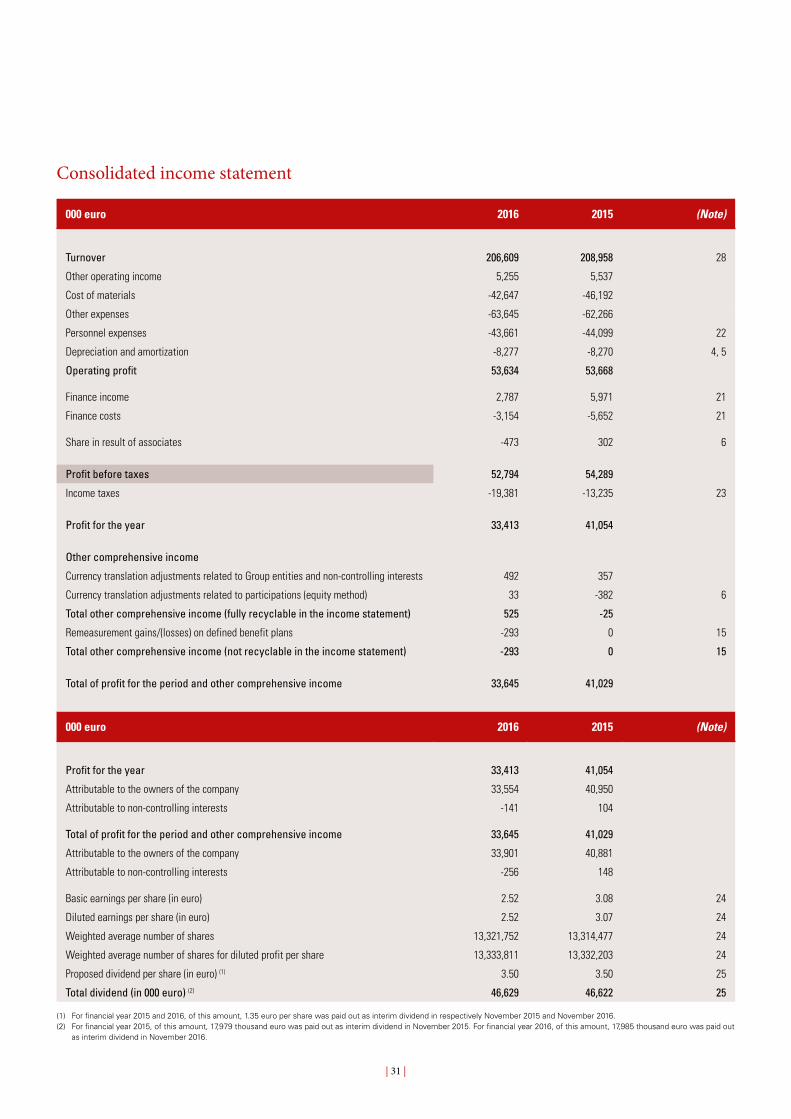
Turnover 206,609 208,958 28
Other operating income 5,255 5,537
Cost of materials -42,647 -46,192
Other expenses -63,645 -62,266
Personnel expenses -43,661 -44,099 22
Depreciation and amortization -8,277 -8,270 4, 5
Operating profit 53,634 53,668
Finance income 2,787 5,971 21
Finance costs -3,154 -5,652 21
Share in result of associates -473 302 6
Profit before taxes 52,794 54,289
Income taxes -19,381 -13,235 23
Profit for the year 33,413 41,054
Other comprehensive income
Currency translation adjustments related to Group entities and non-controlling interests 492 357
Currency translation adjustments related to participations (equity method) 33 -382 6
Total other comprehensive income (fully recyclable in the income statement) 525 -25
Remeasurement gains/(losses) on defined benefit plans -293 0 15
Total other comprehensive income (not recyclable in the income statement) -293 0 15
Total of profit for the period and other comprehensive income 33,645 41,029
000 euro 2016 2015 (Note)
Profit for the year 33,413 41,054
Attributable to the owners of the company 33,554 40,950
Attributable to non-controlling interests -141 104
Total of profit for the period and other comprehensive income 33,645 41,029
Attributable to the owners of the company 33,901 40,881
Attributable to non-controlling interests -256 148
Basic earnings per share (in euro) 2.52 3.08 24
Diluted earnings per share (in euro) 2.52 3.07 24
Weighted average number of shares 13,321,752 13,314,477 24
Weighted average number of shares for diluted profit per share 13,333,811 13,332,203 24
Proposed dividend per share (in euro) (1) 3.50 3.50 25
Total dividend (in 000 euro) (2) 46,629 46,622 25
(1) For financial year 2015 and 2016, of this amount, 1.35 euro per share was paid out as interim dividend in respectively November 2015 and November 2016.(2) For financial year 2015, of this amount, 17,979 thousand euro was paid out as interim dividend in November 2015. For financial year 2016, of this amount, 17,985 thousand euro was paid out
as interim dividend in November 2016.
| 32 |
Consolidated statement of changes in equity
Attributable to the shareholders of the parent
000 euroChange in equity
Share capital
Treasury shares
Share premium
Treasury shares
Retained earnings
Other reserves
Share-based
pay-ments Equity
Non- control-
ling interests
Total equity
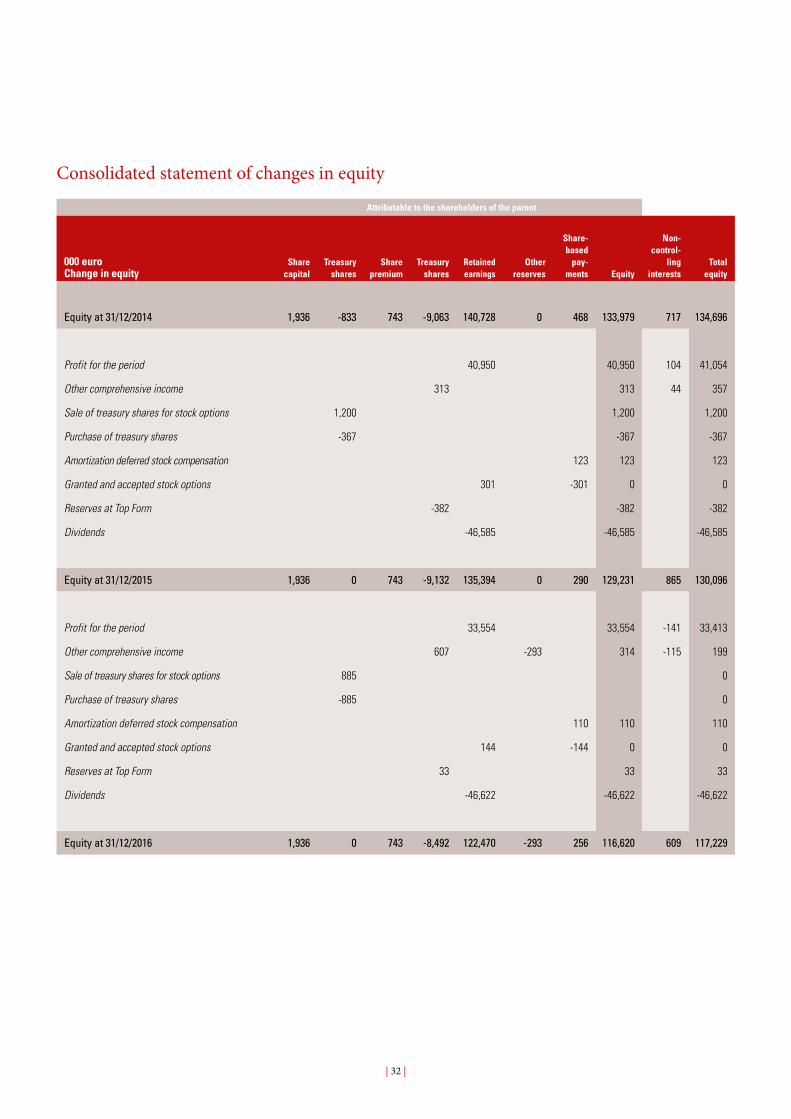
Equity at 31/12/2014 1,936 -833 743 -9,063 140,728 0 468 133,979 717 134,696
Profit for the period 40,950 40,950 104 41,054
Other comprehensive income 313 313 44 357
Sale of treasury shares for stock options 1,200 1,200 1,200
Purchase of treasury shares -367 -367 -367
Amortization deferred stock compensation 123 123 123
Granted and accepted stock options 301 -301 0 0
Reserves at Top Form -382 -382 -382
Dividends -46,585 -46,585 -46,585
Equity at 31/12/2015 1,936 0 743 -9,132 135,394 0 290 129,231 865 130,096
Profit for the period 33,554 33,554 -141 33,413
Other comprehensive income 607 -293 314 -115 199
Sale of treasury shares for stock options 885 0
Purchase of treasury shares -885 0
Amortization deferred stock compensation 110 110 110
Granted and accepted stock options 144 -144 0 0
Reserves at Top Form 33 33 33
Dividends -46,622 -46,622 -46,622
Equity at 31/12/2016 1,936 0 743 -8,492 122,470 -293 256 116,620 609 117,229

| 33 |
Consolidated cash flow statement
000 euro 2016 2015 (Note)
Cash flows from operating activitiesCash receipts from customers 260,668 260,413
Cash paid to suppliers and employees -196,253 -196,211
Cash generated from operations 64,415 64,202
Income taxes paid -11,565 -7,235
Other taxes paid -7,411 -6,379
Interest and bank costs paid -295 -243 21
= Net cash from operating activities 45,144 50,345
Cash flows from investing activitiesInterest received 85 144 21
Received dividends 647 641 21
Purchase of fixed assets -10,726 -10,605 4, 5
Investment / Recovery investment in subsidiary 0 0
Investments in other participating interests 0 0
Sale of treasury shares for stock options 523 1,027 13
Purchase of treasury shares -885 -367 13
= Net cash used in investing activities -10,356 -9,160
Cash flows from financing activitiesDividends paid -46,634 -46,614 25
Repayment of long-term borrowings / increase in financial debt 0 0
Repayment of short-term borrowings / increase in financial debt -215 -753
Net financing of customer growth fund 106 88
= Net cash used in financing activities -46,743 -47,279
Net increase/(decrease) in cash and cash equivalents -11,955 -6,094
Cash and cash equivalents at the beginning of the period 28,148 35,272 12
Exchange rate differences 2,345 -1,030
Net increase/(decrease) in cash and cash equivalents -11,955 -6,094
Cash and cash equivalents at the end of the period 18,538 28,148 12
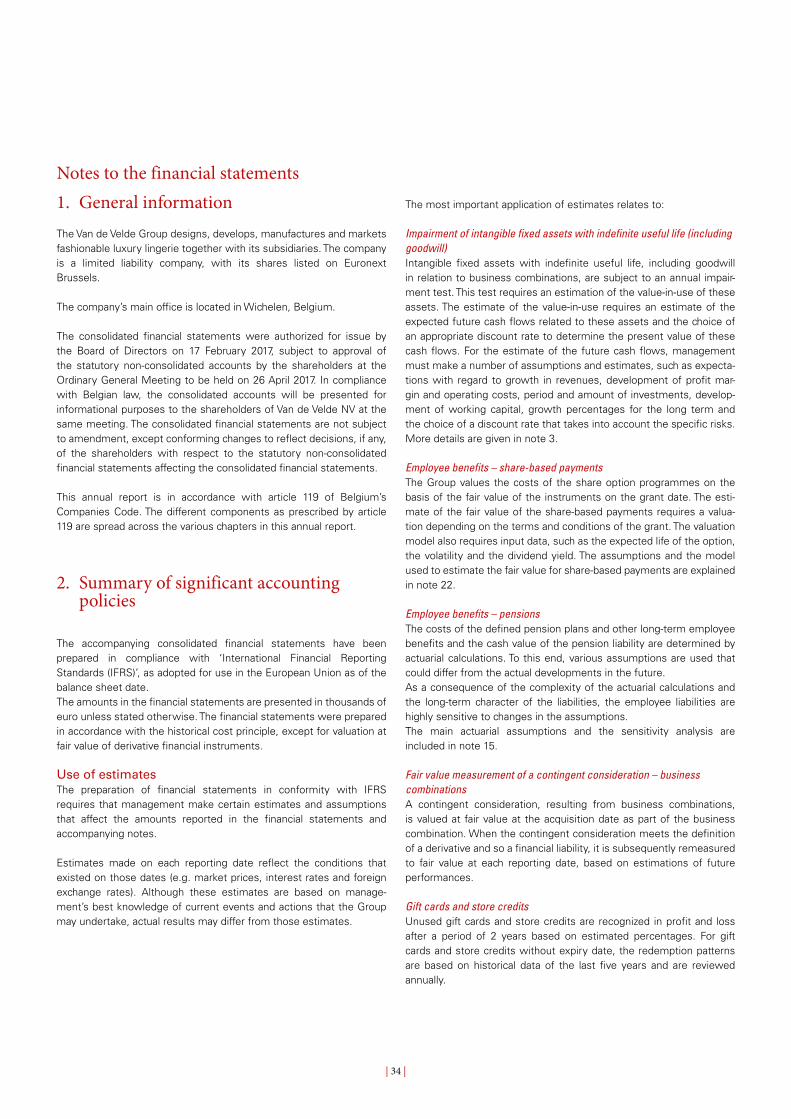
| 34 |
The most important application of estimates relates to:
Impairment of intangible fixed assets with indefinite useful life (including goodwill)Intangible fixed assets with indefinite useful life, including goodwill in relation to business combinations, are subject to an annual impair-ment test. This test requires an estimation of the value-in-use of these assets. The estimate of the value-in-use requires an estimate of the expected future cash flows related to these assets and the choice of an appropriate discount rate to determine the present value of these cash flows. For the estimate of the future cash flows, management must make a number of assumptions and estimates, such as expecta-tions with regard to growth in revenues, development of profit mar-gin and operating costs, period and amount of investments, develop-ment of working capital, growth percentages for the long term and the choice of a discount rate that takes into account the specific risks. More details are given in note 3.
Employee benefits – share-based paymentsThe Group values the costs of the share option programmes on the basis of the fair value of the instruments on the grant date. The esti-mate of the fair value of the share-based payments requires a valua-tion depending on the terms and conditions of the grant. The valuation model also requires input data, such as the expected life of the option, the volatility and the dividend yield. The assumptions and the model used to estimate the fair value for share-based payments are explained in note 22.
Employee benefits – pensionsThe costs of the defined pension plans and other long-term employee benefits and the cash value of the pension liability are determined by actuarial calculations. To this end, various assumptions are used that could differ from the actual developments in the future.As a consequence of the complexity of the actuarial calculations and the long-term character of the liabilities, the employee liabilities are highly sensitive to changes in the assumptions.The main actuarial assumptions and the sensitivity analysis are included in note 15.
Fair value measurement of a contingent consideration – business combinationsA contingent consideration, resulting from business combinations, is valued at fair value at the acquisition date as part of the business combination. When the contingent consideration meets the definition of a derivative and so a financial liability, it is subsequently remeasured to fair value at each reporting date, based on estimations of future performances.
Gift cards and store creditsUnused gift cards and store credits are recognized in profit and loss after a period of 2 years based on estimated percentages. For gift cards and store credits without expiry date, the redemption patterns are based on historical data of the last five years and are reviewed annually.
Notes to the financial statements1. General informationThe Van de Velde Group designs, develops, manufactures and markets fashionable luxury lingerie together with its subsidiaries. The company is a limited liability company, with its shares listed on Euronext Brussels.
The company’s main office is located in Wichelen, Belgium.
The consolidated financial statements were authorized for issue by the Board of Directors on 17 February 2017, subject to approval of the statutory non-consolidated accounts by the shareholders at the Ordinary General Meeting to be held on 26 April 2017. In compliance with Belgian law, the consolidated accounts will be presented for informational purposes to the shareholders of Van de Velde NV at the same meeting. The consolidated financial statements are not subject to amendment, except conforming changes to reflect decisions, if any, of the shareholders with respect to the statutory non-consolidated financial statements affecting the consolidated financial statements.
This annual report is in accordance with article 119 of Belgium’s Companies Code. The different components as prescribed by article 119 are spread across the various chapters in this annual report.
2. Summary of significant accounting policies
The accompanying consolidated financial statements have been prepared in compliance with ‘International Financial Reporting Standards (IFRS)’, as adopted for use in the European Union as of the balance sheet date. The amounts in the financial statements are presented in thousands of euro unless stated otherwise. The financial statements were prepared in accordance with the historical cost principle, except for valuation at fair value of derivative financial instruments.
Use of estimatesThe preparation of financial statements in conformity with IFRS requires that management make certain estimates and assumptions that affect the amounts reported in the financial statements and accompanying notes.
Estimates made on each reporting date reflect the conditions that existed on those dates (e.g. market prices, interest rates and foreign exchange rates). Although these estimates are based on manage-ment’s best knowledge of current events and actions that the Group may undertake, actual results may differ from those estimates.
| 35 |
Business combinationsBusiness combinations are accounted for using the purchase method. The cost of a business combination is valued as the total of the fair value on the date of exchange of assets disposed of, issued equity instruments, and obligations entered into or acquired. Identifiable acquired assets, acquired obligations and contingent obligations that are part of a business combination are initially valued at fair value at the acquisition date, regardless of the existence of any minority share-holding.
Costs directly attributable to the business combination are directly recorded in the income statement.
Non-controlling interestsNon-controlling interests represent the portion of profit or loss and net assets not held by the Group and are presented separately from the parent’s shareholders’ equity in the consolidated income statement and in the consolidated balance sheet.
Foreign currenciesForeign currency transactionsThe reporting currency of the Group is the euro. Foreign currency transactions are recorded at the exchange rate on the transaction date. Monetary assets and liabilities denominated in foreign currencies are converted at the exchange rate on the balance sheet date. Gains and losses resulting from the settlement of foreign currency transactions and from the conversion of monetary assets and liabilities denomi-nated in foreign currencies are recognized in the income statement. Non-monetary assets and liabilities denominated in foreign currencies are converted at the foreign exchange rate on the date of the transac-tion.
Financial statements of foreign activitiesVan de Velde’s foreign operations outside the euro zone are consid-ered to be foreign activities. Accordingly, assets and liabilities are converted to euro at foreign exchange rates on the balance sheet date. Income statements of foreign entities are converted to euro at the average exchange rates of that currency over the past 12 months. The components of shareholders’ equity are converted at historical rates. Exchange differences arising from the conversion of sharehold-ers’ equity to euro at year-end exchange rates are recorded in ‘Other comprehensive income’. On sale or disposal of a foreign operation, the deferred cumulative amount recognized in equity relating to that particular foreign operation is recognized in the income statement.
The Group treats goodwill and intangible assets with an indefinite use-ful life, arising from business combinations, as assets of the parent. Therefore, those assets are already expressed in the functional cur-rency and are treated as non-monetary items.
Intangible assets(1) Research and developmentThe nature of the development costs within the Van de Velde Group is such that they do not meet the criteria set out in IAS 38 for recognition as intangible assets. They are therefore expensed when incurred.
Change in accounting policiesThe accounting policies adopted are consistent with those of the previ-ous fiscal year except for the following new, amended or revised IFRSs and interpretations effective as of 1 January 2016: Amendments to IFRS 10, IFRS 12 and IAS 28 – Investment Entities: Applying the Consolidation Exception, effective 1 January 2016; – Amendments to IFRS 11 Joint Arrangements – Accounting for
Acquisitions of Interests in Joint Operations, effective 1 January 2016;
– Amendments to IAS 1 Presentation of Financial Statements – Disclosure Initiative, effective 1 January 2016;
– Amendments to IAS 16 Property, Plant and Equipment and IAS 38 Intangible Assets – Clarification of Acceptable Methods of Depreciation and Amortization, effective 1 January 2016;
– Amendments to IAS 16 Property, Plant and Equipment and IAS 41 Agriculture – Bearer Plants, effective 1 January 2016;
– Amendments to IAS 27 Separate Financial Statements – Equity Method in Separate Financial Statements, effective 1 January 2016;
– Annual Improvements to IFRSs 2012-2014 Cycle (issued September 2014), effective 1 January 2016.
These changes did not have an impact on the annual consolidated accounts of the Group.
Consolidation principlesSubsidiariesVan de Velde NV has direct or indirect control over an entity if and only if it has all the following: – Power over the investee; – Exposure, or rights, to variable returns from its involvement with
the investee; and – The ability to use its power over the investee to affect the amount
of the investor’s returns.
The financial statements of subsidiaries are included in the consoli-dated financial statements of the Group from the date that control commences until the date that control ceases. They are prepared as of the same reporting date and using the Group accounting policies. Intragroup balances, transactions, income and expenses are elimi-nated in full.
Associated companiesAssociated companies are companies in which Van de Velde NV directly or indirectly has a significant influence. This is assumed to be the case when the Group holds at least 20% of the voting rights attached to the shares. The financial statements of these companies are prepared in accordance with the same accounting policies used for the Group. The consolidated financial statements contain the share of the Group in the result of associated companies in accordance with the equity method from the day that the significant influence is acquired until the day it ends. If the share of the Group in the losses of the associated companies is greater than the carrying amount of the participation, the carrying amount is set at zero and additional losses are recognized only insofar as the Group has assumed additional obligations.
Participations in associated companies are revalued if there are indica-tions of possible impairment or of the disappearance of the reasons for earlier impairments. The participations valued in the balance sheet in accordance with the equity method also include the carrying amount of related goodwill.
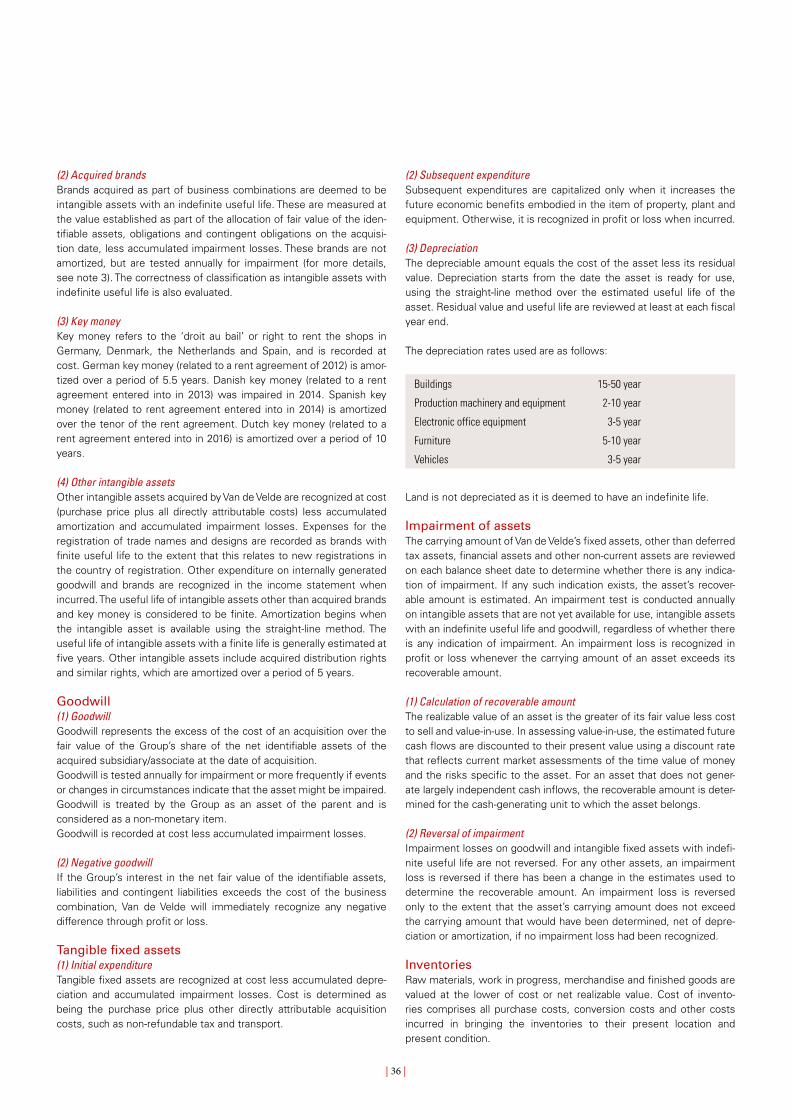
| 36 |
(2) Subsequent expenditureSubsequent expenditures are capitalized only when it increases the future economic benefits embodied in the item of property, plant and equipment. Otherwise, it is recognized in profit or loss when incurred.
(3) DepreciationThe depreciable amount equals the cost of the asset less its residual value. Depreciation starts from the date the asset is ready for use, using the straight-line method over the estimated useful life of the asset. Residual value and useful life are reviewed at least at each fiscal year end.
The depreciation rates used are as follows:
Buildings 15-50 year
Production machinery and equipment 2-10 year
Electronic office equipment 3-5 year
Furniture 5-10 year
Vehicles 3-5 year
Land is not depreciated as it is deemed to have an indefinite life.
Impairment of assetsThe carrying amount of Van de Velde’s fixed assets, other than deferred tax assets, financial assets and other non-current assets are reviewed on each balance sheet date to determine whether there is any indica-tion of impairment. If any such indication exists, the asset’s recover-able amount is estimated. An impairment test is conducted annually on intangible assets that are not yet available for use, intangible assets with an indefinite useful life and goodwill, regardless of whether there is any indication of impairment. An impairment loss is recognized in profit or loss whenever the carrying amount of an asset exceeds its recoverable amount.
(1) Calculation of recoverable amountThe realizable value of an asset is the greater of its fair value less cost to sell and value-in-use. In assessing value-in-use, the estimated future cash flows are discounted to their present value using a discount rate that reflects current market assessments of the time value of money and the risks specific to the asset. For an asset that does not gener-ate largely independent cash inflows, the recoverable amount is deter-mined for the cash-generating unit to which the asset belongs.
(2) Reversal of impairmentImpairment losses on goodwill and intangible fixed assets with indefi-nite useful life are not reversed. For any other assets, an impairment loss is reversed if there has been a change in the estimates used to determine the recoverable amount. An impairment loss is reversed only to the extent that the asset’s carrying amount does not exceed the carrying amount that would have been determined, net of depre-ciation or amortization, if no impairment loss had been recognized.
InventoriesRaw materials, work in progress, merchandise and finished goods are valued at the lower of cost or net realizable value. Cost of invento-ries comprises all purchase costs, conversion costs and other costs incurred in bringing the inventories to their present location and present condition.
(2) Acquired brandsBrands acquired as part of business combinations are deemed to be intangible assets with an indefinite useful life. These are measured at the value established as part of the allocation of fair value of the iden-tifiable assets, obligations and contingent obligations on the acquisi-tion date, less accumulated impairment losses. These brands are not amortized, but are tested annually for impairment (for more details, see note 3). The correctness of classification as intangible assets with indefinite useful life is also evaluated.
(3) Key moneyKey money refers to the ‘droit au bail’ or right to rent the shops in Germany, Denmark, the Netherlands and Spain, and is recorded at cost. German key money (related to a rent agreement of 2012) is amor-tized over a period of 5.5 years. Danish key money (related to a rent agreement entered into in 2013) was impaired in 2014. Spanish key money (related to rent agreement entered into in 2014) is amortized over the tenor of the rent agreement. Dutch key money (related to a rent agreement entered into in 2016) is amortized over a period of 10 years.
(4) Other intangible assetsOther intangible assets acquired by Van de Velde are recognized at cost (purchase price plus all directly attributable costs) less accumulated amortization and accumulated impairment losses. Expenses for the registration of trade names and designs are recorded as brands with finite useful life to the extent that this relates to new registrations in the country of registration. Other expenditure on internally generated goodwill and brands are recognized in the income statement when incurred. The useful life of intangible assets other than acquired brands and key money is considered to be finite. Amortization begins when the intangible asset is available using the straight-line method. The useful life of intangible assets with a finite life is generally estimated at five years. Other intangible assets include acquired distribution rights and similar rights, which are amortized over a period of 5 years.
Goodwill(1) GoodwillGoodwill represents the excess of the cost of an acquisition over the fair value of the Group’s share of the net identifiable assets of the acquired subsidiary/associate at the date of acquisition.Goodwill is tested annually for impairment or more frequently if events or changes in circumstances indicate that the asset might be impaired. Goodwill is treated by the Group as an asset of the parent and is considered as a non-monetary item. Goodwill is recorded at cost less accumulated impairment losses.
(2) Negative goodwillIf the Group’s interest in the net fair value of the identifiable assets, liabilities and contingent liabilities exceeds the cost of the business combination, Van de Velde will immediately recognize any negative difference through profit or loss.
Tangible fixed assets(1) Initial expenditureTangible fixed assets are recognized at cost less accumulated depre-ciation and accumulated impairment losses. Cost is determined as being the purchase price plus other directly attributable acquisition costs, such as non-refundable tax and transport.
| 37 |
Cash and cash equivalentsCash and cash equivalents comprise cash at bank and in hand and short-term deposits. Interest income is recognized based on the effec-tive interest rate of the asset.
Share capital(1) Change in capitalWhen there is an increase or decrease in Van de Velde’s share capital, all directly attributable costs relating to that event are deducted from equity and not recognized in profit or loss when incurred.
(2) DividendsDividends are recognized as a liability in the period in which they are declared.
ProvisionsProvisions are recognized when Van de Velde has a present legal or constructive obligation as a result of past events, it is probable that an outflow will be required to settle the obligation and a reliable estimate of the amount of the obligation can be made. If the effect is mate-rial, provisions are determined by discounting the expected future cash flows at a rate that reflects current market assessments of the time value of money and, where appropriate, the risks specific to the liability.
Employee benefits(1) Pension planVan de Velde has group insurance plans for its Belgian employees and group insurance plans for its employees elsewhere. Under IAS 19 all pension plans are recognized as defined contribution plans or defined pension plans. A defined contribution plan is a pension plan in which a company pays fixed contributions to a separate company and has no legal or actual obligation to pay further contributions if the pension fund has inadequate assets to pay the benefits related to the years of service in the current or previous periods to all employees. A defined pension plan is a pension plan that is not a defined contribution plan.
The pension plans in foreign countries are defined contribution plans. The costs connected with these are recognized through profit and loss when incurred.
The Belgian pension plans were previously recognized as defined contribution plans. However, this classification has been changed in response to a clarification of the Belgian law of 18 December 2015, which means that the Belgian pension plans will be recognized as defined pension plans from now on. The first actuarial calculation was made on 30 June 2016 and an update calculation was made as of 31 December 2016 in accordance with the principles of IAS 19 set out below. The company recognized the obligation ensuing from the first valuation against other comprehensive income, given that this is deemed to be a change in assumptions.
Purchasing costs include: – Purchase price, plus – Import duties and other taxes (if not recoverable), plus – Transport, handling and other costs directly attributable to the
acquisition of the goods, less – Trade discounts, rebates and other similar items.
Conversion costs include: – Costs directly related to the units of production, plus – A systematic allocation of fixed and variable indirect production
costs.
The provision for obsolescence is calculated consistently throughout the Group based on the age and expected future sales of the items at hand.
Trade and other receivablesTrade receivables are recognized at cost less impairment losses. If there is objective evidence that an impairment loss has been incurred on trade receivables, the impairment loss recognized is the differ-ence between the carrying amount and the present value of esti-mated future cash flows. An assessment of impairment is made for all accounts receivable individually. If no objective evidence of impair-ment for individual receivables exists, a collective assessment for impairment is performed.
LeasingLeases through which the Group acquires the right to use assets and the lessor substantially retains all the risks and the benefits of owner-ship of the asset are classified as operating leases. Operating lease payments (as contractually defined) are recognized as an expense in the income statement on a straight-line basis over the lease term (including the construction period). The difference between the actual cash payment to the lessor and the expense recognized in the income statement is recorded on the balance sheet as a debt. Lease incentives received as part of the lease contract are recognized over the lease term in accordance with the principles of SIC 15 and are deducted from the recorded rent expense.
Derivative financial instrumentsHedgesVan de Velde applies derivative financial instruments only in order to reduce the exposure to foreign currency risk. These financial instru-ments are entered into in accordance with the aims and principles laid down by general management, which prohibits the use of such finan-cial instruments for speculation purposes.
Derivative financial instruments are initially measured at fair value. Although they provide effective economic hedges, they do not qual-ify for hedge accounting under the specific requirements in IAS 39 (Financial Instruments: Recognition and Measurement). As a result, at reporting date all derivatives are measured at fair value with changes in fair value recognized immediately in the income statement. The fair value of derivatives is calculated by discounting the expected future cash flows at the prevailing interest rates. All spot purchases and sales of financial assets are recognized on the settlement date.
| 38 |
Deferred income tax assets and liabilities are measured at the tax rates that are expected to apply in the year in which the asset is realized or the liability is settled, based on tax rates (and tax laws) that have been implemented or substantively implemented at the balance sheet date.
Deferred tax assets and deferred tax liabilities are offset when a legally enforceable right exists to set off current tax assets against current tax liabilities and the deferred taxes relate to the same taxable entity and the same taxation authority.
Trade and other payablesTrade and other payables are stated at cost. Trade payables are non-interest bearing and are normally settled on 30-day terms. Other paya-bles are non-interest bearing and have an average term of six months.
Revenue(1) Goods soldIn relation to the sale of goods, revenue is recognized when goods have been invoiced and shipped to the buyer. The possible return of goods or non-settlement of invoices is currently not taken into account. Cash discounts granted are recorded in the income statement upon collection of the outstanding balance. These discounts are recorded as a deduction of revenue.
Sales of products to the customers of the Group’s retail network are recognized at the point of sale when the transaction is entered into the cash register. Sales are recorded net of sales taxes, value-added taxes, discounts and incentives.
(2) Gift cards and store creditsThe Group’s retail network sells gift cards and issues credits to its cus-tomers when merchandise is returned. The cards and credits do either not expire or have an expiry date in 24 months. The Group recognizes sales from gift cards when they are redeemed by the customer and when the likelihood of the gift cards and credits being redeemed by the customer is remote (breakage). The company determines break-age income on unused gift cards and store credits based on the his-torical redemption pattern. Management has determined that redemp-tion would be remote after a period of two years. Breakage income is recognized as part of turnover.
(3) Financial incomeFinancial income comprises dividend income and interest income. Royalties arising from the use by others of the company’s resources are recognized when it is probable that the economic benefits associ-ated with the transaction will flow to the company and the revenue can be measured reliably. Dividend income is recognized in the income statement on the date that the dividend is declared. Interest income is recognized based on the effective interest rate of the asset.
(4) Government grantsA government grant is recognized when there is reasonable assur-ance that it will be received and that the company will comply with the attached conditions. Grants that compensate the company for expenses incurred are recognized as revenue in the income statement on a systematic basis in the same periods in which the expenses are incurred. Grants that compensate the company for the cost of an asset are recognized as income over the life of a depreciable asset by means of a reduced depreciation charge.
A liability was recognized in the balance sheet with regard to the Belgian pension schemes equal to the sum of the cash value of the gross liabilities on account of defined pension entitlements (includ-ing the tax due on contributions relating to pension costs) as at the balance sheet date, less the market value of the fund investments. An independent actuary made an actuarial calculation of this gross liabil-ity for the first time on 30 June 2016 using the projected unit credit method. This type of valuation will be repeated on an annual basis in the future.
The interest expense is calculated by applying a discount rate to the asset or the liability of the defined pension entitlements. This inter-est expense is recognized through profit and loss. In establishing an appropriate discount rate, the company bases itself on the interest rates applicable to corporate bonds in cash, which correspond to the currency in which the liability is expected to be paid in accordance with the expected duration of the defined pension liability.
Revaluations, including actuarial gains and losses and the return on fund investments (excluding net interest expense), are recognized in other comprehensive income when they occur. Revaluations must not be reclassified to profit and loss in later periods.
Past service pension cost is recognized through profit and loss when the plan is changed or when the related restructuring or termination benefits become payable by the company, whichever occurs first.
(2) Share-based paymentsThe fair value of the share options awarded under the Group’s share option plan is established on the grant date, with due consideration for the terms and conditions under which the options are granted and using a valuation technique corresponding to generally accepted valu-ation methods for establishing the price of financial instruments and with due consideration for all relevant factors and assumptions. The fair value of the share options is recognized as personnel expenses for the period until the beneficiary acquires the option unconditionally (i.e. vesting date).
Income taxIncome tax on the profit or loss for the year comprises current and deferred tax. Income tax is recognized in the income statement except insofar as it relates to items included in other comprehensive income or shareholders’ equity. In that case, income tax is included in other comprehensive income or shareholders’ equity.
Current tax is the expected tax payable on the taxable income for the year, using applicable tax rates on the balance sheet date, and any adjustments to tax payables with respect to previous years.
For financial reporting purposes, deferred income tax is calculated using the liability method based on temporary differences at the balance sheet date between the tax bases of assets and liabilities and their carrying amounts.
Deferred income tax assets are recognized only insofar as it is prob-able that taxable profit will be available against which the deductible temporary differences, the carryforward of unused tax credits and unused tax losses can be utilized.

| 39 |
The Group is currently assessing the impact of these changes.
With regard to IFRS 15, the Group intends to introduce the new stand-ard on the required commencement date, applying the fully retrospec-tive method. In 2016 the Group conducted a provisional analysis of IFRS 15. Changes may be made to this as a consequence of a more detailed continuous analysis. The provisional expectation is that this has no material impact on the result of the Group.
IFRS 16 also requires lessees and lessors to provide more extensive information than under IAS 17. The new standard applies to fiscal years commencing on or after 1 January 2019. Premature application is permitted, but not before an entity applies IFRS 15 Revenues from Contracts with Customers. A lessee may choose between full retro-spective application or an adapted retrospective application. Certain exemptions are permitted, based on the transitional stipulations of the standard. In 2017 the Group intends to assess the possible effect of IFRS 16 on its consolidated financial statements.
The impact of IFRS 9 will be analyzed in the course of 2017.
Expenses(1) Interest expensesAll interest and other costs incurred in connection with borrowings and finance lease liabilities are recognized in the income statement using the effective interest rate method.
(2) Research and development, advertising and promotional costs, and system development costsResearch, advertising and promotional costs are expensed in the year in which these costs are incurred. Development costs and system development costs are expensed in the year in which these costs are incurred if they do not meet the criteria for capitalization. If the devel-opment expenditure meets the criteria, it will be capitalized.
New and amended standards and interpretations, ef-fective for fiscal years starting after 1 January 2016
The Group has not early-adopted any standards or interpretations issued but not yet effective as at 31 December 2016.
Standards and interpretations issued but not yet effective up to the date of issuance of the Group’s financial statements are listed below: – Amendments to IFRS 2 Share-based Payment - Classification and
Measurement of Share-based Payment Transactions, effective 1 January 2018;
– Amendments to IFRS 4 Insurance Contracts – Applying IFRS 9 Financial instruments with IFRS 4, effective 1 January 2018;
– IFRS 9 Financial Instruments, effective 1 January 2018; – IFRS 15 Revenue from Contracts with Customers, including amend-
ments to IFRS 15: Effective date of IFRS 15 and Clarifications to IFRS 15 Revenue from Contracts with Customers, effective 1 January 2018;
– IFRS 16 Leases, effective 1 January 2019; – Amendments to IAS 7 Statement of Cash Flows – Disclosure
Initiative, effective 1 January 2017; – Amendments to IAS 12 Income Taxes – Recognition of Deferred Tax
Assets for Unrealized Losses, effective 1 January 2017; – Amendments to IAS 40 Investment Property – Transfers of
Investment Property, effective 1 January 2018; – IFRIC 22 Foreign Currency Transactions and Advance Consideration,
effective 1 January 2018; – Annual Improvements to IFRSs 2014-2016 Cycle (issued December
2016)3, effective 1 January 2017 and 1 January 2018.
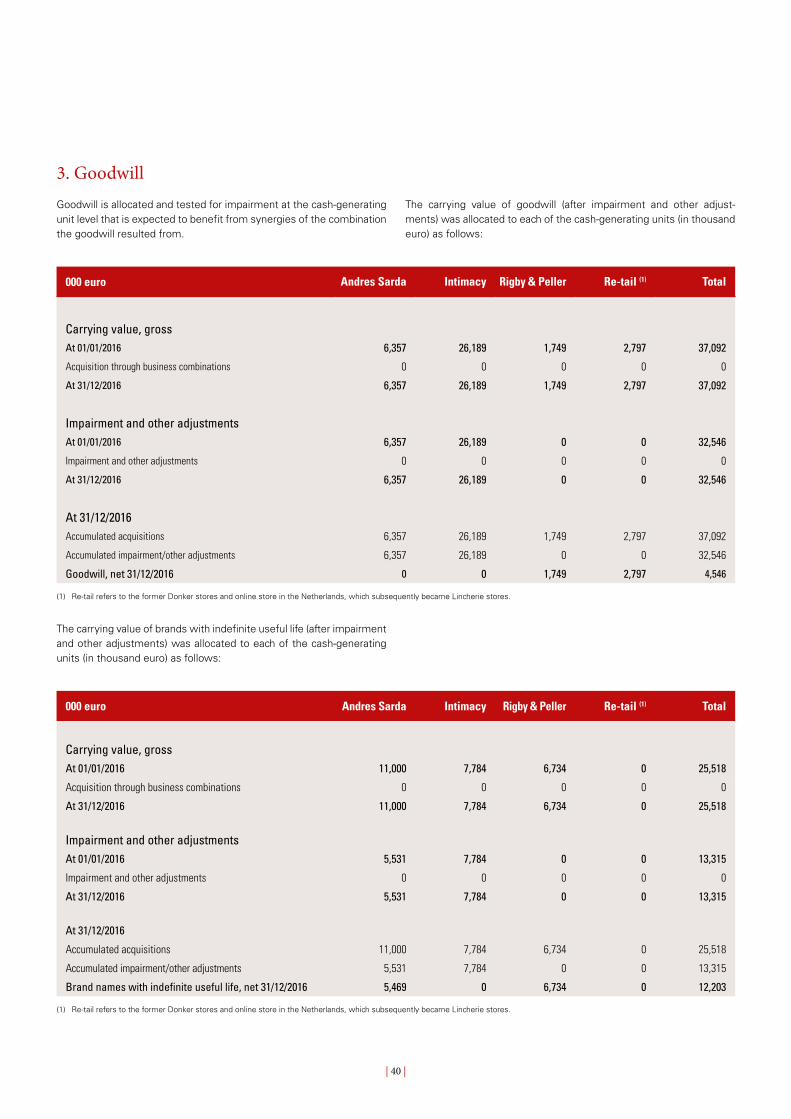
| 40 |
3. GoodwillGoodwill is allocated and tested for impairment at the cash-generating unit level that is expected to benefit from synergies of the combination the goodwill resulted from.
The carrying value of goodwill (after impairment and other adjust-ments) was allocated to each of the cash-generating units (in thousand euro) as follows:
000 euro Andres Sarda Intimacy Rigby & Peller Re-tail (1) Total
Carrying value, grossAt 01/01/2016 6,357 26,189 1,749 2,797 37,092
Acquisition through business combinations 0 0 0 0 0
At 31/12/2016 6,357 26,189 1,749 2,797 37,092
Impairment and other adjustmentsAt 01/01/2016 6,357 26,189 0 0 32,546
Impairment and other adjustments 0 0 0 0 0
At 31/12/2016 6,357 26,189 0 0 32,546
At 31/12/2016Accumulated acquisitions 6,357 26,189 1,749 2,797 37,092
Accumulated impairment/other adjustments 6,357 26,189 0 0 32,546
Goodwill, net 31/12/2016 0 0 1,749 2,797 4,546
(1) Re-tail refers to the former Donker stores and online store in the Netherlands, which subsequently became Lincherie stores.
The carrying value of brands with indefinite useful life (after impairment and other adjustments) was allocated to each of the cash- generating units (in thousand euro) as follows:
000 euro Andres Sarda Intimacy Rigby & Peller Re-tail (1) Total
Carrying value, grossAt 01/01/2016 11,000 7,784 6,734 0 25,518
Acquisition through business combinations 0 0 0 0 0
At 31/12/2016 11,000 7,784 6,734 0 25,518
Impairment and other adjustmentsAt 01/01/2016 5,531 7,784 0 0 13,315
Impairment and other adjustments 0 0 0 0 0
At 31/12/2016 5,531 7,784 0 0 13,315
At 31/12/2016
Accumulated acquisitions 11,000 7,784 6,734 0 25,518
Accumulated impairment/other adjustments 5,531 7,784 0 0 13,315
Brand names with indefinite useful life, net 31/12/2016 5,469 0 6,734 0 12,203
(1) Re-tail refers to the former Donker stores and online store in the Netherlands, which subsequently became Lincherie stores.
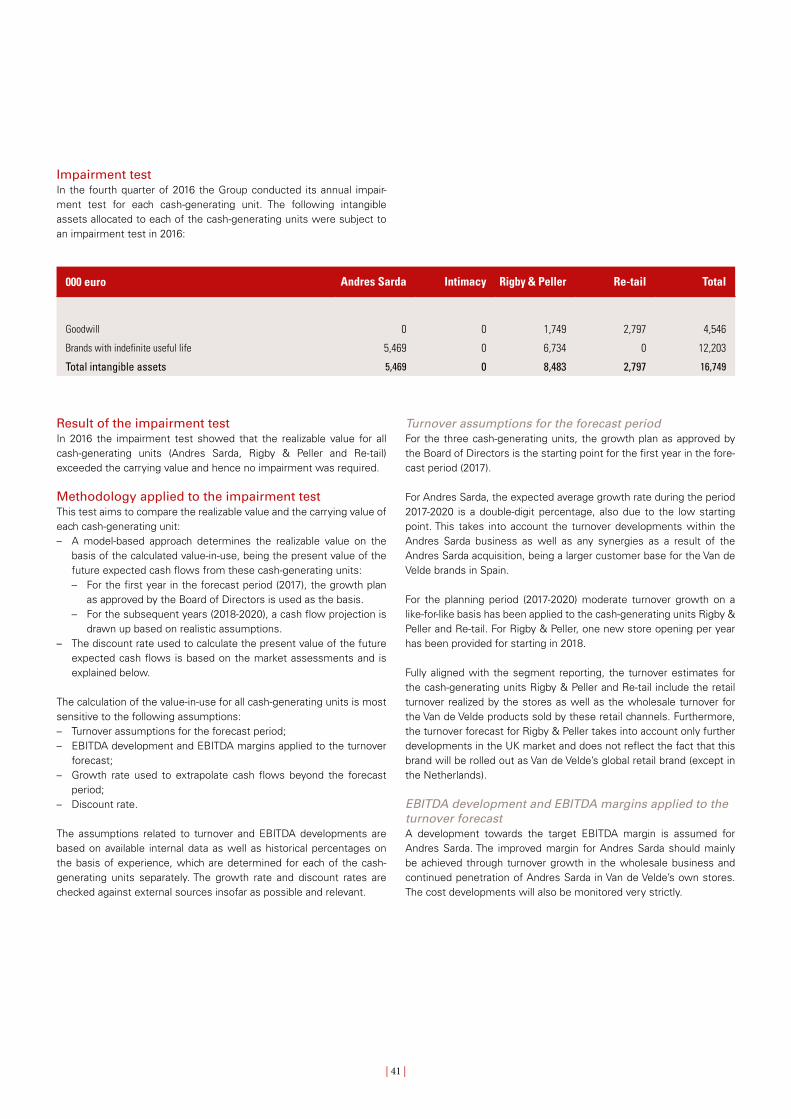
| 41 |
000 euro Andres Sarda Intimacy Rigby & Peller Re-tail Total
Goodwill 0 0 1,749 2,797 4,546
Brands with indefinite useful life 5,469 0 6,734 0 12,203
Total intangible assets 5,469 0 8,483 2,797 16,749
Result of the impairment testIn 2016 the impairment test showed that the realizable value for all cash-generating units (Andres Sarda, Rigby & Peller and Re-tail) exceeded the carrying value and hence no impairment was required.
Methodology applied to the impairment testThis test aims to compare the realizable value and the carrying value of each cash-generating unit:– A model-based approach determines the realizable value on the
basis of the calculated value-in-use, being the present value of the future expected cash flows from these cash-generating units: – For the first year in the forecast period (2017), the growth plan
as approved by the Board of Directors is used as the basis. – For the subsequent years (2018-2020), a cash flow projection is
drawn up based on realistic assumptions.– The discount rate used to calculate the present value of the future
expected cash flows is based on the market assessments and is explained below.
The calculation of the value-in-use for all cash-generating units is most sensitive to the following assumptions: – Turnover assumptions for the forecast period; – EBITDA development and EBITDA margins applied to the turnover
forecast; – Growth rate used to extrapolate cash flows beyond the forecast
period; – Discount rate.
The assumptions related to turnover and EBITDA developments are based on available internal data as well as historical percentages on the basis of experience, which are determined for each of the cash-generating units separately. The growth rate and discount rates are checked against external sources insofar as possible and relevant.
Impairment testIn the fourth quarter of 2016 the Group conducted its annual impair-ment test for each cash-generating unit. The following intangible assets allocated to each of the cash-generating units were subject to an impairment test in 2016:
Turnover assumptions for the forecast periodFor the three cash-generating units, the growth plan as approved by the Board of Directors is the starting point for the first year in the fore-cast period (2017).
For Andres Sarda, the expected average growth rate during the period 2017-2020 is a double-digit percentage, also due to the low starting point. This takes into account the turnover developments within the Andres Sarda business as well as any synergies as a result of the Andres Sarda acquisition, being a larger customer base for the Van de Velde brands in Spain.
For the planning period (2017-2020) moderate turnover growth on a like-for-like basis has been applied to the cash-generating units Rigby & Peller and Re-tail. For Rigby & Peller, one new store opening per year has been provided for starting in 2018.
Fully aligned with the segment reporting, the turnover estimates for the cash-generating units Rigby & Peller and Re-tail include the retail turnover realized by the stores as well as the wholesale turnover for the Van de Velde products sold by these retail channels. Furthermore, the turnover forecast for Rigby & Peller takes into account only further developments in the UK market and does not reflect the fact that this brand will be rolled out as Van de Velde’s global retail brand (except in the Netherlands).
EBITDA development and EBITDA margins applied to the turnover forecastA development towards the target EBITDA margin is assumed for Andres Sarda. The improved margin for Andres Sarda should mainly be achieved through turnover growth in the wholesale business and continued penetration of Andres Sarda in Van de Velde’s own stores. The cost developments will also be monitored very strictly.
| 42 |
For the cash-generating units Rigby & Peller and Re-tail, a gradual increase in the EBITDA margin is assumed towards the target EBITDA margin for a (partially) integrated retail chain. The target EBITDA margin is achieved through high gross margins, limited cost increases and the envisioned market share of the Van de Velde products.
Growth rate used to extrapolate cash flows beyond the forecast period The long-term percentage applied to extrapolate cash flows beyond the forecast period is assessed in line with the expected long-term inflation for all cash-generating units (1%).
Discount rate The discount rates represent the current market assessment of the risks specific to the Van de Velde Group on the one hand and the cash-generating units on the other. The discount rates are estimated on the basis of the weighted average cost of capital after tax and are for the three cash-generating units in a range between 7.4% and 8.2%. This corresponds to a cost of capital before tax of between 9.5% and 10.5%.
Sensitivity to changes in assumptionsWith regard to the assessment of value-in-use of the Andres Sarda, Rigby & Peller and Re-tail units, management believes that on the basis of the performed sensitivity analysis no reasonably possible change in any of the above key assumptions would cause the carrying value of the unit to materially exceed its recoverable amount. This is also reflected in the reasonable headroom1 in the three cash- generating units. The tested sensitivities related to: – the possibility of lower than forecast turnover growth during the
forecast period (2017-2020); – the possibility of lower than forecast EBITDA margin on sales; – a decrease in the growth rate used to extrapolate cash flows
beyond the forecast period; – an increase in the weighted average cost of capital.
1 Headroom refers to the difference between the calculated realizable value and the carrying value for a specific cash-generating unit.

| 43 |
4. Intangible assets
000 euro Total
Brands with finite useful life
Brands with
indefinite useful life
Distribution rights and
similar rights Software
Key money
Intangible assets, grossAt 01/01/2015 40,168 1,837 27,193 3,734 7,164 240
Investments 772 190 0 0 582 0
Disposals 0 0 0 0 0 0
Other adjustments 0 1,675 -1,675 0 0 0
Exchange adjustments 30 30 0 0 0 0
At 31/12/2015 40,970 3,732 25,518 3,734 7,746 240
Amortization and impairmentAt 01/01/2015 22,061 1,260 13,315 2,193 5,199 94
Amortization 2,391 832 0 747 784 28
Impairment 0 0 0 0 0 0
Disposals 0 0 0 0 0 0
Exchange adjustments 0 0 0 0 0 0
At 31/12/2015 24,452 2,092 13,315 2,940 5,983 122
Intangible assets, net 31/12/2015 16,518 1,640 12,203 794 1,763 118
Intangible assets, grossAt 01/01/2016 40,970 3,732 25,518 3,734 7,746 240
Investments 738 100 0 0 561 77
Disposals 0 0 0 0 0 0
Other adjustments 0 0 0 0 0 0
Exchange adjustments -24 -24 0 0 0 0
At 31/12/2016 41,684 3,808 25,518 3,734 8,307 317
Amortization and impairmentAt 01/01/2016 24,452 2,092 13,315 2,940 5,983 122
Amortization 2,095 802 0 507 752 34
Impairment 0 0 0 0 0 0
Disposals 0 0 0 0 0 0
Exchange adjustments 0 0 0 0 0 0
At 31/12/2016 26,547 2,894 13,315 3,447 6,735 156
Intangible assets, net 31/12/2016 15,137 914 12,203 287 1,572 161
| 44 |
The expenses of brands with a finite useful life relates among other things to registration costs of developed in-house brands.
Brands with indefinite useful life are: – The Andres Sarda brand acquired in 2008. In 2012, an impairment
charge of 5,531 thousand euro was recognized on this brand. – The Intimacy brand and concept acquired in 2010 (7,784 thousand
euro) is fully written off in 2014. – The Rigby & Peller brand and concept acquired in 2011, the fair
value of which was determined as part of a business combination.
These brands are deemed to be brands with an indefinite useful life because the Group considers them to be full-fledged additions to its existing brand portfolio.
Distribution rights and similar rights refer to the distribution agreement and the intangible assets that the Group acquired at the start of the Private Shop joint venture with Getz Bros. (Hong Kong) Limited (‘Getz’) in 2012. The investment for the acquisition of the distribution agree-
ment and the intangible assets is estimated at 5,000 thousand US dollar, 3,000 thousand US dollar of which was settled. The remaining amount of 2,000 thousand US dollar has been recognized as a liability payable to Getz and will be settled dependent on certain milestone criteria being fulfilled. The amortization period is 5 years.
The investment in software in 2016 relates among other things to implementation of software for among other things eCommerce, exchange of information and online collaboration, integration of appli-cations, renewal of shop management system and miscellaneous improvements to ERP software.
Key money relates to stores in Germany, Denmark, Spain and the Netherlands.
Expenditure on research activities undertaken to acquire new scientific or technical knowledge and understanding, is recognized as expense when incurred.
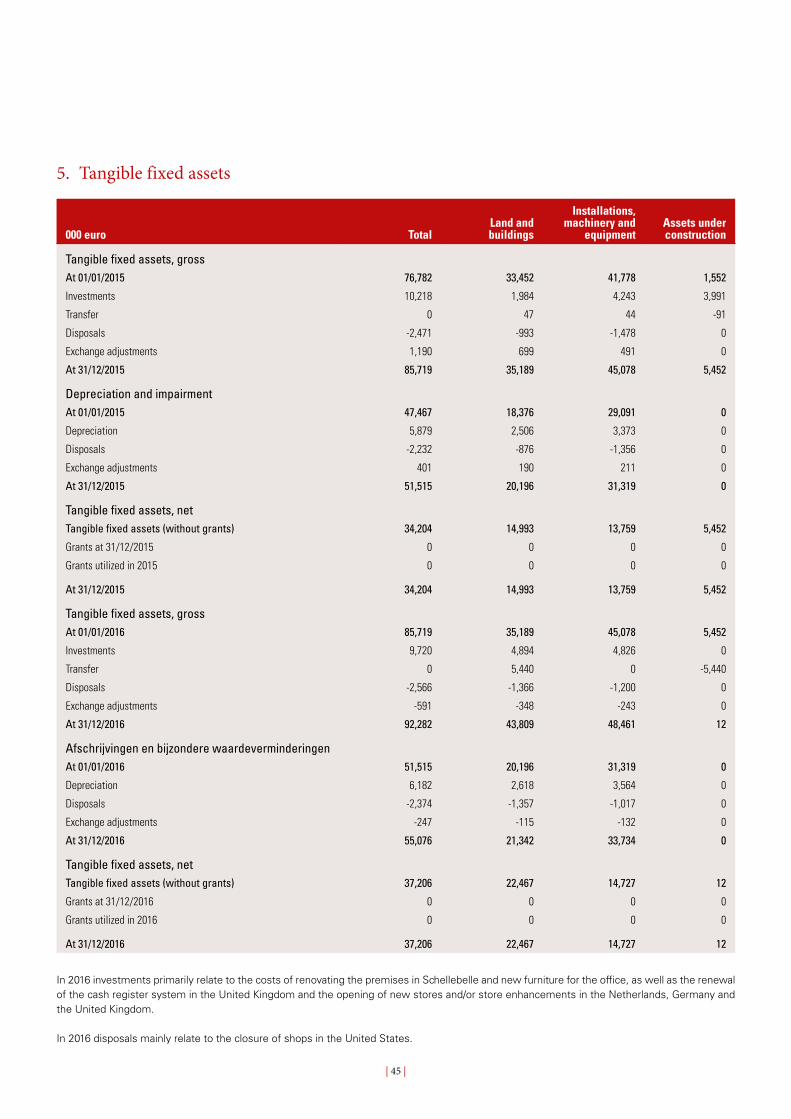
| 45 |
5. Tangible fixed assets
000 euro TotalLand and buildings
Installations, machinery and
equipmentAssets under construction
Tangible fixed assets, grossAt 01/01/2015 76,782 33,452 41,778 1,552
Investments 10,218 1,984 4,243 3,991
Transfer 0 47 44 -91
Disposals -2,471 -993 -1,478 0
Exchange adjustments 1,190 699 491 0
At 31/12/2015 85,719 35,189 45,078 5,452
Depreciation and impairmentAt 01/01/2015 47,467 18,376 29,091 0
Depreciation 5,879 2,506 3,373 0
Disposals -2,232 -876 -1,356 0
Exchange adjustments 401 190 211 0
At 31/12/2015 51,515 20,196 31,319 0
Tangible fixed assets, netTangible fixed assets (without grants) 34,204 14,993 13,759 5,452
Grants at 31/12/2015 0 0 0 0
Grants utilized in 2015 0 0 0 0
At 31/12/2015 34,204 14,993 13,759 5,452
Tangible fixed assets, grossAt 01/01/2016 85,719 35,189 45,078 5,452
Investments 9,720 4,894 4,826 0
Transfer 0 5,440 0 -5,440
Disposals -2,566 -1,366 -1,200 0
Exchange adjustments -591 -348 -243 0
At 31/12/2016 92,282 43,809 48,461 12
Afschrijvingen en bijzondere waardeverminderingenAt 01/01/2016 51,515 20,196 31,319 0
Depreciation 6,182 2,618 3,564 0
Disposals -2,374 -1,357 -1,017 0
Exchange adjustments -247 -115 -132 0
At 31/12/2016 55,076 21,342 33,734 0
Tangible fixed assets, netTangible fixed assets (without grants) 37,206 22,467 14,727 12
Grants at 31/12/2016 0 0 0 0
Grants utilized in 2016 0 0 0 0
At 31/12/2016 37,206 22,467 14,727 12
In 2016 investments primarily relate to the costs of renovating the premises in Schellebelle and new furniture for the office, as well as the renewal of the cash register system in the United Kingdom and the opening of new stores and/or store enhancements in the Netherlands, Germany and the United Kingdom.
In 2016 disposals mainly relate to the closure of shops in the United States.
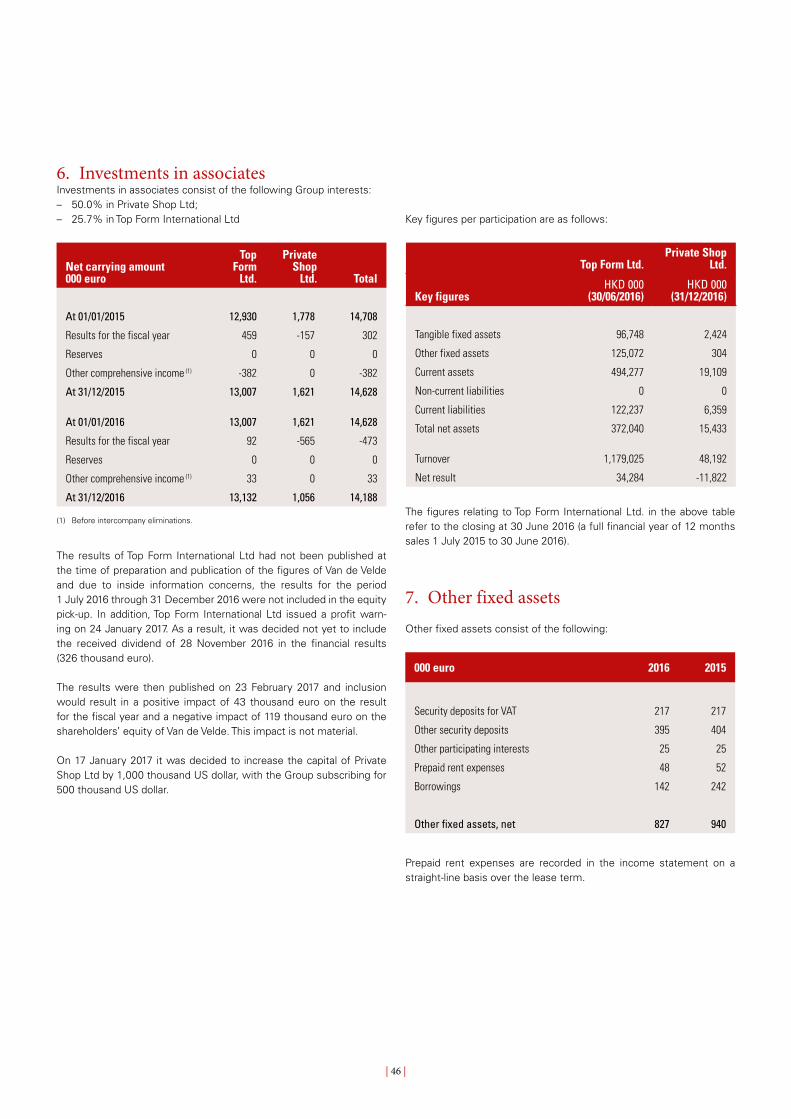
| 46 |
6. Investments in associatesInvestments in associates consist of the following Group interests: – 50.0% in Private Shop Ltd; – 25.7% in Top Form International Ltd
Net carrying amount 000 euro
Top Form
Ltd.
Private Shop
Ltd. Total
At 01/01/2015 12,930 1,778 14,708
Results for the fiscal year 459 -157 302
Reserves 0 0 0
Other comprehensive income (1) -382 0 -382
At 31/12/2015 13,007 1,621 14,628
At 01/01/2016 13,007 1,621 14,628
Results for the fiscal year 92 -565 -473
Reserves 0 0 0
Other comprehensive income (1) 33 0 33
At 31/12/2016 13,132 1,056 14,188
(1) Before intercompany eliminations.
The results of Top Form International Ltd had not been published at the time of preparation and publication of the figures of Van de Velde and due to inside information concerns, the results for the period 1 July 2016 through 31 December 2016 were not included in the equity pick-up. In addition, Top Form International Ltd issued a profit warn-ing on 24 January 2017. As a result, it was decided not yet to include the received dividend of 28 November 2016 in the financial results (326 thousand euro).
The results were then published on 23 February 2017 and inclusion would result in a positive impact of 43 thousand euro on the result for the fiscal year and a negative impact of 119 thousand euro on the shareholders’ equity of Van de Velde. This impact is not material.
On 17 January 2017 it was decided to increase the capital of Private Shop Ltd by 1,000 thousand US dollar, with the Group subscribing for 500 thousand US dollar.
Key figures per participation are as follows:
Top Form Ltd.Private Shop
Ltd.
Key figuresHKD 000
(30/06/2016)HKD 000
(31/12/2016)
Tangible fixed assets 96,748 2,424
Other fixed assets 125,072 304
Current assets 494,277 19,109
Non-current liabilities 0 0
Current liabilities 122,237 6,359
Total net assets 372,040 15,433
Turnover 1,179,025 48,192
Net result 34,284 -11,822
The figures relating to Top Form International Ltd. in the above table refer to the closing at 30 June 2016 (a full financial year of 12 months sales 1 July 2015 to 30 June 2016).
7. Other fixed assetsOther fixed assets consist of the following:
000 euro 2016 2015
Security deposits for VAT 217 217
Other security deposits 395 404
Other participating interests 25 25
Prepaid rent expenses 48 52
Borrowings 142 242
Other fixed assets, net 827 940
Prepaid rent expenses are recorded in the income statement on a straight-line basis over the lease term.
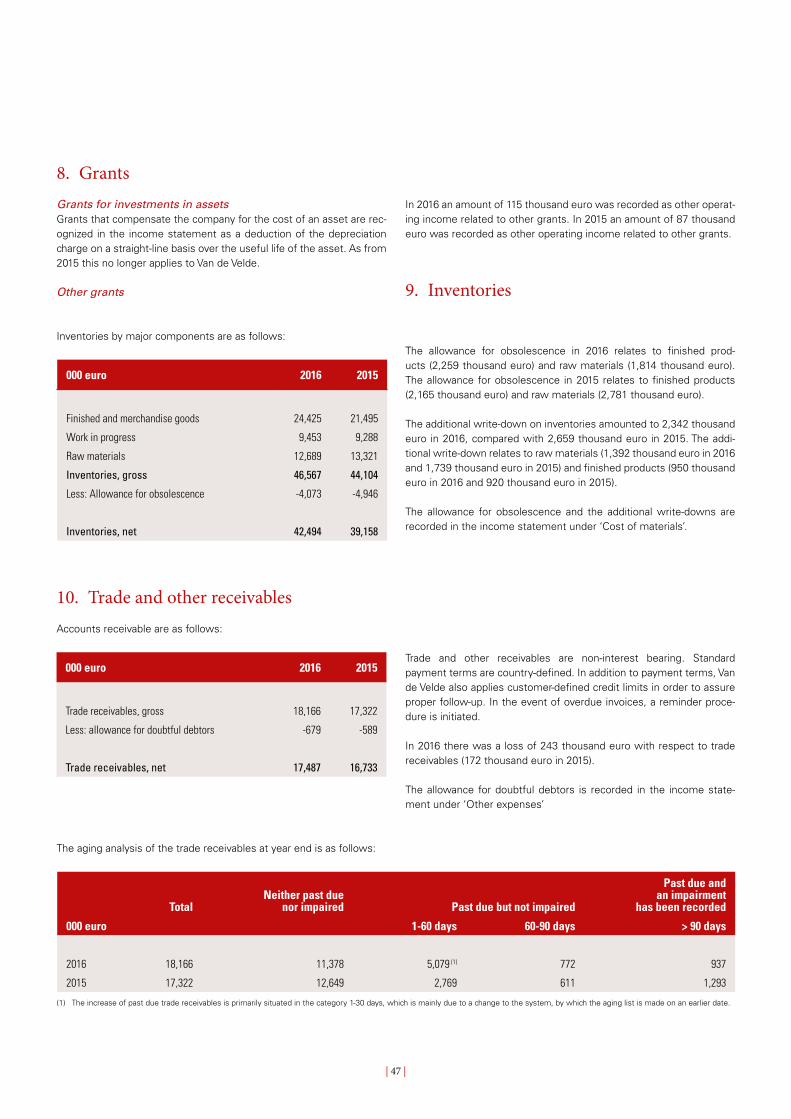
| 47 |
8. GrantsGrants for investments in assetsGrants that compensate the company for the cost of an asset are rec-ognized in the income statement as a deduction of the depreciation charge on a straight-line basis over the useful life of the asset. As from 2015 this no longer applies to Van de Velde.
Other grants
10. Trade and other receivables
The aging analysis of the trade receivables at year end is as follows:
TotalNeither past due
nor impaired Past due but not impaired
Past due and an impairment
has been recorded
000 euro 1-60 days 60-90 days > 90 days
2016 18,166 11,378 5,079 (1) 772 937
2015 17,322 12,649 2,769 611 1,293
(1) The increase of past due trade receivables is primarily situated in the category 1-30 days, which is mainly due to a change to the system, by which the aging list is made on an earlier date.
In 2016 an amount of 115 thousand euro was recorded as other operat-ing income related to other grants. In 2015 an amount of 87 thousand euro was recorded as other operating income related to other grants.
9. Inventories
Inventories by major components are as follows:
000 euro 2016 2015
Finished and merchandise goods 24,425 21,495
Work in progress 9,453 9,288
Raw materials 12,689 13,321
Inventories, gross 46,567 44,104
Less: Allowance for obsolescence -4,073 -4,946
Inventories, net 42,494 39,158
The allowance for obsolescence in 2016 relates to finished prod-ucts (2,259 thousand euro) and raw materials (1,814 thousand euro). The allowance for obsolescence in 2015 relates to finished products (2,165 thousand euro) and raw materials (2,781 thousand euro).
The additional write-down on inventories amounted to 2,342 thousand euro in 2016, compared with 2,659 thousand euro in 2015. The addi-tional write-down relates to raw materials (1,392 thousand euro in 2016 and 1,739 thousand euro in 2015) and finished products (950 thousand euro in 2016 and 920 thousand euro in 2015).
The allowance for obsolescence and the additional write-downs are recorded in the income statement under ‘Cost of materials’.
Accounts receivable are as follows:
000 euro 2016 2015
Trade receivables, gross 18,166 17,322
Less: allowance for doubtful debtors -679 -589
Trade receivables, net 17,487 16,733
Trade and other receivables are non-interest bearing. Standard payment terms are country-defined. In addition to payment terms, Van de Velde also applies customer-defined credit limits in order to assure proper follow-up. In the event of overdue invoices, a reminder proce-dure is initiated.
In 2016 there was a loss of 243 thousand euro with respect to trade receivables (172 thousand euro in 2015).
The allowance for doubtful debtors is recorded in the income state-ment under ‘Other expenses’

| 48 |
13. Share capital
Authorized and fully paid 2016 2015
Nominative shares 7,502,693 7,497,684
Dematerialized shares 5,819,787 5,824,796
Total number of shares 13,322,480 13,322,480
At 31 December 2016 Van de Velde NV’s share capital was 1,936 thou-sand euro (fully paid), represented by 13,322,480 shares with no nomi-nal value and all with the same rights insofar as they are not treasury shares, whose rights have been suspended or cancelled. The Board of Directors of Van de Velde NV is authorized to raise the subscribed capital one or more times by a total amount of 1,936 thousand euro under the conditions stated in the Articles of Association. This authori-zation is valid for five years after publication in the annexes to Belgisch Staatsblad/Moniteur belge (21 May 2012).
The distributions from retained earnings of Van de Velde NV, the parent company, is limited to a legal reserve, which was built up, in previous years in accordance with Belgium’s Companies Code, to 10% of the subscribed capital.
Treasury sharesAt the end of 2016 Van de Velde NV held no treasury shares.
In accordance with Article 620 of Belgium’s Companies Code, the Extraordinary General Meeting of Shareholders of 30 April 2014 gave the Board of Directors the power to acquire the company’s own shares. In 2016 15,000 treasury shares were purchased to meet the commitments regarding the exercise of stock options in 2016.
Within the framework of the stock option plan a total of 15,000 options were exercised and the same number of treasury shares was made available to the option holders.
At the end of 2016 Van de Velde NV held no treasury shares.
000 euro 2016 2015
Share capital 1,936 1,936
Treasury shares 0 0
Share premium 743 743
Non-controlling interestsAt the end of 2016, non-controlling interests include the 13% stake of the Kenton family in the equity and the net income of Rigby & Peller Ltd.
11. Other current assetsOther current assets consist of the following:
000 euro 2016 2015
Prepaid expenses (1) 4,220 4,567
Tax receivables (VAT & corporate income tax) 1,359 1,428
Accrued income 14 80
Sundry 116 161
FX forward contracts (note 20) 584 623
Other current assets, net 6,293 6,859
(1) The prepaid expenses primarily relate to publicity and marketing costs for the next seasons as well as prepaid maintenance costs.
12. Cash and cash equivalentsCash and cash equivalents consist of the following:
000 euro 2016 2015
Cash at banks and in hand 16,612 7,819
Marketable securities 1,926 20,329
Cash and cash equivalents 18,538 28,148
Marketable securities consist only of saving accounts and short-term investments at financial institutions. Cash and cash equivalents recognized in the cash flow statement comprise the same elements as presented above.
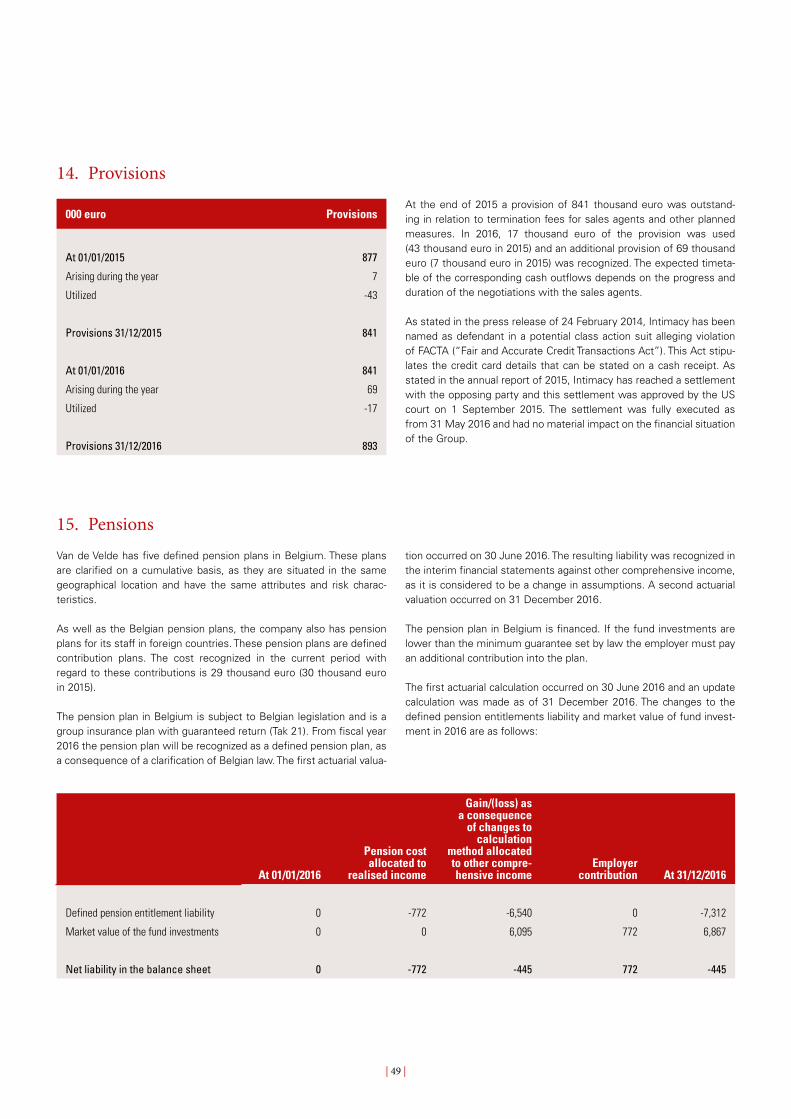
| 49 |
At the end of 2015 a provision of 841 thousand euro was outstand-ing in relation to termination fees for sales agents and other planned measures. In 2016, 17 thousand euro of the provision was used (43 thousand euro in 2015) and an additional provision of 69 thousand euro (7 thousand euro in 2015) was recognized. The expected timeta-ble of the corresponding cash outflows depends on the progress and duration of the negotiations with the sales agents.
As stated in the press release of 24 February 2014, Intimacy has been named as defendant in a potential class action suit alleging violation of FACTA (“Fair and Accurate Credit Transactions Act”). This Act stipu-lates the credit card details that can be stated on a cash receipt. As stated in the annual report of 2015, Intimacy has reached a settlement with the opposing party and this settlement was approved by the US court on 1 September 2015. The settlement was fully executed as from 31 May 2016 and had no material impact on the financial situation of the Group.
14. Provisions
000 euro Provisions
At 01/01/2015 877
Arising during the year 7
Utilized -43
Provisions 31/12/2015 841
At 01/01/2016 841
Arising during the year 69
Utilized -17
Provisions 31/12/2016 893
15. PensionsVan de Velde has five defined pension plans in Belgium. These plans are clarified on a cumulative basis, as they are situated in the same geographical location and have the same attributes and risk charac-teristics.
As well as the Belgian pension plans, the company also has pension plans for its staff in foreign countries. These pension plans are defined contribution plans. The cost recognized in the current period with regard to these contributions is 29 thousand euro (30 thousand euro in 2015).
The pension plan in Belgium is subject to Belgian legislation and is a group insurance plan with guaranteed return (Tak 21). From fiscal year 2016 the pension plan will be recognized as a defined pension plan, as a consequence of a clarification of Belgian law. The first actuarial valua-
tion occurred on 30 June 2016. The resulting liability was recognized in the interim financial statements against other comprehensive income, as it is considered to be a change in assumptions. A second actuarial valuation occurred on 31 December 2016.
The pension plan in Belgium is financed. If the fund investments are lower than the minimum guarantee set by law the employer must pay an additional contribution into the plan.
The first actuarial calculation occurred on 30 June 2016 and an update calculation was made as of 31 December 2016. The changes to the defined pension entitlements liability and market value of fund invest-ment in 2016 are as follows:
At 01/01/2016
Pension cost allocated to
realised income
Gain/(loss) as a consequence
of changes to calculation
method allocated to other compre-hensive income
Employer contribution At 31/12/2016
Defined pension entitlement liability 0 -772 -6,540 0 -7,312
Market value of the fund investments 0 0 6,095 772 6,867
Net liability in the balance sheet 0 -772 -445 772 -445

| 50 |
The table below shows the effect of the discount rate on the defined pension entitlement liability:
Valuation trend -0.5% Original
Valuation trend +0.5%
Discount rate 1.30% 1.80% 2.30%
Defined pension entitlement liability
7,988 7,312 6,716
Market value of the fund investments
7,474 6,867 6,341
The table below shows the effect of the withdrawals from the plan on the defined pension entitlement liability:
Original Sensitivity
Withdrawal from the plan Employer table 0.00%
Defined pension entitlement liability
7,312 7,707
The sensitivity analysis in the above tables is determined on the basis of a method that shows the impact on the liability due to the defined pension entitlements as a consequence of reasonable changes to significant assumptions occurring at the end of the period. This analy-sis is based on a change to a significant assumption that keeps all other assumptions constant. The sensitivity analysis may not be repre-sentative of actual changes in the defined pension entitlement liability because it is unlikely that changes to the assumptions could occur in isolation.
16. Other non-current liabilitiesOther non-current liabilities consist of the following:
000 euro 2016 2015
Deferred rent and lease incentives 1,296 1,454
Liabilities from acquisition of a participation in joint venture
1,830 1,830
Other non-current liabilities 3,126 3,284
Deferred rent and lease incentives relate to both the difference between the actual cash payment to the lessor and the expense recognized in the income statement and lease incentives received as part of the lease contract, which are recognized over the lease term as a deduction from the recorded rent expense.
The investments primarily relate to qualifying insurance policies (99.8% of all investments). The expected contribution by the employer for the year ending 31 December 2017 was 463 thousand euro.
The main actuarial assumptions used in the valuation of the pension plans are shown in the table below:
Annual pay rises (excluding inflation) 1%
Annual inflation 2%
Annual discount rate 1.8%
Retirement age in years 65
Total number of members 659
Average age in years 42
Estimated duration in years 19
The expected duration of the non-discounted pension payments is broken down in the table below:
Expected benefits
Within 12 months (fiscal year ending 31 December 2017)
54
Between 2 and 5 years 800
Between 5 and 10 years 1,016
Total expected benefits 1.870
The cash value of pension liabilities depends on a number of factors that are determined actuarially on the basis of a number of assump-tions. The assumptions that are used when calculating the net pension costs (income) include the discount rate. Changes in the assumptions impact the carrying value of the pension liabilities.
Van de Velde determines the appropriate discount rate at the end of each year. This is the interest rate that must be applied to determine the cash value of the estimated future cash flows required to meet the pension liabilities. When determining the appropriate discount rate Van de Velde uses the interest rate of high-value corporate bonds expressed in the currency in which the pensions will be paid out and with a duration comparable to the duration of the corresponding pension liabilities.
Other important assumptions for pension liabilities, such as expected annual growth rate of salaries and benefits, are partly based on current market conditions.

| 51 |
17. Deferred taxesThe deferred taxes consist of the following:
000 euro
Deferred tax liabilities
on fixed assets
Deferred tax assets
on assets / liabilities Deductible losses Total
At 01/01/2015 -1,611 1,092 333 -186
Changes -41 254 -333 -120
At 31/12/2015 -1,652 1,346 0 -306
At 01/01/2016 -1,652 1,346 0 -306
Changes -213 167 0 -46
At 31/12/2016 -1,865 1,513 0 -352
The net deferred tax liability of 352 thousand euro consists of the following components: – Regarding the deferred tax liabilities on fixed assets, the deprecia-
ble amount of an item of property, plant and equipment should be allocated on a straight-line basis over its useful life. In the statutory financial statements, the double declining depreciation method is applied, which is restated for consolidation purposes. The deferred taxes were valued at the theoretical tax rate of 33.99%.
18. Trade and other payablesTrade and other payables consist of the following:
000 euro 2016 2015
Trade payables 5,022 5,640
Payroll, social charges 5,312 5,177
Gift cards and credits issued 694 710
Accrued charges (1) 4,437 3,755
Deferred income 326 0
Sundry 0 155
Fx forward contracts (note 19) 190 30
Short-term borrowings 579 355
Trade and other payables 16,560 15,822
(1) Accrued charges primarily relate to accrued bonuses to employees and directors as well as discounts to customers.
– Deferred tax assets on assets (16 thousand euro) relate to differ-ences between the statutory accounting policies and the account-ing policies in accordance with IFRS.
– Deferred tax assets on liabilities (151 thousand euro) relate to the additional pension scheme where deferred tax assets are recorded through reserves.
19. Other current liabilities and taxes payable
000 euro 2016 2015
Other current liabilities: taxes (VAT payable, local taxes, withholding taxes)
1,211 1,632
Taxes payable: corporate income taxes 16,871 9,723
The increase in current liabilities and taxes payable in 2016 mainly relates to the outstanding payable of corporate income taxes cover-ing income years 2015 and 2016 compared with 2014 and 2015 in the previous year.
The liabilities from acquisition of a participation in joint venture relate to Private Shop Ltd. The amount of 1,830 thousand euro (2,000 thou-sand US dollar) is a liability payable to Getz for the acquisition of a distribution agreement and intangible assets at the start of the joint
venture in 2012. This amount will be settled when certain milestone criteria are fulfilled. The Group is of the opinion that this amount will not be settled until after 2017.

| 52 |
20. Financial instrumentsThe Group applies derivative financial instruments to limit the risks of unfavourable exchange rate fluctuations originating from operations and investments.
Derivatives that do not qualify for hedge accountingThe company applies FX forward contracts to manage transaction risks. These have a maturity date between 16/01/2017 and 15/12/2017 (maturities at 31 December 2015: between 15/01/2016 and 15/12/2016). As these contracts do not meet the hedging criteria of IAS 39, they are valued at fair value and recognized as trading contracts through profit or loss.
On 31 December the fair value of these FX forward contracts was 394 thousand euro, comprising an unrealized income of 584 thousand euro and an unrealized loss of 190 thousand euro.
By way of a summary, the various fair values are shown in the follow-ing table:
000 euro 2016 2015
Derivatives that do not qualify for hedge accounting:
Other current assets 584 623
Other current liabilities -190 -30
Real value 394 593
The valuation technique used to determine the fair value is level 2-compliant, with the various levels and related valuation techniques defined as follows: – Level 1: quoted (and not adjusted) prices on active markets for
identical assets and liabilities; – Level 2: other techniques, in which all inputs that have a major
impact on the recognized fair value are observable (directly or indi-rectly);
– Level 3: techniques, using inputs with a major impact on the fair value and for which no observable market data is available.
21. Financial resultThe financial result breaks down as follows:
000 euro 2016 2015
Interest income 59 138
Interest costs -64 -27
Interest result, net -5 111
Exchange gains 2,407 5,192
Exchange losses -2,299 -5,117
Exchange result, net 108 75
Income from investments (dividends) 321 641
Other financial income 0 0
Other financial costs -791 -508
Financial result -367 319
22. Personnel expensesPersonnel expenses are as follows:
000 euro 2016 2015
Wages 8,259 8,581
Salaries 26,256 27,031
Social security contributions 7,643 7,506
Other personnel expenses 1,503 981
Personnel expenses 43,661 44,099
Workforce at balance sheet date 2016 2015
White collars 569 574
Blue collars 848 787
Total 1,417 1,361

| 53 |
Share-based paymentsThe Group applies IFRS 2 Share-based payments since 2008. The fair value of the options on the grant date is recognized for the period until the beneficiary acquires the option unconditionally in accordance with the gradual acquisition method.
The impact of IFRS 2 on the result of the year 2016 was 110 thousand euro versus 123 thousand euro in 2015.The option plans were valued using the Black-Scholes-Merton model for call options. The following assumptions were used to determine the weighted average fair value at grant date:
PLAN PLAN PLAN PLAN
2013 2014 2015 2016
Award date (1) 11/10/13 13/10/14 12/10/15 29/9/16
Dividend right as of the grant date no no no no
Contractual term of the options 5-10 5-10 5-10 5-10
Exercise price 34.89 37.85 55.87 63.02
Expected volatility 35.00% 35.00% 35.00% 35.00%
Risk-free interest rate 1.08% - 2.16% 0.33% - 1.01% 0.07% -0.269% - 0.242%
Fair value of the share options (in euro) 10.26 9.97 14.45 16.40(1) The exchange of property will take place on the 60th day after the award date and is called the grant date.
The share option plan has developed as follows:
Number of shares and optionsOption plan 2005 - 2016
Outstanding at 01/01/2015 73,500
Exercisable at 01/01/2015 26,000
Movements during the year
Accepted 1,000
Forfeited 0
Exercised 33,000
Expired 0
Outstanding at 31/12/2015 41,500
Exercisable at 31/12/2015 0
Movements during the year
Accepted 21,000
Forfeited 0
Exercised 15,000
Expired 0
Outstanding at 31/12/2016 47,500
Exercisable at 31/12/2016 0

| 54 |
24. Earnings per share Basic earnings per share are calculated by dividing the net income for the year attributable to ordinary shareholders by the weighted average number of ordinary shares outstanding during the year, excluding the shares purchased by the Group and held as treasury shares (note 13).
Diluted earnings per share are calculated by dividing the net income for the year attributable to ordinary shareholders by the weighted average number of ordinary shares outstanding during the year, both adjusted for the effects of dilutive potential ordinary shares (stock options).
2016 2015
Profit attributable to shareholders (in 000 euro) 33,554 40,950
Weighted average number of ordinary shares 13,321,752 13,314,477
Dilutive effect of stock options 12,059 17,726
Weighted average number of shares after impact of dilution
13,333,811 13,332,203
Basic earnings per share (euro) 2.52 3.08
Diluted earnings per share (euro) 2.52 3.07
In 2015 all stock options granted over the period 2007-2015 were dilu-tive. In 2016 all stock options granted over the period 2012-2016 were dilutive.
23. Income taxesThe major components of income tax expense for the years ending 31 December 2016 and 2015 are:
000 euro 2016 2015
Current income tax 19,183 12,929
Current income tax charge 19,183 12,929
Adjustments in respect of current income tax of previous years
0 0
Deferred income tax 198 306
Relating to the origination and reversal of temporary differences
198 306
Income tax expense reported in the consoli-dated income statement
19,381 13,235
The reconciliation of income tax expense applicable to income before taxes at the statutory income tax rate and income tax expense at the Group’s effective income tax rate for each of the past two years ending 31 December is as follows:
000 euro 2016 2015
Profit before taxes (1) 53,267 53,987
Parent’s statutory tax rate of 33.99% 18,105 18,350
Higher income tax rates in other countries 0 41
Lower income tax rates in other countries -1,321 -3,462
Utilization tax losses and unrecognized losses 2,128 -1,945
Disallowed expenses 346 300
Notional interest deduction -164 -313
Other 111 93
Dividend received reduction ('DBI') 176 171
Total income taxes 19,381 13,235
Effective income tax rate 36.38% 24.52%
(1) Profit before taxes excluding the share in the result of associates and impairment charges.
The increase of the effective income tax rate in 2016 can mainly be clarified as follows: – The tax exemption in Tunisia ended in 2016. – During 2015 a tax-deductible amortization on intragroup receivables
was realized. – Lower notional interest deduction.

| 55 |
26. Commitments and contingent liabilitiesThe Group rents sites for the shops of its own retail network and showrooms to present collections to customers. These rent contracts are operational leases with a contract term of one year or more. Rental expenses in respect of these operating leases amounted to 6,791 thousand euro in 2016 (7,410 thousand euro in 2015).
Future minimum lease payments under operating leases were as follows at 31 December 2016:
000 euro 2016 2015
Within one year 6,297 6,792
After one year but not more than five years 16,029 18,108
More than five years 4,001 6,034
Total 26,327 30,934
25. Dividends paid and proposed
000 euro 2016 2015
Dividend paid 46,634 46,618
Dividend paid:– in 2016: - 1.35 euro per share as interim dividend for fiscal year 2016. - 2.15 euro per share for fiscal year 2015.– in 2015: - 1.35 euro per share as interim dividend for fiscal year 2015. - 2.15 euro per share for fiscal year 2014.
Dividend proposed 46,629 46,622
Dividend proposed:– 3.50 euro per share for fiscal year 2016 of which 1.35 euro per share was
paid as interim dividend in November 2016.– 3.50 euro per share for fiscal year 2015 of which 1.35 euro per share was
paid as interim dividend in November 2015.– No dividend rights are attached to treasury shares.
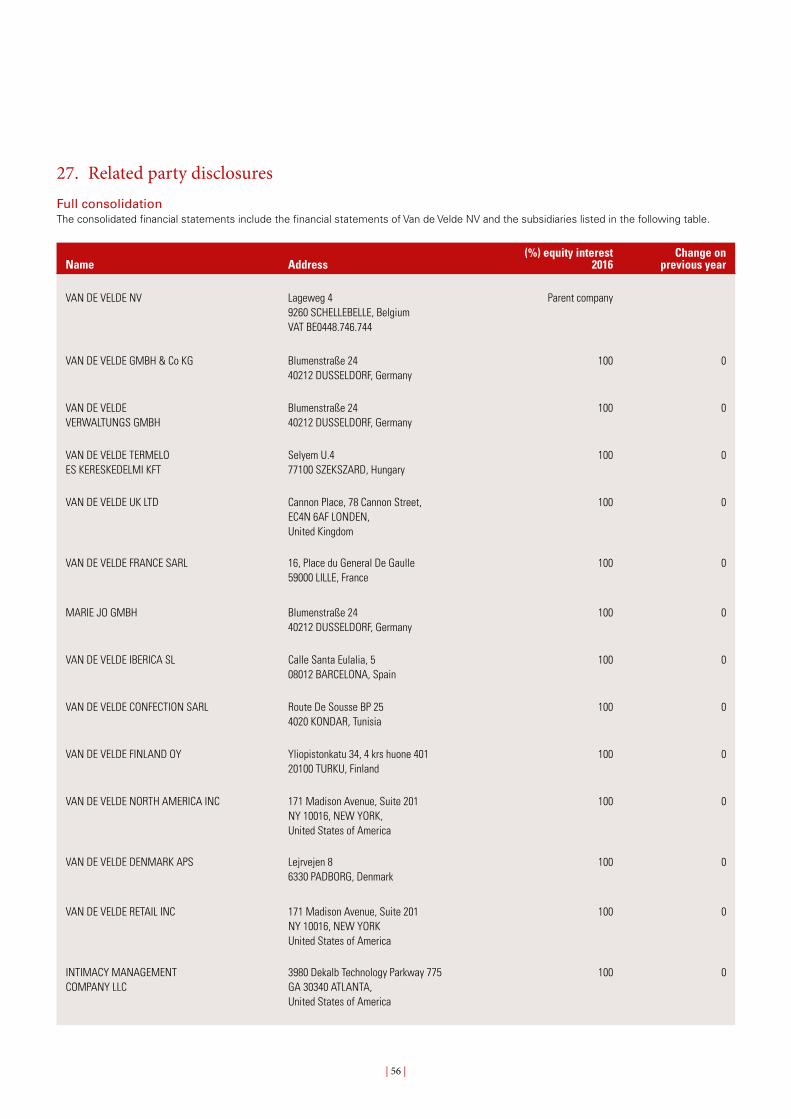
| 56 |
27. Related party disclosuresFull consolidationThe consolidated financial statements include the financial statements of Van de Velde NV and the subsidiaries listed in the following table.
Name Address(%) equity interest
2016Change on
previous year
VAN DE VELDE NV Lageweg 4 9260 SCHELLEBELLE, BelgiumVAT BE0448.746.744
Parent company
VAN DE VELDE GMBH & Co KG Blumenstraße 2440212 DUSSELDORF, Germany
100 0
VAN DE VELDE VERWALTUNGS GMBH
Blumenstraße 2440212 DUSSELDORF, Germany
100 0
VAN DE VELDE TERMELOES KERESKEDELMI KFT
Selyem U.4 77100 SZEKSZARD, Hungary
100 0
VAN DE VELDE UK LTD Cannon Place, 78 Cannon Street,EC4N 6AF LONDEN,United Kingdom
100 0
VAN DE VELDE FRANCE SARL 16, Place du General De Gaulle59000 LILLE, France
100 0
MARIE JO GMBH Blumenstraße 2440212 DUSSELDORF, Germany
100 0
VAN DE VELDE IBERICA SL Calle Santa Eulalia, 5 08012 BARCELONA, Spain
100 0
VAN DE VELDE CONFECTION SARL Route De Sousse BP 254020 KONDAR, Tunisia
100 0
VAN DE VELDE FINLAND OY Yliopistonkatu 34, 4 krs huone 40120100 TURKU, Finland
100 0
VAN DE VELDE NORTH AMERICA INC 171 Madison Avenue, Suite 201NY 10016, NEW YORK,United States of America
100 0
VAN DE VELDE DENMARK APS Lejrvejen 86330 PADBORG, Denmark
100 0
VAN DE VELDE RETAIL INC 171 Madison Avenue, Suite 201NY 10016, NEW YORKUnited States of America
100 0
INTIMACY MANAGEMENTCOMPANY LLC
3980 Dekalb Technology Parkway 775GA 30340 ATLANTA, United States of America
100 0

| 57 |
Name Address(%) equity interest
2016Change on
previous year
RIGBY & PELLER LTD Second Floor, 37 North RowW1K 6DH, LONDENUnited Kingdom
87 0
VAN DE VELDE NEDERLAND BV Corellistraat 271077 HB AMSTERDAM, Netherlands
100 0
VAN DE VELDE POLAND SP ZOO Ul. Al Wyzwolenia 10 - lok 17100570 WARSCHAU, Poland
100 0
Sales of goods and services are at arm’s length between Group companies.
Companies to which the equity method is appliedThe equity method is applied to the following companies:
Name Address(%) equity interest
2016Change on
previous year
TOP FORM INTERNATIONAL LTD 15/F., Tower A,Manulife Financial Centre,No. 223-231 Wai Yip Street, Kwun Tong, Kowloon, Hong Kong
25.7 0
PRIVATE SHOP LTD Wyler Centre I, 8th Floor202-210 Tai Lin Pai RoadKwai Chung, Hong Kong
50 0
Top Form International Ltd (“TFI”)In 2016 transactions between the Group and TFI totalled 11,717 thousand US dollar. On 31 December 2016 the Group had trade payables to TFI in the amount of 108 thousand US dollar. In 2015 transactions between the Group and TFI totalled 10,387 thousand US dollar. On 31 December 2015 the Group had trade payables to TFI in the amount of 654 thousand US dollar.
Private Shop LtdIn 2016 sales between the Group and Private Shop Ltd totalled 555 thousand euro. On 31 December 2016, the Group had no accounts receivable to Private Shop Ltd. In 2015 sales between the Group and Private Shop Ltd totalled 587 thousand euro. On 31 December 2015, the Group had no accounts receivable to Private Shop Ltd.
Related to the acquisition of a distribution agreement and a number of intangible assets in relation to Private Shop Ltd, the Group had a debt to Getz of 2.0 million US dollar as per 31 December 2016. This amount will be paid to Getz as certain milestone criteria are achieved.
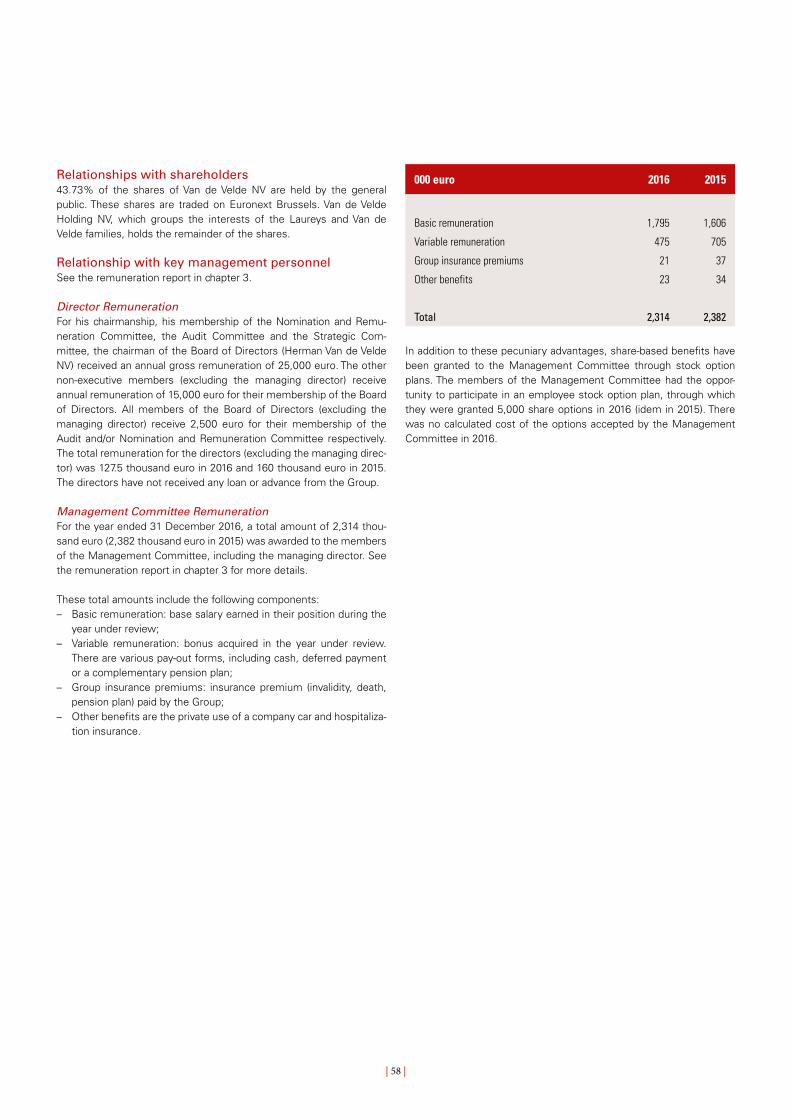
| 58 |
Relationships with shareholders43.73% of the shares of Van de Velde NV are held by the general public. These shares are traded on Euronext Brussels. Van de Velde Holding NV, which groups the interests of the Laureys and Van de Velde families, holds the remainder of the shares.
Relationship with key management personnelSee the remuneration report in chapter 3.
Director RemunerationFor his chairmanship, his membership of the Nomination and Remu-neration Committee, the Audit Committee and the Strategic Com -mittee, the chairman of the Board of Directors (Herman Van de Velde NV) received an annual gross remuneration of 25,000 euro. The other non-executive members (excluding the managing director) receive annual remuneration of 15,000 euro for their membership of the Board of Directors. All members of the Board of Directors (excluding the managing director) receive 2,500 euro for their membership of the Audit and/or Nomination and Remuneration Committee respectively. The total remuneration for the directors (excluding the managing direc-tor) was 127.5 thousand euro in 2016 and 160 thousand euro in 2015. The directors have not received any loan or advance from the Group.
Management Committee RemunerationFor the year ended 31 December 2016, a total amount of 2,314 thou-sand euro (2,382 thousand euro in 2015) was awarded to the members of the Management Committee, including the managing director. See the remuneration report in chapter 3 for more details.
These total amounts include the following components: – Basic remuneration: base salary earned in their position during the
year under review; – Variable remuneration: bonus acquired in the year under review.
There are various pay-out forms, including cash, deferred payment or a complementary pension plan;
– Group insurance premiums: insurance premium (invalidity, death, pension plan) paid by the Group;
– Other benefits are the private use of a company car and hospitaliza-tion insurance.
000 euro 2016 2015
Basic remuneration 1,795 1,606
Variable remuneration 475 705
Group insurance premiums 21 37
Other benefits 23 34
Total 2,314 2,382
In addition to these pecuniary advantages, share-based benefits have been granted to the Management Committee through stock option plans. The members of the Management Committee had the oppor-tunity to participate in an employee stock option plan, through which they were granted 5,000 share options in 2016 (idem in 2015). There was no calculated cost of the options accepted by the Management Committee in 2016.
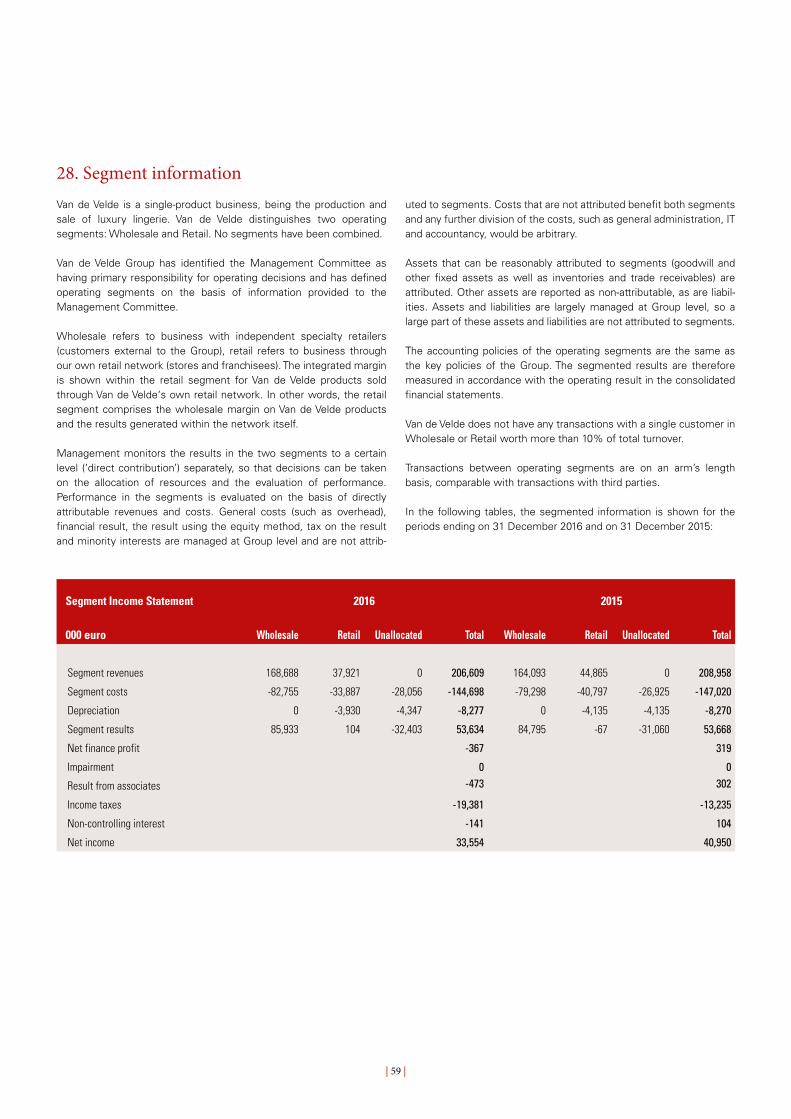
| 59 |
28. Segment informationVan de Velde is a single-product business, being the production and sale of luxury lingerie. Van de Velde distinguishes two operating segments: Wholesale and Retail. No segments have been combined.
Van de Velde Group has identified the Management Committee as having primary responsibility for operating decisions and has defined operating segments on the basis of information provided to the Management Committee.
Wholesale refers to business with independent specialty retailers (customers external to the Group), retail refers to business through our own retail network (stores and franchisees). The integrated margin is shown within the retail segment for Van de Velde products sold through Van de Velde‘s own retail network. In other words, the retail segment comprises the wholesale margin on Van de Velde products and the results generated within the network itself.
Management monitors the results in the two segments to a certain level (‘direct contribution’) separately, so that decisions can be taken on the allocation of resources and the evaluation of performance. Performance in the segments is evaluated on the basis of directly attributable revenues and costs. General costs (such as overhead), financial result, the result using the equity method, tax on the result and minority interests are managed at Group level and are not attrib-
uted to segments. Costs that are not attributed benefit both segments and any further division of the costs, such as general administration, IT and accountancy, would be arbitrary.
Assets that can be reasonably attributed to segments (goodwill and other fixed assets as well as inventories and trade receivables) are attributed. Other assets are reported as non-attributable, as are liabil-ities. Assets and liabilities are largely managed at Group level, so a large part of these assets and liabilities are not attributed to segments. The accounting policies of the operating segments are the same as the key policies of the Group. The segmented results are therefore measured in accordance with the operating result in the consolidated financial statements.
Van de Velde does not have any transactions with a single customer in Wholesale or Retail worth more than 10% of total turnover.
Transactions between operating segments are on an arm’s length basis, comparable with transactions with third parties.
In the following tables, the segmented information is shown for the periods ending on 31 December 2016 and on 31 December 2015:
Segment Income Statement 2016 2015
000 euro Wholesale Retail Unallocated Total Wholesale Retail Unallocated Total
Segment revenues 168,688 37,921 0 206,609 164,093 44,865 0 208,958
Segment costs -82,755 -33,887 -28,056 -144,698 -79,298 -40,797 -26,925 -147,020
Depreciation 0 -3,930 -4,347 -8,277 0 -4,135 -4,135 -8,270
Segment results 85,933 104 -32,403 53,634 84,795 -67 -31,060 53,668
Net finance profit -367 319
Impairment 0 0
Result from associates -473 302
Income taxes -19,381 -13,235
Non-controlling interest -141 104
Net income 33,554 40,950

| 60 |
Segment Balance Sheet 2016 2015
000 euro Wholesale Retail Total Wholesale Retail Total
Segment assets 60,053 23,177 83,230 55,575 26,220 81,795
Unallocated assets 73,486 79,939
Consolidated total assets 60,053 23,177 156,716 55,575 26,220 161,734
Segment liabilities 0 0 0 0 0 0
Unallocated liabilities 156,716 161,734
Consolidated total liabilities 0 0 156,716 0 0 161,734
Capital expenditure 2016 2015
000 euro Wholesale Retail Unallocated Total Wholesale Retail Unallocated Total
Tangible fixed assets 0 1,131 8,589 9,720 0 1,596 8,622 10,218
Intangible assets 0 92 646 738 0 52 720 772
Depreciation 0 3,930 4,347 8,277 0 4,135 4,135 8,270
Breakdown by region – turnover 2016 2015
000 euro Eurozone Elsewhere Total Eurozone Elsewhere Total
Turnover 139,307 67,302 206,609 134,423 (1) 74,535 (1) 208,958
(1) Figures for 2015 were adjusted to enhance comparibility with 2016.
The most important markets, determined on the basis of the quantitative IFRS criteria, are: – Belgium, Germany and the Netherlands for the Eurozone; – United States for Elsewhere.
Further information about the assets of the company – location (000 euro) Belgium Elsewhere Total
Tangible fixed assets 30,584 6,622 37,206
Intangible assets 8,105 7,032 15,137
Inventories 37,455 5,039 42,494
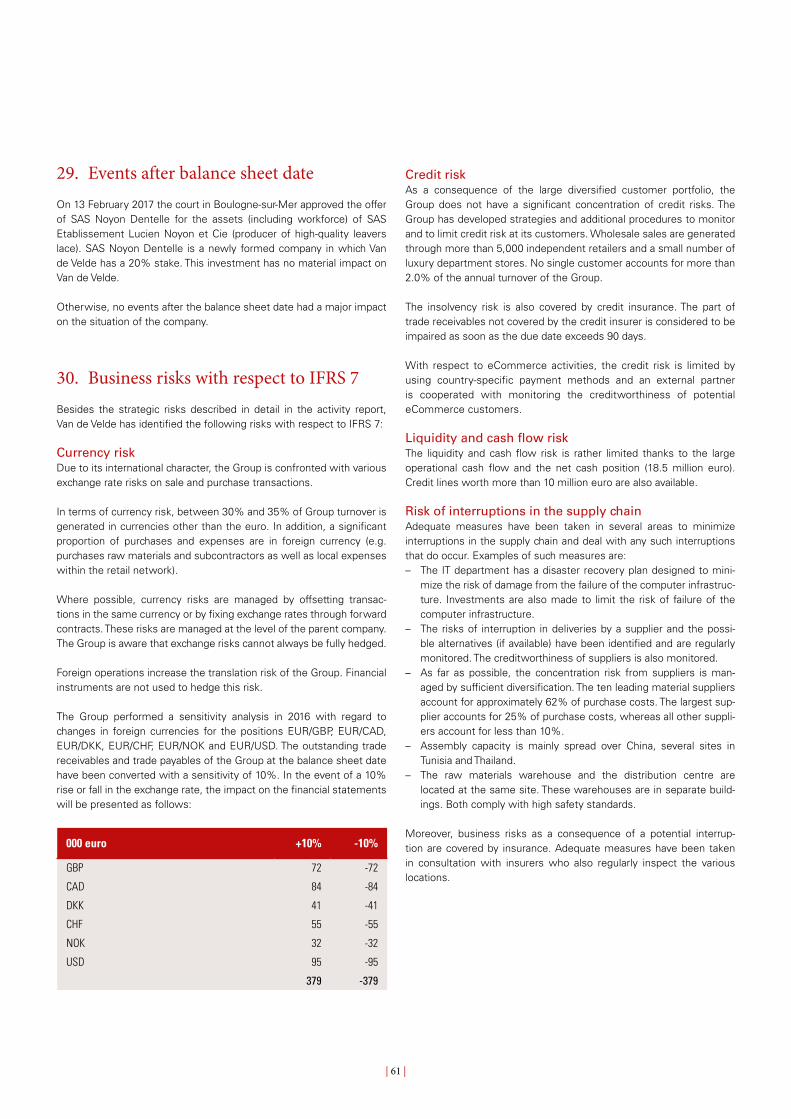
| 61 |
Credit riskAs a consequence of the large diversified customer portfolio, the Group does not have a significant concentration of credit risks. The Group has developed strategies and additional procedures to monitor and to limit credit risk at its customers. Wholesale sales are generated through more than 5,000 independent retailers and a small number of luxury department stores. No single customer accounts for more than 2.0% of the annual turnover of the Group.
The insolvency risk is also covered by credit insurance. The part of trade receivables not covered by the credit insurer is considered to be impaired as soon as the due date exceeds 90 days.
With respect to eCommerce activities, the credit risk is limited by using country-specific payment methods and an external partner is cooperated with monitoring the creditworthiness of potential eCommerce customers.
Liquidity and cash flow riskThe liquidity and cash flow risk is rather limited thanks to the large operational cash flow and the net cash position (18.5 million euro). Credit lines worth more than 10 million euro are also available.
Risk of interruptions in the supply chain Adequate measures have been taken in several areas to minimize interruptions in the supply chain and deal with any such interruptions that do occur. Examples of such measures are: – The IT department has a disaster recovery plan designed to mini-
mize the risk of damage from the failure of the computer infrastruc-ture. Investments are also made to limit the risk of failure of the computer infrastructure.
– The risks of interruption in deliveries by a supplier and the possi-ble alternatives (if available) have been identified and are regularly monitored. The creditworthiness of suppliers is also monitored.
– As far as possible, the concentration risk from suppliers is man-aged by sufficient diversification. The ten leading material suppliers account for approximately 62% of purchase costs. The largest sup-plier accounts for 25% of purchase costs, whereas all other suppli-ers account for less than 10%.
– Assembly capacity is mainly spread over China, several sites in Tunisia and Thailand.
– The raw materials warehouse and the distribution centre are located at the same site. These warehouses are in separate build-ings. Both comply with high safety standards.
Moreover, business risks as a consequence of a potential interrup-tion are covered by insurance. Adequate measures have been taken in consultation with insurers who also regularly inspect the various locations.
29. Events after balance sheet dateOn 13 February 2017 the court in Boulogne-sur-Mer approved the offer of SAS Noyon Dentelle for the assets (including workforce) of SAS Etablissement Lucien Noyon et Cie (producer of high-quality leavers lace). SAS Noyon Dentelle is a newly formed company in which Van de Velde has a 20% stake. This investment has no material impact on Van de Velde.
Otherwise, no events after the balance sheet date had a major impact on the situation of the company.
30. Business risks with respect to IFRS 7Besides the strategic risks described in detail in the activity report, Van de Velde has identified the following risks with respect to IFRS 7:
Currency riskDue to its international character, the Group is confronted with various exchange rate risks on sale and purchase transactions.
In terms of currency risk, between 30% and 35% of Group turnover is generated in currencies other than the euro. In addition, a significant proportion of purchases and expenses are in foreign currency (e.g. purchases raw materials and subcontractors as well as local expenses within the retail network).
Where possible, currency risks are managed by offsetting transac-tions in the same currency or by fixing exchange rates through forward contracts. These risks are managed at the level of the parent company. The Group is aware that exchange risks cannot always be fully hedged.
Foreign operations increase the translation risk of the Group. Financial instruments are not used to hedge this risk.
The Group performed a sensitivity analysis in 2016 with regard to changes in foreign currencies for the positions EUR/GBP, EUR/CAD, EUR/DKK, EUR/CHF, EUR/NOK and EUR/USD. The outstanding trade receivables and trade payables of the Group at the balance sheet date have been converted with a sensitivity of 10%. In the event of a 10% rise or fall in the exchange rate, the impact on the financial statements will be presented as follows:
000 euro +10% -10%
GBP 72 -72
CAD 84 -84
DKK 41 -41
CHF 55 -55
NOK 32 -32
USD 95 -95
379 -379

| 62 |
Van de Velde Group has been subject to and may in the future be subject to allegations of violating certain laws and/or regulations. Such allegations or investigations or proceedings may require the Group to devote significant management resources to defending itself. In the event that such allegations are proven, Van de Velde may be subject to significant fines, damages awards and other expenses, and its reputa-tion may be harmed.
Van de Velde Group actively strives to ensure compliance with all laws and regulations to which it is subject. A degree of insurance has been taken out to cover some of the above-mentioned risks.
With reference to note 14, as stated in the press release of 24 February 2014, Intimacy has been named as defendant in a potential class action suit alleging violation of FACTA (“Fair and Accurate Credit Transactions Act”). This Act stipulates the credit card details that can be stated on a cash receipt. In this case, Intimacy has reached a settle-ment with the opposing party and this settlement was approved by the US court on 1 September 2015. The settlement was fully executed on 31 May 2016 and had no material impact on the financial situation of the Group.
Other operational risksThe Group is also faced with other operational risks which (if possible) are monitored and for which (if available) correcting actions are taken.
Risk of overvalued stock Van de Velde’s business model entails risks with regard to raw materi-als and finished products. Raw materials are ordered and production launched before we have full insight into the orders. As far as possible, Van de Velde attempts to concentrate this risk at the level of raw mate-rials rather than finished products.
Van de Velde also applies a strict policy regarding write-downs on inventories: – The value of finished products for which sales are declining is writ-
ten down at the end of the season or during the following season. These finished products are fully written off in the subsequent year.
– If there is no further need for additional production, the related raw materials are written off completely.
Product risk Sales are spread over about 50,000 stock references, over 10,000 of which are changed every season. Therefore, sales do not depend on the success of any one model.
Compliance and regulatory risksVan de Velde Group is subject to federal, regional and local laws and regulations in each country in which it operates. Such laws and regula-tions relate to a wide variety of matters, such as data security, privacy, product liability, health and safety, import and export, occupational accidents, employment practices and the relationship with associates (regarding overtime and work place safety among other things), tax matters, unfair competitive practices and similar regulations, etc.
Compliance with, or changes in, these laws could reduce the revenues and profitability of the Group and could affect its business, financial conditions or the results of operations.


| 64 |
1 | Het Jaar 2011
Group’s internal control. An audit also includes evaluating the appropri-ateness of accounting policies used, the reasonableness of account-ing estimates made by the Board of Directors, as well as evaluating the overall presentation of the Consolidated Financial Statements.
We have obtained from the Board of Directors and the Company’s officials the explanations and information necessary for performing our audit procedure and we believe that the audit evidence we have obtained is sufficient and appropriate to provide a basis for our opinion.
Unqualified opinionIn our opinion, the Consolidated Financial Statements of the Group as at 31 December 2016 give a true and fair view of the net equity and financial position of the consolidated whole, as well as its consoli-dated results and its consolidated cash flows for the year then ended in accordance with the International Financial Reporting Standards as adopted by the European Union.
Report on other legal and regulatory requirementsThe Board of Directors is responsible for the preparation and the content of the Board of Director’s report on the Consolidated Financial Statements, in accordance with article 119 of the Belgian Company Code.
In the context of our mandate and in accordance with the additional standard issued by the ‘Instituut van de Bedrijfsrevisoren/Institut des Réviseurs d’Entreprises’ as published in the Belgian Gazette on 28 August 2013 (the “Additional Standard”), it is our responsibility to perform certain procedures to verify, in all material respects, compli-ance with certain legal and regulatory requirements, as defined in the Additional Standard. On this basis, we make the following additional statement, which does not modify the scope of our opinion on the Consolidated Financial Statements.
– The Board of Director’s report to the Consolidated Financial Statements includes the information required by law, is consistent with the Consolidated Financial Statements and does not present any material inconsistencies with the information that we became aware of during the performance of our mandate.
Gent, 17 February 2017Ernst & Young Bedrijfsrevisoren BCVBA
Statutory auditor represented by
Paul Eelen*Partner
As required by law and the Company’s by-laws, we report to you in the context of our statutory auditor’s mandate. This report includes our opinion on the consolidated statement of the financial position as at 31 December 2016, the consolidated statement of the realized and non-realized results, the consolidated statement of changes in equity and the consolidated statement of cash flows for the year ended 31 December 2016 and the disclosures (all elements together “the Consolidated Financial Statements”) and includes as well our report on other legal and regulatory requirements.
Report on the Consolidated Financial Statements - Un-qualified opinion We have audited the Consolidated Financial Statements of Van de Velde NV (“the Company”) and her subsidiaries (together “the Group”) as of and for the year ended 31 December 2016, prepared in accord-ance with the International Financial Reporting Standards as adopted by the European Union, which show a consolidated balance sheet total of € 156,716 thousand and of which the consolidated income state-ment shows a profit for the year (attributable to the equityholders of the parent) of € 33,554 thousand.
Responsibility of the Board of Directors for the preparation of the Consolidated Financial StatementsThe Board of Directors is responsible for the preparation of Consolidated Financial Statements that give a true and fair view in accordance with the International Financial Reporting Standards, as adopted by the European Union. This responsibility includes: design-ing, implementing and maintaining internal control relevant to the preparation of Consolidated Financial Statements that give a true and fair view and that are free from material misstatement, whether due to fraud or error; selecting and applying appropriate accounting policies; and making accounting estimates that are reasonable in the given circumstances.
Responsibility of the statutory auditor Our responsibility is to express an opinion on these Consolidated Financial Statements based on our audit. We conducted our audit in accordance with International Standards on Auditing (“ISAs”). Those standards require that we comply with the ethical requirements and plan and perform the audit to obtain reasonable assurance about whether the Consolidated Financial Statements are free from material misstatement.
An audit involves performing procedures to obtain audit evidence about the amounts and disclosures in the Consolidated Financial Statements. The procedures selected depend on the statutory audi-tor’s judgment, including the assessment of the risks of material misstatement of the Annual Accounts, whether due to fraud or error. In making those risk assessments, the statutory auditor considers internal control relevant to the Group’s preparation and presentation of the Annual Accounts that give a true and fair view, in order to design audit procedures that are appropriate in the circumstances, but not for the purpose of expressing an opinion on the effectiveness of the
6 | Statutory auditor’s report to the general meeting of shareholders of Van de Velde NV on the consolidated financial statements for the year ended 31 December 2016
* acting on behalf of a BVBA

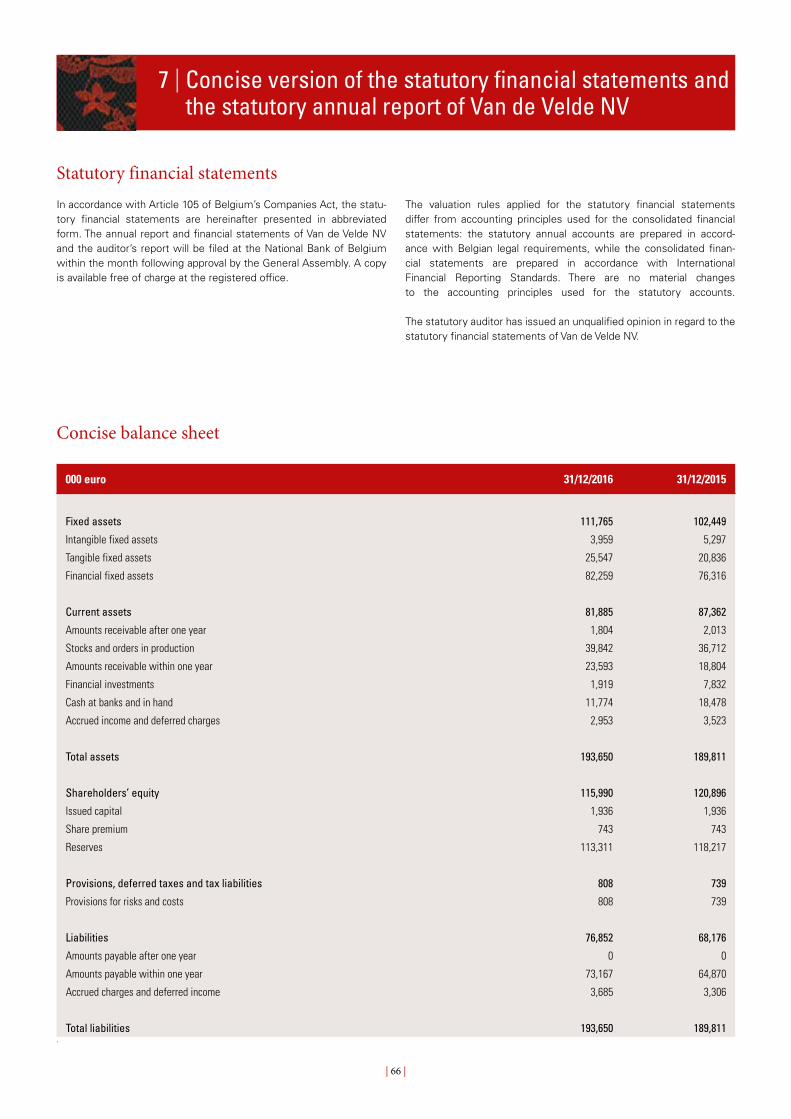
| 66 |
1 | Het Jaar 2011
The valuation rules applied for the statutory financial statements differ from accounting principles used for the consolidated financial statements: the statutory annual accounts are prepared in accord-ance with Belgian legal requirements, while the consolidated finan-cial statements are prepared in accordance with International Financial Reporting Standards. There are no material changes to the accounting principles used for the statutory accounts.
The statutory auditor has issued an unqualified opinion in regard to the statutory financial statements of Van de Velde NV.
Statutory financial statements In accordance with Article 105 of Belgium’s Companies Act, the statu-tory financial statements are hereinafter presented in abbreviated form. The annual report and financial statements of Van de Velde NV and the auditor’s report will be filed at the National Bank of Belgium within the month following approval by the General Assembly. A copy is available free of charge at the registered office.
Concise balance sheet
000 euro 31/12/2016 31/12/2015
Fixed assets 111,765 102,449
Intangible fixed assets 3,959 5,297
Tangible fixed assets 25,547 20,836
Financial fixed assets 82,259 76,316
Current assets 81,885 87,362
Amounts receivable after one year 1,804 2,013
Stocks and orders in production 39,842 36,712
Amounts receivable within one year 23,593 18,804
Financial investments 1,919 7,832
Cash at banks and in hand 11,774 18,478
Accrued income and deferred charges 2,953 3,523
Total assets 193,650 189,811
Shareholders’ equity 115,990 120,896
Issued capital 1,936 1,936
Share premium 743 743
Reserves 113,311 118,217
Provisions, deferred taxes and tax liabilities 808 739
Provisions for risks and costs 808 739
Liabilities 76,852 68,176
Amounts payable after one year 0 0
Amounts payable within one year 73,167 64,870
Accrued charges and deferred income 3,685 3,306
Total liabilities 193,650 189,811.
7 | Concise version of the statutory financial statements and the statutory annual report of Van de Velde NV
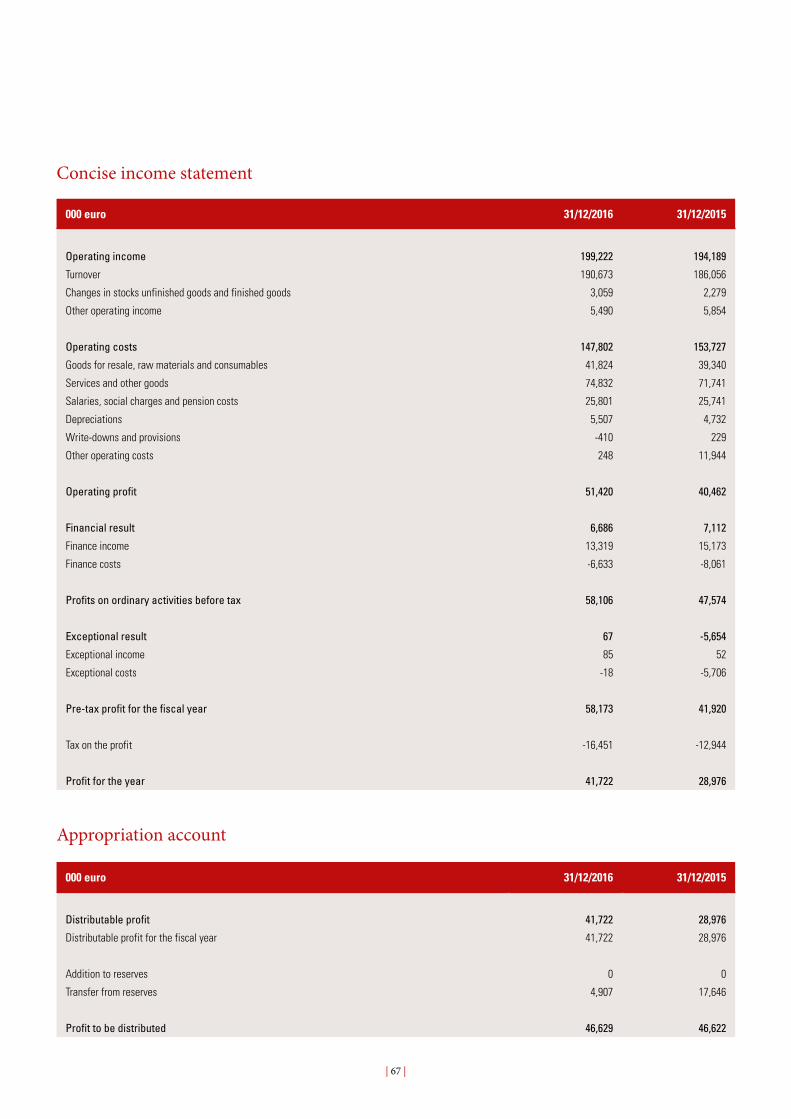
| 67 |
Concise income statement
000 euro 31/12/2016 31/12/2015
Operating income 199,222 194,189
Turnover 190,673 186,056
Changes in stocks unfinished goods and finished goods 3,059 2,279
Other operating income 5,490 5,854
Operating costs 147,802 153,727
Goods for resale, raw materials and consumables 41,824 39,340
Services and other goods 74,832 71,741
Salaries, social charges and pension costs 25,801 25,741
Depreciations 5,507 4,732
Write-downs and provisions -410 229
Other operating costs 248 11,944
Operating profit 51,420 40,462
Financial result 6,686 7,112
Finance income 13,319 15,173
Finance costs -6,633 -8,061
Profits on ordinary activities before tax 58,106 47,574
Exceptional result 67 -5,654
Exceptional income 85 52
Exceptional costs -18 -5,706
Pre-tax profit for the fiscal year 58,173 41,920
Tax on the profit -16,451 -12,944
Profit for the year 41,722 28,976
Appropriation account
000 euro 31/12/2016 31/12/2015
Distributable profit 41,722 28,976
Distributable profit for the fiscal year 41,722 28,976
Addition to reserves 0 0
Transfer from reserves 4,907 17,646
Profit to be distributed 46,629 46,622
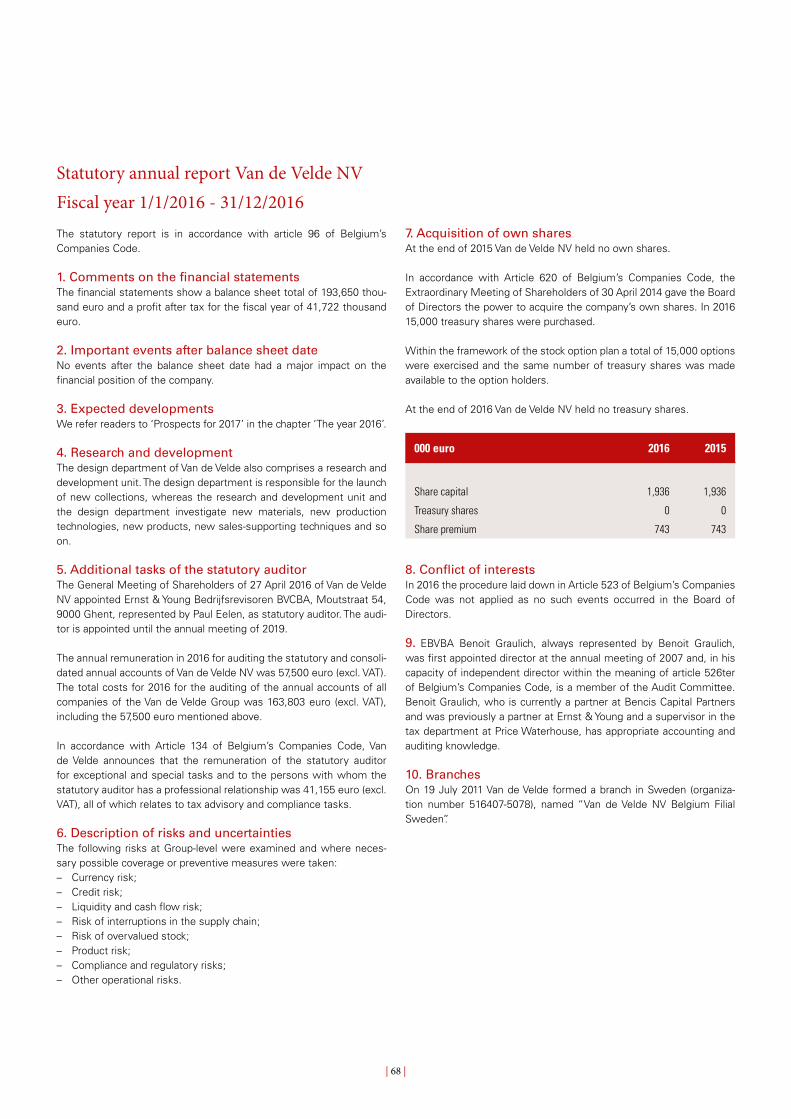
| 68 |
7. Acquisition of own sharesAt the end of 2015 Van de Velde NV held no own shares.
In accordance with Article 620 of Belgium’s Companies Code, the Extraordinary Meeting of Shareholders of 30 April 2014 gave the Board of Directors the power to acquire the company’s own shares. In 2016 15,000 treasury shares were purchased.
Within the framework of the stock option plan a total of 15,000 options were exercised and the same number of treasury shares was made available to the option holders.
At the end of 2016 Van de Velde NV held no treasury shares.
000 euro 2016 2015
Share capital 1,936 1,936
Treasury shares 0 0
Share premium 743 743
8. Conflict of interestsIn 2016 the procedure laid down in Article 523 of Belgium’s Companies Code was not applied as no such events occurred in the Board of Directors.
9. EBVBA Benoit Graulich, always represented by Benoit Graulich, was first appointed director at the annual meeting of 2007 and, in his capacity of independent director within the meaning of article 526ter of Belgium’s Companies Code, is a member of the Audit Committee. Benoit Graulich, who is currently a partner at Bencis Capital Partners and was previously a partner at Ernst & Young and a supervisor in the tax department at Price Waterhouse, has appropriate accounting and auditing knowledge.
10. BranchesOn 19 July 2011 Van de Velde formed a branch in Sweden (organiza-tion number 516407-5078), named “Van de Velde NV Belgium Filial Sweden”.
Statutory annual report Van de Velde NVFiscal year 1/1/2016 - 31/12/2016The statutory report is in accordance with article 96 of Belgium’s Companies Code.
1. Comments on the financial statementsThe financial statements show a balance sheet total of 193,650 thou-sand euro and a profit after tax for the fiscal year of 41,722 thousand euro.
2. Important events after balance sheet dateNo events after the balance sheet date had a major impact on the financial position of the company.
3. Expected developmentsWe refer readers to ‘Prospects for 2017’ in the chapter ‘The year 2016’.
4. Research and developmentThe design department of Van de Velde also comprises a research and development unit. The design department is responsible for the launch of new collections, whereas the research and development unit and the design department investigate new materials, new production technologies, new products, new sales-supporting techniques and so on.
5. Additional tasks of the statutory auditorThe General Meeting of Shareholders of 27 April 2016 of Van de Velde NV appointed Ernst & Young Bedrijfsrevisoren BVCBA, Moutstraat 54, 9000 Ghent, represented by Paul Eelen, as statutory auditor. The audi-tor is appointed until the annual meeting of 2019.
The annual remuneration in 2016 for auditing the statutory and consoli-dated annual accounts of Van de Velde NV was 57,500 euro (excl. VAT). The total costs for 2016 for the auditing of the annual accounts of all companies of the Van de Velde Group was 163,803 euro (excl. VAT), including the 57,500 euro mentioned above.
In accordance with Article 134 of Belgium’s Companies Code, Van de Velde announces that the remuneration of the statutory auditor for exceptional and special tasks and to the persons with whom the statutory auditor has a professional relationship was 41,155 euro (excl. VAT), all of which relates to tax advisory and compliance tasks.
6. Description of risks and uncertaintiesThe following risks at Group-level were examined and where neces-sary possible coverage or preventive measures were taken: – Currency risk; – Credit risk; – Liquidity and cash flow risk; – Risk of interruptions in the supply chain; – Risk of overvalued stock; – Product risk; – Compliance and regulatory risks; – Other operational risks.

| 69 |
13. Remuneration ReportThe remuneration report provides transparent information on Van de Velde’s reward policy for its directors and members of the Management Committee, in accordance with the Belgian Corporate Governance Act of 6 April 2010 and the Belgian Corporate Governance Code. Please see chapter 3 (Corporate Governance).
14. Proposed profit distributionThe Board of Directors proposes to the General Meeting of Shareholders payment of a gross dividend of 3.5000 euro per share. After payment of withholding tax, this represents a net dividend of 2.4905 euro per share. Of this amount, a gross interim dividend of 1.3500 euro per share (net dividend of 0.9855 euro per share) was paid in November 2016. After approval by the General Meeting of Shareholders the final dividend of 2.1500 euro per share (net dividend of 1.505 euro per share) will be paid out as from 4 May 2017.
Proposed profit distribution in thousands of euro:
Distributable profit 41,722
Transfer from reserves 4,907
Gross dividend of 3.50 euro per share on 13,322,480 shares 46,629
– Of this amount, 1.35 euro per share was paid as interim dividend in November 2016
17,985
– Of this amount, 2.15 euro per share as final dividend 28,644
15. Bearer sharesWithin the framework of the dematerialization of bearer shares, the statutory auditor has in accordance with article 11 of the Act of 14 December 2005 made a report to the Board of Directors. This report will be submitted in accordance with this same article to the ‘Caisse des Dépôts et Consignations’.
Positron BVBA,always represented byErwin Van LaethemManaging Director
11. Enumeration, within the framework of Article 34 of Belgium’s Royal Decree of 14 November 2007 con-cerning the obligations of issuers of financial instru-ments that may be traded on a regulated market.
– 43.73% of the shares of Van de Velde NV are held by the gen-eral public. The remainder of the shares are held by Van de Velde Holding NV, which groups the interests of the Laureys and Van de Velde families. Different types of shares do not exist.
– There are no restrictions on the transfer of securities laid down by law or the Articles of Association.
– Holders of securities linked to special control: A majority of Van de Velde NV’s directors are appointed from the candidates nominated by Van de Velde Holding NV, as long as it directly or indirectly holds no less than 35% of the company’s shares.
– There are no employee share plans in which the controlling rights are not directly exercised by the employees.
– There are no restrictions on the exercise of voting rights laid down by law or the Articles of Association.
– Van de Velde NV is not aware of any shareholder agreements. – Notwithstanding the abovementioned fact that a majority of Van de
Velde NV’s directors are appointed from the candidates nominated by Van de Velde Holding NV, as long as it directly or indirectly holds no less than 35% of the company’s shares, there are no rules for the appointment or replacement of the members of the administra-tive bodies or restrictions on the exercise of voting rights laid down by the Articles of Association.
– With regard to the power of the administrative body to issuing shares, the Board of Directors is authorized, for a period of five years from announcement in the annexes to Belgisch Staatsblad/Moniteur belge (21 May 2012), to raise the subscribed capital one or more times by a total amount of 1,936,173.73 euro, under the conditions stated in the Articles of Association.
– The power of the administrative body with respect to the possibility of purchasing shares: see point 7 above.
– There are no major agreements to which Van de Velde NV is party that come into effect, are amended or expire in the event of a change in control of the issuer after a public offer.
– No agreements have been concluded between the issuer and its directors and/or employees that provide for a payment if the rela-tionship is ended as a consequence of a public offer.
12. Corporate GovernanceWe refer to chapter 3 of the annual report for the Corporate Governance statement.
| 70 |
1 | Het Jaar 2011
The undersigned declare that, to the best of their knowledge:
A) The financial statements, which have been prepared in compliance with the applicable standards, faithfully reflect the equity, the financial situ-ation and the results of Van de Velde and the companies included in the consolidation.
B) The annual report faithfully reflects the developments and the results of Van de Velde and the companies included in the consolidation, as well as providing a description of the main risks and uncertainties it faces.
Positron BVBA, Bart Rabaey Consulting VOF,always represented by always represented byErwin Van Laethem Bart RabaeyCEO CFO
8 | Statement of responsible persons

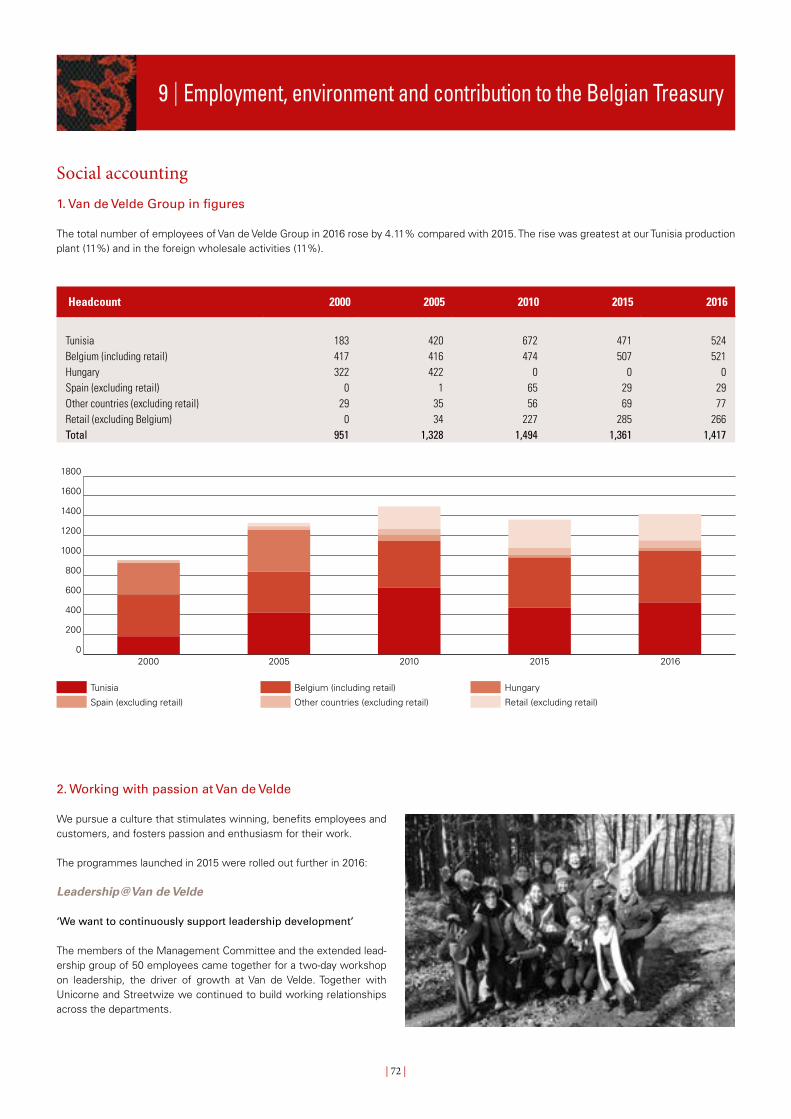
| 72 |
1 | Het Jaar 20119 | Employment, environment and contribution to the Belgian Treasury
Social accounting 1. Van de Velde Group in figures
The total number of employees of Van de Velde Group in 2016 rose by 4.11% compared with 2015. The rise was greatest at our Tunisia production plant (11%) and in the foreign wholesale activities (11%).
Headcount 2000 2005 2010 2015 2016
Tunisia 183 420 672 471 524Belgium (including retail) 417 416 474 507 521Hungary 322 422 0 0 0 Spain (excluding retail) 0 1 65 29 29Other countries (excluding retail) 29 35 56 69 77Retail (excluding Belgium) 0 34 227 285 266Total 951 1,328 1,494 1,361 1,417
2. Working with passion at Van de Velde
We pursue a culture that stimulates winning, benefits employees and customers, and fosters passion and enthusiasm for their work.
The programmes launched in 2015 were rolled out further in 2016:
Leadership@Van de Velde
‘We want to continuously support leadership development’
The members of the Management Committee and the extended lead-ership group of 50 employees came together for a two-day workshop on leadership, the driver of growth at Van de Velde. Together with Unicorne and Streetwize we continued to build working relationships across the departments.
Tunisia Belgium (including retail) Hungary
Spain (excluding retail) Other countries (excluding retail) Retail (excluding retail)
0
200
400
600
800
1000
1200
1400
1600
1800
2000 2005 2010 2015 2016

| 73 |
Meeting about the results and targeted communicationAll employees are given the opportunity to attend an information meet-ing on the day the annual and interim figures are published. The aim of this meeting is to clarify Van de Velde’ results and ongoing projects.
We invited internal and external speakers for Lunch&Learn and hotdog sessions. An external speaker told a fascinating story, providing new insights and inspiring ‘outward thinking’. Internal speakers talked about their department’s chal-lenges and projects, providing rich, multidiscipli-nary insights.
Leaders new in their role were given training in people management skills and the team leaders that head the production departments were given intensive guidance and coaching by an external trainer.
Community@Van de Velde
‘We want to build a community of Van de Velde Ambassadors’
Conversation room and ‘Working at Van de Velde’ Facebook groupOur internal communication platform, the ‘conversation room’, has grown into a central information point for all Group employees.
News, calendar items and so on are shared with everyone through this channel. The messages are shown on displays for those employees who do not have a personal computer.
Employees share all kinds of news and messages with each other on the closed ‘Working at Van de Velde’ Facebook group, which brings together almost 400 colleagues from around the world.
That enables all employees to stay up to date on how the company is doing and create engagement in results and projects. We also expect every manager to regularly notify all team members about the results of their department and the company.
| 74 |
Work@Van de Velde
‘We want to build a modern company’
From formal interviews to permanent dialogue and feedbackThe compulsory annual growth interviews were replaced by perma-nent dialogue and feedback at the end of 2015.
Our aim is to focus on what is truly important: honest feedback, dialogue and coaching. Managers must create the right context and provide direction; the focus must not be on control. This will empha-size natural leadership. Meetings are opportunities to appraise team members, give them attention and offer constructive feedback.
We ask every manager to hold frequent work sessions and brief chats (we call them check-ins) with all team members. We also expect each employee to show initiative and actively give and ask for feedback.
To support this interactive way of working, all employees take part in a training in which they are given practical tips on how to give and receive feedback. This training will be continued in 2017.
Courtesy and respectWe need some rules to ensure that the workplace is a pleasant envi-ronment for everyone. Rather than pedantically drawing up a list of regulations we produced an entertaining little film. The children of some of our employees were cast in the starring roles. Because cour-tesy is child’s play!

| 75 |
Van de Velde4Community
‘We want to be involved in the community around us’
Van de Velde actively chooses to support a number of local charities that work with (vulnerable) women and children.
Our fight against breast cancer: Every day, 26 women in Belgium alone are told that they have breast cancer. This is the disease that most affects us as a company. Not only because women make up 90% of our work-force, but also because of the nature of our products. That is why we support the Anticancer Fund in the production of a new brochure about breast cancer treatments.
Time for others. Employees have the oppor-tunity to invest time in social projects. In 2016 Van de Velde donated 240 working hours to local communities through Time4Society’s local social projects.
As part of Studio Brussel’s Warmest Week, a large group of employ-ees organized a Christmas market for the Mobile School. They made Christmas cards, decorations, croque-monsieurs, biscuits, fresh mint
tea and plenty more besides. The Christmas mood was there for all to feel, as was the warm-heartedness of our employees. We raised more than 2,400 euro in total.
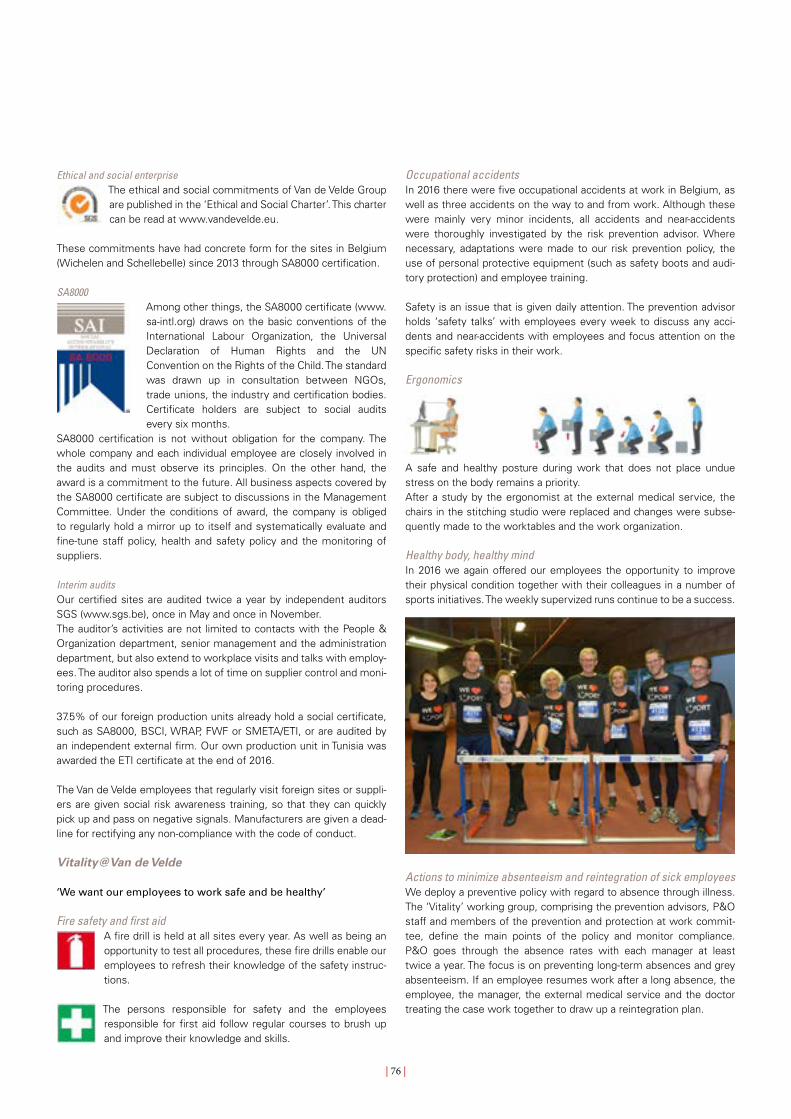
| 76 |
Ethical and social enterpriseThe ethical and social commitments of Van de Velde Group are published in the ‘Ethical and Social Charter’. This charter can be read at www.vandevelde.eu.
These commitments have had concrete form for the sites in Belgium (Wichelen and Schellebelle) since 2013 through SA8000 certification.
SA8000Among other things, the SA8000 certificate (www.sa-intl.org) draws on the basic conventions of the International Labour Organization, the Universal Declaration of Human Rights and the UN Convention on the Rights of the Child. The standard was drawn up in consultation between NGOs, trade unions, the industry and certification bodies. Certificate holders are subject to social audits every six months.
SA8000 certification is not without obligation for the company. The whole company and each individual employee are closely involved in the audits and must observe its principles. On the other hand, the award is a commitment to the future. All business aspects covered by the SA8000 certificate are subject to discussions in the Management Committee. Under the conditions of award, the company is obliged to regularly hold a mirror up to itself and systematically evaluate and fine-tune staff policy, health and safety policy and the monitoring of suppliers.
Interim auditsOur certified sites are audited twice a year by independent auditors SGS (www.sgs.be), once in May and once in November.The auditor’s activities are not limited to contacts with the People & Organization department, senior management and the administration department, but also extend to workplace visits and talks with employ-ees. The auditor also spends a lot of time on supplier control and moni-toring procedures.
37.5% of our foreign production units already hold a social certificate, such as SA8000, BSCI, WRAP, FWF or SMETA/ETI, or are audited by an independent external firm. Our own production unit in Tunisia was awarded the ETI certificate at the end of 2016.
The Van de Velde employees that regularly visit foreign sites or suppli-ers are given social risk awareness training, so that they can quickly pick up and pass on negative signals. Manufacturers are given a dead-line for rectifying any non-compliance with the code of conduct.
Vitality@Van de Velde
‘We want our employees to work safe and be healthy’
Fire safety and first aidA fire drill is held at all sites every year. As well as being an opportunity to test all procedures, these fire drills enable our employees to refresh their knowledge of the safety instruc-tions.
The persons responsible for safety and the employees responsible for first aid follow regular courses to brush up and improve their knowledge and skills.
Occupational accidentsIn 2016 there were five occupational accidents at work in Belgium, as well as three accidents on the way to and from work. Although these were mainly very minor incidents, all accidents and near-accidents were thoroughly investigated by the risk prevention advisor. Where necessary, adaptations were made to our risk prevention policy, the use of personal protective equipment (such as safety boots and audi-tory protection) and employee training.
Safety is an issue that is given daily attention. The prevention advisor holds ‘safety talks’ with employees every week to discuss any acci-dents and near-accidents with employees and focus attention on the specific safety risks in their work.
Ergonomics
A safe and healthy posture during work that does not place undue stress on the body remains a priority. After a study by the ergonomist at the external medical service, the chairs in the stitching studio were replaced and changes were subse-quently made to the worktables and the work organization.
Healthy body, healthy mindIn 2016 we again offered our employees the opportunity to improve their physical condition together with their colleagues in a number of sports initiatives. The weekly supervized runs continue to be a success.
Actions to minimize absenteeism and reintegration of sick employeesWe deploy a preventive policy with regard to absence through illness. The ‘Vitality’ working group, comprising the prevention advisors, P&O staff and members of the prevention and protection at work commit-tee, define the main points of the policy and monitor compliance. P&O goes through the absence rates with each manager at least twice a year. The focus is on preventing long-term absences and grey absenteeism. If an employee resumes work after a long absence, the employee, the manager, the external medical service and the doctor treating the case work together to draw up a reintegration plan.
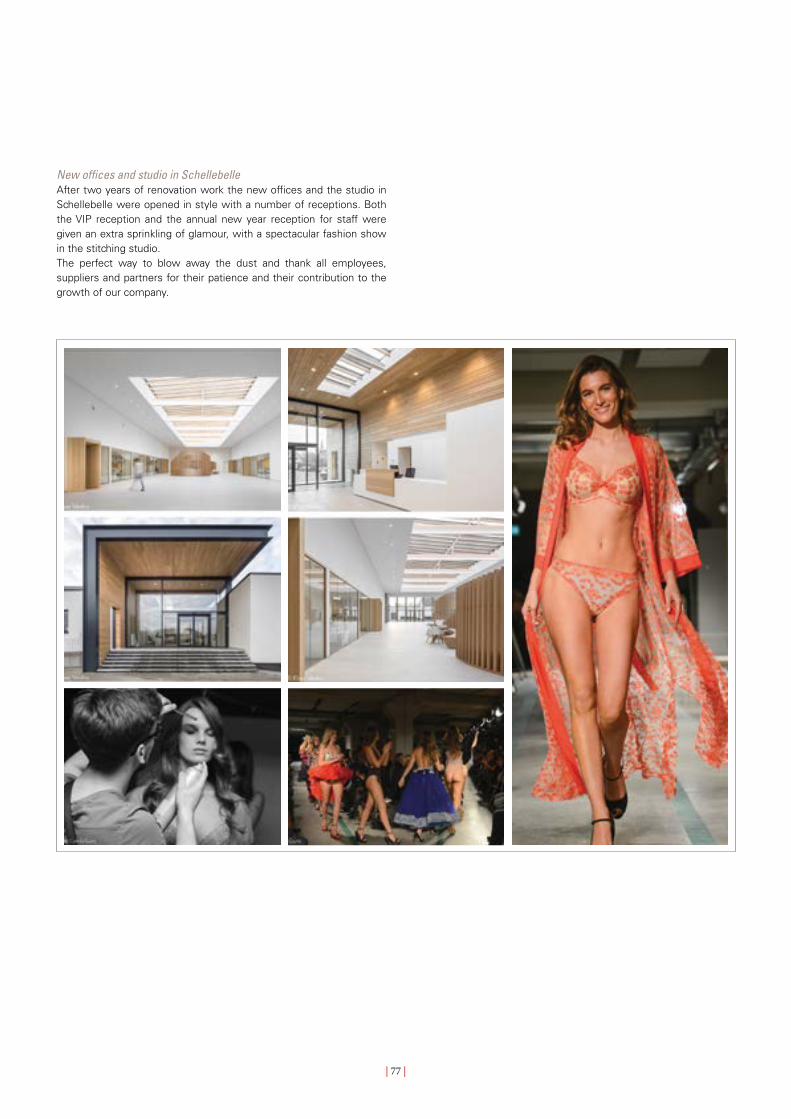
| 77 |
New offices and studio in SchellebelleAfter two years of renovation work the new offices and the studio in Schellebelle were opened in style with a number of receptions. Both the VIP reception and the annual new year reception for staff were given an extra sprinkling of glamour, with a spectacular fashion show in the stitching studio. The perfect way to blow away the dust and thank all employees, suppliers and partners for their patience and their contribution to the growth of our company.
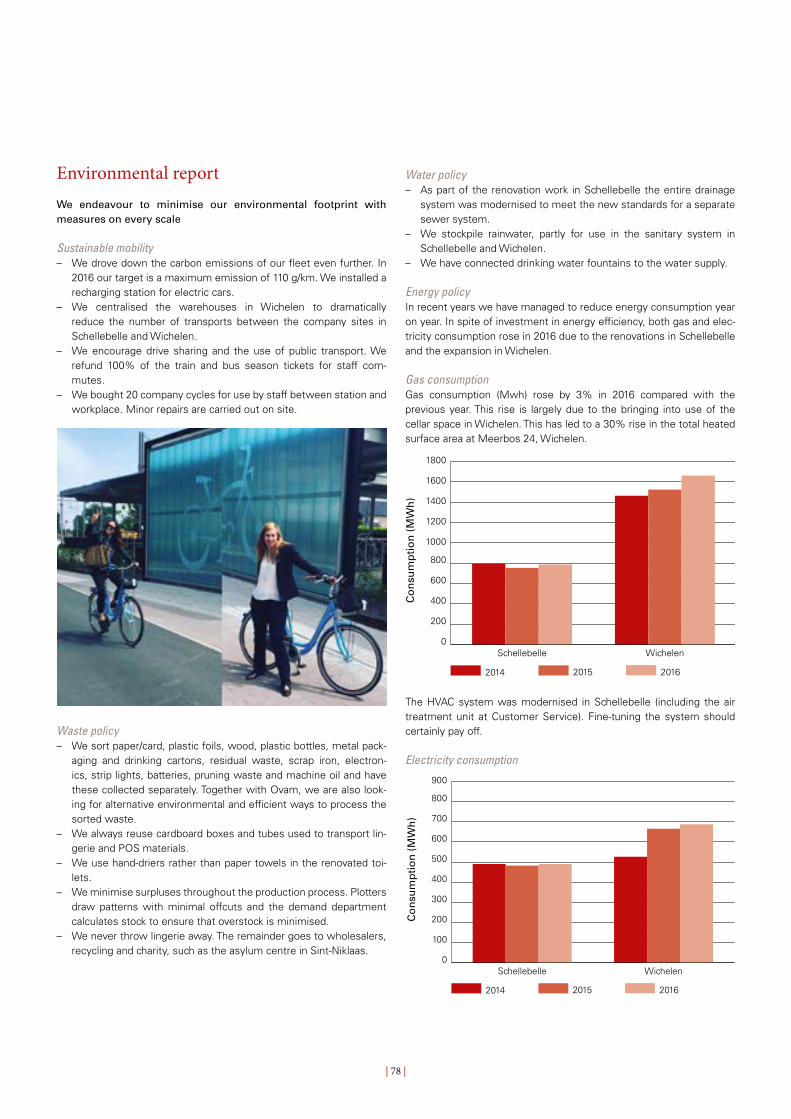
| 78 |
Environmental reportWe endeavour to minimise our environmental footprint with measures on every scale
Sustainable mobility – We drove down the carbon emissions of our fleet even further. In
2016 our target is a maximum emission of 110 g/km. We installed a recharging station for electric cars.
– We centralised the warehouses in Wichelen to dramatically reduce the number of transports between the company sites in Schellebelle and Wichelen.
– We encourage drive sharing and the use of public transport. We refund 100% of the train and bus season tickets for staff com-mutes.
– We bought 20 company cycles for use by staff between station and workplace. Minor repairs are carried out on site.
Waste policy – We sort paper/card, plastic foils, wood, plastic bottles, metal pack-
aging and drinking cartons, residual waste, scrap iron, electron-ics, strip lights, batteries, pruning waste and machine oil and have these collected separately. Together with Ovam, we are also look-ing for alternative environmental and efficient ways to process the sorted waste.
– We always reuse cardboard boxes and tubes used to transport lin-gerie and POS materials.
– We use hand-driers rather than paper towels in the renovated toi-lets.
– We minimise surpluses throughout the production process. Plotters draw patterns with minimal offcuts and the demand department calculates stock to ensure that overstock is minimised.
– We never throw lingerie away. The remainder goes to wholesalers, recycling and charity, such as the asylum centre in Sint-Niklaas.
Water policy – As part of the renovation work in Schellebelle the entire drainage
system was modernised to meet the new standards for a separate sewer system.
– We stockpile rainwater, partly for use in the sanitary system in Schellebelle and Wichelen.
– We have connected drinking water fountains to the water supply.
Energy policyIn recent years we have managed to reduce energy consumption year on year. In spite of investment in energy efficiency, both gas and elec-tricity consumption rose in 2016 due to the renovations in Schellebelle and the expansion in Wichelen.
Gas consumptionGas consumption (Mwh) rose by 3% in 2016 compared with the previous year. This rise is largely due to the bringing into use of the cellar space in Wichelen. This has led to a 30% rise in the total heated surface area at Meerbos 24, Wichelen.
0
200
400
600
800
1000
1200
1400
1600
1800
WichelenSchellebelle
Co
nsu
mp
tio
n (
MW
h)
201620152014
The HVAC system was modernised in Schellebelle (including the air treatment unit at Customer Service). Fine-tuning the system should certainly pay off.
Electricity consumption
0
100
200
300
400
500
600
700
800
900
WichelenSchellebelle
Co
nsu
mp
tio
n (
MW
h)
201620152014
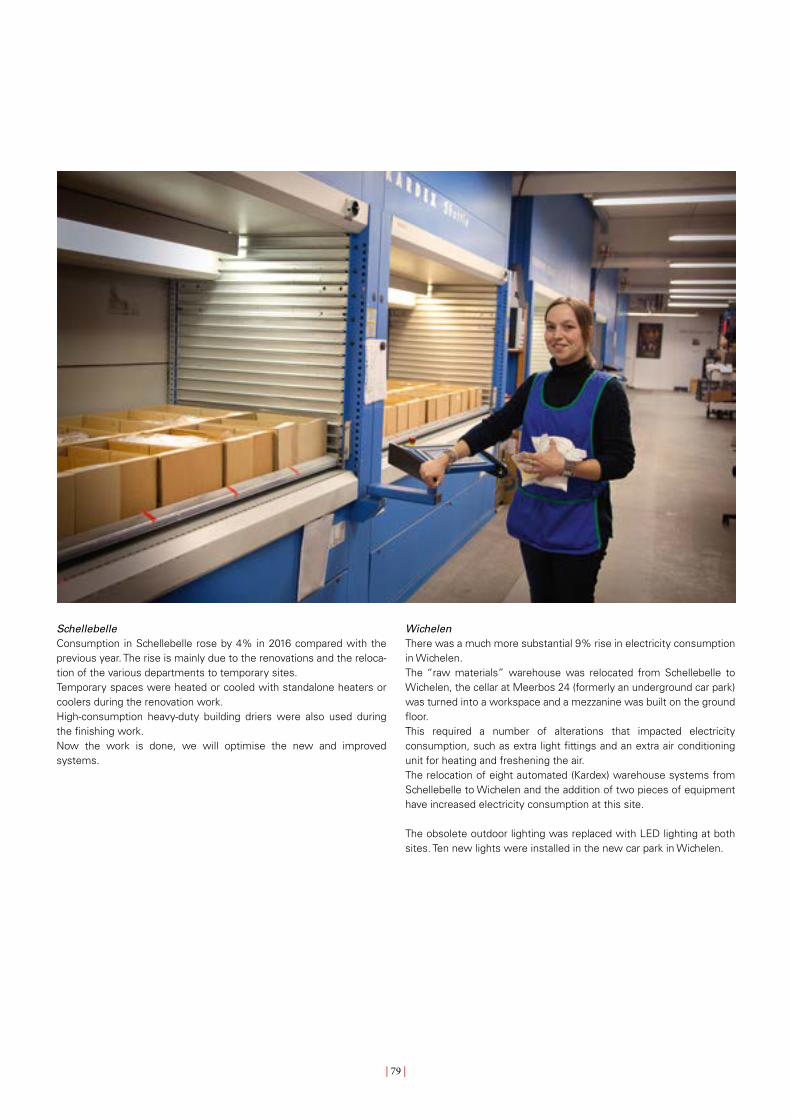
| 79 |
SchellebelleConsumption in Schellebelle rose by 4% in 2016 compared with the previous year. The rise is mainly due to the renovations and the reloca-tion of the various departments to temporary sites.Temporary spaces were heated or cooled with standalone heaters or coolers during the renovation work. High-consumption heavy-duty building driers were also used during the finishing work.Now the work is done, we will optimise the new and improved systems.
WichelenThere was a much more substantial 9% rise in electricity consumption in Wichelen.The “raw materials” warehouse was relocated from Schellebelle to Wichelen, the cellar at Meerbos 24 (formerly an underground car park) was turned into a workspace and a mezzanine was built on the ground floor.This required a number of alterations that impacted electricity consumption, such as extra light fittings and an extra air conditioning unit for heating and freshening the air. The relocation of eight automated (Kardex) warehouse systems from Schellebelle to Wichelen and the addition of two pieces of equipment have increased electricity consumption at this site.
The obsolete outdoor lighting was replaced with LED lighting at both sites. Ten new lights were installed in the new car park in Wichelen.

| 80 |
Contribution to the Belgian TreasuryThe total contributions made to the Belgian Treasury represent 64.6% of the operating profit of Van de Velde that was generated in Belgium. This operating profit is based on the statutory financial statements and amounted to 51,420 thousand euro at 31 December 2016.
000 euro TotalExpense for
Van de VeldeWithheld by
Van de Velde Velde
Social security contribution 4,817 4,817 0
Withholding tax on wages 3,526 0 3,526
Income tax 16,440 16,440 0
Difference between recoverable and deductible VAT 2,125 0 2,125
Withholding taxes 5,046 14 5,032
Provincial and municipal taxes and other federal taxes 69 69 0
Taxes on insurance premiums 88 88 0
Import duties 1,109 1,109 0
Total 33,220 22,537 10,683