annual report 2015 - handelsblatt...
TRANSCRIPT

Annual Report 2015

Financial highlights
Figures in €m 2009 2010 2011 2012 2013 2014 2015
Number of employees as at 31 December 53,302 53,437 52,526 51,966 45,169 44,909 45,453
Sales volumes
Cement and clinker (million tonnes) 79.3 78.4 87.8 89.0 78.1 81.8 81.1
Aggregates (million tonnes) 239.5 239.7 254.1 243.0 230.6 243.6 249.2
Ready-mixed concrete (million cubic metres) 35.0 35.0 39.1 39.1 34.9 36.6 36.7
Asphalt (million tonnes) 10.0 9.1 9.5 8.6 8.4 9.3 9.1
Income statement
Total Group revenue 11,117 11,762 12,902 14,020 12,128 12,614 13,465
Operating income before depreciation (OIBD) 2,102 2,239 2,321 2,477 2,224 2,288 2,613
Operating income (OI) 1,317 1,430 1,474 1,604 1,519 1,595 1,846
Profit for the financial year 168 511 534 529 933 687 983
Group share of profit 43 343 348 285 736 486 800
Dividend per share in € 0.12 0.25 0.35 0.47 0.60 0.75 1.301)
Earnings per share in € 0.30 1.83 1.86 1.52 3.93 2.59 4.26
Investments
Investments in intangible assets and PP&E 796 734 874 831 861 941 908
Investments in financial assets 24 138 85 35 379 184 94
Total investments 820 872 959 866 1,240 1,125 1,002
Depreciation and amortisation 785 809 847 873 704 693 767
Free cash flow
Cash flow from operating activities 1,164 1,144 1,332 1,513 1,167 1,480 1,449
Cash flow from investing activities -539 -648 -758 -582 -1,037 -973 493
Balance sheet
Equity (incl. non-controlling interests) 11,003 12,884 13,569 13,708 12,514 14,245 15,976
Balance sheet total 25,508 27,377 29,020 28,008 26,276 28,133 28,374
Net debt 8,460 8,242 7,868 7,092 7,352 6,957 5,286
Ratios
OIBD margin 18.9% 19.0% 18.0% 17.7% 18.3% 18.1% 19.4%
OI margin 11.8% 12.2% 11.4% 11.4% 12.5% 12.6% 13.7%
Net debt / equity (gearing) 76.9% 64.0% 58.0% 51.7% 58.7% 48.8% 33.1%
Net debt / OIBD 4.02x 3.68x 3.39x 2.86x 3.31x 3.04x 2.02x
1) The Managing Board and Supervisory Board will propose to the Annual General Meeting on 4 May 2016 the distribution of a cash dividend of €1.30.

Overview of Group areas
Figures in €m 2009 2010 2011 2012 2013 2014 2015
Western and Northern Europe
Revenue 3,848 3,811 4,318 4,201 3,779 4,012 4,196
Operating income before depreciation 687 683 734 578 524 562 672
Investments in property, plant, and equipment 248 178 193 177 178 188 249
Employees as at 31 December 14,640 14,302 13,693 13,438 11,882 12,441 13,818
Eastern Europe-Central Asia
Revenue 1,282 1,138 1,392 1,435 1,243 1,182 1,097
Operating income before depreciation 361 299 327 319 259 230 207
Investments in property, plant, and equipment 270 202 240 181 122 95 93
Employees as at 31 December 9,481 9,959 9,693 9,435 8,696 8,453 8,177
North America
Revenue 2,892 3,033 3,035 3,441 2,766 3,049 3,746
Operating income before depreciation 340 448 473 572 555 610 829
Investments in property, plant, and equipment 152 146 159 162 181 214 263
Employees as at 31 December 12,601 11,899 11,586 11,001 7,513 7,644 7,658
Asia-Pacific
Revenue 2,211 2,609 2,957 3,477 2,877 2,818 2,775
Operating income before depreciation 612 718 711 887 778 743 719
Investments in property, plant, and equipment 96 174 215 231 245 322 247
Employees as at 31 December 14,030 13,682 14,039 14,686 14,133 13,482 13,029
Africa-Mediterranean Basin
Revenue 837 938 1,023 1,135 949 910 1,008
Operating income before depreciation 157 156 164 204 195 213 260
Investments in property, plant, and equipment 28 34 67 80 135 122 56
Employees as at 31 December 2,499 3,539 3,460 3,349 2,885 2,811 2,690
Group Services
Revenue 475 709 652 828 941 1,077 1,060
Operating income before depreciation 30 20 11 22 21 27 25
Investments in property, plant, and equipment
Employees as at 31 December 51 55 55 57 61 79 81

Financial highlights | Overview of Group areas
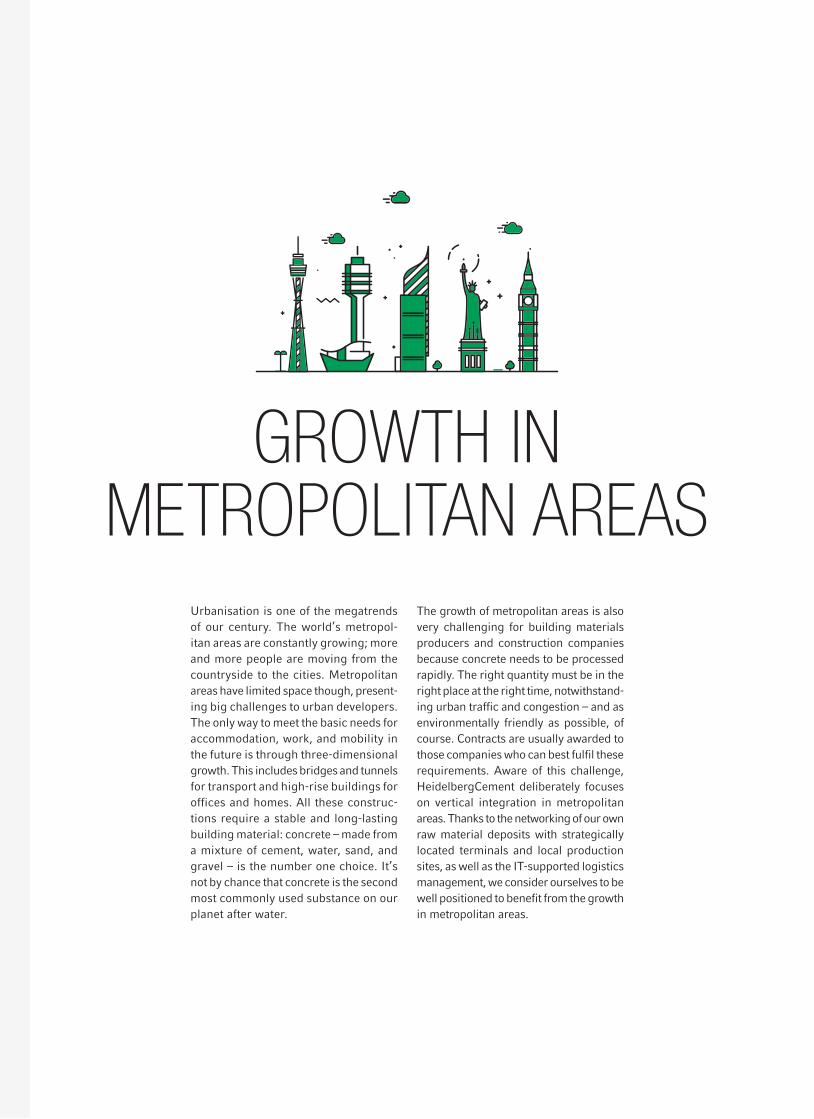
The growth of metropolitan areas is also very challenging for building materials producers and construction companies because concrete needs to be processed rapidly. The right quantity must be in the right place at the right time, notwithstand-ing urban traffic and congestion – and as environmentally friendly as possible, of course. Contracts are usually awarded to those companies who can best fulfil these requirements. Aware of this challenge, HeidelbergCement deliberately focuses on vertical integration in metropolitan areas. Thanks to the networking of our own raw material deposits with strategically located terminals and local production sites, as well as the IT-supported logistics management, we consider ourselves to be well positioned to benefit from the growth in metropolitan areas.
Urbanisation is one of the megatrends of our century. The world’s metropol-itan areas are constantly growing; more and more people are moving from the countryside to the cities. Metropolitan areas have limited space though, present-ing big challenges to urban developers. The only way to meet the basic needs for accommodation, work, and mobility in the future is through three-dimensional growth. This includes bridges and tunnels for transport and high-rise buildings for offices and homes. All these construc-tions require a stable and long-lasting building material: concrete – made from a mixture of cement, water, sand, and gravel – is the number one choice. It’s not by chance that concrete is the second most commonly used substance on our planet after water.
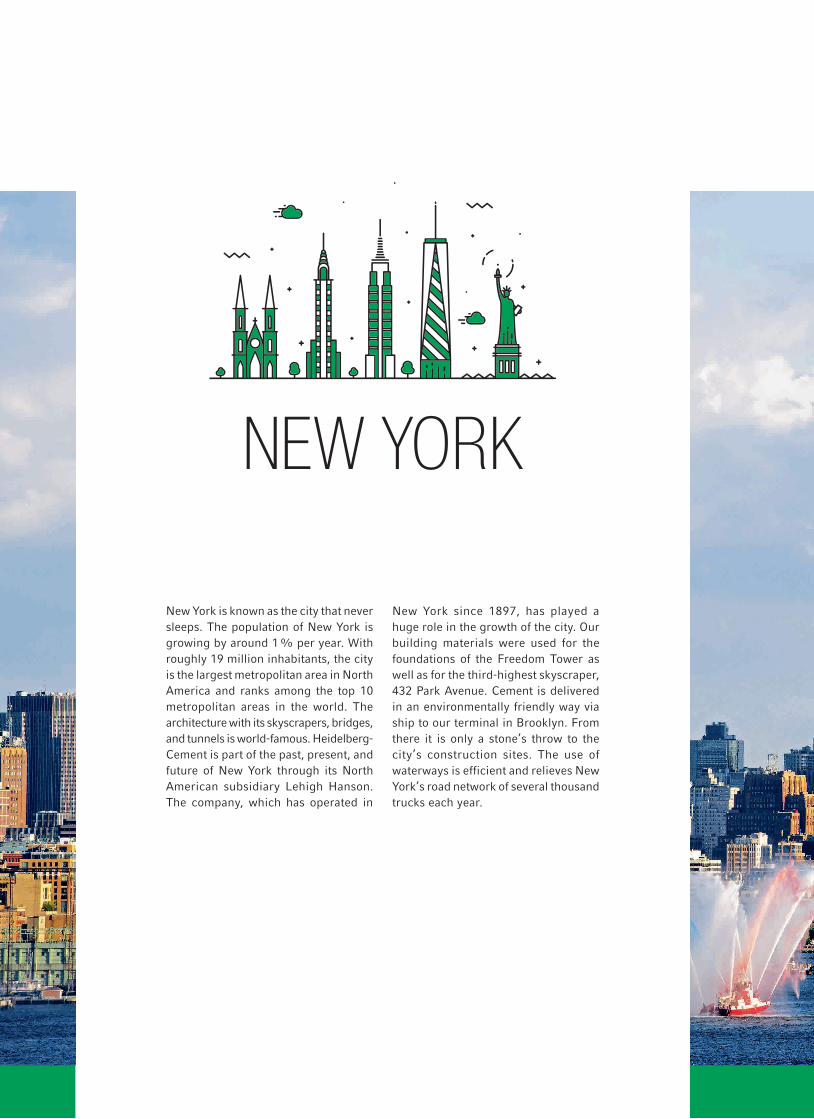
New York since 1897, has played a huge role in the growth of the city. Our building materials were used for the foundations of the Freedom Tower as well as for the third-highest skyscraper, 432 Park Avenue. Cement is delivered in an environmentally friendly way via ship to our terminal in Brooklyn. From there it is only a stone’s throw to the city’s construction sites. The use of waterways is efficient and relieves New York’s road network of several thousand trucks each year.
New York is known as the city that never sleeps. The population of New York is growing by around 1% per year. With roughly 19 million inhabitants, the city is the largest metropolitan area in North America and ranks among the top 10 metropolitan areas in the world. The architecture with its skyscrapers, bridges, and tunnels is world-famous. Heidel berg-Cement is part of the past, present, and future of New York through its North American subsidiary Lehigh Hanson. The company, which has operated in

19 million 17,405 km2 390 km (underground)approx. 1 % per year

with rail connections, 12 ready-mixed concrete plants, 3 asphalt plants, and 4 quay installations on the Thames and Medway, Hanson is fully integrated and therefore the preferred supplier for large-scale projects, such as the underground expansion. Innovative logistics concepts are also applied: A new record was already set in 2014 by pumping concrete over a distance of 1.3 km to a construction site. This is environmentally friendly and relieves the metropolitan area of some of its heavy traffic.
With 13.6 million inhabitants, London is the largest metropolitan area in the European Union. Its population is grow-ing by around 1.7% per year. Several striking skyscrapers have appeared on the London skyline in recent years, and others are being built. Even below the surface there is a lot going on: the underground system is being extended, and a major new sewage tunnel is under construction. Our subsidiary Hanson is the leading building materials supplier in the metropolitan area. With 1 cement terminal and 3 aggregates terminals

13.6 million 8,382 km2 402 km (underground)approx. 1.7 % per year
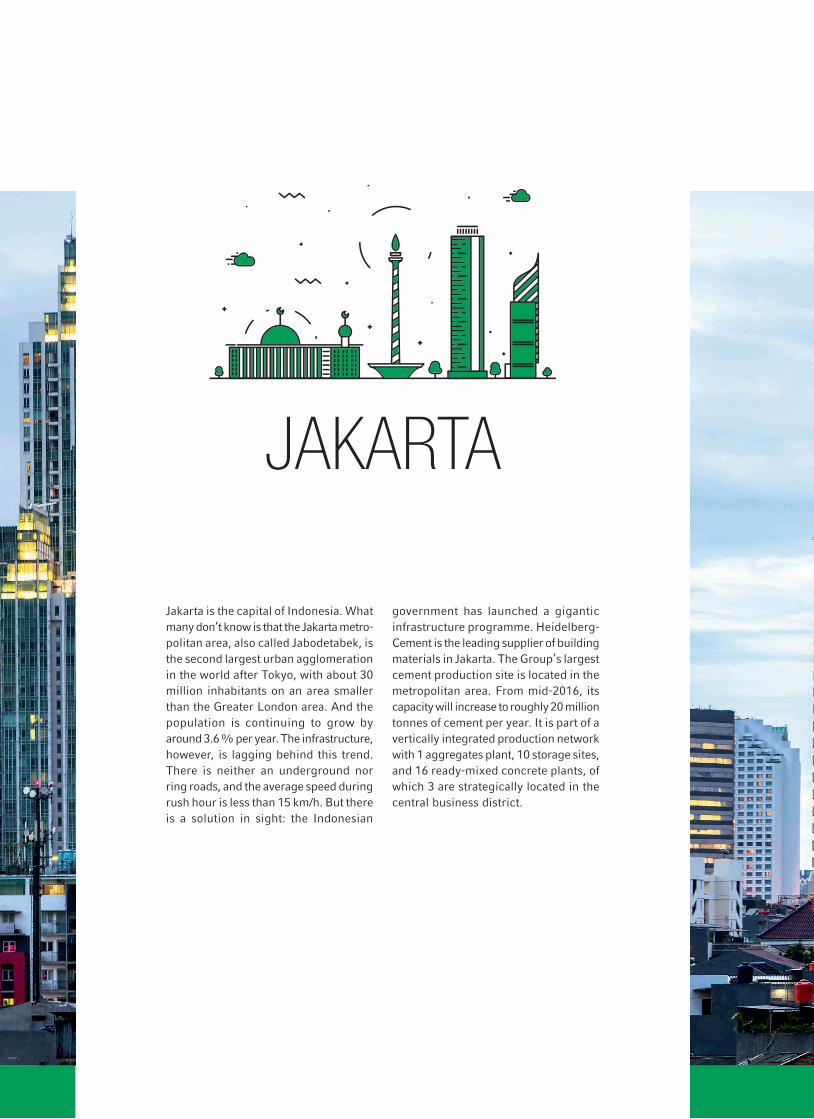
government has launched a gigantic infra structure programme. Heidelberg-Cement is the leading supplier of building materials in Jakarta. The Group’s largest cement production site is located in the metropolitan area. From mid-2016, its capacity will increase to roughly 20 million tonnes of cement per year. It is part of a vertically integrated production network with 1 aggregates plant, 10 storage sites, and 16 ready-mixed concrete plants, of which 3 are strategically located in the central business district.
Jakarta is the capital of Indonesia. What many don’t know is that the Jakarta metro-politan area, also called Jabodetabek, is the second largest urban agglomeration in the world after Tokyo, with about 30 million inhabitants on an area smaller than the Greater London area. And the population is continuing to grow by around 3.6% per year. The infrastructure, however, is lagging behind this trend. There is neither an underground nor ring roads, and the average speed during rush hour is less than 15 km/h. But there is a solution in sight: the Indonesian

30 million 7,315 km2 125 km (regional train)approx. 3.6 % per year

remedy the situation, the Dar es Salaam Metropolitan Development Project was started in 2012. In a first step, an efficient bus network is to be established, which should reduce the high number of mini-buses and relieve the road network. With its subsidiary TPCC (Tanzania Portland Cement Company), HeidelbergCement is the leading local cement supplier. TPCC has over 17 sales outlets in the city and supplies the most significant city development projects.
With just under 5 million inhabitants, Dar es Salaam is the biggest city in Tan-zania and the third largest in Africa. At around 4.4%, the annual growth rate is relatively high. This makes Dar es Salaam one of the ten fastest-growing cities in the world. By 2030, the population is expected to increase to 10 million. The city’s harbour is the largest on the East African coast. The infrastructure of Dar es Salaam can barely cope with the rapid growth and associated traffic volume. To

5 million 2,764 km2 21 km (bus)approx. 4.4 % per year

further expansion. HeidelbergCement is represented locally with its subsidiary Hanson Australia and a 50% participa-tion in market leader Cement Australia. All in all, we have a strong vertically integrated position in the metropolitan area of Sydney and in the state of New South Wales: 71 ready-mixed concrete plants, 15 aggregates plants, and 1 cement grinding plant produce building materials that are supplied to construction sites by around 400 ready-mix trucks.
With just over 4.6 million inhabitants, Sydney is the largest city in Australia and the capital of the state of New South Wales. Its landmarks are known throughout the world: the sail-shaped opera house and the harbour bridge. Australia is a popular country of immigration, and Sydney has experienced annual growth of around 1.6% in recent years. The city’s public transport consists almost exclusively of buses. The tram service was put back into operation in 1997 and is slated for

4.6 million 12,368 km2 140 km (bus and tram)approx. 1.6 % per year

Review
2015Extension of partnership with BirdLife InternationalOver the next three years, the partnership is to be extended to Asia and Africa and the cooperation broadened: from the preservation and promotion of local biological diversity and the restoration of quarrying sites through to extensive environmental and resource management.
Sale of building products business concludedThrough the sale of the building products business line in the United Kingdom and North America (excluding western Canada), the Group receives €1,265 million, which are used to significantly reduce liabilities. As a result, HeidelbergCement clearly exceeds its self-imposed goals.
New strategic priorities and financial targets for the next five yearsHeidelbergCement intends to stimulate growth in earnings through significant operational leverage, cost leadership, vertical integration, and a superior geographical presence. The allocation of capital is to focus on higher shareholder returns and growth in attractive markets.
Accelerated growth through the takeover of ItalcementiHeidelbergCement signs an agreement with Italmobiliare to acquire 45% of Italcementi. Once the anticipated approval by antitrust authorities is given in the first half of 2016, a public mandatory offer will be proposed to the remaining shareholders. With this purchase, HeidelbergCement gains a valuable portfolio of production sites in 22 countries, which perfectly complements its activities in geographical and operational terms.
Quarry Life Award 2016 competition startedThe third edition of this competition takes place in over 20 countries in Europe, Africa, Central Asia, and Asia-Pacific. Pupils, students, scientists, and non-governmental organisations are invited to submit their project proposals for the preservation and promotion of biodiversity.
Sale of lime operating line in Germany concluded With the sale of the non-core lime activities, HeidelbergCement focuses on its core products cement and aggregates as well as concrete. The sales proceeds are used to finance the acquisition of Italcementi.
Generation shift within the Managing Board – new Group areas In the context of long-term succession planning and due to the required reorganisation of the Group areas in connection with the acquisition of Italcementi, three new members aged between 45 and 48 are appointed to the Managing Board from February 2016. Longstanding Managing Board members Daniel Gauthier and Andreas Kern will retire at the end of June 2016.
A leader in climate reportingCDP honours HeidelbergCement as “Sector Leader Energy & Materials” in the DACH region (Germany, Austria, Switzerland). With a rating of 99 A-, HeidelbergCement is one of the top five companies of the industry in these three countries and one of the top ten in the DAX.
Q1
Q2
Q3
Q4

To our shareholders 20 Letter to the shareholders 25 Report of the Supervisory Board 34 Managing Board 36 HeidelbergCement in the capital market
Combined management report of HeidelbergCement Group and HeidelbergCement AG 44 Fundamentals of the Group 55 2015 economic report 91 Additional statements 96 Sustainability 97 Employees and society 105 Environmental responsibility109 Procurement110 Outlook121 Risk and opportunity report
Corporate Governance 1)
142 Corporate Governance statement148 Remuneration report162 Supervisory Board and Managing Board
Consolidated financial statements171 Consolidated income statement172 Consolidated statement of comprehensive income173 Consolidated statement of cash flows174 Consolidated balance sheet176 Consolidated statement of changes in equity178 Segment reporting/part of the Notes180 Notes to the 2015 consolidated financial statements280 Audit opinion281 Responsibility statement
Additional information284 Global functions and Country Managers286 Glossary288 ImprintBack Cover: Cement capacities and aggregates reserves
1) Part of the combined management report of HeidelbergCement Group and HeidelbergCement AG
1
2
3
4
5
Contents

To our shareholders
1
18 HeidelbergCement | Annual Report 2015

20 Letter to the shareholders 25 Report of the Supervisory Board 34 Managing Board 36 HeidelbergCement in the capital market36 Overview36 Development of the HeidelbergCement share38 Earnings per share38 Dividend38 Shareholder structure and trading volume40 Bonds and credit ratings40 Investor Relations
19HeidelbergCement | Annual Report 2015
Com
bine
d m
anag
emen
t re
port
Cor
pora
te G
over
nanc
eC
onso
lidat
ed f
inan
cial
sta
tem
ents
Add
itio
nal i
nfor
mat
ion
To o
ur s
hare
hold
ers
2
3
4
5
1

Dear Shareholders, Dear Employees and Friends of HeidelbergCement,
In 2015, HeidelbergCement once again delivered what it had promised at the start of the financial year:
– We have substantially increased the operating income and operating margin in all business lines, as well as profit for the financial year and earnings per share.
– With the closing of the sale of our building products business, we have consistently and successfully implemented our strategy of focusing on our core business.
– We have reduced net debt to a level significantly below our target value of €6.5 billion and clearly improved the dynamic gearing ratio to 2.0x.
– For the first time since the start of the financial crisis, we have once again earned a premium on our cost of capital.
We are proud of our achievements in 2015, because we faced a number of challenges across the world in the past year: The global economy grew at a much lower rate than originally expected due to the economic weakness in the emerging countries. The number and the intensity of geo-political tensions in particular continued to increase. The situation on the currency, financial, and raw material markets was characterised by high volatility and partly extreme nervousness. The world has become more complex. Past experience is now only of limited use. In general, the political and macroeconomic risks rose considerably.
For the capital markets, 2015 was a volatile but overall successful year. The HeidelbergCement share performed well, and at €75.62 at the end of December 2015 was 28.6% higher than the closing price of 2014. We clearly outperformed the German benchmark index DAX (2015: +9.6%) for the second time in succession and the international MSCI World Construction Materials Index (2015: +1.1%) for the third time in a row. It is also encouraging to note that the proportion of German shareholders in our Group has further increased. The stability of the shareholder structure has continued to improve. It corresponds more and more to the long-term and sustainable orientation of our business model.
2015 – the best year since the financial crisisIt is not only in operational terms that 2015 was by far the best year for HeidelbergCement since the financial crisis. All other key financial ratios also improved considerably in comparison with the previous year.
In 2015, HeidelbergCement’s Group revenue increased to €13.5 billion, corresponding to a growth rate of 6.7%. After adjustment for exchange rate effects and changes in the scope of consolidation, revenue was at the level of the previous year.
Operating income rose by €251 million (+15.7%) to €1.8 billion. Adjusted for exchange rate and consolidation effects, the increase amounted to 9.9%.
The additional ordinary result improved by €51 million in comparison with the previous year.
20 HeidelbergCement | Annual Report 2015
To our shareholders1

The financial result improved by €79 million to €-550 million, which reflects lower interest expenses and the elimination of burdens in the other financial result as well as in foreign exchange losses. Profit for the financial year rose by €296 million to €983 million and earnings per share from €2.59 to €4.26. At 65%, the increase in earnings per share was around ten times higher than the increase in revenue. This shows that we have delivered the profitable growth as promised!
At around €5.3 billion, we have reduced net debt to a level significantly below our target value of €6.5 billion. Accordingly, the dynamic gearing ratio of 2.0x lies well below the target of 2.5x that was communicated to the capital market.
Thanks to the sharp rise in results and disciplined financial management, we have earned a premium on our cost of capital for the first time since the start of the financial crisis.
In view of the positive development of our business and the considerable growth in profit for the financial year, the Managing Board and Supervisory Board will propose to the Annual General Meeting on 4 May 2016 an increase in the dividend from €0.75 per share to €1.30 per share, corresponding to a rise of 73%. With this dividend proposal, we are within the target payout ratio for 2015 of 30% to 35% that was communicated to the capital market.
Focus on sustainabilityWe believe that operational strength and measures for the sustainable development of our business activity go hand in hand. In the area of occupational health and safety, we have tightened our Group guidelines and introduced a number of mandatory basic rules. Although we were able to record a substantial decline in the frequency of accidents on a comparable basis across all business lines, we must continue to intensify our efforts concerning occupational safety in order to permanently prevent accidents.
Dr. Bernd Scheifele, Chairman of the Managing Board
21HeidelbergCement | Annual Report 2015
Letter to the shareholders
Report of the Supervisory Board
Managing Board
HeidelbergCement in the capital market
Com
bine
d m
anag
emen
t re
port
Cor
pora
te G
over
nanc
eC
onso
lidat
ed f
inan
cial
sta
tem
ents
Add
itio
nal i
nfor
mat
ion
To o
ur s
hare
hold
ers
2
3
4
5
1

One point of focus in 2015 was climate protection and the avoidance of CO2 emissions. In the course of the financial year, HeidelbergCement significantly intensified its commitment to develop technologies for the storage or utilisation of CO2 as raw material and has entered into promising new cooperations, thereby putting ourselves at the head of this movement in the cement industry. Thanks to our achievements in climate protection and reporting, the Carbon Disclosure Project (CDP) recognised us one of the five best companies in the energy and raw materials sector in the Germany, Austria, and Switzerland region in 2015.
Following the very positive experiences of recent years, we launched the Quarry Life Award – our international competition for the promotion of biodiversity in our quarries and aggregate pits – for the third time in 2015. Around the world, 69 locations in 22 countries will open their doors to allow pupils, students, and scientists to carry out research projects related to biodiversity. Prizes will be awarded to the best projects at a national and international level at the end of 2016. The global competition supports the development of new ideas for the preservation and promotion of biodiversity at quarrying sites and raises public awareness of this important topic.
Thanks to our employeesOur employees all over the world had to face many challenges in 2015. Their strong personal dedication and unconditional loyalty to our Group are major strengths of HeidelbergCement. On behalf of myself and my colleagues on the Managing Board, I would like to express my sincere thanks and appreciation. I would also like to the thank employee representatives, who in line with the HeidelbergCement philosophy cooperated very closely, openly, and trustingly with the Managing Board for the benefit of our Group.
Strong global management team/rejuvenation of the Managing BoardAs in previous years, I would like to personally thank and express my utmost appreciation to our managers in the operating units as well as the staff functions. Without them, the excellent perfor-mance in 2015 – especially in comparison with our competitors – would not have been possible.
The success of our Group is first and foremost based on the performance of a strong, global management team. There are two key pillars: Firstly, the very distinct corporate culture that focuses on the key success factors of HeidelbergCement, namely customer and employee orientation, long-term thinking, performance and results orientation, along with comprehensive cost management and strong execution skills. Secondly, the very international composition of our management team with its different personalities, competences, and cultural backgrounds that mirrors our global presence, our customer structure, and our core business lines. As a result, we are often able to respond more quickly and more flexibly than our competitors to global challenges and local market changes. Our common aspiration therefore remains the same: we want to be the best-managed company in our industry! That is what we work on every day, in all the countries in which we operate.
Excellently managed companies stand out, particularly through their timely and well-prepared approach to succession planning at the top management level. The Supervisory Board there-fore accepted my request at the start of 2015 and appointed Dr. Dominik von Achten as Deputy Chairman. We are now carrying out the next steps.
22 HeidelbergCement | Annual Report 2015
To our shareholders1

Long-term and highly respected Managing Board members Daniel Gauthier and Andreas Kern will leave the Managing Board on 30 June 2016. I would like to offer my sincere thanks to both colleagues for their excellent and very successful cooperation over the last eleven years. Without their tireless and successful commitment, the positive development of HeidelbergCement would not have been possible.
With Kevin Gluskie, Hakan Gurdal, and Jon Morrish, a younger generation is joining the Managing Board. All three new colleagues have decades of experience in our core business lines and have been very successful in a variety of leadership positions at HeidelbergCement. The appointment of international candidates reflects even better the global business activity of HeidelbergCement in the Managing Board.
I am convinced that we will consistently pursue the successful course of recent years with the new members of the Managing Board, and I am looking forward to our cooperation.
New strategic priorities: shareholder returns and growthThanks to the good business development in the last two years and the profitable sale of our building materials business, we have fully achieved the three strategic goals communicated in 2011: cost leadership, debt reduction, and investment in growth markets.
At the Capital Markets Day in London on 10 June 2015, we therefore announced new strategic priorities: “shareholder returns” and “continuous growth”. In specific terms, this means that we intend to put the emphasis of capital allocation on higher income for our shareholders and growth opportunities.
The focus is on the following items:– increase in free cash flow,– continuous growth,– attractive rate of return for our shareholders.
Key prerequisites for the achievement of these goals are investment discipline, a solid investment grade rating, and a progressive dividend policy. Furthermore, we are concentrating on four strategic levers: high operating leverage, maintenance of cost leadership, vertical integration, and optimal geographical positioning. In this way we will increase our efficiency and the satisfaction of our customers, especially in the world’s rapidly growing metropolitan areas.
We are convinced that we will be able to create long-term shareholder returns through continuous growth with sound judgement. In July 2015, we therefore used the opportunity to acquire Italcementi, one of the leading international cement companies. Italcementi and HeidelbergCement complement each other perfectly from a geographical perspective. With the takeover, we clearly strengthen our market position in the North America, Europe, Africa, and Asia core regions. At the same time, we expand our global leadership in the aggregates business line and are becoming a strong world number two in the cement industry. HeidelbergCement is thus excellently positioned from a strategic point of view. In our core business lines aggregates, cement, and ready-mixed concrete, we will occupy first, second, and third place on a global scale! We estimate the annual synergies from the integration of Italcementi to amount to around €400 million. Moreover, we are convinced that we will be able to create sustainable value for our shareholders with this acquisition.
23HeidelbergCement | Annual Report 2015
Letter to the shareholders
Report of the Supervisory Board
Managing Board
HeidelbergCement in the capital market
Com
bine
d m
anag
emen
t re
port
Cor
pora
te G
over
nanc
eC
onso
lidat
ed f
inan
cial
sta
tem
ents
Add
itio
nal i
nfor
mat
ion
To o
ur s
hare
hold
ers
2
3
4
5
1

Outlook for 2016We are cautiously optimistic about 2016: While the outlook for the global economy is positive, there are major macroeconomic and particularly geopolitical risks. An escalation of the political conflicts in the Middle East or Ukraine could have a negative impact on the business environment. The economic development in China has to be closely monitored. A further interest rate rise in the USA could lead to significant devaluations of the currencies in emerging countries.
However, HeidelbergCement will benefit from the good and stable economic development in the industrial countries, especially in the USA, the United Kingdom, Germany, Northern Europe, and Australia. These countries generate approximately 60% of our revenue. In the growth markets, we will extend our market position through the commissioning of new capacities and further improve cost efficiency. Overall, we expect an increase in the sales volumes of our core products cement, aggregates, and ready-mixed concrete.
With regard to costs, we expect a slight decline in energy and raw material prices and a moderate growth in personnel costs.
Our global programmes to optimise costs and processes and to increase margins will once again be consistently pursued in 2016. These include, in particular, the Continuous Improvement Programmes for the aggregates (“Aggregates CI”) and cement (“CIP”) business lines, as well as “FOX” for purchasing. We expect these three programmes to contribute significantly to the improvement in results.
On the basis of these assumptions, the Managing Board has set the goal of moderately increasing revenue and operating income before exchange rate and consolidation effects.
HeidelbergCement is on track. With the acquisition of Italcementi, we are strengthening our global market position in an ideal manner. In the next few years, we intend to consistently develop the characteristics that set HeidelbergCement apart from the competitors: cost leadership and operational excellence. At the same time, we plan to achieve a sustainable level of earnings power for shareholders that is unprecedented in the Group.
Yours sincerely,
Dr. Bernd ScheifeleChairman of the Managing Board
Heidelberg, 17 March 2016
24 HeidelbergCement | Annual Report 2015
To our shareholders1

Report of the Supervisory Board
Ladies and Gentlemen,
The 2015 financial year as a whole developed very positively. HeidelbergCement was able to benefit from the economic recovery in the USA and the United Kingdom, in particular, as well as the growth in several emerging countries, especially in Africa. The Group programmes that were launched in recent years to improve margins and operational efficiency have continued success-fully. Furthermore, price increases were implemented in key markets, and energy costs declined slightly. The weakening of the euro also supported the development of revenue and results. Despite a slowdown in the global economy in the second half of 2015, HeidelbergCement was able, as originally anticipated, to considerably increase its results and further improve its operating margin.
Thanks to the successful completion of the sale of the building products business lines in North America and the United Kingdom and of the lime business in Germany, in addition to the operational strength and disciplined cash flow management, it was possible to significantly reduce the net debt by the end of the year. HeidelbergCement therefore attained key financial ratios that correspond to an investment grade rating.
In 2015, the Group met the objectives that it had set itself during the financial crisis. A logical consequence was therefore the formulation and announcement of new, medium-term strategic priorities and financial targets that focus on shareholder returns and growth.
Fritz-Jürgen Heckmann, Chairman of the Supervisory Board
25HeidelbergCement | Annual Report 2015
Managing Board
HeidelbergCement in the capital market
Letter to the shareholders
Report of the Supervisory Board
Com
bine
d m
anag
emen
t re
port
Cor
pora
te G
over
nanc
eC
onso
lidat
ed f
inan
cial
sta
tem
ents
Add
itio
nal i
nfor
mat
ion
To o
ur s
hare
hold
ers
2
3
4
5
1

The planned takeover of Italcementi is consistent with these new priorities. HeidelbergCement and Italcementi complement each other excellently from a geographical perspective and have a high level of industrial expertise. HeidelbergCement is thus setting the course for accelerated growth and is well positioned to increase shareholder returns. Consultation and monitoringThe Supervisory Board firmly supported the aforementioned measures and discussed them with the Managing Board at the ordinary and extraordinary meetings of the plenary session and its committees as well as through contact outside the scheduled meetings. Additionally, it received regular and detailed reports, both in writing and verbally, about the intended business policies, fundamental issues regarding financial, investment, and personnel planning, the progress of business, and the profitability of the Group. All deviations of the actual business development from the plans were explained in detail by the Managing Board. In particular, the Managing Board agreed the Group’s strategy with the Supervisory Board. The Supervisory Board was directly involved in all decisions of fundamental importance to the Group. Investment projects and financing matters requiring authorisation were presented by the Managing Board and discussed before decisions were made. The Supervisory Board is satisfied that the Managing Board has installed an effective risk management system capable of recognising at an early stage any developments that could jeopardise the survival of the Group. The Supervisory Board has also had this certified by the auditor. Furthermore, it is satisfied as to the expansion and effectiveness of the compliance pro-gramme, which guarantees Group-wide compliance with the law and with internal guidelines. In the relevant meetings, the responsible line managers of the Group below Managing Board level were available together with members of the Managing Board to provide information to the Audit Committee and to answer questions. Outside the scheduled meetings and without the participation of the Managing Board, the Chairman of the Supervisory Board and the Chairman of the Audit Committee discussed topics relating to the audit in detail with the auditor. The Chairman of the Supervisory Board was also in regular contact with the Chairman of the Managing Board outside the scheduled meetings. In summary, it is evident that the Supervisory Board has duly fulfilled the duties incumbent upon it under the law, the Articles of Association, the Rules of Procedure, and the Corporate Governance Code.
Topics of discussion in the meetings of the Supervisory Board and its committeesThe plenary session of the Supervisory Board convened at five ordinary and three extraordinary meetings. The Audit Committee met twice. The Personnel Committee held two ordinary and two extraordinary meetings. The Nomination Committee and the Arbitration Committee, formed in accordance with § 27, section 3 of the German Codetermination Law, did not need to meet. In addition, the Audit Committee held three conference calls to discuss the relevant quarterly reports in detail prior to their publication. The results of the committees’ meetings were reported at the subsequent plenary sessions. Members of the Supervisory Board and its committees are listed in the Corporate Governance chapter on page 162 f.
There was an attendance rate of 94.8% at the eight plenary sessions in February, March, May, July, September (two meetings), October, and November; the average attendance at the committees’ meetings held in the reporting year was 94.4%, thereby slightly exceeding the already very high attendance rate of the Supervisory Board in the previous year. The sessions in the first half of 2015 dealt, amongst other things, with the adoption of the 2014 annual financial statements and consolidated financial statements, the approval of the 2015 operating plan, and preparations for the 2015 Annual General Meeting, in addition to reporting on the business trends and status of financial liabilities, as well as resolutions on Corporate Governance issues, including decisions on the variable elements of the Managing Board remuneration.
26 HeidelbergCement | Annual Report 2015
To our shareholders1

When discussing corporate development projects in its February meeting, the Supervisory Board once again addressed the sale of the building products business line in North America and the United Kingdom to a subsidiary of Lone Star Funds for US$1.4 billion, which was made public shortly before Christmas 2014. Following renewed analysis, the Supervisory Board encouraged the Managing Board in its decision on the sale of the business line, which was concluded in mid-March 2015.
The consultation and resolution in the Supervisory Board centred particularly on the acquisition of a 45% stake from Italmobiliare S.p.A. in international building materials company Italcementi, headquartered in Italy, which is held by founding family Pesenti. To this end, the Supervisory Board held an extraordinary meeting on 28 July 2015, in which it discussed extensively with the Managing Board the background and details of the two-stage transaction, its financing, the regulatory situation, and the takeover bid to be made to all shareholders of Italcementi after the stake purchase. The planned full acquisition of Italcementi is to take place with the acquisition of the controlling 45% stake from Italmobiliare in a first step and with the takeover of all shares tendered in the subsequent takeover bid in a second step. Assuming the acquisition of all Italcementi shares is carried out against cash payment, the total investment for the planned takeover of Italcementi will amount to €3.7 billion, whereby payment to vendor Italmobiliare is to be carried out by means of cash (approximately €1 billion) and the transfer of new HeidelbergCement shares on completion of the transaction. A minimum of 7.75 million and a maximum of 10.5 million HeidelbergCement shares will be issued from the existing Authorised Capital II in return for contributions in kind at a minimum rate of €72.50 per share. The Managing Board and Supervisory Board have assured themselves of the adequacy of the transaction price and transaction structure by obtaining two independent “fairness opinions” from well-known credit institutes, among other things. On the one hand, the financing of the share acquisition via a balanced mix of company capital and outside funds limits the financing risks in the current low-interest environment, thereby balancing the interests of the suppliers of equity and outside capital to HeidelbergCement in an advantageous manner. On the other hand, it enables the Pesenti family to continue its desired involvement in the international building materials industry. The Supervisory Board is convinced that the involvement of a new key shareholder with industry expertise and a long-term view will support the integration of Italcementi and the growth of HeidelbergCement for the benefit of the Group and all shareholders. The Supervisory Board therefore approved the capital increase in kind by using Authorised Capital II to complete the transaction.
With the takeover of Italcementi, HeidelbergCement acquires leading market positions in Europe, primarily in Italy, France, Spain, Bulgaria, and Greece, and expands its existing commitment in Africa to include Egypt and Morocco. Furthermore, the market positions in Asia (India, Thailand, and Sri Lanka) and North America including Eastern Canada are strengthened or significantly expanded. The completion of the transaction and the execution of the ensuing takeover bid to the Italcementi shareholders, after the antitrust authorities in Morocco, India, Canada, and Kazakhstan have already given their approval, are still subject to approval by the European Commission and US antitrust authority FTC.
The Managing Board prepared and compiled information about the transaction with particular care, so that the Supervisory Board had recourse to all options and alternative courses of action when making its decision. Following extensive discussion, the Supervisory Board unanimously agreed that, in light of the current low financing costs, the takeover of Italcementi will enable new attractive markets to be acquired and existing positions in India, North America, and Kazakhstan
27HeidelbergCement | Annual Report 2015
Letter to the shareholders
Report of the Supervisory Board
Managing Board
HeidelbergCement in the capital market
Com
bine
d m
anag
emen
t re
port
Cor
pora
te G
over
nanc
eC
onso
lidat
ed f
inan
cial
sta
tem
ents
Add
itio
nal i
nfor
mat
ion
To o
ur s
hare
hold
ers
2
3
4
5
1

to be advantageously expanded. In its extraordinary July meeting, it therefore approved the acquisition as well as the financing via a capital increase and the raising of funds from a recently completed syndicated credit line.
In addition to the Italcementi transaction, the Supervisory Board discussed the hedging of defined benefit obligations of active or retired members of the Managing Board and senior managers of the company in its extraordinary meeting of 28 July 2015. The Supervisory Board approved the conclusion of a standard market contractual trust agreement with Deutsche Treuinvest Stiftung. As a result, specific entitlements and claims of beneficiaries that lie above the insurance ceiling of the Pensionssicherungsverein (German Pension Insurance Association) are hedged by off balance sheet assets which are under the autonomous control of an independent trustee.
On 13 September 2015, the Supervisory Board held an additional extraordinary meeting that addressed, among other items, the current status of the Italcementi acquisition and the findings of the joint working groups of HeidelbergCement and Italcementi on integration planning following the completion of the transaction and on the identification of synergies. The Supervisory Board recognised that the target figure for synergies communicated at the time the transaction was announced in July 2015 has more than doubled, following a thorough examination.
During the meeting, the Supervisory Board also discussed other corporate development projects. It then approved the acquisition of certain business activities of Cemex by a joint venture in Eastern Europe (Hungary, Croatia, Bosnia-Herzegovina), as well as the purchase of an aggregates company in Australia.
Both the Supervisory Board and its Audit Committee once again addressed financing decisions during the reporting year. This included, in particular, the aforementioned conclusion of a new syndicated credit line at the end of July 2015 to ensure sufficient resources for financing the Italcementi acquisition. The credit line of €4.4 billion, which will only be used during 2016 once the acquisition has been concluded, could be reduced by €1.1 billion to €3.3 billion during the reporting year. Furthermore, in its November meeting, the Supervisory Board approved the issue of a debt certificate of €645 million, which was successfully placed on the market in January 2016. Thanks to the steadily improving credit quality of the Group, the interest margins could be considerably decreased compared with previous issues. Due to the successful issue of the debt certificate, the syndicated credit line was further reduced to €2.7 billion. The Group is very well prepared to secure financing for the Italcementi acquisition as well as for its ongoing business in the short, medium, and long term. The Supervisory Board welcomes and encourages the request of the Managing Board to refinance expiring financial instruments at current favourable interest conditions, thereby continuing to improve the financial result of the Group.
In its meetings, the Audit Committee dealt with the 2014 annual financial statements and con-solidated financial statements as well as the points of focus for the audit, the status quo reports regarding internal audit, risk management, occupational health and safety, compliance, the quarterly and half-yearly reports for the 2015 financial year, the preparation of the Supervisory Board’s proposal to the 2015 Annual General Meeting for the appointment of the auditor and Group auditor, and – after the Annual General Meeting followed this proposal – the award of the contract to the audit firm Ernst & Young for the auditing of the annual financial statements and consolidated financial statements for the 2015 financial year. In this context, it defined the points of focus for the audit. The auditors responsible for the consolidated financial statements are
28 HeidelbergCement | Annual Report 2015
To our shareholders1

Stefan Viering and Karen Somes. With the 2015 financial statements, Mr Viering has supported the audit for the fourth time. It was the first audit for Ms Somes after her cooling-off period of three years. The Audit Committee dealt also with the financing of the Italcementi transaction and further projects as well as the conclusion of the debt certificate of €645 million, and it passed appropriate preparatory resolutions for the subsequent discussion in the plenary session of the Supervisory Board.
The ordinary meetings of the Personnel Committee covered, amongst other things, the preliminary discussion and recommendation to the Supervisory Board regarding the determination of the variable Managing Board remuneration for the 2014 financial year, as well as the definition of parameters for the variable Managing Board remuneration for 2015 and 2015–2017/18, respec-tively. In its extraordinary meeting of 9 October, the Personnel Committee dealt thoroughly with the required structural changes to the Group’s organisation prior to the integration of Italcementi and the associated changes on the Managing Board. The Personnel Committee was informed about the concept of the newly defined Group areas in Europe and, in addition to approving the new Group organisation, recommended that the Supervisory Board rejuvenated the Managing Board by appointing three new, internationally experienced members as of 1 February 2016 to succeed Daniel Gauthier and Andreas Kern. Furthermore, in its extraordinary meeting of 28 July, the Personnel Committee addressed, in an advisory capacity, the aforementioned hedging of entitlements and defined benefit obligations by a trustee. Finally, the Personnel Committee assured itself that all members of the Managing Board have carried out the required individual investment in HeidelbergCement shares as part of the Managing Board remuneration system.
There were no conflicts of interest of any Supervisory Board member when dealing with topics within the Supervisory Board. There were no consulting or other contracts for services or work between any member of the Supervisory Board and the Group in the 2015 reporting year.
Corporate GovernanceThe statement of compliance in the reporting year was submitted by the Managing Board on 9 February 2015 and by the Supervisory Board on 10 February 2015. The statement of compliance for the current year was submitted by the Managing Board on 15 February 2016 and by the Supervisory Board on 16 February 2016. The complete text can be found in the section Statement of compliance in accordance with § 161 of the German Stock Company Act in the Corporate Governance chapter on page 142. The statements are made permanently available to the share-holders on the Group’s website.
In several meetings during the reporting year, the Supervisory Board addressed the recommen-dations of the current version of the Corporate Governance Code, including the reforms that came into force in June 2015, and adopted the required resolutions, in particular those regarding the target figure for the future proportion of women in the Managing Board and on the regular limit for length of membership of the Supervisory Board.
With regard to its composition and that of the Managing Board, the Supervisory Board will thoroughly comply with the guidelines of the German Corporate Governance Code regarding the principles of diversity when appointing committees and leadership positions within the Group. Regarding its own composition, it implements the diversity goals stated in the Code with the following specific objectives: The composition of the Supervisory Board is an appropriate reflection of the national and international alignment of HeidelbergCement as a leading building materials manufacturer. The Supervisory Board comprises at least three members who have been
29HeidelbergCement | Annual Report 2015
Letter to the shareholders
Report of the Supervisory Board
Managing Board
HeidelbergCement in the capital market
Com
bine
d m
anag
emen
t re
port
Cor
pora
te G
over
nanc
eC
onso
lidat
ed f
inan
cial
sta
tem
ents
Add
itio
nal i
nfor
mat
ion
To o
ur s
hare
hold
ers
2
3
4
5
1

elected by the shareholders and who are independent members in line with point 5.4.2 of the Code. The Supervisory Board shall comprise at least two women. The standard retirement age for members of the Supervisory Board is 75 years. This age also constitutes the regular limit of length of membership of the Supervisory Board. With these goals, the Supervisory Board aims to make a wide range of expertise available to the Group and to have the broadest possible pool of candidates at its disposal for the election of future Supervisory Board members.
After reconsideration, the Supervisory Board resolved on 14 September 2015 to maintain the current proportion of women in the Managing Board and to set the target figure for the proportion of women in the Managing Board by 30 June 2017 to 0%, although this specification explicitly states that the Supervisory Board is committed, as was previously the case, to take diversity into account when making personnel decisions.
The Supervisory Board welcomes and supports the Managing Board’s goal of bringing the proportion of women in management positions in the first and second leadership level below the Managing Board in line with the proportion of women employed in Germany by 2017. As a result, the proportion of women in management positions in Germany will double, from 7% in 2011 to 14% in the first leadership level and 15% in the second leadership level below the Managing Board.
As regards the remuneration structure for the members of the Managing Board for the 2015 financial year, details on remuneration of the Managing Board are included in the Corporate Governance Report on page 148 f. to avoid repetition. They describe the Managing Board remuneration system that came into force on 1 January 2011 and was adjusted on 1 January 2014.
As in 2011 and 2013, the Supervisory Board again conducted the regular efficiency review of its activities in October and November 2015, as required by the German Corporate Governance Code. Points of focus of the review were the analysis of the cooperation and distribution of tasks between the plenary session of the Supervisory Board and the committees, as well as the discussion and review of the annual financial statements by the Supervisory Board and Audit Committee. The Supervisory Board members have been extensively involved in a written survey and provided important suggestions as to how to improve the work of the Supervisory Board. The results of the review were presented and explained in detail at the November meeting of the Supervisory Board.
As in the past, following another suggestion in the Code, internal training sessions were organised for Supervisory Board members in February and November 2015. In February, the Supervisory Board dealt with product innovations in the field of building materials and the positioning of the Group in the development of alternative binders. In November, it was informed about the status and impact of audit reforms on its activities. Additional regular training sessions are planned. The Supervisory Board has thus reaffirmed its commitment to effective Corporate Governance in the Group.
Auditing and approval of annual financial statements and consolidated financial statementsBefore the contract for the auditing of the annual financial statements of the Company and the consolidated financial statements of the Group was awarded, the points of focus for the audit, the content of the audit, and the costs were discussed in detail with the auditors, Ernst & Young GmbH, Wirtschaftsprüfungsgesellschaft, Stuttgart. In February 2016, the Managing Board informed the Supervisory Board about the preliminary, unaudited key figures for the 2015 financial year and provided a status report on the financial statements work. The annual financial statements of HeidelbergCement AG, the consolidated financial statements as of 31 December 2015, and
30 HeidelbergCement | Annual Report 2015
To our shareholders1

the combined management report for the Company and the Group, as prepared by the Manag-ing Board, were examined by the independent auditors. The auditors gave the statements the unqualified audit opinion. The financial statements documents and auditors’ reports were sent to the members of the Supervisory Board. At first, the Audit Committee dealt intensively with the financial statements in the presence of the auditors. The auditors reported on the main results of their audit. Then, the Supervisory Board discussed the financial statements in detail, once again in the presence of the auditors. The Supervisory Board approved the audit results. It examined the annual financial statements and consolidated financial statements, the combined management report, as well as the Managing Board’s proposal for the use of net profit shown in the balance sheet. The results of the pre-audit conducted by the Audit Committee and the results of its own audit correspond fully to the results of the official auditor. The Supervisory Board raised no objections to the final results of this examination. The Supervisory Board has therefore approved the annual financial statements and the consolidated financial statements. The annual financial statements have thus been adopted.
The Supervisory Board approved the Managing Board’s proposal for the use of net profit, including the payout of a dividend of €1.30 per share (previous year: €0.75 per share).
Personnel matters and a note of thanksIn the 2015 reporting year, there were no changes to the personnel in the Supervisory Board.
One of the characteristics of well-managed companies is timely and careful succession planning for top management positions. In a first step, the Supervisory Board extended the Managing Board agreements of Dr. Bernd Scheifele as Chairman of the Managing Board (until 31 January 2020) and Dr. Lorenz Näger as Chief Financial Officer (until 30 September 2019). Furthermore, it resolved to amend the structure of the Managing Board to include the position of a Deputy Chairman of the Managing Board and, with effect from 1 February 2015, Dr. Dominik von Achten has been appointed Deputy Chairman of the Managing Board. In its extraordinary meeting of 9 October, the Supervisory Board discussed intensively the reorganisation of the Group structure taking into account the expanded country organisation and associated increase in personnel following the conclusion of the Italcementi transaction as well as the rejuvenation of the Managing Board, and set out the following fundamental course for the future in a second step.
The basic organisational structure of HeidelbergCement’s Group, area, and country functions was retained. The new countries which are to be added after the Italcementi transaction, however, could not be meaningfully incorporated in the existing management organisation with four Group areas. The Supervisory Board therefore resolved on a redesign of the Group areas, predominantly in Europe, which will enter into force on 1 April 2016. The new split of the Group areas is shown on page 110, the Managing Board responsibilities can be found on pages 34/35.
Against this backdrop, the Managing Board agreements of Daniel Gauthier and Andreas Kern, which expire on 30 June 2016, were not extended for reasons of age. In their place, Kevin Gluskie, Hakan Gurdal, and Jon Morrish – three long-serving and very successful, internationally experienced top managers of the Group – were appointed to the Managing Board as from 1 February 2016. Diversity within the Managing Board is thus further strengthened and the geographical and operational expansion of the Group is taken into account with lasting effect. The rejuvenation and internationalisation of the Managing Board represent a sustainable basis for the continuity that the Supervisory Board strives for in the midst of change.
31HeidelbergCement | Annual Report 2015
Managing Board
HeidelbergCement in the capital market
Letter to the shareholders
Report of the Supervisory Board
Com
bine
d m
anag
emen
t re
port
Cor
pora
te G
over
nanc
eC
onso
lidat
ed f
inan
cial
sta
tem
ents
Add
itio
nal i
nfor
mat
ion
To o
ur s
hare
hold
ers
2
3
4
5
1

The Supervisory Board is particularly indebted to Daniel Gauthier and Andreas Kern for their sixteen years of work in the Managing Board of the Group. Both gentlemen are experts in the sector and their Group areas and have provided outstanding pioneering services, for example in the countries of Eastern Europe and Central Asia, where HeidelbergCement is often one of the largest private investors in a country, or in Africa, where HeidelbergCement has meanwhile assumed stable, leading positions in numerous countries. They recognised business opportunities arising in their areas through the expansion of the Group at an early stage and took responsibility for far-reaching strategic decisions in an entrepreneurial manner. HeidelbergCement’s positioning in the international building materials markets, which is unreservedly recognised by the capital market and in specialist circles, is largely due to the acquisition and integration work of these two members of the Managing Board who will leave on 30 June 2016. Both gentlemen are carefully training their successors and gradually transferring their tasks.
In conclusion, the Supervisory Board would like to thank all employees of the Group once again for their high level of commitment and their performance for the Group in the 2015 financial year.
Heidelberg, 16 March 2016
For the Supervisory Board
Yours sincerely,
Fritz-Jürgen HeckmannChairman
32 HeidelbergCement | Annual Report 2015
To our shareholders1

33HeidelbergCement | Annual Report 2015
Managing Board
HeidelbergCement in the capital market
Letter to the shareholders
Report of the Supervisory Board
Com
bine
d m
anag
emen
t re
port
Cor
pora
te G
over
nanc
eC
onso
lidat
ed f
inan
cial
sta
tem
ents
Add
itio
nal i
nfor
mat
ion
To o
ur s
hare
hold
ers
2
3
4
5
1

Managing Board
1 DR. BERND SCHEIFELEBorn in Freiburg (Germany), aged 57 years. Studies in law at the universities of Freiburg, Dijon (France), and the University of Illinois (USA). Since 2005, Chairman of the Managing Board; in charge of Strategy & Development, Communication & Investor Relations, Human Resources, Legal, Compliance, and Internal Audit.
2 DR. LORENZ NÄGERBorn in Ravensburg (Germany), aged 55 years. Studies in business administration at the German universities of Regensburg and Mannheim and in Swansea (UK). Since 2004, member of the Manag ing Board; in charge of Finance, Group Accounting, Controlling, Taxes, Insurance & Risk Management, IT, Shared Service Center, and Logistics.
4 DR. ALBERT SCHEUERBorn in Alsfeld (Germany), aged 58 years. Studies in mechanical engineering/process technology at the Clausthal University of Technology (Germany). Since 1992 at HeidelbergCement. Member of the Managing Board since 2007; in charge of world-wide coordination of the Heidelberg Technology Center as well as the Asia-Pacific Group area until 31 March 2016; as of 1 April 2016 in charge of the Northern and Eastern Europe-Central Asia Group area.
7 JON MORRISHBorn in Shrewsbury (United Kingdom), aged 45 years. Studies in biochemistry at the University of Leeds and MBA of the Cranfield School of Management. He joined Hanson in 1999. Member of the Managing Board since 1 February 2016; as of 1 April 2016, in charge of the North America Group area.
8 HAKAN GURDALBorn in Istanbul (Turkey), aged 48 years. Studies in mechanical engineering at the Yildiz Technical Uni-versity in Istanbul and MBA International Management of the University of Istanbul. He joined Çanakkale Çimento (today part of the joint venture Akçansa) in 1992. Member of the Managing Board since 1 Feb ruary 2016; as of 1 April 2016, in charge of the Africa- Eastern Mediterranean Basin Group area.
1 2
7 8
34 HeidelbergCement | Annual Report 2015
To our shareholders1

3 DR. DOMINIK VON ACHTENBorn in Munich (Germany), aged 50 years. Studies in law and economics at the German univer sities of Freiburg and Munich. Member of the Managing Board since 2007 and Deputy Chairman of the Managing Board since 1 February 2015; in charge of Purchasing and worldwide coordination of the Competence Center Materials as well as the North America Group area until 31 March 2016; as of 1 April 2016 in charge of the Western and Southern Europe Group area.
5 DANIEL GAUTHIERBorn in Charleroi (Belgium), aged 59 years. Studies in mining engineering at the Poly technic University of Mons (Belgium). Since 1982 at CBR, the Belgian subsidiary of Heidelberg Cement. Member of the Manag ing Board since 2000; in charge of the Group areas Western and Northern Europe (without Germany), Africa-Mediter ranean Basin, and Group Services, as well as Environmental Sustain-ability. He will leave the Managing Board after expiry of his Managing Board agreement on 30 June 2016.
9 KEVIN GLUSKIEBorn in Hobart (Australia), aged 48 years. Studies in civil engineering at the University of Tasmania (Australia) and MBA of the University of Sydney. He joined Pioneer (acquired by Hanson in 2000) in 1990. Member of the Managing Board since 1 February 2016; as of 1 April 2016, in charge of the Asia-Pacific Group area.
6 ANDREAS KERNBorn in Neckarsteinach (Germany), aged 57 years. Studies in business administration at the University of Mannheim (Germany). Since 1983 at Heidelberg-Cement. Member of the Managing Board since 2000; in charge of the Eastern Europe-Central Asia Group area and Germany, Sales and Marketing, as well as worldwide coordination of secondary cementitious materials. He will leave the Managing Board after expiry of his Manag ing Board agreement on 30 June 2016.
3
4 5 6
9
35HeidelbergCement | Annual Report 2015
Letter to the shareholders
Report of the Supervisory Board
Managing Board
HeidelbergCement in the capital market
Com
bine
d m
anag
emen
t re
port
Cor
pora
te G
over
nanc
eC
onso
lidat
ed f
inan
cial
sta
tem
ents
Add
itio
nal i
nfor
mat
ion
To o
ur s
hare
hold
ers
2
3
4
5
1

HeidelbergCement in the capital market
Overview
In Germany, the HeidelbergCement share is listed for trading on the Prime Standard segment of the Frankfurt Stock Exchange and on the Regulated Market of the Stuttgart, Düsseldorf, and Munich Stock Exchanges. The HeidelbergCement share is listed in the German benchmark index DAX, making HeidelbergCement the only company in the construction and building materials industry to be recognised as one of the 30 largest listed companies in Germany.
Our share ranks among the most important building materials shares in Europe. Besides the DAX, it is also included in other indices, such as the FTSEurofirst 300 Economic Sector Index, the S&P Global 1200 Index, and the Dow Jones Construction & Materials Titans 30 Index, which comprises the 30 largest construction shares and second-tier construction shares in the world.
Development of the HeidelbergCement share
After closing at €58.81 at the end of 2014, the HeidelbergCement share recorded its annual low of €56.95 on 6 January 2015. The share price rose noticeably over the next few months, driven by a significant easing of the monetary policy of the European Central Bank (ECB), the low oil price, and the positive outlook for the US economy. Moreover, the share price was supported by our strong results in the first quarter and the confirmation of the positive outlook for 2015. As a result, the HeidelbergCement share reached its annual peak at €77.04 on 21 May 2015.
Towards the middle of the year, insecurity in the capital markets increased considerably. The contributing factors included both the weakening economy in China and uncertainty about the future of Greece in the euro zone, as well as the sanctions against Russia. During the third quarter, concerns about weaker growth in the emerging countries and the expected interest rate rise by the US Federal Reserve caused a significant drop in prices on the capital markets. Our share price also fell until the end of September.
In the fourth quarter, however, our share price experienced an increasing recovery. Compared with the DAX and the MSCI World Construction Materials Index, it rose much more strongly in the last few months of the year. Our share price was supported, among other things, by the sustained positive economic data from the USA and our good results in the third quarter. Furthermore, the increase in our synergy targets as part of the takeover of the Italian company Italcementi had a positive impact on the development of the share price. The HeidelbergCement share closed at €75.62 at the end of the year. This represented an increase of 28.6% in 2015. At 9.6%, the DAX recorded markedly lower growth in comparison. The worldwide sector index MSCI World Construction Materials Index closed the year with a plus of only 1.1%. At the end of 2015, HeidelbergCement’s market capitalisation amounted to €14.2 billion, thereby significantly exceeding the previous year’s value of €11.1 billion.
36 HeidelbergCement | Annual Report 2015
To our shareholders1

Development of the HeidelbergCement share (ISIN DE0006047004, WKN 604700)
€ 2015
Year-end share price 2014 58.81
Highest share price 77.04
Lowest share price 56.95
Year-end share price 2015 75.62
Equity per share on 31 Dec. 2015 85.02
Market value on 31 Dec. 2015 (€ ’000s) 14,210,244
Change compared with 31 Dec. 2014
HeidelbergCement share +28.6%
DAX +9.6%
MSCI World Construction Materials Index +1.1%
Performance of the HeidelbergCement share in 2015
Development of the HeidelbergCement share compared to MSCI World Construction Materials Index and DAX in 2015
Index (Base: 31 December 2014 = 100)
€80
€75
€70
€65
€60
€55DecJan Feb Mar Apr May Jun Jul Aug Sep Oct Nov
DecJan
HeidelbergCement share MSCI World Construction Materials Index DAX
140
130
120
110
100
90Feb Mar Apr May Jun Jul Aug Sep Oct Nov
37HeidelbergCement | Annual Report 2015
Managing Board
HeidelbergCement in the capital market
Letter to the shareholders
Report of the Supervisory Board
Com
bine
d m
anag
emen
t re
port
Cor
pora
te G
over
nanc
eC
onso
lidat
ed f
inan
cial
sta
tem
ents
Add
itio
nal i
nfor
mat
ion
To o
ur s
hare
hold
ers
2
3
4
5
1

Earnings per share
Earnings per share in accordance with IAS 33 for the 2015 financial year were €4.26 (previous year: 2.59). For continuing operations, earnings per share amount to €4.45 (previous year: 3.54).
The calculation of the earnings per share in accordance with IAS 33 is shown in the following table. To determine the average number of shares, additions are weighted in proportion to time. Further comments are provided in the Notes under Note 14.
Earnings per share according to IAS 33
2014 2015
Group share of profit in €m 485.7 800.1
Number of shares in ’000s (weighted average) 187,867 187,916
Earnings per share in € 2.59 4.26
Net income from continuing operations in €m – attributable to the parent entity 664.6 835.8
Earnings per share in € – continuing operations 3.54 4.45
Net income/loss from discontinued operations in €m – attributable to the parent entity -178.9 -35.7
Earnings per share in € – discontinued operations -0.95 -0.19
Dividend
In view of the overall positive business development, the Managing Board and Supervisory Board will propose to the Annual General Meeting on 4 May 2016 the distribution of a dividend of €1.30 per HeidelbergCement share.
Dividend key figures
2011 2012 2013 2014 2015
Dividend per share in € 0.35 0.47 0.60 0.75 1.30 1)
Dividend yield 2) in % 0.9 0.8 1.0 1.0 1.7
Group share of profit in €m 348.1 284.7 736.0 485.7 800.1
Dividends in €m 65.6 88.1 112.5 140.9 244.3
Payout ratio in % 18.8 30.9 15.3 29.0 30.5
1) To be proposed to the Annual General Meeting on 4 May 2016
2) Dividend per share/share price on the day of the Annual General Meeting; for the 2015 financial year: dividend per share/share price at the end of the financial year
Shareholder structure and trading volume
A shareholder study conducted in October 2015 showed a further stabilisation of the shareholder structure of HeidelbergCement in comparison with the last study from November 2014. As in previous years, we have worked to further improve our relations with investors. We were particularly pleased that we could increase the proportion of institutional investors from Germany, Switzerland, Sweden, and North America. In contrast, the proportion of investors from the United Kingdom, Ireland, and France declined. The study also showed that the proportion of hedge fund investors fell in 2015.
38 HeidelbergCement | Annual Report 2015
To our shareholders1

In October 2015, investors from Germany formed the largest investor group at 34%, followed by investors from North America at 27%, continental Europe excluding Germany at 15%, and the United Kingdom and Ireland at 11%.
As at 31 December 2015, the free float amounted to 73.80%. According to notifications available to us, Ludwig Merckle holds 26.20% of the voting rights in the company via VEMOS 2 Beteili-gungen GmbH, a company under his control.
On average, around 0.7 million HeidelbergCement shares were traded per day in Xetra trading on the Frankfurt Stock Exchange in 2015. In the Equity Indices Ranking published by Deutsche Börse, our share was in place 27 at the end of 2015 for the free float market capitalisation criterion and in place 28 for order book turnover.
Geographical distribution of shareholders (as of October 2015)
Shareholder structure
31 Dec. 2015
VEMOS 2 Beteiligungen GmbH, Zossen/Germany (20 October 2015) (thereof 26.20% pursuant to sections 21, 22 WpHG and 0.001% pursuant to sec. 25a WpHG). VEMOS 2 Beteiligungen GmbH is controlled by Mr Ludwig Merckle. Mr Ludwig Merckle himself notified us on 9 December 2014 that he held directly and indirectly 25.34% of the voting rights. 26.20%
Free float 73.80%
Comprising:
Stephen A. Schwarzman/USA1) and Maximilian Management LLC, Wilmington, Delaware/USA1) (via First Eagle Investment Management, LLC, New York/USA1)) (1 December 2015) 7.34%
The Capital Group Companies, Inc., Los Angeles/USA 1) (28 August 2015)At this date, no individual fund holds more than 3% of the voting rights 5.07%
(26 October 2015: EuroPacific Growth Fund, Los Angeles/USA: 3.03%)
BlackRock, Inc., New York/USA 1) (25 September 2014) 4.10%
Société Générale S.A., Paris/France (13 August 2015) (thereof 3.77% pursuant to sec. 25a WpHG and 0.07% pursuant to sec. 25 WpHG) 3.84%
1) Attribution in accordance with § 22 of the German Securities Trading Law (Wertpapierhandelsgesetz)
In brackets: date on which percentage exceeded or fell below a reporting threshold
HeidelbergCement AG share capital
Share capital€ ’000s
Numberof shares
1 January 2015 563,749 187,916,477
31 December 2015 563,749 187,916,477
12%
27%34%
11%Rest of the world, private investors, and unknown
North AmericaGermany
United Kingdomand Ireland
15%Continental Europe(without Germany)
39HeidelbergCement | Annual Report 2015
Letter to the shareholders
Report of the Supervisory Board
Managing Board
HeidelbergCement in the capital market
Com
bine
d m
anag
emen
t re
port
Cor
pora
te G
over
nanc
eC
onso
lidat
ed f
inan
cial
sta
tem
ents
Add
itio
nal i
nfor
mat
ion
To o
ur s
hare
hold
ers
2
3
4
5
1

Bonds and credit ratings
In recent years, HeidelbergCement has issued a series of corporate bonds under its €10 billion EMTN programme. All bonds are unsecured and rank pari passu with all other financial liabilities of HeidelbergCement. We did not issue any bonds in the 2015 financial year. Further information on our corporate bonds can be found in the Group financial management section on page 82 f.
HeidelbergCement’s credit quality is assessed by the internationally recognised rating agencies Moody’s Investors Service and Fitch Ratings. In the 2015 financial year, the credit ratings for our Group remained stable. The ratings are Ba1/Not Prime/Outlook Stable from Moody’s Investors Service and BB+/B/Outlook Stable from Fitch Ratings. Further information on HeidelbergCement’s rating and its development can be found in the Group financial management section on page 85 f.
Investor Relations
Aside from fostering existing investor relations and attracting new, long-term investors, our investor relations work in 2015 mainly focused on preparing and executing the communication of the revised, medium-term strategic priorities and financial goals of the Group, which we announced as part of a Capital Markets Day in London on 10 June 2015. Nearly 80 analysts and investors accepted the invitation to attend presentations and panel discussions. At this event, the Chairman of the Managing Board, the Chief Financial Officer, and the member of the Managing Board in charge of the North America Group area presented information about the current situation of the Group and its successful development over the last five years. They highlighted the new strategic priorities and medium-term goals and explained how HeidelbergCement would like to create more value for its shareholders in the future. The presentations shown during this event and at other conferences and visits are available on the internet, provided they contain significant changes compared with previous presentations. The Investor Relations team supported reporting on HeidelbergCement by regular discussions with analysts. The number of analysts regularly reporting on HeidelbergCement has – with 39 – remained the same since the publication of the last Annual Report.
In 2015, Institutional Investor Magazine conducted a survey that questioned over 760 portfolio managers and more than 1,100 analysts about the best investor relations work in Europe. In the construction sector, HeidelbergCement was awarded first place for the second time in a row. The Investor Relations team consistently gathered and evaluated feedback from investors following visits and conferences in order to continually improve the quality and effectiveness of our investor relations work. The results were incorporated into the ongoing development of our investor relations work, with the aim of successfully continuing open dialogue and transparent communication with the capital market and further strengthening trust in our Group and our share.
40 HeidelbergCement | Annual Report 2015
To our shareholders1

Contact us
HeidelbergCement AGGroup Communication & Investor RelationsBerliner Strasse 669120 Heidelberg Germany
Phone:
Director Group Communication & IR (Andreas Schaller): + 49 (0) 6221 481 - 13249 Head of Investor Relations – Institutional investors USA and United Kingdom (Ozan Kacar): + 49 (0) 6221 481 - 13925 Institutional investors EU and rest of the world (Steffen Schebesta, CFA): + 49 (0) 6221 481 - 39568 Private investors (Günter Wesch): + 49 (0) 6221 481 - 13256 Fax: + 49 (0) 6221 481 - 13217 E-mail: [email protected]
41HeidelbergCement | Annual Report 2015
Letter to the shareholders
Report of the Supervisory Board
Managing Board
HeidelbergCement in the capital market
Com
bine
d m
anag
emen
t re
port
Cor
pora
te G
over
nanc
eC
onso
lidat
ed f
inan
cial
sta
tem
ents
Add
itio
nal i
nfor
mat
ion
To o
ur s
hare
hold
ers
2
3
4
5
1
Combined management report of Heidelberg Cement Group and HeidelbergCement AG
2
42 HeidelbergCement | Annual Report 2015

44 Fundamentals of the Group 44 Business model 46 Strategy and targets 48 Internal management control system and indicators 50 Research and technology 55 2015 economic report 55 Economic environment 57 Relevant changes in reporting 58 Development of sales volumes 59 Earnings position 61 Non-financial key performance indicators 62 Business trend in the Group areas 77 Discontinued operations 77 Statement of cash flows 78 Investments 80 Consolidated balance sheet 82 Group financial management 86 Statements on HeidelbergCement AG 88 Evaluation of the economic situation by Group management 89 Comparison of the business trend with the previous year’s forecasts 91 Additional statements 96 Sustainability 97 Employees and society 105 Environmental responsibility 109 Procurement 110 Outlook 121 Risk and opportunity report 140 Corporate Governance
Due to rounding, numbers presented in the Annual Report may not add up precisely to the totals provided.
43HeidelbergCement | Annual Report 2015
Com
bine
d m
anag
emen
t re
port
Cor
pora
te G
over
nanc
eC
onso
lidat
ed f
inan
cial
sta
tem
ents
Add
itio
nal i
nfor
mat
ion
2
3
4
5

Fundamentals of the Group
Business model
HeidelbergCement is one of the world’s largest building materials companies and operates on five continents. Our products are used for the construction of houses, infrastructure, and commercial and industrial facilities, thus meeting the demands of a growing world population for housing, mobility, and economic development.
ProductsOur core activities include the production and distribution of cement and aggregates, the two essential raw materials for the manufacture of concrete. Our product range is substantially complemented by downstream ready-mixed concrete and asphalt activities. Furthermore, HeidelbergCement offers services such as worldwide trading in cement and coal by sea.
Our core products cement and aggregates (sand, gravel, and crushed rock) are generally homo-geneous bulk goods. Their product characteristics are standardised in order to ensure the required stability, reliability, and processability in the application.
Cements are classified according to their early and final strength as well as their composition. In addition to cements that consist of 100% clinker, there are so-called composite cements, in which a portion of the clinker is replaced by alternative raw materials, such as fly ash, ground slag, or limestone. As the production of clinker is energy-intensive and releases large amounts of CO2, the use of alternative raw materials can conserve natural resources and reduce CO2 emissions. Cement is used as a binder mainly in concrete production.
Aggregates are classified according to their particle size and consistency. They are the main component in the production of concrete and asphalt, but are also used as base courses in the construction of infrastructure, such as roads.
Concrete is a mixture of aggregates (about 80%), cement (about 12%), and water. After water, concrete is the most commonly used substance on our planet. Concrete is usually delivered to the building site by ready-mix trucks and is poured locally into forms. Moreover, concrete is also used for the production of precast concrete parts, such as stairs, ceiling elements, or structural components.
Asphalt is a mixture of aggregates (about 95%) and bitumen, and is generally used as a top layer in road construction.
In 2015, HeidelbergCement sold 81.1 million tonnes (previous year: 81.8) of cement, 249.2 million tonnes (previous year: 243.6) of aggregates, 36.7 million cubic metres (previous year: 36.6) of ready-mixed concrete, and 9.1 million tonnes (previous year: 9.3) of asphalt.
Locations and sales marketsDue to the heavy weight of cement and aggregates compared with their price, production is usually located in close proximity to the sales markets. The cement transportation radius by road normally does not exceed 200 km. The delivery radius for aggregates and ready-mixed concrete by road is less than 100 km. Consequently, we have local production sites in the more than 40 countries in
44 HeidelbergCement | Annual Report 2015
Combined management report2

which we offer building materials. We currently operate 85 cement plants (plus 16 as part of joint ventures), more than 600 quarries and aggregate pits, and well over 1,000 ready-mixed concrete production sites worldwide. In total, the Group employs 45,453 people at around 2,100 locations (plus over 200 of joint ventures) on five continents.
Organisational structure HeidelbergCement is divided into five geographical Group areas: Western and Northern Europe, Eastern Europe-Central Asia, North America, Asia-Pacific, and Africa-Mediterranean Basin (see organisation chart for breakdown of countries). Our global trading activities, especially the trading of cement, clinker, and fuels, are pooled together in the sixth Group area Group Services.
Within the geographical Group areas, we have divided our activities into four business lines. Following the sale of the building products business in North America and the United Kingdom at the end of 2014, we altered this division slightly. The business lines of our core activities cement and aggregates remain unchanged. Here we report on the essential raw materials that are required for the manufacture of downstream ready-mixed concrete and asphalt activities, which are combined in the third business line. The fourth business line, service-joint ventures-other, primarily covers the activities of our joint ventures. It also includes the building products that are still manufactured in a few countries.
Organisational structure of the Group areas and business lines
Belgium Denmark EstoniaGermany 1) IcelandLatvia Lithuania Netherlands Norway Sweden United Kingdom
Bosnia-Herzego-vinaCroatia Czech Republic Georgia HungaryKazakhstan Poland Romania Russia Slovakia Ukraine
USA Canada
Bangladesh Brunei China India Indonesia MalaysiaSingapore
Australia
BeninBurkina FasoDR Congo Ghana Liberia Sierra Leone Tanzania Togo
Israel Spain Turkey
- Cement
- Aggregates
- Ready-mixed concrete-asphalt
- Service- joint ventures- other
- Cement
- Aggregates
- Ready-mixed concrete-asphalt
- Service- joint ventures- other
- Cement
- Aggregates
- Ready-mixed concrete-asphalt
- Service- joint ventures- other
- Cement
- Aggregates
- Ready-mixed concrete-asphalt
- Service- joint ventures- other
- Cement
- Aggregates
- Ready-mixed concrete-asphalt
- Service- joint ventures- other
1) Germany, as a mature market, is reported on as part of the Western and Northern Europe Group area. For management reasons, however, the country belongs to the area of responsibility of the same Managing Board member who is in charge of Eastern Europe-Central Asia.
Western and Northern Europe
Eastern Europe- Central Asia
North America Asia-Pacific
Africa-Mediterranean
Basin
Group Services
45HeidelbergCement | Annual Report 2015
Fundamentals of the Group
2015 economic report
Additional statements
Sustainability
Employees and society
Environmental responsibility
Procurement
Outlook
Risk and opportunity report
Com
bine
d m
anag
emen
t re
port
Cor
pora
te G
over
nanc
eC
onso
lidat
ed f
inan
cial
sta
tem
ents
Add
itio
nal i
nfor
mat
ion
2
3
4
5

Business processesHeidelbergCement operates as a fully integrated building materials company. Key business processes include the extraction of raw materials, the production of building materials, as well as their marketing and distribution to the customers. Operating activities are supported by central competence centers for technology as well as by shared service centers in individual countries and regions. Operating business processes include the geological exploration of raw material deposits, the purchase or lease of the land where the deposits are located, obtaining mining concessions and environmental certifications, the construction of manufacturing facilities in cooperation with external service providers, as well as the actual production of building materials, including the extraction of raw materials and the maintenance of facilities.
External factors of influenceThe most significant external factors influencing the economic development of the Heidelberg Cement Group are weather conditions, economic and population growth, as well as the development of the regulatory environment and the competition in the markets in which we operate.
Strategy and targets
The target of HeidelbergCement is to increase the value of the Group in the long term through sustainable and result-oriented growth. We want to continue to provide our customers with superior quality and innovative products at competitive prices, open up prospects for our shareholders, and offer all of our employees safe and attractive jobs. We incorporate economic, ecological, and social targets in our business strategy by the measures we take to protect the climate and biodiversity, as well as the social responsibility we assume at all locations worldwide.
Growth Thanks to the improvement of result and cash inflow as well as the strengthening of the financing structure, HeidelbergCement has created a solid foundation over the last five years for the acceleration of future growth.
HeidelbergCement is very well positioned to exploit growth opportunities in key mature markets and emerging countries. The investments made in many emerging countries in recent years have resulted in modern capacities that can serve the anticipated market growth. In the mature markets, we have reserve capacities and import opportunities to meet the recovering market demand.
In addition, HeidelbergCement intends to further strengthen the vertical integration in urban centres as a vital driver for future growth and value creation. To this end, we are combining the production sites of different business lines, such as cement, aggregates, ready-mixed concrete, and asphalt, in one production network. Overlapping processes, for instance logistics, are controlled centrally via standardised IT platforms, thereby optimising the use of resources. Business activities are being integrated, for example through shared sales structures and the provision of complete, cross-business-line solutions and additional services. With these measures, HeidelbergCement intends to make better use of its operational capacity than ever before. At the same time, we aim to further improve customer service and optimise supply capacities. For the future, HeidelbergCement plans to build up and strengthen vertically integrated positions in urban centres around the world.
46 HeidelbergCement | Annual Report 2015
Combined management report2

HeidelbergCement will also use its financial resources for carefully selected growth projects in existing regions and tap into new markets as part of a disciplined M&A strategy. In this connection, the takeover of Italcementi was initiated at the end of July 2015 with the signing of an agreement with Italmobiliare on the purchase of 45% of the shares in Italcementi and is to be concluded in 2016. With the takeover of Italcementi, HeidelbergCement benefits from a unique opportunity to accelerate the growth of the Group. HeidelbergCement is acquiring a valuable portfolio of plants and quarries that ideally complements its own international presence in geographical terms. Italcementi is represented in 22 countries and has strong market positions in France, Italy, the USA, and Canada. Furthermore, the company operates in emerging countries with high growth potential, such as India, Egypt, Morocco, and Thailand. Italcementi also owns extensive raw material reserves in the cement and aggregates areas.
Cost leadershipIn a market with largely standardised products, cost leadership is a key factor for success. In addition to our consistent focus on cost cutting programmes, emphasis is placed on continuous improvement of operational performance at individual production sites. We engage in intensive benchmarking both internally and in relation to competitors, in order to identify optimisation potentials. When it comes to investment, we also aim to keep costs as low as possible through a combination of HeidelbergCement’s engineering and low-cost suppliers worldwide for machines, equipment, and services.
Performance culture and local responsibilityAn excellent management team and dedicated, qualified employees are the source of our business success. As a company with a focus on performance and results, we greatly value the competence of our employees and management. The focus is on comprehensive efficiency and clear customer- orientation. HeidelbergCement pursues an integrated management approach, the success of which is based on a balance between local operational responsibility, Group-wide standards, and global leadership. Our local operations are key for the success of our business. Local management bears full responsibility for production, market, and management development, with the aim of market and cost leadership. They are supported by nationwide shared service centers, which handle administration for all business lines on the basis of a standardised IT infrastructure. In order to ensure transparency, efficiency, and rapid implementation of measures throughout the Group, HeidelbergCement has standardised all important management processes. Group-wide, uniform key performance indicators (KPIs) facilitate direct comparability and provide a foundation for continuous benchmarking.
SustainabilityWe build our long-term success on sustainable business practices. This includes securing access to raw materials reserves with adequate lifetimes and introducing innovative production processes. Alongside the use of alternative fuels and raw materials, and the development of new products, this leads to emission reduction and conservation-oriented handling of our raw materials base. HeidelbergCement is also active in the promotion of biodiversity at its extraction sites, through targeted implementation of biodiversity management plans, partnerships with international and national environmental organisations, as well as organising the international Quarry Life Award competition.
47HeidelbergCement | Annual Report 2015
Fundamentals of the Group
2015 economic report
Additional statements
Sustainability
Employees and society
Environmental responsibility
Procurement
Outlook
Risk and opportunity report
Com
bine
d m
anag
emen
t re
port
Cor
pora
te G
over
nanc
eC
onso
lidat
ed f
inan
cial
sta
tem
ents
Add
itio
nal i
nfor
mat
ion
2
3
4
5

Capital allocation and financing strategyFollowing the successful reduction in financial liabilities in recent years, HeidelbergCement now intends to focus its capital allocation on shareholder returns and disciplined growth. This plan is based on a steady increase in free cash flow over the next few years and key financial ratios that remain within the investment grade range.
We understand disciplined growth to be the thorough assessment of growth projects in terms of their strategic, financial, and technical attractiveness and with regard to clearly defined investment criteria. In this way we can ensure that growth investments create value for our shareholders. Accordingly, the takeover of Italcementi planned for 2016 was carefully examined and meets the requirements of a value-creating investment.
To improve the results for shareholders, HeidelbergCement intends to pursue a progressive dividend policy over the next few years. The payout ratio is expected to increase to 40% – 45% by 2019. Moreover, the option is to be introduced for any available cash to be returned to shareholders in the form of share buybacks.
For further information on financial management-related targets and policies, please refer to the section Group financial management on page 82 f.
Internal management control system and indicators
Components and functionality of the control systemThe internal management control system at HeidelbergCement is based primarily on annual op erational planning, ongoing management accounting and control, quarterly management meet-ings, central coordination of investment processes, as well as regular Managing Board meetings and reporting to the Supervisory Board.
Annual planning takes the form of top-down/bottom-up planning, under which the Managing Board first defines a top-down budget on the basis of macroeconomic analyses, its assessment of market conditions and cost targets. From this, specific targets are derived for individual operat-ing units, which are used as the basis of detailed planning for the individual units and setting of targets with local management. The individual operational plans created by the operating units are then consolidated centrally to create the Group-wide plan.
Ongoing management accounting and control of the company is carried out using a comprehensive system of standardised reports on the Group’s net assets, financial performance, and results of operations. The indicators used for this purpose are determined and presented uniformly throughout the Group. Reports on financial status, selected sales volumes and production overviews are prepared weekly. Reports on results of operations and a detailed cash flow report are prepared monthly in order to monitor cash flow. Detailed reports on the financial situation are submitted at the end of each quarter. Internal quarterly reporting includes a detailed tax reporting. At the quarterly management meetings, the Managing Board and country managers discuss business developments, including target achievement, along with the outlook for the relevant year and any measures that need to be taken.
Central departments in the areas of strategy, finance, and technology follow a formalised process to review and assess all major investments and acquisitions. This ensures comparability between different projects and consistent high quality in investment decision making. Investments in
48 HeidelbergCement | Annual Report 2015
Combined management report2

expansion are assessed using a discounted cash flow (DCF) model. The standard is that investment projects must generate at least enough income to cover their weighted average cost of capital (WACC). This long-term approach to investment returns is supported by simulated calculations that show the impact of an investment on the consolidated income statement, statement of cash flows, balance sheet, and taxes over a period of five years.
The financial analysis is complemented by a strategic analysis of the planned investments. Here, the strategic value of an investment is determined taking into account the expected market position, growth potential, synergies with other Group units, and the risk structure. The overall result of these analyses is the criterion by which the Managing Board makes its investment decisions.
Financial targets and management indicators
Earnings, capital expenditure, and return on capitalThe most important short-term indicator of the company’s earnings strength is operating income, which is determined in detail and analysed for all operating units. The decisive indicators at Group level are earnings before interest and taxes (EBIT) and Group share of profit. The financial and assets positions of the operating units are monitored short-term primarily via the amount of working capital and investment. Fixed targets are agreed with all operating units for each indicator.
Strategic management and capital allocation are based on return on invested capital (ROIC), which is defined as the ratio of earnings before interest but after tax to the sum of shareholders’ equity and interest-bearing liabilities. At operating level, the company uses return on capital employed (ROCE) for capital allocation. ROCE is calculated as the ratio of EBIT to invested capital. Taxes and goodwill are not taken into account for calculation. These are strategic-level indicators, and are therefore taken into account for determination of ROIC.
General target is generation of ROIC at least equivalent to weighted average cost of capital (WACC). HeidelbergCement’s weighted WACC totalled 7.0% at the end of the reporting year. Heidelberg-Cement has set the medium-term target of increasing ROIC to over 10% by 2019. Please see page 81, for more information on capital efficiency.
Financing structureHeidelbergCement is determined to achieve an investment grade rating to ensure that we retain our high financial stability as a company that is sensitive to business cycles. Furthermore, investment grade rating facilitates access to attractive and cost-effective funding opportunities and makes our share more attractive for an even broader circle of investors. To achieve this goal, we are focussing on the financial indicators most watched by rating agencies. An important indicator is the dynamic gearing ratio, i.e. the ratio of net debt to operating income before depreciation (OIBD). By the end of 2015, we achieved a ratio of 2.0x, as compared to 3.0x at the end of 2014. Our objective is a ratio in the area between 2.5x and 1.5x.
Non-financial targets and sustainable key-performance indicatorsOperational health and safety generally plays a major role in the production of building materials and, in addition, emissions in cement production especially. Therefore, essential key- performance indicators include parameters, such as accident frequency rate, accident severity rate, and fatality rate, as well as CO2 emissions and the use of alternative fuels. Information on these non-financial key-performance indicators is available in the chapters 2015 economic report on page 61, Occupational health and safety on page 102 f., and Environmental responsibility on page 105 f.
49HeidelbergCement | Annual Report 2015
Fundamentals of the Group
2015 economic report
Additional statements
Sustainability
Employees and society
Environmental responsibility
Procurement
Outlook
Risk and opportunity report
Com
bine
d m
anag
emen
t re
port
Cor
pora
te G
over
nanc
eC
onso
lidat
ed f
inan
cial
sta
tem
ents
Add
itio
nal i
nfor
mat
ion
2
3
4
5

Lead indicatorsHeidelbergCement’s core business is in standardised mass products that are generally ordered at short notice. For the most part, suppliers of such products are interchangeable from a customer standpoint. Moreover, the volume of construction activity – and thus sales volumes of building materials – are dependent on local weather conditions in the respective markets. Given this market constellation, no reliable lead indicators are definable for business forecasting. However, selected statistical data and industry association forecasts can be utilised to gauge the business outlook at country level. In mature markets, for instance, figures on building permits or infrastructure budgets serve as important sources of information. In emerging markets, data on population growth and GDP growth forecasts are frequently used indicators.
Research and technology
The target of HeidelbergCement’s research and development activities is to generate added value for customers and the Group through innovative products as well as through process improve-ments and new formulations, whilst minimising the use of energy, CO2 emissions, and hence costs.
Our research and development activitiesThe innovation work at HeidelbergCement can essentially be divided into five areas of focus:
– Products and applications: Our research and development activities are geared strongly towards the market and our customers. The main priority is the development and improvement of binders and concretes with optimised properties and innovative functionalities. However, our work does not end with the product; it also includes providing our customers with competent, professional technical service on the application and optimisation of their products.
– Cement production: The focus lies on the continuous improvement of processes and cost structures. This includes the cost-efficient replacement of fossil fuels and natural raw materials with alternative fuels and raw materials as well as reducing energy requirements in produc-tion. These goals were pursued until the end of 2013 as part of the Group-wide “Operational Excellence” initiative, with opportunities systematically and very successfully exploited in the cement plants. With the “Continuous Improvement Program” (CIP), started in 2014, we intend to not only retain, but further improve upon our achievements.
– Aggregates: In the aggregates business line, the “CLIMB” (2011–2013) and “CLIMB Commercial” (2013–2015) projects have led to significant improvements in throughput, uptime, manpower utilisation, energy efficiency, pricing, and the balance between production and sales. During these five years, we have increasingly focused on promoting standardised processes in the plants. We have targeted training at all levels from management to workers in the plants, supplemented by user-friendly training resources. Strong regional and local management commitment, coupled with the involvement of local CI managers, is driving improved performance and bottom line results.
– Optimisations across all business lines: Vertical integration, especially in urban centers, has been a strong focus of HeidelbergCement. Sustainable financial improvements can be achieved through a tightly coordinated optimisation of product portfolio, production processes, and
50 HeidelbergCement | Annual Report 2015
Combined management report2

logistics across the aggregates, ready-mixed concrete, and cement business lines. By utilising our entire raw material portfolio in one market region, we can optimise the material mix in our ready-mixed concrete plants so that our raw material deposits are most efficiently used and the costs in all aforementioned business lines are reduced. At the same time, we guarantee high concrete quality for our customers.
– Development of cements and concretes with improved CO2 balance: A major area of focus here is to further develop composite cements with less clinker – even beyond the limits of today’s existing standards. Reducing the proportion of clinker is the most important lever when it comes to minimising energy consumption and CO2 emissions, and in preserving natural raw materials. Finally, we are also researching entirely new kinds of binder systems that dispense with the use of clinker altogether. These innovative alternative products are still in the early stages of research and it will take many years until they are ready for the market and for wide deployment.
Organisation and fields of activities in the area of research and technologyOur global competence centers, Heidelberg Technology Center Global (HTC Global) and Competence Center Materials (CCM), pool the knowledge in our Group and make it available to all operational units both quickly and comprehensively. HTC and CCM employ many international experts covering a broad spectrum of cement- and aggregates-related expertise. HTC, for instance, is divided into five departments: Research & Development, Engineering, Geology & Raw Materials, Benchmarking & Training, and Mining.
The Group-wide activities in the area of research and technology are divided into the following tasks.
Central research and developmentWe have concentrated the Group-wide research and development activities in the cement, concrete, and aggregates business lines at HTC Global. To match the high importance of the development of CO2-minimised products, we reinforced this area even more, both financially and with personnel, in recent years. The individual projects are defined and carried out in close coordination with the operating companies. This close collaboration from the very start of the project facilitates the efficient implementation of the development results and a quick market launch.
Technology and innovationTechnical centers support our national companies in each Group area. In the cement business line, these are the Heidelberg Technology Centers (HTC) with two locations in Europe, supporting Europe, the Mediterranean Basin, Africa, and Central Asia, one location in North America, and one in Asia with offices in China, India, and Indonesia. They support our cement plants on all technical issues, from securing raw materials and operational optimisations to process control and quality assurance. With investment projects, HTC locations are involved in project management until a new installation or plant is commissioned or optimisation measures have been completed. Similarly, the Competence Center Materials (CCM) supports the aggregates, ready-mixed concrete, and asphalt business areas Group-wide. The close dialogue between HTC, CCM, and our plants ensures efficient implementation of potential optimisations and a robust continuous improvement process.
51HeidelbergCement | Annual Report 2015
Fundamentals of the Group
2015 economic report
Additional statements
Sustainability
Employees and society
Environmental responsibility
Procurement
Outlook
Risk and opportunity report
Com
bine
d m
anag
emen
t re
port
Cor
pora
te G
over
nanc
eC
onso
lidat
ed f
inan
cial
sta
tem
ents
Add
itio
nal i
nfor
mat
ion
2
3
4
5

Customer-related development and technical serviceOur close proximity to the market requires intensive customer-oriented development and technical service, which is also reflected in our high financial commitment (see the following table). The relevant departments and employees, which are integrated directly into the organisation of the respective national companies, develop and optimise the cements, aggregates, and concretes that are tailored to the local needs, often in close cooperation with the customers.
Expenditure for research and technologyTotal expenditure for research and technology amounted to €107.8 million in the reporting year (previous year: 99.6), corresponding to 0.8% of revenue. Personnel costs accounted for around three quarters of the total expenses. The following table shows a breakdown of expenses for the last five years for each of the three fields of activities mentioned above.
Expenditure for research and technology
€m 2011 2012 2013 2014 2015
Central research and development 1) 6.6 7.3 7.8 8.5 8.9
Technology and innovation 37.1 46.4 49.3 48.3 52.6
Customer-related development and technical service 35.2 38.1 46.8 42.8 46.2
Total 78.9 91.8 103.9 99.6 107.8
1) Including capitalised expenses
The structure of the expenditure for research and technology corresponds to the organisational breakdown: Expenses for the development of basic technologies are allocated to the Central research and development section, expenses for process innovations can be found in the Technology and innovation section, while the third section of the table contains the expenses for the optimisation of products and applications according to the wishes of our customers.
The development projects that were capitalised as investments include, amongst others, our innovative special products CemFlow® and Powercrete® as well as new composite cements. In 2015, capitalised development costs totalled €1.1 million, which corresponds to around 1.1% of total expenditure for research and technology. Because this figure is low, we have not presented it separately or shown further key figures.
Employees in research and technologyIn the 2015 financial year, a total of 924 people (previous year: 876) were employed in research and technology. The personnel breakdown and development over the last five years is shown in the following table.
Employees in research and technology
2011 2012 2013 2014 2015
Central research and development 54 54 56 60 59
Technology and innovation 283 341 329 325 333
Customer-related development and technical service 413 454 550 491 531
Total 750 849 935 876 924
The high importance of customer-related development and technical service as well as technology and innovation is reflected not only in the costs but also in the number of employees.
52 HeidelbergCement | Annual Report 2015
Combined management report2

Our employees’ high level of expertise in research and technology is a key competitive factor and the qualification requirements are correspondingly high. Around 69% of the employees in our technical competence centers have a university degree and short of 8% have a PhD (see the following graph). Intensive on-going training and a systematic exchange of knowledge in expert networks across the Group ensure a high level of qualification.
Qualification profile of our employees in research and technology
Research cooperationsClose cooperation with institutes and universities at both a local and global level complement our own research and development activities. At a global level, we refer in particular to our par-ticipation in Nanocem, the world’s most important research network in the cement sector. The network includes cement and admixture companies as well as 25 leading universities in Europe, who all work together to carry out fundamental research, which is supported by public funding.
In terms of product development, we prefer bilateral cooperation with individual universities in order to complement our own expertise in a targeted way. In some cases, cooperative projects with universities are supported by government funding. Compared with total expenditure, the funding ratio is marginal; therefore, we do not record it centrally. Total expenditure for contract research is considerably less than €1 million for the year and is, therefore, not shown separately; these expenses are included in the Central research and development section in the table on page 52. Aside from research cooperation mentioned above, we did not acquire any research and development expertise in 2015. Major projects and research and development results
Improving cost efficiency and tied-up capitalFollowing a successful pilot phase in spring 2014, the Managing Board resolved to implement the new “Continuous Improvement Program” (CIP) in the cement business line. CIP is the consistent continuation of the programmes we have already completed – “Operational Excellence” (OPEX), “Maintenance Improvement”, and “Group Spare Parts” – and focuses on the ongoing exploitation of improvement potential and the anchoring of a new management approach within the Group. In 2015, CIP was successfully introduced in two-thirds of the cement plants. In 2016, it will be rolled out to another 18 cement plants.
University degree 68.6%Master craftsman/
technician13.6%
7.6% PhD degree
Professional training10.2%
53HeidelbergCement | Annual Report 2015
Fundamentals of the Group
2015 economic report
Additional statements
Sustainability
Employees and society
Environmental responsibility
Procurement
Outlook
Risk and opportunity report
Com
bine
d m
anag
emen
t re
port
Cor
pora
te G
over
nanc
eC
onso
lidat
ed f
inan
cial
sta
tem
ents
Add
itio
nal i
nfor
mat
ion
2
3
4
5
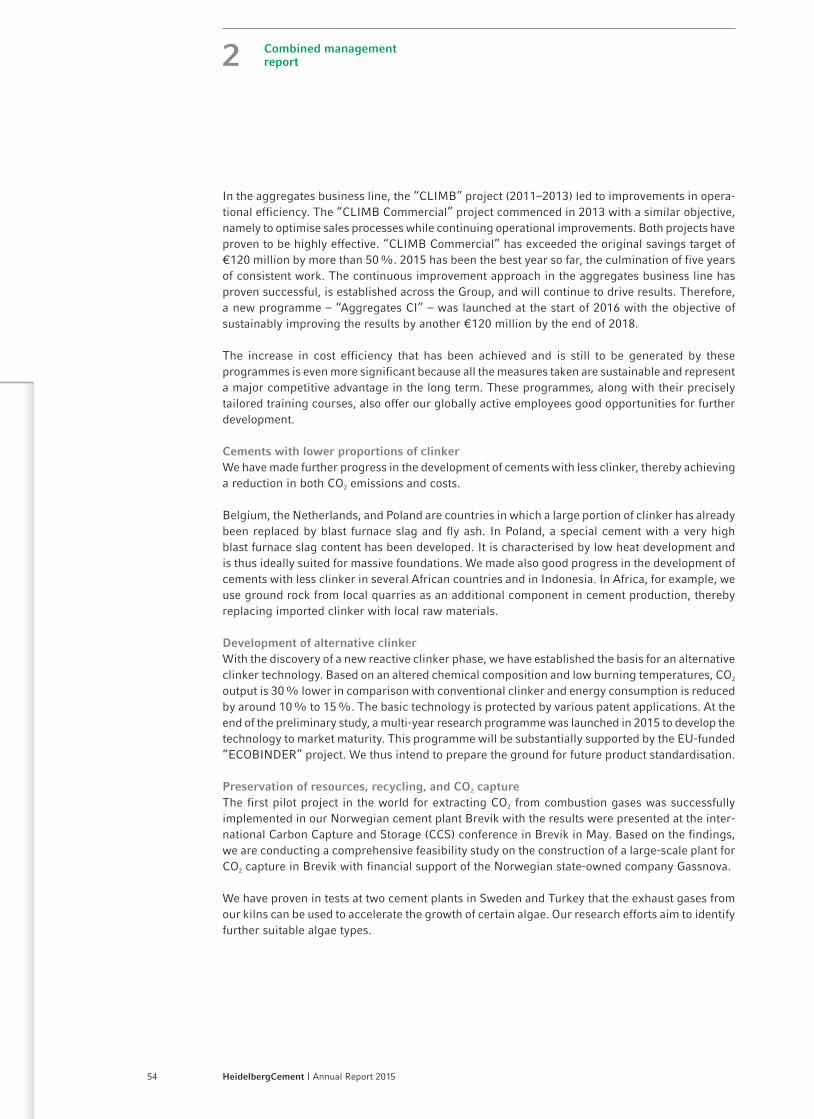
In the aggregates business line, the “CLIMB” project (2011–2013) led to improvements in opera-tional efficiency. The “CLIMB Commercial” project commenced in 2013 with a similar objective, namely to optimise sales processes while continuing operational improvements. Both projects have proven to be highly effective. “CLIMB Commercial” has exceeded the original savings target of €120 million by more than 50%. 2015 has been the best year so far, the culmination of five years of consistent work. The continuous improvement approach in the aggregates business line has proven successful, is established across the Group, and will continue to drive results. Therefore, a new programme – “Aggregates CI” – was launched at the start of 2016 with the objective of sustainably improving the results by another €120 million by the end of 2018.
The increase in cost efficiency that has been achieved and is still to be generated by these programmes is even more significant because all the measures taken are sustainable and represent a major competitive advantage in the long term. These programmes, along with their precisely tailored training courses, also offer our globally active employees good opportunities for further development.
Cements with lower proportions of clinkerWe have made further progress in the development of cements with less clinker, thereby achieving a reduction in both CO2 emissions and costs.
Belgium, the Netherlands, and Poland are countries in which a large portion of clinker has already been replaced by blast furnace slag and fly ash. In Poland, a special cement with a very high blast furnace slag content has been developed. It is characterised by low heat development and is thus ideally suited for massive foundations. We made also good progress in the development of cements with less clinker in several African countries and in Indonesia. In Africa, for example, we use ground rock from local quarries as an additional component in cement production, thereby replacing imported clinker with local raw materials.
Development of alternative clinkerWith the discovery of a new reactive clinker phase, we have established the basis for an alternative clinker technology. Based on an altered chemical composition and low burning temperatures, CO2 output is 30% lower in comparison with conventional clinker and energy consumption is reduced by around 10% to 15%. The basic technology is protected by various patent applications. At the end of the preliminary study, a multi-year research programme was launched in 2015 to develop the technology to market maturity. This programme will be substantially supported by the EU-funded “ECOBINDER” project. We thus intend to prepare the ground for future product standardisation.
Preservation of resources, recycling, and CO2 captureThe first pilot project in the world for extracting CO2 from combustion gases was successfully implemented in our Norwegian cement plant Brevik with the results were presented at the inter-national Carbon Capture and Storage (CCS) conference in Brevik in May. Based on the findings, we are conducting a comprehensive feasibility study on the construction of a large-scale plant for CO2 capture in Brevik with financial support of the Norwegian state-owned company Gassnova.
We have proven in tests at two cement plants in Sweden and Turkey that the exhaust gases from our kilns can be used to accelerate the growth of certain algae. Our research efforts aim to identify further suitable algae types.
54 HeidelbergCement | Annual Report 2015
Combined management report2

In addition, HeidelbergCement has entered into a strategic partnership with Joule Unlimited, Inc., a pioneer in the area of CO2 recycling and the manufacture of liquid fuels, to research the generation of biofuels from CO2 emissions. Using the helioculture technology developed by Joule, exhaust gases containing CO2 are converted into methanol or biodiesel with the help of bacteria and sunlight.
Innovative concretesFollowing several pilot projects in past years, the extensive marketing of the special product Powercrete® started. The concrete, containing a special cement, enables greatly improved thermal conductivity. It is ideal for the installation of high-voltage power lines because it ensures improved heat dissipation and lower performance losses in the cabling.
Our Dutch subsidiary has developed an ultra-high-performance concrete with compressive strength of up to 200 MPa and high ductility and has tested this product in pilot projects. It can be used to manufacture concrete parts that are particularly slim and lightweight.
Chronocrete® is a product family of special concretes with very high early strength. These concretes are particularly suitable for overnight repairs to traffic areas, such as motorways or airports. 2015 saw the commercial market launch for the product in Germany.
2015 economic report
Economic environment
General economic conditionsContrary to the expectations at the beginning of the year, global economic growth did not accelerate in 2015, but declined slightly as the year progressed. This was attributable to various factors: the slowdown in growth in China, the significant drop in the oil price, and the revaluation of the US dollar following the end of the expansionary monetary policy of the US Federal Reserve. While economic growth in the euro zone was better than anticipated and southern Europe, in particular, showed stronger signs of recovery, forecasts for the USA and most emerging countries had to be revised downwards during the course of the year. Growth in China continued to weaken and the economic momentum slowed down throughout Asia. Russia and the emerging countries in South America even fell into recession. Gross domestic product in Germany rose by 1.7% and was slightly above the level of the euro zone. Together with population growth and gross domestic product per capita, economic growth is one of the most important indicators for measuring the development of construction activity and the demand for building materials. The increase in demand for cement in emerging countries is roughly in line with economic growth. During infrastructure expansion phases, however, it can also be exceeded several times.
In the USA, the US Federal Reserve initiated the expected reversal in interest rates with a slight increase. In contrast, the European Central Bank continued its expansionary policy in 2015. The disparity between interest rate policies in the USA and Europe had a massive impact on numerous exchange rates and led to a weakening of the euro against other currencies. In the United Kingdom, the positive economic momentum continued, even if it was somewhat weaker than expected over the course of the year. The Bank of England has nonetheless kept interest rates low. According to the IMF, the global economy grew by 3.1% in 2015 compared with 3.4% in the previous year.
55HeidelbergCement | Annual Report 2015
Environmental responsibility
Procurement
Outlook
Risk and opportunity report
Fundamentals of the Group
2015 economic report
Additional statements
Sustainability
Employees and society
Com
bine
d m
anag
emen
t re
port
Cor
pora
te G
over
nanc
eC
onso
lidat
ed f
inan
cial
sta
tem
ents
Add
itio
nal i
nfor
mat
ion
2
3
4
5

Real GDP growth rate in major Group countries
in % 2014 2015 1) in % 2014 2015 1)
Western and Northern Europe North America
Belgium 1.3 1.2 Canada 2.5 1.2
Germany 1.6 1.7 USA 2.4 2.4
Netherlands 1.0 2.0 Asia-Pacific
Norway 2.3 1.0 Australia 2.6 3.0
Sweden 2.4 2.8 China 7.3 6.9
United Kingdom 2.9 2.2 India 7.3 7.4
Eastern Europe-Central Asia Indonesia 5.0 4.8
Czech Republic 2.0 4.3 Malaysia 6.0 5.0
Hungary 3.6 2.7 Africa-Mediterranean Basin
Kazakhstan 4.4 0.9 DR Congo 2) 9.2 8.4
Poland 3.3 3.5 Ghana 2) 4.0 3.5
Romania 2.8 3.6 Tanzania 2) 7.0 6.9
Russia 0.6 -3.7 Togo 2) 5.0 5.4
Ukraine -6.8 -12.0 Israel 2.6 2.6
Spain 1.4 3.2
Turkey 2.9 3.0
1) 2015 values are based on estimations and forecasts.
Source: National statistical offices, Deutsche Bank Research and 2) CIA World Factbook Estimates
As a result of weakening economic growth in emerging countries, the prices of many raw materials continued to fall in 2015. The prices of fuels such as coal also experienced a further decline. The growing availability of shale oil, especially in North America, and the sustained high oil production of the OPEC also led to a further major drop in the oil price.
Industry-specific conditionsBesides the country-specific investment climate for residential, commercial, and infrastructure construction, industry-specific conditions also include local weather conditions, developments in the competitive situation, and the regulatory environment. As the production and marketing of building materials is very localised and global trade in building materials only represents a small percentage of the total volume, we focus on the relevant regions and countries instead of considering a global view of the demand trend.
According to the American cement association PCA, construction activity in the USA rose by 8.2% in 2015. Construction activity increased in all sectors, growing by 9.6% in residential construction, 21.2% in non-residential construction, and 3.9% in public construction. Cement consumption rose by 3.8%. Private residential construction continued to recover. According to the PCA, the number of completed houses in 2015 was 10.2% above the previous year. This increase relates to single-family as well as to multi-family houses, in particular. In December 2015, the US Congress adopted a new five-year federal programme (FAST – Fixing America’s Surface Transportation Act) with a volume of US$305 billion for infrastructure development. At the same time, financing support from the TIFIA (Transport Infrastructure Finance and Innovation Act) programme was cut
56 HeidelbergCement | Annual Report 2015
Combined management report2

back. The impact of these changes on 2015 is negligible. For the coming years, a positive effect is expected, which is explained in more detail in the outlook on page 113 f. According to its projection from December 2015, the European market research network Euroconstruct expects an increase in construction activity in Europe for 2015. Most countries show a growth in con-struction work, if only slight in some cases. The exceptions are declines in Finland, France, and Switzerland, where HeidelbergCement is not represented. In Germany, construction activity is expected to have risen modestly by 0.4% in 2015, although cement consumption fell by 2.2% due to the colder winter and weakening demand in commercial construction. Growth in the United Kingdom is anticipated to have slowed down to 3.9%, but still remains significantly above the European average of 1.3%. Residential construction and major infrastructure projects in London are still the key drivers. A stabilisation is forecast for Belgium, and growth in construction activity is expected in the Netherlands. In Norway and Sweden, a rise of 2.4% and 5.5%, respectively, is anticipated for 2015. Construction activity in the Eastern European countries is also forecast to have increased further in 2015, particularly in the Czech Republic by 7.4%.
In Asia, cement consumption varied greatly by region. According to analyst reports, China recorded a decline of 5%. In Indonesia, cement consumption more or less achieved the previous year’s figure, due to the considerably delayed start of infrastructure programmes of the new government. India recorded a slight market growth.
In Africa, demand for building materials continued to develop positively, with the exception of Ghana, where the drop in the oil price adversely impacted the investment climate.
The positive demand in recent years has increased the level of global competition in 2015, particularly in the emerging countries of Africa and Asia. Local and regional companies have announced the expansion of cement capacities. Furthermore, increasing import volumes put pressure on local prices in some cases.
Weather conditions also play a major role, as construction activities are considerably restricted or even suspended altogether when temperatures fall well below freezing, during snow, or heavy rainfalls. In 2015, sales volumes of building materials in the south of the USA were impaired by heavy rain. According to statistics, 2015 saw the wettest weather in this region since records began in 1895. Nonetheless, sales volumes of building materials in North America exceeded the previous year thanks to the overall good economic development.
The EU Emissions Trading Scheme (ETS) is just one of the regulatory conditions that exercise an influence on the results of building materials producers. Owing to the persistent weak economic development in Europe, the price of emission rights remained well below €10 per tonne of CO2. As in 2014, HeidelbergCement decided not to sell its surplus emission rights on account of the low price, but has kept them for future use.
Relevant changes in reporting
In 2015, there were no relevant changes in reporting. Unless expressly indicated otherwise, all statements and figures in this annual report refer to the continuing operations of HeidelbergCement.
57HeidelbergCement | Annual Report 2015
Fundamentals of the Group
2015 economic report
Additional statements
Sustainability
Employees and society
Environmental responsibility
Procurement
Outlook
Risk and opportunity report
Com
bine
d m
anag
emen
t re
port
Cor
pora
te G
over
nanc
eC
onso
lidat
ed f
inan
cial
sta
tem
ents
Add
itio
nal i
nfor
mat
ion
2
3
4
5

Development of sales volumes
In 2015, sales volumes developed rather differently in the individual Group areas, but as a whole remained stable at the level of the previous year. On the one hand, we benefited from the sustained recovery of the economy in the USA and in some countries in Western Europe, such as the United Kingdom, where demand for building materials continued to increase. The expansion of our capacities in Africa and Kazakhstan also had a positive impact. On the other hand, the strongly cooling economy in Asia, the deteriorating oil price, and political crises adversely affected our sales volumes.
As recently predicted, cement and clinker sales volumes in 2015 remained more or less stable at the previous year’s level, falling slightly by 0.9% to 81.1 million tonnes (previous year: 81.8). While sales volumes in Eastern Europe-Central Asia and Asia-Pacific declined slightly and in Western and Northern Europe almost achieved the level of the previous year, we recorded growth in the Africa-Mediterranean Basin and North America Group areas. Apart from Ghana, which was suffering from the effects of the drop in the oil price, an increase in demand and the capacity expansion in Togo and Burkina Faso had a positive impact in Africa. In the USA, we benefited particularly from the sustained economic recovery in the North and West regions. In the Eastern Europe-Central Asia Group area, the Ukraine conflict impacted the development of sales volumes in Russia and Ukraine, while our new plant in Kazakhstan contributed to an increase in volumes. In the Asia-Pacific Group area, Indonesia, which for us is the country with by far the greatest sales volumes in Asia, suffered from weak demand. In the countries of the Western and Northern Europe Group area, demand was rather mixed: a significant increase in the United Kingdom and Sweden almost offset declines in Germany, Norway, and the Baltic States. In Benelux, delivery volumes slightly exceeded the level of the previous year.
The sale of aggregates rose as expected in 2015; it increased by 2.3% to 249.2 million tonnes (previous year: 243.6). Deliveries in North America and the Eastern Europe-Central Asian countries – excluding Ukraine – saw the highest increase, followed by Africa-Mediterranean Basin. In North America, all market regions excluding Canada sold more aggregates than in the previous year. In the Africa-Mediterranean Basin Group area, sales volumes rose both in Spain and Israel. However, sales figures dropped overall in Asia-Pacific and also, to a lesser extent, in Western and Northern Europe. The lower volumes in Indonesia as well as in Malaysia, where demand has weakened following the completion of major projects, could not be compensated by the slight increase in sales volumes in Australia. In the Western and Northern Europe Group area, the United Kingdom, Germany, and the Benelux countries came close to the previous year’s level, while Norway and Sweden suffered double-digit declines in sales volumes. We only recorded increases in volumes in the Baltic States and Iceland.
As recently predicted, our ready-mixed concrete sales volumes were flat at 36.7 million cubic metres (previous year: 36.6) in 2015. Here too, the development in the individual Group areas has been varied. We achieved the greatest increase in Eastern Europe-Central Asia, primarily in Poland, Romania, and Georgia. In our market regions in North America, deliveries also rose or at least reached the previous year’s level. In the Western and Northern Europe Group area, pleasing increases in sales volumes in the United Kingdom and Benelux almost offset the decline in the Baltic States, Denmark, Norway, and Germany. In Israel and Spain, the only countries in the Africa-Mediterranean Basin Group area that produce ready-mixed concrete, sales volumes experienced slight growth. However, they fell considerably in the Asia-Pacific region, with the exception of Australia.
58 HeidelbergCement | Annual Report 2015
Combined management report2

In 2015, asphalt deliveries fell slightly by 2.0% to 9.1 million tonnes (previous year: 9.3). The sharpest drop was registered in the two asphalt-producing countries Malaysia and Australia in Asia-Pacific, followed by the United Kingdom in the Western and Northern Europe Group area. In North America, however, sales volumes rose in the North and West regions, where we manufacture asphalt.
Sales volumes
2014 2015 Change
Cement and clinker (million tonnes) 81.8 81.1 -0.9%
Aggregates (million tonnes) 243.6 249.2 2.3%
Ready-mixed concrete (million cubic metres) 36.6 36.7 0.3%
Asphalt (million tonnes) 9.3 9.1 -2.0%
Earnings position
Operating earnings of HeidelbergCement improved significantly in the 2015 financial year compared with the previous year.
Revenue rose by 6.7% in comparison with the previous year to €13,465 million (previous year: 12,614); adjusted for currency and consolidation effects, revenue was almost flat. Currency effects of €795 million had a positive impact and resulted primarily from the increase in the US-dollar, the British pound, and some Asian currencies against the euro. Positive consolidation effects contributed €76 million to the increase in revenue.
While sales volumes rose in the reporting year in the aggregates business line, particularly in the North America and Eastern Europe-Central Asia Group areas, they remained almost at the level of the previous year in the cement and ready-mixed concrete-asphalt business lines.
Material costs rose by 3.0% to €5,477 million (previous year: 5,320). While the costs of energy fell by 4.3%, they increased by 5.2% for raw materials, by 7.1% for consumable and repair materials, and by 3.4% for goods purchased for resale.
Other operating expenses and income were 5.7% above the previous year’s level at €-3,334 million (previous year: -3,155). While expenses for repairs and service by third parties, rental and leasing expenses and administrative and distribution costs rose disproportionately by 14.3%, 20.2%, and 8.0%, respectively, freight costs fell by 1.4% despite a slight rise in sales volumes. At the same time, gains from the disposal of fixed assets increased by €25.3 million, or 47.5%.
The average number of employees decreased slightly by 1.3%. Personnel costs rose by 10.9% to €2,274 million (previous year: 2,050); excluding currency effects, the increase amounted to 5.3%. The result from joint ventures rose by 17.9% to €201 million (previous year: 171), primarily due to the positive business development of our joint ventures Cement Australia, Akçansa, and Texas Lehigh Cement.
Operating income before depreciation (OIBD) improved by 14.2% to €2,613 million (previous year: 2,288); adjusted for currency and consolidation effects, it increased by 8.2%. The good development of OIBD is largely due to the success of the Group programmes for efficiency and margin improvements, the decline in energy costs, and price increases in key markets.
59HeidelbergCement | Annual Report 2015
Fundamentals of the Group
2015 economic report
Additional statements
Sustainability
Employees and society
Environmental responsibility
Procurement
Outlook
Risk and opportunity report
Com
bine
d m
anag
emen
t re
port
Cor
pora
te G
over
nanc
eC
onso
lidat
ed f
inan
cial
sta
tem
ents
Add
itio
nal i
nfor
mat
ion
2
3
4
5

Depreciation and amortisation of intangible assets and property, plant, and equipment rose by 10.6% to €767 million (previous year: 693). Operating income increased by 15.7% to €1,846 million (previous year: 1,595); adjusted for currency and consolidation effects, operating income rose by 9.9%.
Additional ordinary result improved by €51 million to €-12 million (previous year: -63). Income of €85 million predominantly originated from foreign exchange-related income in connection with a capital repayment of a foreign holding company, the release of a provision for compensation related to antitrust proceedings, and the sale of the lime activities in Germany. Expenses of €97 million were essentially attributable to impairment of goodwill in Russia (€26 million) and of property, plant, and equipment (€14 million), as well as to restructuring measures (€11 million), losses from the disposal of business units (€7 million), and other non-recurring expenses (€39 million). In the previous year, the income primarily related to the disposal of business units amounting to €25 million. Expenses in the previous year related mainly to impairment of goodwill and other fixed assets amounting to €58 million as well as restructuring of €19 million.
Result from participations increased slightly by €1 million to €29 million (previous year: 28). Earnings before interest and taxes (EBIT) rose substantially by €303 million to €1,863 million (previous year: 1,560).
The financial result improved by €79 million to €-550 million (previous year: -629). Interest income fell by €20 million, primarily due to lower interest income in Indonesia and Canada. Thanks to the significantly reduced net debt, interest expenses declined by €86 million. Foreign exchange losses decreased by €8 million to €-35 million (previous year: -43). Other financial result improved slightly by €5 million to €-118 million (previous year: -123).
Profit before tax from continuing operations rose by €383 million to €1,313 million (previous year: 931).
Expenses for income taxes increased by €230 million to €295 million (previous year: 65). Current taxes rose by €12 million to €342 million (previous year: 330). The disproportionately low increase in relation to the profit before tax is mostly attributable to the utilisation of losses carried forward. Deferred tax revenue fell by €218 million to €47 million (previous year: 265), predominantly due to deferred taxes on losses carried forward that were recognised in the last year in the USA and Luxembourg. As a result, the effective tax rate increased in comparison with the previous year from 6.6% to 22.0%.
Net income from continuing operations thus amounts to €1,019 million (previous year: 866).
Net income from discontinued operations rose by €143 million to €-36 million (previous year: -179). The results from the discontinued operation Hanson Building Products, which was sold on 13 March 2015, amounted to €16 million. In 2015, expenses of €52 million related to operations of the Hanson Group that were discontinued in previous years.
Overall, a profit of €983 million (previous year: 687) was recorded for the financial year. The profit attributable to non-controlling interests fell by €19 million to €183 million (previous year: 202). The Group share of profit thus amounts to €800 million (previous year: 486).
Earnings per share – Group share – in accordance with IAS 33 rose to €4.26 (previous year: 2.59). For continuing operations, the earnings per share increased to €4.45 (previous year: 3.54).
60 HeidelbergCement | Annual Report 2015
Combined management report2

In view of the overall positive business development, the Managing Board and Supervisory Board will propose to the Annual General Meeting on 4 May 2016 the distribution of a dividend of €1.30 (previous year: 0.75) per share.
Consolidated income statement (short form)
€m 2014 2015 Change
Revenue 12,614 13,465 7%
Operating income before depreciation (OIBD) 2,288 2,613 14%
Depreciation and amortisation -693 -767 11%
Operating income 1,595 1,846 16%
Additional ordinary result -63 -12 -80%
Result from participations 28 30 5%
Earnings before interest and taxes (EBIT) 1,560 1,863 19%
Financial result -629 -550 -13%
Profit before tax from continuing operations 931 1,313 41%
Income taxes -65 -295 356%
Net income from continuing operations 866 1,019 18%
Net income/loss from discontinued operations -179 -36 -80%
Profit for the financial year 687 983 43%
Group share of profit 486 800 65%
Non-financial key performance indicators
In the non-financial area we use several key performance indicators for the internal control and monitoring of occupational safety and CO2 emissions.
The extraction of raw materials and the production of cement and aggregates in itself harbour various dangers, for example with regard to the transportation of raw materials and finished prod-ucts, working at great heights, with high voltage currents, or using heavy technical equipment. Therefore, occupational health and safety has top priority at HeidelbergCement. To gauge the effectiveness of our occupational safety measures, we use the following key performance indica-tors: accident frequency rate, accident severity rate, and fatality rate. For more information on the definition and development of these non-financial key performance indicators, see the section on occupational health and safety on page 102 f.
The production of cement generates a large amount of CO2 due to the chemical processes involved in burning clinker and the high temperatures that are required. Climate protection is not only a necessary measure to safeguard the living conditions of future generations, it also has financial benefits. HeidelbergCement is increasingly involved in emission trading systems, which require the additional purchase of emission rights if the assigned amount is exceeded. That is why the continuous reduction of CO2 emissions is at the heart of our environmental policy. The use of alternative fuels and raw materials is one of the essential levers for reducing CO2 emissions. In order to control and monitor progress in climate protection, we use the following key performance indicators: specific net CO2 emissions, alternative fuel rate, and clinker ratio. For more information on the definition and development of these non-financial key performance indicators, see the section on environmental responsibility on page 105 f.
61HeidelbergCement | Annual Report 2015
Fundamentals of the Group
2015 economic report
Additional statements
Sustainability
Employees and society
Environmental responsibility
Procurement
Outlook
Risk and opportunity report
Com
bine
d m
anag
emen
t re
port
Cor
pora
te G
over
nanc
eC
onso
lidat
ed f
inan
cial
sta
tem
ents
Add
itio
nal i
nfor
mat
ion
2
3
4
5

Business trend in the Group areas
Western and Northern Europe
HeidelbergCement operates in eleven countries in the Western and Northern Europe Group area. In these mature markets, we manufacture cement, aggregates, ready-mixed concrete, asphalt, and various building products as a fully integrated building materials company. We are the market leader in most of the countries in which we produce cement. We also have a dense network of quarries for aggregates and production facilities for ready-mixed concrete. The United Kingdom is our largest market region in Western and Northern Europe.
The economic recovery continued in the countries of the Western and Northern Europe Group area during the reporting year. In Germany, the United Kingdom, and Sweden, the gross domestic product rose by 1.7%, 2.2%, and 2.8% respectively in the reporting year. The economy continued to pick up in Belgium and the Netherlands. Belgium reported growth of 1.2%, while the Netherlands registered an improvement of 2.0%. In Norway, the economic momentum weakened due to the deteriorating oil price. Economic output rose by 1.0%.
Construction activity in the countries of the Group area underwent largely positive development in the reporting year. Construction investments in Sweden and the Netherlands increased considerably by 5.5% and 6.0% respectively in comparison with the previous year thanks to strong demand from residential construction. Particularly private residential construction – supported by the government’s “Help to buy” programme – and infrastructure construction were the principal growth drivers in the United Kingdom. Total construction activity in the United Kingdom increased by 3.9% in the reporting year. Despite the negative impact of the low oil price on commercial construction, construction activity in Norway is expected to have risen by 2.4%, driven by an upswing in infrastructure construction. With an improvement of 0.3% and 0.4% in Belgium and Germany respectively, construction activity was relatively stable. In Germany, however, only residential construction increased in comparison with the previous year.
Cement business lineIn 2015, cement consumption in Germany fell short of the previous year by 2.2%, totalling 26.6 million tonnes. A drop of around 3% is expected in the Netherlands due to the completion of infrastructure projects in the previous year, while cement consumption in Sweden and the United Kingdom rose significantly by an estimated 5% and 4% respectively. In Norway, cement consumption decreased by 1.6%; Belgium will remain at the previous year’s level.
Total cement and clinker shipments in the Group area decreased by 1.0% to 21.4 million tonnes (previous year: 21.6). Growth in sales volumes in the United Kingdom, Sweden, and Denmark could not fully offset the drop in the other countries and the decline in exports from Northern Europe. In the United Kingdom, sales volumes grew considerably thanks to the positive development in residential construction and large infrastructure projects in the Greater London area. Deliveries of ground blast furnace slag were also above the previous year’s level. In Sweden, we benefited from increasing domestic demand, particularly in residential construction. The restrained demand in commercial construction and the colder winter weather are reflected in the slight decline in volumes of our German plants. In Benelux, our shipments remained marginally below the previous year, primarily as a result of the sustained weak demand in the Netherlands. The declining activities in the oil industry had an adverse impact on the sales volumes of our Norwegian plants. Revenue of the cement business line grew by 0.9% to €1,796 million (previous year: 1,780).
The “Germany Cement Master Plan”, an ambitious investment programme, was adopted for the modernisation and efficiency improvement of our plants and environmental protection. The key
62 HeidelbergCement | Annual Report 2015
Combined management report2

new construction and conversion projects should be implemented by 2019. In the United Kingdom, we installed a new packing line for plastic bags and a feeding system for alternative fuels at the Padeswood plant. In Norway and Sweden, we have carried out various investments to improve efficiency and protect the environment. In the Belgian plant Antoing, the coal mill was converted and the power supply modernised.
Following the findings of a study by the UK Competition and Markets Authority, HeidelbergCement was obliged to sell one GGBS (ground granulated blast furnace slag) plant in the 2015 financial year. The transaction was completed on 31 July 2015 with the sale of the plant in Scunthorpe.
Aggregates business lineIn the Western and Northern Europe Group area, HeidelbergCement operates an extensive network of production sites. Total aggregates sales volumes decreased by 2.1% to 63.8 million tonnes (previous year: 65.2). While they rose in the Baltic States and Iceland, they were almost flat in the United Kingdom, Germany, and Benelux. In Sweden and Norway, however, aggregates sales volumes fell considerably short of the previous year. In Sweden, this was due to the sale of two quarries in September 2014 and in Norway owing to weaker domestic demand as well as a decline in exports to the Baltic States. Revenue of the aggregates business line rose by 5.2% to €887 million (previous year: 843), mainly thanks to an increase in the United Kingdom.
Due to the rising demand in 2015, we reopened the sand and gravel quarry in Shardlow in the United Kingdom, which had been mothballed in 2012.
Ready-mixed concrete-asphalt business lineThis business line covers the ready-mixed concrete and asphalt business. While we have an extensive network of ready-mixed concrete plants in many parts of the Group area, asphalt activities are limited to the United Kingdom.
In 2015, deliveries of ready-mixed concrete fell slightly short of the previous year by 0.3%, at 13.0 million cubic metres (previous year: 13.0). The growth in sales volumes in the United Kingdom, Sweden, Benelux, and Iceland almost compensated the decrease in volume in the other Group countries. Sales volumes of asphalt dropped by 3.3% to 3.0 million tonnes (pre-vious year: 3.1) in 2015, mainly due to the wet weather and a slight decrease in demand in the second half of the year.
In Belgium, three ready-mixed concrete plants were acquired to improve vertical integration. In the Netherlands, we sold our share in a company that produces ready-mixed concrete, among other things. In the United Kingdom, two refurbished ready-mixed concrete plants were relocated from other locations to Stanton Harcourt near Oxford and Chipping Sodbury near Bristol. We commissioned new plants in Vilnius, Lithuania, and in Larvik, Norway.
In the asphalt operating line, we also relocated a plant that had been mothballed in 2012 from Devon to Wales. Furthermore, our asphalt plant at the Whatley quarry in Somerset is being completely refurbished.
Revenue of the ready-mixed concrete-asphalt business line rose in 2015 by 5.7% to €1,627 million (previous year: 1,539), particularly due to the increase in the United Kingdom.
Service-joint ventures-other business line In the first quarter of 2015, HeidelbergCement sold its building products business line in North America and the United Kingdom to a subsidiary of Lone Star Funds. The remaining building products of the Group area fall into the service-joint ventures-other business line. This essentially
63HeidelbergCement | Annual Report 2015
Fundamentals of the Group
2015 economic report
Additional statements
Sustainability
Employees and society
Environmental responsibility
Procurement
Outlook
Risk and opportunity report
Com
bine
d m
anag
emen
t re
port
Cor
pora
te G
over
nanc
eC
onso
lidat
ed f
inan
cial
sta
tem
ents
Add
itio
nal i
nfor
mat
ion
2
3
4
5

includes sand-lime brick, precast concrete parts, and concrete products in Germany, as well as the Nordic Precast Group, which produces concrete products.
On 13 March 2015, HeidelbergCement and the Norwegian KB Gruppen Kongsvinger AS signed an agreement on the merger of the concrete product activities of their Swedish subsidiaries Abetong AB and Contiga AB. The transaction was concluded on 28 September 2015. The newly formed Nordic Precast Group AB, which is the result of this combination and in which HeidelbergCement holds a 57.6% stake, operates in Norway, Sweden, Denmark, Germany, Poland, and Latvia.
On 31 August 2015, we completed the sale of the lime business in Germany to the Belgian Lhoist Group.
The service-joint ventures-other business line also includes our road construction activities in the United Kingdom and our joint venture Mibau, which operates in the aggregates business, as well as several joint ventures in the ready-mixed concrete operating line in Germany and Norway.
Revenue of the business line rose by 21.8% to €610 million (previous year: 501), essentially due to the consolidation of the Nordic Precast Group.
Revenue and resultsRevenue of the Western and Northern Europe Group area increased by 4.6% to €4,196 million (previous year: 4,012). In operational terms, excluding consolidation and exchange rate effects, the growth was 0.1%. At €672 million (previous year: 562), operating income before depreciation (OIBD) was 19.7% above the previous year; excluding consolidation and exchange rate effects, the increase amounted to 17.3%. Operating income rose by 31.9% to €434 million (previous year: 329); adjusted for consolidation and exchange rate effects, the growth was 31.7%.
Key data Western and Northern Europe
€m 2014 2015 Change
Revenue 4,012 4,196 4.6%
Operating income 329 434 31.9%
Investment in property, plant, and equipment 188 249 32.3%
Cement and clinker sales volumes (Mt) 21.6 21.4 -1.0%
Aggregates sales volumes (Mt) 65.2 63.8 -2.1%
Ready-mixed concrete sales volumes (Mm3) 13.0 13.0 -0.3%
Asphalt sales volumes (Mt) 3.1 3.0 -3.3%
Employees as at 31 December 12,441 13,818 11.1%
Revenue Western and Northern Europe 2015: €4,196 million
36.5%
Service-joint ventures-others
Cement
12.4%
Aggregates18.0%
Ready-mixed concrete-asphalt33.1%
64 HeidelbergCement | Annual Report 2015
Combined management report2

Eastern Europe-Central Asia
HeidelbergCement operates in eleven countries in the Eastern Europe-Central Asia Group area. In most of these growth markets, we are the market leader in the cement business. The production of aggregates and ready-mixed concrete is also becoming increasingly important. In terms of revenue, Poland is our largest market region in Eastern Europe-Central Asia.
The economic development of the countries in the Eastern Europe-Central Asia Group area presents a mixed picture: The economic upturn in Poland and the Czech Republic is ongoing and the Romanian economy is also continuing to recover. In Kazakhstan, the economy has cooled down due to the low oil price, while the Russian economy is even in recession with a decline of 3.7%. The conflict in Ukraine has severely impaired the Ukrainian economy, where a drop of 12.0% in gross domestic product is predicted for 2015. While economic output in Kazakhstan is expected to increase slightly by 0.9%, significant growth of 3.6%, 3.5%, and 2.5% is forecast in Romania, Poland, and Georgia, respectively. The gross domestic product in the Czech Republic registered the best development with an increase of 4.3%.
In several countries, such as the Czech Republic, Poland, and Romania, the economic recovery has had a positive impact on the construction industry. It also experienced an upswing in Kazakhstan and Georgia, but was clearly in decline in Russia and Ukraine. The crisis in eastern Ukraine definitely impaired the local construction activity, while the economic downturn in Russia, which was accelerated by the low oil price, was partially offset by infrastructure measures of the government.
Cement business lineAside from Slovakia, HeidelbergCement produces cement and clinker in all countries of the Eastern Europe-Central Asia Group area. Total cement and clinker deliveries fell by 3.3% in 2015 to 16.6 million tonnes (previous year: 17.1).
The development of sales volumes in the individual countries was varied. In Kazakhstan, the ramp-up of production at our new CaspiCement cement plant contributed to a double-digit percentage increase in sales volumes. Shipments also rose in the Czech Republic and Georgia. In Poland, increasing competitive pressure led to a moderate decrease in sales volumes, while they remained almost stable in Romania. Cement deliveries in Russia were considerably below the previous year’s level as a result of the economic downturn. In Ukraine, the conflict in the east of the country led to a double-digit percentage drop in sales volumes for the full year despite an increase in volumes in the second half of 2015. Revenue of the cement business line fell by 11.1% to €878 million (previous year: 987). The decline in revenue was intensified due to the substantial depreciation of the Russian and Ukrainian currencies against the euro.
We have carried out investments to improve environmental protection and productivity in several countries. At our Fieni cement plant in Romania, we commissioned an installation for power generation from kiln waste heat.
Aggregates business lineThe main markets of HeidelbergCement in the aggregates business line are the Czech Republic and Poland. We also run aggregates operations in Russia, Romania, Slovakia, Ukraine, and Kazakhstan. We benefited from a significant increase in demand in most countries. Total sales volumes increased by 9.9% to 22.4 million tonnes (previous year: 20.4).
65HeidelbergCement | Annual Report 2015
Fundamentals of the Group
2015 economic report
Additional statements
Sustainability
Employees and society
Environmental responsibility
Procurement
Outlook
Risk and opportunity report
Com
bine
d m
anag
emen
t re
port
Cor
pora
te G
over
nanc
eC
onso
lidat
ed f
inan
cial
sta
tem
ents
Add
itio
nal i
nfor
mat
ion
2
3
4
5

We achieved substantial growth in Kazakhstan, Romania, the Czech Republic, and Slovakia. In Poland and Russia, our sales volumes increased moderately, while they remained clearly below the previous year’s level in Ukraine. Revenue of the aggregates business line grew by 11.9% to €116 million (previous year: 104).
Investments in the aggregates business line were governed by strict expenditure control and essentially limited to the purchase of two sand and gravel pits in the Opole area in Poland.
Ready-mixed concrete-asphalt business lineThis business line covers the ready-mixed concrete and asphalt business, although we do not produce any asphalt in the Eastern Europe-Central Asia Group area. In the ready-mixed concrete operating line, however, we have a dense network of plants in all countries, apart from Russia. The main market regions are located in the Czech Republic and Poland.
In 2015, ready-mixed concrete sales volumes rose in Eastern Europe-Central Asia by 15.2% to 3.4 million cubic metres (previous year: 2.9). The strongest growth, at a double-digit rate, was recorded in Poland, Romania, and Georgia. While the deliveries in Kazakhstan were slightly above the previous year’s level, they remained below the level of 2014 in the Czech Republic and Ukraine. At €183 million (previous year: 163), revenue of the ready-mixed concrete-asphalt business line rose by 12.3%.
In Poland, we acquired seven ready-mixed concrete plants in the Wroclaw, Warsaw, and Opole areas – our core markets – in order to expand our production capacities. In the Czech Republic, we opened one new plant and modernised the production facilities in two others. In Kazakhstan, we built a new ready-mixed concrete plant in the capital Astana, and we acquired a new semi-mobile ready-mixed concrete plant in Romania.
Service-joint ventures-other business lineIn Eastern Europe-Central Asia, this business line is solely made up by our joint ventures. We therefore do not report any revenue.
Our main joint ventures are located in Hungary and Bosnia-Herzegovina. Our joint venture Duna-Dráva Cement Kft is the leading building materials manufacturer in Hungary. In Bosnia-Herzegovina, we are represented with one cement plant and four ready-mixed concrete plants. We also operate other joint ventures – particularly in the ready-mixed concrete business – in Croatia, the Czech Republic, Poland, and Slovakia. Cement sales volumes rose substantially in Hungary thanks to a robust construction industry, and they increased slightly in Bosnia-Herzegovina.
Revenue and resultsRevenue in the Eastern Europe-Central Asia Group area decreased by 7.2% in 2015 to €1,097 million (previous year: 1,182). The decline in revenue was primarily due to significant negative exchange rate effects resulting from the devaluation of the currencies of Ukraine and Russia against the euro. Adjusted for currency and consolidation effects, revenue rose slightly by 1.1%. At €207 million (previous year: 230), operating income before depreciation (OIBD) was 9.9% below the previous year; excluding exchange rate and consolidation effects, the decrease amounted to 4.4%. Operating income fell by 11.9% to €114 million (previous year: 129); adjusted for currency and consolidation effects, the decline amounted to 8.8%. OIBD and operating income are essentially impaired by negative exchange rate effects, the slowdown of the Russian construction industry, and falling prices as a result of imports to Kazakhstan.
66 HeidelbergCement | Annual Report 2015
Combined management report2
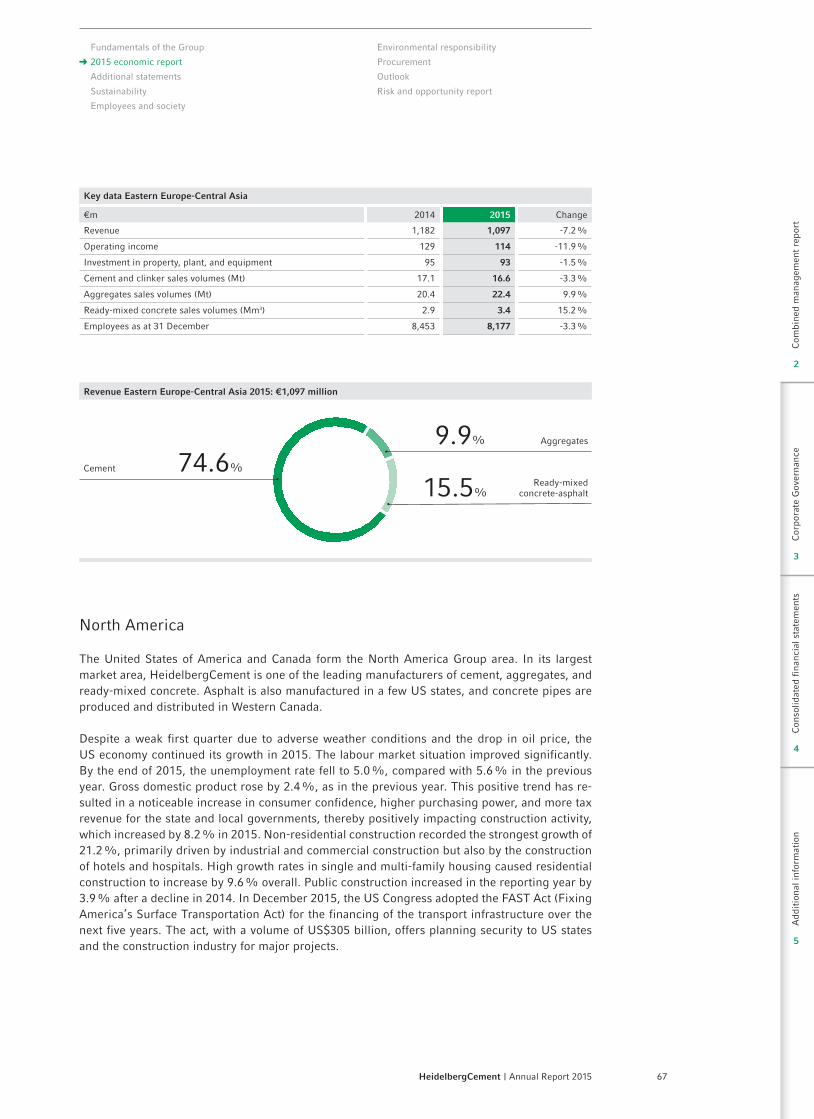
Key data Eastern Europe-Central Asia
€m 2014 2015 Change
Revenue 1,182 1,097 -7.2%
Operating income 129 114 -11.9%
Investment in property, plant, and equipment 95 93 -1.5%
Cement and clinker sales volumes (Mt) 17.1 16.6 -3.3%
Aggregates sales volumes (Mt) 20.4 22.4 9.9%
Ready-mixed concrete sales volumes (Mm3) 2.9 3.4 15.2%
Employees as at 31 December 8,453 8,177 -3.3%
Revenue Eastern Europe-Central Asia 2015: €1,097 million
North America
The United States of America and Canada form the North America Group area. In its largest market area, HeidelbergCement is one of the leading manufacturers of cement, aggregates, and ready-mixed concrete. Asphalt is also manufactured in a few US states, and concrete pipes are produced and distributed in Western Canada.
Despite a weak first quarter due to adverse weather conditions and the drop in oil price, the US economy continued its growth in 2015. The labour market situation improved significantly. By the end of 2015, the unemployment rate fell to 5.0%, compared with 5.6% in the previous year. Gross domestic product rose by 2.4%, as in the previous year. This positive trend has re-sulted in a noticeable increase in consumer confidence, higher purchasing power, and more tax revenue for the state and local governments, thereby positively impacting construction activity, which increased by 8.2% in 2015. Non-residential construction recorded the strongest growth of 21.2%, primarily driven by industrial and commercial construction but also by the construction of hotels and hospitals. High growth rates in single and multi-family housing caused residential construction to increase by 9.6% overall. Public construction increased in the reporting year by 3.9% after a decline in 2014. In December 2015, the US Congress adopted the FAST Act (Fixing America’s Surface Transportation Act) for the financing of the transport infrastructure over the next five years. The act, with a volume of US$305 billion, offers planning security to US states and the construction industry for major projects.
74.6%Cement
Aggregates9.9%
Ready-mixed concrete-asphalt15.5%
67HeidelbergCement | Annual Report 2015
Fundamentals of the Group
2015 economic report
Additional statements
Sustainability
Employees and society
Environmental responsibility
Procurement
Outlook
Risk and opportunity report
Com
bine
d m
anag
emen
t re
port
Cor
pora
te G
over
nanc
eC
onso
lidat
ed f
inan
cial
sta
tem
ents
Add
itio
nal i
nfor
mat
ion
2
3
4
5

In 2015, the Canadian economy suffered from the deteriorating oil price and the resulting sharp decline in investment activities. Gross domestic product advanced 1.2%, about half the pace recorded in 2014. According to the Winter 2015 Forecast of the Cement Association of Canada (CAC), construction activity slowed down as a whole in the reporting year. Slight growth in residential and infrastructure construction couldn’t offset a considerable decline in non- residential construction.
Cement business lineCement consumption in the USA rose by 3.8% to 92 million tonnes in 2015. In Canada, cement consumption decreased by 4.4% to 8.8 million tonnes in comparison with 2014.
Cement and clinker sales volumes of our plants, without consideration of our joint venture Texas Lehigh Cement, reached 12.3 million tonnes (previous year: 12.1), an increase of 1.9%. The North and West Regions and our two white cement plants recorded the highest rise in volumes. In Canada, sales volumes were impacted by the declining oil price and the resulting decrease in demand in the oil industry, although this impact was mitigated by successes in major construction projects. This development was also seen in the South Region, which was also impacted by adverse weather conditions. However, we were able to successfully implement price increases in all key markets in both the USA and Canada. Revenue of the cement business line rose by 22.5% in 2015 to €1,366 million (previous year: 1,115).
We finalised investments in 2015 in all US cement plants to comply with the new National Emission Standards for Hazardous Air Pollutants (NESHAP), which came into effect in September 2015.
In this context, for example, we completed a major investment in the kiln bag house at the Permanente cement plant in Cupertino, California, with the installation of a continuous emission monitoring system. In Permanente, development and testing also continued on a state-of-the-art water treatment system for discharges from the quarry containing selenium. This process is unique in North America and has been proven to be cost-effective and efficient.
In the Tehachapi cement plant, likewise in California, we have started to increase the cement grind-ing capacity. The plant has also received approval for the use of biomass and other engineered fuel as alternative fuels. In the North Region, we have continued with the construction of a limestone crushing facility for the Union Bridge, Maryland, cement plant and a 6.4 km long conveyor system, which links the cement plant to its new quarry.
In the Canadian cement plant Delta, British Columbia, a new system for the use of alternative fuels was completed, increasing the proportion of alternative fuels to 20%. A further rise to 30% or even higher is possible in the near future. At the Edmonton cement plant in the Canadian province of Alberta, we started construction of a new cement mill, which is due to be completed by mid-2017.
Aggregates business lineIn the USA and Western Canada, HeidelbergCement has a dense network of production sites for sand, gravel, and hard rock. Total sales volumes exceeded the previous year by 5.5%, with 116.6 million tonnes (previous year: 110.5). While considerable increases in volumes were recorded in the North and West Regions, sales volumes in the South market region only rose slightly due to adverse weather conditions in the southwest – mainly Texas. The Canada Region was flat; falling sales volumes in the three Prairie Provinces were offset by increasing demand in British Columbia. Price increases were successfully carried out in all key markets in the USA and Canada. Revenue of the aggregates business line rose by 28.0% to €1,471 million (previous year: 1,150).
68 HeidelbergCement | Annual Report 2015
Combined management report2

We continued to increase our production and logistics capacities in the South Region during the reporting year. This includes investments in new aggregates rail terminals and the expansion of production capacity in Texas at our Lake Bridgeport and Servtex plants. At the Sanger production site, near the Californian town of Fresno, a new aggregates plant has begun full production. The plant, which has an annual production capacity of 700,000 tonnes, will supply the market of Fresno. Around 90% of the volume will be used internally, for example to manufacture asphalt.
Ready-mixed concrete-asphalt business line While we have an extensive network of ready-mixed concrete plants throughout the Group area, asphalt production is mainly concentrated on the states of New York, Pennsylvania, and California.
Ready-mixed concrete deliveries increased by 2.7% to 6.4 million cubic metres (previous year: 6.3) in 2015. Aside from the South Region, all other market regions recorded growth. The devel-opment in the West Region, followed by Canada, was particularly pleasing. Sales volumes in the South Region remained at the previous year’s level because we divested a part of the ready-mixed concrete business in Northern Alabama.
In the reporting year, we invested in the expansion and modernisation of our fleet of ready-mixed concrete trucks throughout the Group area.
Asphalt sales volumes increased by 3.5% to 3.7 million tonnes (previous year: 3.6) in the reporting year. Our production sites in the North and West market regions registered growing demand. In asphalt production, we also benefited from the lower oil price.
To strengthen our market position in California, we acquired an asphalt plant in Visalia, the largest city in the Central Valley. The plant is strategically well located for the supply of our existing customers. The required aggregates will be obtained from the Sanger plant.
In 2015, total revenue of the ready-mixed concrete-asphalt business line rose by 18.8% to €1,039 million (previous year: 874).
Service-joint ventures-other business lineIn the first quarter of 2015, HeidelbergCement sold its building products business in North America and the United Kingdom to a subsidiary of Lone Star Funds. The concrete pipes operating line in Western Canada, which as part of an integrated business has been assigned to the service-joint ventures-other business line, was excluded from the sales agreement.
Our joint venture Texas Lehigh Cement Company LP, headquartered in Austin, Texas, is also included in this business line. The company, in which we hold a 50% stake, operates a cement plant in Buda, Texas. The cement sales volumes of this joint venture fell by a double-digit percentage during the financial year due to less demand from the oil industry and adverse weather conditions.
Revenue of the business line, which includes the concrete pipe operating line and associated activities, rose slightly by 1.9% to €262 million (previous year: 257).
Revenue and resultsAfter conversion to euro, total revenue in the North America Group area increased by 22.9% to €3,746 million (previous year: 3,049). In operational terms, i.e. excluding consolidation and exchange rate effects, revenue rose by 6.7%. As a result of the growth in sales, successfully
69HeidelbergCement | Annual Report 2015
Fundamentals of the Group
2015 economic report
Additional statements
Sustainability
Employees and society
Environmental responsibility
Procurement
Outlook
Risk and opportunity report
Com
bine
d m
anag
emen
t re
port
Cor
pora
te G
over
nanc
eC
onso
lidat
ed f
inan
cial
sta
tem
ents
Add
itio
nal i
nfor
mat
ion
2
3
4
5

implemented price rises, and strict cost management, we were able to increase operating income before depreciation (OIBD) by 35.9% to €829 million (previous year: 610); excluding currency and consolidation effects, the increase amounted to 19.5%. Operating income even rose by 41.3% to €583 million (previous year: 412); excluding consolidation and exchange rate effects, the increase was 25.9%.
Key data North America
€m 2014 2015 Change
Revenue 3,049 3,746 22.9%
Operating income 412 583 41.3%
Investment in property, plant, and equipment 214 263 23.0%
Cement and clinker sales volumes (Mt) 12.1 12.3 1.9%
Aggregates sales volumes (Mt) 110.5 116.6 5.5%
Ready-mixed concrete sales volumes (Mm3) 6.3 6.4 2.7%
Asphalt sales volumes (Mt) 3.6 3.7 3.5%
Employees as at 31 December 7,644 7,658 0.2%
Revenue North America 2015: €3,746 million
Asia-Pacific
The Asia-Pacific Group area comprises seven Asian countries and Australia. In most of the growth countries of Asia, the focus is on cement production. In Indonesia, in particular, cement capacities are currently undergoing major expansion. In Malaysia, Hong Kong, and Indonesia, Heidelberg-Cement maintains a strong market position in aggregates and ready-mixed concrete. In Australia, we have significant market positions in ready-mixed concrete and aggregates, with a dense network of production sites. We also hold a 50% participation in the largest cement company in Australia.
The emerging countries of Asia remained on course for growth in 2015, although the economic dynamics have weakened again as a whole. The Chinese economy continued to slow down. In 2015, the Chinese economy grew by 6.9%, after a rate of 7.3% in the previous year. In India, the economy showed signs of recovery in 2015. The Indian central bank anticipates economic growth of 7.4% in fiscal year 2015/16, after a growth rate of 7.0% in the previous year. In Indonesia, economic growth has decelerated further due to the declining raw material prices. Economic output rose by 4.8% in 2015 compared with 5.0% in the previous year. The government programme for the urgently needed infrastructure expansion was delayed due to bureaucratic constraints. However, infrastructure expenditure increased considerably in the second half-year. While investments in the raw material sector continued to decline in Australia, growth in the non-mining parts of the economy picked up; gross domestic product rose by 3.0% in 2015.
33.0%
Service-joint ventures-other
Cement
6.4%
Aggregates35.5%
Ready-mixed concrete-asphalt25.1%
70 HeidelbergCement | Annual Report 2015
Combined management report2

Cement business lineTotal cement and clinker sales volumes of the Asia-Pacific Group area fell by 4.5% in 2015 to 23.5 million tonnes (previous year: 24.6).
In Indonesia, our largest Asian market, construction activity in 2015 was adversely affected by the weak economic development and delays to government infrastructure projects. Domestic cement consumption rose from the third quarter of the year, but still decreased by 3% compared to the level of the previous year on a like-for-like basis. Indocement’s domestic sales volumes fell by 7.7%. The weaker development of sales volumes of Indocement in comparison with the market as a whole relates to the margin-oriented price policy of our subsidiary. Due to new capacities in the Indonesian cement market and increased competitive pressure, the average sales prices of Indocement in 2015 fell short of the previous year’s figure. Export sales volumes rose by 37% from a low level. Total cement and clinker sales volumes of Indocement decreased by 7.3%. It was possible to limit the decline in margins through disciplined pricing policy and strict cost management.
Indocement anticipates an increase in domestic cement demand based on the infrastructure programme launched by the government and its multiplier effect on the property sector. In view of the growth prospects and to ensure a more cost-efficient production, Indocement is continuing to increase its cement capacity with the expansion of the Citeureup production site. The completion of a new integrated production line with a cement capacity of 4.4 million tonnes is expected in the first quarter of 2016.
In India, construction activity and cement demand continued to be adversely affected by the weak demand for infrastructure construction and, in large parts of the country, a shortage of building materials due to legal restrictions with regard to the extraction of sand. Urban and rural residential construction did not provide any stimulus for growth either. Domestic cement production rose by around 1.5% in 2015. The deliveries of our Indian cement plants increased by 5.2%, primarily as a result of the higher utilisation of our cement capacities in central India. Since we commissioned the new facilities with a capacity of 2.9 million tonnes at our Damoh production site in the state of Madya Pradesh and at our Jhansi plant in the state of Uttar Pradesh in 2013, production has been steadily ramped-up. The sales prices fell short of the previous year’s level due to the low market growth.
In Bangladesh, political unrest in the first quarter and heavy rainfall during the monsoon period adversely impacted construction activity. Our cement deliveries registered a slight increase, although sales prices were below the previous year’s level because of intensified competition. In the Sultanate of Brunei, the construction industry benefited from national infrastructure projects, and our cement sales volumes rose considerably.
Revenue of the cement business line fell by 1.2% to €1,463 million (previous year: 1,481) as a consequence of the overall decline in sales volumes and lower sales prices.
Aggregates business lineIn the aggregates business line, HeidelbergCement is represented in Australia, Malaysia, and Indonesia. In 2015, our sales volumes of aggregates decreased by 4.6% to 35.9 million tonnes (previous year: 37.7). Excluding consolidation effects, the decline amounted to 4.3%.
In Australia, by far our biggest aggregates market in this Group area, strong demand from residential construction was recorded especially in the metropolitan areas of Melbourne, Sydney, and Brisbane. This more than offset the decrease in volumes in the mining areas of northwestern Australia and Queensland and the declining demand from road construction in some parts of the country. The
71HeidelbergCement | Annual Report 2015
Fundamentals of the Group
2015 economic report
Additional statements
Sustainability
Employees and society
Environmental responsibility
Procurement
Outlook
Risk and opportunity report
Com
bine
d m
anag
emen
t re
port
Cor
pora
te G
over
nanc
eC
onso
lidat
ed f
inan
cial
sta
tem
ents
Add
itio
nal i
nfor
mat
ion
2
3
4
5

slight overall increase in sales volumes and higher sales prices led to an improvement in revenue and results. In Indonesia and Malaysia, our aggregates activities recorded significant decreases in volumes. Supported by the positive development in Australia, the revenue of our aggregates business line rose by 1.3% to €537 million (previous year: 530).
Ready-mixed concrete-asphalt business lineIn the ready-mixed concrete business, HeidelbergCement is represented in Australia, Indonesia, and Malaysia. While we have significant asphalt activities in Malaysia, we only operate one asphalt plant in Australia.
At 10.9 million cubic metres (previous year: 11.4), the ready-mixed concrete sales volumes of the ready-mixed concrete-asphalt business line were 4.3% below the previous year’s level. The pleasing growth in volumes in Australia could not compensate the decreases in Indonesia and Malaysia. Deliveries of the asphalt operating line dropped by 9.7% to 2.0 million tonnes (previous year: 2.3) due to the weak demand in Malaysia. Revenue of the ready-mixed concrete-asphalt business line declined by 1.6% to €1,086 million (previous year: 1,103).
Service-joint ventures-other business lineThe service-joint ventures-other business line essentially comprises the cement, aggregates, and ready-mixed concrete activities of our joint ventures in the Chinese provinces of Guangdong and Shaanxi as well as in Hong Kong and our joint venture Cement Australia. We also operate two precast concrete plants in Australia in the Sydney metropolitan area, as well as activities for road construction in Malaysia.
In China, we are represented in the cement business with the two joint ventures China Century Cement and Jidong Heidelberg Cement Company in the Guangdong and Shaanxi provinces. Sales volumes of both companies in 2015 decreased by 11.1% in comparison with the previous year. The growth in sales volumes in Guangdong could not offset the decrease in Shaanxi. While our deliveries of aggregates in Hong Kong remained below the previous year, ready-mixed concrete sales volumes registered significant growth. In Guangdong, however, our ready-mixed concrete activities recorded a sharp decrease in volumes.
In Australia, the cement deliveries of our joint venture Cement Australia fell slightly short of the previous year primarily as a result of lower mining activities in Queensland.
Revenue of the business line, which only includes the two Australian precast concrete plants and the road construction activities in Malaysia, fell by 9.4% to €33 million (previous year: 36). Revenue and resultsRevenue of the Asia-Pacific Group area decreased by 1.5% to €2,775 million (previous year: 2,818); excluding consolidation and exchange rate effects, the decline amounted to 5.6%. The positive currency effect of €118 million arose largely from the strengthening of the Indian rupee and the Indonesian rupiah against the euro. Operating income before depreciation (OIBD) fell by 3.2% to €719 million (previous year: 743) compared with the previous year; excluding consolidation and exchange rate effects, it declined by 8.1%. Operating income decreased by 5.6% to €588 million (previous year: 623); excluding consolidation and exchange rate effects, it fell by 10.6%.
72 HeidelbergCement | Annual Report 2015
Combined management report2

Key data Asia-Pacific
€m 2014 2015 Change
Revenue 2,818 2,775 -1.5%
Operating income 623 588 -5.6%
Investment in property, plant, and equipment 322 247 -23.5%
Cement and clinker sales volumes (Mt) 24.6 23.5 -4.5%
Aggregates sales volumes (Mt) 37.7 35.9 -4.6%
Ready-mixed concrete sales volumes (Mm3) 11.4 10.9 -4.3%
Asphalt sales volumes (Mt) 2.3 2.0 -9.7%
Employees as at 31 December 13,482 13,029 -3.4%
Revenue Asia-Pacific 2015: €2,775 million
Africa-Mediterranean Basin
In Africa, HeidelbergCement is represented in eight countries south of the Sahara, where it almost exclusively produces cement. Our locations in the Mediterranean Basin are situated in Spain, Israel, and Turkey. In Spain and Israel, HeidelbergCement mainly produces aggregates and ready-mixed concrete. In Turkey, our joint venture Akçansa is one of the country’s leading cement manufacturers; in addition, Akçansa also runs ready-mixed concrete and aggregates operations.
Overall, the African countries south of the Sahara are continuing to experience robust economic development and lively construction activity. Solid economic growth, a young burgeoning popu-lation, and a growing urbanisation rate all lead to increased infrastructure requirements, driving a rise in construction activity and cement demand. In Ghana, however, economic recovery slowed down considerably owing to the drop in oil price, inadequate power supply, and weak national currency. In Turkey, the economy is impaired by the devaluation of the currency and high infla-tion. Nonetheless, the Turkish economic output is estimated to have risen moderately by around 3% in 2015 thanks to the lower oil price. The construction industry benefited from infrastructure projects, while residential and commercial construction weakened slightly. In Spain, the econom-ic recovery continued in 2015 with an increase in gross domestic product of 3.2%. Benefiting from the emerging revival in residential and commercial construction, the demand for building materials rose again for the first time since the start of the crisis. Infrastructure investments, how-ever, continued to be affected by the national budgetary restrictions. In Israel, economic growth remained flat at 2.6% in 2015 compared with the previous year. The high level of construction investments could be maintained, thanks to numerous infrastructure projects and a slight increase in residential construction.
46.9%
Service-joint ventures-other
Cement
1.1%
Aggregates17.2%
Ready-mixed concrete-asphalt34.8%
73HeidelbergCement | Annual Report 2015
Fundamentals of the Group
2015 economic report
Additional statements
Sustainability
Employees and society
Environmental responsibility
Procurement
Outlook
Risk and opportunity report
Com
bine
d m
anag
emen
t re
port
Cor
pora
te G
over
nanc
eC
onso
lidat
ed f
inan
cial
sta
tem
ents
Add
itio
nal i
nfor
mat
ion
2
3
4
5

Cement business lineThe cement and clinker sales volumes of the Africa-Mediterranean Basin Group area, which only includes the deliveries from our African subsidiaries, increased by 15.3% in 2015 to 7.4 million tonnes (previous year: 6.4). Excluding consolidation effects from the deconsolidation of our activities in Gabon in the previous year, the growth amounted to 16.1%. In addition to the good demand conditions in most countries, the new production capacities in Tanzania, Togo, and Burkina Faso made a particular contribution to the significant increase in volumes in Africa. In the third quarter of 2014, we commissioned a new cement mill in Tanzania and, at the end of the year, a clinker plant in Togo and a cement grinding plant in neighbouring Burking Faso. The Democratic Republic of Congo also recorded a considerable increase in sales volumes. In Ghana, however, our deliveries remained below the previous year as a result of higher imports and weak construction activity due to economic factors. Cement prices fell in some countries owing to increased competitive pressure, especially through imports. In Tanzania, in particular, sales prices were considerably below the previous year’s level. The falling cost for clinker imports and efficiency improvements, particularly the commissioning of the new plant in Togo, have offset the pressure on prices. Revenue of the cement business line rose by 12.8% to €701 million (previous year: 622).
In light of the good growth prospects, HeidelbergCement is expanding its activities in Africa. In Togo, HeidelbergCement officially opened its first newly constructed clinker plant in Africa at the start of March 2015. The plant, with an annual capacity of 1.5 million tonnes, is located near the town of Tabligbo, around 80 km to the northeast of the capital Lomé. It started production at the end of 2014 and supplies clinker to HeidelbergCement’s cement grinding plants in Togo and the neighbouring countries of Benin, Burkina Faso, and Ghana, reducing the need for expensive clinker imports. Moreover, we are constructing a cement grinding facility with a capacity of around 250,000 tonnes in the north of Togo which is scheduled for completion for the first half of 2017.
At the beginning of March 2015, the cement grinding plant that was completed in Burkina Faso in the fourth quarter of 2014 was officially opened. This plant, which is located near the capital Ouagadougou, has a capacity of 0.8 million tonnes. In Ghana, a new cement mill with a capacity of 0.8 million tonnes was opened at the Takoradi grinding plant at the end of March 2015. After the successful completion of the test runs, we have a total cement grinding capacity of 4.4 million tonnes in Ghana. We are also expanding our cement capacity in Benin with the construction of another cement mill at the Cotonou grinding plant. The commissioning of the new mill with a capacity of 250,000 tonnes is scheduled for 2017. In the Democratic Republic of Congo, we are constructing a new integrated production line in our Cimenterie de Lukala cement plant. With completion planned for the end of 2017, the cement capacity of the plant, which is located near to the capital of Kinshasa, will increase to 0.8 million tonnes. We are also evaluating options for capacity expansions in other African countries.
Aggregates business lineHeidelbergCement is active in Spain and Israel in the aggregates business line. In both countries, we achieved increases in sales volumes. As a whole, the Group area’s deliveries of aggregates rose by 2.6% to 11.1 million tonnes (previous year: 10.8); excluding consolidation effects, the increase in volumes amounted to 3.7%. Revenue of the aggregates business line grew by 8.1% to €93 million (previous year: 86).
Ready-mixed concrete-asphalt business lineIn the Africa-Mediterranean Basin Group area, HeidelbergCement operates ready-mixed concrete plants in Spain and Israel. The asphalt operating line is only represented in Israel. Deliveries of ready-mixed concrete rose slightly by 0.9% to 3.0 million cubic metres (previous year: 3.0) in
74 HeidelbergCement | Annual Report 2015
Combined management report2
2015. In Spain, our ready-mixed concrete sales volumes increased for the first time since 2007. We also recorded a slight growth in Israel. The asphalt operating line in Israel achieved an increase in sales volumes of 2.7% to 0.4 million tonnes (previous year: 0.4). Revenue of the ready-mixed concrete-asphalt business line rose by 7.0% to €221 million (previous year: 207).
Service-joint ventures-other business lineThe service-joint ventures-other business line essentially includes the cement, aggregates, and ready-mixed concrete activities of our Turkish joint venture Akçansa. In the reporting year, the domestic cement sales volumes of Akçansa slightly exceeded the previous year, thereby achieving a new record. Cement exports also rose. In total, Akçansa’s cement and clinker sales volumes recorded a slight increase of 1.3%. Deliveries of aggregates and ready-mixed concrete, however, fell short of the previous year’s volumes. Overall, Akçansa achieved an improvement in results due to the good domestic demand for cement and positive development of prices in all business lines.
Revenue of the business line, which only includes some smaller non-core activities in the transport and other services divisions in Israel and Spain, rose by 50.0% to €53 million (previous year: 35).
Revenue and resultsRevenue of the Africa-Mediterranean Basin Group area increased by 10.8% to €1,008 million (previous year: 910). In operational terms, i.e. excluding consolidation and exchange rate effects, growth of 11.4% was achieved. At €260 million (previous year: 213), operating income before depreciation (OIBD) came in 22.5% above the previous year; excluding exchange rate effects, the increase amounted to 23.9%. Operating income improved by 17.8% to €216 million (previous year: 184); excluding consolidation and exchange rate effects, the growth amounted to 19.8%.
Key data Africa-Mediterranean Basin
€m 2014 2015 Change
Revenue 910 1,008 10.8%
Operating income 184 216 17.8%
Investment in property, plant, and equipment 122 56 -54.5%
Cement and clinker sales volumes (Mt) 6.4 7.4 15.3%
Aggregates sales volumes (Mt) 10.8 11.1 2.6%
Ready-mixed concrete sales volumes (Mm3) 3.0 3.0 0.9%
Asphalt sales volumes (Mt) 0.4 0.4 2.7%
Employees as at 31 December 2,811 2,690 -4.3%
Revenue Africa-Mediterranean Basin 2015: €1,008 million
65.6%Cement
Aggregates8.7%
Service-joint ventures-other5.0%
Ready-mixed concrete-asphalt20.7%
75HeidelbergCement | Annual Report 2015
Fundamentals of the Group
2015 economic report
Additional statements
Sustainability
Employees and society
Environmental responsibility
Procurement
Outlook
Risk and opportunity report
Com
bine
d m
anag
emen
t re
port
Cor
pora
te G
over
nanc
eC
onso
lidat
ed f
inan
cial
sta
tem
ents
Add
itio
nal i
nfor
mat
ion
2
3
4
5

Group Services
Group Services comprises the activities of our subsidiary HC Trading, one of the world’s largest inter-national trading companies for cement and clinker. It is responsible for the global maritime trading of cement, clinker, and other building materials produced by HeidelbergCement plants, among others. It also purchases and delivers coal and petroleum coke via sea routes to our own locations and to other cement companies around the world.
The global trading network of HC Trading has employees from 27 countries at strategically important locations in Malta, Istanbul, Singapore, Shanghai, Dubai, Australia, and Madagascar, as well as representations in Peru, Brazil, Spain, Bangladesh, and Vietnam. This network enables us to maximise the capacity utilisation of our plants and deliver surplus production from one country to another where demand for cement and clinker is higher. HC Trading increased its trade volume in the reporting year by 1.0% to 21.7 million tonnes (previous year: 21.5) while revenues decreased by 1.6% to €1,060 million (previous year: 1,077) due to declining prices in international commodity markets. 27% of these deliveries were within the Group, while 73% went to other international companies that make use of our competitive and efficient global trading network.
Due to shrinking worldwide trading volumes, deliveries of cement, clinker, and other building products, such as lime and dry mortar, decreased by 3.6% to 14.6 million tonnes (previous year: 15.1) in 2015. The largest volumes were destined for Africa (especially Kenya and Ghana), Asia (mainly Bangladesh), and North and South America. The key supply countries were Turkey, China, the United Arab Emirates, Portugal, and Spain.
International trading in coal and petroleum coke increased in the reporting year by 11.9% to 7.2 million tonnes (previous year: 6.4) after growth of 30% in 2014. In addition to Group-owned cement plants, HC Trading supplied the global cement industry in Africa, Europe, the Middle East, and Asia. The key supply countries were the USA, South Africa, and Australia.
Overall, more than 950 ships transported HC Trading goods in 2015, mostly via the main sea routes of Asia, the Mediterranean Basin, and Continental Europe, to their destinations in Africa, the Middle East, and South America. Thanks to its sophisticated in-house shipping department, HC Trading is able to respond quickly to changing market conditions.
Revenue and resultsRevenue in Group Services decreased by 1.6% to €1,060 million (previous year: 1,077) driven by lower prices in international commodity markets. Operating income before depreciation (OIBD) declined by 6.6% to €25 million (previous year: 27) despite increased trading volumes. Operating income declined similarly to €25 million (previous year: 27)
Key data Group Services
€m 2014 2015 Change
Revenue 1,077 1,060 -1.6%
Operating income 27 25 -6.8%
Employees as at 31 December 79 81 2.5%
76 HeidelbergCement | Annual Report 2015
Combined management report2

Discontinued operations
Net loss from discontinued operations of €36 million includes income of €16 million relating to the sale of the building products business in North America and the United Kingdom (Hanson Building Products), which was concluded on 13 March 2015, and expenses of €52 million relating to damages and environmental obligations for US subsidiaries of the Hanson Group, which was taken over in 2007.
In the context of the sale of Hanson Building Products, an amount of up to US$100 million is conditional on the company’s business success in 2015 and payable in 2016.
Statement of cash flows
The statement of cash flows in 2015 is essentially characterised by the disposal of the building products business in North America and the United Kingdom. The cash flow from investing activities of discontinued operations of €1,245 million (previous year: -14) is made up of the disposal proceeds of €1,265 million after the deduction of cash and cash equivalents and ongoing capital spending in the first quarter of 2015. The financial resources gained from this disposal and from operating activities were used for investments in continuing operations and the reduction in net debt.
The cash inflow from operating activities (internal financing capability) remained almost unchanged despite the strong operational development. The main reason is the negative development of the cash flow from operating activities of discontinued operations due to the sale of the building products business. The cash inflow from operating activities of continuing operations rose by €137 million to €1,511 million (previous year: 1,374), essentially due to the increase of €242 million to €2,622 million (previous year: 2,380) in the cash flow before interest received and paid and income taxes paid. In contrast, the decrease in provisions through cash payments rose by €21 million to €244 million (previous year: 223), and income taxes paid increased by €38 million to €353 million (previous year: 315). The decline of €101 million in interest received to €92 million (previous year: 193) is particularly due to special items arising from the settlement of interest rate swaps in the 2014 financial year. Interest payments fell by €50 million to €584 million (previous year: 634), essentially as a result of the decrease in net debt.
However, the increase in working capital of €22 million (previous year: 27), which is cash- relevant and recognised in the income statement, adversely impacted the change in cash and cash equivalents.
Cash outflow from investing activities of continuing operations declined by €207 million to €752 million (previous year: 959). Cash-relevant investments fell by €123 million to €1,002 million (previous year: 1,125). Of this figure, €539 million (previous year: 489) related to investments for sustaining and optimising our capacities and €463 million (previous year: 635) to capacity expan-sions. Further details can be found in the Investments section on page 78 f. and in the Business combinations in the reporting year section of the Notes on page 194 f.
Financing activities of continuing operations generated a cash outflow of €1,822 million (previous year: 717) in the reporting year. The cash outflow arising from the net proceeds from and repay-ment of bonds and loans of €1,436 million (previous year: 422) included in this figure covers the
77HeidelbergCement | Annual Report 2015
Fundamentals of the Group
2015 economic report
Additional statements
Sustainability
Employees and society
Environmental responsibility
Procurement
Outlook
Risk and opportunity report
Com
bine
d m
anag
emen
t re
port
Cor
pora
te G
over
nanc
eC
onso
lidat
ed f
inan
cial
sta
tem
ents
Add
itio
nal i
nfor
mat
ion
2
3
4
5

change in non-current and current financial liabilities and essentially comprises the repayment of two bonds for €650 million each in August and December 2015. This item also includes the utilisation of the syndicated credit facility, repayments under the EMTN programme, outflows from the repayment of issued commercial papers and bank debts, as well as changes to other current financial liabilities with high turnover rate. In the previous year, a bond of €1 billion that matured in October 2014 was repaid; moreover, a bond of €500 million was issued in March 2014. Dividend payments led to a cash outflow of €369 million (previous year: 278), with dividend payments of HeidelbergCement AG making up €140.9 million (previous year: 112.5) of this figure.
Cash flows from operating activities as well as investing and financing activities of discontinued operations relate to the divested building products business in North America and the United Kingdom.
In the 2015 financial year, HeidelbergCement was able to meet its payment obligations at all times.
Consolidated statement of cash flows (short form)
€m 2014 2015 Difference
Cash flow 1,624 1,777 153
Changes in working capital -27 -22 5
Decrease in provisions through cash payments -223 -244 -21
Cash flow from operating activities – continuing operations 1,374 1,511 137
Cash flow from operating activities – discontinued operations 106 -61 -167
Cash flow from operating activities 1,480 1,449 -31
Investments (cash outflow) -1,125 -1,002 123
Other inflows of cash and cash equivalents 165 249 84
Cash flow from investing activities – continuing operations -959 -752 207
Cash flow from investing activities – discontinued operations -14 1,245 1,259
Cash flow from investing activities -973 493 1,466
Capital increase/decrease – non-controlling shareholders 1 -3 -4
Dividend payments -278 -369 -90
Changes in ownership interests in subsidiaries -17 -15 3
Net proceeds from/repayment of bonds and loans -422 -1,436 -1,013
Cash flow from financing activities – continuing operations -717 -1,822 -1,105
Cash flow from financing activities – discontinued operations -1 -5 -3
Cash flow from financing activities -718 -1,827 -1,108
Effect of exchange rate changes 88 7 -81
Change in cash and cash equivalents -123 122 245
Investments
Strict spending discipline regarding investments continued to form a significant cornerstone of our rigid and consistent cash management in 2015. Cash-relevant investments declined to €1,002 million in the reporting year (previous year: 1,125). As a result, our investments remained significantly below the originally planned amount of €1.2 billion. However, the investment goal of €0.9 billion, which was reduced in connection with the Italcementi acquisition, was not fully achieved. €908 million (previous year: 941) were invested in property, plant, and equipment (including intangible assets). Investments in financial assets and other business units amounted to €94 million (previous year: 184).
78 HeidelbergCement | Annual Report 2015
Combined management report2

Investments in property, plant, and equipment related partly to maintenance, optimisation, and environmental protection measures at our production sites in all Group areas. One focus in the area of optimisation and environmental protection is on the projects of the “Germany Cement Master Plan” for modernisation and efficiency improvements, as well as environmental protection, in our German cement plants. In the USA, we carried out investments in all cement plants to meet the new National Emission Standards for Hazardous Air Pollutants (NESHAP) that came into effect in September 2015. At the Fieni plant in Romania, we commissioned a facility for power generation from kiln waste heat in July 2015. Similar power generation facilities also started at our Damoh plant in India and our Guangzhou plant in China, at the end of the year.
In 2015, we also made targeted investments in Asia and Africa in order to lay the foundations for future growth. By far the largest project is the construction of a new integrated production line at the Indonesian Citeureup production site with a cement capacity of 4.4 million tonnes. The most important investment project in Africa is the capacity expansion of our Cimenterie de Lukala cement plant in the Democratic Republic of Congo with the building of a new integrated production line. Further investments related to the expansion of our cement grinding capacities in Ghana, Togo, Burkina Faso, and Benin.
The investments in financial assets and other business units related primarily to smaller bolt-on acquisitions of shareholdings in the Western and Northern Europe and Eastern Europe-Central Asia Group areas. The payment of €18.9 million was cash-relevant, due to a standard working capital adjustment clause in the context of the merger of our Swedish subsidiary Abetong AB and Contiga AB into Nordic Precast Group AB, but did not have any impact on net debt as more cash and cash equivalents of the same amount were available from the working capital of Contiga AB.
Investments
€m 2014 2015 Change
Western and Northern Europe 188 249 32.3%
Eastern Europe-Central Asia 95 93 -1.5%
North America 214 263 23.0%
Asia-Pacific 322 247 -23.5%
Africa-Mediterranean Basin 122 56 -54.5%
Group Services 0 0
Financial assets and other business units 184 94 -48.8%
Total 1,125 1,002 -10.9%
Investments in property, plant, and equipment by business lines in 2015
20.3%
Ready-mixed concrete-asphalt
Aggregates
14.6%Cement 59.3%
Service-joint ventures-other5.8%
79HeidelbergCement | Annual Report 2015
Fundamentals of the Group
2015 economic report
Additional statements
Sustainability
Employees and society
Environmental responsibility
Procurement
Outlook
Risk and opportunity report
Com
bine
d m
anag
emen
t re
port
Cor
pora
te G
over
nanc
eC
onso
lidat
ed f
inan
cial
sta
tem
ents
Add
itio
nal i
nfor
mat
ion
2
3
4
5

Consolidated balance sheet
The balance sheet total grew by €242 million to €28,374 million (previous year: 28,133) as at 31 December 2015.
Non-current assets increased by €1,159 million to €23,668 million (previous year: 22,509). Fixed assets rose by €952 million to €22,142 million (previous year: 21,190). Exchange rate effects totalled €799 million.
Property, plant, and equipment increased by €378 million to €9,871 million (previous year: 9,493). The key changes concern additions to property, plant, and equipment of €882 million, positive exchange rate effects of €237 million, depreciation, amortisation, and impairment totalling €751 million, and disposals of €56 million.
Financial assets remained constant at €1,832 million. The increase in the carrying amount of €70 million relating to joint ventures and associates accounted for using the equity method offset a decline of €70 million in long-term loans granted, derivative financial instruments, and financial investments.
Deferred tax assets, which originate for the most part from the capitalisation of tax losses carried forward and tax credits, grew by €117 million to €805 million (previous year: 688). The rise in other non-current receivables of €94 million to €711 million (previous year: 616) is largely attributable to the valuation of plan assets from defined benefit pension plans.
Current assets increased by €463 million to €4,707 million (previous year: 4,244). Inventories grew by €47 million to €1,444 million (previous year: 1,397). Trade receivables grew by €157 million to €1,215 million (previous year: 1,057), primarily as a result of revenue and weather conditions. The change in cash and cash equivalents is explained in more detail in the Statement of cash flows section on page 77 f.
On the equity and liabilities side, equity rose by €1,731 million to €15,976 million (previous year: 14,245). This is essentially attributable to the profit for the financial year of €983 million, currency translation differences of €1,004 million, and actuarial losses of €94 million. Dividends to shareholders of HeidelbergCement AG of €141 million and to shareholders of non-controlling interests of €228 million reduced equity by a total of €369 million. The consolidated statement of changes in equity is explained in detail on pages 176/77.
The drop of €1,510 million in interest-bearing liabilities to €6,712 million (previous year: 8,222) mainly resulted from the repayment of bonds in August and December totalling €1.3 billion and the repayment of commercial papers to the amount of €227 million.
Provisions decreased by a total of €22 million to €2,423 million (previous year: 2,445). The decline of €99 million in pension provisions is essentially owing to higher discount rates. Other provisions rose by €77 million, of which €95 million is due to currency translation and €-43 million to utilisation, additions, and reversals.
The growth of €271 million in operating liabilities to €2,827 million (previous year: 2,557) is largely attributable to the increase in other current operating liabilities and currency effects.
80 HeidelbergCement | Annual Report 2015
Combined management report2

In the 2015 financial year, the net debt-to-equity ratio (gearing) fell by 15.7 percentage points to 33.1% (previous year: 48.8%), which was primarily due to exchange rate effects in equity in addition to the decrease of €1,671 million in net debt to €5,286 million (previous year: 6,957).
Consolidated balance sheet (short form)
€m 31 Dec. 2014 31 Dec. 2015Part of balance
sheet total 2015
Intangible assets and property, plant, and equipment 19,358 20,310 72%
Financial assets 1,832 1,832 6%
Other non-current assets 1,319 1,526 5%
Current assets 4,244 4,707 17%
Assets held for sale and discontinued operations 1,380
Shareholders’ equity and non-controlling interests 14,245 15,976 56%
Non-current liabilities 8,638 7,531 27%
Current liabilities 5,028 4,867 17%
Liabilities associated with assets held for sale and discontinued operations 222
Balance sheet total 28,133 28,374 100%
Key financial ratios
2013 2014 2015
Assets and capital structure
Equity / total capital 47.6% 50.6% 56.3%
Net debt / balance sheet total 28.0% 24.7% 18.6%
Non-current capital / fixed assets 102.4% 108.0% 106.2%
Gearing (net debt / equity) 58.7% 48.8% 33.1%
Earnings per share
Earnings per share (€) 3.93 2.59 4.26
Profitability
Return on total assets before taxes 6.0% 5.3% 6.3%
Return on equity 6.5% 6.1% 6.4%
Return on revenue 6.7% 6.9% 7.6%
Capital efficiencyTarget of HeidelbergCement is to achieve a ROIC (Return On Invested Capital) equivalent to at least the weighted average cost of capital (WACC). HeidelbergCement defines the WACC as weighted average of the country specific cost of capital. The weighting is based on the invested capital. The company specific risk and the capital structure of HeidelbergCement as well as the various country risks are taken into account for determining the cost of capital.
According to HeidelbergCement, weighted cost of capital relevant for evaluating capital efficiency amounted to 7.0% at the end of 2015. ROIC of HeidelbergCement was 7.1% (previous year: 5.9%) for 2015. Impairment and restructuring expenses had only a slightly negative impact on ROIC in the reporting year. In 2014, ROIC was additionally impacted by the reclassification of the building products business in North America and the United Kingdom into discontinued operations. Excluding these negative effects, ROIC amounted to 7.2% (previous year: 6.7%). Thanks to further improvements in 2015, compared to the previous year, HeidelbergCement earned a premium on its cost of capital for the first time since the beginning of the financial and economic crisis.
81HeidelbergCement | Annual Report 2015
Fundamentals of the Group
2015 economic report
Additional statements
Sustainability
Employees and society
Environmental responsibility
Procurement
Outlook
Risk and opportunity report
Com
bine
d m
anag
emen
t re
port
Cor
pora
te G
over
nanc
eC
onso
lidat
ed f
inan
cial
sta
tem
ents
Add
itio
nal i
nfor
mat
ion
2
3
4
5

Group financial management
Financial principles and goalsThe objective of external financing and safeguarding of liquidity is to ensure sufficient liquidity for the Group at all times. The crisis in the international capital markets has emphasised how important it is to focus on liquidity.
Our external financial flexibility is primarily assured by capital markets and a group of major international banks. Within the Group the principle of internal financing applies, i.e. financing requirements of subsidiaries are – where possible – covered by internal loan relationships. In 2015, our subsidiaries were financed according to this principle primarily by our finance company HeidelbergCement Finance Luxembourg S.A. (HC Finance Luxembourg S.A.) based in Luxem-bourg and by HeidelbergCement AG. This central financing principle ensures a uniform presence in the capital markets and also in relation to rating agencies, it eliminates structural benefits for individual creditor groups, and strengthens our negotiating position with credit institutions and other market participants. Furthermore, it enables us to allocate liquidity in the most efficient way and to monitor and eliminate the financial risk positions (currencies and interest) across the Group on the basis of net positions
The Group companies use either liquidity surpluses from other subsidiaries in cash pools (Germany, Scandinavia/Baltic States, USA, Benelux countries, Australia, United Kingdom, Canada, Czech Republic, Russia, Spain, and other countries) or are provided with intra-Group loans from HC Finance Luxembourg S.A. or HeidelbergCement AG. In some cases, the Group Treasury department also arranges credit lines for subsidiaries with local banks in order to accommodate legal, tax, or other conditions. Local financing is mainly used for particularly small volumes.
Financing measures2015 was characterised by the successful conclusion of €4.4 billion in bridge financing to secure the financial obligations arising from the takeover of Italcementi S.p.A.
On 28 July 2015, we entered into a purchase agreement with Italmobiliare S.p.A., Italy, for its 45% shareholding in Italcementi S.p.A., listed in Milan, Italy (“share purchase agreement”). The acquisition price (subject to contractual reductions to the purchase price) is €10.60 per Italcementi share and therefore totals approximately €1.67 billion. To cover some of the purchase price, Italmobiliare S.p.A. will receive a minimum of 7.75 million and a maximum of 10.5 million new no-par value shares of HeidelbergCement AG from a capital increase against contributions in kind that has yet to be carried out and will then hold at least 3.96% and no more than 5.29% of the increased subscribed share capital of HeidelbergCement AG. The conclusion of the share purchase agreement is subject, among other things, to the approval of the transaction by com-petition authorities, particularly in Europe and the USA, and is anticipated for the first half of 2016. In the event that the share purchase agreement is concluded, HeidelbergCement AG or one of its participations will propose a public mandatory takeover offer (cash offer) under Italian law to all other Italcementi shareholders for the acquisition of their shares at a price determined under applicable law, which at present is likely to be €10.60. If the price paid per share at the time of conclusion is reduced by certain price-adjusting mechanisms provided for in the share purchase agreement, the price to be paid as part of the mandatory takeover offer is also likely to be reduced correspondingly. This will lead to a payment of €2 billion to the other Italcementi shareholders, provided that the offer is accepted by all shareholders.
82 HeidelbergCement | Annual Report 2015
Combined management report2

The financing of the acquisition is secured by €4.4 billion in bridge financing, which is made available by a bank consortium. The bridge financing has a duration of 18 months and an option to extend it for two further nine-month periods. On 21 August 2015, we successfully syndicated the bridge financing for the acquisition of Italcementi. All core banks of HeidelbergCement have participated equally in the syndication of the credit line that was originally provided by Deutsche Bank and Morgan Stanley. These were: Bank of America Merrill Lynch, Bayern LB, BNP Paribas, Citibank, Commerzbank, Danske Bank A/S, Deutsche Bank, Helaba, ING Bank, Intesa Sanpaolo, LBBW, Mediobanca, Nordea, RBI, RBS, SEB, Standard Chartered, Svenska Handelsbanken, and Morgan Stanley.
The financing volume of the bridge financing was subsequently reduced by €600 million, from €4.4 billion to €3.8 billion. The risk of a mandatory offer to minority shareholders in Morocco that was initially taken into account could be mostly excluded. At the end of October 2015, we took a further step towards the optimisation of the financing of the Italcementi acquisition. The financing volume of the bridge financing could be reduced by a further €500 million, from €3.8 billion to €3.3 billion as at the balance sheet date. Accordingly, the refinancing requirement on the bond market decreased by €500 million to around €2.5 billion. A decisive factor in the reduction of the financing volume was that some of the banks financing Italcementi have agreed to waive their change of control clauses. As a result, additional credit lines of €500 million will be available to HeidelbergCement on a long-term basis even after the acquisition has been successfully concluded. The refinancing of these credit lines after the takeover is thus no longer necessary and the bridge financing volume was reduced accordingly. After the balance sheet date, the bridge financing was further reduced by €0.6 billion.
As already communicated in the announcement of the Italcementi acquisition, the bridge financing is to be refinanced through free cash flow, the sale of locations, and the issue of bonds. The reduction in the bridge financing volume therefore also decreases the refinancing requirement on the bond market by the same amount.
As at 31 December 2015, only €324.2 million had been drawn upon the syndicated credit facility which acts as HeidelbergCement’s liquidity back-up. The free credit line amounted to €2,675.8 million at year-end 2015 (see following table). Overall, it is thereby ensured that all Group companies have sufficient headroom for cash drawdowns as well as for letters of credit and guarantees to enable them to successfully finance operational business and new investments.
Credit line
€m 31 Dec. 2015
Syndicated facility (SFA) 3,000.0
Utilisation (cash) 116.9
Utilisation (guarantee) 207.3
Free credit line 2,675.8
Due to the excellent progression of debt reduction and operational performance, the credit margin was lowered from 95 basis points to 75 basis points in the reporting year.
According to the terms and conditions of all the bonds issued since 2009 and the debt certificate issued in December 2011, there is a limitation on incurring additional debt if the consolidated coverage ratio (i.e. the ratio of the aggregate amount of the consolidated EBITDA to the aggregate amount of the consolidated interest expense) of the HeidelbergCement Group is below 2. The
83HeidelbergCement | Annual Report 2015
Fundamentals of the Group
2015 economic report
Additional statements
Sustainability
Employees and society
Environmental responsibility
Procurement
Outlook
Risk and opportunity report
Com
bine
d m
anag
emen
t re
port
Cor
pora
te G
over
nanc
eC
onso
lidat
ed f
inan
cial
sta
tem
ents
Add
itio
nal i
nfor
mat
ion
2
3
4
5

consolidated EBITDA of €2,499 million and the consolidated interest expense of €441 million are calculated on a pro forma basis in accordance with the terms and conditions of the bonds. At the end of 2015, the consolidated coverage ratio amounted to 5.67. In the reporting year, net debt fell by €1.7 billion, and amounted to €5.3 billion (previous year: 7.0) as at 31 December 2015. The dynamic gearing ratio improved to 2.0x (previous year: 3.0x).
The following table shows the new issues and repayments of HeidelbergCement Group in 2015.
New issues and repayments of HeidelbergCement Group
Transaction Offering date Duration Maturity date Nominal volume
Yield
New issue bridge facility 2015-07-28 18 months 2017-01-28 €m 4,400 variable
Reduction bridge facility 2015-08-04 18 months 2017-01-28 €m 600 variable
Reduction bridge facility 2015-10-21 18 months 2017-01-28 €m 500 variable
Repayment 2015-06-09 10 years 2015-06-09 €m 30 variable
Repayment 2010-01-19 6 years 2015-08-03 €m 650 6.500%
Repayment 2010-07-01 5 years 2015-12-15 €m 650 6.750%
The following tables show the financial liabilities of HeidelbergCement Group as at 31 December 2015.
Bonds payable
Issuer€m
Nominal volume
Book value
Coupon rate in %
Offering date
Maturity date
ISIN
HC Finance Luxembourg S.A. 300.0 304.0 4.000 2012-03-08 2016-03-08 XS0755521142
Hanson Limited US$m 750 690.6 707.4 6.125 2006-08-16 2016-08-15 US411349AA15
HC Finance Luxembourg S.A. 1,000.0 1,039.5 8.000 2009-10-21 2017-01-31 XS0458230322
HC Finance Luxembourg S.A. CHFm 150 137.8 138.4 7.250 2011-11-14 2017-11-14 CH0140684512
HC Finance Luxembourg S.A. 480.0 495.9 5.625 2007-10-22 2018-01-04 DE000A0TKUU3
HC Finance Luxembourg S.A. 500.0 506.2 9.500 2011-10-05 2018-12-15 XS0686703736
HC Finance Luxembourg S.A. 500.0 513.1 2.250 2014-03-12 2019-03-12 XS1044496203
HC Finance Luxembourg S.A. 500.0 497.7 8.500 2009-10-21 2019-10-31 XS0458685913
HC Finance Luxembourg S.A. 750.0 753.7 7.500 2010-01-19 2020-04-03 XS0478803355
HC Finance Luxembourg S.A. 300.0 314.2 3.250 2013-10-24 2020-10-21 XS0985874543
HC Finance Luxembourg S.A. 500.0 524.9 3.250 2013-12-12 2021-10-21 XS1002933072
Total 5,795.2
Bank loans
Issuer€m
Nominal volume
Book value
Coupon rate in % Offering date
Maturity date
Debt certificates
HeidelbergCement AG 173.5 175.2 6.770 2011-12-20 2016-10-31
Syndicated facility
HeidelbergCement AG 116.9 105.4 2014-02-25 2019-02-25
Others
HeidelbergCement Group 240.6
Total 521.3
84 HeidelbergCement | Annual Report 2015
Combined management report2

Other interest-bearing liabilities
Issuer€m
Nominal volume
Book value
Commercial Paper
HeidelbergCement AG 207.0 207.0
Others
HeidelbergCement Group 158.0
Total 365.0
Non-controlling interests with put options
€m Book value
Non-controlling interests with put options 30.1
Total 30.1
The following table shows the main liquidity instruments as at 31 December 2015.
Liquidity instruments
€m 31 Dec. 2015
Cash and cash equivalents 1,350.5
Liquidable financial investments and derivative financial instruments 75.1
Free credit line 2,675.8
Free liquidity 4,101.4
RatingIn the 2015 financial year, the company‘s credit rating by the rating agencies Moody’s and Fitch Ratings remained stable at Ba1 and BB+, respectively. At the end of March 2015, Moody’s raised the outlook for our credit rating (Ba1/Not Prime) from stable to positive. The change in the outlook was based on the good business development and the decline in net debt in the 2014 financial year, the cash inflow from the sale of the building products business, and the anticipation of a positive economic development in our main markets of North America, United Kingdom, Germany, and Indonesia. Following HeidelbergCement’s announcement at the end of July 2015 that it intends to acquire the Italian building materials company Italcementi, Moody’s confirmed the rating of HeidelbergCement and changed its outlook from positive to stable in view of the challenges relating to the pending takeover and integration processes. The stable outlook reflects the prudent financing of the Italcementi acquisition through the issue of new shares, the sale of non-core activities and plants in regions with overlaps, and the issue of bonds, as well as the operating cash flow. The strategic rationale of the planned takeover is viewed as positive by Moody’s due to the complementary geographical presence of the two companies and the considerable added value potential through the realisation of synergies. Our aim is to reduce the dynamic gearing ratio again after the acquisition to a level that enables an investment grade rating as early as the end of 2016.
We were able to successfully continue issuance activity in the money market during 2015 and issued a total volume of €2.8 billion via our €1.5 billion Euro Commercial Paper Programme over the course of 2015. At the end of the year, issuance activity under the Commercial Paper Programme was gradually reduced in order to limit excess liquidity at the end of the year. As at 31 December 2015, €207 million of the Commercial Paper issued by HeidelbergCement AG remained outstanding. The €3 billion syndicated credit facility thereby serves as a backup line.
85HeidelbergCement | Annual Report 2015
Fundamentals of the Group
2015 economic report
Additional statements
Sustainability
Employees and society
Environmental responsibility
Procurement
Outlook
Risk and opportunity report
Com
bine
d m
anag
emen
t re
port
Cor
pora
te G
over
nanc
eC
onso
lidat
ed f
inan
cial
sta
tem
ents
Add
itio
nal i
nfor
mat
ion
2
3
4
5

Ratings as at 31 December 2015
Rating agency Long-term rating Outlook Short-term rating
Moody‘s Ba1 stable Not Prime
Fitch BB+ stable B
The consistent and successful reduction of net debt over recent years is reflected by the positive development of our credit ratings between 2009 and 2015:
Development of ratings 2009–2015
Statements on HeidelbergCement AG
In addition to the Group reporting, the parent company’s development is described below. In contrast to the consolidated financial statements, the annual financial statements of Heidelberg-Cement AG are prepared in accordance with German commercial law. HeidelbergCement AG’s management report is combined with that of the HeidelbergCement Group in accordance with § 315, section 3 of the German Commercial Code (Handelsgesetzbuch, HGB), as the business trend, economic position, and future opportunities and risks of the parent company are closely linked with the Group on account of their common activity in the building materials business.
As the controlling company, HeidelbergCement AG plays the leading role in the Heidelberg Cement Group. It is also operationally active in Germany in the cement business line with eleven cement plants and grinding facilities. The results of HeidelbergCement AG are significantly influenced by its directly and indirectly held subsidiaries and participations. The business development of HeidelbergCement AG is subject to the same risks and opportunities as the business development of the Group. Regarding financing, HeidelbergCement AG plays the key role within the Group. Due to the links between HeidelbergCement AG and its subsidiaries as well as its importance in
2009
Fitch
Moody’s
2010 2011 2012 2013 2014 2015
BBB-/Baa3
BB+/Ba1
B-/B3
BB+/Ba1
BB/Ba2
BB-/Ba3
B+/B1
B/B2
86 HeidelbergCement | Annual Report 2015
Combined management report2

the Group, the outlook for the Group also reflects the expectations for HeidelbergCement AG to a large extent. Therefore, the statements in the Management Report apply likewise for the Group and HeidelbergCement AG.
An agreement on the sale of the German lime operating line was concluded with the Belgian Lhoist Group on 18 December 2014. In a first step, the sale of the Istein lime plant belonging to HeidelbergCement AG with the associated participation in the kiln company HC Kalkproduktions --gesellschaft Istein mbH, Heidelberg, Germany, to the Belgian Lhoist Group was completed on 30 June 2015. The divestment of Walhalla Kalk GmbH & Co. KG, a majority participation in Regensburg, Germany, took place in a second step on 31 August 2015.
In 2015, the business development in Germany was adversely impacted by declining shipments, after demand for building materials had risen considerably in the previous year as a result of the mild winter weather. Successful price increases were only partially able to compensate for this effect.
Total revenue of HeidelbergCement AG fell by €24 million to €521 million (previous year: 545). The decline in revenue in cement and clinker amounts to €15 million (-2.85%) and is essentially due to lower cement and clinker sales volumes as a result of the weaker market development. Following the sale of the Istein lime plant on 30 June 2015, the building products business line only generated low revenue, that fell by €9 million in the financial year in comparison with the previous year. Material costs declined by 4.7%, or €9 million, to €193 million (previous year: 202). This was due to the lower cement and clinker production, the general market development of raw materials and energy prices, as well as the discontinuation of the lime activities in the third quarter of 2015. Other operating income increased to €175 million (previous year: 149). Personnel costs rose by €14 million to €212 million (previous year: 198), in particular due to the increase in the number of employees and personnel-related provisions. The other operating expenses fell slightly by €6 million to €220 million (previous year: 226). Overall, earnings before interest and taxes (EBIT) increased by €18 million to €49 million (previous year: 31). Results from participations improved by €12 million to €7 million (previous year: -5), mainly as a result of higher dividend distributions. Income from loans rose by €4 million to €51 million (previous year: 47). This is essentially due to new loans granted to African Group companies during the reporting year. Other interest and similar earnings decreased by €56 million to €219 million (previous year: 275). Interest and similar expenses rose by €12 million to €241 million (previous year: 229). The decrease in other interest and similar earnings is mainly attributable to one-off earnings of €61.5 million from the premature close-out of interest swaps which were included in the previous year.
Through the in-house banking activities, the financing measures of the subsidiaries lead to currency positions that are hedged by means of external foreign exchange transactions, which are appropriate in terms of maturities and amounts. As these hedging transactions do not, as a rule, relate to any valuation units, currency and interest gains or losses may arise. In accor-dance with the imparity principle, provisions for risks arising from hedging transactions were recognised at the end of the year to the extent of the negative market values. Positive market values are not recognised as assets. The foreign currency results in the 2015 financial year amounted to €-13 million (previous year: -34).
Impairment in shares in affiliated companies totalling €7 million was carried out in the 2015 financial year. The income tax of €13 million (previous year: 16) results from taxes of the report-ing year and adjustments for previous years. Total profit for the 2015 financial year amounted to €42 million (previous year: 67), while balance sheet profit was €245 million (previous year: 144).
87HeidelbergCement | Annual Report 2015
Fundamentals of the Group
2015 economic report
Additional statements
Sustainability
Employees and society
Environmental responsibility
Procurement
Outlook
Risk and opportunity report
Com
bine
d m
anag
emen
t re
port
Cor
pora
te G
over
nanc
eC
onso
lidat
ed f
inan
cial
sta
tem
ents
Add
itio
nal i
nfor
mat
ion
2
3
4
5

The balance sheet total rose by €0.4 billion to €19.1 billion (previous year: 18.7). This is largely attributable to the increase of €0.3 billion in receivables from affiliated companies and of €0.4 billion in loans to affiliated companies.
On the assets side, shares in affiliated companies only declined marginally due to additions and disposals and remained almost at the previous year’s level of €13.6 billion (previous year: 13.6). Capital reserves were increased in HeidelbergCement, Funk & Kapphan Grundstücksgesellschaft mbH & Co.KG, Heidelberg, Germany, Kerpen & Kerpen GmbH & Co. KG, Ochtendung, Germany, and CEMLAPIS Warstein GmbH & Co. KG, Warstein, Germany. In the course of restructurings within the Group, HeidelbergCement Finance B.V., Netherlands, was sold to HeidelbergCement Netherlands Holding B.V., Netherlands. Furthermore, HC Kalkproduktionsgesellschaft Istein mbH, Heidelberg, Germany, Walhalla Kalk GmbH & Co. KG, Regensburg, Germany, and Walhalla Kalk Verwaltungsgesellschaft mbH, Regensburg, Germany, were sold to the Belgian Lhoist Group as part of the divestment of the German lime operating line.
Loans to affiliated companies grew to €1.3 billion (previous year: 1.2) due to the issue of new loans. Financial assets stayed at the previous year’s level of €14.9 billion. Total fixed assets thus remained almost unchanged at €15.1 billion. Inventories decreased by €1.5 million to €61 million (previous year: 62), mainly because of the reduction in inventories of raw materials and consumables. Trade receivables also remained at the previous year’s level of €8.5 million. Receivables and other assets rose to €3.8 billion (previous year: 3.4), which is primarily due to the increase in receivables from affiliated companies to €3.7 billion (previous year: 3.3) related to financing measures within the Group. Cash and cash equivalents declined by €12 million to €28 million (previous year: 40).
On the equity and liabilities side, the equity decreased marginally to €11.6 billion (previous year: 11.7). Provisions increased slightly to €0.47 billion (previous year: 0.45) in comparison with the previous year. Liabilities rose by €0.4 billion to €7.0 billion (previous year: 6.6). This primarily reflects the increase to €6.2 billion in liabilities to affiliated companies in connection with Group financing activities.
Evaluation of the economic situation by Group management
In 2015, HeidelbergCement developed very successfully and benefited once again from its opera-tional strength and advantageous geographical positioning. Despite the drop in the oil-producing industry, the economic recovery continued in North America and led to an increase in demand for building materials, driven by commercial and residential construction. The upswing in the construction sector in the United Kingdom also persisted. The decisive factors were the positive trend in private residential construction and infrastructure projects, particularly in the Greater London area. In Eastern Europe, the development of sales volumes of aggregates and ready-mixed concrete was encouraging. Only the conflict in eastern Ukraine and the recession in Russia had a negative impact on regional demand for building materials. In the African countries south of the Sahara, we benefited from the overall positive development and our recently commissioned capacities. The emerging countries in Asia, however, were negatively affected by the economic slowdown in China. In Indonesia, the delay of infrastructure projects led to a weak development of sales volumes. The decline in mining projects in Australia was more than offset by an increase in residential construction.
As a leading building materials producer, we profited from the positive development of demand particularly in North America, the United Kingdom, and in Sub-Saharan Africa. Furthermore, we were able to further improve our operating margin with price increases in key Group coun-tries and measures to reduce costs and optimise efficiency. This pleasing development was also
88 HeidelbergCement | Annual Report 2015
Combined management report2

supported by moderately declining energy costs. The weakening of the euro against numerous other currencies has also had a positive impact on revenue and results. Thanks to the advantageous sale of the building products business and disciplined cash flow management, we were able to significantly improve the financial result as expected in comparison with the previous year. As a whole, we clearly achieved our objective of substantially increasing operating income, earnings before interest and taxes (EBIT), and the profit for the financial year. We were also able to improve ROIC accordingly and to earn again a premium on our cost of capital for the first time since the financial crisis.
The cash inflow from operating activities of continuing operations grew considerably in comparison with the previous year, because of the strong operational development. We continued with our disciplined and targeted investments to expand cement capacities in attractive growth markets, but significantly reduced expenditure following the announcement of the takeover of Italcementi. As a consequence of the successful sale of the building products business and the disciplined cash management, net debt fell significantly from €6.9 billion at the end of 2014 to €5.3 billion at the end of 2015. Consequently, the dynamic gearing ratio improved markedly from a factor of 3.0x at the end of 2014 to 2.0x at the end of 2015. The available liquidity at the end of 2015 amounted to €4.1 billion. HeidelbergCement is in a solid position to face the challenges of 2016 and successfully complete the takeover of Italcementi.
Comparison of the business trend with the previous year’s outlook
Revenue outlookIn the 2014 Annual Report, the Managing Board projected a significant increase in revenue for 2015. This outlook was based on the assumption that sales volumes of cement and aggregates would rise moderately and the euro would weaken against other currencies. Furthermore, price increases should be implemented with a high priority. After the development of cement sales volumes was weaker than expected over the course of the year, largely because of the delay to infrastructure projects in Indonesia, the sales volume outlook for cement was reduced to stable and the revenue outlook to a moderate to significant increase. In accordance with this outlook, cement sales volumes saw a stable development and aggregates sales volumes increased as originally expected. Moreover, we were able to increase our prices for cement and aggregates in key markets. As a result, revenue rose by 6.7% and was thus in line with the updated expectations. Excluding consolidation and exchange rate effects, revenue was at the level of the previous year.
Expenditure outlookIn last year’s Annual Report, a slight to moderate increase was anticipated for 2015 in the cost base for energy, and a moderate rise in costs for raw materials and personnel. Energy costs developed better than expected in 2015 and were even moderately lower compared with the previous year. After this trend became apparent over the course of the year, the outlook for energy costs was updated to a moderate decline. In absolute terms, they fell by 5.0%, corresponding to 10.3% of revenue in 2014 and 9.3% in 2015. Excluding consolidation and exchange rate effects, the decline amounted to 8.1%. Aside from the oil price drop, the decisive factor was the declining price of coal, which we were able to use to our advantage due to our rather short-term purchasing strategy in 2015. Electricity costs, however, increased slightly.
In 2015, personnel costs rose more markedly than expected and went up by 10.9%; as a percentage of revenue they increased from 16.3% in 2014 to 16.9% in 2015. Negative exchange rate effects arising from the weakening euro had the greatest impact. The increase amounted to 5.3% after exclusion of exchange rate effects and to 4.2% after additional exclusion of consolidation effects.
89HeidelbergCement | Annual Report 2015
Fundamentals of the Group
2015 economic report
Additional statements
Sustainability
Employees and society
Environmental responsibility
Procurement
Outlook
Risk and opportunity report
Com
bine
d m
anag
emen
t re
port
Cor
pora
te G
over
nanc
eC
onso
lidat
ed f
inan
cial
sta
tem
ents
Add
itio
nal i
nfor
mat
ion
2
3
4
5

The weakening of the euro against numerous currencies, especially the US dollar, the British pound, and some Asian currencies, contributed to the rise in material and personnel costs.
As anticipated, interest costs fell in comparison with the previous year due to significantly lower net debt following the completion of the sale of the building products business. As a consequence, the financial result improved significantly.
Profit outlookOn the basis of the expected development of revenue and expenditure, we forecast a substantial rise in operating income, EBIT, and profit for the financial year in the 2014 Annual Report. Despite the weaker than expected development of revenue, operating income and EBIT rose by 15.7% and 19.4% respectively. The decline in energy costs contributed to this positive development. As a consequence of the strong operational performance and thanks to the improved financial result, profit for the financial year also rose significantly by 43.1%. ROIC could be increased from 6.7% to 7.1%, accordingly. The development of the result and ROIC was therefore in line with the original outlook.
Comparison of the business trend with the outlook in the 2014 Annual Report
€m Outlook Annual Report 2014 Actual 2014
Actual 2015
Change (adjusted for exchange rate
and consolidation effects)
Revenue Significant increase (reduced to “moderate to significant” in November 2015) 12,614 13,465 +6.7% (-0.2%)
Energy costs Slight to moderate increase (updated to “moderate decline” in November 2015) 1,302 1,246 -5.0% (-8.1%)
Personnel costs Moderate increase 2,050 2,274 +10.9% (+4.2%)
Financing costs (financial result) Significant decline -629 -550 -12.6%
Operating income Significant increase 1,595 1,846 +15.7% (+9.9%)
EBIT Significant increase 1,560 1,863 +19.4%
Profit for the financial year Significant increase 687 983 +43.1%
ROIC Improvement 6.7% 7.1% +0.4 percentage points
90 HeidelbergCement | Annual Report 2015
Combined management report2

Additional statements
Statements in accordance with § 289, section 4 and § 315, section 4 of the German Commercial Code (HGB)
On 31 December 2015, the share capital of HeidelbergCement AG amounted to €563,749,431. It is divided into 187,916,477 no-par value bearer shares, each with a pro rata amount of €3, which corresponds to a proportionate amount of the subscribed share capital. Each share carries one vote at the Annual General Meeting. All shares carry the same rights and obligations; there are no different classes of shares. The Managing Board knows of no restrictions concerning voting rights or the transfer of shares.
Mr Ludwig Merckle, Ulm, Germany, holds via VEMOS 2 Beteiligungen GmbH, a company under his control, 26.20% of the voting rights in the company, according to the notifications available to the company as at 31 December 2015 in accordance with the German Securities Trading Law (Wert-papierhandelsgesetz). No holder of shares has been granted special rights giving power of control.
The company’s Managing Board is appointed and discharged by the Supervisory Board. The Articles of Association may be amended by the Annual General Meeting with a simple majority of the share capital represented at the time of voting, except where a greater majority is required by law. Amendments affecting only the wording of the Articles of Association may be made by the Supervisory Board.
As at 31 December 2015, there were two authorised capitals: namely, authorisation of the Managing Board and Supervisory Board to increase the capital by issuing new shares in return for cash contributions (Authorised Capital I), and authorisation of the Managing Board and Supervisory Board to increase the capital by issuing new shares in return for contributions in kind ( Authorised Capital II). The Authorised Capitals are summarised as below. The complete text of the authorisations can be found in the Articles of Association, which are published on our website www.heidelbergcement.com under “Company/Corporate Governance/Articles of Association”.
Authorised Capital IThe Managing Board is authorised to increase, with the consent of the Supervisory Board, the company’s share capital by a total amount of up to €225,000,000 by issuing new no-par value bearer shares in return for cash contributions on one or more occasions until 6 May 2020 ( Authorised Capital I). The shareholders must be granted subscription rights. However, the Managing Board is authorised, in certain cases described in more detail in the authorisation, to exclude the subscrip-tion rights of shareholders in order to realise residual amounts, to service option or conversion rights, or to issue shares totalling up to 10% of the share capital at a near-market price. As at 31 December 2015, the Authorised Capital I had not been used.
Authorised Capital IIThe Managing Board is also authorised to increase, with the consent of the Supervisory Board, the company’s share capital by a total amount of up to €56,374,941 by issuing new no-par value bearer shares in return for contributions in kind on one or more occasions until 6 May 2020 (Authorised Capital II). The subscription right of shareholders is generally excluded in the case of capital increases in return for contributions in kind. The authorisation governs, in particular, the possibility of excluding the subscription right insofar as the capital increase in return for contributions in kind is performed for the purposes of acquisition of companies, to service option or conversion rights, or in the context of implementing a dividend in kind/dividend option. As at 31 December 2015, the Authorised Capital II had not been used.
91HeidelbergCement | Annual Report 2015
Fundamentals of the Group
2015 economic report
Additional statements
Sustainability
Employees and society
Environmental responsibility
Procurement
Outlook
Risk and opportunity report
Com
bine
d m
anag
emen
t re
port
Cor
pora
te G
over
nanc
eC
onso
lidat
ed f
inan
cial
sta
tem
ents
Add
itio
nal i
nfor
mat
ion
2
3
4
5

Conditional Share CapitalIn addition, the Conditional Share Capital described below existed as at 31 December 2015. The share capital was conditionally increased by a further amount of up to €168,000,000, divided into up to 56,000,000 new no-par value bearer shares (Conditional Share Capital 2013). The conditional capital increase serves to back the issuance of option or conversion rights, or option or conversion obligations on HeidelbergCement shares. The conditional capital increase is only carried out insofar as the Managing Board issues warrant or convertible bonds until 7 May 2018 under the authorisation of the Annual General Meeting from 8 May 2013 and the bearers of option or conversion rights make use of their rights. Warrant or convertible bonds may also be issued with option or conversion obligations.
The shareholders generally have a subscription right to newly issued warrant or convertible bonds. The authorisation governs specific cases in which the Managing Board may exclude the subscrip-tion right of shareholders to warrant or convertible bonds. The complete text of the Conditional Share Capital can also be found in the Articles of Association, which are published on our website www.heidelbergcement.com under “Company/Corporate Governance/Articles of Association”. As at 31 December 2015, the authorisation to issue warrant or convertible bonds forming the basis of the Conditional Share Capital 2013 had not been used.
A corresponding volume limit as well as the deduction clauses ensure that the sum of all exclusions of subscription rights in the two existing Authorised Capitals and the Conditional Share Capital 2013 will not exceed a limit of 20% of the share capital existing at the time the authorisation to exclude the subscription right comes into force. As at 31 December 2015, the company has no treasury shares and there is no authorisation to acquire treasury shares.
A list of the company’s significant agreements contingent on a change of control resulting from a takeover bid, and a summary of the effects thereof, is provided in the following in accordance with § 289, section 4, no. 8 and § 315, section 4, no. 8 of the German Commercial Code (HGB). Please note that we are disregarding agreements whose potential consequences for the company fall below the thresholds of €50 million in a singular instance or €100 million in the case of several similar agreements, as they will not normally affect the decision of a potential bidder. These change of control clauses are standard for this industry and type of transaction and have not been agreed with the intention of hindering any takeover bids.
As at 31 December 2015, the following significant agreements of HeidelbergCement AG were contingent on a change of control within HeidelbergCement AG resulting from a takeover bid.
92 HeidelbergCement | Annual Report 2015
Combined management report2

Name of agreement/date Type of contract Nominal amount €m 1)
Repayment Type ofclause
Syndicated credit and aval agreements
Syndicated credit line and aval credit facility of 25 February 2014
Credit and aval credit facility 3,000 2) to the extent outstanding by 25 February 2019
(1)
Syndicated credit line facility of 28 July 2015
Credit facility 3,300 3) to the extent outstanding by 28 January 2017 4)
(1)
Bonds issued by HeidelbergCement Finance Luxembourg S.A., guaranteed by HeidelbergCement AG
4.0% bond 2012/2016 Debenture bond 300 to the extent outstanding by 8 March 2016
(3)
8.0% bond 2009/2017 Debenture bond 1,000 to the extent outstanding by 31 January 2017
(3)
7.25% bond 2011/2017 Debenture bond CHFm 150 to the extent outstanding by 14 November 2017
(3)
5.625% bond 2007/2018 Debenture bond 480 to the extent outstanding by 4 January 2018
(2)
9.5% bond 2011/2018 Debenture bond 500 to the extent outstanding by 15 December 2018
(3)
2.25% bond 2014/2019 Debenture bond 500 to the extent outstanding by 12 March 2019
(3)
8.5% bond 2009/2019 Debenture bond 500 to the extent outstanding by 31 October 2019
(3)
7.5% bond 2010/2020 Debenture bond 750 to the extent outstanding by 3 April 2020
(3)
3.25% bond 2013/2020 Debenture bond 300 to the extent outstanding by 21 October 2020
(3)
3.25% bond 2013/2021 Debenture bond 500 to the extent outstanding by 21 October 2021
(3)
Debt certificates issued by HeidelbergCement AG
of 20 December 2011 Debt certificate 173.5 to the extent outstandingby 31 October 2016
(3)
Shareholders agreement
between HeidelbergCement AG and IFC dated 19 May 2010, supplemented and revised on 19 January 2012
Agreement between Heidelberg-Cement AG and IFC as well as their associated shareholders in Scancem International DA
to be determined
to be determined
(4)
1) Provided that no other currency is specified
2) Of this figure, €324.2 million was outstanding as at 31 December 2015.
3) Of this figure, €0 million was outstanding as at 31 December 2015.
4) Two extension options of nine months each
The relevant change of control clauses give the contractual partner or bearer of the bonds or debt certificates the right to immediately accelerate and to demand repayment of the agreement or outstanding loans, debenture bonds, or debt certificates, or to end the common participation in Scancem International DA in the event of a change in the company’s shareholder structure as defined variously below.
The syndicated credit line and aval credit facility agreement dated 25 February 2014, marked (1) in the type of clause column as well as the additional syndicated credit line agreement dated 28 July 2015, revised on 21 August 2015, also marked (1) in the type of clause column, give each bank syndicate creditor the right, in the event of a change of control, to accelerate the loan amount it provided (plus any accrued interest) and to demand repayment accordingly.
93HeidelbergCement | Annual Report 2015
Fundamentals of the Group
2015 economic report
Additional statements
Sustainability
Employees and society
Environmental responsibility
Procurement
Outlook
Risk and opportunity report
Com
bine
d m
anag
emen
t re
port
Cor
pora
te G
over
nanc
eC
onso
lidat
ed f
inan
cial
sta
tem
ents
Add
itio
nal i
nfor
mat
ion
2
3
4
5

A change of control is deemed to occur when a person or a group of people acting jointly in the sense of § 2, section 5 of the German Securities Acquisition and Takeover Act (WpÜG) has acquired more than 30% of the shares in the company.
The bonds marked (2) in the type of clause column give each bearer of the debenture bond the right of early termination in the event of changes in the shareholder structure that lead to a change in the control of the company.
A change of control is deemed to occur when more than 50% of the subscribed capital or more than 50% of the voting rights are controlled contractually or by other means. In connection with a concept of “registered partner”, a change of control to (a) SC Vermögensverwaltung GmbH (formerly Spohn Cement GmbH) or (b) any partner of SC Vermögensverwaltung GmbH including successors and legatees of partners of SC Vermögensverwaltung GmbH and persons who are beneficial owners of shares in SC Vermögensverwaltung GmbH or (c) any legal person or foun-dation or comparable institution managed by such persons to whom shares in HeidelbergCement AG were transferred by persons mentioned under (a) to (c) is exempted from the change of control provision and thus from the regulation regarding a right of early termination.
The bonds and debt certificates marked (3) in the type of clause column give each bearer of the debenture bond or debt certificate the right, in the event of a change of control as described below, to demand full or partial repayment of the debt certificate from the company or, in the case of debenture bonds, at the company’s option, the full or partial purchase of his debenture bonds by the company (or, at the company’s request, by a third party) at the ”early repayment amount”. The early repayment amount means, in the case of the debt certificate, 100% of the nominal amount of the debt certificate or, in the case of debenture bonds, 101% of the nominal amount of the debenture bond plus accrued and unpaid interest up to (but not including) the repayment date defined in the bond terms.
A change of control is deemed to occur when one of the following events takes place: – the company becomes aware that a person or group of persons acting in concert in the sense
of § 2, section 5 of the German Securities Acquisition and Takeover Act (WpÜG) has become the legal or beneficial owner of more than 30% of the company’s voting rights, or
– the merger of the company with or into a third person or the merger of a third person with or into the company, or the sale of all or substantially all assets (consolidated) of the company to a third person, except in connection with legal transactions, as a result of which (a) in the event of a merger the holders of 100% of the company’s voting rights hold at least the majority of the voting rights in the surviving legal entity immediately after such a merger and (b) in the event of the sale of all or substantially all assets, the acquiring legal entity is or becomes a subsidiary of the company and becomes the guarantor for the debenture bonds.
The US$750 million 6.125% bond taken out by Hanson Limited, issued on 16 August 2006 and maturing on 15 August 2016, now guaranteed by HeidelbergCement AG, includes a provision whereby not only the direct but also the indirect acquisition of more than 50% of the shares or voting rights in Hanson Limited may represent a change of control. The acquisition of 30% of the voting rights in HeidelbergCement AG, which indirectly holds 100% of the shares in Hanson
94 HeidelbergCement | Annual Report 2015
Combined management report2

Limited, could be regarded as an indirect acquisition. A change of control would grant the bearers of this bond a put option at 101% of the nominal value plus interest against Hanson Limited if, in connection with this change of control, the bond was downgraded below investment grade by certain rating agencies. As the bond is already classified below investment grade, this change of control provision is currently not applicable.
In May 2010, HeidelbergCement signed a shareholders agreement, marked (4) in the type of clause column, with International Finance Corporation (IFC), a member of the World Bank Group. The agreement was supplemented and revised on 19 January 2012. This agreement governs the rights of the shareholders in the jointly held Norwegian holding partnership Scancem International DA, which brings together the main African activities of HeidelbergCement in the countries south of the Sahara. The agreement provides IFC and its financial partners with the opportunity of selling their indirect holding in Scancem International DA to HeidelbergCement at a price that corresponds to the reference price determined according to certain requirements in the agreement, if an “adverse sponsor change in control” occurs. This is defined as a change in control at HeidelbergCement AG that leads to a mandatory offer, pursuant to the German Securities Acquisition and Takeover Act (WpÜG), for the outside shareholders of HeidelbergCement AG, if the purchaser of the control is either included in one of the sanction lists of the UN, EU, France, the USA, or the World Bank specified in the agreement, or if the purchaser of the control takes action or makes decisions that would end or compromise the objectives planned with the IFC’s participation in Scancem International DA, i.e. the modernisation and expansion of the jointly led activities in the African countries south of the Sahara.
Agreements also exist on pension schemes in the United Kingdom, which stipulate that a change of control (not contractually specified) at HeidelbergCement AG must be communicated to the trustees of these pension schemes. If, according to the corresponding regulatory guidelines, a change of control poses a considerable risk to the fulfilment of the pension obligations (Type A Event), the trustees can request negotiations on the suitability of the safeguarding of the pension cover and these can be verified by means of a clearance procedure before the supervisory authority, which may lead to the adjustment of the securities.
With the introduction of the new Managing Board remuneration system in November 2010, the HeidelbergCement AG Supervisory Board has decided, in the event of new contracts and the extension of Managing Board contracts in accordance with the German Corporate Governance Code (point 4.2.3, section 5), to agree that a possible redundancy payment in the case of early termination of membership of the Managing Board following a change of control be limited to 150% of the redundancy pay cap.
The other details required in accordance with § 289, section 4, and § 315, section 4 of the German Commercial Code (HGB) relate to circumstances that do not exist at HeidelbergCement AG.
Regional branches
HeidelbergCement has no regional branches either domestically or internationally.
95HeidelbergCement | Annual Report 2015
Fundamentals of the Group
2015 economic report
Additional statements
Sustainability
Employees and society
Environmental responsibility
Procurement
Outlook
Risk and opportunity report
Com
bine
d m
anag
emen
t re
port
Cor
pora
te G
over
nanc
eC
onso
lidat
ed f
inan
cial
sta
tem
ents
Add
itio
nal i
nfor
mat
ion
2
3
4
5
Events occurring after the close of the 2015 financial year
On 14 January 2016, HeidelbergCement placed debt certificates in the amount of €625 million, thereby further strengthening its financing structure. On 4 February 2016, the volume of the debt certificates was increased by €20 million to €645 million. The debt certificates, with a maturity date of 20 January 2022, consist of two tranches: one tranche with a floating rate and the other with a fixed rate. The fixed rate tranche yields at 1.85% p.a. and the floating tranche at 1.5% p.a. over 6 months Euribor. Issuance of the debt certificates was secured with the assistance of Landesbank Baden-Württemberg, Landesbank Hessen-Thüringen, and Raiffeisen Bank International. As with all the bonds issued since 2009 and the debt certificate issued in December 2011, the terms and conditions of the debt certificates include a limitation on incurring additional debt. In addition, the terms and conditions include the same change of control clause as the bonds and debt certificates marked (3) in the type of clause column in the table on page 93. The proceeds will be utilised to pre-fund the upcoming Italcementi acquisition and thereby reduce the volume of the bridge financing from €3.3 billion to €2.7 billion. The refinancing needs in the bond market decline to below €2 billion, correspondingly.
Business combinations after the close of the financial year are described in the Notes on page 197.
Sustainability
The commitment to sustainable development is a pillar of HeidelbergCement’s corporate strategy. The creation of economic added value, ecological competence, and social responsibility secure the Group’s future viability. For us, sustainable corporate governance means ensuring a balance between making profit and securing future viability. We strive to act in a socially and ecologically responsible way. We take into account the effects of our entrepreneurial activity on the environ-ment and society, and thereby reduce the risks for our business.
Sustainability strategy
As a commodity company, people, nature, and society are the focus of our sustainability strategy. We consider environmental responsibility, climate protection, and sustainable resource conservation to be the foundation for the future development of our Group. In the same way, our obligation to prevent employees from work-related dangers and to protect their health has become an integral part of our activities for many years. Last but not least, acting in a sustainable way for us also means taking on social responsibility at our locations. Our sustainability strategy and the areas of focus of our sustainability activities are strongly influenced by the expectations of external and internal stakeholders, which are systematically recorded and incorporated into our approach. We therefore conducted a survey among this group in December 2014 and published the results in our Sustainability Report 2013/2014. Furthermore, the Cement Sustainability Initiative (CSI) of the World Business Council for Sustainable Development (WBCSD) has defined central fields of action for this industry. These are: occupational safety, climate protection (CO2 and energy man-agement), use of alternative fuels and raw materials, pollutant emissions, sustainable land use and species conservation, sustainable construction, water management, supply chain management, and stakeholder dialogue.
96 HeidelbergCement | Annual Report 2015
Combined management report2

Further fields of action are arising from the structure of our sales markets. Competition in the market is limited amongst building materials suppliers in many regions, which is why transparency and fair competition take on particular importance. Our international positioning comes with the need to respect cultural diversity and promote regional development at all our locations.
In the reporting year, we started the revision of our sustainability strategy which should be published by the end of 2016. The new sustainability strategy will set binding targets to be achieved by 2030.
Sustainability management The Sustainability Steering Committee, led by the Chairman of the Managing Board, is in charge of the management and control of the sustainability strategy. The committee is made up of people from various business lines and disciplines: the member of the Managing Board responsible for environmental sustainability as well as the heads of the Group departments Human Resources, Legal, Logistics, Sales & Marketing, Purchasing, Research & Technology, Communication & Investor Relations, and Global Environmental Sustainability. Operational responsibility for implementing the sustainability goals and measures lies with the individual Group departments, the country managers, and the Group Environmental Sustainability Committee. This interdisciplinary commit-tee was set up in 2008 with the aim of improving our performance in environmental protection and occupational safety – very important areas for our industry – and promoting the exchange of information between the Group areas and business lines.
Employees and society
Employee development
Employees worldwideAt the end of 2015, the number of employees at HeidelbergCement stood at 45,453 (previous year: 44,909). The increase of 544 employees essentially results from two opposing developments: on the one hand, more than 1,000 jobs were cut in particular in the Eastern Europe-Central Asia Group area, in Indonesia, and India in connection with efficiency increases in sales and administration as well as location optimisations. On the other hand, the number of employees in Northern Europe rose by just under 1,400 due to the merger of our Swedish subsidiary Abetong AB and Contiga AB to form Nordic Precast Group AB. In addition, the workforce in Australia grew by around 200 employees mainly as a result of the insourcing of truck drivers.
Employees by Group areas
31 December 2014 2015 Change
Western and Northern Europe 12,441 13,818 11.1%
Eastern Europe-Central Asia 8,453 8,177 -3.3%
North America 7,644 7,658 0.2%
Asia-Pacific 13,482 13,029 -3.4%
Africa-Mediterranean Basin 2,811 2,690 -4.3%
Group Services 79 81 2.5%
Total 44,909 45,453 1.2%
97HeidelbergCement | Annual Report 2015
Fundamentals of the Group
2015 economic report
Additional statements
Sustainability
Employees and society
Environmental responsibility
Procurement
Outlook
Risk and opportunity report
Com
bine
d m
anag
emen
t re
port
Cor
pora
te G
over
nanc
eC
onso
lidat
ed f
inan
cial
sta
tem
ents
Add
itio
nal i
nfor
mat
ion
2
3
4
5

Personnel costs and social benefitsExpenditure on wages and salaries, social security contributions, costs of retirement benefits, and other personnel cost rose by 10.9% in comparison with the previous year to €2,274 million (pre vious year: 2,050). This corresponds to a share in revenue of 16.9% (previous year: 16.3%).Adjusted for exchange rate effects, the increase amounted to 5.3%. Higher provisions for the running long-term bonus plans contributed 2.3% to this increase. Adjusted for exchange rate effects and the provisions for long-term bonus plans, personnel costs rose by 3.0%.
Personnel costs
€m 2014 2015 Change
Wages, salaries, social security costs 1,939.4 2,152.1 11.0%
Costs of retirement benefits 86.4 97.0 12.3%
Other personnel costs 24.1 25.1 4.1%
Total 2,049.9 2,274.2 10.9%
Development dialogueQualified and motivated employees are an important prerequisite for the sustainable success of HeidelbergCement. Identifying our employees’ talents, developing them, and – in competition with other companies – retaining those employees within the Group are therefore at the core of the Group-wide personnel policy. This is supported by the HeidelbergCement competence model, which defines the essential professional and personal capabilities and skills that are critical for the success of our business. It enables the respective superiors to perform systematic, Group-wide assessments of performance and potential in accordance with standardised regulations and serves as a basis for strategic development of managers and successor planning. Superiors and employees discuss development opportunities and prospects within the framework of structured appraisal interviews. The dialogue is primarily targeted at upper and middle management, those in specialist roles, and future executives. We aim to achieve the following three goals:– to internally fill key positions with top-class candidates worldwide,– to develop top talent at HeidelbergCement in a targeted way, and– to retain employees in the Group for the long term by means of personalised development
planning.
On-going trainingSustainable HR management means consistently investing in training, i.e. employing and training qualified talent. The proportion of apprentices in Germany is 5% (previous year: 5%). The retention rate of these apprentices stands at 80% (previous year: 84%).
Technical skills are essential in ensuring the functionally sound operational management of process technology and maintenance in our plants. In addition to technical training, we also offer master classes every year at the German Cement Works Association (Verein Deutscher Zementwerke e.V.).
As in the previous year, a focus of our training programmes throughout the Group was on occupational safety, which made up around 50% of the total training measures. Other areas of focus were specialist training (30%) and the training of our managers (6%).
Our extensive training programmes in virtually every work area are characterised by practical and business-oriented learning and enable our employees to develop their skills.
98 HeidelbergCement | Annual Report 2015
Combined management report2

Management trainingThe motivation and skills of our managers play a crucial role in determining how well Heidel-bergCement positions itself among its global competitors and how well-prepared the Group is for future challenges. In order to prepare our managers for their future tasks, we offer training programmes tailored specifically to the needs of our Group. This applies both to traditional topics such as strategy, leadership, and management, or the method of capital expenditure budgeting, and to special training topics, for instance in the area of technology. Uniform training content ensures that a common understanding of strategy, integrated management approach, and leader-ship is developed everywhere.
A strategic Group initiative is to further develop the skills of our senior managers through the “Summit” programme, which was developed in close cooperation with Duke Corporate Education. All senior managers in the Group from 41 countries participate in the three-stage curriculum focusing on general management and leadership, which takes into account global, regional, and local issues. Members of the Managing Board contribute actively to all modules through discussion forums and with their own presentations. The mix of theory and practice is a key factor in the programme’s success, and its ongoing evaluation and adjustment contributes to the fact that the programme is highly valued by the participants.
Securing and advancing future executivesIn the reporting year, we consistently pursued our efforts to advance future executives. We offer highly motivated and qualified university graduates international trainee programmes focus-ing on the following areas: technology, sales, finance, personnel, purchasing, and IT. In 2014, HeidelbergCement was awarded the trainee seal of the “Initiative for career-enhancing and fair trainee programmes” for its high-quality programmes for the advancement of future executives. We also continued to work intensively on expanding our programmes for the advancement of future executives and strengthening our recruitment of university graduates and graduates with first professional experience worldwide. In 2015, we hired 296 university graduates. Currently, around 830 employees take part in programmes which prepare them for more advanced tasks.
In 2011, we started a special programme for highly qualified engineers in the cement business as a pilot project in Europe and Central Asia, in order to prepare these employees for senior engineer-ing positions. Upon completion of the “Engineer in Training” programme, the engineers spend several years completing specifically defined training stages in technical fields at various plants both in Germany and abroad – supplemented by training in general management and leadership. Since 2013, this programme has been extended to other Group areas.
During the reporting year, the Aggregates Academy continued its employee training offer in the aggregates business line. More than 1,800 participants from our aggregates business management team have been trained across 18 countries. The target group of the Aggregates Academy training courses comprises almost all hierarchy levels in our Group. Training materials and delivery is typically in the native language of the country and is supported by a pool of local managers who have received professional training in adult learning techniques.
Demographic developmentOur Group, too, is faced with the consequences of demographic change. Around 14% of our employees are younger than 30. The majority of the employees are aged between 30 and 49, making up around 51% of the Group’s total workforce. 35% of our employees are above 50 years of age.
99HeidelbergCement | Annual Report 2015
Fundamentals of the Group
2015 economic report
Additional statements
Sustainability
Employees and society
Environmental responsibility
Procurement
Outlook
Risk and opportunity report
Com
bine
d m
anag
emen
t re
port
Cor
pora
te G
over
nanc
eC
onso
lidat
ed f
inan
cial
sta
tem
ents
Add
itio
nal i
nfor
mat
ion
2
3
4
5

We are responding to the effects of demographic change with numerous measures adapted to regional requirements. In Germany, for example, we have continued to develop our health management activities and have incorporated them in the “FIT for LIFE” initiative. It includes a prevention programme for the early diagnosis of illnesses and risk factors, but primarily focuses on the initiative of individuals to adopt a healthy lifestyle. This service covers, among other things, colon cancer screening, flu vaccinations, eye examinations, special health days, and lectures about health. In the future, health management activities will continue to focus on the prevention of typical age-related health risks and change in awareness. We are therefore specifically promoting company sports activities for all age groups.
Diversity as a factor for successIn the Group-wide personnel policy, we consciously aim for a balanced mix of diverse personalities, skills, and experience when putting together teams of employees. We understand diversity as a management concept, which through the inclusion of various cultures, talents, and levels of experience ensures that the composition of our workforce mirrors our presence in the international markets, our customer structure, and our business environment. We aim to achieve this in the following ways: – local country management and therefore an international management team, – an international workforce at the Group headquarters, – a complementary composition of management and other teams (international, specialist,
experience, age, sex etc.), – women in management positions reflecting the proportion of women in the total workforce in
Germany.
The goal is to advance and attract highly qualified and committed employees around the world who can bring various social and professional skills to our company and thus contribute to the success of the Group.
The international composition of our management team enables us to benefit from a broad range of experience and different cultural backgrounds, thereby allowing us to respond more flexibly to both global challenges and local market needs. The proportion of local managers at the upper management level remains unchanged at around 80%.
At the Group headquarters, we consciously aim to ensure that the workforce is composed of employees from the countries in which we operate. We benefit considerably from their local knowledge and this also facilitates cooperation with the local personnel. We have 584 employees at the Group headquarters and at our technical centers, the Competence Center Materials and Heidelberg Technology Center in Heidelberg and Leimen, with 160 of these employees representing 42 different countries.
To aid diversity, we believe it is important for management positions to be held by both men and women, thereby providing a true reflection of our employee structure. Within the Group, women made up 15% of the total workforce and held 9% of the upper management positions in 2015.
Together with other DAX companies, HeidelbergCement signed a self-commitment in 2011. So far we have voluntarily committed to more than double the proportion of women in leadership positions in Germany from 7% in 2011 to 15% in 2020. In Germany, women represented 15% of the total workforce and held 8% of leadership positions in the top, senior, and middle manage ment in 2015.
100 HeidelbergCement | Annual Report 2015
Combined management report2

According to the legislation on the promotion of women in leadership positions, specific targets must be set for the two leadership levels below the Managing Board of the company. Managers who in their main role report directly to the Managing Board form the first level at Heidelberg-Cement, and any of their employees with leadership responsibility form the second level below the Managing Board. In 2015, the proportion of women in leadership positions in Germany at the first level below the Managing Board was 10%, and 9% at the second level.
HeidelbergCement decided to retain its voluntary target for the two levels below the Managing Board, but to bring forward its achievement to mid-2017. In specific terms, this means that we aim to achieve a proportion of 14% of women in leadership positions at the first level below the Managing Board and 15% at the second level by 30 June 2017. As a result, the proportion of women in leadership positions would correspond to the proportion of women in the total work-force of HeidelbergCement in Germany. The decision to bring forward the target achievement to mid-2017 is a clear indication that we have worked consistently on the promotion of women in the last few years and achieved significant success. The proportion of women in programmes for the advancement of future executives across Germany is already 24% and therefore significantly higher than the proportion of women in the total workforce.
Share of women in Germany
2014 2015 Target: 30 June 2017
Total workforce 14% 15%
First leadership level 10% 10% 14%
Second leadership level 7% 9% 15%
The global “NOW – Network of Women” at HeidelbergCement is an initiative that brings together female employees worldwide both virtually and face-to-face. Among other things, it enables the regular, informal exchange of ideas and targets the development of individual careers as well as the promotion of women.
Work-life balance In the race for the best employees, we adapt ourselves globally to changing lifestyles. In terms of what we offer to encourage a good work-life balance, we focus on models such as flexitime, part-time, and leave of absence. The part-time ratio at HeidelbergCement AG is 11%. Because of the small size of our locations, cooperation with external networks has proven itself for example in terms of children’s daycare, caring for family members, or holiday camps for children. Employees benefit from having easy access to a professional and flexible network at reasonable costs. As part of our “FIT for FAMILY” initiative, we have entered into cooperation with daycare centres for the location in Heidelberg, Germany. These arrangements allocate us our own quota of places that can be offered to our employees.
Result-oriented remuneration systemsIf you expect performance, you need to create a suitable environment. This includes also an attractive remuneration system. Alongside fixed salaries governed by a collective agreement or an individual work contract, HeidelbergCement AG employees also receive variable remuneration elements based on their individual performance and on corporate success. In the case of managers, we consciously aim to achieve a high variable element as part of the total remuneration in order to take into account, in a clear and direct way, collective and personal performances as well as
101HeidelbergCement | Annual Report 2015
Fundamentals of the Group
2015 economic report
Additional statements
Sustainability
Employees and society
Environmental responsibility
Procurement
Outlook
Risk and opportunity report
Com
bine
d m
anag
emen
t re
port
Cor
pora
te G
over
nanc
eC
onso
lidat
ed f
inan
cial
sta
tem
ents
Add
itio
nal i
nfor
mat
ion
2
3
4
5

corporate success. The employees in our foreign subsidiaries benefit from attractively designed remuneration systems that relate to the respective local market conditions. For our 150 top managers we have launched a long-term bonus plan for 2015–2017/18 across the Group, which follows the same targets as the long-term bonus plan for the Managing Board.
IT-supported personnel processesIn recent years, our focus has been on the introduction of IT-supported core personnel processes for top, senior, and middle management worldwide. Since the beginning of 2013, the performance management, target agreement, salary review, and individual development dialogue processes for top and senior managers have been supported via our IT platform “HR GLOBE”. The roll-out to middle management and talents was concluded according to plan at the end of 2015.
Occupational health and safety
Group standardsOccupational health and safety has top priority at HeidelbergCement and is an integral part of the key corporate values. In the reporting year, we have continuously improved the technical and organisational safety standards within the Group by means of additional measures in order to reinforce the safety culture in the company.
Work management systems, such as those in accordance with the internationally accepted OHSAS 18001 standard, have already been implemented in most of our plants. These systems require a structured approach from the location managers with planning, clear work regulations, respon-sibilities, and controls to ensure an ongoing improvement process and thus prevent accidents. In 2015, several plants in Sweden and Malaysia introduced management systems in accordance with OHSAS 18001 for the first time, while other plants successfully renewed their certification. Additional locations will follow in 2016. In addition to the required management audits, we have carried out the health and safety improvement reviews introduced already in 2014 in order to identify and implement further potential for improvement.
Accident management softwareIn 2015, we introduced new software for recording accidents across the Group. This software combines the qualitative recording of accident details with statistical accident analysis, thereby rendering unnecessary the manual entries that were previously required. The new software will replace a range of local programs and standardise accident investigation across the Group. The standardised processes will make accident analysis and the implementation of corrective or preventative measures more transparent for the responsible superiors. We will develop the software further so that it can also be used for other applications.
Management responsibility for occupational health and safetyFor many years, we have been improving occupational health and safety at a technical and organisational level, which is reflected in a consistent reduction in accident frequency rates. Despite these efforts, we still have to report serious accidents – including some fatalities – that are often caused by human error. In our Group guideline on occupational health and safety, which was revised in 2015, we once again emphasised management responsibility for occupational health and safety to make it clear that all management levels at HeidelbergCement are responsible for
102 HeidelbergCement | Annual Report 2015
Combined management report2

occupational health and safety. At the same time, we stress the responsibility of each and every employee, contractor, and visitor to follow the occupational safety regulations and thereby ensure their own safety and that of their colleagues.
Together with the Group guideline, we have also introduced a range of basic rules that are mandatory for all employees and contractors. These basic rules relate to actual accident black spots, which are already covered by Group standards, but still require constant attention. In 2016, we will communicate these basic rules by highlighting the main points.
Accident trendsAlthough we achieved a decrease in the lost time frequency rate by almost 12% when considering all business lines and on a like-for-like basis compared to the previous year, it is for the first time in several years that we were not able to significantly reduce this rate in our core business. This is all the more regrettable since many locations have been accident-free for years and others were able to reduce their accident rates drastically, which is of course very pleasing. Nevertheless, the measures must be maintained consistently and further intensified to safely prevent accidents everywhere on a sustained basis. This applies all the more to those locations where the accident frequency rate rose in 2015 compared to the previous year.
In the reporting year, it was with great regret that we had to announce the death of six of our own employees, who died as a result of accidents at work. Furthermore, the lives of eight employees from external companies were claimed, two of whom died in road accidents. Although this is a slight improvement compared to the previous year, this development is still very painful and clearly shows that we must intensify our efforts even more to further improve occupational health and safety. Each occurrence that results in death is analysed and discussed in detail by the Managing Board. Appropriate measures are being determined and shared across the Group in order to avoid similar accidents from happening elsewhere.
Accident trends 1)
2011 2012 2013 2014 2015
Accident frequency rate 2) 3.8 3.4 2.6 2.1 2.1
Accident severity rate 3) 125 115 94 91 106
Fatality rate 4) 0.6 0.5 1.1 1.0 1.7
1) Accident trends in the business areas of cement, ready-mixed concrete, and aggregates in companies where HeidelbergCement is in charge of safety management
2) Number of accidents (with at least one lost working day) suffered by Group employees per 1,000,000 working hours
3) Number of lost working days resulting from accidents suffered by Group employees per 1,000,000 working hours
4) Number of fatalities of Group employees per 10,000 Group employees
103HeidelbergCement | Annual Report 2015
Fundamentals of the Group
2015 economic report
Additional statements
Sustainability
Employees and society
Environmental responsibility
Procurement
Outlook
Risk and opportunity report
Com
bine
d m
anag
emen
t re
port
Cor
pora
te G
over
nanc
eC
onso
lidat
ed f
inan
cial
sta
tem
ents
Add
itio
nal i
nfor
mat
ion
2
3
4
5

Social responsibility
The responsibility we take at our locations around the world is a key factor in the success of our business activity worldwide, according to the motto “think global – act local”. We aim to work with local partners to create added value for both our Group and the local communities.
We believe in giving local employees responsibility for local management wherever possible. Each plant collaborates closely with local suppliers and service providers. We invest around 30% of our purchasing volume in the areas immediately surrounding our plants. Together with the creation of jobs, this helps to create added value and promote economic development at our locations.
Corporate citizenshipCorporate responsibility is not limited to a company’s business processes and the areas where they have a direct impact. As a corporate citizen, we are a part of society, and we benefit from being fully involved at the community level at our locations around the world. We are also playing an active role in the search for solutions to social issues that affect these locations. Our understanding of our role is reflected in the Corporate Citizenship Guidelines, which lay down the benchmarks and objectives related to our social commitment. In 2015, we revised this guideline. Particular emphasis was placed on corporate citizenship activities as part of investment projects, as these could be seen as a form of influence. The revised guideline therefore expressly refers to compli-ance with the relevant provisions of the anticorruption directive of the Group.
Our social commitment is focused on areas in which we have specific expertise and can achieve the best results for society:– Building, architecture, and infrastructure: we provide practical help in the construction of
buildings and infrastructure by making products, financial means, and expertise available.– Environment, climate, and biodiversity: we support initiatives that promote environmental
protection and strengthen the diversity of nature at our locations.– Education, training, and culture: in this area, we are guided by the specific needs of our locations.
Center for Entrepreneurship in TogoAt the end of November 2015, the Center for Entrepreneurship was opened at the Tabligbo plant location in Togo. It offers training and support to inhabitants of the neighbouring communities when setting up small businesses or companies. In addition, the center, which is sponsored by the HeidelbergCement Togo Foundation, can be used for social and cultural events. A committee made up of representatives from the communities and the foundation ensures that support is given to sustainable projects and disadvantaged groups, such as young people and women. Through the general support of the entrepreneurial spirit, the foundation aims to contribute to the economic and social development of the region.
KIS – Cooperation Industry and SchoolIn 2000, HeidelbergCement established the training initiative KIS Cooperation Industry and School in Germany. In Heidelberg, where the Group is headquartered, HeidelbergCement now cooperates with ten schools. There are already 25 cooperation arrangements throughout Germany. The aim of KIS is to give pupils an insight into business and economy and make teaching more practice-oriented. The services offered by KIS range from practical training modules and lectures by employees, job application training, and teacher training through to plant visits and quarry tours.
104 HeidelbergCement | Annual Report 2015
Combined management report2

Environmental responsibility
As an active member of the Cement Sustainability Initiative (CSI) of the World Business Council for Sustainable Development (WBCSD), we are committed to the sustainable development of our business activities with a priority on the health and safety of our employees. As evidence of our commitment, we signed the Low Carbon Technology Partnerships initiative (LCTPi) for cement in 2015 together with 15 other cement companies. This initiative is based on a multi-tiered action plan encompassing energy efficiency improvements, the use of alternative fuels and raw materials, clinker substitution, and the development of cement types that require lower energy for their production. The measures identified within this initiative target the reduction of global CO2 emissions by 20%–25% by 2030 in addition to the reduction already taken into account in what is considered business as usual.
Climate protection
Climate protection is a fundamental part of our environmental policy. By continuously improving the energy efficiency of our plants, increasing the use of alternative fuels, and substituting the energy-intensive intermediate product clinker with alternative raw materials, we continue to lower carbon dioxide emissions. Between 1990 and 2015, we reduced the specific net CO2 emissions by 22% to 606 kg CO2 per tonne of cement. For 2030, our aim is to further reduce the emissions by around 20 million tonnes of CO2 per year compared with the level of 1990.
Thanks to our achievements in terms of emissions reductions, CDP recognised us as “Sector Leader Energy & Materials” in the DACH region (Germany, Austria, Switzerland). With a rating of 99 A-, HeidelbergCement is one of the five best companies in the sector in these three countries and one of the top ten companies in the German DAX.
Climate protection
2013 2014 2015
Specific net CO2 emissions (kg CO2 / t cement) 617 613 606
Alternative fuel rate 21% 21% 21%
Clinker ratio 76% 75% 75%
In 2015, we finished the tests of four different technologies for the capture of CO2 from combustion exhaust gases at our Brevik plant in Norway. The results were presented to attendees at the Carbon Capture and Storage (CCS) conference in Brevik that we organised in May with the support of the Norwegian Ministry of Petroleum and Energy. On the basis of the knowledge gained, we are preparing, with financial support from the Norwegian state-owned company Gassnova, a compre-hensive feasibility study on the construction of a full-scale plant for the capture of CO2 in Brevik. This would be the first full-scale CCS plant in the cement industry.
HeidelbergCement participates in the CEMCAP project, which is financed by the EU funding programme “Horizon 2020” for climate protection, to further develop the oxyfuel technology. With this technology, the rotary kiln is supplied with pure oxygen instead of ambient air via the clinker cooler, thereby facilitating the capture of CO2. In our plant in Hanover, Germany, we are working on the development of this technology on an experimental scale.
105HeidelbergCement | Annual Report 2015
Fundamentals of the Group
2015 economic report
Additional statements
Sustainability
Employees and society
Environmental responsibility
Procurement
Outlook
Risk and opportunity report
Com
bine
d m
anag
emen
t re
port
Cor
pora
te G
over
nanc
eC
onso
lidat
ed f
inan
cial
sta
tem
ents
Add
itio
nal i
nfor
mat
ion
2
3
4
5

HeidelbergCement is also involved in the LEILAC project, which is also funded by “Horizon 2020”. The objective is to demonstrate the technical and economic feasibility of a process technology that can be used to separate the released CO2 in its purest form during the heating of the raw material. This technical approach is complementary to the oxyfuel technology described above.
In December 2015, HeidelbergCement entered into a strategic partnership with Joule Unlimited, Inc. – a pioneer in the area of CO2 recycling and the manufacture of liquid fuels – to research the generation of biofuels from CO2 emissions. This partnership represents another example of the Group’s sustained dedication to leveraging innovative technologies and programmes for climate protection.
In Africa, we installed a solar power plant with an output of 250 MW in our plant in Burkina Faso in 2015 to generate the electricity needed for our cement packing line.
Use of alternative fuels and raw materials
As part of our resource preservation and climate protection strategy, we are continuously ex-tending the use of alternative fuels and raw materials in our production process. Even though the prevention of waste and the recycling of products are always to be considered first, there is a category of waste that cannot be economically reused or completely recycled. Coprocessing in cement kilns is then regarded as the next best option, as it recovers both the calorific value of waste materials as well as the contained mineral value, leaving no residual components unused.
The high level of competency in the use of alternative fuels and raw materials that HeidelbergCement has gained in Europe over the last 30 years is greatly beneficial when presenting this ecologically sound approach to stakeholders in countries where waste is still predominantly landfilled.
In 2015, we were able to increase the proportion of alternative fuels in our TulaCement plant in Russia to a double-digit percentage rate, even though it was only the second year that we made use of them there. In Romania, all three plants have already significantly increased the proportion of alternative fuels for the seventh year in a row. We were even successful in countries with relatively low fossil fuel prices and fees for landfilling. The best example is the Kunda plant in Estonia, where up to 50% of fossil fuels were replaced. On a global level, we achieved the highest substitution rate in the Lengfurt plant in Germany where 90% of coal was replaced by alternative fuels.
In China, we made good progress with the use of sewage sludge as an alternative fuel at the Guangzhou plant. Tests for its use in a kiln at the nearby Zhujiang plant are in preparation.
In Indonesia, the pilot plant for the recycling of municipal solid waste (MSW) has exceeded ex-pectations. It is an important forerunner of the solution to the waste disposal problems in Jakarta and its surrounding cities. The local authorities of the towns of Depok and Bogor, for example, have already adopted this technology to develop a major MSW-treatment project.
HeidelbergCement is well on the way to achieving the Sustainability Ambitions 2020 target of increasing the proportion of alternative fuels within the Group to 30%.
106 HeidelbergCement | Annual Report 2015
Combined management report2

Biodiversity
In order to increase awareness of the high biological value of our quarrying sites, we launched the third edition of the Quarry Life Award in 2015. For this new edition, 69 quarries and aggregate pits in 22 countries will open their doors to allow young scientists to perform research and com-pete for awards at both national and international level. The Group countries Estonia, Togo, and the Democratic Republic of Congo take part for the first time. The winners of this international research competition will be revealed at the end of 2016.
Our partnership with the largest international nature conservation organisation BirdLife International helps us to improve our environmental footprint and social mandate to operate as a responsible commodity company. Through open dialogue with BirdLife International and cooperation with its national partner organisations, we strive to minimise our impact on nature as well as to protect and promote biodiversity wherever needed. Our projects contribute to global nature conservation goals and are locally relevant at the same time. During the reporting year, we completed over ten projects in which we restored or reconnected natural habitats, controlled invasive alien plants, increased the local populations of threatened bird and amphibian species, and contributed to local communities having access to nature. We are extending the scope of our partnership with BirdLife International in Asia and Africa. This includes a cooperation agreement with the Ghana Wildlife Society.
In Togo, we have established a tree nursery in Tabligbo, close to the site of our new clinker plant. The nursery is located near the Center for Entrepreneurship that we have set up and forms part of our local CSR activities in the field of environmental education and training.
In 2015, we published the fifth book in our series on biodiversity in our quarrying sites with the title “Biodiversity management in quarries and gravel pits”. It is dedicated to the restoration and conservation of high value habitats in quarries and gravel pits.
Sustainable construction
We carried out further research into product solutions with improved sustainability performance during the reporting year. In our central laboratory, we developed potential alternatives to traditional cement for different applications – with reduced environmental impact, including lower CO2 emissions and energy consumption.
As a founding member of the Concrete Sustainability Council, we actively contributed to the development of the certification system for sustainably produced concrete. With the certification of concrete – taking into account social and ecological aspects along the value chain – the product and the entire industry is expected to receive better recognition in the future from Green Building Councils and in the awarding process of public construction contracts.
As a leading member of the European Construction Technology Platform, we also continued to develop product solutions in 2015 to further increase the energy efficiency of buildings
107HeidelbergCement | Annual Report 2015
Fundamentals of the Group
2015 economic report
Additional statements
Sustainability
Employees and society
Environmental responsibility
Procurement
Outlook
Risk and opportunity report
Com
bine
d m
anag
emen
t re
port
Cor
pora
te G
over
nanc
eC
onso
lidat
ed f
inan
cial
sta
tem
ents
Add
itio
nal i
nfor
mat
ion
2
3
4
5

Reducing other environmental effects
In line with Sustainability Ambitions 2020, we have conducted Group-wide environmental audits in all business lines. We aim to audit all locations between 2015 and 2020. The measures resulting from previous audits have already been implemented and contribute to an improved environmental performance.
During the reporting year, we made technical improvements in numerous plants in Europe as well as in Indonesia to reduce dust, nitrogen oxide, and sulphur oxide emissions. In the Czech Republic, we continued the long-term project to reduce noise and dust in our cement plants Mokra and Radotin. In the TulaCement cement plant in Russia, acoustic insulation was installed for the reduction of noise. The new plants in Togo and Burkina Faso meet the international standards for emission reduction. In addition, equipment for continuous monitoring of dust, nitrogen oxide, and sulphur oxide emissions was installed in the Tabligbo clinker plant in Togo in accordance with CSI guidelines.
Since September 2015, the new NESHAP (National Emission Standards for Hazardous Air Pollut-ants) have been in force in the USA. To comply with these standards, we implemented measures in all cement plants during the reporting year to reduce and control dust, mercury, hydrochloric acid, and hydrocarbon emissions.
In the Fieni plant in Romania, we have been generating electricity from kiln waste heat since July 2015. The facility has an average net output of 3.6 MW. Through these and other energy efficiency measures, the Fieni plant is able to reduce its external electricity procurement by one quarter. About 40% of the investment was cofinanced by the EU and the Romanian government. We have also commissioned waste heat recovery plants to generate electricity in the Indian cement production site Damoh and in the Chinese cement plant Guangzhou.
In 2015, four of our cement plants in the USA – Leeds/Alabama, Union Bridge/Maryland, Glens Falls/New York, and Redding/California – were awarded the prestigious ENERGY STAR® by the U.S. Environmental Protection Agency (EPA) for their outstanding energy efficiency. The four plants are among the top 25 cement plants in the USA in terms of energy efficiency and meet the strict criteria of the EPA. Our Union Bridge plant has received this award for the third consecutive time, and the Leeds, Glens Falls, and Redding plants for the second time in a row.
In the aggregates business line, we focussed our efforts in 2015 on reducing noise and dust emissions as well as water and fuel consumption. In the United Kingdom, we installed a dust collection system at the Cliff Hill quarry and a fully automated water treatment plant at the Ardingly quarry. In Australia, a long downhill conveyor was installed as part of the quarry expansion at the Hobart location. The slope of this conveyor serves to generate electricity by means of a frequency converter. In the USA, our Rocky Mount/North Carolina quarry was awarded the ENERGY STAR®
for outstanding energy efficiency.
In the ready-mixed concrete business, we have made great efforts in Northern Europe to achieve zero emissions in the long term and reduce the consumption of fresh water and the quantity of sewage water through water recycling. This multi-year project will include over 100 production sites. In the Rosh Haayin concrete plant in Israel, the water treatment system was also upgraded.
As in previous years, numerous locations in all Group areas once again received awards for envi-ronmental protection measures in 2015.
108 HeidelbergCement | Annual Report 2015
Combined management report2

Procurement
In the 2015 reporting year, goods and services with a total value of €9,045 million were procured at HeidelbergCement. This corresponds to 67.2% of total revenue.
Procurement managementOur lead buyer organisation facilitates continuously efficient procurement of important commodity groups at Group level. This means that we bundle process-critical goods and services, usually with high volumes, into commodity groups in order to obtain better terms and conditions from our suppliers. The tasks of our lead buyers within the Group include conducting price negotiations, concluding framework agreements, supplier management, and observing current market and price developments. Thereby, they make an important contribution to increasing efficiency and to risk management in our Group.
The second component of procurement management is the local purchasing at our production sites, which strengthens our negotiating position with local suppliers. The local purchasing de-partments also obtain goods and services directly via the Group framework agreements. In this way, we combine the advantages of central and local procurement.
Increasing efficiency The proven savings initiative in procurement – the “FOX” programme – was continued in 2015 as part of the ongoing improvement process to further increase the Group’s financial and operational performance in the long term. In view of the generally persisting cost pressure, the programme also targets additional savings in procurement. In the reporting year, we succeeded in achieving considerable cost savings.
Another objective is to improve payment periods, because our terms of payment represent a key success factor for competitiveness. Thanks to continuous process optimisations and an improvement in our Group-wide terms of payment, we were able to achieve a correspondingly high liquidity effect by the end of 2015.
Furthermore, greater focus was put on the optimisation of the administrative procurement processes in 2015. On the one hand, the aim is to increase the level of automation in procurement, and on the other hand, to further standardise processes and interfaces.
Procurement of energyOverall, HeidelbergCement’s purchasing policy for the procurement of fuels and electricity fo-cuses primarily on the short term. In liquid electricity markets, in particular, such as Northern Europe, the United Kingdom, Germany, Belgium, the Czech Republic, and Hungary, we relied on low day-ahead prices. Our procurement strategy proved successful thanks to in part significantly reduced spot prices in these markets. Regulatory cost components, which have increased in many countries, were thus compensated. On account of the large proportion of index-based contracts for coal, we were able to benefit from reduced coal prices during the year. By adopting these measures, we successfully reduced electricity and fuel costs in many markets during 2015 and decreased energy costs in the cement business for the Group as a whole.
109HeidelbergCement | Annual Report 2015
Environmental responsibility
Procurement
Outlook
Risk and opportunity report
Fundamentals of the Group
2015 economic report
Additional statements
Sustainability
Employees and society
Com
bine
d m
anag
emen
t re
port
Cor
pora
te G
over
nanc
eC
onso
lidat
ed f
inan
cial
sta
tem
ents
Add
itio
nal i
nfor
mat
ion
2
3
4
5

Outlook
The expected future development of the HeidelbergCement Group, HeidelbergCement AG, and the business environment in 2016 is described in the following. In this context, please note that this Annual Report contains forward-looking statements based on the information presently available and the current assumptions and forecasts of the Group management of HeidelbergCement. Such statements are naturally subject to risks and uncertainties and may therefore deviate significantly from the actual development. HeidelbergCement undertakes no obligation and furthermore has no intention to update the forward-looking statements made in this Annual Report.
Changes in the reporting structure
From 2016, HeidelbergCement will reorganise its reporting structure. The changes were decided in the context of the generation change on the Managing Board and the intended acquisition of Italcementi. HeidelbergCement will then be divided into six Group areas:
– Western and Southern Europe: Belgium, Germany, Netherlands, United Kingdom, and Spain– Northern and Eastern Europe-Central Asia: Denmark, Iceland, Norway, Sweden, and the Baltic
States as well as Bosnia-Herzegovina, Croatia, Czech Republic, Georgia, Hungary, Kazakhstan, Poland, Romania, Russia, Slovakia, and Ukraine
– North America: Canada and USA– Asia-Pacific: Bangladesh, Brunei, China, India, Indonesia, Malaysia, Singapore, and Australia– Africa-Eastern Mediterranean Basin: Benin, Burkina Faso, DR Congo, Ghana, Liberia, Sierra
Leone, Tanzania, Togo, as well as Israel and Turkey– As before, Group Services will comprise our trading activities.
The only changes concern the shift of the northern European countries to the Northern and Eastern Europe-Central Asia Group area and of Spain to Western and Southern Europe.
Assumptions underlying our outlook
Our business is subject to a multitude of external influencing factors that are beyond our control. These include geopolitical, macroeconomic, and regulatory factors. This outlook is based on the assumption that the global political environment will not undergo any critical changes during the outlook period. In particular, this implies that the political crisis between Ukraine and Russia as well as the political and religious conflicts in the Middle East will not have a global impact on our business activity and that the euro zone will not be fundamentally destabilised. Despite the economic growth reported in the past year, we experienced a substantial drop in cement demand in China. We expect that the resulting excess capacities will only have a limited effect on export volumes.
Moreover, our assumptions for exchange rates and raw material prices in 2016 are based on their levels at the end of 2015. We therefore believe that the euro will strengthen slightly against most of our key currencies, with the exception of the US dollar. We expect that the prices of fuel, electricity, and key raw materials during the forecast period will remain approximately at a level
110 HeidelbergCement | Annual Report 2015
Combined management report2

comparable to the annual average of 2015. At the start of 2016, oil and raw material prices have declined further. On the one hand, the economy and population of importing countries benefit from the lower prices. On the other hand, companies in the raw materials industry significantly reduce their investments in new projects. The impact of this development is difficult to predict.
Furthermore, we have not taken account of any material changes to balance sheet positions or any associated expense or earnings positions in our outlook below that may result from changes to macroeconomic parameters, such as discount rates, interest rates, inflation rates, the future salary developments, or similar.
Acquisition of Italcementi
On 28 July 2015, HeidelbergCement concluded an agreement with Italmobiliare S.p.A. on the acquisition of a 45% stake in Italcementi S.p.A. This takeover provides a unique opportunity for accelerating the growth of our Group.
Italcementi operates in 22 countries and ideally complements the international presence of Heidel-bergCement. The Italian building materials manufacturer has strong market positions in France, Italy, the USA, and Canada. The company is also active in emerging countries with high growth potential, such as India, Egypt, Morocco, and Thailand.
The planned full acquisition of Italcementi is to take place in two steps. Following all necessary approvals of the competition authorities, HeidelbergCement will initially acquire a controlling stake of 45% from Italmobiliare S.p.A. The purchase price of around €1.7 billion will be paid in cash and with a minimum of 7.75 million and a maximum of 10.5 million new HeidelbergCement shares from a capital increase against contributions in kind at a minimum rate of €72.50 per share. HeidelbergCement will then propose a public mandatory offer to the remaining shareholders for the acquisition of their shares in return for a cash payment. For the acquisition of all shares, the total purchase price for Italcementi will amount to around €3.7 billion. The exact timing of the transaction was not yet known at the time the Annual Report was prepared. HeidelbergCement expects the transaction to be completed entirely in the second half of 2016.
As part of the Italcementi acquisition, divestments with a targeted volume of €1.0 billion are planned. This includes the already agreed sale to Italmobiliare S.p.A. of the activities of Italcementi that are not part of the core business. Furthermore, HeidelbergCement intends to dispose of individual plants in regions in which the activities of the two companies overlap. For further details regarding the financing of the acquisition, see the Expected financing section on page 116 f.
For the 2015 financial year, Italcementi achieved revenue of €4.3 billion, an adjusted EBITDA of €636 million, and an EBIT of €148 million. According to its own statements, Italcementi anti-cipates a slight rise in sales volumes and an improvement in the operating margin in 2016. If the Italcementi takeover is completed as expected in 2016, it will result in a correspondingly strong increase in revenue and operating income in the enlarged HeidelbergCement Group. The effect on the net result could not be estimated at the time the Annual Report was prepared.
The expected development of the HeidelbergCement Group, without taking the Italcementi take-over into consideration, is described in the following.
111HeidelbergCement | Annual Report 2015
Fundamentals of the Group
2015 economic report
Additional statements
Sustainability
Employees and society
Environmental responsibility
Procurement
Outlook
Risk and opportunity report
Com
bine
d m
anag
emen
t re
port
Cor
pora
te G
over
nanc
eC
onso
lidat
ed f
inan
cial
sta
tem
ents
Add
itio
nal i
nfor
mat
ion
2
3
4
5

Economic environment
General economic developmentAfter global economic growth in 2015 weakened slightly in comparison with the previous year, we anticipate a somewhat accelerated global economic expansion in 2016. In its outlook published in January 2016, the International Monetary Fund (IMF) forecasts global economic growth of 3.4% for 2016, compared with 3.1% in 2015. Drivers behind this trend are, on the one hand, the continued growth in the USA and the sustained economic recovery in the euro zone. On the other hand, it is anticipated that growth in the emerging countries will accelerate again, despite a further economic slowdown in China. Higher growth rates are expected in particular for countries in the Middle East and in Africa south of the Sahara. However, considerable uncertainties exist with regard to further geopolitical and macroeconomic development and the forecast for global economic growth was reduced most recently. In this context, the unpredictable consequences of the downturn in the Chinese economy, the impact of the oil price drop on oil-producing countries, and the distortions resulting from disparity in US and European interest rate policies must be mentioned.
In Asia, China will continue to be the determining factor in economic development. The IMF fore-casts a decline in growth for China, from 6.9% in 2015 to 6.3% in 2016. For Indonesia, growth of 5.3% is anticipated. Following the economic slowdown in 2015, development in Africa is seen in a more positive light again. This relates primarily to the countries south of the Sahara, where growth rates are expected to rise from 3.5% in 2015 to 4.0% in 2016.
In the mature markets, economic growth is estimated to accelerate from 1.9% in 2015 to 2.1% in 2016. According to IMF forecasts, the important markets for HeidelbergCement – USA, United Kingdom, Germany, and Canada – will show positive economic growth in 2016. However, the growth rate in the United Kingdom and Germany is forecast to remain stable in comparison with the previous year, while the other countries will register a slight improvement. Of these countries, the USA is expected to achieve the highest increase in economic output at 2.6%, followed by the United Kingdom with 2.2%, and Canada and Germany with 1.7% each. It is anticipated that the influx of immigrants in Germany will initially have a positive effect on economic growth and particularly demand for consumer goods and housing. Additional economic growth of 2.9% is anticipated for Australia, where increasing residential construction is expected to offset the decline in mining activities. In Canada, however, restrained market development is forecast due to the decline in investments in the oil sector.
Further expansion is also predicted for most countries in Eastern Europe and Central Asia in 2016. As in the mature markets, the development of individual countries is expected to vary. In the countries of Eastern and Southeastern Europe, economic growth ranging from 2.5% in Hungary to 3.9% in Romania is expected. An increase in growth rate is anticipated in Bosnia-Herzegovina, Romania, and Slovakia, and a decline in the Czech Republic and Hungary. Stable growth of 3.5% is predicted for Poland. After several years of recession on account of the conflict situation in the east of the country, a moderate recovery is forecast for Ukraine. The low oil price and the sanc-tions, however, are expected to have a sustained negative impact on economic growth in Russia.
With regard to consumer goods prices, the IMF expects a slight rise in mature markets and a moderate increase in emerging countries. Prices for raw materials, and oil in particular, are likely to remain below the level of the previous year in 2016, but the price drop is expected to slow down considerably.
112 HeidelbergCement | Annual Report 2015
Combined management report2

Industry developmentThe development of economic output is also reflected in the demand estimates for building materials. As the production and marketing of building materials is very localised and global trade in building materials only represents a small percentage of the total volume, we focus on the relevant regions and countries instead of considering a global view of the demand trend.
For the USA, a further increase of 5.0% in cement demand is anticipated for 2016. The growth rate is thus somewhat higher than the level of 2015 (+3.8%). This growth is mainly driven by the sustained recovery of private residential construction and commercial construction. For 2016, the American cement association PCA projects an increase of 10% in single- and multi-family housing starts. In December 2015, the US Congress adopted a new five-year federal programme (FAST – Fixing America’s Surface Transportation Act) with a volume of US$305 billion for the expansion of the infrastructure. At the same time, the financing support from the TIFIA (Transport Infrastructure Finance and Innovation Act) programme has been reduced. Over US$207 billion is available for road construction, representing an increase of almost 10%. Furthermore, the new federal programme ensures planning security for major infrastructure projects that are constructed over a longer period and are generally more cement-intensive.
In Europe, trends in the demand for building materials are expected to vary by region. In its fore-cast from November 2015, Euroconstruct expects an increase in cement consumption in most countries. In the United Kingdom and Sweden, the positive development of the previous year will continue thanks to growing demand in all construction sectors. For the other Scandinavian countries, additional moderate growth is anticipated. In the Netherlands, an increase in demand for cement is forecast due to the recovering residential construction, while demand is expected to decline to some extent in Belgium as a result of a slowdown in residential construction. A rise in cement consumption is projected for Poland and the Czech Republic in line with the positive economic trend. In its forecast from November 2015, the German Cement Works Association (VDZ) predicts slight growth for the German cement market in 2016, based on the positive economic development. Almost all construction sectors are expected to contribute to this trend, particularly the continuing dynamic development in private residential construction. Orders in Germany rose by almost 12% in 2015.
Just as the general economic forecasts, the development of demand for building materials during 2016 is also associated with uncertainties. With efforts being made to consolidate budgets in some mature markets, the demand for building materials is still dependent on the trend in private residential construction as well as commercial construction. Rising demand for building materials can only be achieved in line with positive economic development, reduced unemployment figures, and affordable property financing. In the growth markets of the emerging countries, the continuation of solid economic growth also plays an important role, as does income available for private residential construction, which in turn depends on the development of local food prices and thus inflation. Political and military conflicts, such as the one in Ukraine, can also influence the development of sales volumes.
Driven by the continuing capacity expansion and strong development of demand at the same time, we expect the level of competition to further increase in 2016, especially in the emerging countries of Asia and Africa. The resulting price pressure and potential weakening of some currencies in these regions, however, will likely slow down the investment activities of local producers.
113HeidelbergCement | Annual Report 2015
Fundamentals of the Group
2015 economic report
Additional statements
Sustainability
Employees and society
Environmental responsibility
Procurement
Outlook
Risk and opportunity report
Com
bine
d m
anag
emen
t re
port
Cor
pora
te G
over
nanc
eC
onso
lidat
ed f
inan
cial
sta
tem
ents
Add
itio
nal i
nfor
mat
ion
2
3
4
5

At the start of 2014, the European Union adopted a regulation to reduce CO2 emission rights. The so-called “backloading” plan envisages the reduction of 900 million emission rights within three years, 400 million of which in 2014, and the remainder in 2015 and 2016. Moreover, the European Union decided in 2015 to introduce a market stability reserve as a further measure to stabilise CO2 prices from 2020. This reserve will be funded with the emission rights that are withdrawn from the market through “backloading” and those that are saved as a result of additional measures. The price of emission rights initially rose after this new arrangement was introduced, but recently declined again due to the deteriorating oil price and is still well below the level of previous years. HeidelbergCement has more than sufficient emission rights for 2016.
Anticipated earnings
RevenueTaking into account the general economic and industry-specific outlook for the building materials industry and the special growth prospects for markets in which HeidelbergCement operates, we expect a moderate increase in revenue excluding exchange rate and consolidation effects for 2016. Capacity expansions in the cement business, which have already been completed in 2015 or are set to be finalised in 2016, support this projection. These include, in particular, the expanded ca-pacities at our Indonesian production site Citeureup, which should be finalised in the first quarter of 2016. In the cement business, we therefore anticipate moderately rising sales volumes. In the aggregates business, we also expect a moderate increase in sales volumes thanks to the recovery of infrastructure investments in mature markets. In 2016, price increases will continue to take on a high priority to further improve margins.
Group areasIn the Western and Northern Europe Group area, we expect a slight to moderate increase in sales volumes of cement and aggregates, driven by the recovery or continuation of demand growth in the countries in which we operate.
In Eastern Europe-Central Asia, we anticipate a moderate growth in sales volumes of cement, which will largely be stimulated by the expected recovery in demand in Poland, the Czech Republic, and Romania. For Russia and Ukraine, we expect stabilisation at a low level.
In North America, we expect a moderate increase in cement and aggregates volumes as a result of the continuing economic recovery, which should also affect commercial and public construction besides residential construction, as well as the development of sales volumes in the last months.
For the Asia-Pacific Group area, we anticipate a return to a moderate growth in sales volumes for cement and aggregates. In India and Indonesia, in particular, demand is forecast to rise due to an acceleration in economic growth and a noticeable increase in infrastructure investments.
In Africa, we estimate rising demand for building materials as result of the sustained economic growth. In terms of results, we expect on the one hand, an increase in competitive pressure, and on the other hand, a cost advantage owing to more favourable clinker imports. With the new capacities commissioned in recent years, we are well positioned and have sufficient reserves to participate in market growth. Overall, we anticipate a slight to moderate rise in sales volumes.
114 HeidelbergCement | Annual Report 2015
Combined management report2

CostsHeidelbergCement estimates that the cost base for energy will undergo slight to moderate growth in 2016, based on the assumption that prices will remain stable and sales volumes will increase. If energy costs remain at the low level seen at the end of January 2016, there is a chance of over-all decreasing energy prices and of a stable or slightly decreasing energy cost development. A moderate rise in the cost of raw materials and personnel is expected. HeidelbergCement further focuses on the continuous improvement of efficiency and margins. To this end we started the “Continuous Improvement” programmes in the cement and aggregates business lines to establish a culture of continuous improvement of operational and commercial work processes at employee level. Process optimisations are expected to achieve a sustainable improvement in results of at least €120 million in both business lines over a three-year period. The “CIP” programme for the cement business line started at the beginning of 2015, and the “Aggregates CI” programme for the aggregates business line was launched at the start of 2016. We also continue to optimise our logistics with the “LEO” programme, which has the goal of reducing costs by a total of €150 mil-lion over a period of several years. In addition, the “FOX” programme in purchasing is expected to achieve cost savings of around €100 million. In 2016, we anticipate a significant decrease in financing costs due to disciplined cash flow management and the refinancing of maturities at more favourable terms.
ResultsIn view of the forecasts for revenue and cost development, HeidelbergCement expects a moderate increase in operating income excluding exchange rate and consolidation effects for 2016. This assumption is made on the basis that building materials sales volumes will grow as anticipated and price increases can be implemented. The same applies for earnings before income and taxes (EBIT), before major non-recurring effects. Excluding non-recurring effects, we also expect a moderate increase in profit for the financial year. This estimation is based on an improvement in operating income and lower financing costs. Due to the increase in results and decrease in net debt, we anticipate a corresponding improvement in ROIC.
DividendHeidelbergCement has announced a progressive dividend policy for the coming years. This means that dividends in strong years are to be increased in an appropriate way that they can remain stable in weak years. For the 2015 financial year, the Managing Board and Supervisory Board will propose to the Annual General Meeting the distribution of a dividend of €1.30 per share. This corresponds to a payout ratio of 30.5% which is in line with the range of 30% to 35% that was announced at our Capital Markets Day. By 2019, we aim to increase the payout ratio to between 40% and 45% of the Group share of profit for the financial year. In individual cases we will adjust the dividend to the development of the dynamic gearing ratio and the cash flow of the HeidelbergCement Group, as well as take into account the further general economic development.
Investments
For information on the investments and divestments in the context of the acquisition of Italcementi, we refer to page 111 of the Outlook chapter.
As in previous years, HeidelbergCement will continue to apply strict spending discipline to further investments. In the 2016 financial year, we will therefore maintain our focus on the attractiveness of potential investment projects, the development of the operating income of the Group, and on the expected general economic trend. In 2016, we aim to increase slightly investment activities compared to the previous year and anticipate cash-relevant investments of around €1.1 billion.
115HeidelbergCement | Annual Report 2015
Fundamentals of the Group
2015 economic report
Additional statements
Sustainability
Employees and society
Environmental responsibility
Procurement
Outlook
Risk and opportunity report
Com
bine
d m
anag
emen
t re
port
Cor
pora
te G
over
nanc
eC
onso
lidat
ed f
inan
cial
sta
tem
ents
Add
itio
nal i
nfor
mat
ion
2
3
4
5

HeidelbergCement will consistently continue with its targeted investments in future growth –especially in cement activities – in the emerging countries of Asia and Africa. In Indonesia, the large-scale project of our subsidiary Indocement to expand the Citeureup production site is nearing completion. A new integrated production line with a cement capacity of 4.4 million tonnes should be ready in the first quarter of 2016. Another significant investment focus is on the expansion of our cement activities in Africa. We are currently constructing a cement grinding plant with a capacity of around 250,000 tonnes in the north of Togo, which is scheduled for completion for the first half of 2017. We are also expanding our cement capacity in Benin with the construction of an additional cement mill at the Cotonou grinding plant. The commissioning of the new mill with a capacity of 250,000 tonnes is also scheduled for 2017. In the Democratic Republic of Congo, we are constructing a new integrated production line in our Cimenterie de Lukala cement plant, which is located near the capital Kinshasa. With completion projected for the end of 2017, cement capacity of the plant will increase to 0.8 million tonnes. We are also evaluating options for capacity expansions in other African countries.
The expansion investments also include the purchase of the Australian aggregates company Rocla Quarry Products at the end of January 2016. We thus secure high-quality raw material reserves for our operations and strengthen our market position in Australia. Rocla Quarry Products operates 12 large sand pits in the metropolitan regions of Perth, Adelaide, Melbourne, and Sydney with a production of about 6 million tonnes per year.
Aside from these capacity expansions, we will invest in the maintenance and modernisation of our existing production sites in 2016. We will be making investments to upgrade our cement plants, among other things, in order to increase the use of alternative fuels. In line with the “Germany Cement Master Plan”, which was launched in 2014, we will continue an ambitious investment programme for modernisation and efficiency improvements, as well as environmental protection, in our German cement plants.
Expected financing
HeidelbergCement has a stable financing structure for the long term and a well-balanced debt maturity profile (see the following diagram). We will refinance the bonds of €300 million and US$ 750 million, that are due in March and August 2016, respectively, as well as the financial liabilities maturing in 2016, by making use of available liquidity, by issuing on the capital market or using free credit lines, depending on the capital market situation.
The financing of the acquisition of Italcementi is secured by initially €4.4 billion in bridge financing, which is made available by a bank consortium. The financing can be claimed by HeidelbergCement until July 2018, but can be repaid prematurely at any time. It has already been possible to reduce the financing volume of this facility by €1.7 billion to €2.7 billion because the risk of a mandatory offer to minority shareholders in Morocco and change of control clauses that were initially taken into account could be mostly excluded. This was further supported by the successful placement of debt certificates of €625 million on 14 January 2016, which were increased by €20 million to €645 million on 4 February 2016. The bridge financing is to be paid off by issuing bonds and making use of the operating cash flow and proceeds from portfolio adjustments.
116 HeidelbergCement | Annual Report 2015
Combined management report2

The following graph shows the maturity profile of HeidelbergCement as at 31 December 2015.
Debt maturity profile as at 31 December 2015 1) (€m)
1) Excluding reconciliation adjustments of liabilities of €7.6 million (accrued transaction costs, issue prices, and fair value adjustments) as well as derivative liabilities of €46.7 million. Excluding also puttable minorities with a total amount of €30.1 million.
As at the end of 2015, we had liquidity reserves consisting of cash, securities portfolios, and committed bank credit facilities, amounting to €4.1 billion (see Group financial management section on page 85). With the €1.5 billion Euro Commercial Paper Programme and €10 billion EMTN Programme we also have framework programmes in the money and capital markets in place that allow us to issue the relevant securities within a short period of time.
Our objective is to further improve our financial ratios in the coming years in order to achieve the necessary preconditions for our credit rating to be upgraded further by the rating agencies. In particular, we have set the ambitious target to reduce the dynamic gearing ratio in a timely manner again to below 2.5x (31 December 2015: 2.0x) after the acquisition of Italcementi. An investment grade rating remains our objective as – given the capital-intensive nature of our business – favourable refinancing opportunities in the banking, money, and capital markets create an important competitive advantage.
Employees and society
For several years, the focus of our global, functionally oriented academies has been the targeted qualification of our employees. In the next stage, we will assess the training content, improve it, and make the range of seminars more transparent. As part of a global training architecture, minimum standards for content will be defined for core target groups. The first additions to the training architecture are already planned in line with the broadening of our e-learning courses to include the Russian version of the “Cement Manufacturing Curriculum” as well as introductions to HeidelbergCement Group and the concrete production line for new employees.
Bonds Debt instruments Syndicated facility (SFA)
2016 2017 2018 2019 2020 2021 > 20210
500
1,000
1,500
2,000
991
991
817
1,808
1,138
121,150
1,051
11
980 1,000
1,122
117
1,050 500
501
5 1
1
5
117HeidelbergCement | Annual Report 2015
Fundamentals of the Group
2015 economic report
Additional statements
Sustainability
Employees and society
Environmental responsibility
Procurement
Outlook
Risk and opportunity report
Com
bine
d m
anag
emen
t re
port
Cor
pora
te G
over
nanc
eC
onso
lidat
ed f
inan
cial
sta
tem
ents
Add
itio
nal i
nfor
mat
ion
2
3
4
5

A point of focus in 2016 will be our extended training schemes for the employees at our head-quarters. Using different teaching formats, such as workshops, seminars, individual coaching, and e-learning, we will focus on business understanding, leadership and management training, effective communication, and IT skills.
Also in 2016, we will continue with the training of middle and junior management in the topic of management responsibility in occupational health and safety. Consistent implementation of and compliance with existing safety standards continues to take top priority and is a pre-requisite for the prevention of accidents, which we will monitor in a targeted manner by means of standardised site inspections.
In 2015, we started to address the issue of digitalisation in human resources with interdisciplinary working groups. The analysis of its impact on the working environment, requirement profiles, selection processes, interdisciplinary cooperation, and knowledge management, as well as the implementation of suitable measures represent another priority of our work in 2016.
To assess the satisfaction of our managers with their working environment and their identification with the Group, we will once again carry out a Group-wide management survey in 2016, as we did in 2010 and 2013. As in previous surveys, this provides an opportunity to identify improvement potential in comparison with the top group in comparable industries.
In the context of preparations for the integration of Italcementi, the focus will be on personnel organisation and core HR processes.
The areas surrounding our plants are as diverse as the people living and working there. That is why our social commitment is geared towards their needs. The voluntary activities we undertake at our locations are in line with our Corporate Citizenship Guidelines. All measures should achieve positive results for the benefit of society. We also want to promote mutual trust and partnership through transparency, open communication, and cooperation.
The CSR expert group, which was formed in 2014, has started to document various activities in the area of corporate citizenship and corporate social responsibility (CSR). The planned internal platform for the exchange of experience and knowledge transfer is to be set up in 2016 and made available across the Group. Furthermore, the expert group intends to implement a system to facilitate the selection and evaluation of CSR projects.
The HeidelbergCement Togo Foundation will extend its activities in the vicinity of the Tabligbo location. With technical support from the company Solergie, the foundation has already erected five solar kiosks in five villages that generate solar power. Around 300 homes, which are not connected to the electric grid, can recharge the batteries of their transportable lamps or mobile phones there and are no longer dependent on kerosene or expensive disposable batteries. Five more solar kiosks are to follow in 2016.
Environmental responsibility
The regulatory environment concerning the EU Emissions Trading System (EU ETS) remains difficult and uncertain due to the constant addition of changes and improvements. In 2015, the European Commission proposed changes for the fourth trading period (2020–2030) in the carbon leakage risk assessment and the definition of benchmarking values and overall caps (for energy-intensive industries). Political discussions on these topics are still in the early stages and will advance during 2016.
118 HeidelbergCement | Annual Report 2015
Combined management report2
In 2016, we will intensify our efforts in carbon capture and storage (CCS) and/or carbon utilisa-tion (CCU). Our CO2 capture project will be concluded in the Brevik cement plant in Norway. Our partnership with Joule Unlimited, Inc. will enter its first phase to jointly explore and develop the technology for converting CO2 emissions into biofuels. In 2016, we will also examine and test other CCU applications.
We will further increase the use of alternative fuels and raw materials in our Group. Besides further optimisation measures at European locations, our focus is on Central Asia, as well as on China and Indonesia, where the growing cities are forced to adopt circular economy initiatives at an affordable cost level. Consequently, we will enhance our engagement with local authorities and other interest groups in the waste management sector to implement appropriate projects.
We will increase the number of biodiversity management plans and continue to monitor existing plans in 2016. In this context, we will work on a more detailed definition of the high biodiversity value of a quarry. With our partner BirdLife International, we will further intensify our cooperation in Europe and launch new joint activities in Africa and Asia. We will expand the integration of biodiversity management aspects in our environmental management systems. In 2016, we will also link projects for the promotion of biodiversity and nature conservation with activities in the field of water management and corporate social responsibility. Furthermore, we plan to conduct a research study on the existence and impact of invasive species at selected quarries in Europe. In 2016, projects of the third edition of the Quarry Life Award competition will enter the research phase. The winners will be revealed in December.
In view of the “Circular Economy Package” of the European Commission, we will concentrate on implementing the certification system for sustainably produced concrete in 2016. We will also encourage the increased use of recycled materials in the production of different building materials.
Moreover, we will continue our Group-wide environmental audit of all business lines in 2016 in order to achieve our goal of auditing all locations by 2020. In 2016, our environmental protection initiatives in the cement business line will also focus on reduc-ing dust, nitrogen oxide, and sulphur oxide emissions. To this end, we will invest in new technical equipment at several locations in Europe, for example in Sweden, Estonia, and Germany, as well as in Asia. We will commission a flue gas desulphurisation facility at the Tarjun location in Indonesia.
In 2016, all our cement plants in the USA will comply with the National Emission Standards for Hazardous Air Pollutants (NESHAP), which implies lower dust, mercury, hydrochloric acid, and hydrocarbon emissions. In the future, we intend to play a leading role in the American building materials industry with regard to environmental protection.
In China, we will replace the existing raw mills at the Zuhjiang location with roller presses, thereby reducing electricity consumption thanks to the highly efficient grinding technology. At the Guangzhou location, we are beginning to install energy-efficient pre-grinders at three of the existing cement mills in order to lower electricity consumption.
In 2016, the focus of the aggregates business line continues to be on dust and noise reduction. In the ready-mixed concrete business, we will drive forward extensive measures for the recycling of water and reduction of water consumption in Northern Europe in particular.
119HeidelbergCement | Annual Report 2015
Fundamentals of the Group
2015 economic report
Additional statements
Sustainability
Employees and society
Environmental responsibility
Procurement
Outlook
Risk and opportunity report
Com
bine
d m
anag
emen
t re
port
Cor
pora
te G
over
nanc
eC
onso
lidat
ed f
inan
cial
sta
tem
ents
Add
itio
nal i
nfor
mat
ion
2
3
4
5

We carried out a global water risk study for all business lines in 2014. On the basis of the results obtained in this study, we have set ourselves the goal of implementing individual water management plans adapted to local conditions at all locations in water-scarce regions between 2016 and 2030.
Research and technology
In the next few years, we will continue to centre our efforts on developing cement types with reduced clinker proportion and thus lower CO2 emissions. The alternative fuels and raw materials used will benefit the environment. Significant cost savings are also expected, depending on the future price development for CO2 emission certificates. In addition, we will promote the develop-ment of our new clinker technology as another option to save CO2 and energy.
Another area of focus is the development of high-quality binders and concrete applications, achieving greater benefits for our customers and added value for our company. In the future, we will intensify the successful transfer of technology to further increase the speed of innovation. For the concrete business, we plan to increase again the profit contribution of special products in mature markets in 2015.
In 2016, we will continue the successful “Continuous Improvement Program” (CIP) and roll out the project in further cement plants. In doing so, our aim is also to anchor the improvements achieved under the “Operational Excellence” (OPEX) and “Maintenance Improvement” programmes with lasting effect in the Group.
In the aggregates business line, the successful and proven strategy of the “CLIMB” and “CLIMB Commercial” projects from 2011–2015 is being continued in 2016. With “Aggregates CI” we encourage continuous improvement in all areas of the local aggregates activities. This impacts, among other things, the management of real estate, extraction planning, operations, quality control, sales, and management efficiency. We make effective use of the skills and innovative suggestions of our talented employees, thereby achieving significant added value for the Group. With the new programme, we intend to sustainably increase the results by €120 million by the end of 2018.
Procurement
Over the current and the next year, we will continue to increase the efficiency of our procurement activities by consistently standardising and optimising our procurement processes. This will include further efforts to bundle commodity groups.
For 2016, we anticipate varying energy price developments in the energy markets that are relevant to us. While some price increases in local currency are expected in Asia and parts of Africa because of the high rates of inflation, among other things, we anticipate similar or slightly lower prices on average in 2016 for Central and Northern Europe compared with 2015.
120 HeidelbergCement | Annual Report 2015
Combined management report2
Risk and opportunity report
Risks and opportunities
HeidelbergCement’s risk policy is based on the business strategy, which focuses on safeguard-ing the Group’s existence and sustainably increasing its value. Entrepreneurial activity is always forward-looking and therefore subject to certain risks. Identifying risks, understanding them, as well as assessing and reducing them systematically are the responsibility of the Managing Board and a key task for all managers.
HeidelbergCement is subject to various risks that are not fundamentally avoided, but instead accepted, provided they are consistent with the legal and ethical principles of entrepreneurial activity and are well balanced by the opportunities they present. Opportunity and risk manage-ment at HeidelbergCement is closely linked by Group-wide planning and monitoring systems. Opportunities are recorded in the annual operational plan and followed up as part of monthly financial reporting. Operational management in each country and the central Group departments are directly responsible for identifying and observing opportunities at an early stage.
Risk management
The Managing Board of HeidelbergCement AG is obliged to set up and supervise an internal control and risk management system. The Managing Board also has overall responsibility for the scope and organisation of the established systems. The Supervisory Board and its Audit Committee also review the effectiveness of the risk management system on a regular basis.
HeidelbergCement has installed transparent regulations to govern competences and responsi-bilities for risk management that are based on the Group’s structure.
A code of conduct, guidelines, and principles apply across the Group for the implementation of systematic and effective risk management. The standardised internal control and risk management system at HeidelbergCement is based on financial resources, operational planning, and the risk management strategy established by the Managing Board. It comprises several components that are carefully coordinated and systematically incorporated into the structure and workflow organisation.
The essential elements of the risk management system are:– documentation of the general conditions for a methodical, efficient risk management in a Group
guideline. In addition to this Risk Management Policy, the Group’s Code of Business Conduct is concerned with the code of conduct and compliance standards to be observed.
– coordination of risk management in the Group Insurance & Corporate Risk department,– managers responsible for corporate risk at country level,– direct information and open communication of quantified risks between the Managing Board
and country management,– standardised and regular reporting at Group and country level.
121HeidelbergCement | Annual Report 2015
Fundamentals of the Group
2015 economic report
Additional statements
Sustainability
Employees and society
Environmental responsibility
Procurement
Outlook
Risk and opportunity report
Com
bine
d m
anag
emen
t re
port
Cor
pora
te G
over
nanc
eC
onso
lidat
ed f
inan
cial
sta
tem
ents
Add
itio
nal i
nfor
mat
ion
2
3
4
5

Organisation of risk management at HeidelbergCement
Risk management process
In order to optimise risk management, we are employing comprehensive software across the Group to map the entire risk management process. By using this software, we have implemented the basic conditions for increasing transparency and efficiency in all phases of the risk management process and for contributing to audit security. The software helps us with, among other things, the clear representation of the Group structure and the assignment of appropriate local respon-sibilities. Supported by standardised evaluation schemes, risks are systematically recorded and can be tracked over time together with the proposed countermeasures. The visualised risk data can now be consolidated in a timely manner, analysed flexibly and in various ways, and depicted using standardised risk reporting.
Identification and assessment of risksThe process of identifying risks is performed regularly on a decentralised basis by the country management and by the globally responsible Group functions. General macro-economic data as well as other industry-specific factors and risk information sources serve as auxiliary parameters for the identification process.
Appropriate thresholds for risk reporting have been established for the individual countries, taking into account their specific circumstances. On the basis of our Group’s risk model and according to the defined risk categories, the risks are assessed with reference to a minimum probability of occurrence of 10% and their potential extent of damage. The operational planning cycle is used as the base period for the probability forecast. In addition to this risk quantification, geared towards a duration of twelve months, there exists also an obligation to report on new and already known risks with medium- or long-term risk tendencies. The impacts on the key parameters – operating income, profit after tax, and cash flow – are used as a benchmark to assess damage potential. Both dimensions of risk assessment can be visualised by means of a risk map.
Supervisory Board
Managing Board
Group functions
Group areas / Country management
Auditors 1)
1) Part of the annual audit2) Legal, Compliance, Tax, IT, Treasury, Corporate Finance, Human Resources, Strategy & Development, Marketing & Sales
Insurance & Corporate Risk
Reporting, Controlling & Consolidation
Other Group functions 2)
Internal Audit
122 HeidelbergCement | Annual Report 2015
Combined management report2

Dimensions of risk assessment
The underlying scaling is as follows:
Likelihood Unlikely 1 to 20%Seldom 21% to 40%Possible 41% to 60%Likely 61% to 100%
Impact Definition of impact on business activity, financial performance and results of operations, and cash flowLow Negligible negative impact (≤ €20 million) Moderate Limited negative impact (> €20 million) Significant Significant negative impact (> €120 million)Critical Harmful negative impact (> €220 million)
The risk statement also includes risks that do not have a direct impact on the financial situation, but that can have an effect on non-monetary factors such as reputation or strategy. In the case of risks that cannot be directly calculated, the potential extent of damage is assessed on the basis of qualitative criteria such as low risk or risks constituting a threat to the Group’s existence.
The process of regular identification is supplemented with an ad-hoc risk report in the event of the sudden occurrence of serious risks or of sudden damage caused. This can arise, in particular, in connection with political events, trends in the financial markets, or natural disasters.
Aggregating, reporting, monitoring, and controlling risksThe quantitative, updated risk reports for all business lines in our Group countries are presented to the Managing Board on a quarterly basis within the framework of central management report-ing to ensure that risks are monitored in a structured and continuous way. Correlations between individual risks and events are considered at local level as far as possible. The quarterly manage-ment meetings provide a platform for the Managing Board and responsible country managers to discuss and determine appropriate risk control measures promptly. Decisions are thus made as to which risks will be intentionally borne independently and which will be transferred to other risk carriers, as well as which measures are suitable for reducing or avoiding potential risks.
Impact
Likelihood Unlikely
HighMediumLow
Seldom Possible Likely
Critical
Significant
Moderate
Low
123HeidelbergCement | Annual Report 2015
Fundamentals of the Group
2015 economic report
Additional statements
Sustainability
Employees and society
Environmental responsibility
Procurement
Outlook
Risk and opportunity report
Com
bine
d m
anag
emen
t re
port
Cor
pora
te G
over
nanc
eC
onso
lidat
ed f
inan
cial
sta
tem
ents
Add
itio
nal i
nfor
mat
ion
2
3
4
5

The Group Insurance & Corporate Risk department is responsible for coordinating the risk man-agement processes. It summarises all significant quantitative and qualitative risks for countries and Group functions on a quarterly basis in a central risk map. The Group’s detailed risk report is presented to the Managing Board once a year. In addition, interim reporting to the Supervisory Board is effected in the course of the year.
Monitoring and adjustmentsThe Group Internal Audit department systematically examines and assesses risk management to help increase risk awareness. In addition, the auditor carries out an examination of the risk management system as part of the annual audit in accordance with legal guidelines to determine whether the monitoring system is capable of identifying at an early stage any issues that could threaten the Group’s existence. The Managing Board also regularly informs the Supervisory Board and its Audit Committee about the risk situation.
The internal control and risk management system with regard to the Group accounting process
In accordance with § 289, section 5 and § 315, section 2, no.5 of the German Commercial Code (HGB), the internal control system within the HeidelbergCement Group includes all principles, processes, and measures intended to ensure the effectiveness, cost efficiency, and accuracy of the accounting and to ensure observance of the relevant legal provisions.
The internal monitoring system within the HeidelbergCement Group consists of process- independent and process-integrated control measures. The process-integrated auditing activities include controls that are incorporated into the process (e.g. the principle of dual control). Process-independent measures are controls carried out by persons not directly involved in the accounting process (e.g. Group Internal Audit).
Structures and processesThe organisational and management structure of HeidelbergCement AG and its Group companies is clearly defined. The responsibilities within the accounting process (e.g. accounting of HeidelbergCement AG and its Group companies, Group Controlling, Group Treasury, and Group Consolidation) are clearly defined and functionally separated.
Key characteristics of the accounting processes and the consolidationAll departments involved in the accounting process have the requisite qualifications and are equipped in accordance with the requirements. In the case of accounting issues that are complex or require discretionary judgement, we also call upon the expertise of external service providers such as pension experts or recultivation obligation assessors.
The accounting guideline and uniform accounting framework, both of which are centrally administered by the Group Reporting, Controlling, and Consolidation department, are mandatory for all Group companies. New laws, accounting standards, and current developments (e.g. in the Group’s economic and legal environment) are analysed and taken into account with regard to their relevance and impact on the consolidated financial statements. The central accounting guideline and uniform accounting framework guarantee uniform recognition, measurement, and presentation in the consolidated financial statements. Group-wide deadlines set out in a centrally managed financial calendar and instructions pertaining to the financial statements also help to make the accounting process structured, efficient, and uniform across the Group.
124 HeidelbergCement | Annual Report 2015
Combined management report2

In most countries, the financial statements of the Group companies are prepared in shared service centers in order to centralise and standardise the accounting processes. Accounting systems from SAP and Oracle are used in the majority of cases. To prepare the consolidated financial statements, further information is added to the individual financial statements of the Group companies and these are then consolidated using standardised software developed by SAP. All consolidation adjustments, such as the capital consolidation, the debt consolidation, the expense and income consolidation, and the at equity valuation, are carried out and documented. The various elements that make up the consolidated financial statements, including the Notes, are created entirely from this consolidation program.
At HeidelbergCement, the accounts data is checked at both local and central level. The decen-tralised checking of the local financial statements is carried out by the responsible Financial Director and country controlling. The central checking of the accounts data is carried out by the Group departments Consolidation, Controlling, Tax, and Treasury.
HeidelbergCement’s control system is also supplemented by manual checks, such as regular spot checks and plausibility checks, carried out both locally and centrally. The validations automati-cally performed by the consolidation program also form an integral part of HeidelbergCement’s control system.
Process-independent checks are carried out by the Audit Committee of the Supervisory Board and by Group Internal Audit. The latter checks the internal control system for the structures and pro-cesses described and monitors application of the accounting guidelines and accounting framework. The results of the check carried out by Group Internal Audit are reported to the Managing Board and Audit Committee. Additional process-independent monitoring activities are also performed by the Group auditor and other auditing bodies, such as the external tax auditors.
Measures for identifying, assessing, and limiting risksIn order to identify and assess risks, individual business transactions at HeidelbergCement are analysed using the criteria of potential risk, likelihood of occurrence, and impact. Suitable control measures are then established on the basis of these analyses. To limit the risks, transactions above a certain volume or with a certain complexity are subject to an established approval process. Fur-thermore, organisational measures (e.g. separation of functions in sensitive areas) and ongoing target/actual comparisons are performed for key accounting figures. The IT systems used for accounting are protected from unauthorised access by appropriate security measures.
The established control and risk management systems are not able to guarantee accurate and complete accounting with absolute certainty. In particular, individual false assumptions, inefficient controls, and illegal activities may limit the effectiveness of the internal control and risk manage-ment systems employed. Exceptional or complex circumstances that are not handled in a routine manner also entail a latent risk.
The statements made here apply only to the Group companies included in the consolidated financial statements of HeidelbergCement AG whose financial and operational policies can be determined directly or indirectly by HeidelbergCement AG for the purpose of deriving benefit from the activity of the company.
125HeidelbergCement | Annual Report 2015
Fundamentals of the Group
2015 economic report
Additional statements
Sustainability
Employees and society
Environmental responsibility
Procurement
Outlook
Risk and opportunity report
Com
bine
d m
anag
emen
t re
port
Cor
pora
te G
over
nanc
eC
onso
lidat
ed f
inan
cial
sta
tem
ents
Add
itio
nal i
nfor
mat
ion
2
3
4
5

Risk areas
Risks that may have a significant impact on our assets, financial, and earnings position in the 2016 financial year are divided into four categories based on the risk catalogue established in the Group: financial risks, strategic risks, operational risks, as well as legal and compliance risks. In the following, we assess only the risk situation of risks that are significant for us.
Financial risks
Our significant financial risks are currency risks, interest rate risks, refinancing risks, and credit risks as well as pension risks. We manage these risks primarily as part of our ongoing business and financing activities and, when required, by using derivative financial instruments. These risk areas are monitored on a continuous basis by the Group Treasury department in accordance with internal Group guidelines. All Group companies must identify their risks and hedge them in cooperation with Group Treasury on the basis of these guidelines. The activities and processes of Group Treasury are governed by comprehensive guidelines, which, amongst other things, regulate the separation of trade and the processing of financial transactions. As part of our ongoing risk management, we manage the transaction risk, i.e. the risk of fluctuating prices (e.g. currency exchange rates, interest rates, raw material prices) that may affect the Group’s earnings position. The overall development of financial risks has been stable in comparison with the previous year.
Currency risksThe most significant risk position overall and naturally also with respect to financial risks is related to currency risks, particularly translation risks. Following the upheaval on the capital markets in the second half of 2015, exchange rate volatility has increased significantly. This affected Asian currencies, in particular, and greater fluctuations on the currency markets should be anticipated as a result of the ongoing uncertainty concerning further interest rate hikes in the USA and the economic development in China. If these fluctuations deviate from the assumptions made in the forecast, this might have a negative impact on translation and transaction effects. We consider these currency risks to represent a medium risk with a seldom likelihood but a significant impact.
Currency risks arising as a result of transactions with third parties in foreign currency (transaction risks) are hedged in certain cases using derivative financial instruments with a hedging horizon of up to twelve months. We primarily use currency swaps and forward exchange contracts for this purpose, as well as currency options in some individual cases. Currency risks arising from intra-Group transactions in goods are not hedged, as the inflows and outflows in the various currency pairs cancel one another out at Group level to a large extent. Through our in-house banking activities, the borrowing and investment of liquidity of the subsidiaries lead to currency positions that are hedged by means of external currency swap transactions, which are appropriate in terms of maturities and amounts.
In general, we do not hedge currency risks arising from converting the financial statements of foreign individual companies or subgroups (translation risks). The associated effects have no impact on cash flow, and influences on the consolidated balance sheet and income statement are monitored on a continuous basis. More information on currency risks can be found in the Notes on page 249 f.
126 HeidelbergCement | Annual Report 2015
Combined management report2

Interest rate risksInterest rate risks exist as a result of potential changes in the market interest rate and may lead to a change in fair value in the case of fixed interest-bearing financial instruments and to fluctuations in interest payments in the case of variable interest-bearing financial instruments. Interest rate risks are maintained within the parameters set by the Group’s Chief Financial Officer. By using financial instruments, primarily interest rate swaps, we are able to hedge both the risk of fluctu-ating cash flows and the risk of value fluctuations. However, the downgrading of our credit rating by the rating agencies (see Rating section on page 85 f.) could increase the interest margins in the event of a refinancing measure. On the basis of the balanced maturity structure of financial liabilities (see diagram in the Outlook chapter on page 117) and the expected cash inflow from operating activities, there is no significant short- or medium-term need to refinance, meaning that no significant effects on the interest result are to be expected. Therefore, we see here only a low risk. More information on interest rate risks can be found in the Notes on page 249 f.
Refinancing/liquidity risksRefinancing/liquidity risks exist when a company is not able to procure the funds necessary to fulfil operational obligations or obligations entered into in connection with financial instruments.
Possible risks from fluctuating cash flows are considered as part of the Group liquidity planning. Assumptions concerning the expected economic cycle harbour particular uncertainties in liquidity planning, which is why we update them on an ongoing basis and simulate them by means of so-called stress tests. On this basis, we can – if necessary – initiate the appropriate measures, such as the issue of additional money and capital market securities or the raising of fresh funds in the bank market. To secure our payment obligations, we have access to a syndicated credit line with a volume of €3 billion and bridge financing for the acquisition of Italcementi that originally totalled €4.4 billion. As a result, we have access to substantial amounts of cash and cash equivalents and have thus considerably reduced the refinancing risk. In addition, cash is continuously accruing from our operating activities. As an additional precautionary measure, an appropriate amount for increasing shareholders’ equity was decided upon at the 2015 Annual General Meeting. We consider the refinancing/liquidity risks as a low risk.
The revolving syndicated credit facility of €3 billion mentioned above with a term that runs until the end of February 2019, following the conclusion of a new agreement in February 2014, of which only €324.2 million had been drawn upon as at the balance sheet date, is available for financing existing payment obligations. The amount of bridge financing, which was syndicated in August 2015 to our existing bank consortium, had already been reduced to €3.3 billion as at the balance sheet date. After the balance sheet date, the bridge financing was further reduced by €0.6 billion. In total, we have €4.1 billion of cash and cash equivalents, of securities, and free credit lines in our portfolio across the Group (see Liquidity instruments table in the Group financial management section on page 85).
In connection with credit agreements, we agreed to comply with various financial covenants, which were all met in the reporting period. The most important key financial ratios are the dynamic gearing ratio and the consolidated coverage ratio. Within the framework of Group planning, compliance with the covenants is monitored consistently, with notification issued to the creditors on a quarterly basis. In the event of a breach of the covenants, the creditors could, under certain conditions, accelerate corresponding loans irrespective of the contractually agreed terms. Depending on the volume of the relevant loan and the refinancing possibilities in the financial markets, this could lead to a refinancing risk for the Group.
127HeidelbergCement | Annual Report 2015
Fundamentals of the Group
2015 economic report
Additional statements
Sustainability
Employees and society
Environmental responsibility
Procurement
Outlook
Risk and opportunity report
Com
bine
d m
anag
emen
t re
port
Cor
pora
te G
over
nanc
eC
onso
lidat
ed f
inan
cial
sta
tem
ents
Add
itio
nal i
nfor
mat
ion
2
3
4
5

Both syndicated credit facilities contain covenants, which were agreed at a level that takes into account the current economic environment and our forecasts. More information on liquidity risks can be found in the Notes on page 247 f.
Credit risksCredit risks exist when a contractual partner in a business cannot fulfil its obligations, or at least not within the stipulated period. We minimise the risk position arising from this by diversification and ongoing assessment of the creditworthiness of the contracting parties.
Credit risks from operating activities are monitored continuously as part of our receivables man-agement. We apply strict standards with regard to the creditworthiness of our business partners. In this way – as well as by avoiding concentrations of positions – we are able to minimise the Group’s credit risks. We minimise credit risks for our financial investments by only conducting transactions with banks that are particularly creditworthy. We select banks for payment trans-actions and establish cash pools in exactly the same way. We consider the credit risks as a low risk. More information on credit risks can be found in the Notes on page 246.
Pension risksPrimarily in North America, HeidelbergCement is involved in various defined contribution pension plans for unionised employees (Multi-employer Pension Plans). The funding status of these pension plans could be affected by adverse developments in the capital markets, demographic changes, and increases in pension benefits. If one of the participating companies no longer pays contributions into the pension plan, all other parties concerned will be held liable for the obligations that have not been covered. Regarding the year 2016, we consider the pension risks as a medium risk with a seldom likelihood and moderate impact.
Strategic risks
Strategic risks particularly include risks related to the development of our sales markets in terms of demand, pricing, and the level of competition. In this category we also take into account risks arising from acquisitions and investments, product substitution, and political risks. Overall, strategic risks have remained almost unchanged in comparison with the previous year.
Industry-specific risks and sales market risksThe International Monetary Fund anticipates a slight acceleration of global economic growth for 2016. However, this is subject to the industrial countries in North America and Europe continuing their recovery, and that the economic growth in Asia, particularly in China, does not decline to a level critical to global economic growth. The significant decline in the oil price since mid-2014 can have varying effects on individual countries: in oil-importing countries, expenditure on fuel will decrease and more funds will potentially be available for consumption, while oil-exporting countries will have less income to invest in projects.
In general, we expect a positive economic development in the individual Group areas for 2016. Aside from general risks due to fluctuations in demand, we also see risks regarding sales volumes, prices, and customer relationships due to the increase in competition, particularly through the entry of new competitors in emerging countries such as Indonesia or in Sub-Saharan Africa. Overall, however, we rate this as a low to medium risk.
128 HeidelbergCement | Annual Report 2015
Combined management report2

The global development of demand for building materials naturally represents both an opportunity and a risk for us, and is dependent on a number of different factors. The key factors include pop-ulation growth and the increasing need for housing, economic growth, growing industrialisation and urbanisation, and the increased need for infrastructure. Demand for building materials is essentially divided into three sectors: private residential construction, commercial construction, and public construction.
Demand in private residential construction depends on factors such as access to affordable loans, the trend in house prices, and the available household income, which is in turn influenced by addi-tional parameters such as the rate of unemployment or inflation. The development of these factors and thus the demand in this sector is mostly subject to country-specific risks and uncertainties. In the USA, the bursting of the property bubble at the start of the financial crisis in 2008 led to a high excess of houses and apartments as well as a corresponding price collapse. Since 2013, we have observed a considerable recovery of the housing market in the USA. The number of sales and construction starts as well as house prices have risen. The continuing recovery of this market is subject to uncertainties and depends, among other things, on the further development of interest rates. In Asia, there is a risk that rising cost of living could negatively impact the revenue available for construction projects and thereby also the investments in private residential construction. In China, there still remain risks from speculations in urban residential property. Although the steps taken by the government and central bank to combat overheating in the booming property market have so far been successful, the situation must still be monitored very carefully.
The utilisation of production facilities, office spaces, and storage areas is crucial in determining the level of demand in commercial construction, and in turn depends on the general order situation both at home and abroad. As a result of the economic crisis, the vacancy rate of office and indus-trial spaces is still high in some countries, such as in the USA. While the recovery process in this sector has become more noticeable, its extent and time span is still uncertain. Intensified budgetary consolidation or increasing interest rates resulting from rising inflation pressure could have a negative effect on economic growth and the future demand for building materials.
Investments in infrastructure such as roads, railways, airports, and waterways fall into the public construction sector. The demand in this sector depends on national budgets and the implemen-tation of special infrastructure funding programmes. Risks exist insofar as countries could cut back on their infrastructure investments due to declining revenues, for example in oil-exporting countries because of the low oil price, or in order to consolidate their budgets. Noticeable growth in result from state-funded projects will only be seen with a time lag. The scope of the cutbacks and their effects on the demand for building materials cannot be predicted with absolute certainty.
Building materials are characterised by heavy weight in relation to the sales price and are thus not transported overland for long distances. Excess cement volumes are traded by sea on a regional level as well as between individual continents. If the difference in the price level between two countries, with connection to the sea trade, is so high that it exceeds the transportation costs, there is a danger of increased import pressure and thus of a price drop in the importing market.
A major industry-specific risk is the weather-related sales risk for building materials, which is mainly due to the seasonal nature of demand. Harsh winters with extremely low temperatures or high precipitation impact construction activity and have a negative effect on the demand for
129HeidelbergCement | Annual Report 2015
Fundamentals of the Group
2015 economic report
Additional statements
Sustainability
Employees and society
Environmental responsibility
Procurement
Outlook
Risk and opportunity report
Com
bine
d m
anag
emen
t re
port
Cor
pora
te G
over
nanc
eC
onso
lidat
ed f
inan
cial
sta
tem
ents
Add
itio
nal i
nfor
mat
ion
2
3
4
5

building materials. In addition to the winter weather, monsoons in some Group countries, such as India, are another example of the seasonal weather conditions that adversely affect the sales volumes of our products and thus our business results.
We counteract weather-related fluctuations in sales volumes and risks from trends in sales mar-kets with regional diversification, increased customer focus, the development of special products, and, to the extent possible, with operational measures: for example, we adjust the production level to the demand situation and use flexible working time models. In 2014, we restructured our activities in Belgium as a result of a persistent weakness of the construction industry and closed a cement plant permanently.
In order to further improve relationships with our customers and to respond to country-specific needs, HeidelbergCement carries out customer surveys across the Group and expands research and development operations at Group level. A continuous transfer of knowledge between our locations, which is systematically supported and promoted by the employees of our technical centers – HTC (cement and binders) and CCM (aggregates) – working at various locations across the Group, ensures that synergy effects are utilised as effectively as possible.
Our expectations regarding the future development of the industry and our sales markets are presented in the Outlook chapter on page 113 f.
Risks from acquisitions and investmentsCapacity expansions from acquisitions and investments ensure opportunities, but also risks. Possible risks in the case of acquisitions arise from the integration of employees, processes, technologies, and products. These also include cultural and language barriers in the growing markets as well as a generally increased level of personnel turnover in Asia, which leads to an outflow of valuable knowledge. We counteract these risks by targeted personnel development and an integrative corporate culture, including the creation of local management structures.
Acquisitions can affect the net debt to equity ratio and financing structure and lead to increases in fixed assets, including goodwill. In particular, impairments of goodwill due to unforeseen business trends can lead to financial burdens.
Investment projects can span several years from the planning phase to completion. In this process, there are particular risks when it comes to obtaining the necessary permission for mining raw materials or developing infrastructure, including connecting to energy and road networks, as well as risks concerning the requirements for subsequent use plans for quarrying sites.
In the case of future acquisitions, partnerships, and investments, there is a risk that political restrictions may only allow them to be implemented under complicated conditions or may prevent them at all. A resulting shortage in capacity expansion projects could affect the growth prospects of HeidelbergCement. In order to minimise financial burdens and risks and better exploit oppor-tunities, we look for suitable partners, particularly in politically unstable regions.
HeidelbergCement constantly monitors the market environment with respect to embarking on suitable acquisition projects or partnerships. In addition, market potential and raw material deposits are also systematically analysed and turned into proposals for investment projects. We place very high return requirements on every acquisition or investment decision, which are explained in the Internal management control and indicators section on page 48 f. Significant investment and acquisition projects are also subject to subsequent checks.
130 HeidelbergCement | Annual Report 2015
Combined management report2

The cement industry is building up its capacities in the markets of Eastern Europe, Asia, and A frica in order to benefit from the rising domestic demand. HeidelbergCement is likewise investing in capacity expansions and is focusing on local markets with exceptional growth potential. In 2015, a new cement mill commenced production in Ghana. In 2016, we will significantly expand our production capacities in Indonesia. Competitors are also building up new capacities in these regions. If the capacity increases in the markets in which we operate exceed the growth in demand, there is a risk of price collapse, which has negative effects on revenue and operating income. Prior to capacity expansion projects, HeidelbergCement reviews both the market environment and the market potential and responds to excess capacities with cost-saving and efficiency improvement programmes, capacity adjustments, and location enhancements. Owing to the weak growth in demand in 2015 and capacity expansions by competitors, there is a surplus of cement in Indonesia. If market development remains below expectations in 2016, price pressure might arise and adversely impact revenue and results. Overall, we consider this as a low risk.
At the end of July 2015, HeidelbergCement Group entered into an agreement with Italmobili-are S.p.A. on the acquisition of a 45% stake in Italcementi S.p.A. with the aim of taking over Italcementi and incorporating it in the HeidelbergCement Group. The takeover is expected to be completed during 2016. The potential impact of the takeover is not included in the revenue and results forecast of HeidelbergCement. We have many years of experience in integrating companies and have already created the necessary processes and structures. Nevertheless, there is a risk that the integration ends up being more difficult than anticipated, that new, so far unknown risks are recognised, or the development of revenue and results of Italcementi is weaker than forecast by Italcementi and adversely affects the revenue and results of the Group following the takeover.
Risks resulting from the substitution of productsCement, sand, gravel, and hard rock are the basic raw materials for the construction of houses, industrial facilities, and infrastructure throughout the world. The use of cement-like binders can be traced back to Roman times. Because cement is highly energy- and CO2-intensive, research projects are being undertaken to develop alternative binders with a more favourable energy and climate footprint.
Employees of the Heidelberg Technology Center (HTC) are closely monitoring the development of alternative binders and are actively exploring this area. However, when comparing the current state of knowledge regarding alternative binders with the stringent requirements relating to the processability, durability, and cost-effective production of the binders, we generally do not anticipate that the alternative binders currently being developed will replace traditional cement types on a large scale in the next few years. If the production costs for traditional binders increase dramatically, particularly in mature markets, e.g. as a result of further shortages of government- issued CO2 emission certificates or significant increases in energy prices, alternative binders could replace traditional binders provided that they fulfil all the aforementioned requirements. However, since this is currently not foreseeable, the risk is not included in our risk reporting.
Political risks and risks arising from exceptional external incidentsAs is the case for all companies, potential turmoil in a political, legal, or social context poses fundamental risks for us, too. HeidelbergCement operates in more than 40 countries around the world and is therefore also exposed to political risks, such as nationalisation, prohibition of capital transfer, terrorism, war, and unrest. At a number of locations, we cannot rule out certain security risks because of internal political circumstances. The conflict in eastern Ukraine affects the operation of one of our cement plants. If the situation in this region does not improve, we may lose the plant. We consider this development as a medium risk with a possible likelihood and moderate impact.
131HeidelbergCement | Annual Report 2015
Fundamentals of the Group
2015 economic report
Additional statements
Sustainability
Employees and society
Environmental responsibility
Procurement
Outlook
Risk and opportunity report
Com
bine
d m
anag
emen
t re
port
Cor
pora
te G
over
nanc
eC
onso
lidat
ed f
inan
cial
sta
tem
ents
Add
itio
nal i
nfor
mat
ion
2
3
4
5

In isolated cases, cement prices are subject to government regulation, e.g. in Togo. There may also be government intervention in production control, such as the temporary decommissioning orders in China. Overall, we consider this as a low risk.
Exceptional external incidents, such as natural disasters or pandemics, could also negatively impact our business performance. Liberia and Sierra Leone experienced an Ebola outbreak in 2014, which was only declared officially over at the end of 2015. Should another outbreak occur, there exists the risk that an adequate amount of raw materials necessary for cement production cannot be imported to these countries. During the last outbreak, we were able to secure sufficient transport capacities. Currently, we do not see any risk here. Appropriate compensation limits of our Group-wide property insurance programme guarantee comprehensive coverage against natural disasters, including earthquakes, for our activities in heavily endangered regions of North America and Asia.
Operational risks
Operational risks particularly include risks related to the availability and cost development of energy, raw materials, and qualified personnel. In this category we also take into account regulatory risks associated with environmental constraints, as well as production, quality, and IT risks. Operational risks have diminished in comparison with the previous year, mainly due to the elimination of energy price risks in Indonesia.
Volatility of energy and raw material pricesFor an energy-intensive company such as HeidelbergCement, price trends in energy markets, which are extremely volatile, represent a considerable risk. In 2015, overall energy prices decreased. This development was favoured by an increase in the production of shale gas and oil in North America. However, in some countries, such as India and Indonesia, prices for electricity rose.
Production bottlenecks, such as those owing to conflicts in the Middle East, could lead to a major increase in energy prices. In a few countries, risks also arise from cutbacks in state subsidies for electricity or from the state regulation of oil and gas prices. In Indonesia, subsidies for electricity and diesel have been considerably reduced in 2014. If the fuel subsidies continue to decrease, the transportation costs of our raw materials and finished products will rise. As a countermeasure, we are planning a corresponding increase in sales prices to offset the rising costs. However, we do not currently see any risk in this respect.
In addition to the volatility of energy prices, infrastructural bottlenecks also pose a common risk for our Group with regard to electricity supply, especially in Africa. The prices of other raw materials are also subject to economic fluctuations. In absolute terms, the costs of raw materials rose in 2015, but they declined slightly in relation to revenue.
We minimise the price risks for energy and raw materials by Group-wide, structured procurement processes. Furthermore, we rely on the increasing use of alternative fuels and raw materials. In this way, we minimise price risks while reducing CO2 emissions and the proportion of energy-intensive clinker in the end product cement. We have sustainably improved the efficiency of the cement
132 HeidelbergCement | Annual Report 2015
Combined management report2

manufacturing process with the Group-wide “Operational Excellence” programme, which was carried out between 2011 and 2013. By reducing and optimising our consumption of electricity, fuel, and raw materials, we are working directly towards a reduction in energy costs. With the “Continuous Improvement Program” (CIP) that was launched in 2014, we intend to not only retain but further improve our achievements continuously.
Another savings initiative in purchasing that continues the successful three-year “FOX” programme commenced in 2014 to further increase the Group’s financial and operational performance in the long term. In view of the generally persisting cost pressure, the current programme also targets additional savings in purchasing. More information on our procurement management can be found on page 109.
In the process of setting prices for our products, we aim to pass on increases in the costs of energy and raw materials to our customers. The success of these price increases is subject to consider-able uncertainty, as most of our products are standardised bulk goods whose price is essentially determined by supply and demand. As a result, there is a risk that price increases cannot be passed on or will cause a decline in sales volumes, particularly in markets with excess capacities.
Availability of raw materials and additivesHeidelbergCement requires a considerable amount of raw materials for cement and aggregates production, which is ensured by our own high deposits. In order to emphasise the key role of raw materials in our company and facilitate the transfer of knowledge and synergy effects beyond national borders, we have combined our geology activities in the cement business across the Group at HTC Global (see the Research and technology section on page 51) and for the aggregates business at CCM (Competence Center Materials). There is, however, potential for certain risks in particular locations with regard to obtaining mining concessions. In Malaysia, for example, the expansion of urbanisation may prevent a quarry from continuing to operate. Necessary permissions may be refused in the short term or disputes may arise regarding mining fees. In Damoh, India, there is a dispute with the state government about the correct calculation of limestone mining fees. We rate this as a medium risk with a seldom likelihood and a moderate impact. Ecological factors and environmental regulations for access to raw material deposits also create a degree of uncertainty. In some regions of the world, for example in West Africa south of the Sahara, raw materials for cement production are so scarce that cement or clinker needs to be imported by sea. Rising transportation costs and capacity constraints in the port facilities can lead to an increase in product costs. Overall, we rate this as a low risk.
Availability and prices of the additive blast furnace slag, which is used in cement manufacturing and is a by-product in steel manufacturing, are subject to economic fluctuations and therefore entail a cost risk. Blast furnace slag is used primarily in Europe and the CIS countries (Commonwealth of Independent States). In 2016, steel production is expected to remain almost stable compared with the previous year.
The transfers of production in connection with adjustments of European excess steel capacity may result in a shortage of blast furnace slag quantities in the short to medium term. As a precaution against potential future supply shortages and price fluctuations, we are optimising our stock holding and make the range of cement types more flexible.
133HeidelbergCement | Annual Report 2015
Fundamentals of the Group
2015 economic report
Additional statements
Sustainability
Employees and society
Environmental responsibility
Procurement
Outlook
Risk and opportunity report
Com
bine
d m
anag
emen
t re
port
Cor
pora
te G
over
nanc
eC
onso
lidat
ed f
inan
cial
sta
tem
ents
Add
itio
nal i
nfor
mat
ion
2
3
4
5

Production-related risksThe cement industry is a facility-intensive industry with complex technology for storing and processing raw materials, additives, and fuels. Because of accident and operating risks, personal injury and material or environmental damage may occur and operations may be interrupted.
In order to avoid the potential occurrence of damage and the resulting consequences, we rely on various surveillance and security systems in our plants as well as integrated management systems, which guarantee high safety standards, and regular checks, maintenance, and servicing. To identify the threat of potential dangers, we aim to provide all employees with appropriate training to raise their risk awareness. Overall, we consider the production-related risks as low risks.
As demand for building materials is heavily dependent on weather conditions, there is a risk that capacity utilisation may fluctuate and production downtimes may occur. We minimise this risk by establishing different regional locations, making use of demand-oriented production control and flexible working time models. In addition, we make use of production downtimes, where possible, to carry out any necessary maintenance work.
HeidelbergCement’s risk transfer strategy sets deductibles for the main insurance programmes that have been adjusted to the size of the Group and are based on many years of failure analyses. As of 2011, the international liability insurance programme has optimised the cover and liability limits, particularly for risks resulting from environmental damage.
Quality risksBuilding materials are subject to a strict standardisation. If supplied products do not meet the prescribed standards or the customer’s quality requirements, we risk losing sales volumes, facing claims for damages, and/or damaging our customer relationships. HeidelbergCement ensures compliance with the standards at the Group’s own laboratories by means of fine-meshed quality assurance in parallel with every process step as well as final inspections. Quality assurance controls are also carried out by independent experts as part of the extensive quality assurance programmes already in place. We consider the quality risks as a low risk.
Regulatory risks in environmental protection Changes to the regulatory environment can affect the business activities of HeidelbergCement. This concerns mainly legal regulations for environmental protection. Tighter environmental regulations could lead to increasing costs, higher demand for investments, or even the closing of production sites.
As part of the European climate package newly adopted in December 2008, which concerns the reduction of greenhouse gas emissions, ambitious goals have been set by the European Parliament and the European Commission with regard to climate protection. The cement industry, like other CO2-intensive industry sectors, has not been affected by the full auction of emission rights since 2013. The emission rights will thus continue to be allocated free of charge, but by 2020 their quantity will have been reduced by 21% compared with 2005. The emission certificates are to be allocated on the basis of demanding, product-specific benchmarks, and will be further reduced by the annually growing cross-sectoral correction factor. A rise in climate protection cost may be assumed as the total volume of certificates continues to decrease. In the long term, this could
134 HeidelbergCement | Annual Report 2015
Combined management report2

create additional burdens in Europe as a result of higher manufacturing costs and therefore clear competitive disadvantages in comparison with producers from countries not involved in emissions trading.
The US state of California has had a cap-and-trade programme for emission rights since Novem-ber 2012. Four auctions were held in the reporting year. Our subsidiary Lehigh Hanson did not take part because the state of California allocated sufficient emission rights free of charge to the cement industry. We do not expect this to change in the short term. Furthermore, Lehigh Hanson is actively examining approaches to maintain the CO2 output below the declining upper limit by improving kiln efficiency and the use of biomass, among other things. However, we will monitor the programme closely to ensure we make a timely decision regarding participation. Any involve-ment in the cap-and-trade programme entails the risk of having insufficient emission rights in the future and of incurring additional costs from the acquisition of rights.
An emissions trading system was introduced as pilot project in the Chinese province of Guangdong in 2013. In 2014, 97% of the emission certificates assigned for the year 2013 were allocated free of charge. As we required less than 97% of the allocated emission rights, these remain free of charge for us. Guangdong is one of China’s first provinces to introduce the emissions trading system. The full extent of the impact on our cement plants there cannot be conclusively assessed at this point. In 2017, a new national emissions trading system, which will also apply to the cement industry, is to be introduced in China.
The implementation of the European Industrial Emissions Directive 2010/75 into national law in 2013 led to more stringent environmental requirements for the European cement industry. In Germany, in particular, the limits for dust and ammonia emissions from 2016 and for nitrogen oxide emissions from 2019 were significantly tightened and even exceed EU requirements. Considerable investment is needed in order for us to meet these more stringent environmental regulations.
The National Emission Standards for Hazardous Air Pollutants (NESHAP), introduced by the American Environmental Protection Agency (EPA), have been in force since September 2015. In 2015, our North American subsidiary Lehigh Hanson completed major investments in technical equipment in order to meet these new standards, which are more stringent than standards already existing in other parts of the world.
Climate protection and reducing CO2 emissions are a focus of HeidelbergCement’s sustainability strategy. By increasing energy efficiency, developing cement types with a lower proportion of clinker, and using alternative fuels, such as biomass, we were able to reduce our specific net CO2 emissions from 1990 to 2015 by 22%. Additional measures concerning climate and environmental protection are outlined in the Environmental responsibility chapter on page 105 f. and the Research and technology section on page 50 f.
IT risksIT systems support our global business processes, communication and also to an increasing extent sales, logistics, and production. Risks could primarily arise from the unavailability of IT systems, the delayed provision of important data, and the loss or manipulation of data. The risk of a system failure increases especially due to the introduction of service and logistics centres based on central server solutions. The impact of a failure increases continuously with the number of connected locations.
135HeidelbergCement | Annual Report 2015
Fundamentals of the Group
2015 economic report
Additional statements
Sustainability
Employees and society
Environmental responsibility
Procurement
Outlook
Risk and opportunity report
Com
bine
d m
anag
emen
t re
port
Cor
pora
te G
over
nanc
eC
onso
lidat
ed f
inan
cial
sta
tem
ents
Add
itio
nal i
nfor
mat
ion
2
3
4
5

To minimise these risks, our Group uses back-up procedures as well as standardised IT infra-structures. Furthermore, the critical systems are run at two separate computer centres per region that comply with the latest security standards.
All important server systems and PCs are constantly protected against potential threats by up-to-date antivirus software. In addition, system platforms and critical business applications are regularly updated and secured by additional safeguards.
Information security is an integral part of the Group-wide IT strategy. We prepare, implement, and revise measures to protect data, applications, systems, and networks. One particular focus is access protection as well as the monitoring and filtering of data traffic. The IT security process is structured and divided into guidelines, standards, and recommendations, which help raise our employees’ awareness.
A continuous improvement process ensures a sustainable increase in the efficiency of security measures. We also take measures to counteract the ageing process of equipment and system technology. In the case of existing applications, we are particularly concerned with business- critical resources (e.g. ERP and logistics applications, or net infrastructure), which are updated and consolidated. We consider the risk of system or application outages as a medium risk.
Legal and compliance risks
Our principal legal and compliance risks include risks from ongoing proceedings and investigations, as well as risks arising from changes in the regulatory environment and the non-observance of compliance requirements. Legal and compliance risks have decreased in comparison with the previous year following the closing of risks regarding the changes to the German Renewable Energy Act (Erneuerbare-Energien-Gesetz).
Hanson asbestos-related claims and environmental damageSome of our Hanson participations in the USA are exposed to particular legal risks and disputes relating to former activities. The most significant of these are asbestos-related claims, which, amongst other things, allege bodily injury and involve several American subsidiaries. Products containing asbestos were manufactured before these companies belonged to the Hanson Group and to HeidelbergCement. In the USA, these damage claims are being handled and intensively managed by a team of in-house lawyers in collaboration with insurers and external consultants. The dispute is likely to continue for a few more years because of the complexity of the cases and the peculiarities of the American legal system. Adequate provisions have been formed on the basis of an extrapolation of the claims and reliable estimates of the development of costs over the next eight years. They are covered by liability insurances.
Furthermore, there is a considerable number of environmental and product liability claims against former and existing Hanson participations in the USA, which relate back to business activities discontinued a long time ago. There is partly insufficient insurance cover for law suits and liability loss claims relating to toxic substances such as coal by-products or wood preservatives. Our subsidiaries may also be charged further fines set by the court in addition to the clean-up costs
136 HeidelbergCement | Annual Report 2015
Combined management report2

and the compensation; there is, however, a possibility to settle authorised claims for compensation outside of court. Sufficient financial provision has been made for this event. Overall, we consider the risks related to environmental damages in North America as a medium risk.
Cartel proceedingsIn the cartel proceedings initiated in 2002 against German cement companies, the Düsseldorf High Regional Court imposed a fine of around €170 million against HeidelbergCement in June 2009, which was reduced in the last instance by the Federal Court of Justice in 2013 to approximately €161.4 million. The action for damages brought by the Belgian company Cartel Damage Claims SA (CDC) before the Düsseldorf District Court, which was based on allegedly inflated cement prices as the result of a cartel between 1993 and 2002, was indeed rejected in the first instance for legal reasons on 17 December 2013. The appeal that called into question this verdict was rejected by the Düsseldorf High Court on 18 February 2015. CDC has not lodged any further appeal against this.
However, CDC has filed a new claim with the Mannheim District Court, which relates to alleged new claims for damages acquired in 2014 and 2015 from 23 cement customers. CDC jointly and severally demands compensation for damages from HeidelbergCement for the alleged price effects of the German cement cartel from 1993 to 2002 in Southern and Eastern Germany. CDC estimates the damages at €82 million plus interest of €57 million. If the claim for damages is granted, HeidelbergCement must take recourse to the other cartel members at its own risk. Heidelberg-Cement believes to have convincing arguments against the claim, but, given the early stage of the claim, cannot reliably exclude a negative outcome. We assign a medium risk to this case.
The investigative procedures based on cartel allegations from November 2008, which started with reviews conducted by the European Commission at locations in Germany, Belgium, the Nether-lands, and the United Kingdom, were abandoned in summer 2015. The allegations could not be substantiated despite extensive investigations.
Especially, the experiences with these proceedings motivate us to continuously review and develop intensive internal precautions, particularly regular training initiatives – using, among others, electronic training programmes – in order to avoid cartel law violations
Sustainability and compliance risksAs part of its sustainable corporate governance, HeidelbergCement makes a special commitment to protect the environment, preserve resources, conserve biodiversity, and to act in a socially responsible way. We consider concern for the environment, climate protection, and sustainable resource conservation to be the foundation for the future development of our Group. Compliance with applicable law and Group regulations forms an integrated part of our corporate culture and is therefore a task and an obligation for every employee. Violations of our commitments or of laws and Group guidelines pose direct sanction risks in addition to strategic and operational risks, and also entail a risk to our reputation.
We have implemented a compliance programme across the Group to ensure conduct that is compliant with both the law and Group guidelines. This comprises, amongst other things, infor-mational leaflets, a compliance hotline, and employee training measures, which are conducted using state-of-the-art technologies and media such as electronic learning modules, and which focus on the risk areas of antitrust and competition legislation as well as anticorruption regulations.
137HeidelbergCement | Annual Report 2015
Environmental responsibility
Procurement
Outlook
Risk and opportunity report
Fundamentals of the Group
2015 economic report
Additional statements
Sustainability
Employees and society
Com
bine
d m
anag
emen
t re
port
Cor
pora
te G
over
nanc
eC
onso
lidat
ed f
inan
cial
sta
tem
ents
Add
itio
nal i
nfor
mat
ion
2
3
4
5

Violations of applicable laws and internal guidelines will be appropriately sanctioned. In addition, corresponding corrective and preventive measures will be taken to help prevent similar incidents from arising in the future.
Moreover, we have developed a concept for the evaluation and reduction of corruption risks and potential conflicts of interest. The risk assessment and creation of action plans in the individual countries started at the beginning of 2014 and will be completed in the course of 2016. An addi-tional focus of the further development of our compliance programme was the implementation of a guideline on international trade sanctions, which was introduced at the end of 2014, to ensure that we comply with the relevant sanctions regulations in the countries in which we are active, in particular those of the United Nations, the European Union, and the USA. The processes for the automated verification procedure against international sanctions lists were completely installed in 2015.
See page 96 f. for more information on sustainability, page 105 f. for more on environmental responsibility, and page 147 for more on compliance.
Opportunity areas
Business opportunities are recognised at Group level and at operational level in the individual countries and taken into account as part of the strategy and planning processes. In the oppor-tunities outlined below, we refer to possible future developments or events that can lead to a positive deviation from our forecast. Usually, we do not assess opportunities as their probability of occurrence is difficult to estimate.
Financial opportunitiesExchange rate and interest risks described under financial risks are also offset by opportunities that can turn the identified factors of influence to our advantage. Fluctuations in the exchange rates of foreign currencies against the euro present both risks and opportunities. On the one hand, for example, appreciation of the US dollar against the euro leads to growth in revenue and operating income; on the other hand, the US dollar-based proportion of purchasing costs measured in euro also increases. This primarily affects raw materials, which are traded in US dollar on the global market. We see opportunities for the development of results if the euro exchange rate against the other currencies weakens for the remainder of 2016.
Strategic opportunitiesIndustry and sales market risks are also offset by opportunities that can turn the identified factors of influence to our advantage. In 2016, opportunities could arise from stronger-than-expected economic growth in oil-importing countries owing to the significantly reduced oil price since the middle of 2014. Public construction might also benefit as a result of higher tax yield. In the medium and long term, we particularly see opportunities for an increase in demand for building materials in residential, commercial, and public construction as a result of rising population numbers, growing prosperity, and the ongoing trend of urbanisation, especially in the growth markets of emerging countries.
Risks arising from acquisitions and investments are also counterbalanced by opportunities. In recent years, we continuously expanded our cement capacities in growth markets and will commission new capacities in emerging countries in 2016 as well, especially in Indonesia. Further more, we intend to accelerate our growth and continue to improve our earnings potential
138 HeidelbergCement | Annual Report 2015
Combined management report2

through the Italcementi takeover. The opportunity exists to realise investments and acquisitions more quickly than expected, which in turn will provide a higher contribution to growth in earnings than anticipated. In the Outlook chapter on page 110 f., only acquisitions that have already been completed are taken into account.
Operational opportunitiesRisks from the increase in prices for energy, raw materials, and additives are offset by opportunities that can turn the identified factors of influence to our advantage. The significantly reduced oil price since the middle of 2014 could lead to lower fuel costs and positive secondary effects for our logistics subcontractors. Overall, the development of the energy price could be more advantageous if the supply of coal, shale gas, and oil exceeds demand, or if tariff increases for energy sources in emerging countries are lower or introduced later than expected. We see specific prospects for the development of results if energy costs remain at the low level of the end of January throughout the rest of 2016.
The consistent and ongoing implementation of measures to increase efficiency, reduce costs, and improve margins in production, logistics, and distribution is an integral part of our business strategy. As part of the “LEO” programme, which was launched in 2012, we are working on the optimisation of our logistics to achieve further improvements in efficiency and reduce costs through the better utilisation of vehicles and drivers. In addition, the projects “Aggregates CI” in the aggregates business line and “CIP” in the cement business line aim to increase margins by continuous improvements of operational and commercial work processes. The opportunity exists for all projects to produce higher-than-anticipated results and margin improvements that exceed previous expectations.
Assessment of the overall risk and opportunity situation by Group management
The assessment of the Group’s overall risk situation is the result of a consolidated examination of all major compound and individual risks. Compared with the previous year, there is no significant change in the composition of the risk matrix. The overall risk situation has improved in comparison with the previous year due to the decline in operational as well as legal and compliance risks.
Overall, the Managing Board is not aware of any risks that could threaten the existence of the Group either independently or in combination with other risks. There has been no notable change in the Group’s risk situation between the reporting date of 31 December 2015 and the preparation of the 2015 consolidated financial statements. The company has a solid financial base and its liquidity situation is comfortable.
HeidelbergCement is aware of the opportunities and risks for its business activity as presented in this chapter. The measures described above play a significant role in allowing HeidelbergCement to make use of the opportunities to further develop the Group without losing sight of the risks. Our control and risk management system, standardised across the Group, ensures that any major risks that could negatively affect our business performance are identified at an early stage.
With its integrated product portfolio, its strong positions in growth markets, and its efficient cost structure, HeidelbergCement considers itself well-equipped to overcome any risks that may materialise and benefit from opportunities presented.
139HeidelbergCement | Annual Report 2015
Environmental responsibility
Procurement
Outlook
Risk and opportunity report
Fundamentals of the Group
2015 economic report
Additional statements
Sustainability
Employees and society
Com
bine
d m
anag
emen
t re
port
Cor
pora
te G
over
nanc
eC
onso
lidat
ed f
inan
cial
sta
tem
ents
Add
itio
nal i
nfor
mat
ion
2
3
4
5

Corporate Governance
Part of the combined management report of HeidelbergCement Group and HeidelbergCement AG
3
140 HeidelbergCement | Annual Report 2015
142 Corporate Governance statement 142 Statement of compliance in accordance with § 161 of the
German Stock Company Act (Aktiengesetz) 142 Corporate Governance practices that extend beyond the legal
requirements 143 Working methods of Managing Board and Supervisory Board,
and composition and working methods of their committees 147 Compliance 148 Remuneration report 148 Current Managing Board remuneration system 2015 154 Amount of Managing Board remuneration in 2015 154 Managing Board remuneration 2015 according to
Accounting Standard DRS 17 157 Managing Board remuneration 2015 according to the
German Corporate Governance Code 161 Remuneration of the Supervisory Board in 2015 162 Supervisory Board and Managing Board 162 Supervisory Board 164 Supervisory Board Committees 165 Managing Board
141HeidelbergCement | Annual Report 2015
Cor
pora
te G
over
nanc
eC
onso
lidat
ed f
inan
cial
sta
tem
ents
Add
itio
nal i
nfor
mat
ion
3
4
5

Corporate Governance statement 1)
Statement of compliance in accordance with § 161 of the German Stock Company Act (Aktiengesetz)
On 15 February 2016, the Managing Board and on 16 February 2016, the Supervisory Board resolved to submit the following statement of compliance in accordance with § 161, section 1 of the German Stock Company Act: The Managing Board and Supervisory Board of HeidelbergCement AG declare, in accordance with § 161, section 1 of the German Stock Company Act, that they have complied with, and are in compliance with, the recommendations of the Government Commission on the German Corporate Governance Code (hereafter referred to as the Code), with the following exceptions:
− The performance-oriented element of the remuneration of the Supervisory Board, which was initially still in force during the reporting period, was not geared towards the sustainable development of the Group (deviation from point 5.4.6). This deviation has now been eliminated with retroactive effect, as the Annual General Meeting on 7 May 2015 abolished the variable remuneration of members of the Supervisory Board with effect from 1 January 2015.
Justification: The variable element of the remuneration of the Supervisory Board in force from 2010 to the end of 2014 was dependent on the Group earnings per share achieved in the respective previous year. As it was not based on a multi-year assessment, this variable element was thus not sustainable in the sense of the Code.
− The shareholdings of members of the Supervisory Board are not disclosed (deviation from point 6.2).
Justification: The members of the Supervisory Board are bound by the shareholding disclosure requirements under § 21 of the German Securities Trading Law (Wertpapierhandelsgesetz) and the Directors’ Dealings disclosure requirements under § 15a of the German Securities Trading Law. This seems to guarantee sufficient transparency as regards the shareholdings of members of the Supervisory Board.
For the reporting period from 9/10 February 2015 (submission date of previous statement of compliance) to 12 June 2015, the above statement relates to the version of the Code published in the German Federal Gazette (Bundesanzeiger) dated 24 June 2014. For the period since 13 June 2015, it relates to the version of the Code dated 5 May 2015, published on 12 June 2015.
Corporate Governance practices that extend beyond the legal requirements
A Group-wide Code of Business Conduct requires all employees to observe the basic rules of business decorum – irrespective of whether these rules have been expressed in legal regulations or not. In particular, the Code of Business Conduct calls for:– integrity and professional behaviour towards customers, suppliers, authorities, and business
partners,– consistent avoidance of conflicts of interest,– careful and responsible handling of the Group’s property and assets,– careful and responsible handling of company and business secrets as well as personal data,
1) In accordance with § 289a of the German Commercial Code (HGB), likewise the Corporate Governance Report in accordance with point 3.10 of the German Corporate Governance Code
142 HeidelbergCement | Annual Report 2015
Corporate Governance3

– fair, non-discriminatory employment conditions and fair dialogue with the employee representatives,– the provision of healthy and safe jobs, and– considerate handling of natural resources.
The Code of Business Conduct, which is published on our website www.heidelbergcement.com under “Company/Corporate Governance/Declaration of Corporate Governance”, is part of the comprehensive compliance programme and its observance is monitored by control mechanisms included in the programme.
Working methods of Managing Board and Supervisory Board, and composition and working methods of their committees
As a German stock company, HeidelbergCement is required by law to have a two-tier board system. The Managing Board is responsible for independently managing the Group; its members are jointly accountable for the management of the Group; the Chairman of the Managing Board coordinates the work of the members of the Managing Board. The Supervisory Board appoints, monitors, and advises the Managing Board and is directly involved in decisions of fundamental importance to the Group; the Chairman of the Supervisory Board coordinates the work of the Supervisory Board.
Management by the Managing BoardIn managing the Group, the Managing Board is obliged to act in the Group’s best interests. It takes into account the interests of shareholders, its employees, and other stakeholders with the aim of creating sustainable added value. The Managing Board develops the Group’s strategy, coordinates it with the Supervisory Board, and ensures its implementation. It ensures that all provisions of law and the Group’s internal guidelines are adhered to, and works to achieve compliance by Group companies. It ensures appropriate risk management and risk controlling within the Group.
The Managing Board considers diversity when filling management positions within the Group, and in doing so, strives to give due consideration to women. On 15 September 2015, the Managing Board resolved to achieve a target figure of 14% by 30 June 2017 for the proportion of women in managerial positions at the first level below the Managing Board at HeidelbergCement AG and a target figure of 15% for the proportion at the second level. For further information, refer to the chapter Employees and society on page 97 f. After reconsideration, the Super visory Board resolved on 14 September 2015 to maintain the current proportion of women in the Managing Board and to set the target figure for the proportion of women in the Managing Board by 30 June 2017 to 0%, although this specification explicitly states that the Supervisory Board is committed, as was previously the case, to take diversity into account when making personnel decisions.
The Managing Board Rules of Procedure issued by the Managing and Supervisory Boards govern, in connection with the schedule of responsibilities approved by the Supervisory Board, the work of the Managing Board, in particular the departmental responsibilities of individual members of the Managing Board, matters reserved for the full Managing Board, and the required majority for resolutions. In accordance with these rules, each member of the Managing Board runs his management department independently, with the provision that all matters of clearly defined fundamental importance are to be decided upon by the full Managing Board. This takes place in the regular meetings of the Managing Board, led by the Chairman of the Managing Board, on the basis of prepared meeting documents. The results of the meetings are recorded in minutes, which are issued to all members of the Managing Board. There are no Managing Board committees.
143HeidelbergCement | Annual Report 2015
Corporate Governance statement
Remuneration report
Supervisory Board and Managing Board
Cor
pora
te G
over
nanc
eC
onso
lidat
ed f
inan
cial
sta
tem
ents
Add
itio
nal i
nfor
mat
ion
3
4
5

Consultation and supervision by the Supervisory BoardThe task of the Supervisory Board is to regularly advise and supervise the Managing Board in the management of the Group. The Managing Board must involve the Supervisory Board in deci-sions of fundamental importance to the Group. The rules of procedure issued by the Supervisory Board for the Managing Board and the Supervisory Board govern the organisation and work of the Supervisory Board, in particular the required majority for resolutions, the legal transactions and measures requiring their consent, the standard retirement age for Managing and Supervisory Board members, the regular limit of length of membership of the Supervisory Board, and the tasks of established committees.
The Supervisory Board meets at least twice every half-year; at these meetings, it usually discusses the open topics and passes the required resolutions, on the basis of reports drawn up by the Managing Board and documents received in advance in preparation for the meeting. Additional or extraordinary meetings are held if necessary. The results of the meetings are recorded in minutes, which are issued to all members of the Supervisory Board. The Supervisory Board comprises a number of independent members – a number which it deems sufficient – and at least one inde-pendent member with expertise in either accounting or auditing. In accordance with the Articles of Association, the Supervisory Board has set up a total of four committees, which are entrusted with the tasks and working methods described below. The following respective plenary session of the Supervisory Board is given an account of the results of the committee work.
The Personnel Committee is responsible for preparing the decision of the Supervisory Board concerning the appointment of members of the Managing Board, for preparing the election of the Chairman of the Managing Board, and the establishment of the Managing Board’s remuneration structure as well as the remuneration paid to the individual members of the Managing Board. It is also responsible for making a decision concerning the structuring of the non-remuneration-related legal relationships between the company and the members of the Managing Board. The Personnel Committee comprises Messrs Fritz-Jürgen Heckmann, Josef Heumann, Hans Georg Kraut, Ludwig Merckle, Alan Murray, and Heinz Schmitt; the Chairman is Mr Ludwig Merckle.
The Audit Committee is responsible for preparing the decision of the Supervisory Board concern-ing the adoption of the annual financial statements and the approval of the consolidated financial statements. It is also responsible for monitoring the accounting process, the effectiveness of the internal control system, the risk management system, the internal audit system, the compliance programme, and the audit. When dealing with the audit, it is responsible in particular for the preparation of the Supervisory Board’s proposal to the Annual General Meeting for the appointment of the auditor, issuing the audit assignment, establishing points of focus for the audit, additional services provided by the auditor, concluding the fee agreement with the auditor, verifying the auditor’s independence including obtaining the auditor’s statement of independence, and making the decision concerning measures to be taken if reasons emerge during the audit to warrant the possible disqualification of the auditor or suggest a conflict of interest on the part of the auditor. The Audit Committee discusses the half-yearly and quarterly reports with the Managing Board before they are published. The Chairman of the Audit Committee has specialist knowledge and experience in the application of accounting principles and internal control processes. In addition to the Chairman, the Audit Committee includes at least one independent member with expertise in either accounting or auditing. The Audit Committee comprises Fritz-Jürgen Heckmann, Ludwig Merckle, Heinz Schmitt, Dr. Jürgen M. Schneider, Werner Schraeder, and Frank-Dirk Steininger; the Chairman is Mr Ludwig Merckle.
144 HeidelbergCement | Annual Report 2015
Corporate Governance3

The Nomination Committee is responsible for putting suitable candidates forward to the Supervisory Board for its proposals for election to be made to the Annual General Meeting. It comprises Messrs Fritz-Jürgen Heckmann, Ludwig Merckle, and Tobias Merckle as shareholder representatives; the Chairman is Mr Fritz-Jürgen Heckmann.
The Arbitration Committee, formed in accordance with § 27, section 3 and § 31, section 3 of the German Codetermination Law, is responsible for making a proposal to the Supervisory Board for the appointment of members of the Managing Board if the necessary two-thirds majority is not initially achieved. It comprises Messrs Fritz-Jürgen Heckmann, Hans Georg Kraut, Tobias Merckle, and Heinz Schmitt; the Chairman is Mr Fritz-Jürgen Heckmann.
Composition of the Supervisory Board, DiversityAdopting the recommendations stated in point 5.4.1 of the Code, the Supervisory Board resolved on 28 June 2012 and 14 September 2015 to set the following concrete objectives regarding its composition: The composition of the Supervisory Board is an appropriate reflection of the national and international alignment of HeidelbergCement as a leading building materials manufacturer. The Supervisory Board comprises at least three members who have been elected by the share-holders and who are independent members in line with point 5.4.2 of the Code. The Supervisory Board comprises at least two female members. The standard retirement age for members of the Supervisory Board is 75 years; at this age ends also the regular limit of length of membership of the Supervisory Board.
The Supervisory Board considers that its constitution corresponds to its specified goals.
At present, the Supervisory Board includes two women, one of whom was elected by shareholders and the other by employees. In accordance with the legal transitional periods, the minimum pro-portion of at least 30% each of women and men in the Supervisory Board, as specified in § 96, section 2 of the German Stock Company Act, only applies to new appointments to the Supervisory Board of the company as of 1 January 2016. No new appointments have yet been made.
Cooperation between Managing Board and Supervisory BoardThe Managing Board and Supervisory Board cooperate closely for the benefit of the Group. To this end, the Managing Board coordinates the Group’s strategic approach with the Supervisory Board and discusses the current state of strategy implementation with the Supervisory Board at regular intervals. For clearly defined transactions of fundamental importance, the Supervisory Board has specified provisions in the Managing Board Rules of Procedure requiring its approval.
The Managing Board informs the Supervisory Board regularly, without delay and comprehensively, of all issues of importance to the Group with regard to strategy, planning, business development, risk situation, risk management, and compliance. The Managing Board explains deviations of the actual business development from previously formulated plans and goals, indicating the reasons for this. The Supervisory Board has included detailed provisions in the Managing Board Rules of Procedure with regard to the Managing Board’s information and reporting duties. Documents required for decisions, in particular, the annual financial statements, the consolidated financial statements, and the Auditors’ report, are sent to the members of the Supervisory Board in due time before the meeting. The cooperation between the Managing Board and the Supervisory Board is shaped by mutual trust and a culture of open debate while fully protecting confidentiality.
145HeidelbergCement | Annual Report 2015
Corporate Governance statement
Remuneration report
Supervisory Board and Managing Board
Cor
pora
te G
over
nanc
eC
onso
lidat
ed f
inan
cial
sta
tem
ents
Add
itio
nal i
nfor
mat
ion
3
4
5
In the periods between Supervisory Board meetings, the Chairman of the Supervisory Board also maintains regular contact with the Managing Board, especially the Chairman of the Managing Board, to discuss Group issues regarding strategy, planning, business development, risk situation, risk management, and compliance. The Chairman of the Supervisory Board is informed by the Chairman of the Managing Board without delay on important events which are essential for the assessment of the situation and development, as well as for the management of the company.
Shareholdings of members of the Managing Board and Supervisory BoardThe direct or indirect ownership of shares or share-based financial instruments, especially deriva-tives, by members of the Managing Board has, neither in any individual case nor in total, exceeded the threshold of 1% of the issued shares.
According to the notifications available to the company, Supervisory Board member Ludwig Merckle holds via VEMOS 2 Beteiligungen GmbH, a company under his control, 26.2% of the issued shares. As regards the other members of the Supervisory Board, the ownership of shares or share-based derivatives has, neither in any individual case nor in total, exceeded the threshold of 1% of the issued shares, according to the available reports.
Relationships with shareholdersIn line with the options provided for in accordance with the law or the Articles of Association, the shareholders exercise their rights before or during the Annual General Meeting and thereby exercise their voting right. Each share carries one vote at the Annual General Meeting (one-share-one-vote principle). The ordinary Annual General Meeting is normally held in the first five months of the financial year. All important documents for exercising shareholder rights as well as the resolution issues and documentation are duly and easily available on our website for shareholders to access. Both the notice of the agenda for the Annual General Meeting and our website will provide shareholders with the information they need to exercise their rights, and particularly their voting rights at the Annual General Meeting, including by way of proxy or postal vote. A company proxy bound by instructions is also available to shareholders to exercise their voting rights at the Annual General Meeting.
The presentation slides accompanying the report given by the Chairman of the Managing Board to the Annual General Meeting will be made available on the Internet at the same time. After the Annual General Meeting is over, our website will be updated with the attendance details and the voting results of each agenda item.
As part of our investor relations work, we provide information to shareholders and other investors comprehensively and regularly on a quarterly basis to tell them about the business development as well as the financial situation and earnings position, and also provide them with notifications in accordance with the German Securities Trading Law and information on analyst presentations, press releases, and the annual financial calendar. Details on our investor relations work can be found on page 40.
146 HeidelbergCement | Annual Report 2015
Corporate Governance3

Compliance
Within the Group’s management culture, strong emphasis is placed on the compliance programme, which is firmly anchored in the Group-wide management and supervisory structures. It comprises the entire compliance organisation within the Group, the setup of guidelines, and verification of compliance with these guidelines.
The compliance organisation is under the authority of the Chairman of the Managing Board, to whom the Director Group Compliance reports directly. Each country has its own compliance officer; however, responsibility for ensuring that employees’ conduct complies with the law and regulations lies with all managers and, of course, the employees themselves.
The compliance officers are supported by modern technologies and media, such as electronic learning platforms and learning programmes as well as an internet- and telephone-based reporting system. The entire compliance programme is reviewed on an ongoing basis for any necessary adjustments to current legal and social developments, and is continuously improved and developed accordingly.
Group-wide implementation of the compliance programme is monitored by regular and special audits by Group Internal Audit as well as via special half-yearly compliance reporting by the Director Group Compliance to the Managing Board and the Audit Committee of the Supervisory Board. As part of his responsibilities, the Director Group Compliance monitors the effectiveness of the compliance programme and verifies in particular whether it adequately satisfies the legal requirements and recognised compliance standards. An additional quarterly report regularly informs the Managing Board members with regional responsibility about the most important compliance incidents in their Group areas.
In 2015, the compliance officers’ preventive activities once again placed great emphasis on compliance with the provisions of competition legislation and anti-corruption regulations. This was backed by appropriate training measures in these areas. The project for the evaluation and reduction of corruption risks was successfully continued and almost completed. Another point of focus was the topic of trade sanctions. In 2014, we adopted a policy with the objective of implementing an IT-supported test procedure across the Group. In 2015, we fully implemented the processes for the assessment of new business partners as well as the regular review of almost the entire business partner position.
In addition to these key areas, other focuses continue to be occupational safety legislation and environmental law. This reflects the characteristics and specific features of a heavy industry that extracts raw materials and manufactures and markets homogeneous mass goods, and which generally operates locally. Special efforts are also made to observe the prohibition of insider trading, capital market and data protection regulations, regulations on non-discrimination in dealings with employees, and internal purchasing principles.
147HeidelbergCement | Annual Report 2015
Supervisory Board and Managing Board Corporate Governance statement
Remuneration report
Cor
pora
te G
over
nanc
eC
onso
lidat
ed f
inan
cial
sta
tem
ents
Add
itio
nal i
nfor
mat
ion
3
4
5

Remuneration report
The remuneration report contains two parts. The first part presents the Managing Board remuner-ation system and the remuneration of members of the Managing Board for the 2015 financial year, both according to the applicable accounting standards as well as the valid version of the German Corporate Governance Code dated 5 May 2015. The second part shows the remuneration for the Supervisory Board paid for the 2015 financial year.
Current Managing Board remuneration system 2015
The current Managing Board remuneration system has been applied to all members of the Managing Board since financial year 2014. It constitutes a further development to the system that was in force from 2011 to 2013. The current Managing Board remuneration system was approved by the Annual General Meeting on 7 May 2014 with a majority of 97.5% of the votes cast, in accordance with § 120, section 4 of the German Stock Company Act.
PrinciplesThe system and amount of remuneration of the Managing Board are determined by the Supervisory Board following a recommendation by the Personnel Committee. They are based on the size and international activity of the Group, its economic and financial situation, its future prospects, the amount and structure of the Managing Board remuneration in comparable companies, and the remuneration structure used for the rest of the Group. In addition, the tasks and performance of the relevant member of the Managing Board, and of the entire Managing Board, are taken into account. The remuneration is calculated in such a way that it is competitive on the market for highly qualified senior managers and provides an incentive for successful work in a business culture with a clear focus on performance and results.
Remuneration elements The remuneration system applicable since 1 January 2014 comprises:1. a fixed annual salary,2. a variable annual bonus,3. a variable long-term bonus with long-term incentive,4. fringe benefits, as well as5. pension promises.
The following graph shows the relation between fixed and variable remuneration elements of the target remuneration (without fringe benefits and pension promises) and a comparison of the amount of the individual variable components – when 100% of the target is met – with the fixed annual salary.
148 HeidelbergCement | Annual Report 2015
Corporate Governance3

Relation of remuneration elements when 100% of the target is met
1. Fixed annual salaryThe fixed annual salary is a set cash payment relating to the financial year, which is based on each Managing Board member’s area of responsibility and is paid on a monthly basis over the year. It amounts to around 29% of the target remuneration for the Chairman of the Managing Board and 33% for members of the Managing Board, when 100% of the target is met.
2. Annual bonusThe annual bonus is a variable remuneration element, which relates to the financial year and is 100% of the fixed annual salary for the Chairman of the Managing Board and 80% for members of the Managing Board, when 100% of the target is met. It amounts to around 29% of the target remuneration for the Chairman of the Managing Board and 26% for members of the Managing Board. The Group share of profit, adjusted for one-off items, is used as the key performance indicator. In addition, individual targets will be agreed with the Chairman of the Managing Board and the Managing Board members.
At the start of the financial year, the Supervisory Board decides on the performance targets and, at the end of the financial year, determines the extent to which the target has been reached.− Target value (value when 100% of the target is met) 100% of the fixed annual salary for the Chairman of the Managing Board, 80% of the fixed
annual salary for the Managing Board members− Key performance indicators and weighting (value when 100% of the target is met) 2/3 Group share of profit 1/3 individual targets − Target achievement range 0–200% (The maximum value of the annual bonus is limited to 200% of the fixed annual salary
for the Chairman of the Managing Board and 160% for the Managing Board members and total loss of the entire annual bonus is possible; the determination of the range refers to each individual key performance indicator.)
Fixed annual salary Annual bonus Long-term bonus
Chairman of the Managing Board since 1 January 2014
(fix)
(variable)
(variable)Fixed
annual salaryAnnualbonus
Long-termbonus
Members of the Managing Board since 1 January 2014
(fix)
(variable)
(variable)
Variable remuneration
Variable remuneration
Fixedannual salary
Annualbonus
Long-termbonus
100% 100% 150%
100% 80% 125%
29%
42%
29%
33%
41%
26%
71%
67%
149HeidelbergCement | Annual Report 2015
Corporate Governance statement
Remuneration report
Supervisory Board and Managing Board
Cor
pora
te G
over
nanc
eC
onso
lidat
ed f
inan
cial
sta
tem
ents
Add
itio
nal i
nfor
mat
ion
3
4
5

The following table shows a sample calculation for the determination of the annual bonus of the Chairman of the Managing Board with a fixed annual salary of €1,500,000.
Sample calculation annual bonus of the Chairman of the Managing Board 1)
Target €1,500,000 (100% of fixed annual salary of €1,500,000)
Performance period 1 year
Key performance indicators
2/3 Group share of profit (€1,000,000)1/3 individual targets (€500,000)
Range 0–200%
Target achievement(example)
Group share of profit 140% (€1,400,000)individual targets 100% (€500,000)
Example result Group share of profit+ individual targets
= Cash payout
€1,400,000€ 500,000
€1,900,000
1) The degrees of target achievement are fictitious and serve only as illustration.
3. Long-term bonusThe long-term bonus is a variable remuneration element based on the long term, which is to be granted in annual tranches starting in 2011. It amounts to 150% of the fixed annual salary for the Chairman of the Managing Board and 125% for members of the Managing Board, when 100% of the target is met. The long-term bonus amounts to approximately 42% of the target remuneration for the Chairman of the Managing Board and 41% for members of the Managing Board and comprises two equally weighted components.
The first component (management component with a term of three years) considers the internal added value as measured by earnings before interest and taxes (EBIT) and return on invested capital (ROIC), and is arranged in the form of a bonus with cash payment. The bonus will be paid after the Annual General Meeting in the year following the three-year performance period. The second component (capital market component with a term of four years) considers the external added value as measured by total shareholder return (TSR) – adjusted for the reinvested dividend payments and for changes in the capital – compared with the relevant capital market indices, using performance share units (PSUs). The PSUs are virtual shares used for the calculation of the capital market component.
At the start of every tranche, the Supervisory Board determines the performance targets for the two key performance indicators of the management component. After expiry of the respective performance period, the Supervisory Board will ascertain the extent to which the target has been reached for the management component; for the capital market component it will be ascertained by way of calculation.
The target for the management component is based on the Group’s relevant three-year operational plan. The share-based capital market component is measured over a four-year period, on the basis of § 193, section 2, no. 4 of the German Stock Company Act (AktG).
For the capital market component, the number of performance share units (PSUs) initially granted is ascertained in the first instance: the number of PSUs is calculated from 50% of the target value of the long-term bonus divided by the reference price 2) of the HeidelbergCement share as at the date of grant. After expiry of the four-year performance period, the PSUs definitively earned are to be calculated in a second step according to the achievement of the target and paid in cash at the reference price of the HeidelbergCement share valid at that time – adjusted for the reinvested dividend payments and for changes in the capital.
2) The reference price is respectively the average of the daily closing prices of the HeidelbergCement share on the Frankfurt Stock Exchange Xetra trading system for three months retrospectively from the start/expiration of the performance period.
150 HeidelbergCement | Annual Report 2015
Corporate Governance3

− Target value (value when 100% of the target is met) 150% of the fixed annual salary for the Chairman of the Managing Board and 125% of the fixed
annual salary for the Managing Board members (of which 50% is the management component and 50% is the capital market component)
− Key performance indicators and weighting (value when 100% of the target is met) Management component (three-year performance period): 1/2 average of EBITs attained during the performance period 1/2 target ROIC at the end of the performance period Capital market component (four-year performance period): 1/2 peer TSR; calculation of TSR compared with DAX 30 Index 1/2 peer TSR; calculation of TSR compared with MSCI World Construction Materials Index − Target achievement range Management component: target achievement ranges from 0–200%, i.e. the maximum value
of the management component of the long-term bonus is limited to 150% of the fixed annual salary for the Chairman of the Managing Board and 125% for the Managing Board members and total loss of the management component is possible; the range applies separately for each key performance indicator EBIT and ROIC.
Capital market component: target achievement ranges from 0–200%, i.e. depending on the target achievement, the number of virtual shares (PSUs) can maximally double or reduce to zero (total loss).
− Cap of performance of the HeidelbergCement share before payout Maximum of 2.5 times the reference price, which was determined at the start of the performance period.− Payment under the respective long-term bonus plan is limited to twice the target value.
Payment system for the long-term bonusThe following graph shows the payment system for the long-term bonus.
2011 2012 2013 2014 2015 2016 2017 2018
Start of performance periods
Target setting
Share price reference periods
Performance periods
Evaluation periods
Payouts
1st planManagement component
Capital market component
2nd planManagement component
Capital market component
3rd planManagement component
Capital market component
4th planManagement component
Capital market component
6th and on-going plans
5th planManagement component
Capital market component
Performance periods
Evaluation periods
Payouts
151HeidelbergCement | Annual Report 2015
Corporate Governance statement
Remuneration report
Supervisory Board and Managing Board
Cor
pora
te G
over
nanc
eC
onso
lidat
ed f
inan
cial
sta
tem
ents
Add
itio
nal i
nfor
mat
ion
3
4
5

The management component of the long-term bonus plan 2015–2017/18, which was granted in 2015, is paid after the Annual General Meeting 2018, i.e. in the year following the three-year performance period; the capital market component is paid after the Annual General Meeting 2019, i.e. in the year following the four-year performance period.
During the implementation phase, a disbursement mechanism with a bonus-malus system formed an element of the long-term bonus plan. According to this mechanism, for the first three years, a third of the target value of the first long-term bonus plan 2011–2013/14 was paid out annually after the following year’s Annual General Meeting. These amounts were offset against payments of variable remuneration elements for financial year 2014.
The following table shows a sample calculation for the determination of the long-term bonus of the Chairman of the Managing Board with a fixed annual salary of €1,500,000.
Sample calculation long-term bonus of the Chairman of the Managing Board 1)
Target €2,250,000 (150% of fixed annual salary of €1,500,000)
Basis Management component: 50% of €2,250,000 = €1,125,000 Capital market component: 50% (€1,125,000) will be converted into virtual shares; Ø share price of the last 3 months before the beginning of the plan: €60€1,125,000/€60 = 18,750 virtual shares
Performance period 3 years (from 2015 to 2017) for the management component and4 years (from 2015 to 2018) for the capital market component
Key performance indicators
Management component: 1,1250,000 € 1/2 EBIT (€562,500)1/2 ROIC (€562,500)
Capital market component: €1,125,000 (18,750 virtual shares) Peer TSR:1/2 DAX 30 Index (9,375 virtual shares)1/2 MSCI World Construction Materials Index (9,375 virtual shares)
Range 0–200%
Target achievement(example)
EBIT 160% (€900,000) Relative TSR: DAX 30 Index 100% (9,375 virtual shares)ROIC 120% (€675,000) MSCI World Construction Materials Index 140% (13,125 virtual shares)
Example result Management component: €900,000 + €675,000 = €1,575,000Capital market component: 9,375 +13,125 = 22,500 virtual shares (Ø share price over the last 3 months before the end of the 4th year e.g.: €100; Maximum value is 250% x €60 = €150) = 22,500 virtual shares x €100 = €2,250,000
Management component €1,575,000 + capital market component €2,250,000 = €3,825,000 2)
1) The degrees of target achievement and share prices are fictitious and serve only as illustration.
2) The arithmetical payment amount is less than twice the target value (€4,500,000) and therefore a payment without cap is possible.
4. Fringe benefitsThe taxable fringe benefits of the members of the Managing Board consist especially of the provision of company cars, mobile phone and communication resources, the reimbursement of expenses, as well as insurance- and assignment-related benefits.
5. Pension promisesThe retirement agreements of the German members of the Managing Board contain the promise of an annual retirement pension, which is calculated as a percentage of the pensionable income. The percentage rate depends on the term of the Managing Board membership. After five years of Managing Board membership, the rate is at least 40% of the pensionable income and can increase to a maximum of 65% of the pensionable income. The percentage rate for the Chairman of the Managing Board is 4% of the pensionable income for each year of service or part thereof, but no more than 60%. The pensionable income is equivalent to a contractually agreed percentage
152 HeidelbergCement | Annual Report 2015
Corporate Governance3

of the fixed annual salary of the Managing Board member. When the Managing Board member’s agreement is terminated and he starts receiving the pension benefit, he receives a transitional allowance for six months, equal to the monthly instalments of the fixed annual salary.
The pension is paid monthly either:− after leaving the company upon reaching retirement age (pension benefit paid on individual
basis between the 62nd and 65th year of age), or − in the case of early termination of the agreement for reasons not attributable to the Managing
Board member, provided the member has reached 60 years of age at the time the agreement is terminated, or
− due to permanent invalidity as a result of illness.
The retirement agreements include a survivor pension benefit. If a member of the Managing Board dies during the term of his employment contract, or after effectuating the pension benefit, the member’s widow and dependent children receive a widow’s/orphan’s pension. The widow’s pension is 60% of the deceased’s pension benefit. The orphan’s pension is 10% of the deceased’s pension benefit as long as a widow’s pension is being paid at the same time. If a widow’s pension is not being paid at the same time, the orphan’s pension is 20% of the deceased’s pension benefit.
The retirement provision for Mr Daniel Gauthier is based on the retirement scheme of Cimenteries CBR S.A., a wholly owned subsidiary of HeidelbergCement AG, based in Brussels, Belgium. The pension promise is comparable to the retirement provision for the German members of the Manag-ing Board in terms of the amount, and also contains a survivor pension benefit.
Adjustment of remunerationThe Supervisory Board has the option of discretionary adjustment (administrative discretion) of the annual and the long-term bonus by ±25% of the target value of these variable remuneration elements in order to account for the personal performance of the individual members of the Managing Board and/or for exceptional circumstances.
In accordance with § 87, section 2 of the German Stock Company Act (AktG), the Supervisory Board’s right and obligation to reduce the Managing Board remuneration to a reasonable amount remains unaffected, if the position of the Group worsens after the fixing to such an extent that it would be unfair for the Group if remuneration of the Managing Board continued to be granted unchanged.
Individual investment (share ownership)To support the sustainable development of the Group, the Supervisory Board has decided upon a set of guidelines for the shareholdings of members of the Managing Board. Members of the Managing Board are obliged to invest part of their personal wealth to purchase a fixed number of HeidelbergCement shares and to hold these shares for the term of their membership on the Managing Board. The number of shares to be held by the Chairman of the Managing Board is set at 30,000 HeidelbergCement shares and at 10,000 HeidelbergCement shares for each of the other members of the Managing Board. In order to comply with the guidelines, half of the amount paid for the long-term bonus is to be used to buy shares of the company until the full individual investment is generated. The accumulation of the individual investment can therefore take several years. HeidelbergCement shares that are already held by Managing Board members are taken into account in the individual investment. The Supervisory Board has received confirmation that the individual investment has already been made or accumulated in accordance with the contract.
153HeidelbergCement | Annual Report 2015
Corporate Governance statement
Remuneration report
Supervisory Board and Managing Board
Cor
pora
te G
over
nanc
eC
onso
lidat
ed f
inan
cial
sta
tem
ents
Add
itio
nal i
nfor
mat
ion
3
4
5

D&O liability insuranceThe members of the Managing Board are covered in the Group’s existing D&O liability insurance. The agreed deductible corresponds to the minimum deductible pursuant to § 93, section 2, sentence 3 of the German Stock Company Act (AktG) in the respective version.
Guidelines in the case of new agreements and extensions to existing Managing Board agreementsThe following guidelines on the redundancy pay cap and change of control clause are applicable as of 1 January 2011 for new agreements or extensions to existing Managing Board agreements. With the entry into force of the contract extension of Dr. Scheifele as at 1 February 2015, the guidelines are part of all Managing Board agreements.
Redundancy pay capIn accordance with the German Corporate Governance Code, when concluding new Managing Board agreements or extending existing Managing Board agreements, it must be ensured that payments to a member of the Managing Board – in the event of the early termination of a Managing Board membership without serious cause – do not exceed the value of two annual remunerations (including fringe benefits) and do not amount to more than the remaining term of the agreement. The redundancy pay cap is calculated based on the amount of the total remuneration for the past financial year and, if necessary, also on the amount of the anticipated total remuneration for the current financial year.
Change of control clauseIn accordance with the German Corporate Governance Code, when concluding new Managing Board agreements or extending existing Managing Board agreements, it must be ensured – in the event of the early termination of a Managing Board membership – that benefits promised as a result of a change of control do not exceed 150% of the redundancy pay cap.
Amount of Managing Board remuneration in 2015
The disclosure of the remuneration of the Managing Board for the 2015 financial year is governed by two different bodies of rules and regulations: firstly, as previously, by the applicable German Accounting Standards (DRS 17), and secondly, by recommendations from the German Corporate Governance Code in the version of 5 May 2015.
Managing Board remuneration 2015 according to DRS 17
Amount of fixed and variable remunerationThe fixed remuneration of the Managing Board rose in comparison with the previous year to €5.3 million (previous year: 5.0). The sum of variable remuneration elements rose to €13.3 million (previous year: 12.6). It comprised a one-year bonus in 2015 and the payment of the management component of the long-term bonus plan 2013–2015/16. The remuneration of the Managing Board members for financial year 2015 according to DRS 17 is shown in the following table.
154 HeidelbergCement | Annual Report 2015
Corporate Governance3

Managing Board remuneration for the 2015 financial year (DRS 17)
€ ’000s rounded off (previous year in brackets)
Dr. Bernd Scheifele
Dr. Dominik von Achten
Daniel Gauthier
Andreas Kern
Dr. Lorenz Näger
Dr. Albert Scheuer
Total
Non-performance related compensation
Fixed annual salary 1,485 969 700 700 775 700 5,329(1,320) (900) (700) (700) (719) (700) (5,039)
Fringe benefits 145 67 92 29 144 60 537(253) (74) (136) (149) (251) (86) (948)
Performance related compensation
Annual bonus 3,153 1,478 1,064 961 1,164 978 8,798(2,534) (1,409) (1,085) (939) (1,085) (1,079) (8,130)
Deduction of fringe benefits -70 -84 -11 -70 -235 from the annual bonus (-163) (-125) (-111) (-163) (-561)
Total cash compensation 4,713 2,513 1,772 1,679 2,013 1,738 14,429including fringe benefits (3,945) (2,382) (1,796) (1,677) (1,892) (1,865) (13,556)
Compensation with long-term incentive
Management component 1,188 810 630 630 630 630 4,518 2013–2015/16 (2012–2014/15) (1,170) (798) (621) (621) (621) (621) (4,450)
Capital market component 1,412 765 549 549 608 549 4,433 2015–2017/18 (2014–2016/17) (1,025) (582) (453) (453) (492) (453) (3,458)
Total compensation 7,314 4,088 2,951 2,859 3,251 2,917 23,380(6,139) (3,762) (2,869) (2,750) (3,004) (2,939) (21,464)
Long-term bonus plan 2015–2017/18The members of the Managing Board are participating in the long-term bonus plan 2015-2017/18, granted in 2015. The target values for the plan are €2,250,000 for Dr. Bernd Scheifele, €1,219,000 for Dr. Dominik von Achten, €969,000 for Dr. Lorenz Näger, and €875,000 for each of the other members of the Managing Board. The plan comprises two equally weighted components: the management component and the capital market component. The target value of each component amounts to €1,125,000 for Dr. Bernd Scheifele, €609,000 for Dr. Dominik von Achten, €484,000 for Dr. Lorenz Näger, and €437,500 for Daniel Gauthier, Andreas Kern, and Dr. Albert Scheuer, respectively. The reference price for the capital market component amounts to €56.05. This equates to 20,071 perfor-mance share units (PSUs) for Dr. Bernd Scheifele, 10,872 PSUs for Dr. Dominik von Achten, 8,642 PSUs for Dr. Lorenz Näger, and 7,806 PSUs for each of the other members of the Managing Board. In accordance with § 314, section 1, no. 6a, sentence 4 of the German Commercial Code (HGB), the fair value at the grant date must be indicated for the capital market components. For Dr. Bernd Scheifele this amounts to €1,412,000, for Dr. Dominik von Achten to €765,000, for Dr. Lorenz Näger to €608,000, and for each of the other members of the Managing Board to €549,000. The fair value was determined in accordance with a recognised actuarial method (Monte Carlo simulation). The following table shows the long-term bonus plan 2015-2017/18.
Long-term bonus plan Target value2015–2017/18
Management component
Capital market component
€ ’000s rounded offTarget value Target value Number of
PSUsFair Value at
grant date
Dr. Bernd Scheifele 2,250 1,125 1,125 20,071 1,412
Dr. Dominik von Achten 1,219 609 609 10,872 765
Daniel Gauthier 875 438 438 7,806 549
Andreas Kern 875 438 438 7,806 549
Dr. Lorenz Näger 969 484 484 8,642 608
Dr. Albert Scheuer 875 438 438 7,806 549
Total 7,063 3,531 3,531 63,003 4,433
155HeidelbergCement | Annual Report 2015
Corporate Governance statement
Remuneration report
Supervisory Board and Managing Board
Cor
pora
te G
over
nanc
eC
onso
lidat
ed f
inan
cial
sta
tem
ents
Add
itio
nal i
nfor
mat
ion
3
4
5

Amount of fringe benefits (rounded to €’000s)The taxable fringe benefits amounted to €0.5 million (previous year: 0.9). For posts and offices held with Group companies, Dr. Bernd Scheifele received €70,000 (previous year: 163,000), Daniel Gauthier €84,000 (previous year: 125,000), Andreas Kern €11,000 (previous year: 111,000), and Dr. Lorenz Näger €70,000 (previous year: 163,000). These amounts are to be offset fully against total remuneration. Furthermore, Dr. Bernd Scheifele and Dr. Lorenz Näger receive compensation of €50,000 for expenses relating to their service on supervisory boards within the Heidelberg-Cement Group and Dr. Dominik von Achten for his service as Managing Board member in charge of the North America Group area. Fringe benefits also relate to taxation of monetary benefits, which amount to €25,000 (previous year: 40,000) for Dr. Bernd Scheifele, €17,000 (previous year: 24,000) for Dr. Dominik von Achten, €8,000 (previous year: 11,000) for Daniel Gauthier, €18,000 (previous year: 38,000) for Andreas Kern, €24,000 (previous year: 38,000) for Dr. Lorenz Näger, and €60,000 (previous year: 86,000) for Dr. Albert Scheuer.
Amount of total remuneration 2015 according to DRS 17When applying Accounting Standard DRS 17, the total remuneration of the Managing Board amounted to €23.4 million (previous year: 21.5) in 2015.
Pension promisesIn 2015, allocations to provisions for pensions (service cost) for members of the Managing Board amounted to €2.6 million (previous year: 1.9). The present values of the defined benefit obligation amounted to €37.5 million (previous year: 37.2). The figures are shown in the following table.
Pension promises Service cost Defined benefit obligation
€ ’000s (rounded off) 2014 2015 2014 2015
Dr. Bernd Scheifele 891 1,259 13,495 13,902
Dr. Dominik von Achten 237 375 2,998 3,064
Daniel Gauthier 141 156 5,122 5,250
Andreas Kern 142 181 6,195 5,888
Dr. Lorenz Näger 295 430 4,817 4,854
Dr. Albert Scheuer 148 188 4,601 4,497
Total 1,853 2,589 37,228 37,454
Payments to former members of the Managing Board and their surviving dependants amounted to €3.2 million (previous year: 3.0) in 2015. Provisions for pension obligations to former members of the Managing Board amounted to €26.2 million (previous year: 28.0).
Loans to members of the Managing BoardIn 2015, no loans were granted to members of the Managing Board of HeidelbergCement AG.
156 HeidelbergCement | Annual Report 2015
Corporate Governance3

Managing Board remuneration 2015 according to the German Corporate Governance Code
Pursuant to the recommendations of the German Corporate Governance Code (GCGC) dated 5 May 2015, both the granted benefits and the allocations in form of the proposed reference tables are disclosed for the reporting year 2015.
Granted benefitsWhen compared with DRS 17, the granted benefits presented in the table on pages 158/159 depict the target value of the annual bonus as well as the target value of the management component and the fair value of the capital market component for the long-term bonus plan 2015–2017/18, as shown on page 155. In addition, the minimum and maximum values that can be achieved are also stated. Furthermore, the pension expenses are taken into account in the total remuneration as shown in the table on page 156 in the form of service cost.
The total Managing Board remuneration granted according to the German Corporate Governance Code amounted to €20.7 million (previous year: 18.4) for the 2015 financial year. AllocationsFor the members of the Managing Board, the allocations to be disclosed for the 2015 financial year are shown in the table on pages 158/159.
The table shows the allocations for the 2015 financial year regarding the fixed annual salary, fringe benefits, and the one-year variable compensation. Pursuant to the new version of the German Corporate Governance Code dated 5 May 2015, allocations for multi-year variable compensation, where the plan term ended in the 2015 financial year, are disclosed. The allocations from the capital market component of the long-term bonus plan 2012–2014/15 and the management component of the long-term bonus plan 2013–2015/16 are therefore disclosed.
The accrued total remuneration of the Managing Board according to the German Corporate Governance Code amounted to €31.2 million (previous year: 17.1) for the 2015 financial year.
The allocations from the components of the long-term bonus plans rose significantly in 2015 compared with the previous year. The key reasons for this are, on the one hand, the clear improvement in earnings before interest and taxes (EBIT) and return on invested capital (ROIC), which led to a target achievement of 200% for the management component. On the other hand, the greatly improved performance of the HeidelbergCement share in comparison with the reference indices DAX and MSCI World Construction Materials Index resulted in a target achievement of 180% for the capital market component. Furthermore, the sharp rise in the price of the HeidelbergCement share, which more than doubled in the performance period from €30.45 to €72.58, contributed to a further increase in the payment amount. This totals 429% of the target value.
The target achievement for the management component of the long-term bonus plan 2013–2015/16 and the capital market component of the long-term bonus plan 2012–2014/15 is shown in the diagram on page 160.
157HeidelbergCement | Annual Report 2015
Corporate Governance statement
Remuneration report
Supervisory Board and Managing Board
Cor
pora
te G
over
nanc
eC
onso
lidat
ed f
inan
cial
sta
tem
ents
Add
itio
nal i
nfor
mat
ion
3
4
5

Granted benefits according to GCGC 1)
Dr. Bernd ScheifeleChairman of the Managing Board
Dr. Dominik von AchtenDeputy Chairman of the
Managing Board
Daniel GauthierMember of the
Managing Board
Andreas KernMember of the
Managing Board
Dr. Lorenz NägerMember of the
Managing Board
Dr. Albert ScheuerMember of the
Managing Board
Total
€ ‘000s (rounded off) 2014 2015Min. 2015
Max. 2015 2014 2015
Min. 2015
Max. 2015 2014 2015
Min. 2015
Max. 2015 2014 2015
Min. 2015
Max. 2015 2014 2015
Min. 2015
Max. 2015 2014 2015
Min. 2015
Max. 2015 2014 2015
Min. 2015
Max. 2015
Non-performance related compensation
Fixed annual salary 1,320 1,485 1,485 1,485 900 969 969 969 700 700 700 700 700 700 700 700 719 775 775 775 700 700 700 700 5,039 5,329 5,329 5,329
Fringe benefits 253 145 145 145 74 67 67 67 136 92 92 92 149 29 29 29 251 144 144 144 86 60 60 60 948 537 537 537
Total 1,573 1,630 1,630 1,630 974 1,036 1,036 1,036 836 792 792 792 849 729 729 729 970 919 919 919 786 760 760 760 5,987 5,866 5,866 5,866
Performance related compensation
Annual bonus 2) 1,320 1,485 0 3,341 720 775 0 1,744 560 560 0 1,260 560 560 0 1,260 575 620 0 1,395 560 560 0 1,260 4,295 4,560 0 10,260
Deduction of fringe benefits from the annual bonus -163 -70 0 -70 0 0 0 0 -125 -84 0 -84 -111 -11 0 -11 -163 -70 0 -70 0 0 0 0 -561 -235 0 -235
Total one-year variable compensation 3) 1,157 1,415 0 3,271 720 775 0 1,744 435 476 0 1,176 449 549 0 1,249 412 550 0 1,325 560 560 0 1,260 3,734 4,325 0 10,025
Long-term bonus plan 2014-2016/17
Management component 990 563 438 438 473 438 3,338
Capital market component 1,025 582 453 453 492 453 3,458
Long-term bonus plan 2015-2017/18
Management component 2) 1,125 0 5,063 609 0 2,742 438 0 1,969 438 0 1,969 484 0 2,180 438 0 1,969 3,531 0 15,891
Capital market component 2) 1,412 765 549 549 608 549 4,433
Total multi-year variable compensation 2,015 2,537 0 5,063 1,145 1,374 0 2,742 890 987 0 1,969 890 987 0 1,969 965 1,092 0 2,180 890 987 0 1,969 6,795 7,965 0 15,891
Total 4) 4,745 5,582 1,630 8,825 2,838 3,185 1,036 5,522 2,161 2,255 792 3,937 2,188 2,265 729 3,947 2,347 2,561 919 4,424 2,237 2,307 760 3,989 16,516 18,155 5,866 30,643
Service cost 891 1,259 1,259 1,259 237 375 375 375 141 156 156 156 142 181 181 181 295 430 430 430 148 188 188 188 1,853 2,589 2,589 2,589
Total compensation 4) 5,636 6,841 2,889 10,084 3,075 3,560 1,411 5,897 2,302 2,410 948 4,092 2,330 2,446 910 4,128 2,642 2,991 1,349 4,854 2,385 2,495 948 4,177 18,369 20,744 8,454 33,231
Allocations according to GCGC 1) Dr. Bernd ScheifeleChairman of the Managing Board
Dr. Dominik von AchtenDeputy Chairman of the
Managing Board
Daniel GauthierMember of the
Managing Board
Andreas KernMember of the
Managing Board
Dr. Lorenz NägerMember of the
Managing Board
Dr. Albert ScheuerMember of the
Managing Board
Total
€ ‘000s (rounded off) 2014 2015 2014 2015 2014 2015 2014 2015 2014 2015 2014 2015 2014 2015
Non-performance related compensation
Fixed annual salary 1,320 1,485 900 969 700 700 700 700 719 775 700 700 5,039 5,329
Fringe benefits 253 145 74 67 136 92 149 29 251 144 86 60 948 537
Total 1,573 1,630 974 1,036 836 792 849 729 970 919 786 760 5,987 5,866
Performance related compensation
Annual bonus 2,534 3,153 1,409 1,478 1,085 1,064 939 961 1,085 1,164 1,079 978 8,130 8,798
Deduction of fringe benefits from the annual bonus -163 -70 0 0 -125 -84 -111 -11 -163 -70 0 0 -561 -235
Total one-year variable compensation 3) 2,372 3,083 1,409 1,478 960 980 828 950 922 1,094 1,079 978 7,569 8,563
Long-term bonus plan 2011-2013/14
Capital market component 433 230 230 230 230 230 1,580
Disbursement mechanism with a bonus-malus system for long-term bonus plan 5) -1,188 -630 -630 -630 -630 -630 -4,338
Long-term bonus plan 2012-2014/15
Management component 1,170 798 621 621 621 621 4,450
Capital market component 2,549 1,738 1,352 1,352 1,352 1,352 9,692
Long-term bonus plan 2013-2015/16
Management component 1,188 810 630 630 630 630 4,518
Total multi-year variable compensation 415 3,737 397 2,548 220 1,982 220 1,982 220 1,982 220 1,982 1,693 14,210
Total 4,360 8,450 2,780 5,061 2,016 3,754 1,897 3,661 2,112 3,994 2,085 3,720 15,249 28,639
Service cost 891 1,259 237 375 141 156 142 181 295 430 148 188 1,853 2,589
Total compensation 5,251 9,708 3,016 5,436 2,156 3,909 2,039 3,842 2,407 4,424 2,233 3,908 17,102 31,227
1) German Corporate Governance Code dated 5 May 2015
2) The maximum amount includes the Supervisory Board’s option of discretionary adjustment of the payout by +25% of the target value.
3) One-year variable compensation including the Supervisory Board’s discretionary adjustment and the deduction of fringe benefits
4) Dr. Bernd Scheifele: contractually agreed maximum remuneration
5) Recognition of advanced payments during the implementation phase (see page 152)
158 HeidelbergCement | Annual Report 2015
Corporate Governance3

Granted benefits according to GCGC 1)
Dr. Bernd ScheifeleChairman of the Managing Board
Dr. Dominik von AchtenDeputy Chairman of the
Managing Board
Daniel GauthierMember of the
Managing Board
Andreas KernMember of the
Managing Board
Dr. Lorenz NägerMember of the
Managing Board
Dr. Albert ScheuerMember of the
Managing Board
Total
€ ‘000s (rounded off) 2014 2015Min. 2015
Max. 2015 2014 2015
Min. 2015
Max. 2015 2014 2015
Min. 2015
Max. 2015 2014 2015
Min. 2015
Max. 2015 2014 2015
Min. 2015
Max. 2015 2014 2015
Min. 2015
Max. 2015 2014 2015
Min. 2015
Max. 2015
Non-performance related compensation
Fixed annual salary 1,320 1,485 1,485 1,485 900 969 969 969 700 700 700 700 700 700 700 700 719 775 775 775 700 700 700 700 5,039 5,329 5,329 5,329
Fringe benefits 253 145 145 145 74 67 67 67 136 92 92 92 149 29 29 29 251 144 144 144 86 60 60 60 948 537 537 537
Total 1,573 1,630 1,630 1,630 974 1,036 1,036 1,036 836 792 792 792 849 729 729 729 970 919 919 919 786 760 760 760 5,987 5,866 5,866 5,866
Performance related compensation
Annual bonus 2) 1,320 1,485 0 3,341 720 775 0 1,744 560 560 0 1,260 560 560 0 1,260 575 620 0 1,395 560 560 0 1,260 4,295 4,560 0 10,260
Deduction of fringe benefits from the annual bonus -163 -70 0 -70 0 0 0 0 -125 -84 0 -84 -111 -11 0 -11 -163 -70 0 -70 0 0 0 0 -561 -235 0 -235
Total one-year variable compensation 3) 1,157 1,415 0 3,271 720 775 0 1,744 435 476 0 1,176 449 549 0 1,249 412 550 0 1,325 560 560 0 1,260 3,734 4,325 0 10,025
Long-term bonus plan 2014-2016/17
Management component 990 563 438 438 473 438 3,338
Capital market component 1,025 582 453 453 492 453 3,458
Long-term bonus plan 2015-2017/18
Management component 2) 1,125 0 5,063 609 0 2,742 438 0 1,969 438 0 1,969 484 0 2,180 438 0 1,969 3,531 0 15,891
Capital market component 2) 1,412 765 549 549 608 549 4,433
Total multi-year variable compensation 2,015 2,537 0 5,063 1,145 1,374 0 2,742 890 987 0 1,969 890 987 0 1,969 965 1,092 0 2,180 890 987 0 1,969 6,795 7,965 0 15,891
Total 4) 4,745 5,582 1,630 8,825 2,838 3,185 1,036 5,522 2,161 2,255 792 3,937 2,188 2,265 729 3,947 2,347 2,561 919 4,424 2,237 2,307 760 3,989 16,516 18,155 5,866 30,643
Service cost 891 1,259 1,259 1,259 237 375 375 375 141 156 156 156 142 181 181 181 295 430 430 430 148 188 188 188 1,853 2,589 2,589 2,589
Total compensation 4) 5,636 6,841 2,889 10,084 3,075 3,560 1,411 5,897 2,302 2,410 948 4,092 2,330 2,446 910 4,128 2,642 2,991 1,349 4,854 2,385 2,495 948 4,177 18,369 20,744 8,454 33,231
Allocations according to GCGC 1) Dr. Bernd ScheifeleChairman of the Managing Board
Dr. Dominik von AchtenDeputy Chairman of the
Managing Board
Daniel GauthierMember of the
Managing Board
Andreas KernMember of the
Managing Board
Dr. Lorenz NägerMember of the
Managing Board
Dr. Albert ScheuerMember of the
Managing Board
Total
€ ‘000s (rounded off) 2014 2015 2014 2015 2014 2015 2014 2015 2014 2015 2014 2015 2014 2015
Non-performance related compensation
Fixed annual salary 1,320 1,485 900 969 700 700 700 700 719 775 700 700 5,039 5,329
Fringe benefits 253 145 74 67 136 92 149 29 251 144 86 60 948 537
Total 1,573 1,630 974 1,036 836 792 849 729 970 919 786 760 5,987 5,866
Performance related compensation
Annual bonus 2,534 3,153 1,409 1,478 1,085 1,064 939 961 1,085 1,164 1,079 978 8,130 8,798
Deduction of fringe benefits from the annual bonus -163 -70 0 0 -125 -84 -111 -11 -163 -70 0 0 -561 -235
Total one-year variable compensation 3) 2,372 3,083 1,409 1,478 960 980 828 950 922 1,094 1,079 978 7,569 8,563
Long-term bonus plan 2011-2013/14
Capital market component 433 230 230 230 230 230 1,580
Disbursement mechanism with a bonus-malus system for long-term bonus plan 5) -1,188 -630 -630 -630 -630 -630 -4,338
Long-term bonus plan 2012-2014/15
Management component 1,170 798 621 621 621 621 4,450
Capital market component 2,549 1,738 1,352 1,352 1,352 1,352 9,692
Long-term bonus plan 2013-2015/16
Management component 1,188 810 630 630 630 630 4,518
Total multi-year variable compensation 415 3,737 397 2,548 220 1,982 220 1,982 220 1,982 220 1,982 1,693 14,210
Total 4,360 8,450 2,780 5,061 2,016 3,754 1,897 3,661 2,112 3,994 2,085 3,720 15,249 28,639
Service cost 891 1,259 237 375 141 156 142 181 295 430 148 188 1,853 2,589
Total compensation 5,251 9,708 3,016 5,436 2,156 3,909 2,039 3,842 2,407 4,424 2,233 3,908 17,102 31,227
1) German Corporate Governance Code dated 5 May 2015
2) The maximum amount includes the Supervisory Board’s option of discretionary adjustment of the payout by +25% of the target value.
3) One-year variable compensation including the Supervisory Board’s discretionary adjustment and the deduction of fringe benefits
4) Dr. Bernd Scheifele: contractually agreed maximum remuneration
5) Recognition of advanced payments during the implementation phase (see page 152)
159HeidelbergCement | Annual Report 2015
Corporate Governance statement
Remuneration report
Supervisory Board and Managing Board
Cor
pora
te G
over
nanc
eC
onso
lidat
ed f
inan
cial
sta
tem
ents
Add
itio
nal i
nfor
mat
ion
3
4
5

Management component (Long-term bonus plan 2013–2015/16)
Earnings before interest and taxes (EBIT) in €m Return on Invested Capital (ROIC) in %
1) Values adjusted for the sale of the building products business in North America and the United Kingdom
Capital market component (Long-term bonus plan 2012–2014/15)
Development of benchmark indices and Total Shareholder Return (TSR) of HeidelbergCement share 2012-2015 in %
Development of HeidelbergCement share price 2012-2015 in €
1) Benchmark indices: DAX and MSCI World Construction Materials Index.
2) Reference price is the average of the daily closing prices from 1 October to 31 December 2011.
3) Reference price is the average of the daily closing prices from 1 October to 31 December 2015 amounting to €69.91, adjusted for reinvested dividend payments and changes in the capital in the amount of €2.69.
EBIT 2012 Average of EBITs in performance period 1)
ROIC 2012 ROIC 2015 1)
1,539 5.8%
1,820
281
7.5%
+1.7 percentage points
200% target achievement
Average development of benchmark indices 1)
Total Shareholder Return (TSR) of HeidelbergCement
share
Reference price at the start of the
performance period 2)
Reference price at the end of the
performance period 3)
43.2%
30.45
63.6%
+20.3 percentage points
72.58
138%
429% target achievement
160 HeidelbergCement | Annual Report 2015
Corporate Governance3

Remuneration of the Supervisory Board in 2015
Supervisory Board remuneration was reestablished by the 2015 Annual General Meeting and is set out in § 12 of the Articles of Association of HeidelbergCement AG, which are published on our website www.heidelbergcement.com under “Company/Corporate Governance/Articles of Associ-ation”. The remuneration consists of fixed amounts and attendance fees. Each member receives a fixed amount of €70,000, with the Chairman receiving two-and-a-half times this amount and the Deputy Chairman one-and-a-half times. The members of the Audit Committee additionally receive fixed remuneration of €25,000 and the members of the Personnel Committee €20,000. The Chairmen of the committees receive twice these respective amounts.
In addition, an attendance fee of €2,000 is paid for each meeting of the Supervisory Board and its committees that is personally attended. Should several such meetings be held on the same or on consecutive days, the attendance fee will be paid only once.
Total Supervisory Board remuneration (excluding value added tax) in the 2015 financial year amounted to €1,471,000 (previous year: 926,477).
The employee representatives on the Supervisory Board remit a significant portion of their Super-visory Board compensation to the recuperation facility for the employees at HeidelbergCement AG and – with the exception of the representative of the senior managers – to the trade union-linked Hans Böckler Foundation.
The Supervisory Board remuneration in the 2015 financial year is divided as shown in the following table.
The Supervisory Board remuneration paid for the 2015 financial year
€ Fixed remuneration
Remuneration for committee
membership
Attendance fees
Total
Fritz-Jürgen Heckmann (Chairman) 175,000 45,000 16,000 236,000
Heinz Schmitt (Deputy Chairman) 105,000 45,000 16,000 166,000
Josef Heumann 70,000 20,000 16,000 106,000
Gabriele Kailing 1) 70,000 12,000 82,000
Hans Georg Kraut 70,000 20,000 16,000 106,000
Ludwig Merckle 70,000 90,000 16,000 176,000
Tobias Merckle 1) 70,000 10,000 80,000
Alan Murray 70,000 20,000 12,000 102,000
Dr. Jürgen M. Schneider 70,000 25,000 16,000 111,000
Werner Schraeder 70,000 25,000 16,000 111,000
Frank-Dirk Steininger 70,000 25,000 16,000 111,000
Prof. Dr. Marion Weissenberger-Eibl 1) 70,000 14,000 84,000
Total 980,000 315,000 176,000 1,471,000
1) No member of committees
161HeidelbergCement | Annual Report 2015
Corporate Governance statement
Remuneration report
Supervisory Board and Managing Board
Cor
pora
te G
over
nanc
eC
onso
lidat
ed f
inan
cial
sta
tem
ents
Add
itio
nal i
nfor
mat
ion
3
4
5

Supervisory Board and Managing Board
Supervisory Board
According to the Articles of Association, the Supervisory Board of HeidelbergCement AG consists of twelve members. Half of the members shall be elected by the Annual General Meeting accord-ing to the provisions of the German Stock Company Act and half by the employees according to the provisions of the German Codetermination Law. The term of office for the Supervisory Board started with the conclusion of the Annual General Meeting of 7 May 2014 and ends according to schedule with the conclusion of the ordinary Annual General Meeting in 2019.
Fritz-Jürgen HeckmannChairman of the Supervisory BoardStuttgart; Business LawyerMember since 8 May 2003, Chairman since 1 February 2005; Chairman of the Arbitration and Nomination Committee and member of the Personnel and Audit Committee
External mandates: HERMA Holding GmbH + Co. KG 2), Filderstadt (Chairman) | Neue Presse gesellschaft mbH & Co. KG 2), Ulm | Paul Hartmann AG 1), Heidenheim (Chairman) | Süddeutscher Verlag GmbH 2), Mu-nich | Südwestdeutsche Medien Holding GmbH 2), Stuttgart | Wieland-Werke AG 1), Ulm (Chairman)
Heinz Schmitt Deputy ChairmanHeidelberg; Controller; Chairman of the Council of Employees at the headquarters of Heidelberg-Cement AG and Chairman of the Group Council of EmployeesMember since 6 May 2004, Deputy Chairman since 7 May 2009; Member of the Audit, Arbitration, and Personnel Committee
Josef HeumannBurglengenfeld; Kiln Supervisor; Chairman of the Council of Employees at the Burglengenfeld plant, HeidelbergCement AG Member since 6 May 2004; Member of the Personnel Committee
Gabriele KailingFrankfurt; Chairwoman of DGB District of Hesse-Thuringia Member since 7 May 2014
Hans Georg Kraut Schelklingen; Director of the Schelklingen plant of HeidelbergCement AG and Managing Director of Urzeit Weide GbR Member since 6 May 2004; Member of the Personnel and Arbitration Committee
162 HeidelbergCement | Annual Report 2015
Corporate Governance3

Ludwig Merckle Ulm; Managing Director of Merckle Service GmbHMember since 2 June 1999; Chairman of the Personnel and Audit Committee and member of the Nomination Committee
External mandates: Kässbohrer Geländefahrzeug AG 1), Laupheim (Chairman) | PHOENIX Pharmahandel GmbH & Co KG 2), Mannheim
Tobias MerckleLeonberg; Managing Director of the association Seehaus e.V.Member since 23 May 2006; Member of the Nomination and Arbitration Committee
Alan MurrayNaples, Florida / USA; former member of the Managing Board of HeidelbergCement AGMember since 21 January 2010; Member of the Personnel Committee
External mandates: Hanson Pension Trustees Limited, trustee of the Hanson No 2 Pension Scheme 2), UK | Owens- Illinois, Inc.2), USA | Wolseley plc 2), Jersey, Channel Islands
Dr. Jürgen M. SchneiderMannheim; former Chief Financial Officer of Bilfinger Berger AG and since 2010 Dean of the Business School of the University of MannheimMember since 7 May 2014; Member of the Audit Committee
External mandates: DACHSER Group SE & Co. KG2), Kempten (Chairman) | DACHSER SE2), Kempten (Chairman) | Heberger GmbH 2), Schifferstadt (Chairman)
Werner SchraederEnnigerloh; Building Fitter; Chairman of the General Council of Employees of HeidelbergCement AG and Chairman of the Council of Employees at the Ennigerloh plant of HeidelbergCement AGMember since 7 May 2009; Member of the Audit Committee
External mandates: Berufsgenossenschaft Rohstoffe und chemische Industrie 2), Heidelberg
Frank-Dirk SteiningerFrankfurt; Specialist in Employment Law for the Federal Executive Committee of IG Bauen-Agrar-UmweltMember since 11 June 2008; Member of the Audit Committee
163HeidelbergCement | Annual Report 2015
Corporate Governance statement
Remuneration report
Supervisory Board and Managing Board
Cor
pora
te G
over
nanc
eC
onso
lidat
ed f
inan
cial
sta
tem
ents
Add
itio
nal i
nfor
mat
ion
3
4
5

Univ.-Prof. Dr. Marion Weissenberger-Eibl Karlsruhe; Head of the Fraunhofer Institute for Systems and Innovation Research ISI in Karlsruhe and holder of the Chair of Innovation and TechnologyManagement (iTM) at the Karlsruhe Institute of Technology (KIT) Member since 3 July 2012
External mandates: MTU Aero Engines AG 1), Munich | Steinbeis-Stiftung für Wirtschaftsförderung (StW) 2), Stuttgart (deputy member)
The above mentioned indications refer to 31 December 2015 and have the following meaning:1) Membership in other legally required supervisory boards of German companies; 2) Membership in comparable German and foreign supervisory committees of commercial enterprises.
Supervisory Board Committees
Personnel CommitteeLudwig Merckle (Chairman), Fritz-Jürgen Heckmann, Josef Heumann, Hans Georg Kraut, Alan Murray, Heinz Schmitt
Audit CommitteeLudwig Merckle (Chairman), Fritz-Jürgen Heckmann, Heinz Schmitt, Dr. Jürgen M. Schneider, Werner Schraeder, Frank-Dirk Steininger
Nomination CommitteeFritz-Jürgen Heckmann (Chairman), Ludwig Merckle, Tobias Merckle
Arbitration Committee, according to § 27, section 3 of the German Code termination LawFritz-Jürgen Heckmann (Chairman), Hans Georg Kraut, Tobias Merckle, Heinz Schmitt
164 HeidelbergCement | Annual Report 2015
Corporate Governance3

Managing Board
In the reporting year, there were six members on the Managing Board of HeidelbergCement AG: the Chairman of the Managing Board, the Chief Financial Officer, and four members of the Managing Board with regional responsibilities. The Managing Board organisation is characterised by dual manage ment responsibility: The operating units in the Group areas fall under the line responsibility of individual members of the Managing Board. In addition, they have cross-area responsibility for specific corporate functions with great strategic importance for the Group. In February 2015, the structure of the Managing Board was amended with the position of a Deputy Chairman.
Dr. Bernd Scheifele Chairman of the Managing BoardArea of responsibility: Strategy and Development, Communication & Investor Relations, Human Resources, Legal, Compliance, Internal AuditChairman of the Managing Board since 2005; appointed until January 2020
External mandates: PHOENIX Pharmahandel GmbH & Co KG 2), Mannheim (Chairman) | Verlagsgruppe Georg von Holtzbrinck GmbH 1), Stuttgart (Deputy Chairman)
Group mandates: Castle Cement Limited 2), UK | ENCI Holding N.V. 2), Netherlands | Hanson Limited 2), UK | Hanson Pioneer España, S.L.U. 2), Spain | HeidelbergCement Holding S.à.r.l. 2), Luxembourg | Heidelberg-Cement India Limited 2), India | HeidelbergCement Netherlands Holding B.V. 2), Netherlands | PT Indocement Tunggal Prakarsa Tbk. 2), Indonesia | RECEM S.A. 2), Luxembourg
Dr. Dominik von AchtenDeputy Chairman of the Managing Board since 1 February 2015Area of responsibility: North America, Purchasing, worldwide coordination of Competence Center MaterialsMember of the Managing Board since 2007; appointed until September 2017
External mandates: Kunststoffwerk Philippine GmbH & Co. KG2), Lahnstein, and Saarpor Klaus Eckhardt GmbH Neun-kirchen Kunststoffe KG2), Neunkirchen3) | Verlag Lensing-Wolff GmbH & Co. KG ( “ Medienhaus Lensing”) 2), Dortmund
Group mandates: HeidelbergCement Canada Holding Limited 2), UK | HeidelbergCement UK Holding II Limited 2), UK | Lehigh Hanson, Inc. 2), USA | Lehigh Hanson Materials Limited 2), Canada (Chairman)
3) Jointly meeting advisory council of Unternehmensgruppe Philippine Saarpor (Philippine Saarpor group)
165HeidelbergCement | Annual Report 2015
Corporate Governance statement
Remuneration report
Supervisory Board and Managing Board
Cor
pora
te G
over
nanc
eC
onso
lidat
ed f
inan
cial
sta
tem
ents
Add
itio
nal i
nfor
mat
ion
3
4
5

Daniel GauthierArea of responsibility: Western and Northern Europe (without Germany), Africa-Mediterranean Basin, Group Services, Environmental SustainabilityMember of the Managing Board since 2000; appointed until June 2016
External mandates: SAS ADIAL 2), France | Akçansa Çimento Sanayi ve Ticaret A.S. 2), Turkey (Deputy Chairman) | Carmeuse Holding SA 2), Belgium | SAS Genlis Metal 2), France | Laserco DT S.A. 2), Belgium | Miema SA 2), Belgium (Chairman)
Group mandates: Castle Cement Limited 2), UK | CBR Asset Management S.A. 2), Luxembourg (Chairman) | CBR Finance S.A. 2), Luxembourg (Chairman) | CBR International Services S.A. 2), Belgium (Chairman) | Cementrum I B.V. 2), Netherlands | Cementrum II B.V. 2), Netherlands | Cimenteries CBR S.A. 2), Belgium (Chairman) | Ciments du Togo SA 2), Togo (Chairman) | Civil and Marine Limited 2), UK | ENCI Holding N.V. 2), Netherlands (Chairman) | Ghacem Ltd. 2), Ghana (Chairman) | Hanson Packed Products Limited 2), UK | Hanson Pioneer España, S.L.U. 2), Spain | Hanson Quarry Products Europe Limited 2), UK | HC Green Trading Limited 2), Malta | HC Trading FZE2), United Arab Emirates | HC Trading International Inc.2), Bahamas (Chairman) | HC Trading B.V. 2), Netherlands (Chairman) | HC Trading Malta Ltd 2), Malta | HCT Holding Malta Limited 2), Malta | HeidelbergCement Asia Pte Ltd 2), Singapore | HeidelbergCement Holding S.à.r.l. 2), Luxembourg | HeidelbergCement Hold-ing HK Limited2), Hong Kong | HeidelbergCement Northern Europe AB 2), Sweden (Chairman) | HeidelbergCement UK Holding Limited 2), UK | Interlacs S.A.R.L. 2), Democratic Republic of the Congo | La Cimenterie de Lukala S.A.R.L. 2), Democratic Republic of the Congo | Lehigh B.V. 2), Netherlands (Deputy Chairman) | PT Indocement Tunggal Prakarsa Tbk. 2), Indonesia | RECEM S.A. 2), Luxembourg | Scancem International DA2), Norway (Chairman) | Tadir Readymix Concrete (1965) Ltd 2), Israel | TPCC Tanzania Portland Cement Company Ltd. 2), Tanzania
Andreas KernArea of responsibility: Eastern Europe-Central Asia, Germany, Sales and Marketing, worldwide coordination of secondary cementitious materialsMember of the Managing Board since 2000; appointed until June 2016
External mandates: Basalt-Actien-Gesellschaft 1), Linz am Rhein | Kronimus AG 1), Iffezheim (Deputy Chairman)
Group mandates: CaucasusCement Holding B.V. 2), Netherlands (Chairman) | Ceskomoravský cement, a.s.2), Czech Republic (Chairman) | Duna-Dráva Cement Kft. 2), Hungary (Chairman) | ENCI Holding N.V. 2), Nether lands | Górazdze Cement S.A. 2), Poland (Chairman) | Hanson Pioneer España, S.L.U. 2), Spain | HeidelbergCement Central Europe East Holding B.V. 2), Netherlands (Chairman) | HeidelbergCement Netherlands Holding B.V. 2), Netherlands | HeidelbergCement Romania S.A. 2), Romania | Heidelberg-Cement Ukraine Public Joint Stock Company2), Ukraine | Joint Stock Company - Bukhtarminskaya Cement Company 2), Kazakhstan (Chairman) | Limited Liability Company HeidelbergCement Georgia2), Georgia (Deputy Chairman) | Limited Liability Company Kartuli Cementi 2), Georgia | NCD Nederlandse Cement Deelnemingsmaatschappij B.V. 2), Netherlands | Open Joint-Stock Com-pany “Slantsy Cement Plant “Cesla” 2), Russia | RECEM S.A. 2), Luxembourg | Tvornica Cementa Kakanj d.d. 2), Bosnia-Herzegovina
166 HeidelbergCement | Annual Report 2015
Corporate Governance3

Dr. Lorenz NägerArea of responsibility: Finance, Group Accounting, Controlling, Taxes, Insurance & Corporate Risk Management, IT, Shared Service Center, LogisticsMember of the Managing Board since 2004; appointed until September 2019
External mandates: MVV Energie AG 1), Mannheim | PHOENIX Pharmahandel GmbH & Co KG 2), Mannheim
Group mandates: Castle Cement Limited 2), UK | Cimenteries CBR S.A. 2), Belgium | ENCI Holding N.V. 2), Netherlands | Hanson Limited 2), UK | Hanson Pioneer España, S.L.U. 2), Spain | Heidel berg-Cement Canada Holding Limited 2), UK | HeidelbergCement Holding S.à.r.l. 2), Luxembourg | HeidelbergCement India Limited 2), India | HeidelbergCement Netherlands Holding B.V. 2), Nether-lands | HeidelbergCement UK Holding Limited 2), UK | HeidelbergCement UK Holding II Limited 2), UK | Lehigh B.V. 2), Netherlands (Chairman) | Lehigh Hanson, Inc. 2), USA | Lehigh Hanson Materials Limited 2), Canada | Lehigh UK Limited 2), UK | Palatina Insurance Ltd. 2), Malta | PT Indocement Tunggal Prakarsa Tbk. 2), Indonesia | RECEM S.A. 2), Luxembourg
Dr. Albert ScheuerArea of responsibility: Asia-Pacific, worldwide coordination of Heidelberg Technology CenterMember of the Managing Board since 2007; appointed until August 2017
External mandates: Cement Australia Holdings Pty Ltd 2), Australia | Cement Australia Pty Limited 2), Australia | Cement Australia Partnership2), Australia | China Century Cement Ltd. 2), Bermuda | Easy Point Industrial Ltd. 2), Hong Kong | Guangzhou Heidel berg Yuexiu Enterprise Management Consulting Company Ltd. 2), China | Jidong Heidelberg (Fufeng) Cement Company Limited 2), China | Jidong Heidelberg (Jingyang) Cement Company Limited 2), China | Squareal Cement Ltd 2), Hong Kong
Group mandates: Butra HeidelbergCement Sdn. Bhd. 2), Brunei (Chairman) | COCHIN Cements Ltd. 2), India | Hanson Building Materials (S) Pte Ltd 2), Singapore | Hanson Invest ment Holdings Pte Ltd 2), Singapore | Hanson Pacific (S) Pte Limited 2), Singapore | HeidelbergCement Asia Pte Ltd 2), Singapore (Chairman) | HeidelbergCement Bangladesh Limited 2), Bangladesh (Chairman) | HeidelbergCement Holding HK Limited 2), Hong Kong | HeidelbergCement India Limited 2), India | HeidelbergCement Myanmar Company Limited 2), Myanmar | PT Indo cement Tunggal Prakarsa Tbk. 2), Indonesia (Chairman)
The above mentioned indications refer to 31 December 2015 and have the following meaning: 1) Membership in legally required supervisory boards of German companies;2) Membership in comparable German and foreign supervisory committees of commercial enterprises.
167HeidelbergCement | Annual Report 2015
Supervisory Board and Managing BoardCorporate Governance statement
Remuneration report
Cor
pora
te G
over
nanc
eC
onso
lidat
ed f
inan
cial
sta
tem
ents
Add
itio
nal i
nfor
mat
ion
3
4
5

Consolidated financial statements
4
168 HeidelbergCement | Annual Report 2015

171 Consolidated income statement 172 Consolidated statement of comprehensive income 173 Consolidated statement of cash flows 174 Consolidated balance sheet 176 Consolidated statement of changes in equity 178 Segment reporting / Notes to the 2015 consolidated
financial statements 180 Notes to the 2015 consolidated financial statements 180 General information 180 Accounting and valuation principles 190 Application of new accounting standards 193 Estimation uncertainty and assumptions 194 Scope of consolidation 199 Notes to the segment reporting 201 Notes to the income statement 213 Notes to the statement of cash flows 217 Notes to the balance sheet – Assets 224 Notes to the balance sheet – Equity and liabilities 241 Additional disclosures on financial instruments 250 Other disclosures 255 List of shareholdings 280 Audit opinion 281 Responsibility statement
169HeidelbergCement | Annual Report 2015
Con
solid
ated
fin
anci
al s
tate
men
tsA
ddit
iona
l inf
orm
atio
n
4
5

170 HeidelbergCement | Annual Report 2015
Consolidated financial statements4

Consolidated income statement
€m Notes 2014 2015
Revenue 1 12,614.3 13,464.7
Change in finished goods and work in progress 17.1 23.2
Own work capitalised 10.2 8.8
Operating revenue 12,641.7 13,496.7
Other operating income 2 292.5 355.3
Material costs 3 -5,319.7 -5,477.1
Employee and personnel costs 4 -2,049.9 -2,274.2
Other operating expenses 5 -3,447.1 -3,689.2
Result from joint ventures 6 170.6 201.2
Operating income before depreciation (OIBD) 2,288.0 2,612.7
Depreciation and amortisation 7 -692.9 -766.6
Operating income 1,595.1 1,846.1
Additional ordinary income 8 25.5 84.7
Additional ordinary expenses 8 -88.8 -97.0
Additional ordinary result -63.3 -12.4
Result from associates 9 26.7 28.7
Result from other participations 1.4 0.8
Result from participations 28.1 29.5
Earnings before interest and taxes (EBIT) 1,559.9 1,863.2
Interest income 93.0 72.9
Interest expenses -555.3 -469.1
Foreign exchange losses -43.4 -35.3
Other financial result 10 -123.5 -118.2
Financial result -629.1 -549.8
Profit before tax from continuing operations 930.8 1,313.4
Income taxes 11 -64.5 -294.5
Net income from continuing operations 866.3 1,018.9
Net loss from discontinued operations 12 -178.9 -35.7
Profit for the financial year 687.3 983.3
Thereof non-controlling interests 201.7 183.1
Thereof Group share of profit 485.7 800.1
Thereof proposed dividend 13 140.9 244.3
Earnings per share in € (IAS 33) 14
Earnings per share attributable to the parent entity 2.59 4.26
Earnings per share – continuing operations 3.54 4.45
Loss per share – discontinued operations -0.95 -0.19
171HeidelbergCement | Annual Report 2015
Consolidated income statement
Consolidated statement of comprehensive income
Consolidated statement of cash flows
Consolidated balance sheet
Consolidated statement of changes in equity
Segment reporting / Notes to the consolidated financial statements
Notes to the 2015 consolidated financial statements
Audit opinion
Responsibility statement
Con
solid
ated
fin
anci
al s
tate
men
tsA
ddit
iona
l inf
orm
atio
n
4
5

Consolidated statement of comprehensive income
€m 2014 2015
Profit for the financial year 687.3 983.3
Other comprehensive income
Items not being reclassified to profit or loss in subsequent periods
Remeasurement of the defined benefit liability (asset) -143.4 111.5
Income taxes 58.4 -17.4
Defined benefit plans -85.0 94.0
Net gains/ losses arising from equity method investments -0.6 0.0
Total -85.6 94.0
Items that may be reclassified subsequently to profit or loss
Cash flow hedges - change in fair value -6.5 12.5
Reclassification adjustments for gains/ losses included in profit or loss -2.4 -14.6
Income taxes 2.2 0.1
Cash flow hedges -6.7 -2.1
Currency translation 1,317.6 1,043.9
Reclassification adjustments for gains/ losses included in profit or loss 2.4 -64.2
Income taxes 15.8 11.1
Currency translation 1,335.8 990.8
Net gains/ losses arising from equity method investments 59.0 -2.5
Total 1,388.2 986.2
Other comprehensive income 1,302.6 1,080.2
Total comprehensive income 1,989.9 2,063.4
Relating to non-controlling interests 310.5 193.8
Relating to HeidelbergCement AG shareholders 1,679.4 1,869.7
172 HeidelbergCement | Annual Report 2015
Consolidated financial statements4

Consolidated statement of cash flows
€m Notes 2014 2015
Net income from continuing operations 866.3 1,018.9
Income taxes 64.5 294.5
Interest income/ expenses 462.3 396.3
Dividends received 15 157.1 183.3
Interest received 16 192.6 91.7
Interest paid 16 -633.5 -583.6
Income taxes paid 17 -315.0 -353.1
Depreciation, amortisation, and impairment 752.5 801.2
Elimination of other non-cash items 18 77.0 -72.3
Cash flow 1,623.8 1,777.0
Changes in operating assets 19 -124.4 -144.8
Changes in operating liabilities 20 97.4 122.7
Changes in working capital -27.0 -22.1
Decrease in provisions through cash payments 21 -222.7 -244.2
Cash flow from operating activities - continuing operations 1,374.1 1,510.7
Cash flow from operating activities - discontinued operations 22 105.7 -61.5
Cash flow from operating activities 1,479.8 1,449.3
Intangible assets -17.7 -23.2
Property, plant and equipment -923.5 -884.5
Subsidiaries and other business units -148.6 -64.7
Other financial assets, associates, and joint ventures -34.8 -29.3
Investments (cash outflow) 23 -1,124.6 -1,001.8
Subsidiaries and other business units 23.3 77.2
Other fixed assets 120.5 151.6
Divestments (cash inflow) 24 143.7 228.7
Cash from changes in consolidation scope 25 21.7 20.5
Cash flow from investing activities - continuing operations -959.2 -752.5
Cash flow from investing activities - discontinued operations 22 -13.8 1,245.1
Cash flow from investing activities -973.0 492.6
Capital increase / decrease - non-controlling shareholders 1.0 -3.1
Dividend payments - HeidelbergCement AG -112.5 -140.9
Dividend payments - non-controlling shareholders 26 -165.9 -227.7
Decrease in ownership interests in subsidiaries 0.9 0.9
Increase in ownership interests in subsidiaries 27 -18.0 -15.5
Proceeds from bond issuance and loans 28 575.3 49.7
Repayment of bonds and loans 29 -1,152.7 -1,385.0
Changes in short-term interest-bearing liabilities 30 155.1 -100.2
Cash flow from financing activities - continuing operations -716.8 -1,821.8
Cash flow from financing activities - discontinued operations 22 -1.5 -4.8
Cash flow from financing activities -718.3 -1,826.6
Net change in cash and cash equivalents - continuing operations -301.9 -1,063.6
Net change in cash and cash equivalents - discontinued operations 90.5 1,178.8
Net change in cash and cash equivalents -211.4 115.2
Effect of exchange rate changes 88.4 7.1
Cash and cash equivalents at 1 January 1,351.1 1,228.1
Cash and cash equivalents at 31 December 1,228.1 1,350.5
Reclassification of cash and cash equivalents according to IFRS 5 0.0
Cash and cash equivalents presented in the balance sheet at 31 December 31 1,228.1 1,350.5
173HeidelbergCement | Annual Report 2015
Consolidated income statement
Consolidated statement of comprehensive income
Consolidated statement of cash flows
Consolidated balance sheet
Consolidated statement of changes in equity
Segment reporting / Notes to the consolidated financial statements
Notes to the 2015 consolidated financial statements
Audit opinion
Responsibility statement
Con
solid
ated
fin
anci
al s
tate
men
tsA
ddit
iona
l inf
orm
atio
n
4
5

Consolidated balance sheet
Assets Equity and liabilities
€m Notes 31 Dec. 2014 31 Dec. 2015 €m Notes 31 Dec. 2014 31 Dec. 2015
Non-current assets Shareholders' equity and non-controlling interests
Intangible assets 32 Subscribed share capital 39 563.7 563.7
Goodwill 9,604.6 10,180.6 Share premium 40 5,539.4 5,539.4
Other intangible assets 259.9 258.1 Retained earnings 41 7,643.9 8,434.4
9,864.5 10,438.8 Other components of equity 42 -596.8 377.9
Property, plant and equipment 33 Equity attributable to shareholders 13,150.3 14,915.4
Land and buildings 4,765.3 4,997.3 Non-controlling interests 43 1,094.7 1,060.9
Plant and machinery 3,595.3 3,671.9 Total equity 14,244.9 15,976.4
Other operating equipment 284.3 272.2
Prepayments and assets under construction 848.3 929.7 Non-current liabilities 46
9,493.2 9,871.2 Bonds payable 5,601.2 4,685.8
Financial assets Bank loans 267.5 123.8
Investments in joint ventures 6 1,362.9 1,452.7 Other non-current interest-bearing liabilities 26.5 21.6
Investments in associates 9 273.7 254.1 Non-controlling interests with put options 5.4 4.2
Financial investments 34 66.2 69.0 5,900.7 4,835.5
Loans and derivative financial instruments 35 129.3 56.0
1,832.1 1,831.8 Pension provisions 44 1,067.6 974.2
Fixed assets 21,189.8 22,141.7 Deferred taxes 11 442.0 435.9
Deferred taxes 11 688.4 805.0 Other non-current provisions 45 1,088.4 1,118.2
Other non-current receivables 35 616.3 710.6 Other non-current operating liabilities 84.3 94.6
Non-current income tax assets 14.4 10.4 Non-current income tax liabilities 54.8 72.7
Total non-current assets 22,508.9 23,667.7 2,737.1 2,695.5
Total non-current liabilities 8,637.7 7,531.0
Current assets
Inventories 36 Current liabilities 46
Raw materials and consumables 614.6 613.4 Bonds payable (current portion) 1,434.3 1,109.4
Work in progress 179.6 188.1 Bank loans (current portion) 285.5 397.4
Finished goods and goods for resale 574.0 616.9 Other current interest-bearing liabilities 579.1 343.4
Prepayments 28.7 25.8 Non-controlling interests with put options 22.3 25.8
1,396.8 1,444.1 2,321.1 1,876.1
Receivables and other assets 37
Current interest-bearing receivables 115.3 168.7 Pension provisions (current portion) 44 97.2 91.3
Trade receivables 1,057.2 1,214.6 Other current provisions 45 192.2 239.8
Other current operating receivables 353.9 395.5 Trade payables 1,398.5 1,450.8
Current income tax assets 55.8 58.2 Other current operating liabilities 892.6 1,091.1
1,582.2 1,837.1 Current income tax liabilities 126.4 117.9
Derivative financial instruments 38 36.9 75.1 2,706.9 2,990.9
Cash and cash equivalents 31 1,228.1 1,350.5 Total current liabilities 5,028.0 4,866.9
Total current assets 4,244.1 4,706.7 Liabilities associated with assets held for sale and discontinued operations 12 222.0
Assets held for sale and discontinued operations 12 1,379.7 Total liabilities 13,887.7 12,398.0
Balance sheet total 28,132.6 28,374.4 Balance sheet total 28,132.6 28,374.4
174 HeidelbergCement | Annual Report 2015
Consolidated financial statements4

Consolidated balance sheet
Assets Equity and liabilities
€m Notes 31 Dec. 2014 31 Dec. 2015 €m Notes 31 Dec. 2014 31 Dec. 2015
Non-current assets Shareholders' equity and non-controlling interests
Intangible assets 32 Subscribed share capital 39 563.7 563.7
Goodwill 9,604.6 10,180.6 Share premium 40 5,539.4 5,539.4
Other intangible assets 259.9 258.1 Retained earnings 41 7,643.9 8,434.4
9,864.5 10,438.8 Other components of equity 42 -596.8 377.9
Property, plant and equipment 33 Equity attributable to shareholders 13,150.3 14,915.4
Land and buildings 4,765.3 4,997.3 Non-controlling interests 43 1,094.7 1,060.9
Plant and machinery 3,595.3 3,671.9 Total equity 14,244.9 15,976.4
Other operating equipment 284.3 272.2
Prepayments and assets under construction 848.3 929.7 Non-current liabilities 46
9,493.2 9,871.2 Bonds payable 5,601.2 4,685.8
Financial assets Bank loans 267.5 123.8
Investments in joint ventures 6 1,362.9 1,452.7 Other non-current interest-bearing liabilities 26.5 21.6
Investments in associates 9 273.7 254.1 Non-controlling interests with put options 5.4 4.2
Financial investments 34 66.2 69.0 5,900.7 4,835.5
Loans and derivative financial instruments 35 129.3 56.0
1,832.1 1,831.8 Pension provisions 44 1,067.6 974.2
Fixed assets 21,189.8 22,141.7 Deferred taxes 11 442.0 435.9
Deferred taxes 11 688.4 805.0 Other non-current provisions 45 1,088.4 1,118.2
Other non-current receivables 35 616.3 710.6 Other non-current operating liabilities 84.3 94.6
Non-current income tax assets 14.4 10.4 Non-current income tax liabilities 54.8 72.7
Total non-current assets 22,508.9 23,667.7 2,737.1 2,695.5
Total non-current liabilities 8,637.7 7,531.0
Current assets
Inventories 36 Current liabilities 46
Raw materials and consumables 614.6 613.4 Bonds payable (current portion) 1,434.3 1,109.4
Work in progress 179.6 188.1 Bank loans (current portion) 285.5 397.4
Finished goods and goods for resale 574.0 616.9 Other current interest-bearing liabilities 579.1 343.4
Prepayments 28.7 25.8 Non-controlling interests with put options 22.3 25.8
1,396.8 1,444.1 2,321.1 1,876.1
Receivables and other assets 37
Current interest-bearing receivables 115.3 168.7 Pension provisions (current portion) 44 97.2 91.3
Trade receivables 1,057.2 1,214.6 Other current provisions 45 192.2 239.8
Other current operating receivables 353.9 395.5 Trade payables 1,398.5 1,450.8
Current income tax assets 55.8 58.2 Other current operating liabilities 892.6 1,091.1
1,582.2 1,837.1 Current income tax liabilities 126.4 117.9
Derivative financial instruments 38 36.9 75.1 2,706.9 2,990.9
Cash and cash equivalents 31 1,228.1 1,350.5 Total current liabilities 5,028.0 4,866.9
Total current assets 4,244.1 4,706.7 Liabilities associated with assets held for sale and discontinued operations 12 222.0
Assets held for sale and discontinued operations 12 1,379.7 Total liabilities 13,887.7 12,398.0
Balance sheet total 28,132.6 28,374.4 Balance sheet total 28,132.6 28,374.4
175HeidelbergCement | Annual Report 2015
Consolidated income statement
Consolidated statement of comprehensive income
Consolidated statement of cash flows
Consolidated balance sheet
Consolidated statement of changes in equity
Segment reporting / Notes to the consolidated financial statements
Notes to the 2015 consolidated financial statements
Audit opinion
Responsibility statement
Con
solid
ated
fin
anci
al s
tate
men
tsA
ddit
iona
l inf
orm
atio
n
4
5

Consolidated statement of changes in equity
Other components of equity
€m
Subscribed share capital
Share premium
Retained earnings
Cash flow hedge reserve
Available for sale reserve
Asset revaluation reserve
Currency translation
Total other components
of equity
Equity attributable to shareholders
Non-controlling interests 1)
Total equity
1 January 2014 562.5 5,539.4 7,347.8 6.4 26.4 32.8 -1,939.6 -1,874.0 11,575.7 938.0 12,513.7
Profit for the financial year 485.7 485.7 201.7 687.3
Other comprehensive income -84.9 -3.4 7.2 1,274.8 1,278.7 1,193.8 108.8 1,302.6
Total comprehensive income 400.8 -3.4 7.2 1,274.8 1,278.7 1,679.4 310.5 1,989.9
Changes in consolidation scope 19.3 19.3
Changes in ownership interests in subsidiaries -12.4 -12.4 -5.8 -18.2
Changes in non-controlling interests with put options -3.5 -3.5 -3.2 -6.6
Transfer of asset revaluation reserve 1.4 -1.4 -1.4
Other changes -0.1 -0.1 0.8 0.7
Capital increase from issuance of new shares 1.2 1.2 1.0 2.2
Capital increase from loan conversion 22.3 22.3 22.3
Dividends -112.5 -112.5 -165.9 -278.4
31 December 2014 563.7 5,539.4 7,643.9 3.1 33.6 31.3 -664.7 -596.8 13,150.3 1,094.7 14,244.9
1 January 2015 563.7 5,539.4 7,643.9 3.1 33.6 31.3 -664.7 -596.8 13,150.3 1,094.7 14,244.9
Profit for the financial year 800.1 800.1 183.1 983.3
Other comprehensive income 93.8 -0.2 -1.1 977.0 975.8 1,069.6 10.6 1,080.2
Total comprehensive income 893.9 -0.2 -1.1 977.0 975.8 1,869.7 193.8 2,063.4
Changes in consolidation scope 20.3 20.3
Changes in ownership interests in subsidiaries 29.1 29.1 -2.1 27.0
Changes in non-controlling interests with put options 7.4 7.4 -13.9 -6.6
Transfer of asset revaluation reserve 1.1 -1.1 -1.1
Other changes -0.9 -1.0
Capital increase 2.8 2.8
Repayment of capital -5.9 -5.9
Dividends -140.9 -140.9 -227.7 -368.6
31 December 2015 563.7 5,539.4 8,434.4 2.9 32.5 30.2 312.3 377.9 14,915.4 1,060.9 15,976.4
1) The accumulated currency translation differences included in non-controlling interests changed in 2015 by € 27.1 million (previous year: 113.2) to € -126.8 million (previous year: -153.9). The total currency translation differences recognised in equity thus amounts to € 185.5 million (previous year: -818.6).
176 HeidelbergCement | Annual Report 2015
Consolidated financial statements4

Consolidated statement of changes in equity
Other components of equity
€m
Subscribed share capital
Share premium
Retained earnings
Cash flow hedge reserve
Available for sale reserve
Asset revaluation reserve
Currency translation
Total other components
of equity
Equity attributable to shareholders
Non-controlling interests 1)
Total equity
1 January 2014 562.5 5,539.4 7,347.8 6.4 26.4 32.8 -1,939.6 -1,874.0 11,575.7 938.0 12,513.7
Profit for the financial year 485.7 485.7 201.7 687.3
Other comprehensive income -84.9 -3.4 7.2 1,274.8 1,278.7 1,193.8 108.8 1,302.6
Total comprehensive income 400.8 -3.4 7.2 1,274.8 1,278.7 1,679.4 310.5 1,989.9
Changes in consolidation scope 19.3 19.3
Changes in ownership interests in subsidiaries -12.4 -12.4 -5.8 -18.2
Changes in non-controlling interests with put options -3.5 -3.5 -3.2 -6.6
Transfer of asset revaluation reserve 1.4 -1.4 -1.4
Other changes -0.1 -0.1 0.8 0.7
Capital increase from issuance of new shares 1.2 1.2 1.0 2.2
Capital increase from loan conversion 22.3 22.3 22.3
Dividends -112.5 -112.5 -165.9 -278.4
31 December 2014 563.7 5,539.4 7,643.9 3.1 33.6 31.3 -664.7 -596.8 13,150.3 1,094.7 14,244.9
1 January 2015 563.7 5,539.4 7,643.9 3.1 33.6 31.3 -664.7 -596.8 13,150.3 1,094.7 14,244.9
Profit for the financial year 800.1 800.1 183.1 983.3
Other comprehensive income 93.8 -0.2 -1.1 977.0 975.8 1,069.6 10.6 1,080.2
Total comprehensive income 893.9 -0.2 -1.1 977.0 975.8 1,869.7 193.8 2,063.4
Changes in consolidation scope 20.3 20.3
Changes in ownership interests in subsidiaries 29.1 29.1 -2.1 27.0
Changes in non-controlling interests with put options 7.4 7.4 -13.9 -6.6
Transfer of asset revaluation reserve 1.1 -1.1 -1.1
Other changes -0.9 -1.0
Capital increase 2.8 2.8
Repayment of capital -5.9 -5.9
Dividends -140.9 -140.9 -227.7 -368.6
31 December 2015 563.7 5,539.4 8,434.4 2.9 32.5 30.2 312.3 377.9 14,915.4 1,060.9 15,976.4
1) The accumulated currency translation differences included in non-controlling interests changed in 2015 by € 27.1 million (previous year: 113.2) to € -126.8 million (previous year: -153.9). The total currency translation differences recognised in equity thus amounts to € 185.5 million (previous year: -818.6).
177HeidelbergCement | Annual Report 2015
Consolidated income statement
Consolidated statement of comprehensive income
Consolidated statement of cash flows
Consolidated balance sheet
Consolidated statement of changes in equity
Segment reporting / Notes to the consolidated financial statements
Notes to the 2015 consolidated financial statements
Audit opinion
Responsibility statement
Con
solid
ated
fin
anci
al s
tate
men
tsA
ddit
iona
l inf
orm
atio
n
4
5

Segment reporting / Notes to the consolidated financial statements
Group areas Western and Northern Europe
Eastern Europe- Central Asia
North America Asia-Pacific Africa-Mediterranean Basin
Group Services Reconciliation1) Continuing operations
€m 2014 2015 2014 2015 2014 2015 2014 2015 2014 2015 2014 2015 2014 2015 2014 2015
External revenue 3,933 4,122 1,182 1,097 3,049 3,746 2,808 2,761 914 991 729 748 12,614 13,465
Inter-Group areas revenue 79 74 10 14 -4 17 348 312 -434 -417
Revenue 4,012 4,196 1,182 1,097 3,049 3,746 2,818 2,775 910 1,008 1,077 1,060 -434 -417 12,614 13,465
Change to previous year in % 4.6% -7.2% 22.9% -1.5% 10.8% -1.6% 6.7%
Result from joint ventures 5 12 4 9 35 39 93 104 34 37 171 201
Operating income before depreciation (OIBD) 562 672 230 207 610 829 743 719 213 260 27 25 -96 -101 2,288 2,613
as % of revenue 14.0% 16.0% 19.5% 18.9% 20.0% 22.1% 26.4% 25.9% 23.4% 25.8% 2.5% 2.4% 18.1% 19.4%
Depreciation -233 -239 -101 -93 -198 -246 -120 -131 -29 -44 0 0 -13 -13 -693 -767
Operating income 329 434 129 114 412 583 623 588 184 216 27 25 -109 -114 1,595 1,846
as % of revenue 8.2% 10.3% 11.0% 10.4% 13.5% 15.6% 22.1% 21.2% 20.2% 21.5% 2.5% 2.4% 12.6% 13.7%
Result from associates 14 16 0 1 5 10 8 2 0 0 27 29
Result from other participations 0 -3 0 1 0 0 1 1 0 0 2 1 1
Result from participations 14 12 0 2 5 10 9 3 0 0 2 28 30
Additional ordinary result -63 -12 -63 -12
Earnings before interest and taxes (EBIT) 343 446 130 116 417 593 631 590 184 217 27 27 -172 -126 1,560 1,863
Capital expenditures 2) 188 249 95 93 214 263 322 247 122 56 0 0 184 94 1,125 1,002
Segment assets 3) 5,892 6,161 1,758 1,550 7,749 8,491 3,200 3,322 723 749 35 36 19,358 20,310
OIBD as % of segment assets 9.5% 10.9% 13.1% 13.4% 7.9% 9.8% 23.2% 21.6% 29.4% 34.8% 78.0% 70.1% 11.8% 12.9%
Number of employees as at 31 December 12,441 13,818 8,453 8,177 7,644 7,658 13,482 13,029 2,811 2,690 79 81 44,909 45,453
Average number of employees 12,466 12,877 8,682 8,328 8,262 8,183 13,710 13,229 2,892 2,768 72 84 46,085 45,469
Voluntary additional information
Business lines Cement Aggregates Ready-mixed concrete-asphalt
Service-joint ventures- other
Reconciliation1) Continuing operations
€m 2014 2015 2014 2015 2014 2015 2014 2015 2014 2015 2014 2015
External revenue 5,339 5,469 1,927 2,244 3,849 4,104 1,500 1,647 12,614 13,465
Inter-business lines revenue 618 694 786 861 38 52 375 348 -1,817 -1,955
Revenue 5,957 6,163 2,713 3,105 3,887 4,156 1,874 1,996 -1,817 -1,955 12,614 13,465
Change to previous year in % 3.5% 14.4% 6.9% 6.5% 6.7%
Result from joint ventures 171 201 171 201
Operating income before depreciation (OIBD) 1,423 1,527 628 751 103 149 233 289 -99 -104 2,288 2,613
as % of revenue 23.9% 24.8% 23.1% 24.2% 2.7% 3.6% 12.4% 14.5% 18.1% 19.4%
Operating income 1,061 1,124 430 531 19 60 196 248 -111 -117 1,595 1,846
as % of revenue 17.8% 18.2% 15.8% 17.1% 0.5% 1.4% 10.5% 12.4% 12.6% 13.7%
Number of employees as at 31 December 22,699 22,064 9,030 8,555 10,402 10,410 2,778 4,423 44,909 45,453
Average number of employees 23,085 22,401 9,587 9,029 10,409 10,488 3,004 3,552 46,085 45,469
1) Includes corporate functions, eliminations of intra-Group relationships between the segments and additional ordinary result.
2) Capital expenditures = in the segment columns: property, plant and equipment as well as intangible assets investments; in the reconciliation column: investments in non-current financial assets and other business units
3) Segment assets = property, plant and equipment as well as intangible assets.
178 HeidelbergCement | Annual Report 2015
Consolidated financial statements4

Segment reporting / Notes to the consolidated financial statements
Group areas Western and Northern Europe
Eastern Europe- Central Asia
North America Asia-Pacific Africa-Mediterranean Basin
Group Services Reconciliation1) Continuing operations
€m 2014 2015 2014 2015 2014 2015 2014 2015 2014 2015 2014 2015 2014 2015 2014 2015
External revenue 3,933 4,122 1,182 1,097 3,049 3,746 2,808 2,761 914 991 729 748 12,614 13,465
Inter-Group areas revenue 79 74 10 14 -4 17 348 312 -434 -417
Revenue 4,012 4,196 1,182 1,097 3,049 3,746 2,818 2,775 910 1,008 1,077 1,060 -434 -417 12,614 13,465
Change to previous year in % 4.6% -7.2% 22.9% -1.5% 10.8% -1.6% 6.7%
Result from joint ventures 5 12 4 9 35 39 93 104 34 37 171 201
Operating income before depreciation (OIBD) 562 672 230 207 610 829 743 719 213 260 27 25 -96 -101 2,288 2,613
as % of revenue 14.0% 16.0% 19.5% 18.9% 20.0% 22.1% 26.4% 25.9% 23.4% 25.8% 2.5% 2.4% 18.1% 19.4%
Depreciation -233 -239 -101 -93 -198 -246 -120 -131 -29 -44 0 0 -13 -13 -693 -767
Operating income 329 434 129 114 412 583 623 588 184 216 27 25 -109 -114 1,595 1,846
as % of revenue 8.2% 10.3% 11.0% 10.4% 13.5% 15.6% 22.1% 21.2% 20.2% 21.5% 2.5% 2.4% 12.6% 13.7%
Result from associates 14 16 0 1 5 10 8 2 0 0 27 29
Result from other participations 0 -3 0 1 0 0 1 1 0 0 2 1 1
Result from participations 14 12 0 2 5 10 9 3 0 0 2 28 30
Additional ordinary result -63 -12 -63 -12
Earnings before interest and taxes (EBIT) 343 446 130 116 417 593 631 590 184 217 27 27 -172 -126 1,560 1,863
Capital expenditures 2) 188 249 95 93 214 263 322 247 122 56 0 0 184 94 1,125 1,002
Segment assets 3) 5,892 6,161 1,758 1,550 7,749 8,491 3,200 3,322 723 749 35 36 19,358 20,310
OIBD as % of segment assets 9.5% 10.9% 13.1% 13.4% 7.9% 9.8% 23.2% 21.6% 29.4% 34.8% 78.0% 70.1% 11.8% 12.9%
Number of employees as at 31 December 12,441 13,818 8,453 8,177 7,644 7,658 13,482 13,029 2,811 2,690 79 81 44,909 45,453
Average number of employees 12,466 12,877 8,682 8,328 8,262 8,183 13,710 13,229 2,892 2,768 72 84 46,085 45,469
Voluntary additional information
Business lines Cement Aggregates Ready-mixed concrete-asphalt
Service-joint ventures- other
Reconciliation1) Continuing operations
€m 2014 2015 2014 2015 2014 2015 2014 2015 2014 2015 2014 2015
External revenue 5,339 5,469 1,927 2,244 3,849 4,104 1,500 1,647 12,614 13,465
Inter-business lines revenue 618 694 786 861 38 52 375 348 -1,817 -1,955
Revenue 5,957 6,163 2,713 3,105 3,887 4,156 1,874 1,996 -1,817 -1,955 12,614 13,465
Change to previous year in % 3.5% 14.4% 6.9% 6.5% 6.7%
Result from joint ventures 171 201 171 201
Operating income before depreciation (OIBD) 1,423 1,527 628 751 103 149 233 289 -99 -104 2,288 2,613
as % of revenue 23.9% 24.8% 23.1% 24.2% 2.7% 3.6% 12.4% 14.5% 18.1% 19.4%
Operating income 1,061 1,124 430 531 19 60 196 248 -111 -117 1,595 1,846
as % of revenue 17.8% 18.2% 15.8% 17.1% 0.5% 1.4% 10.5% 12.4% 12.6% 13.7%
Number of employees as at 31 December 22,699 22,064 9,030 8,555 10,402 10,410 2,778 4,423 44,909 45,453
Average number of employees 23,085 22,401 9,587 9,029 10,409 10,488 3,004 3,552 46,085 45,469
1) Includes corporate functions, eliminations of intra-Group relationships between the segments and additional ordinary result.
2) Capital expenditures = in the segment columns: property, plant and equipment as well as intangible assets investments; in the reconciliation column: investments in non-current financial assets and other business units
3) Segment assets = property, plant and equipment as well as intangible assets.
179HeidelbergCement | Annual Report 2015
Consolidated income statement
Consolidated statement of comprehensive income
Consolidated statement of cash flows
Consolidated balance sheet
Consolidated statement of changes in equity
Segment reporting / Notes to the consolidated financial statements
Notes to the 2015 consolidated financial statements
Audit opinion
Responsibility statement
Con
solid
ated
fin
anci
al s
tate
men
tsA
ddit
iona
l inf
orm
atio
n
4
5

Notes to the 2015 consolidated financial statements
General information
HeidelbergCement AG is a public limited company based in Germany. The company has its registered office in Heidelberg, Germany. Its address is: HeidelbergCement AG, Berliner Straße 6, 69120 Heidelberg.
The core activities of HeidelbergCement include the production and distribution of cement, aggregates, and concrete. Further details are given in the management report.
Accounting and valuation principles
Accounting principlesThe consolidated financial statements of HeidelbergCement AG were prepared in accordance with the Interna-tional Financial Reporting Standards (IFRS) as adopted by the European Union and the additional requirements of German Commercial Law pursuant to § 315a, section 1 of the German Commercial Code. All binding IFRS for the 2015 financial year adopted into European law by the European Commission, including the interpretations of the IFRS Interpretations Committee (IFRS IC), were applied.
The previous year’s figures were determined according to the same principles. The consolidated financial statements are prepared in euro. The financial statements show a true and fair view of the financial position and performance of the HeidelbergCement Group.
In accordance with IAS 1 (Presentation of Financial Statements), the consolidated financial statements contain a balance sheet as at the reporting date, an income statement, a statement of comprehensive income, a statement of changes in equity, and a statement of cash flows in accordance with the principles of IAS 7 (Statement of Cash Flows). The segment reporting is prepared in accordance with the regulations of IFRS 8 (Operating Segments).
For reasons of clarity, some individual items have been combined in the income statement and in the balance sheet. Explanations of these items are contained in the Notes. To improve the level of information, the addi-tional ordinary result is shown separately in the income statement. The income statement classifies expenses according to their nature.
Scope of consolidationIn addition to HeidelbergCement AG, the consolidated financial statements include all subsidiaries, joint ar-rangements, and associates.
Subsidiaries are characterised by the fact that HeidelbergCement can exercise control over these companies. Control exists when HeidelbergCement has decision-making powers, is exposed to variable returns, and is able to influence the level of the variable returns as a result of the decision-making powers. Normally, this is the case when more than 50% of the shares are owned. If contractual or legal regulations stipulate that a company can be controlled despite a shareholding of less than 50%, this company is included in the consolidated financial statements as a subsidiary. If a company cannot be controlled with a shareholding of more than 50% as a result of contractual or legal regulations, this company is not included in the consolidated financial statements as a subsidiary.
180 HeidelbergCement | Annual Report 2015
Consolidated financial statements4

In joint arrangements, HeidelbergCement exercises joint control over a company with one or more parties through contractual agreements. Joint control exists if decisions about the relevant activities of the company must be made unanimously. Depending on the rights and obligations of the parties, joint arrangements may be joint operations or joint ventures. In joint operations, however, the controlling parties have direct rights to the assets and obligations for the liabilities of the jointly controlled operation. Joint ventures are characterised by the fact that the parties that have joint control participate in the net assets of the company by virtue of their position as shareholders.
In associates, HeidelbergCement has a significant influence on the operating and financial policies of the company. This is normally the case if HeidelbergCement holds between 20% and 50% of the voting rights in a company.
Consolidation principlesThe capital consolidation of subsidiaries is performed using the acquisition method in accordance with IFRS 3 (Business Combinations). In this process, the acquirer measures the identifiable assets acquired and liabilities assumed at their fair values at the acquisition date. The acquiring entity’s investment, measured at the fair value of the consideration transferred, is eliminated against the revalued equity of the newly consolidated subsidiary at acquisition date. The residual positive difference between the fair value of the consideration transferred and the fair value of acquired assets and liabilities is shown as goodwill. A residual negative difference is recognised in profit or loss after further review. Non-controlling interests can be recognised either at their proportionate share of the acquiree’s net assets or at fair value. This option can be applied separately for every business combination. Transaction costs relating to business combinations are recorded as additional ordinary expenses.
Income and expenses as well as receivables and payables between consolidated companies are eliminated. Profits and losses from intra-Group sales of assets are eliminated. The consequences of consolidation on income tax are taken into account by recognising deferred taxes.
The share of equity and the share of profit or loss for the financial year attributable to non-controlling interests are shown separately. In the case of put options held by non-controlling interests (including non-controlling interests in German partnerships), the proportionate share of the period’s comprehensive income attributable to the non-controlling interests as well as the dividend payments to non-controlling interests are shown over the course of the year as changes in equity. At the reporting date, non-controlling interests with a put option were reclassified as financial liabilities. The financial liability is measured at the present value of the redemption amount. Differences between the carrying amount of the non-controlling interests and the present value of the redemption amount are recognised directly in equity. In the statement of changes in equity, this is reported in the line changes in non-controlling interests with put options.
In the event of business combinations achieved in stages, HeidelbergCement achieves control of a company in which it held a non-controlling equity interest immediately before the acquisition date. In this scenario, differ-ences between the carrying amount and the fair value of previously held shares are recognised in profit or loss. Changes in the ownership interest in a subsidiary that do not lead to a loss of control are recognised outside profit or loss as equity transactions. In the case of transactions that lead to a loss of control, any residual interests are revalued at fair value in profit or loss.
181HeidelbergCement | Annual Report 2015
Consolidated income statement
Consolidated statement of comprehensive income
Consolidated statement of cash flows
Consolidated balance sheet
Consolidated statement of changes in equity
Segment reporting / Notes to the consolidated financial statements
Notes to the 2015 consolidated financial statements
Audit opinion
Responsibility statement
Con
solid
ated
fin
anci
al s
tate
men
tsA
ddit
iona
l inf
orm
atio
n
4
5
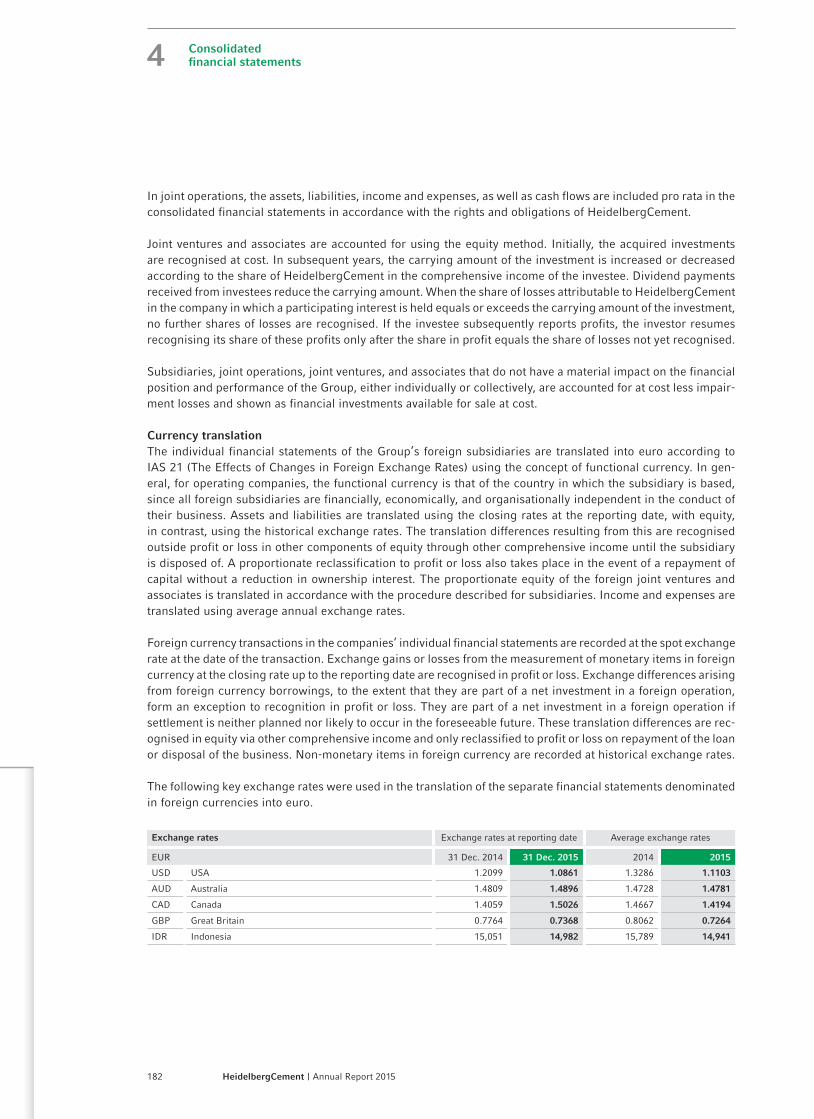
In joint operations, the assets, liabilities, income and expenses, as well as cash flows are included pro rata in the consolidated financial statements in accordance with the rights and obligations of HeidelbergCement.
Joint ventures and associates are accounted for using the equity method. Initially, the acquired investments are recognised at cost. In subsequent years, the carrying amount of the investment is increased or decreased according to the share of HeidelbergCement in the comprehensive income of the investee. Dividend payments received from investees reduce the carrying amount. When the share of losses attributable to HeidelbergCement in the company in which a participating interest is held equals or exceeds the carrying amount of the investment, no further shares of losses are recognised. If the investee subsequently reports profits, the investor resumes recognising its share of these profits only after the share in profit equals the share of losses not yet recognised.
Subsidiaries, joint operations, joint ventures, and associates that do not have a material impact on the financial position and performance of the Group, either individually or collectively, are accounted for at cost less impair-ment losses and shown as financial investments available for sale at cost.
Currency translationThe individual financial statements of the Group’s foreign subsidiaries are translated into euro according to IAS 21 (The Effects of Changes in Foreign Exchange Rates) using the concept of functional currency. In gen-eral, for operating companies, the functional currency is that of the country in which the subsidiary is based, since all foreign subsidiaries are financially, economically, and organisationally independent in the conduct of their business. Assets and liabilities are translated using the closing rates at the reporting date, with equity, in con trast, using the historical exchange rates. The translation differences resulting from this are recognised outside profit or loss in other components of equity through other comprehensive income until the subsidiary is disposed of. A proportionate reclassification to profit or loss also takes place in the event of a repayment of capital without a reduction in ownership interest. The proportionate equity of the foreign joint ventures and associates is translated in accordance with the procedure described for subsidiaries. Income and expenses are translated using average annual exchange rates.
Foreign currency transactions in the companies’ individual financial statements are recorded at the spot exchange rate at the date of the transaction. Exchange gains or losses from the measurement of monetary items in foreign currency at the closing rate up to the reporting date are recognised in profit or loss. Exchange differences arising from foreign currency borrowings, to the extent that they are part of a net investment in a foreign operation, form an exception to recognition in profit or loss. They are part of a net investment in a foreign operation if settlement is neither planned nor likely to occur in the foreseeable future. These translation differences are rec-ognised in equity via other comprehensive income and only reclassified to profit or loss on repayment of the loan or disposal of the business. Non-monetary items in foreign currency are recorded at historical exchange rates.
The following key exchange rates were used in the translation of the separate financial statements denominated in foreign currencies into euro.
Exchange rates Exchange rates at reporting date Average exchange rates
EUR 31 Dec. 2014 31 Dec. 2015 2014 2015
USD USA 1.2099 1.0861 1.3286 1.1103
AUD Australia 1.4809 1.4896 1.4728 1.4781
CAD Canada 1.4059 1.5026 1.4667 1.4194
GBP Great Britain 0.7764 0.7368 0.8062 0.7264
IDR Indonesia 15,051 14,982 15,789 14,941
182 HeidelbergCement | Annual Report 2015
Consolidated financial statements4

Recognition and measurement principlesThe consolidated financial statements are generally prepared using the historical cost principle. Exceptions to this are derivative financial instruments and available-for-sale investments, which are measured at fair value. Furthermore, the carrying amounts of the assets and liabilities recognised in the balance sheet, which represent the hedged items in fair value hedges and are otherwise accounted at cost, are adjusted as a result of changes in the fair values assigned to the hedged risks. The fundamental recognition and measurement principles are outlined below.
Intangible assets are initially measured at cost. In subsequent periods, intangible assets with a finite useful life are measured at cost less accumulated amortisation and impairment, and intangible assets with an indefinite useful life are measured at cost less accumulated impairment. Intangible assets with a finite useful life are amortised using the unit of production method, in the case of quarrying licences, otherwise using the straight-line method.
Emission rights are shown as intangible assets. Emission rights granted free of charge are initially measured at a nominal value of zero. Emission rights acquired for consideration are accounted for at cost and are subject to write-down in the event of impairment. Provisions for the obligation to return emission rights are recognised if the actual CO2 emissions up to the reporting date are not covered by emission rights granted free of charge. The amount of provision for emission rights already acquired for consideration is measured at the carrying amount and, for emission rights yet to be acquired in order to fulfil the obligation, at the market value as at the reporting date.
In accordance with IFRS 3 (Business Combinations), goodwill arising from business combinations is not am-ortised. Instead, goodwill is tested for impairment according to IAS 36 (Impairment of Assets) at least once a year in the fourth quarter after completion of the current operational plan or upon the occurrence of significant events or changes in circumstances that indicate an impairment requirement. In this impairment test, the car-rying amount of a group of cash-generating units (CGUs) to which goodwill is allocated is compared with the recoverable amount of this group of CGUs. On the basis of the sales and management structure, a group of CGUs is defined generally as a country or Group area. An exception is the cross-border Nordic Precast Group. As soon as the carrying amount of a group of CGUs to which a goodwill is allocated exceeds its recoverable amount, an impairment loss of the allocated goodwill is recognised in profit or loss. The recoverable amount is the higher of fair value less costs of disposal and the value in use of a group of CGUs. The fair value is the amount obtainable from the sale in an arm’s length transaction. The value in use is calculated by discounting estimated future cash flows after taxes with a post-tax risk-adjusted discount rate (WACC).
Property, plant and equipment are accounted for according to IAS 16 (Property, Plant and Equipment) at cost less accumulated depreciation and impairment. Cost includes all costs that can be attributed to the manufacturing process and appropriate amounts of production overheads. Costs for repair and maintenance of property, plant and equipment are generally expensed as incurred. Capitalisation takes place if the measures lead to an exten-sion or significant improvement of the asset. Property, plant and equipment are depreciated on a straight-line basis unless there is another depreciation method more appropriate for the pattern of use. Borrowing costs that can be allocated directly or indirectly to the construction of large facilities with a creation period of more than twelve months (Qualifying Assets) are capitalised as part of the cost in accordance with IAS 23 (Borrowing Costs).
183HeidelbergCement | Annual Report 2015
Consolidated income statement
Consolidated statement of comprehensive income
Consolidated statement of cash flows
Consolidated balance sheet
Consolidated statement of changes in equity
Segment reporting / Notes to the consolidated financial statements
Notes to the 2015 consolidated financial statements
Audit opinion
Responsibility statement
Con
solid
ated
fin
anci
al s
tate
men
tsA
ddit
iona
l inf
orm
atio
n
4
5

Inventories are measured in accordance with IAS 2 (Inventories) at the lower of cost and net realisable value, using the weighted average cost method. Adequate provisions are made for risks relating to quality and quantity. Besides direct expenses, the costs for finished goods and work in progress include production-related indirect materials and indirect labour costs, as well as production-related depreciation. The overhead rates are calculated on the basis of the average operating performance rate. Borrowing costs are not recognised as part of the costs because the production period is less than twelve months. Spare parts for equipment are generally reported under inventories. If they were acquired in connection with the acquisition of the equipment, or in a separate acquisition meet the definition of an asset, then they are reported under fixed assets.
Pension provisions and similar obligations are determined in accordance with IAS 19 (Employee Benefits). For numerous employees, the Group makes provisions for retirement either directly or indirectly through contributions to pension funds. Various post-employment benefit plans are in place, depending on the legal, economic, and tax framework in each country, which are generally based on employees’ years of service and remuneration. The pension provisions include those from current pensions and from entitlements from pensions to be paid in the future.
At HeidelbergCement, the company pension schemes include both defined contribution and defined benefit plans. In defined contribution plans, the Group pays contributions into earmarked funds. After paying the con-tributions, the Group has no further benefit obligations. In defined benefit plans, the Group’s obligation is to provide the agreed benefits to current and former employees. A distinction is made between benefit systems financed by provisions and those financed by funds.
The most significant post-employment benefit plans financed by funds exist in the USA, Canada, the United Kingdom, Belgium, Australia, Indonesia, and Norway. The retirement benefit system in Indonesia consists of a statutory defined benefit plan and a company-based defined contribution plan financed by funds, the benefits from which may be set off against the statutory benefits. In Germany and Sweden, the retirement benefit plans are financed by means of provisions. HeidelbergCement also has a retirement benefit system financed by pro-visions to cover the health care costs of pension recipients in the USA, Belgium, Canada, the United Kingdom, Indonesia and Ghana. In addition, the Group grants its employees other long-term employee benefits, such as jubilee benefits, old age part-time arrangements, or early retirement commitments.
The three Group areas or countries North America, the United Kingdom, and Germany account for approximately 94% of the defined benefit obligations.
The majority of defined benefit pension plans in North America have been closed to new entrants, and many have been closed to future accruals. In North America, a retirement plans committee has been established by HeidelbergCement to serve as oversight of the pension administration and fiduciary responsibilities of Hei-delbergCement in relation to the retirement plans and to act as plan administrator. The regulatory framework for each of the qualified pension plans in the USA has a minimum funding requirement based on the statutory funding objective agreed with the plan administrator. In the USA, the Employee Retirement Income Security Act of 1974 (ERISA) provides the national legal framework, which sets the minimum standards for company retirement plans. ERISA sets minimum standards for participation, vesting, benefit accrual, and funding and requires accountability of plan fiduciaries. ERISA also guarantees payment of certain benefits through the Pen-sion Benefit Guaranty Corporation if a plan is terminated. In Canada, the pension plans of HeidelbergCement fall under the jurisdiction of the provinces of Alberta or Ontario.
184 HeidelbergCement | Annual Report 2015
Consolidated financial statements4

In the United Kingdom, the main defined benefit pension plans operate under UK trust law and under the jurisdiction of the UK Pensions Regulator. These plans are run by groups of trustees, some of whom are ap-pointed by the sponsoring employer and some of whom are nominated by the plan members. The trustees are obligated by the statutory funding framework mandated by UK law to meet the statutory funding objective of having sufficient and appropriate assets to cover the schemes’ technical provisions. All of the main defined benefit pension plans in the United Kingdom are closed to new entrants and in most cases to future accruals. Benefits are granted under a number of plans, many of which are final salary plans. As such, the liabilities are expected to trend downward in the mid- to long-term as benefits are paid. Liability driven investments (LDI) strategies are used extensively in the United Kingdom and the UK pension plans are currently, in aggregate, overfunded on an IAS 19 basis. As pension benefits in the United Kingdom receive inflationary increases after benefit commencement, these benefits are subject to inflation risk. This risk is mitigated in many cases through the use of LDI products and/or through the use of caps on the maximum pension indexation granted. Given the closed nature of the arrangements, the liabilities in the United Kingdom are only marginally impacted by the salary trend assumption.
In Germany, pension plans operate under the framework of German Company Pension Law (BetrAVG) and general regulations based on German Labour Law. The main pension plans were closed to new entrants in 2005. Employees hired prior to 2006 continue to earn benefits under these arrangements. The closed pension arrangements have either a final salary plan design or a fixed benefit per year of service structure. In addition, individual pension entitlements have been granted to the members of the Managing board (please refer to the Management Report, chapter Remuneration report on page 152 f.). The German pension benefits are largely unfunded.
The liabilities in respect of the benefits granted are subject to the following major risks:
– Discount rate risks in all cases where falling market interest rates could result in a higher present value being placed on the remaining future obligations,
– Inflation risks (in particular where benefits are linked to salary, or pension payments are subject to inflation adjustments),
– Asset performance risks, in countries where funded pension plans are present (such as the USA and the United Kingdom); these risks have been mitigated in part through the use of liability driven investment strategies,
– Longevity risks in cases where benefits would be paid for a longer period in the future than is currently an-ticipated in the mortality assumptions used to estimate the future benefits payable,
– Changes to national funding requirements may accelerate cash flows required to meet pension funding re-quirements, and national law might also mandate increases in benefits beyond those presently agreed upon.
The pension obligations and the available plan assets are valued annually by independent experts for all major Group companies. The pension obligations and the expenses required to cover this obligation are measured in accordance with the internationally accepted projected unit credit method.
For the purpose of financial reporting, the actuarial assumptions are dependent on the economic situation in each individual country. The interest rate is based on the interest rate level observed on the measurement date for high-quality corporate bonds (AA rating) with a duration corresponding to the pension plans concerned in the relevant country. In countries or currency areas without a deep market for corporate bonds, the interest rate is determined on the basis of government bonds or using other approximation methods.
185HeidelbergCement | Annual Report 2015
Consolidated income statement
Consolidated statement of comprehensive income
Consolidated statement of cash flows
Consolidated balance sheet
Consolidated statement of changes in equity
Segment reporting / Notes to the consolidated financial statements
Notes to the 2015 consolidated financial statements
Audit opinion
Responsibility statement
Con
solid
ated
fin
anci
al s
tate
men
tsA
ddit
iona
l inf
orm
atio
n
4
5

Actuarial gains and losses result from increases or decreases in the present value of the defined benefit obliga-tions versus the expected amounts. These may be caused by, for example, changes in the calculation parameters or deviations between the actual and expected development of the pension obligations. These amounts, as well as the difference between the actual asset performance and the interest income shown in profit or loss, and the effect of the asset ceiling are reported in other comprehensive income.
Defined contribution accounting has been used for certain multi-employer pension plans for which insufficient information is available to use defined benefit accounting.
Other provisions are recognised in accordance with IAS 37 (Provisions, Contingent Liabilities and Contingent Assets) if, as a result of past events, there are legal or constructive obligations towards third parties that are likely to lead to outflows of resources embodying economic benefits that can be reliably determined. The provisions are calculated on the basis of the best estimate, taking into account all identifiable risks.
The capital market components of the Group-wide virtual stock option plan are accounted for as cash-settled, share-based payment transactions in accordance with IFRS 2 (Share-based Payment). As at the reporting date, a provision is recognised pro rata temporis in the amount of the fair value of the payment obligation. Changes in the fair value are recognised in profit or loss. The fair value of the options is determined using a recognised option price model.
Deferred tax assets and liabilities are recognised in accordance with the balance sheet liability method (IAS 12 Income Taxes). This means that, with the exception of goodwill arising on capital consolidation, deferred taxes are principally recognised for all temporary differences between the IFRS financial statements and the tax accounts. However, deferred tax assets are only recognised to the extent that it is probable that taxable income will be sufficiently available in the future. Furthermore, deferred tax assets are recognised on unused tax losses carried forward, to the extent that the probability of their recovery in subsequent years is sufficiently high. Deferred tax liabilities are considered in connection with undistributed profits from subsidiaries, joint ventures, and associates, unless HeidelbergCement is able to control the dividend policy of the companies and no dividend distribution or disposal is anticipated in the foreseeable future. The deferred taxes are measured using the rates of taxation that, as of the reporting date, are applicable or have been announced as applicable in the individual countries for the period when the deferred taxes are realised. Deferred tax assets and liabilities are offset if there is an enforceable right to set off current tax assets and liabilities and if they relate to income taxes levied by the same taxing authority and the Group intends to settle its current tax assets and liabilities on a net basis. In principle, changes in the deferred taxes in the balance sheet lead to deferred tax expense or income. If circumstances that lead to a change in the deferred taxes are recognised outside profit or loss in other comprehensive income or directly in equity, the change in deferred taxes is also taken into account in other comprehensive income or directly in equity. If deferred taxes were recognised via other comprehensive income, they are also subsequently released via other comprehensive income.
186 HeidelbergCement | Annual Report 2015
Consolidated financial statements4

A financial instrument is any contract that gives rise to a financial asset of one entity and a financial liability or equity instrument of another entity. The financial instruments include non-derivative and derivative financial instruments.
Non-derivative financial instruments are, in principle, measured at fair value when first recognised. These include financial investments, loans and receivables granted, and financial liabilities.
Financial instruments classified as held for trading are measured at fair value through profit or loss.
Financial investments that are categorised as available for sale in accordance with IAS 39 (Financial Instruments: Recognition and Measurement) are regularly measured at fair value if it can be reliably ascertained. This class of instrument is referred to in the following as investments available for sale at fair value. The unrealised gains and losses resulting from the subsequent measurement are recognised outside profit or loss in equity through other comprehensive income. The stock market price at the reporting date forms the basis of the fair value. If the fair values of investments available for sale at fair value fall below the cost and there is objective evidence of a significant or permanent impairment, the accumulated losses previously recognised in equity are recognised directly in profit or loss. Investments in equity instruments, for which no listed price on an active market exists and whose fair values cannot be reliably determined with justifiable expense, are measured at cost. This class of instruments is referred to in the following as investments available for sale at cost. This concerns other par-ticipations that are not listed on the stock exchange. If there is objective evidence of significant or permanent impairment, these impairment losses are directly recognised in profit or loss. The recognition of reversals of impairment in profit or loss for equity instruments held is not permitted.
Loans and receivables are measured at amortised cost, using the effective interest method if applicable, provided that they are not linked with hedging instruments. This concerns non-current receivables, interest-bearing receiv-ables, trade receivables, and other current operating receivables. In principle, the amortised cost in the case of current receivables corresponds to the nominal value or the redemption amount. Receivables are derecognised from the balance sheet when all risks and rewards were transferred and the receipt of payment associated with the receivables is ensured. In case not all risks and rewards are transferred, the receivables are derecognised when the control over the receivables has been transferred. If there is objective evidence of impairment of the loans and receivables (e.g. significant financial difficulties or negative changes in the market environment of the debtor), impairment losses are recognised in profit or loss. For trade receivables, the impairment losses are recognised through the use of an allowance account. A derecognition is booked as soon as a default of re-ceivables occurs. Reversals are carried out if the reasons for the impairment losses no longer apply. In the past financial year, there were no financial assets (as in the previous year) whose terms have been changed which would otherwise have been overdue or impaired.
Non-derivative financial liabilities are initially recognised at the fair value of the consideration received or at the value of the cash received less transaction costs incurred, if applicable. These instruments are subsequently measured at amortised cost, using the effective interest method if applicable. This includes trade payables, other operating liabilities, and financial liabilities.
187HeidelbergCement | Annual Report 2015
Consolidated income statement
Consolidated statement of comprehensive income
Consolidated statement of cash flows
Consolidated balance sheet
Consolidated statement of changes in equity
Segment reporting / Notes to the consolidated financial statements
Notes to the 2015 consolidated financial statements
Audit opinion
Responsibility statement
Con
solid
ated
fin
anci
al s
tate
men
tsA
ddit
iona
l inf
orm
atio
n
4
5

Non-current financial liabilities are discounted. In principle, the amortised cost in the case of current financial liabilities corresponds to the nominal value or the redemption amount.
The Group has not yet made use of the possibility of designating non-derivative financial instruments, when first recognised, as financial instruments at fair value through profit or loss. All non-derivative financial instruments are accounted for at the settlement date.
A derivative financial instrument is a contract whose value is dependent on a variable, which usually requires no initial net investment or an initial net investment that is smaller than would be required for other types of contracts that would be expected to have a similar response to changes in market factors, and which is settled at a later date. All derivative financial instruments are measured at fair value on the trade date when first recognised. The fair values are also relevant for the subsequent measurement. For derivative financial instruments, the fair value corresponds to the amount that HeidelbergCement would either receive or have to pay at the reporting date in the case of early termination of this financial instrument. This amount is calculated by the Group Trea-sury department on the basis of the relevant exchange and interest rates on the reporting date. The fair value of derivative financial instruments traded in the market corresponds to the market value.
In the HeidelbergCement Group, derivative financial instruments such as currency forwards, currency option contracts, interest rate swaps, or interest rate options are, in principle, used to minimise financial risks. The focus is on hedging interest, currency, and other market price risks. No derivative financial instruments are contracted or held for speculative purposes.
Contracts concluded for the purpose of receiving or supplying non-financial items in accordance with the com-pany’s expected purchase, sale, or usage requirements and held as such (own use contracts) are accounted for as pending transactions rather than derivative financial instruments. Written options for the purchase or sale of non-financial items that can be cash-settled are not classified as own use contracts.
Hybrid financial instruments consist of a non-derivative host contract and an embedded financial derivative. The two components are legally inseparable. These are usually contracts with riders. Separate accounting of the embedded derivative and the host contract is required if the economic characteristics and risks are not closely linked with the host contract, the embedded derivative fulfils the same definition criteria as a stand-alone deriv-ative, and the hybrid financial instrument is not measured at fair value through profit or loss. Alternatively, the hybrid financial instrument may be measured in total at fair value through profit or loss unless the embedded derivative changes the resulting cash flows to an insignificant degree or separation of the embedded derivative is not permitted.
Hedge accounting denotes a specific accounting method that modifies the accounting of the hedged item and hedge of a hedging relationship so that the results of measuring the hedged item or hedge are recognised in the period incurred directly in equity or in profit or loss. Accordingly, hedge accounting is based on matching the offsetting values of the hedging instrument and the hedged item.
For accounting purposes, three types of hedges exist in accordance with IAS 39. Specific requirements have to be met for hedge accounting.
– Cash flow hedges Where necessary, HeidelbergCement hedges the risk of fluctuation in future cash flows. The risk of interest
rate fluctuations in the case of variable interest is hedged by means of swaps that convert variable interest payments into fixed interest payments. This method is also used for hedging currency risks of transactions
188 HeidelbergCement | Annual Report 2015
Consolidated financial statements4

to be executed in foreign currency in the future. The fair value of the derivatives used for hedging is shown in the balance sheet. As an offsetting item, the other components of equity are adjusted directly in equity to the amount of the effective portion of the change in fair value, taking deferred taxes into account. These amounts are reclassified to the income statement when the hedged item is also recognised in profit or loss. The ineffective portion of the change in fair value is recognised directly in profit or loss.
– Fair value hedges In individual cases, HeidelbergCement hedges against fluctuations in the fair value of assets or liabilities.
Where necessary, the currency risk that arises when financial instruments are accounted for in a currency other than the functional currency is thus hedged. In addition, the fair value of fixed interest-bearing liabilities is selectively hedged by means of conversion to variable interest. In the case of hedging against fluctuations in the fair value of certain balance sheet items (fair value hedges), both the hedging instrument and the hedged portion of the risk of the underlying transaction are recognised at fair value. Changes in fair value are recognised in profit or loss.
– Hedging a net investment in a foreign operation When acquiring foreign companies, the investment can, for example, be hedged with loans in the functional
currency of the foreign company. In these cases, the currency risk arising on the subsidiary’s equity through fluctuations in exchange rates (translation risk) is designated as a hedged risk. The loans are translated using the exchange rate applicable at the reporting date. As an offsetting item, the foreign currency translation reserves in equity are adjusted. Consequently, translation differences are recognised outside profit or loss in equity through other comprehensive income until the net investment is sold, and are recognised in profit or loss on its disposal.
Derivative financial instruments for which no hedge accounting is used nevertheless represent an effective hedge in an economic sense within the context of the Group strategy. In accordance with IAS 39, these instru-ments are classified for accounting purposes as held for trading. The changes in the market values of these derivative financial instruments recognised in profit or loss are almost offset by changes in the market values of the hedged items.
Assets held for sale and discontinued operations are shown separately in the balance sheet if they can be sold in their present condition and the sale is highly probable. Assets classified as held for sale are recognised at the lower of their carrying amount and fair value less costs to sell. According to their classification, liabilities directly connected with these assets are shown in a separate line on the liability side of the balance sheet.
For discontinued operations, the profit after tax is shown in a separate line in the income statement. In the statement of cash flows, the cash flows are broken down into continuing and discontinued operations. For discontinued operations, the previous year’s values in the income statement, the statement of cash flows, and the segment reporting are adjusted accordingly in the year of the reclassification. The Notes include additional details on the assets held for sale and discontinued operations.
Contingent liabilities and assets are, on the one hand, possible obligations or assets arising from past events and whose existence depends on the occurrence or non-occurrence of one or more uncertain future events that are not within the Group’s control. On the other hand, contingent liabilities are current obligations arising from past events for which there is unlikely to be an outflow of resources embodying economic benefits or where the scope of the obligation cannot be reliably estimated. Contingent liabilities are not included in the balance sheet unless they are current obligations that have been taken on as part of a business combination.
189HeidelbergCement | Annual Report 2015
Consolidated income statement
Consolidated statement of comprehensive income
Consolidated statement of cash flows
Consolidated balance sheet
Consolidated statement of changes in equity
Segment reporting / Notes to the consolidated financial statements
Notes to the 2015 consolidated financial statements
Audit opinion
Responsibility statement
Con
solid
ated
fin
anci
al s
tate
men
tsA
ddit
iona
l inf
orm
atio
n
4
5

Contingent assets are only recognised in the balance sheet if they are virtually certain. Insofar as an outflow or inflow of economic benefits is possible, details of contingent liabilities and assets are provided in the Notes.
Finance leases, for which all risks and rewards incidental to ownership of the leased asset are transferred to the Group, lead to capitalisation of the leased asset at the inception of the lease. The leased asset is recognised at the lower of its fair value and the present value of the minimum lease payments. Lease payments are apportioned between the finance charge and the reduction of the outstanding liability so as to produce a constant rate of interest on the remaining balance of the liability over the term of the lease. The finance charge is recognised in profit or loss. Leased assets are generally depreciated over the useful life of the asset. If there is insufficient certainty that the transfer of title to the Group will take place at the end of the lease term, the leased asset is depreciated over the shorter of the expected useful life and the lease term.
Lease payments for operating leases are recognised as an expense in the income statement over the lease term on a straight-line basis.
Income is recognised if it is sufficiently probable that the Group will receive future economic benefits that can be reliably determined. It is measured at the fair value of the consideration received or receivable; sales tax and other duties are not taken into account. Revenue is recognised as soon as the goods have been delivered and the risks and rewards in accordance with the contractually agreed terms of delivery have passed to the purchaser. Interest income is recognised pro rata temporis using the effective interest method. Dividend income is realised when the legal entitlement to payment arises.
Application of new accounting standards
Application of new accounting standardsIn the 2015 financial year, HeidelbergCement applied the following standards and interpretations of the Inter-national Accounting Standards Board (IASB) for the first time.
First-time application of accounting standards
Title
Amendments to IAS 19 Defined Benefit Plans: Employee Contributions
Improvements to IFRSs 2010-2012 Cycle
Improvements to IFRSs 2011-2013 Cycle
– The amendments to IAS 19 Defined Benefit Plans: Employee Contributions clarify the accounting of em-ployee contributions or contributions made by third parties for defined benefit pension plans. Contributions that are independent of the years of service may be deducted from past service costs in the period in which the corresponding service was rendered. However, if the contributions are dependent on the number of years of service, they are to be attributed to the periods of service in the same way as the gross benefits. The amendments did not have any impact on the financial position and performance of the Group.
– As part of the annual improvements projects Improvements to IFRSs 2010–2012 Cycle and 2011–2013 Cycle, the IASB made minor amendments to a total of nine standards. The amendments did not have any impact on the financial position and performance of the Group.
190 HeidelbergCement | Annual Report 2015
Consolidated financial statements4

Published but not yet applicable accounting standardsThe IASB and IFRS IC adopted the standards and interpretations listed below, whose application was not yet mandatory for the 2015 financial year. HeidelbergCement will not apply these standards and interpretations until the date when their application first becomes mandatory and after endorsement by the European Commission.
Published, but not yet applicable accounting standards
TitleDate of first-time
application 1)
Endorsement by the EU Commission
Amendments to IAS 16 and IAS 38: Clarification of Acceptable Methods of Depreciation and Amortisation 1 January 2016 yes
Amendments to IFRS 11: Accounting for Acquisitions of Interests in Joint Operations 1 January 2016 yes
Improvements to IFRSs 2012-2014 Cycle 1 January 2016 yes
Amendments to IAS 7 Statement of Cash Flows (Disclosure Initiative) 1 January 2017 no
Amendments to IAS 12: Recognition of Deferred Tax Assets for Unrealised Losses 1 January 2017 no
IFRS 9 Financial Instruments 1 January 2018 no
IFRS 15 Revenue from Contracts with Customers 1 January 2018 no
IFRS 16 Leases 1 January 2019 no
Amendments to IFRS 10 and IAS 28: Sale or Contribution of Assets between an Investor and its Associate or Joint Venture deferred indefinitely no
1) Fiscal years beginning on or after that date
– The amendments to IAS 16 and IAS 38: Clarification of Acceptable Methods of Depreciation and Amorti-sation make it clear that revenue-based methods of depreciation and amortisation cannot be used in general. The amendments will not have any impact on the financial position and performance of the Group.
– The amendments to IFRS 11: Accounting for Acquisitions of Interests in Joint Operations regulate the accounting of the acquisition of interests in joint operations that constitute a business. The principles of IFRS 3 for business combinations are consequently to be applied on first-time consolidation. The amendments will not have a significant impact on the financial position and performance of the Group.
– As part of the annual improvements project Improvements to IFRSs 2012–2014 Cycle, the IASB made minor amendments to a total of four standards. The amendments will not have a significant impact on the financial position and performance of the Group.
– The amendments to IAS 7 Statement of Cash Flows were published by IASB as part of its Disclosure Initiative and contain guidelines for additional notes on changes in liabilities arising from financing activities.
– The amendments to IAS 12: Recognition of Deferred Tax Assets for Unrealised Losses addresses various questions relating to the recognition of deferred tax assets for unrealised losses arising from debt instruments available for sale measured at fair value. The amendments are not expected to have any impact on the financial position and performance of the Group.
– IFRS 9 Financial Instruments governs the accounting of financial instruments and completely replaces IAS 39 (Financial Instruments: Recognition and Measurement). IFRS 9 pursues a new, less complex approach for the categorisation and measurement of financial assets. In doing so, it refers to the cash flow characteristics of the financial assets and the business model under which they are managed. The regulations for the accounting of financial liabilities in accordance with IFRS 9 essentially correspond to the previous regulations in IAS 39.
191HeidelbergCement | Annual Report 2015
Consolidated income statement
Consolidated statement of comprehensive income
Consolidated statement of cash flows
Consolidated balance sheet
Consolidated statement of changes in equity
Segment reporting / Notes to the consolidated financial statements
Notes to the 2015 consolidated financial statements
Audit opinion
Responsibility statement
Con
solid
ated
fin
anci
al s
tate
men
tsA
ddit
iona
l inf
orm
atio
n
4
5

In addition, IFRS 9 provides a new impairment model, which, in contrast to IAS 39, is not based on existing losses, but on expected credit losses. With regard to hedge accounting, IFRS 9 provides for the removal of the thresholds applied as part of retrospective effectiveness testing. Instead, evidence is now to be documented of the economic relationship between the hedged item and the hedging instrument. Furthermore, the number of potential hedged items and the disclosures for hedge accounting were extended. The first-time application of IFRIC 9 is not expected to have a significant impact on the financial position and performance of the Group.
– The objective of IFRS 15 Revenue from Contracts with Customers is to consolidate the wide range of regulations for revenue recognition that have been set out in various standards and interpretations to date and to establish uniform basic principles that are applicable to all industries and all categories of revenue transactions. IFRS 15 determines when and to what extent revenue is recognised. The basic principle is that revenue is recognised with the transfer of goods and services to the amount of the expected consideration (payment). IFRS 15 also includes extended guidelines on multiple element arrangements as well as new reg-ulations concerning the treatment of service contracts and contract modifications. IFRS 15 replaces IAS 18 (Revenue) and IAS 11 (Construction Contracts), as well as the associated interpretations. According to current estimates, the first-time application of IFRS 15 should not have a significant impact on the financial position and performance of the Group.
– IFRS 16 Leases provides new regulations for the accounting of leases and replaces IAS 17 Leases and related interpretations. For all leases, according to IFRS 16, the lessee has a fundamental obligation to account for rights and obligations arising under leases. In future, lessees will account for the right-of-use asset in the fixed assets as well as a corresponding lease liability. Leases with a term of up to twelve months and contracts with a low volume, in terms of value, are exempted from the accounting obligation. The lease liability is measured at the present value of the lease payments made during the term of the lease. The costs of the right-of-use asset include the initially recognised amount of the lease liability as well as any additional costs incurred in connection with the lease contract. The lease liability is compounded in subsequent periods and reduced by the amount of the lease payments made. The right-of-use asset is amortised on a straight-line basis over the term of the lease contract. The new regulation will lead to an increase in fixed assets in the consolidated balance sheet as well as a rise in financial liabilities. According to the current regulations of IAS 17, the ex-penses arising from operating leases are recognised as other operating expenses in the income statement. The future minimum lease payments (not discounted) are mentioned in the Notes under the other financial commitments. According to the regulations of IFRS 16, the expenses are reflected in the amortisation and interest expenses.
– The amendments to IFRS 10 and IAS 28: Sale or Contribution of Assets between an Investor and its As-sociate or Joint Venture address a known inconsistency between the requirements of IFRS 10 and IAS 28 in the event of a sale of assets to an associate or a joint venture, or the contribution of assets to an associate or a joint venture. In the future, the full gain or loss resulting from a transaction will only be recognised if the assets that have been sold or contributed constitute a business in accordance with IFRS 3, regardless of whether the transaction is defined as a share or asset deal. In contrast, if the assets do not constitute a business, only the unrelated investors’ share of the gain or loss is to be recognised in profit or loss. The amendments are not expected to have any impact on the financial position and performance of the Group.
192 HeidelbergCement | Annual Report 2015
Consolidated financial statements4

Estimation uncertainty and assumptions
The presentation of the financial position and performance in the consolidated financial statements is dependent on estimates and assumptions made by the management, which affect the amounts and presentation of the assets and liabilities, expenses and income, and contingent liabilities accounted for in the period. The actual values may differ from these estimates. The assumptions and estimates relate particularly to the necessity and calculation of impairment of goodwill, the recognition of deferred tax assets, and the measurement of pension provisions and other provisions, as well as the measurement of specific financial instruments (e.g. earn-out clauses and put options of non-controlling interests).
A cash flow-based method in accordance with IAS 36 (Impairment of Assets) is used to determine the recoverable amount of groups of cash-generating units as part of the impairment test for goodwill. In particular, estimates are required in relation to future cash flows of the groups of cash-generating units as well as to the discount rates and growth rates used (discounted cash flow method). A change in the influencing factors may have a significant impact on the existence or amount of impairment losses. Explanations concerning the composition of the carrying amount of goodwill and the impairment test are provided in Note 32 Intangible assets.
To assess the future probability that deferred tax assets can be utilised, various estimates must be adopted, e.g. operational plans, utilisation of losses carried forward, and tax planning strategies. If the actual results deviate from these estimates, this may impact the financial position and performance. More detailed information on deferred tax assets is given in Note 11 Income taxes.
The obligations arising from defined post-employment benefit plans are determined on the basis of actuarial methods, which are based on assumptions and estimates concerning the discount rate, pension increase rate, life expectancy, and other influencing factors. A change in the underlying parameters may lead to changes in the amounts recognised in the balance sheet. Further details are given on page 184 f. and in Note 44 Pension provisions.
Provisions for damages and environmental obligations are measured on the basis of an extrapolation of the claims and estimates of the development of costs. A change in the influencing parameters may have an impact on the income statement as well as the amounts recognised in the balance sheet. The recognition and measurement of the other provisions are based on estimates of the probabilities of future outflow of resources and on the basis of empirical values and the circumstances known at the reporting date. The actual outflow of resources may differ from the outflow of resources expected at the reporting date and may have an impact on the recognition and measurement. Further explanations on provisions can be found in Note 45 Other provisions.
The measurement of specific financial instruments, such as earn-out clauses and put options of non-controlling interests, which are not traded on an active market, is based on best possible estimates using probability fore-casts and recognised actuarial methods.
193HeidelbergCement | Annual Report 2015
Consolidated income statement
Consolidated statement of comprehensive income
Consolidated statement of cash flows
Consolidated balance sheet
Consolidated statement of changes in equity
Segment reporting / Notes to the consolidated financial statements
Notes to the 2015 consolidated financial statements
Audit opinion
Responsibility statement
Con
solid
ated
fin
anci
al s
tate
men
tsA
ddit
iona
l inf
orm
atio
n
4
5

Scope of consolidation
In addition to HeidelbergCement AG, the consolidated financial statements include 711 subsidiaries that have been fully consolidated, of which 32 are German and 679 are foreign companies. The changes in comparison with 31 December 2014 are shown in the following table.
Number of fully consolidated companies
Germany Abroad Total
31 December 2014 33 711 744
First-time consolidations 1 18 19
Divestments -3 -15 -18
Incorporations / mergers / liquidations / method changes 1 -35 -34
31 December 2015 32 679 711
A list of shareholdings of the HeidelbergCement Group as at 31 December 2015 on the basis of the regulations of § 313, section 2 of the German Commercial Code (HGB) is provided on page 255 f. It contains an exhaustive list of all subsidiaries that make use of the exemption from disclosure obligations in accordance with § 264b of the German Commercial Code (HGB).
Business combinations in the reporting yearOn 13 March 2015, HeidelbergCement and the Norwegian KB Gruppen Kongsvinger AS signed an agreement on the combination of the concrete products activities of their Swedish subsidiaries Abetong AB and Contiga AB. The transaction was concluded on 28 September 2015. The newly formed Nordic Precast Group AB, which is the result of this combination and in which HeidelbergCement holds a 57.6% stake, operates in Norway, Sweden, Denmark, Germany, Poland, and Latvia and is assigned to the Western and Northern Europe Group area. The combination aims at improving our competitiveness in the concrete products area in Northern Europe. The fair value of the consideration transferred for the acquisition of shares in the Contiga Group amounts to €80.9 mil-lion. It comprises the fair value of €62.0 million for 42.4% of shares in the newly formed Nordic Precast Group AB as well as a cash payment of €18.9 million. The non-controlling interests within the Contiga Group amount to €2.5 million. It is contractually agreed that HeidelbergCement subsequently acquires these non-controlling interests. This agreement is accounted for as a put option of the non-controlling interests and shown accordingly.
The provisionally recognised goodwill of €82.1 million, which resulted from the business combination is not deductible for tax purposes, and also includes the share of non-controlling interests of the Nordic Precast Group AB. The goodwill represents the growth potential arising from an improved market position. Transaction costs of €0.7 million were recognised in profit or loss.
As part of the business combination, receivables with a fair value of €36.2 million were acquired. These concern trade receivables amounting to €30.7 million, loan receivables amounting to €1.7 million, and other receivables amounting to €3.8 million. The gross value of the receivables is €36.4 million, of which €0.2 million is likely to be irrecoverable. The purchase price allocation has not yet been completed, as not all measurements have been finalised. Adjustments may be made, particularly in relation to intangible assets and property, plant and equipment, as well as deferred taxes.
194 HeidelbergCement | Annual Report 2015
Consolidated financial statements4

To expand its market shares in the ready-mixed concrete and aggregates business lines in Poland, Heidelberg-Cement acquired 100% of the shares of both Duda Beton Sp.z.o.o. and Duda Kruszywa Sp.z.o.o., Opole, on 15 October 2015. The purchase price amounted to €18.2 million and was paid in cash. The provisionally recognised goodwill of €6.7 million is not tax-deductible. The transaction costs recognised in profit or loss amounted to €0.6 million. The fair value of the trade receivables taken over amounts to €6.2 million and corresponds to the gross value. The purchase price allocation is not yet been completed, as not all measurements have been final-ised. There may be adjustments concerning the measurement of property, plant and equipment, and provisions.
During the reporting period, HeidelbergCement also carried out further acquisitions in the Group areas Western and Northern Europe, North America, and Asia-Pacific, which are immaterial when considered individually. The total acquisition costs amounted to €30.4 million and are made up of cash payments of €27.7 million and the fair value of previous shareholdings of €2.7 million. The revaluation of the previously held shares resulted in a profit of €1.9 million, which was recognised in the additional ordinary income. Goodwill amounts to a total of €5.5 million and is not deductible for tax purposes. In connection with the acquisitions, transaction costs of €0.2 million were recognised in profit or loss. The fair value of the receivables taken over amounts to €9.4 million and includes trade receivables of €8.3 million and other operating receivables to the amount of €1.1 million. The gross value of the receivables totals €9.7 million, of which €0.3 million is likely to be irrecoverable.
The following table shows the fair values of the assets and liabilities of the business combinations as at the acquisition date.
Fair values recognised as at the acquisition date
€m Contiga Group Poland Others Total
Intangible assets 0.5 0.0 3.2 3.6
Property, plant and equipment 45.6 9.8 20.3 75.7
Financial assets 1.9 0.1 2.0
Inventories 6.3 0.9 1.9 9.1
Trade receivables 30.7 6.2 8.3 45.2
Cash and cash equivalents 16.3 0.4 1.1 17.7
Other assets 15.5 0.5 1.6 17.6
Total assets 116.7 17.8 36.3 170.8
Deferred taxes 3.7 1.7 5.5
Provisions 0.5 0.5 0.7 1.6
Non-current liabilities 28.6 1.8 30.4
Current liabilities 82.5 5.8 7.0 95.4
Total liabilities 115.4 6.3 11.2 132.9
Net assets 1.3 11.5 25.1 37.9
The acquired property, plant and equipment relates to land, similar land rights, and buildings (€39.2 million), plant and machinery (€31.4 million), other equipment (€3.0 million), and assets under construction (€2.1 million).
The companies have contributed €86.8 million to revenue and €2.8 million to the profit for the financial year since their acquisition. If the acquisitions had taken place on 1 January 2015, contributions to revenue and the profit for the financial year would be higher by €222.6 million and €3.6 million, respectively.
195HeidelbergCement | Annual Report 2015
Consolidated income statement
Consolidated statement of comprehensive income
Consolidated statement of cash flows
Consolidated balance sheet
Consolidated statement of changes in equity
Segment reporting / Notes to the consolidated financial statements
Notes to the 2015 consolidated financial statements
Audit opinion
Responsibility statement
Con
solid
ated
fin
anci
al s
tate
men
tsA
ddit
iona
l inf
orm
atio
n
4
5

Business combinations in the previous yearTo strengthen the market position in the field of aggregates, HeidelbergCement purchased an additional 62.91% of shares in the Cimescaut Group, Tournai, Belgium – previously accounted for at equity – on 15 January 2014, and the remaining 3.07% in July 2014 as part of a squeeze-out, thereby raising its shareholding to 100%. The purchase price totalled €50.3 million and was paid in cash. The fair value of the previously held equity interest amounted to €21.4 million as at the acquisition date. The revaluation of the shareholding resulted in a profit of €5.6 million, which was recognised in the additional ordinary income. The goodwill of €30.0 million, which is not deductible for tax purposes, represents market growth potential.
On 20 January 2014, HeidelbergCement acquired 100% of the shares in Espabel NV, Gent, Belgium. Espabel operates a cement grinding plant. With this acquisition, HeidelbergCement aims to enhance its market position in cement activities and realise cost savings in production and sales. The purchase price of €37.5 million is made up of a cash payment of €31.5 million and a liability for a contingent consideration, which was recognised at a fair value of €6.0 million. The contingent consideration is dependent on future payments received from a long-term service contract. The fair value was determined by discounting the estimated future cash flows with a discount rate adjusted to the risk profile. The range of outcomes (undiscounted) lies between €6.0 million and €15.0 million. The goodwill of €30.0 million, which is not tax-deductible, represents synergy effects. The liability for the contingent consideration has not changed materially as at 31 December 2015.
In order to strengthen its market position in the concrete business line in Canada, HeidelbergCement acquired 87.5% of the shares in the Cindercrete Products Group, Saskatchewan, on 17 July 2014. The purchase price of €47.3 million is made up of a cash payment of €41.7 million and a liability for a contingent consideration with a fair value of €5.6 million. The contingent consideration is measured according to the average operating income before depreciation (OIBD) of the company until 30 June 2019 and was determined on the basis of probabilities. The range of outcomes (undiscounted) lies between €0 million and €7.1 million. The non-controlling interests of €3.1 million were measured on the basis of their proportionate interest in the fair value of the identifiable net assets. The purchase contract also provides for the subsequent acquisition of the non-controlling interests by HeidelbergCement. This component of the contract is accounted for as a put option of the non-controlling interests and shown accordingly. The goodwill of €25.4 million provisionally recognised on 31 December 2014, which is not deductible for tax purposes, represents the synergy potential arising from the business combi-nation. The final purchase price allocation resulted in an increase in goodwill and non-controlling interests of €2.8 million. The liability for the contingent consideration decreased by €1.4 million as at 31 December 2015.
To expand its market position in the cement, aggregates, and concrete business lines in Iceland, Heidelberg-Cement increased its shareholdings in four participations that were previously accounted for as associates to 53.0%, respectively, between February 2014 and July 2014. The total cost of the business combinations amount to €3.9 million.
HeidelbergCement acquired a quarry in Axedale, Australia, on 28 November 2014 as part of an asset deal. With this acquisition, HeidelbergCement secures additional aggregates reserves in the Melbourne metropolitan region. The purchase price amounted to €20.6 million and was paid in cash.
The following table shows the fair values of the identifiable assets and liabilities of the business combinations as at the acquisition date.
196 HeidelbergCement | Annual Report 2015
Consolidated financial statements4

Fair values recognised as at the acquisition date
€m Cimescaut Espabel Cindercrete Iceland Australia Total
Intangible assets 0.0 1.0 0.2 14.5 15.8
Property, plant and equipment 11.6 33.3 22.5 17.3 6.3 90.9
Financial assets 10.4 0.0 0.0 10.4
Inventories 3.2 2.7 2.7 3.1 0.3 11.9
Trade receivables 6.0 2.8 7.1 5.9 21.8
Cash and cash equivalents 22.9 0.2 0.4 0.7 24.2
Other assets 9.9 0.3 0.1 1.5 0.1 11.9
Total assets 63.9 40.4 32.8 28.7 21.2 187.0
Provisions 1.4 0.0 0.5 1.9
Liabilities 18.8 32.8 3.8 20.6 0.1 76.1
Deferred taxes 2.0 0.1 4.0 0.3 6.3
Total liabilities 22.2 32.9 7.7 20.9 0.6 84.3
Net assets 41.7 7.5 25.1 7.7 20.6 102.7
The acquired property, plant and equipment relates to land and buildings (€51.7 million), plant and machinery (€32.1 million), other equipment (€7.0 million), and assets under construction (€0.1 million).
The Cimescaut Group, the Cindercrete Products Group, the Icelandic companies, and the quarry in Australia have contributed €64.9 million to revenue and €5.4 million to the profit for the financial year since their acqui-sition. If the acquisitions had taken place on 1 January 2014, contributions to revenue and the profit for the 2014 financial year would be higher by €38.3 million and €4.3 million, respectively. The contribution of Espabel to revenue and the profit for the financial year cannot be determined separately, as deliveries to customers were made from other plants during the conversion phase of the cement grinding plant.
Furthermore, HeidelbergCement effected business combinations in Germany in the area of ready-mixed con-crete that were of minor importance for the presentation of the financial position and performance of the Group.
Business combinations following the end of the reporting periodTo secure raw material reserves and strengthen its market position in Australia, HeidelbergCement acquired the business of Rocla Quarry Products (RQP) on 29 January 2016 as part of an asset deal. The purchase price is around €98 million and subject to a usual working capital adjustment clause. RQP operates 12 large sand pits in the metropolitan regions of Perth, Adelaide, Melbourne, and Sydney with a production of about 6 million tonnes per year. It also has a number of smaller production locations and mineral reserves. The initial accounting for the business combination was still incomplete when the consolidated financial statements were approved by the Managing Board. Assessments were not yet available for the preparation of the further information in accordance with paragraph B64 of IFRS 3.
Divestments in the reporting yearBased on the findings of the report by the British Competition Commission on the aggregates, ready-mixed concrete, and cement market in the United Kingdom, which was published on 14 January 2014, Heidelberg- Cement was obliged to sell one blast furnace slag grinding plant in the 2015 financial year. The transaction was completed on 31 July 2015 with the disposal of the plant in Scunthorpe. The sales price of €30.2 million is made up of a cash payment of €27.4 million and a non-current, contingent purchase price receivable of €2.8 million.
197HeidelbergCement | Annual Report 2015
Consolidated income statement
Consolidated statement of comprehensive income
Consolidated statement of cash flows
Consolidated balance sheet
Consolidated statement of changes in equity
Segment reporting / Notes to the consolidated financial statements
Notes to the 2015 consolidated financial statements
Audit opinion
Responsibility statement
Con
solid
ated
fin
anci
al s
tate
men
tsA
ddit
iona
l inf
orm
atio
n
4
5

The agreement dated 18 December 2014 binds HeidelbergCement to sell the German lime operating line. The sale of the majority participation in Walhalla Kalk GmbH & Co. KG, Regensburg, as well as the participation in Walhalla Kalk Verwaltungsgesellschaft mbH, which is also based in Regensburg, was completed on 1 September 2015. Furthermore, the Istein lime plant and all shares in HC Kalkproduktionsgesellschaft Istein mbH, Efrin-gen-Kirchen, were also sold on 1 July 2015. The preliminary sales price amounting to €46.3 million is made up of a cash payment of €39.8 million as well as a receivable of €6.5 million.
The following table shows the assets and liabilities as at the date of disposal.
Assets and liabilities at date of disposal
€m UK Germany Total
Disposal groups held for sale 28.9 61.1 90.0
Liabilities associated with disposal groups 18.1 18.1
Net assets 28.9 42.9 71.8
The divestments generated losses of €5.4 million and profits of €3.7 million, which are shown in additional ordinary expenses and income, respectively.
Discontinued operationsOn 23 December 2014, HeidelbergCement signed an agreement with an American subsidiary of Lone Star Funds on the sale of its building products business in North America (excluding Western Canada) and the United Kingdom (referred to in summary as “Hanson Building Products”). Hanson Building Products is a leading manu-facturer of pressure and gravity pipes in North America and one of the largest brick producers in North America and the United Kingdom. By selling Hanson Building Products, HeidelbergCement is consistently pursuing its strategy of focusing on the refinement of raw materials for its core products cement and aggregates, as well as the downstream concrete and asphalt activities. The transaction was concluded on 13 March 2015. On comple-tion and following a contractually agreed purchase price adjustment, HeidelbergCement received a payment of €1,265 million in total, which is shown as cash flow from investing activities – discontinued operations. An additional payment of up to US$100 million is conditional on the success of the business in 2015 and payable in 2016. The result from the discontinued operation is shown in Note 12.
Divestments in the previous yearThe agreement dated 5 October 2013 obliges HeidelbergCement to dispose of the grinding facility in Raigad, India. The approval of the local authorities and the transfer of assets and liabilities took place on 3 January 2014. The sales price of €19.6 million is made up of a cash payment of €12.3 million and a receivable of €7.3 million, which was settled in the 2015 financial year.
On the basis of an agreement dated 23 December 2013, HeidelbergCement is obliged to dispose of its shares in OAO Voronezhskoe Rudoupravlenije, Strelica, Russia. The notarial transfer of the shares to the purchaser occurred after approval was given by the local competition authorities on 3 February 2014. The sales price of €5.5 million was paid in cash.
On 28 March 2014, HeidelbergCement sold its shares in Cimgabon S.A., Libreville, Gabon. The sales price of €1.4 million is made up of a cash payment of €0.2 million and a receivable of €1.2 million.
On 15 August 2014, HeidelbergCement sold its shares in PT Gunung Tua Mandiri, Bogor, Indonesia. The sales price of €3.2 million was paid in cash.
198 HeidelbergCement | Annual Report 2015
Consolidated financial statements4

The following table shows the assets and liabilities as at the date of deconsolidation.
Assets and liabilities at date of disposal
€m India Russia Gabon Indonesia Total
Property, plant and equipment 3.7 3.7 7.4
Inventories 8.0 0.3 8.3
Cash and cash equivalents 1.3 1.4 2.6
Other assets 8.6 1.1 9.7
Assets held for sale 15.5 10.5 26.0
Total assets 15.5 10.5 21.6 6.5 54.1
Provisions 16.6 0.1 16.8
Liabilities 15.0 2.3 17.2
Liabilities associated with disposal groups 3.6 3.8 7.4
Total liabilities 3.6 3.8 31.6 2.4 41.4
Net assets 12.0 6.7 -10.0 4.1 12.7
The divestment generated profits of €16.6 million and losses of €2.9 million, which are shown in additional ordinary income and expenses, respectively.
Notes to the segment reporting
HeidelbergCement’s segment reporting is based on the Group’s internal division into geographical regions and business lines. It reflects the management organisation and divides the Group into geographical regions. In addition, a voluntary breakdown into business lines is provided.
HeidelbergCement is geographically divided into the following six Group areas:– Western and Northern Europe,– Eastern Europe-Central Asia,– North America,– Asia-Pacific,– Africa-Mediterranean Basin, and– Group Services.
The Western and Northern Europe Group area includes the Benelux countries, Denmark, the United Kingdom, Iceland, Norway, Sweden, the Baltic States, and the cross-border Nordic Precast Group. Germany was con-solidated with Western and Northern Europe primarily on the basis of the medium to long-term comparable operating income before depreciation as a percentage of revenue. Bosnia-Herzegovina, Georgia, Kazakhstan, Croatia, Poland, Romania, Russia, the Czech Republic, Slovakia, Ukraine, and Hungary are part of the Eastern Europe-Central Asia Group area. The Group area Asia-Pacific includes Bangladesh, Brunei, China, Hong Kong, India, Indonesia, Malaysia, and Australia. The Group area Africa-Mediterranean Basin is made up of the African countries as well as Israel, Spain, and Turkey. North America includes the United States and Canada. Our trading activities are combined in Group Services.
HeidelbergCement is also divided into four business lines: cement, aggregates, ready-mixed concrete-asphalt, and service-joint ventures-other. The service-joint ventures-other business line essentially covers the trading activities and results of our joint ventures.
199HeidelbergCement | Annual Report 2015
Consolidated income statement
Consolidated statement of comprehensive income
Consolidated statement of cash flows
Consolidated balance sheet
Consolidated statement of changes in equity
Segment reporting / Notes to the consolidated financial statements
Notes to the 2015 consolidated financial statements
Audit opinion
Responsibility statement
Con
solid
ated
fin
anci
al s
tate
men
tsA
ddit
iona
l inf
orm
atio
n
4
5

HeidelbergCement evaluates the performance in the segments primarily on the basis of the operating income. Group financing (including financing expenses and income) and income taxes are managed centrally by the Group, and are therefore not allocated to segments. The IFRS used in these financial statements form the basis for the valuation principles of the segment reporting.
Revenue with other Group areas or business lines represents the revenue between segments. In the reconcili-ation, intra-Group relationships between the segments are eliminated.
The following table shows a breakdown of the revenue with external customers and the non-current assets of continuing operations by country in accordance with IFRS 8.33.
Information by country Revenue with external customers Non-current assets 1)
€m 2014 2015 2014 2015
United States 2,340 3,061 7,279 8,061
United Kingdom 1,286 1,485 3,038 3,139
Indonesia 1,257 1,177 955 1,073
Australia 998 1,007 1,631 1,615
Germany 1,018 998 928 1,009
Canada 709 686 443 425
Belgium 458 461 891 888
Other countries 4,549 4,590 4,193 4,102
Total 12,614 13,465 19,358 20,310
1) Intangible assets and property, plant and equipment
Revenue is allocated to countries according to the supplying company’s country of origin.
200 HeidelbergCement | Annual Report 2015
Consolidated financial statements4

Notes to the income statement
1 Revenue
Revenue development by Group areas and business lines
Cement Aggregates Ready-mixed concrete-asphalt
Service- joint ventures-
other
Intra-Group eliminations
Total
€m 2014 2015 2014 2015 2014 2015 2014 2015 2014 2015 2014 2015
Western and Northern Europe 1,780 1,796 843 887 1,539 1,627 501 610 -651 -726 4,012 4,196
Eastern Europe-Central Asia 987 878 104 116 163 183 0 -72 -81 1,182 1,097
North America 1,115 1,366 1,150 1,471 874 1,039 257 262 -346 -391 3,049 3,746
Asia-Pacific 1,481 1,463 530 537 1,103 1,086 36 33 -334 -344 2,818 2,775
Africa-Mediterranean Basin 622 701 86 93 207 221 35 53 -40 -60 910 1,008
Group Services 36 11 1,045 1,056 -4 -7 1,077 1,060
Inter-Group area revenue within business lines -64 -52 -18 -64 -70
Total 5,957 6,163 2,713 3,105 3,887 4,156 1,874 1,996 -1,447 -1,608 12,984 13,812
Inter-Group area revenue between business lines -370 -347 -370 -347
Continuing operations -1,817 -1,955 12,614 13,465
2 Other operating income
Other operating income
€m 2014 2015
Gains from sale of fixed assets 53.2 78.5
Income from sale of non-core products 59.4 58.0
Rental income 30.3 32.9
Foreign exchange gains 31.5 58.7
Reversal of provisions 21.6 14.8
Income from reduction of bad debt provision 10.8 7.0
Other income 85.7 105.3
292.5 355.3
Book profits from fixed asset disposals include gains from the sale of quarries that were depleted and no longer in operational use to the amount of €25.3 million. The foreign exchange gains concern trade receivables and payables. Foreign exchange gains from interest-bearing receivables and liabilities are shown in the financial result. Income from the reversal of provisions includes the reversal of provisions that cannot be assigned by cost type.
Significant non-recurring transactions occurring in the course of ordinary business activities are shown in the additional ordinary income and explained in Note 8.
201HeidelbergCement | Annual Report 2015
Consolidated income statement
Consolidated statement of comprehensive income
Consolidated statement of cash flows
Consolidated balance sheet
Consolidated statement of changes in equity
Segment reporting / Notes to the consolidated financial statements
Notes to the 2015 consolidated financial statements
Audit opinion
Responsibility statement
Con
solid
ated
fin
anci
al s
tate
men
tsA
ddit
iona
l inf
orm
atio
n
4
5

3 Material costs
Material costs
€m 2014 2015
Raw materials 1,989.7 2,092.8
Supplies, repair materials, and packaging 794.7 851.0
Costs of energy 1,312.3 1,255.5
Goods purchased for resale 1,025.4 1,060.0
Miscellaneous 197.7 217.8
5,319.7 5,477.1
Material costs amounted to 40.7% of revenue (previous year: 42.2%).
4 Personnel costs and employees
Personnel costs
€m 2014 2015
Wages, salaries, social security costs 1,939.4 2,152.1
Costs of retirement benefits 86.4 97.0
Other personnel costs 24.1 25.1
2,049.9 2,274.2
Personnel costs equalled 16.9% of revenue (previous year: 16.3%). The development of expenses for retirement benefits is explained in Note 44.
Annual average number of employees
Categories of employees 2014 2015
Blue-collar employees 31,819 31,163
White-collar employees 13,959 13,992
Apprentices 307 314
46,085 45,469
Long-term bonus – capital market componentAs a long-term variable remuneration element, the members of the Managing Board of HeidelbergCement AG and certain managers within the HeidelbergCement Group receive a long-term bonus made up of a management component and a capital market component. The capital market component with a term of four years considers the external added value as measured by total shareholder return (TSR) – adjusted for the reinvested dividend payments and for changes in capital – compared with the relevant capital market indices, using performance share units (PSUs). The PSUs are virtual shares used for the calculation of the capital market component.
For the capital market component, the number of PSUs initially granted is determined in a first step: the num-ber of PSUs is calculated from a set percentage of the fixed annual salary divided by the reference price of the HeidelbergCement share as at the time of issue. The reference price in each case is the average of the daily closing prices (trading days) of the HeidelbergCement share in Xetra trading on the Frankfurt Stock Exchange for three months retrospectively from the start/expiration of the performance period. After expiry of the
202 HeidelbergCement | Annual Report 2015
Consolidated financial statements4

four-year performance period, the PSUs definitively earned are to be calculated in a second step according to the attainment of the target (0–200%) and paid in cash at the reference price of the HeidelbergCement share valid at that time, adjusted for the reinvested dividend payments and for changes in capital.
The following table shows the key figures of the plans.
Key parameters of the long-term bonus plans
Plan 2012 Plan 2013 Plan 2014 Plan 2015
Date of issuance 1 January 2012 1 January 2013 1 January 2014 1 January 2015
Term 4 years 4 years 4 years 4 years
Reference price at issuance €30,45 €41,71 €56.53 €56,05
Maximum payment amount per PSU €76,13 €104,28 €141.33 €140,13
The reconciliation of the number of PSUs from 1 January 2012 to 31 December 2015 is shown in the following table.
Number of PSUs
Plan 2012 Plan 2013 Plan 2014 Plan 2015
Granted as of 1 January 2012
Additions 216,828
Disposals -3,020
Granted as of 31 December 2012 / as of 1 January 2013 213,808
Additions 166,151
Disposals -9,818 -6,990
Granted as of 31 December 2013 / as of 1 January 2014 203,990 159,161
Additions 144,273
Disposals -5,631 -4,321 -8,746
Granted as of 31 December 2014 / as of 1 January 2015 198,359 154,840 135,527
Additions 148,853
Disposals -4,026 -6,323 -8,785 -9,382
Granted as of 31 December 2015 194,333 148,517 126,742 139,471
In the reporting year, all of the 138,197 PSUs from the 2011 plan granted as of 31 December 2014 were exercised and either settled via cash payment or lapsed due to the departure of employees.
For accounting in accordance with IFRS 2 (Share-based Payment), the fair value of the PSUs is calculated using a recognised option price model. A large number of different development paths for the HeidelbergCement share – taking into account the effects of reinvested dividends – and the benchmark indices are simulated (Monte Carlo simulation). As at the reporting date, the benchmark index DAX 30 had 10,743 points (previous year: 9,806) and the benchmark index MSCI World Construction Materials 173.3 points (previous year: 171.6). The fair value and additional valuation parameters are shown in the tables below.
203HeidelbergCement | Annual Report 2015
Consolidated income statement
Consolidated statement of comprehensive income
Consolidated statement of cash flows
Consolidated balance sheet
Consolidated statement of changes in equity
Segment reporting / Notes to the consolidated financial statements
Notes to the 2015 consolidated financial statements
Audit opinion
Responsibility statement
Con
solid
ated
fin
anci
al s
tate
men
tsA
ddit
iona
l inf
orm
atio
n
4
5

Fair value
in € Plan 2012 Plan 2013 Plan 2014 Plan 2015
Fair value as of 31 December 2012 39.51
Fair value as of 31 December 2013 53.89 55.60
Fair value as of 31 December 2014 84.85 94.64 81.13
Fair value as of 31 December 2015 130.64 150.29 144.33 130.31
Measurement parameters 31 Dec. 2012 31 Dec. 2013 31 Dec. 2014 31 Dec. 2015
Plans 2011/12
Plans 2011/12/13
Plans 2012/13/14 2)
Plans 2013/14/15 3)
Expected dividend yield 8.0% 8.0% 7.5% 7.0%
Share price at 31 December €45.83 €55.15 €58.81 €75.62
Volatility of HeidelbergCement share 1) 41% 32% 26% 25%
Volatility of MSCI World Construction Materials Index 1) 31% 23% 17% 17%
Volatility of DAX 30 Index 1) 25% 17% 16% 20%
Correlation HeidelbergCement share / MSCI World Construction Materials Index 1) 94% 95% 82% 29%
Correlation HeidelbergCement share / DAX 30 Index 1) 89% 92% 73% 91%
Correlation DAX 30 Index / MSCI World Construction Materials Index 1) 86% 95% 79% 21%
1) Average over the last two years
2) Plan 2011 valuation based on actuals 2014 year-end.
3) Plan 2012 valuation based on actuals 2015 year-end.
The total expenditure for the capital market component of the long-term bonus plan for the 2015 financial year amounted to €31.3 million (previous year: 16.2). As at the reporting date, the provisions for the capital market component totalled €58.3 million (previous year: 24.8). The capital market component of the long-term bonus plan 2012–2014/15 is paid after the Annual General Meeting 2016. The same applies to the additional current long-term bonus plans, i.e. payment takes place in the year following the four-year performance period.
5 Other operating expenses
Other operating expenses
€m 2014 2015
Selling and administrative expenses 821.6 887.7
Freight 1,343.6 1,324.8
Expenses for third party repairs and services 947.1 1,082.7
Rental and leasing expenses 205.4 246.8
Other taxes 39.5 41.3
Foreign exchange losses 37.2 66.8
Other expenses 52.7 39.1
3,447.1 3,689.2
The foreign exchange losses concern trade receivables and payables. Foreign exchange losses from current interest-bearing receivables and liabilities are shown in the financial result. Expenses of €106.9 million (previous year: 97,3) for research and development could not be capitalised.
Significant non-recurring transactions occurring in the course of ordinary business activities are reported in the additional ordinary expenses and explained in Note 8.
204 HeidelbergCement | Annual Report 2015
Consolidated financial statements4

6 Result from joint ventures
With its joint venture partners, HeidelbergCement operates numerous joint ventures worldwide. The following companies make an important contribution to the operating income of the HeidelbergCement Group.
– Cement Australia Holdings Pty Ltd, based in New South Wales, is a joint venture between HeidelbergCement and LafargeHolcim. Each partner holds 50% of the capital shares in the company. Cement Australia is the largest Australian cement manufacturer and operates two cement plants and two grinding plants in eastern and southeastern Australia as well as in Tasmania. HeidelbergCement procures its entire Australian cement demand from Cement Australia.
– Akçansa Çimento Sanayi ve Ticaret A.S., based in Istanbul, is a joint venture between HeidelbergCement and Haci Ömer Sabanci Holding A.S. HeidelbergCement and Sabanci Holding each hold 39.7% of the capital shares in Akçansa. The remaining shares are in free float. Akçansa is the largest cement manufacturer in Turkey and operates three cement plants in the north and northwest of the country as well as six grinding facilities. It also has a dense network of ready-mixed concrete production sites and manufactures aggregates.
– Texas Lehigh Cement Company LP, based in Austin, Texas, operates one cement plant in Buda, Texas, and supplies the regional market. The joint venture partners HeidelbergCement and Eagle Materials, Inc. each hold 50% of the capital shares in the company.
– Alliance Construction Materials Limited, located in Kowloon, is the leading manufacturer of concrete and aggregates in Hong Kong. HeidelbergCement and our joint venture partner Cheung Kong Infrastructure Holdings Limited each hold 50% of the capital shares in the company.
The following table shows the statement of comprehensive income for these material joint ventures (100% values):
Statement of comprehensive income for material joint ventures
Cement Australia Holdings Pty Ltd
Akçansa Çimento Sanayi ve Ticaret A.S.
Texas Lehigh Cement Company LP
Alliance Construction Materials Ltd
€m 2014 2015 2014 2015 2014 2015 2014 2015
Revenue 654.6 641.9 506.2 511.0 193.6 199.3 185.1 234.3
Depreciation and amortisation -31.6 -34.0 -22.8 -23.7 -1.8 -2.2 -3.2 -2.7
Operating income 141.2 157.6 109.4 116.8 67.7 74.0 42.0 56.7
Additional ordinary result -2.9 -0.7 2.4
Result from participations 6.1 6.6 0.0 0.0
Earnings before interest and taxes (EBIT) 138.4 156.9 115.5 123.4 67.7 74.0 44.4 56.7
Interest income 0.6 0.9 0.0 0.0 0.1 0.2
Interest expenses -16.2 -15.3 -9.4 -9.4
Other financial result 0.0 0.0 -0.6 0.2 0.0 -0.1 0.0 -0.2
Profit before tax 122.2 141.6 106.1 115.0 67.7 74.0 44.5 56.6
Income taxes -15.5 -15.9 -20.1 -21.6 -0.6 -0.7 -6.1 -9.4
Profit for the financial year 106.6 125.7 86.0 93.5 67.1 73.3 38.5 47.3
Other comprehensive income 18.4 -1.7 54.2 -28.3 7.5 9.4 6.6 1.5
Total comprehensive income 125.0 124.0 140.2 65.2 74.6 82.7 45.0 48.8
205HeidelbergCement | Annual Report 2015
Consolidated income statement
Consolidated statement of comprehensive income
Consolidated statement of cash flows
Consolidated balance sheet
Consolidated statement of changes in equity
Segment reporting / Notes to the consolidated financial statements
Notes to the 2015 consolidated financial statements
Audit opinion
Responsibility statement
Con
solid
ated
fin
anci
al s
tate
men
tsA
ddit
iona
l inf
orm
atio
n
4
5

The assets and liabilities of the material joint ventures (100% values), the reconciliation to the total carrying amount of the interest, and the dividends received by the joint ventures are shown in the following table:
Additional financial information for material joint ventures
Cement Australia Holdings Pty Ltd
Akçansa Çimento Sanayi ve Ticaret A.S.
Texas Lehigh Cement Company LP
Alliance Construction Materials Ltd
€m 2014 2015 2014 2015 2014 2015 2014 2015
Intangible assets 23.6 22.5 58.7 54.3 10.5 13.1
Property, plant and equipment 452.7 430.5 253.8 237.4 20.2 21.1 6.5 13.7
Financial assets 47.5 44.2 83.4 72.4 15.5 17.3 9.3 17.3
Other non-current assets 0.6 1.5 1.0 1.0 0.0 4.4 4.5
Total non-current assets 524.4 498.7 397.0 365.1 35.8 38.4 30.6 48.5
Cash and cash equivalents 1.4 1.2 4.7 6.9 0.6 0.4 25.9 33.3
Other current assets 173.3 167.4 171.6 172.6 55.8 66.9 47.7 49.9
Total current assets 174.7 168.6 176.3 179.5 56.3 67.3 73.5 83.2
Balance sheet total 699.1 667.3 573.3 544.6 92.1 105.6 104.2 131.7
Non-current financial liabilities 218.5 0.1 17.7 34.7 0.8
Non-current provisions 7.2 6.7 8.5 8.7 3.0 3.4
Other non-current liabilities 8.0 9.6 16.8 15.1 0.8 1.0
Total non-current liabilities 233.7 16.4 42.9 58.5 3.0 3.4 1.6 1.0
Current financial liabilities 91.4 255.8 17.1 1.0 0.5
Current provisions 9.8 9.4 3.5 2.9 0.4 1.3 0.1
Trade payables 35.7 32.3 86.1 86.4 10.4 8.4 29.1 35.5
Other current liabilities 50.0 51.7 12.0 14.1 3.5 3.9 12.5 15.5
Total current liabilities 186.9 349.3 118.7 104.3 14.3 12.3 42.9 51.6
Total liabilities 420.6 365.7 161.6 162.8 17.3 15.7 44.6 52.6
Net assets 278.5 301.7 411.7 381.8 74.8 90.0 59.6 79.1
Non-controlling interests 3.8 3.4 0.1 0.1
Net assets after non-controlling interests 278.5 301.7 407.9 378.4 74.8 90.0 59.5 79.0
Group share in % 50.0 50.0 39.7 39.7 50.0 50.0 50.0 50.0
Investments in joint ventures 139.2 150.8 162.0 150.3 37.4 45.0 29.8 39.5
Goodwill 370.1 368.0 59.2 59.2 35.1 39.0 92.1 102.6
Total carrying amount of the interest 509.3 518.8 221.2 209.5 72.4 84.0 121.8 142.1
Dividends received 42.6 51.0 19.7 32.4 29.1 33.5 11.2 17.3
The Akçansa share is listed on the stock exchange in Istanbul. As at the reporting date, the fair value of shares held by HeidelbergCement amounts to €316.3 million (previous year: 419.6).
HeidelbergCement also holds investments in individually immaterial joint ventures. The summarised financial information for these companies is shown in the following table (HeidelbergCement shareholding).
Summarised financial information for immaterial joint ventures
€m 2014 2015
Investments in immaterial joint ventures 438.0 498.4
Result from continuing operations 30.6 41.1
Net income from discontinued operations 3.3
Other comprehensive income 15.0 2.2
Total comprehensive income 48.9 43.3
Unrecognised share of losses cumulated 0.0 0.0
206 HeidelbergCement | Annual Report 2015
Consolidated financial statements4

7 Amortisation and depreciation of intangible assets and property, plant and equipment
Scheduled amortisation of intangible assets and property, plant and equipment is determined on the basis of the following Group-wide useful lives.
Useful lives
Years
Standard software 3
SAP applications 3 to 5
Buildings 20 to 40
Technical equipment and machinery 10 to 20
Plant and office equipment 5 to 10
IT hardware 4 to 5
Impairment is shown in the additional ordinary expenses and explained in Note 8.
8 Additional ordinary result
The additional ordinary result includes transactions which, although occurring in the course of ordinary business activities, are not reported in operating income as they are non-recurring.
Additional ordinary result
€m 2014 2015
Additional ordinary income
Gains from the disposal of business units and repayment of capital 25.0 49.3
Other non-recurring income 0.5 35.4
25.5 84.7
Additional ordinary expenses
Losses from the disposal of business units and repayment of capital -3.1 -6.5
Impairment of goodwill -40.9 -25.7
Impairment of other intangible assets and property, plant and equipment -17.4 -14.3
Restructuring expenses -19.4 -11.1
Other non-recurring expenses -8.1 -39.4
-88.8 -97.0
-63.3 -12.4
Additional ordinary income In the 2015 financial year, gains from the disposal of business units and the repayment of capital primarily included foreign exchange-related income in connection with the repayment of capital of a foreign holding company as well as income from the divestment of the lime activities in Germany. In the previous year, the gains essentially arose from divestments in India, Gabon, and Indonesia, as well as the revaluation of previously held shares as part of successive company acquisitions in Belgium and Iceland.
Other non-recurring income in the 2015 financial year is predominantly due to the release of a provision for compensation related to cartel proceedings.
207HeidelbergCement | Annual Report 2015
Consolidated income statement
Consolidated statement of comprehensive income
Consolidated statement of cash flows
Consolidated balance sheet
Consolidated statement of changes in equity
Segment reporting / Notes to the consolidated financial statements
Notes to the 2015 consolidated financial statements
Audit opinion
Responsibility statement
Con
solid
ated
fin
anci
al s
tate
men
tsA
ddit
iona
l inf
orm
atio
n
4
5

Additional ordinary expensesThe losses from the disposal of business units and the repayment of capital in the 2015 financial year are essen-tially due to the divestment of a blast furnace slag grinding plant in the United Kingdom. The previous year’s figure mainly included the loss from a divestment in Russia. Following the goodwill impairment test, impairment losses were recognised in the reporting year for the CGU Russia. The impairment losses of the previous year related to the CGU Ukraine. Detailed explanations on the impairment test can be found in Note 32 Intangible assets.
Impairment of other intangible assets and property, plant and equipment were recognised, particularly in connec-tion with shutdowns or closures of locations. The impairment losses related to intangible assets at €0.2 million (previous year: 4.2) and property, plant and equipment at €14.1 million (previous year 13.2). The impairment losses were incurred in the Group areas of Western and Northern Europe (€1.0 million), Eastern Europe-Central Asia (€6.7 million), North America (€4.4 million), Asia-Pacific (€0.4 million), and Africa-Mediterranean Basin (€1.8 million). Impairment losses of €11.9 million were recognised on the value in use and €2.4 million on the fair value less costs of disposal.
The restructuring expenses of €11.1 million in the financial year arose in the Group areas of Western and North-ern Europe (€6.5 million), Eastern Europe-Central Asia (€1.3 million), North America (€4.4 million), Asia-Pacific (€0.4 million), and Africa-Mediterranean Basin (€-1.5 million). In the previous year, restructuring expenses were primarily incurred in the Group areas of Western and Northern Europe and Africa-Mediterranean Basin.
Other non-recurring expenses include transaction costs, demolition costs, and expenses that cannot be assigned to any other category.
9 Result from associates
The following table shows the summarised financial information concerning the associates.
Summarised financial information of associates
€m 2014 2015
Investments in associates 273.7 254.1
Result from associates 26.7 28.7
Other comprehensive income from associates 0.6 1.1
Total comprehensive income from associates 27.3 29.8
Unrecognised share of losses of the period -0.4 -0.2
Unrecognised share of losses cumulated -8.7 -7.1
.
208 HeidelbergCement | Annual Report 2015
Consolidated financial statements4

10 Other financial result
Other financial result
€m 2014 2015
Interest balance from defined benefit pension plans -29.6 -25.9
Interest effect from the valuation of other provisions -35.7 -3.3
Valuation result of financial derivatives -37.3 -56.2
Miscellaneous other financial result -20.9 -32.8
-123.5 -118.2
Interest rate effects arising from the valuation of other provisions are explained in Note 45. The valuation result of derivative financial instruments essentially resulted from the interest component of the foreign currency derivatives.
11 Income taxes
Income taxes from continuing operations
€m 2014 2015
Current taxes -330.0 -341.6
Deferred taxes 265.4 47.1
-64.5 -294.5
The improvement in the profit before tax was mainly achieved in countries in which losses carried forward could be utilised. As a result, the current tax expense rose by only €11.7 million. Adjusted for additional tax payments and tax refunds for previous years, which amounted to €-11.5 million (previous year: -3.4), the current taxes increased by €3.6 million.
The deferred tax revenue includes expenses of €-32.0 (previous year: 96.5) resulting from the recognition and reversal of temporary differences. Deferred tax assets created in previous years for losses carried forward were impaired by €19.5 million (previous year: 6.8) during the reporting year. The reduction in the tax expense for deferred taxes as a result of tax losses not recognised in previous years amounted to €130.7 million (previous year: 209.0) in the financial year. As in the previous year, upon recognition of deferred tax assets of €531.4 million (previous year: 408.9) in the USA, which were not covered by deferred tax liabilities, the assessment regarding the recoverability of the losses and interest carried forward within the next five years was considered in accordance with the forecast income and on the basis of the tax planning. This also applies to the initial recognition of an excess deferred tax asset in Kazakhstan (€6.7 million).
Tax losses carried forward and tax credits for which no deferred tax is recognised amount to €2,621.4 million (previous year: 2,685.5). The losses carried forward both in Germany and abroad have essentially vested, but are not determined separately in all countries by official notice and are therefore partly subject to review by the financial authorities prior to utilisation. In addition, no deferred tax assets were recognised for deductible temporary differences of €17.8 million (previous year: 1.7). Overall, unrecognised deferred tax assets amounted to €649.2 million (previous year: 692.7) in the reporting year.
209HeidelbergCement | Annual Report 2015
Consolidated income statement
Consolidated statement of comprehensive income
Consolidated statement of cash flows
Consolidated balance sheet
Consolidated statement of changes in equity
Segment reporting / Notes to the consolidated financial statements
Notes to the 2015 consolidated financial statements
Audit opinion
Responsibility statement
Con
solid
ated
fin
anci
al s
tate
men
tsA
ddit
iona
l inf
orm
atio
n
4
5

In the financial year, €-5.8 million (previous year: 75.2) of deferred taxes, resulting primarily from the measure-ment of pension provisions in accordance with IAS 19 and from the measurement of financial instruments in accordance with IAS 39, were charged directly to equity. In addition, €-0.4 million (previous year: 0.7) of cur-rent taxes, likewise resulting from the measurement of financial instruments according to IAS 39, were directly recognised in equity. The deferred tax liabilities decreased by €-59.5 million (previous year: 5.4) as a result of changes in the scope of consolidation and were recognised directly in equity.
As laid down in IAS 12, deferred taxes must be recognised on the difference between the share of equity of a subsidiary captured in the consolidated balance sheet and the carrying amount for this subsidiary in the parent company’s tax accounts, if realisation is expected (outside basis differences). On the basis of the regulations for the application of IAS 12.39, deferred taxes of €24.4 million (previous year: 27.5) were recognised on planned future dividends. No deferred tax liabilities were recognised for additional outside basis differences from retained earnings of the subsidiaries of HeidelbergCement AG amounting to €8.0 billion (previous year: 6.4), as no further dividend payments are planned. In accordance with the regulations of IAS 12.87, the amount of unrecognised deferred tax liabilities was not computed.
To measure deferred taxes, a combined income tax rate of 29.46% is applied for the domestic companies. This consists of the statutory corporation tax rate of 15.0% plus the solidarity surcharge of 5.5% levied on the corporation tax to be paid, as well as an average trade tax burden of 13.64%. For 2014, the combined income tax rate was also 29.46%.
The calculation of the expected income tax expense at the domestic tax rate is carried out using the same com-bined income tax rate that is used in the calculation of deferred taxes for domestic companies.
The profit before tax of the Group companies based abroad is taxed at the applicable rate in the respective coun-try of residence. The local income tax rates range between 0% and 38.89%, thus resulting in corresponding tax rate differentials.
A weighted average tax rate is established by taking the tax rate differentials into account. The increase in this rate in comparison with the previous year is primarily due to the change in the relative weighting of the companies’ results. In line with the anticipated recovery in our mature markets, such as the USA, the weighted average tax rate is expected to rise further in the future.
Tax reconciliation of continuing operations
€m 2014 2015
Profit before tax 930.8 1,313.4
Impairment of goodwill -40.9 -25.6
Profit before tax and impairment of goodwill 971.7 1,339.0
Expected tax expense at national tax rate of 29.5% (2014: 29.5%) -286.3 -394.5
Tax rate differentials 34.7 46.2
Expected tax expense at weighted average tax rate of 26.0% (2014: 25.9%) -251.6 -348.4
Tax-free earnings (+) and non-deductible expenses (-) 20.0 17.5
Effects from loss carry forwards 202.2 111.2
Not recognised deferred tax assets -46.5 -35.4
Tax increase (-), reduction (+) for prior years 13.7 -68.5
Changes in tax rate 0.0 35.3
Others -2.2 -6.3
Income taxes -64.5 -294.5
210 HeidelbergCement | Annual Report 2015
Consolidated financial statements4
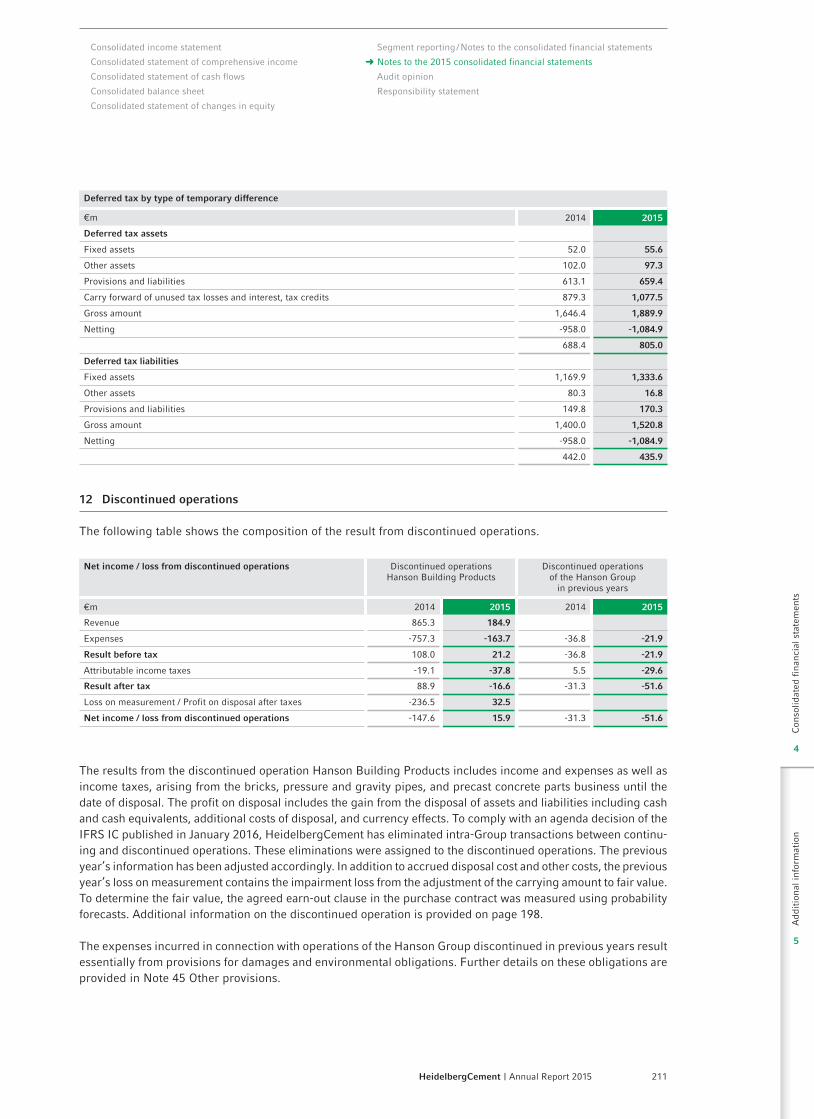
Deferred tax by type of temporary difference
€m 2014 2015
Deferred tax assets
Fixed assets 52.0 55.6
Other assets 102.0 97.3
Provisions and liabilities 613.1 659.4
Carry forward of unused tax losses and interest, tax credits 879.3 1,077.5
Gross amount 1,646.4 1,889.9
Netting -958.0 -1,084.9
688.4 805.0
Deferred tax liabilities
Fixed assets 1,169.9 1,333.6
Other assets 80.3 16.8
Provisions and liabilities 149.8 170.3
Gross amount 1,400.0 1,520.8
Netting -958.0 -1,084.9
442.0 435.9
12 Discontinued operations
The following table shows the composition of the result from discontinued operations.
Net income / loss from discontinued operations Discontinued operations Hanson Building Products
Discontinued operations of the Hanson Group
in previous years
€m 2014 2015 2014 2015
Revenue 865.3 184.9
Expenses -757.3 -163.7 -36.8 -21.9
Result before tax 108.0 21.2 -36.8 -21.9
Attributable income taxes -19.1 -37.8 5.5 -29.6
Result after tax 88.9 -16.6 -31.3 -51.6
Loss on measurement / Profit on disposal after taxes -236.5 32.5
Net income / loss from discontinued operations -147.6 15.9 -31.3 -51.6
The results from the discontinued operation Hanson Building Products includes income and expenses as well as income taxes, arising from the bricks, pressure and gravity pipes, and precast concrete parts business until the date of disposal. The profit on disposal includes the gain from the disposal of assets and liabilities including cash and cash equivalents, additional costs of disposal, and currency effects. To comply with an agenda decision of the IFRS IC published in January 2016, HeidelbergCement has eliminated intra-Group transactions between continu-ing and discontinued operations. These eliminations were assigned to the discontinued operations. The previous year’s information has been adjusted accordingly. In addition to accrued disposal cost and other costs, the previous year’s loss on measurement contains the impairment loss from the adjustment of the carrying amount to fair value. To determine the fair value, the agreed earn-out clause in the purchase contract was measured using probability forecasts. Additional information on the discontinued operation is provided on page 198.
The expenses incurred in connection with operations of the Hanson Group discontinued in previous years result essentially from provisions for damages and environmental obligations. Further details on these obligations are provided in Note 45 Other provisions.
211HeidelbergCement | Annual Report 2015
Consolidated income statement
Consolidated statement of comprehensive income
Consolidated statement of cash flows
Consolidated balance sheet
Consolidated statement of changes in equity
Segment reporting / Notes to the consolidated financial statements
Notes to the 2015 consolidated financial statements
Audit opinion
Responsibility statement
Con
solid
ated
fin
anci
al s
tate
men
tsA
ddit
iona
l inf
orm
atio
n
4
5

The attributable income taxes essentially relate to taxes for previous years.
The following overview shows the main groups of assets and liabilities of the discontinued operation Hanson Building Products as at 31 December 2014.
Assets and liabilities classified as held for sale
€mHanson Building
Products
Intangible assets 335.1
Property, plant and equipment 572.2
Other non-current assets 66.9
Inventories 202.6
Other current assets 137.3
Assets classified as held for sale 1,314.1
Pension provisions
Other non-current provisions 16.1
Non-current liabilities 24.3
Current provisions 6.1
Current liabilities 152.9
Liabilities classified as held for sale 199.4
Net assets 1,114.7
Other components of equity as at 31 December 2014 included cumulative income from currency translation of €25.8 million in connection with the discontinued operation Hanson Building Products.
13 Proposed dividend
The Managing Board and Supervisory Board propose the following dividend: €1.30 per share. Based on 187,916,477 no-par value shares entitled to participate in dividends for the 2015 financial year, the amount for dividend payment comes to €244,291,420.10.
14 Earnings per share
Earnings per share
€m 2014 2015
Profit for the financial year 687.3 983.3
Non-controlling interests 201.7 183.1
Group share of profit 485.7 800.1
Number of shares in '000s (weighted average) 187,867 187,916
Earnings per share in € 2.59 4.26
Net income from continuing operations – attributable to the parent entity 664.6 835.8
Earnings per share in € – continuing operations 3.54 4.45
Net loss from discontinued operations – attributable to the parent entity -178.9 -35.7
Loss per share in € – discontinued operations -0.95 -0.19
The basic earnings per share are calculated in accordance with IAS 33 (Earnings per Share) by dividing the Group share in profit for the financial year by the weighted average of the number of issued shares. The diluted earn-ings per share indicator takes into account not only currently issued shares but also shares potentially available through option rights. The earnings per share were not diluted in the reporting period according to IAS 33.30.
212 HeidelbergCement | Annual Report 2015
Consolidated financial statements4

Notes to the statement of cash flows
The consolidated statement of cash flows shows how the Group’s cash and cash equivalents changed through inflows and outflows during the reporting year. In accordance with IAS 7 (Statement of Cash Flows), a distinc-tion is made between cash flows from operating, investing, and financing activities. The changes in the relevant balance sheet items cannot be directly derived from the consolidated balance sheet, as they are adjusted for non-cash transactions, such as effects arising from currency translation and changes in the consolidation scope.
The cash flow is calculated as net income from continuing operations adjusted for income taxes, net interest, depreciation, amortisation, impairment losses, and other non-cash items. Cash flows from dividends received from non-consolidated companies, from interest received and paid, and from taxes paid are also recognised. Changes in working capital and utilisation of provisions are taken into account when determining the cash flow from operating activities.
Cash flows from the acquisition or sale of intangible assets as well as property, plant and equipment and finan-cial assets are recognised in the cash flow from investing activities. If these relate to the acquisition or disposal of subsidiaries or other business units (gain or loss of control), the effects on the statement of cash flows are shown in separate items.
The cash outflow from financing activities mainly results from changes in capital and dividend payments as well as proceeds from and repayments of bonds and loans. In addition, cash flows from changes in ownership interests in subsidiaries that do not result in a loss of control are classified as financing activities.
The cash flows from foreign Group companies shown in the statement are generally translated into euro using the average annual exchange rates. In contrast, cash and cash equivalents are translated using the exchange rate at year end, as in the consolidated balance sheet. The effects of exchange rate changes on cash and cash equivalents are shown separately.
The significant individual items in the statement of cash flows are explained below.
15 Dividends received
The cash inflow from dividends received relate with €162.5 million (previous year: 144.7) to joint ventures, with €16.6 million (previous year: 8.9) to associates, and with €4.2 million (previous year: 3.5) to other equity investments.
16 Interest received / Interest paid
The cash inflow from interest received decreased by €100.9 million to €91.7 million (previous year: 192.6). The decline is particularly due to special items arising from the settlement of interest rate swaps in the 2014 financial year. Interest payments decreased by €49.9 million to €583.6 million (previous year: 633.5), corresponding to the decline in net debt.
17 Income taxes paid
This item includes payments relating to income taxes amounting to €353.1 million (previous year: 315.0).
213HeidelbergCement | Annual Report 2015
Consolidated income statement
Consolidated statement of comprehensive income
Consolidated statement of cash flows
Consolidated balance sheet
Consolidated statement of changes in equity
Segment reporting / Notes to the consolidated financial statements
Notes to the 2015 consolidated financial statements
Audit opinion
Responsibility statement
Con
solid
ated
fin
anci
al s
tate
men
tsA
ddit
iona
l inf
orm
atio
n
4
5
18 Elimination of other non-cash items
The other non-cash items include non-cash expenses and income, such as additions to and releases of provi-sions, results from participations accounted for using the equity method, non-cash effects from foreign currency translation, as well as impairment losses and reversals of impairment losses of current assets. Furthermore, the results were adjusted for the book profits and losses from fixed asset disposals. The total amount earned from these fixed asset disposals is shown under divestments in investing activities.
19 Changes in operating assets
Operating assets consist of inventories, trade receivables, and other assets used in operating activities.
20 Changes in operating liabilities
Operating liabilities include trade payables and other liabilities from operating activities.
21 Decrease in provisions through cash payments
This item includes the cash outflow of pension provisions and other provisions.
22 Cash flow from discontinued operations
The cash flow from discontinued operations includes cash flows related to the discontinued operation Hanson Building Products. The positive cash inflow from investing activities of discontinued operations of €1,245.1 million (previous year: cash outflow of 13.8) is attributable to the disposal price of the Hanson Building Products business amounting to €1,265.1 million after deduction of disposed cash and cash equivalents and ongoing capital spending in the first quarter of 2015.
23 Investments (cash outflow)
The payments for investments differ from additions in the fixed-asset movement schedule, which shows, for in-stance, non-cash items as additions, e.g. additions in connection with barter transactions or contributions in kind.
Of the total cash flow investments of €1,001.8 million (previous year: 1,124.6), €538.5 million (previous year: 489.3) related to investments to sustain and optimise capacity and €463.3 million (previous year: 635.3) to capacity expansions.
Investments in intangible assets and property, plant and equipment amounted to €907.7 million (previous year: 941.2) and concerned maintenance, optimisation, and environmental protection measures at our production sites, as well as expansion projects in growth markets.
Payments for the acquisition of subsidiaries and other business units amounted to €64.7 million (previous year: 148.6). Further details of the acquisitions can be found on page 194 f. Cash and cash equivalents amounting to €17.7 million were acquired in connection with the investments in subsidiaries and other business units.
214 HeidelbergCement | Annual Report 2015
Consolidated financial statements4

The investments in financial assets, associates, and joint ventures totalled €29.3 million (previous year: 34.8).
24 Divestments (cash inflow)
The cash inflow from the disposal of subsidiaries and other business units amounted to €77.2 million (previous year: 23.3). Detailed explanations on the divestments are provided on page 197 f.
Proceeds from the disposal of other fixed assets amounting to €151.6 million (previous year: 120.5) include proceeds from the disposal of intangible assets and property, plant and equipment totalling €94.0 million (pre-vious year: 88.5). The remaining payments received of €57.6 million (previous year: 32.0) primarily apply to disposals of financial assets and the repayment of loans.
25 Cash from changes in consolidation scope
This line shows the change in cash and cash equivalents in connection with a gain or loss of control over sub-sidiaries and other business units and with other changes in the consolidation scope.
26 Dividend payments to non-controlling shareholders
This item shows dividends paid to non-controlling shareholders during the financial year.
27 Increase in ownership interests in subsidiaries
This item shows cash flows from the increase of ownership interests in subsidiaries.
28 Proceeds from bond issuance and loans
This item primarily includes drawings of the syndicated credit line concluded in the 2014 financial year.
In the previous year, this item primarily included the issue of two new bonds payable with a nominal value of €500 million and of US$75 million.
29 Repayment of bonds and loans
This item includes the scheduled repayments of financial liabilities. In 2015, two bonds of €650 million each were repaid. The first repayment took place in August and the second in December. Furthermore, various re-payments were made under the EMTN programme.
In the previous year, the €1 billion bond was repaid on schedule in October, as were various drawings under the EMTN programme and debt certificates.
30 Changes in short-term interest-bearing liabilities
This line shows the balance from proceeds and payments for items with a high turnover rate, large amounts, and short terms from financing activities.
215HeidelbergCement | Annual Report 2015
Consolidated income statement
Consolidated statement of comprehensive income
Consolidated statement of cash flows
Consolidated balance sheet
Consolidated statement of changes in equity
Segment reporting / Notes to the consolidated financial statements
Notes to the 2015 consolidated financial statements
Audit opinion
Responsibility statement
Con
solid
ated
fin
anci
al s
tate
men
tsA
ddit
iona
l inf
orm
atio
n
4
5

31 Cash and cash equivalents
Cash and cash equivalents with a remaining term of less than three months are included. Of this item, €12.4 million (previous year: 8.7) is not available for use by HeidelbergCement. This relates to short-term cash deposits at banks that were placed as security for various business transactions – such as outstanding recul-tivation payments or in connection with energy trading – as well as cash and cash equivalents in Ukraine that are only partially accessible.
216 HeidelbergCement | Annual Report 2015
Consolidated financial statements4

Notes to the balance sheet – Assets
32 Intangible assets
Intangible assets
€mGoodwill Other intangible
assetsTotal
Cost
1 January 2014 10,766.4 526.7 11,293.1
Currency translation 686.7 20.5 707.1
Change in consolidation scope 86.4 14.6 101.0
Additions 19.4 19.4
Disposals -3.6 -3.6
Reclassifications 27.6 27.6
Reclassifications to current assets -474.1 -30.2 -504.3
31 December 2014 11,065.4 574.9 11,640.3
Amortisation and impairment
1 January 2014 1,361.7 283.2 1,644.9
Currency translation 58.8 16.4 75.2
Change in consolidation scope -0.6 -0.5 -1.1
Additions 26.9 26.9
Impairment 40.9 4.2 45.1
Disposals -2.1 -2.1
Reclassifications 1.8 1.8
Reclassifications to current assets -14.9 -14.9
31 December 2014 1,460.8 315.0 1,775.8
Carrying amount at 31 December 2014 9,604.6 259.9 9,864.5
Cost
1 January 2015 11,065.4 574.9 11,640.3
Currency translation 596.1 9.1 605.2
Change in consolidation scope 96.4 3.6 100.0
Additions 23.5 23.5
Disposals -7.0 -7.0
Reclassifications 5.1 5.1
Reclassifications to current assets -22.9 2.2 -20.7
31 December 2015 11,735.1 611.4 12,346.5
Amortisation and impairment
1 January 2015 1,460.8 315.0 1,775.8
Currency translation 67.9 11.8 79.6
Additions 29.6 29.6
Impairment 25.7 0.1 25.9
Disposals -3.4 -3.4
Reclassifications -0.5 -0.5
Reclassifications to current assets 0.7 0.7
31 December 2015 1,554.4 353.3 1,907.8
Carrying amount at 31 December 2015 10,180.6 258.1 10,438.8
217HeidelbergCement | Annual Report 2015
Consolidated income statement
Consolidated statement of comprehensive income
Consolidated statement of cash flows
Consolidated balance sheet
Consolidated statement of changes in equity
Segment reporting / Notes to the consolidated financial statements
Notes to the 2015 consolidated financial statements
Audit opinion
Responsibility statement
Con
solid
ated
fin
anci
al s
tate
men
tsA
ddit
iona
l inf
orm
atio
n
4
5

Goodwill Larger individual items of goodwill are connected with the acquisition of the Hanson Group, London, United Kingdom; S.A. Cimenteries CBR, Brussels, Belgium; Lehigh Hanson, Inc., Wilmington, USA; HeidelbergCement Northern Europe AB, Stockholm, Sweden; and ENCI N.V., ’s-Hertogenbosch, Netherlands. Goodwill comprises acquired market shares and synergy effects that cannot be assigned to any other determinable and separable intangible asset.
Goodwill impairment tests are carried out annually in accordance with IAS 36 (Impairment of Assets). The re-coverable amount was determined based on value in use, taking into account the following parameters.
Cash flow estimates extend over a five-year planning period, after which a terminal value is applied. A three-year detailed bottom-up operational plan approved by management forms the basis for these estimates. This is generally complemented by a top-down plan for an additional two years, which incorporates medium-term expectations of the management based on estimates of market volume, market shares, as well as cost and price development. As a general rule, the top-down plan is derived by applying growth rates to the detailed three-year operational plan. A detailed plan is created for all CGUs operating in unstable markets. This applies especially to those markets in which demand for building materials and building products, as well as the price level, have decreased substantially due to the financial and economic crisis, current political unrest, and the low oil price. It is generally assumed that demand and prices in these markets will recover. As the recovery in Europe is ex-pected to be slow as a result of the financial and economic crisis, the planned level of demand and prices in the affected CGUs at the end of the planning period are partly significantly below the pre-crisis levels. A sustained increase in demand, which will remain moderate, is also anticipated for other CGU, such as Australia and North America. The sales volumes derived thereof are generally based on the assumption of constant market shares. The underlying development of the price level varies by CGU.
Variable costs are assumed to evolve in line with the projected development of sales volumes and prices. As a rule, it is expected that the contribution margin in per cent of revenue remains on a stable level. With increasing sales volumes, this leads partially to a significant improvement in the operating margin. Furthermore, it was assumed that the savings achieved through cost reduction programmes (“CLIMB Ops” and “LEO”), as well as the initiatives to increase prices (“PERFORM” and “CLIMB Commercial”), would have a positive influence on the operating margins.
The projections for the estimated growth rates of the terminal value are based on country-specific long-term inflation rates.
The WACC rates for the Group were calculated using a two-phase approach. A phase one WACC rate was used to discount the cash flows for the first five years and a phase two WACC discount rate was applied for the deter-mination of the terminal value. The difference between the two WACC rates merely results from the downward adjustment for the perpetual growth rate in phase two. The credit spread was derived from the rating of the homogenous peer group. The peer group is subject to an annual review and adjusted, if necessary.
The following key assumptions were applied in the determination of the recoverable amount based on the value in use for the CGU.
218 HeidelbergCement | Annual Report 2015
Consolidated financial statements4

Assumptions made in the calculation of impairment of goodwill
Group area / CGU 1) Carrying amount of goodwill in €m
Weighted average cost of capital after taxes 2)
Perpetual growth rate
31 Dec. 2014 31 Dec. 2015 31 Dec. 2014 31 Dec. 2015 31 Dec. 2014 31 Dec. 2015
Western and Northern Europe 3,034.2 3,195.6 5.6% - 7.8% 6.0% - 8.1% 1.7% - 2.2% 1.7% - 2.2%
Benelux 596.0 596.9 5.8% 6.3% 1.9% 1.9%
United Kingdom 1,787.6 1,866.4 6.9% 7.6% 2.1% 2.2%
Eastern Europe-Central Asia 517.7 464.4 6.1% - 21.8% 6.3% - 15.5% 2.0% - 5.5% 2.0% - 5.5%
Kazakhstan 91.8 58.5 11.6% 12.5% 5.5% 5.5%
Russia 25.7 0.0 17.8% 15.5% 3.5% 3.5%
Ukraine 0.0 - 21.8% - 5.5% -
North America 4,455.9 4,925.7 7.3% 7.3% 2.1% 2.1%
Asia-Pacific 1,376.1 1,360.9 4.7% - 12.9% 5.3% - 14.4% 0.8% - 6.1% 0.8% - 5.0%
Australia 1,031.9 1,025.9 7.9% 7.8% 2.5% 2.5%
Africa-Mediterranean Basin 186.6 198.9 7.4% - 15.9% 7.7% - 20.6% 2.1% - 5.5% 2.1% - 7.0%
Group Services 34.2 35.2 5.6% 6.0% 1.9% 1.9%
Total 9,604.6 10,180.6
1) CGU = Cash-generating unit
2) Stated figure is the phase one WACC, before adjustment for growth. The second phase WACC, used to calculate the terminal value, is equal to the phase one WACC after adjustment for growth.
As a result of the impairment testing procedures performed, the Group recognised a total impairment of good-will of €25.7 million. This impairment relates to the CGU Russia, where in accordance with the value-in-use method, as described above, the carrying amount exceeded the recoverable amount of €335.1 million. The impairment mainly resulted from a significantly lower development of results.
In the previous year, impairment of goodwill in Ukraine totalled €40.9 million, because the carrying amount exceeded the recoverable amount of €117.5 million.
For the CGUs Benelux and United Kingdom, marginal changes in the sustainable growth rate or in the oper-ational planning as the basis for cash flow estimates or the weighted average cost of capital could cause the carrying amount to exceed the recoverable amount. Management does not rule out such a development. With a reduction of the growth rate by 0.1 percentage points for the CGU Benelux and 0.5 percentage points for the CGU United Kingdom, the recoverable amount corresponds to the respective carrying amount. A decline in the planned results (EBIT) for each year of planning as well as a decline in the terminal value by around one per cent for the CGU Benelux and around six per cent for the CGU United Kingdom, respectively, result in the carrying amount and the recoverable amount being equal. With an increase in the weighted average cost of capital of around 0.1 percentage points for the CGU Benelux and 0.3 percentage points for the CGU United Kingdom, the recoverable amount corresponds to the respective carrying amount.
Without the aforementioned changes, the recoverable amount exceeds the carrying amount of the CGU Ben-elux by €10.3 million and of the CGU United Kingdom by €172.4 million on the reporting date.
With a reduction of 1.0 percentage points in the growth rate, a WACC increase of 0.6 percentage points, or a decline of 9.0% in the planned result (EBIT) for each year of planning as well as in the terminal value, the recoverable amount for all other CGU continues to lie above the carrying amount.
219HeidelbergCement | Annual Report 2015
Consolidated income statement
Consolidated statement of comprehensive income
Consolidated statement of cash flows
Consolidated balance sheet
Consolidated statement of changes in equity
Segment reporting / Notes to the consolidated financial statements
Notes to the 2015 consolidated financial statements
Audit opinion
Responsibility statement
Con
solid
ated
fin
anci
al s
tate
men
tsA
ddit
iona
l inf
orm
atio
n
4
5

Other intangible assetsQuarrying rights, concessions, and software, in particular, are shown under other intangible assets.
Development costs of €0.9 million (previous year: 2.3) were capitalised as intangible assets in the financial year. The carrying amount of intangible assets pledged as security amounts to €43.2 million (previous year: 43.2).
220 HeidelbergCement | Annual Report 2015
Consolidated financial statements4

33 Property, plant and equipment
Property, plant and equipment
€m
Land and buildings
Plant and machinery
Other operating equipment
Prepayments and assets
under construction
Total
Cost
1 January 2014 7,080.8 9,927.3 922.4 813.9 18,744.3
Currency translation 301.0 278.5 4.4 18.4 602.2
Change in consolidation scope 34.2 -16.7 2.3 -1.9 18.0
Additions 88.7 115.2 25.1 704.0 933.0
Disposals -80.2 -173.5 -55.8 -0.1 -309.5
Reclassifications 195.7 419.2 35.9 -678.4 -27.6
Reclassifications to current assets -404.9 -577.7 -11.0 -7.6 -1,001.2
31 December 2014 7,215.4 9,972.2 923.3 848.3 18,959.1
Depreciation and impairment
1 January 2014 2,395.6 6,215.2 638.3 1.6 9,250.8
Currency translation 54.9 177.8 10.4 243.1
Change in consolidation scope -15.8 -45.8 -4.8 -1.6 -68.0
Additions 152.4 455.7 57.9 666.0
Impairment 5.9 7.0 0.3 13.2
Reversal of impairment -0.5 -0.5
Disposals -41.5 -159.4 -53.5 -254.3
Reclassifications -0.7 -0.6 -0.5 -1.8
Reclassifications to current assets -100.8 -272.4 -9.3 -382.5
31 December 2014 2,450.1 6,376.9 638.9 9,466.0
Carrying amount at 31 December 2014 4,765.3 3,595.3 284.3 848.3 9,493.2
Cost
1 January 2015 7,215.4 9,972.2 923.3 848.3 18,959.1
Currency translation 220.3 250.7 -13.0 -10.8 447.3
Change in consolidation scope 39.3 31.7 3.1 2.1 76.1
Additions 54.4 72.7 26.7 728.1 881.9
Disposals -69.5 -113.6 -55.1 -0.5 -238.7
Reclassifications 165.8 400.3 66.5 -637.7 -5.1
Reclassifications to current assets -0.6 -0.2 -6.1 0.3 -6.5
31 December 2015 7,625.1 10,613.9 945.4 929.7 20,114.1
Depreciation and impairment
1 January 2015 2,450.1 6,376.9 638.9 9,466.0
Currency translation 40.2 168.1 2.5 210.7
Additions 178.2 495.3 63.5 737.0
Impairment 3.2 9.9 1.1 14.1
Disposals -38.4 -95.9 -48.1 -182.4
Reclassifications -5.1 -12.0 17.6 0.5
Reclassifications to current assets -0.4 -0.2 -2.3 -3.0
31 December 2015 2,627.8 6,941.9 673.2 10,243.0
Carrying amount at 31 December 2015 4,997.3 3,671.9 272.2 929.7 9,871.2
221HeidelbergCement | Annual Report 2015
Consolidated income statement
Consolidated statement of comprehensive income
Consolidated statement of cash flows
Consolidated balance sheet
Consolidated statement of changes in equity
Segment reporting / Notes to the consolidated financial statements
Notes to the 2015 consolidated financial statements
Audit opinion
Responsibility statement
Con
solid
ated
fin
anci
al s
tate
men
tsA
ddit
iona
l inf
orm
atio
n
4
5

Property, plant and equipment includes €13.8 million (previous year: 21.6) of capitalised lease assets, of which €10.6 million (previous year: 18.2) relates to plant and machinery and €3.2 million (previous year: 3.3) to plant and office equipment.
The carrying amount of property, plant and equipment pledged as security amounts to €5.1 million (previous year: 10.8).
Borrowing costs of €1.6 million (previous year: 2.3) were recognised. The average capitalisation rate applied was 7% (previous year: 4%).
In the reporting year, impairment losses of €14.1 million were recognised; these are shown in the additional ordinary result and explained in Note 8.
34 Financial investments
This item includes investments in equity instruments acquired on the basis of long-term investment planning. They are classified in accordance with IAS 39 as financial investments available for sale at cost.
35 Non-current receivables and derivative financial instruments
The following table shows the composition of the non-current receivables and derivative financial instruments.
Non-current receivables and derivative financial instruments
€m 2014 2015
Loans 97.6 29.7
Derivative financial instruments 31.7 26.3
Other non-current operating receivables 312.4 332.3
Other non-current non-financial receivables 303.9 378.3
745.6 766.6
The non-current derivative financial instruments relate to currency swaps and cross-currency interest rate swaps. Because of the separation into current and non-current components, the fair values were shown on both the assets side as well as the equity and liabilities side. Additional information on the derivative financial instruments is provided on page 245 f. Other non-current operating receivables include claims for reimbursement against insurance companies for environmental and third-party liability damages amounting to €298.7 million (previous year: 276.4). The other non-current non-financial receivables primarily include overfunding of pension funds as well as prepaid expenses.
The following table shows the due term structure of the non-current financial receivables.
Due terms of non-current financial receivables Loans Other non-current operating receivables
Total
€m 2014 2015 2014 2015 2014 2015
Not impaired, not overdue 97.6 29.7 312.3 332.2 409.9 361.9
Not impaired, overdue 1 − 60 days 0.1 0.1 0.1 0.1
97.6 29.7 312.4 332.3 410.0 362.0
As at the reporting date, there are no indications that the debtors of the receivables shown as not impaired and not overdue will not meet their payment obligations.
222 HeidelbergCement | Annual Report 2015
Consolidated financial statements4

36 Inventories
In the reporting year, impairments of inventories of €12.7 million (previous year: 15.0) and reversals of impair-ment losses of €6.4 million (previous year: 9.8) were recognised.
37 Receivables and other assets
The following overview shows the composition of the other current operating receivables.
Other current operating receivables
€m 2014 2015
Miscellaneous current operating receivables 248.1 281.0
Non-financial other assets 105.8 114.5
353.9 395.5
The miscellaneous current operating receivables include claims for damages and claims for reimbursement against insurance companies for environmental and third-party liability damages amounting to €72.4 million (previous year: 73.1), as well as the contingent purchase price receivable from the disposal of the Hanson Building Products business of €46.0 million (previous year: 45.0). The carrying amount for the reserve account covering credit losses of pre-financed trade receivables, which is reported in the cash and cash equivalents, amounts to €16.2 million (previous year: 15.4) and substantially represents the maximum exposure to loss from the continuing involvement to the amount of €19.2 million (previous year: 18.4). Non-financial other assets essentially include prepaid expenses.
The following table shows the due term structure of the current financial receivables.
Due terms of current financial receivables Current interest-bearing
receivables
Trade receivables
Miscellaneous current operating
receivables
Total
€m 2014 2015 2014 2015 2014 2015 2014 2015
Not impaired, not overdue 114.1 168.6 714.3 870.3 244.1 274.7 1,072.5 1,313.6
Not impaired, overdue 1 − 60 days 267.6 268.5 2.8 4.3 270.4 272.8
Not impaired, overdue 61 − 360 days 52.3 58.9 1.0 0.8 53.3 59.7
Not impaired, overdue > 360 days 0.1 0.1 11.0 9.8 0.1 0.1 11.2 10.0
Impaired 1.1 12.1 7.1 0.1 1.1 13.3 8.2
115.3 168.7 1,057.2 1,214.6 248.1 281.0 1,420.6 1,664.3
As at the reporting date, there are no indications that the debtors of the receivables shown as not impaired and not overdue will not meet their payment obligations.
223HeidelbergCement | Annual Report 2015
Consolidated income statement
Consolidated statement of comprehensive income
Consolidated statement of cash flows
Consolidated balance sheet
Consolidated statement of changes in equity
Segment reporting / Notes to the consolidated financial statements
Notes to the 2015 consolidated financial statements
Audit opinion
Responsibility statement
Con
solid
ated
fin
anci
al s
tate
men
tsA
ddit
iona
l inf
orm
atio
n
4
5

The valuation allowances on trade receivables have developed as follows:
Valuation allowances on trade receivables
€m 2014 2015
Valuation allowances at 1 January 73.7 69.2
Additions 21.7 11.9
Reversal and use -24.8 -10.3
Currency translation and other adjustments -1.4 1.6
Valuation allowances at 31 December 69.2 72.4
The valuation allowances are essentially based on historical default probabilities and due terms. They primarily relate to collective specific valuation allowances.
38 Derivative financial instruments
The short-term derivatives with positive fair values primarily include foreign exchange swaps of €49.0 million (previous year: 34.0), cross-currency interest rate swaps of €24.7 million (previous year: 0.0), and interest rate swaps of €1.2 million (previous year: 2.9). Additional information on the derivative financial instruments is provided on page 245 f.
Notes to the balance sheet – Equity and liabilities
39 Subscribed share capital
As at the reporting date of 31 December 2015, the subscribed share capital amounts to €563,749,431, unchanged from the previous year. It is divided into 187,916,477 shares; the shares are no-par value bearer shares. The pro rata amount of each share is €3.00, which corresponds to a proportionate amount of the subscribed share capital.
Authorised CapitalAs at 31 December 2015, there were two authorised capitals: namely, authorisation of the Managing Board and Supervisory Board to increase the capital by issuing new shares in return for cash contributions (Authorised Capital I), and authorisation of the Managing Board and Supervisory Board to increase the capital by issuing new shares in return for contributions in kind (Authorised Capital II). The authorised capitals are summarized below; the complete text of the authorisations can be found in the Articles of Association, which are published on our website www.heidelbergcement.com under “Company/Corporate Governance/Articles of Association”.
Authorised Capital IThe Annual General Meeting held on 7 May 2015 authorised the Managing Board, with the consent of the Su-pervisory Board, to increase the Company’s subscribed share capital by a total amount of up to €225,000,000 by issuing up to 75,000,000 new no-par value bearer shares in total in return for cash contributions on one or more occasions until 6 May 2020 (Authorised Capital I). The shareholders must be granted subscription rights. However, the Managing Board is authorised, in certain cases described in more detail in the authorisation, to exclude the subscription rights of shareholders in order to realise residual amounts, to service option or con-version rights, or to issue shares totalling up to 10% of the subscribed share capital at a near-market price. As at 31 December 2015, the authorisation to issue new shares in return for cash contributions forming the basis of the Authorised Capital I had not been used.
224 HeidelbergCement | Annual Report 2015
Consolidated financial statements4

Authorised Capital IIFurthermore, the Annual General Meeting of 7 May 2015 authorised the Managing Board, with the consent of the Supervisory Board, to increase the Company’s subscribed share capital by a total amount of up to €56,374,941 by issuing up to 18,791,647 new no-par value bearer shares in total against contributions in kind on one or more occasions until 6 May 2020 (Authorised Capital II). The subscription right of shareholders is generally excluded in the case of capital increases in return for contributions in kind. The authorisation governs, in particular, the possibility of excluding the subscription right insofar as the capital increase in return for contributions in kind is performed for the purposes of acquisition of companies or to service option or conversion rights or in the context of implementing a dividend in kind/dividend option. As at 31 December 2015, the authorisation to issue new shares in return for contributions in kind forming the basis of the Authorised Capital II had not been used.
Conditional Share CapitalThe conditional share capital described below existed as at 31 December 2015. The Annual General Meeting of 8 May 2013 decided to conditionally increase the subscribed share capital by a further amount of up to €168,000,000, divided into up to 56,000,000 new no-par value bearer shares (Conditional Share capital 2013). The conditional capital increase serves to back the issuance of option or conversion rights, or option or conver-sion obligations, on HeidelbergCement shares. The conditional capital increase is only carried out insofar as the Managing Board issues warrant or convertible bonds under the authorisation until 7 May 2018 and the bearers of option or conversion rights make use of their rights. Warrant or convertible bonds may also be issued with option or conversion obligations. The shareholders generally have a subscription right to newly issued warrant or convertible bonds. The authorisation governs specific cases in which the Managing Board may exclude the subscription right of shareholders to warrant or convertible bonds. The complete text of the conditional share capital can also be found in the Articles of Association, which are published on our website (www.heidelberg-cement.com under “Company/Corporate Governance/Articles of Association”). As at 31 December 2015, the authorisation to issue warrant or convertible bonds forming the basis of the Conditional Share Capital 2013 had not been used.
A corresponding volume limit as well as the deduction clauses ensure that the sum of all exclusions of sub-scription rights in the two existing Authorised Capitals and the Conditional Share Capital 2013 will not exceed a limit of 20% of the subscribed share capital existing at the time the authorisation to exclude the subscription right comes into force.
As at the reporting date of 31 December 2015, the Company has no treasury shares and there is no authorization to acquire treasury shares.
40 Share premium
The share premium of €5,539.4 million is unchanged from the previous year. It was essentially created from the premium from capital increases.
225HeidelbergCement | Annual Report 2015
Consolidated income statement
Consolidated statement of comprehensive income
Consolidated statement of cash flows
Consolidated balance sheet
Consolidated statement of changes in equity
Segment reporting / Notes to the consolidated financial statements
Notes to the 2015 consolidated financial statements
Audit opinion
Responsibility statement
Con
solid
ated
fin
anci
al s
tate
men
tsA
ddit
iona
l inf
orm
atio
n
4
5
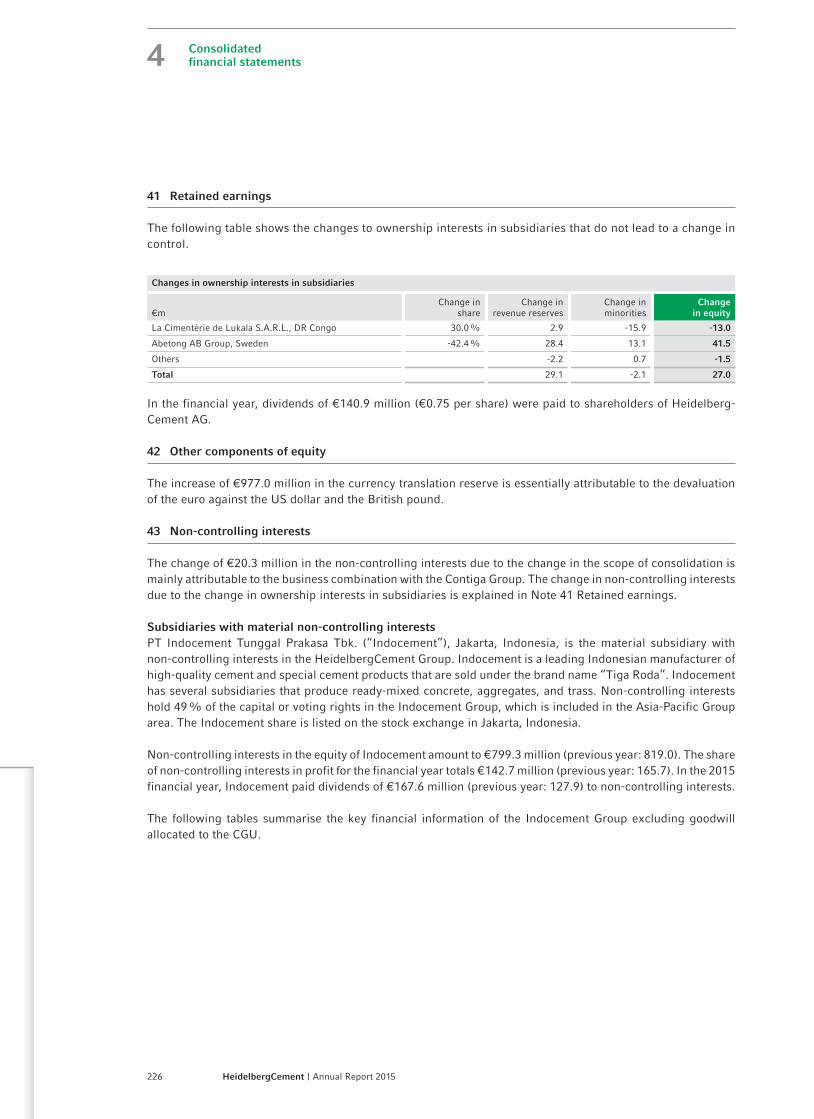
41 Retained earnings
The following table shows the changes to ownership interests in subsidiaries that do not lead to a change in control.
Changes in ownership interests in subsidiaries
€mChange in
shareChange in
revenue reservesChange in minorities
Change in equity
La Cimentérie de Lukala S.A.R.L., DR Congo 30.0% 2.9 -15.9 -13.0
Abetong AB Group, Sweden -42.4% 28.4 13.1 41.5
Others -2.2 0.7 -1.5
Total 29.1 -2.1 27.0
In the financial year, dividends of €140.9 million (€0.75 per share) were paid to shareholders of Heidelberg-Cement AG.
42 Other components of equity
The increase of €977.0 million in the currency translation reserve is essentially attributable to the devaluation of the euro against the US dollar and the British pound.
43 Non-controlling interests
The change of €20.3 million in the non-controlling interests due to the change in the scope of consolidation is mainly attributable to the business combination with the Contiga Group. The change in non-controlling interests due to the change in ownership interests in subsidiaries is explained in Note 41 Retained earnings.
Subsidiaries with material non-controlling interestsPT Indocement Tunggal Prakasa Tbk. (“Indocement”), Jakarta, Indonesia, is the material subsidiary with non-controlling interests in the HeidelbergCement Group. Indocement is a leading Indonesian manufacturer of high-quality cement and special cement products that are sold under the brand name “Tiga Roda”. Indocement has several subsidiaries that produce ready-mixed concrete, aggregates, and trass. Non-controlling interests hold 49% of the capital or voting rights in the Indocement Group, which is included in the Asia-Pacific Group area. The Indocement share is listed on the stock exchange in Jakarta, Indonesia.
Non-controlling interests in the equity of Indocement amount to €799.3 million (previous year: 819.0). The share of non-controlling interests in profit for the financial year totals €142.7 million (previous year: 165.7). In the 2015 financial year, Indocement paid dividends of €167.6 million (previous year: 127.9) to non-controlling interests.
The following tables summarise the key financial information of the Indocement Group excluding goodwill allocated to the CGU.
226 HeidelbergCement | Annual Report 2015
Consolidated financial statements4

Statement of comprehensive income Indocement Group
€m 2014 2015
Revenue 1,266.6 1,191.2
Depreciation and amortisation -52.3 -60.8
Operating income 384.5 340.4
Additional ordinary result 1.1 -0.3
Result from participations 1.6 1.7
Earnings before interest and taxes (EBIT) 387.1 341.8
Interest income 64.3 49.3
Interest expenses -0.9 -0.7
Other financial income and expenses -2.2 -3.5
Profit before tax 448.2 386.9
Income taxes -110.3 -95.7
Profit for the period 337.9 291.2
Other comprehensive income 202.9 39.3
Total comprehensive income 540.8 330.5
Assets and liabilities Indocement Group
€m 2014 2015
Intangible assets 1.1 1.1
Property, plant and equipment 876.8 993.9
Financial assets 7.2 6.9
Other non-current assets 9.5 12.2
Non-current assets 894.6 1,014.0
Cash and cash equivalents 747.9 577.7
Other current assets 312.2 291.4
Current assets 1,060.1 869.1
Total assets 1,954.7 1,883.1
Non-current financial liabilities 5.1 4.1
Non-current provisions 44.2 44.1
Other non-current liabilities 28.5 28.7
Non-current liabilities 77.8 76.9
Current financial liabilities 3.5 4.4
Current provisions 4.8 4.4
Trade payables 152.2 120.4
Other current liabilities 59.0 59.7
Current liabilities 219.5 189.0
Total liabilities 297.2 265.9
44 Pension provisions
Defined contribution plansThe sum of all pension expenses in connection with defined contribution plans amounted to €63.4 million (previous year: 49.4). In the 2015 financial year, the contributions to the social security programmes came to €58.5 million (previous year: 54.4).
Actuarial assumptionsThe actuarial assumptions on which the calculations are based are summarised in the following table (weighted presentation).
227HeidelbergCement | Annual Report 2015
Consolidated income statement
Consolidated statement of comprehensive income
Consolidated statement of cash flows
Consolidated balance sheet
Consolidated statement of changes in equity
Segment reporting / Notes to the consolidated financial statements
Notes to the 2015 consolidated financial statements
Audit opinion
Responsibility statement
Con
solid
ated
fin
anci
al s
tate
men
tsA
ddit
iona
l inf
orm
atio
n
4
5

Actuarial assumptions
in % Group North America UK Germany
31 December 2015
Discount rate 3.93% 4.58% 3.80% 2.40%
Pension increase rate 2.58% - 2.72% 1.75%
Expected increase in health care costs 6.95% 7.50% - 5.00% 9.00% -
31 December 2014
Discount rate 3.63% 4.21% 3.60% 2.00%
Pension increase rate 2.50% - 2.64% 1.75%
Expected increase in health care costs 7.40% 8.00% - 5.00% 9.95% -
The RP-2014 mortality tables published by the Society of Actuaries in 2014 were used in the valuations for the pension plans in the USA. For the Canadian pension plans, the CPM 2014 mortality tables were used. In the United Kingdom, different mortality tables based on the “S1” series have been taken into account. The mortality tables in the United Kingdom, the USA, and Canada have been modified to consider future improvements in life expectancy and in many cases are additionally adjusted based on company-specific experience. In Germany, the “2005 G Richttafeln” from Prof. Dr. Klaus Heubeck have been applied.
Overview of provisions for pensions for the different types of retirement benefit plansThe following tables show the obligations from defined benefit pension plans, including other long-term employee benefits plans and plans for health care costs, and their presentation in the balance sheet.
Types of post-employment benefit plans
€m Group North America UK Germany
31 December 2015
Defined benefit pension plans 543.3 282.6 -311.6 415.7
Plans for health care costs 183.5 149.5 4.7
726.8 432.1 -306.9 415.7
31 December 2014
Defined benefit pension plans 680.7 256.4 -204.9 445.2
Plans for health care costs 209.8 170.6 7.1
890.5 427.0 -197.8 445.2
Presentation in the balance sheet
€m Group North America UK Germany
31 December 2015
Non-current pension provisions 974.2 394.1 12.7 395.4
Current pension provisions 91.3 38.0 14.0 20.3
Other long-term operating receivables (overfunding of pension schemes) -338.7 -333.6
726.8 432.1 -306.9 415.7
31 December 2014
Non-current pension provisions 1,067.6 389.4 57.9 424.5
Current pension provisions 97.2 37.6 12.8 20.7
Other long-term operating receivables (overfunding of pension schemes) -274.3 -268.5
890.5 427.0 -197.8 445.2
228 HeidelbergCement | Annual Report 2015
Consolidated financial statements4

With regard to the overfunded pension plans in the United Kingdom for which an asset ceiling has not been applied, HeidelbergCement has the unconditional entitlement to the pension plan surplus if the plan is wound up.
In the following, a breakdown of the amounts relating to pension plans is shown exclusively for the three key Group areas and countries North America, the United Kingdom, and Germany. A breakdown of the amounts relating to plans for health care costs is not provided, as the vast majority of the liabilities and expenses are in North America.
Pension obligations and pension fundsIn 2015, pension obligations amounting to €4,530.0 million (previous year: 4,479.6) existed in the Group, which were essentially covered by outside pension funds. In addition, there were direct agreements of €615.5 million (previous year: 663.9). Obligations in the USA, Belgium, Canada, the United Kingdom, Indonesia, and Ghana for health care costs of pension recipients amounted to €183.5 million (previous year: 209.8). The following table shows the financing status of these plans and their presentation in the balance sheet.
Pension obligations and plan assets Pension plans and plans for health care costs
thereof pension plans
€m
Pension plans
Plans for health care
costs
Group North America
UK Germany
31 December 2015
Present value of funded obligations 4,530.0 4,530.0 1,409.0 2,936.8 12.3
Fair value of plan assets -4,650.4 -4,650.4 -1,190.2 -3,296.6 -12.3
Recognised limitation acc. to IAS 19.64 48.2 48.2 3.3 44.9
Fair value of plan assets after limitation acc. to IAS 19.64 -4,602.2 -4,602.2 -1,186.9 -3,251.7 -12.3
Deficit (+) / surplus (-) -72.2 -72.2 222.1 -314.9
Present value of unfunded obligations 615.5 183.5 799.0 60.5 3.3 415.7
Net defined benefit liability (asset) 543.3 183.5 726.8 282.6 -311.6 415.7
31 December 2014
Present value of funded obligations 4,479.6 4,479.6 1,367.4 2,916.9 11.6
Fair value of plan assets -4,506.6 -4,506.6 -1,175.6 -3,168.7 -11.6
Recognised limitation acc. to IAS 19.64 43.8 43.8 43.8
Fair value of plan assets after limitation acc. to IAS 19.64 -4,462.8 -4,462.8 -1,175.6 -3,124.9 -11.6
Deficit (+) / surplus (-) 16.8 16.8 191.8 -208.0
Present value of unfunded obligations 663.9 209.8 873.7 64.6 3.1 445.2
Net defined benefit liability (asset) 680.7 209.8 890.5 256.4 -204.9 445.2
The reconciliation of the net defined benefit liability (asset) was as follows:
229HeidelbergCement | Annual Report 2015
Consolidated income statement
Consolidated statement of comprehensive income
Consolidated statement of cash flows
Consolidated balance sheet
Consolidated statement of changes in equity
Segment reporting / Notes to the consolidated financial statements
Notes to the 2015 consolidated financial statements
Audit opinion
Responsibility statement
Con
solid
ated
fin
anci
al s
tate
men
tsA
ddit
iona
l inf
orm
atio
n
4
5

Net defined benefit liability (asset) Pension plans and plans for health care costs
thereof pension plans
€m
Pension plans
Plans for health care
costs
Group North America
UK Germany
2015
Net defined benefit liability (asset) at 1 January 680.7 209.8 890.5 256.4 -204.9 445.2
Changes in consolidation scope -6.0 -6.0 0.1
Pension expenses recognised in profit or loss 48.0 8.5 56.4 5.7 -2.1 17.2
Remeasurements recognised in other comprehensive income -73.5 -38.0 -111.5 22.4 -46.7 -26.2
Cash flow in the period -123.0 -14.5 -137.5 -26.4 -48.2 -20.6
Disposal groups
Exchange rate changes 17.1 17.7 34.8 24.5 -9.7
Net defined benefit liability (asset) at 31 December 543.3 183.5 726.8 282.6 -311.6 415.7
2014
Net defined benefit liability (asset) at 1 January 614.8 174.4 789.2 179.9 -101.2 360.7
Changes in consolidation scope -1.9 0.2 -1.7
Pension expenses recognised in profit or loss 57.7 3.2 60.9 12.7 0.9 17.9
Remeasurements recognised in other comprehensive income 117.4 25.9 143.3 58.4 -51.5 92.3
Cash flow in the period -116.1 -14.2 -130.3 -21.3 -42.5 -21.0
Disposal groups -5.0 -5.0 -4.7
Exchange rate changes 13.8 20.3 34.1 26.7 -10.6
Net defined benefit liability (asset) at 31 December 680.7 209.8 890.5 256.4 -204.9 445.2
Breakdown of the pension obligationsThe following table shows the pension obligations divided in different member groups.
Defined benefit obligation by member groups Pension plans and plans for health care costs
thereof pension plans
€m
Pension plans
Plans for health care
costs
Group North America
UK Germany
31 December 2015
Active members 802.1 44.2 846.3 383.0 34.5 169.1
Deferred vested members 1,380.3 8.4 1,388.7 126.7 1,202.0 24.1
Pensioners 2,963.1 130.9 3,094.0 959.8 1,703.6 234.8
Total defined benefit obligation 5,145.5 183.5 5,329.0 1,469.5 2,940.1 428.0
31 December 2014
Active members 847.8 61.4 909.2 399.5 33.4 179.8
Deferred vested members 1,454.2 9.2 1,463.4 159.3 1,240.6 28.3
Pensioners 2,841.5 139.2 2,980.7 873.2 1,646.1 248.7
Total defined benefit obligation 5,143.5 209.8 5,353.3 1,432.0 2,920.1 456.8
230 HeidelbergCement | Annual Report 2015
Consolidated financial statements4
Amounts recognised in other comprehensive incomeIn the 2015 financial year, actuarial gains from the defined benefit obligation (DBO) amounting to €251.3 million (previous year: losses of 636.2) have arisen mainly from the increase in the discount rate on which the actuarial calculation is based. The weighted average discount rate as at the end of the year is 0.3 percentage points higher (previous year: 0.9 percentage points lower) than the weighted discount rate as at the end of the previous year. In key countries, excluding Canada (reduction of 0.1 percentage points), the discount rate increased by between 0.2 percentage points (United Kingdom) and 0.4 percentage points (Germany and United States).
The actuarial gains and losses can be broken down into effects from experience adjustments resulting in gains of €44.4 million (previous year: losses of 12.9), effects from changes in demographic assumptions resulting in gains of €20.6 million (previous year: losses of 57.0), essentially attributable to the adjustment of demographic assumptions in the United States and assumptions relating to an improvement in future life expectancy in the United Kingdom, and effects from changes in financial assumptions resulting in gains of €186.3 million (pre-vious year: losses of 566.3). Due to increasing interest rates and the nature of LDI products, the performance of the plan assets was low compared with the previous year. In the 2015 financial year, return on plan assets fell short of interest income by €139.4 million. In the previous year, the return exceeded the interest income by €507.8 million.
Changes in the effect of asset ceiling according to IAS 19.64 resulted in an amount of €-0.4 million (previous year: -15.0).
Development in the income statementThe expenses for retirement benefits for the significant pension and healthcare plans can be summarised as follows.
231HeidelbergCement | Annual Report 2015
Consolidated income statement
Consolidated statement of comprehensive income
Consolidated statement of cash flows
Consolidated balance sheet
Consolidated statement of changes in equity
Segment reporting / Notes to the consolidated financial statements
Notes to the 2015 consolidated financial statements
Audit opinion
Responsibility statement
Con
solid
ated
fin
anci
al s
tate
men
tsA
ddit
iona
l inf
orm
atio
n
4
5

Development in the income statement Pension plans and plans for health care costs
thereof pension plans
€m
Pension plans
Plans for health care
costs
Group North America
UK Germany
31 December 2015
Current service cost 33.8 2.2 36.0 4.4 3.5 8.5
Administrative expenses (not investment related) paid by the plan 11.4 11.4 8.5 3.0
Net interest, thereof 18.0 7.9 25.9 10.5 -8.6 8.7
Interest cost on defined benefit obligation 193.1 7.9 201.0 63.1 110.1 9.0
Interest income on plan assets -176.9 -176.9 -52.7 -120.4 -0.3
Interest income on assets ceiling 1.8 1.8 0.1 1.7
Past service cost recognised -15.4 -1.6 -17.0 -18.0
Settlement gains / losses recognised 0.1 0.1 0.3
Expenses from continuing operations recognised in profit or loss 48.0 8.5 56.4 5.7 -2.1 17.2
Expenses from discontinued operations recognised in profit or loss
Total expenses recognised in profit or loss 48.0 8.5 56.4 5.7 -2.1 17.2
31 December 2014
Current service cost 34.9 1.5 36.4 5.2 4.2 5.6
Administrative expenses (not investment related) paid by the plan 4.4 4.4 1.4 2.8
Net interest, thereof 21.9 7.7 29.6 7.9 -6.1 12.3
Interest cost on defined benefit obligation 188.5 7.7 196.2 50.2 110.4 12.6
Interest income on plan assets -167.8 -167.8 -42.3 -117.7 -0.3
Interest income on assets ceiling 1.2 1.2 1.2
Past service cost recognised 1.7 -6.7 -5.0 0.8
Settlement gains / losses recognised -6.4 -6.4 -3.8
Expenses from continuing operations recognised in profit or loss 56.5 2.5 59.0 11.5 0.9 17.9
Expenses from discontinued operations recognised in profit or loss 1.2 0.7 1.9 1.2
Total expenses recognised in profit or loss 57.7 3.2 60.9 12.7 0.9 17.9
Of the total pension expenses from continuing operations of €56.4 million (previous year: 59.0), €30.5 million (previous year: 29.4) are shown in the personnel costs or in other operating expenses, and an amount of €25.9 million (previous year: 29.6) in other financial result.
In the 2015 financial year, the Lehigh Retirement Pension Plan in the United States was amended so that mem-ber groups with vested rights can be offered a capital payment from 1 April 2016. This results in a past service income of €9.8 million. The supplemental executive retirement plan (SERP) for one employee in the United States was amended in 2015. The effect amounting to €3.9 million was shown as past service income. As part of the sale of the building products business line, active employees who are entitled to benefits from the Hanson Brick Plan for non-tariff employees or the Pipe and Precast Pension Plan will earn no further benefit increases from these plans. The entitlement already earned will be adjusted by the end of 2017 to the average wage index of the industry and will subsequently remain unchanged at this level. This led to a plan curtailment of €3.0 million.
The actual return on plan assets amounted to €26.0 million (previous year: 677.7).
232 HeidelbergCement | Annual Report 2015
Consolidated financial statements4

Sensitivity analysis of the defined benefit obligationsChanges in the discount rate, pension increase rate, and the life expectancy affect the income statement and the pension obligations. The sensitivities to changes in assumptions as shown below are determined by changing one assumption as indicated and keeping all other assumptions constant. In reality, multiple assumptions may change at the same time, and the change of one parameter may result in a change of another parameter.
Sensitivity analysis of defined benefit obligations (pension plans)
€m Group North America UK Germany
31 December 2015
Defined benefit obligation 5,145.5 1,469.5 2,940.1 428.0
Discount rateincrease by 1.0 % 4,471.4 1,319.1 2,500.2 373.7
decrease by 1.0 % 5,996.3 1,637.3 3,500.9 514.3
Pension increase rateincrease by 0.25 % 5,251.1 1,469.5 3,030.0 440.0
decrease by 0.25 % 5,046.7 1,469.5 2,856.3 416.6
Life expectancyincrease by 1 year 5,329.1 1,514.3 3,052.8 447.8
decrease by 1 year 4,959.7 1,424.9 2,825.0 408.0
31 December 2014
Defined benefit obligation 5,143.5 1,432.0 2,920.1 456.8
Discount rateincrease by 1.0 % 4,445.0 1,278.2 2,468.9 395.9
decrease by 1.0 % 6,015.7 1,604.5 3,501.5 533.9
Pension increase rateincrease by 0.25 % 5,246.7 1,432.0 3,006.0 469.6
decrease by 0.25 % 5,044.9 1,432.0 2,837.5 444.6
Life expectancyincrease by 1 year 5,339.5 1,483.2 3,036.6 478.0
decrease by 1 year 4,950.1 1,382.8 2,803.8 435.3
233HeidelbergCement | Annual Report 2015
Consolidated income statement
Consolidated statement of comprehensive income
Consolidated statement of cash flows
Consolidated balance sheet
Consolidated statement of changes in equity
Segment reporting / Notes to the consolidated financial statements
Notes to the 2015 consolidated financial statements
Audit opinion
Responsibility statement
Con
solid
ated
fin
anci
al s
tate
men
tsA
ddit
iona
l inf
orm
atio
n
4
5

Development of the pension obligations and the plan assets The following table shows the development of the pension obligations and the plan assets.
Development of pension obligations and plan assets Pension plans Plans for health care costs
Total
€m 2014 2015 2014 2015 2014 2015
Defined benefit obligation at 1 January 4,347.5 5,143.5 174.4 209.8 4,521.9 5,353.3
Change in scope of consolidation -1.5 -5.9 0.2 -1.3 -5.9
Current service cost 35.7 33.8 1.6 2.2 37.3 36.0
Interest cost 196.2 193.1 8.3 7.9 204.5 201.0
Employee contributions 1.9 1.5 1.9 1.5
Actuarial gains / losses 610.3 -213.3 25.9 -38.0 636.2 -251.3
Benefits paid by the company -42.5 -46.4 -14.2 -14.5 -56.7 -60.9
Benefits paid by the fund -205.8 -241.7 -205.8 -241.7
Taxes and premiums paid -1.4 -1.3 -1.4 -1.3
Past service cost 1.7 -15.4 -6.7 -1.6 -5.0 -17.0
Plan settlements -125.1 0.1 -125.1 0.1
Disposal groups -5.1 -5.1
Exchange rate changes 331.6 297.5 20.3 17.7 351.9 315.2
Defined benefit obligation at 31 December 5,143.5 5,145.5 209.8 183.5 5,353.3 5,329.0
Funded obligation 4,479.6 4,530.0 4,479.6 4,530.0
Unfunded obligation 663.9 615.5 209.8 183.5 873.7 799.0
Fair value of plan assets at 1 January 3,758.0 4,506.6 3,758.0 4,506.6
Change in scope of consolidation 0.5 0.1 0.5 0.1
Interest income 174.8 176.9 174.8 176.9
Return on plan assets (excluding interest income) 507.8 -139.4 507.8 -139.4
Administrative expenses (not investment related) paid by the plan -5.0 -11.4 -5.0 -11.4
Employer contributions 72.3 75.3 72.3 75.3
Employee contributions 1.9 1.5 1.9 1.5
Benefits, taxes and premiums paid -205.8 -241.7 -205.8 -241.7
Plan settlements -117.9 -117.9
Disposal groups -0.1 -0.1
Exchange rate changes 320.1 282.5 320.1 282.5
Fair value of plan assets at 31 December 4,506.6 4,650.4 4,506.6 4,650.4
HeidelbergCement paid €60.9 million (previous year: 56.7) directly to the pension recipients and €75.3 million (previous year: 72.3) as employer contributions to the funds. In 2016, HeidelbergCement expects to make pension payments of €54.7 million and employer contributions to the funds of €63.8 million. In addition, Heidelberg-Cement AG plans to allocate a Group contractual trust agreement (CTA) with €51.2 million in 2016, in order to protect pension entitlements from insolvency.
234 HeidelbergCement | Annual Report 2015
Consolidated financial statements4

The following table shows the expected benefits paid directly by HeidelbergCement or from the plan assets in the next ten years.
Expected benefit payments Pension plans and plans for health care costs
thereof pension plans
€mPension plans Plans for health
care costsGroup North America UK Germany
31 December 2015
in the following year 382.9 15.8 398.7 205.2 136.4 20.8
in the current year +2 300.5 15.1 315.6 117.4 140.1 20.7
in the current year +3 299.7 14.7 314.4 112.7 143.9 20.5
in the current year +4 307.4 14.1 321.5 109.4 147.8 20.6
in the current year +5 297.9 13.6 311.5 106.6 151.8 21.7
aggregated in the current year +6 through current year +10 1,509.1 60.8 1,569.9 476.4 822.6 105.4
Duration (in years) 15.1 11.4 17.6 14.5
31 December 2014
in the following year 268.3 16.4 284.7 93.2 123.6 21.3
in the current year +2 264.2 15.7 279.9 93.4 127.2 21.4
in the current year +3 267.4 15.3 282.7 93.8 130.9 21.2
in the current year +4 271.9 14.9 286.8 93.9 134.8 21.1
in the current year +5 280.7 14.5 295.2 93.8 138.7 21.0
aggregated in the current year +6 through current year +10 1,432.4 65.5 1,497.9 459.9 757.3 106.9
Duration (in years) 15.7 12.0 18.3 15.4
235HeidelbergCement | Annual Report 2015
Consolidated income statement
Consolidated statement of comprehensive income
Consolidated statement of cash flows
Consolidated balance sheet
Consolidated statement of changes in equity
Segment reporting / Notes to the consolidated financial statements
Notes to the 2015 consolidated financial statements
Audit opinion
Responsibility statement
Con
solid
ated
fin
anci
al s
tate
men
tsA
ddit
iona
l inf
orm
atio
n
4
5

Breakdown of the plan assets The plan assets originate primarily from North America with 26% (previous year: 26%) and the United Kingdom with 71% (previous year: 71%). The plan assets can be divided into the following categories:
Breakdown of the plan assets
€m Group North America UK Germany
31 December 2015
Cash and cash equivalents 178.4 55.3 118.8
Equity instruments 1,019.4 313.2 656.5
Interest rate swaps 196.5 196.5
Other derivatives 72.2 72.6 -0.4
Hedge funds 1.2
Nominal government bonds 1,133.2 232.1 859.3
Nominal corporate bonds 831.0 445.6 376.2
Index linked bonds 558.5 557.1
Real estate 158.0 145.5
Insurance policies 138.4 122.6
Other 363.6 71.4 264.5 12.3
Total 4,650.4 1,190.2 3,296.6 12.3
31 December 2014
Cash and cash equivalents 153.2 45.4 99.1
Equity instruments 1,133.3 293.7 787.4
Interest rate swaps 169.6 169.6
Other derivatives 62.5 62.3 0.2
Hedge funds 1.5
Nominal government bonds 543.7 287.5 227.2
Nominal corporate bonds 804.9 439.7 345.1
Index linked bonds 1,020.3 7.5 1,012.9
Real estate 174.2 166.2
Insurance policies 136.9 119.9
Other 306.5 39.5 241.2 11.6
Total 4,506.6 1,175.6 3,168.8 11.6
The investments in equity instruments can be further divided up as follows:
Division of equity instruments
in % 2014 2015
North America 55% 54%
UK 8% 8%
Europe 15% 15%
Emerging Markets 6% 7%
Other 16% 16%
Certain non-monetary assets are based on appraisals that are not completed until the consolidated financial statements have been adopted by the Managing Board. In those cases, the most recent appraisal values are rolled forward with observed trends in the relevant markets to determine the best estimates at year end. The majority of the Group assets are based directly on quoted market prices for the invested assets or, in the case where investment funds are used, indirectly based on the quoted value of the underlying investments. Exceptions are that in the United Kingdom and Germany, a portion of the assets needs to be estimated as at the end of the
236 HeidelbergCement | Annual Report 2015
Consolidated financial statements4

year, as detailed asset information is not available or is not available in time until adoption of the consolidated financial statements by the Managing Board (about €116.7 million). In the United Kingdom, these asset values are estimated based on the most current information available. For the German deferred compensation plan, assets are assumed to be equal to the defined benefit obligation, as the benefits are fully funded.
The plan assets do not include any significant own financial instruments, property occupied by, or other assets used by HeidelbergCement.
As at 31 December 2015, the unrecognized assets due to the application of the asset ceiling as per IAS 19.64 amounted to €48.2 million (previous year: 43.8). The changes in the asset ceiling in 2015 are divided into in-terest income of €1.8 million, changes in the asset ceiling to be shown in other comprehensive income of €0.4 million, and exchange rate changes of €2.2 million.
Multi-employer pension plansHeidelbergCement participates in multi-employer pension plans (MEPP), predominantly in the USA, which award some unionised employees fixed benefits after their retirement. These multi-employer pension plans are accounted for as defined contribution plans, as it is not possible to isolate the individual company components for these plans. The contributions are determined on the basis of collective bargaining. Contributions of €14.5 million (previous year: 11.8) were paid in 2015. The funding status of these pension plans could be affected by adverse developments in the capital markets due to demographic changes and increases in pension benefits. If one of the participating companies no longer pays contributions into the multi-employer pension plan, all other parties concerned will be held liable for the obligations that have not been covered. Contributions of €14.2 million are expected in 2016. The withdrawal liability of these plans as at 31 December 2015 would amount to €91.0 million (previous year: 124.4), should HeidelbergCement decide to withdraw. This amount declined in comparison with the previous year due to the withdrawal from a major MEPP, which was set up prior to the sale of the building products business line. HeidelbergCement has provisions of €60.4 million (previous year: 50.8) for these liabilities, which are shown under miscellaneous other provisions.
45 Other provisions
The following table explains the development of other provisions.
Provisions
€m
Provisions for damages and
environmental obligations
Other environmental
provisions
Miscellaneous other
provisions
Total
1 January 2015 531.9 346.2 402.5 1,280.6
Adjustment 60.5 19.6 28.5 108.6
Reclassification -0.4 12.6 12.2
Utilisation -27.7 -43.9 -71.9 -143.5
Reduction -57.1 -19.9 -73.2 -150.2
Addition 76.0 61.9 112.4 250.3
31 December 2015 583.6 363.5 410.9 1,358.0
The adjustment line includes changes in the scope of consolidation and adjustments from currency translation. The reclassification line shows other reclassifications. The reduction line includes the release of unused provisions amounting to €91.3 million, the offsetting of obligations against the corresponding claims for reimbursement, and the offsetting of obligations in kind against other assets totalling €58.9 million.
237HeidelbergCement | Annual Report 2015
Consolidated income statement
Consolidated statement of comprehensive income
Consolidated statement of cash flows
Consolidated balance sheet
Consolidated statement of changes in equity
Segment reporting / Notes to the consolidated financial statements
Notes to the 2015 consolidated financial statements
Audit opinion
Responsibility statement
Con
solid
ated
fin
anci
al s
tate
men
tsA
ddit
iona
l inf
orm
atio
n
4
5

The maturities of the provisions can be broken down as follows:
Maturities
€m
Provisions for damages and
environmental obligations
Other environmental
provisions
Miscellaneous other
provisions
Total
Maturity ≤ 1 year 89.8 47.5 102.4 239.7
Maturity > 1 year ≤ 5 years 364.8 120.4 259.0 744.2
Maturity > 5 years 129.0 195.6 49.5 374.1
583.6 363.5 410.9 1,358.0
Provisions for damages and environmental obligationsProvisions for damages and environmental obligations result from discontinued operations that were transferred to the HeidelbergCement Group as part of the takeover of the Hanson Group in 2007. The obligations are there-fore not linked to the continuing operations of the HeidelbergCement Group.
The provisions for damages concern legal proceedings before US courts. The claims relate to health problems allegedly caused by the sale of products containing asbestos. The environmental liability claims pertain to re-mediation obligations in connection with the sale of chemical products by a former Hanson participation. The provisions to be formed are measured at the present value of the expected expenses, using reliable estimates of the development of costs for the next eight years.
The provisions are offset by claims for reimbursement against environmental and third-party liability insurers. As at 31 December 2015, the claims amount to €371.1 million (previous year: 349.5), of which €298.7 million (previous year: 276.4) is recorded under other non-current operating receivables and €72.4 million (previous year: 73.1) under other current operating receivables.
Other environmental provisionsThe other environmental provisions include recultivation, environmental, and asset retirement obligations.
Recultivation obligations relate to legal and constructive obligations to backfill and restore raw material quarrying sites. The provisions recognised for these obligations are measured in accordance with the extraction progress on the basis of the best cost estimate for fulfilling the obligation. As at the reporting date, these provisions amounted to €219.9 million (previous year: 224.9).
Provisions for environmental obligations are recognised on the basis of contractual or official regulations and essentially include expenses connected with the cleaning up of contaminated areas and the remediation of ex-traction damages. The provisions are measured at the present value of the expected expenses. These provisions amount to a total of €69.4 million (previous year: 53.3).
The provisions for asset retirement obligations pertain to obligations arising in connection with the removal of installations (e.g. conveying systems at rented locations), so that a location can be restored to its contractually agreed or legally defined state after the end of its useful life. As at the reporting date, provisions for asset re-tirement obligations of €74.2 million (previous year: 68.0) had been recognised.
238 HeidelbergCement | Annual Report 2015
Consolidated financial statements4

Miscellaneous other provisionsMiscellaneous other provisions particularly exist for restructuring obligations, other litigation risks, compensation obligations, and obligations to personnel.
The provisions for restructuring obligations concern expenses for various optimisation programmes, such as the closure of plants or relocation of activities. Provisions of €30.3 million (previous year: 36.3) had been recognised for this purpose as at the reporting date.
Because of pending legal action against the Group, provisions for litigation risks, including those relating to pending antitrust proceedings, amounting to €34.3 million (previous year: 70.7) were recognised in the bal-ance sheet. These obligations are assessed as most likely, provided that other estimates do not lead to a fairer evaluation as a result of specific probability distributions.
Provisions for compensation obligations relate to the Group’s obligations arising from occupational accidents. As at the reporting date, provisions of €87.0 million (previous year: 84.1) had been formed for this purpose.
Obligations to personnel include the provision for the long-term bonus plan (management and capital market component) of €80.0 million (previous year: 42.9), as well as provisions for multi-employer plans amounting to €60.4 million (previous year: 50.8).
Further provisions were additionally recognised for a variety of minor issues.
Impact of interest rate effectsProvisions are measured at their present value, which is determined using a pre-tax interest rate. To this effect, HeidelbergCement uses the risk-free interest rate of government bonds from the respective countries, taking into account the relevant term. The risks specific to the liability are taken into account in the estimate of future cash outflows.
Interest rate effects of €5.4 million for provisions for damages and environmental obligations are included in the expenses from discontinued operations. Changes in the interest rate of €-8.2 million and compounding of €11.5 million led to an increase in miscellaneous other provisions.
46 Liabilities
The following table shows the composition of the interest-bearing liabilities.
Interest-bearing liabilities
€m 2014 2015
Bonds payable 7,035.5 5,795.2
Bank loans 553.0 521.2
Other interest-bearing liabilities
Miscellaneous interest-bearing liabilities 551.7 306.3
Liabilities from finance lease 11.5 12.0
Derivative financial instruments 42.4 46.7
Non-controlling interests with put options 27.7 30.0
8,221.8 6,711.4
239HeidelbergCement | Annual Report 2015
Consolidated income statement
Consolidated statement of comprehensive income
Consolidated statement of cash flows
Consolidated balance sheet
Consolidated statement of changes in equity
Segment reporting / Notes to the consolidated financial statements
Notes to the 2015 consolidated financial statements
Audit opinion
Responsibility statement
Con
solid
ated
fin
anci
al s
tate
men
tsA
ddit
iona
l inf
orm
atio
n
4
5

The following table provides an overview of the maturities of the interest-bearing liabilities.
Maturities of interest-bearing liabilities
€m < 1 year 1 – 5 years > 5 years Total
31 December 2015
Bonds payable 1,109.4 4,164.0 521.8 5,795.2
Bank loans 397.4 121.9 1.9 521.2
Miscellaneous interest-bearing liabilities 297.6 2.7 6.0 306.3
Liabilities from finance lease 4.5 7.5 12.0
Derivative financial instruments 41.3 5.4 46.7
Non-controlling interests with put options 25.8 4.2 30.0
1,876.0 4,305.7 529.7 6,711.4
31 December 2014
Bonds payable 1,434.3 4,022.9 1,578.3 7,035.5
Bank loans 285.5 265.6 1.9 553.0
Miscellaneous interest-bearing liabilities 541.6 2.8 7.3 551.7
Liabilities from finance lease 3.3 8.2 11.5
Derivative financial instruments 34.2 8.2 42.4
Non-controlling interests with put options 22.3 5.4 27.7
2,321.2 4,313.1 1,587.5 8,221.8
The following table shows the reconciliation of the total future minimum lease payments with their present value for finance lease liabilities.
Minimum lease payments of finance leases
€m < 1 year 1 – 5 years Total
31 December 2015
Present value of future minimum lease payments 4.5 7.5 12.0
Interest of future minimum lease payments 0.6 0.5 1.1
Future minimum lease payments 5.1 8.0 13.1
31 December 2014
Present value of future minimum lease payments 3.3 8.2 11.5
Interest of future minimum lease payments 0.7 1.0 1.7
Future minimum lease payments 4.0 9.2 13.2
Further information on interest-bearing liabilities can be found in the Group financial management section of the Group Management Report on page 84 f. Explanations on the derivative financial instruments are provided on page 245 f.
240 HeidelbergCement | Annual Report 2015
Consolidated financial statements4

Additional disclosures on financial instruments
The following table assigns the individual balance sheet items for the financial instruments to classes and mea-surement categories of IAS 39. In addition, the aggregate carrying amounts for each measurement category and the fair values for each class are depicted.
Carrying amounts, measurement and fair values by measurement categories
€m
Category of
IAS 39 1)
Amortised cost
Cost Fair value with
P/L effect
Fair value without
P/L effect
Carrying amount
Fair value
31 December 2015
Assets
Financial investments − available for sale at cost AfS 69.0 69.0
Loans and other interest-bearing receivables LaR 198.4 198.4 199.4
Trade receivables and other operating receivables LaR 1,827.9 1,827.9 1,827.9
Cash and cash equivalents LaR 1,350.5 1,350.5 1,350.5
Derivatives − hedge accounting Hedge 18.4 18.4 18.4
Derivatives − held for trading HfT 83.0 83.0 83.0
Liabilities
Bonds payable, bank loans, and miscellaneous financial liabilities FLAC 6,622.7 6,622.7 7,248.3
Trade payables, liabilities relating to personnel, and miscellaneous operating liabilities FLAC 2,483.3 2,483.3 2,483.3
Liabilities from finance lease FLAC 12.0 12.0 12.0
Derivatives − hedge accounting Hedge 1.8 1.8 1.8
Derivatives − held for trading HfT 44.9 44.9 44.9
Non-controlling interests with put options FLAC 30.0 30.0 30.0
31 December 2014
Assets
Financial investments − available for sale at cost AfS 66.2 66.2
Loans and other interest-bearing receivables LaR 212.9 212.9 218.3
Trade receivables and other operating receivables LaR 1,617.7 1,617.7 1,617.7
Cash and cash equivalents LaR 1,228.1 1,228.1 1,228.1
Derivatives − hedge accounting Hedge 4.2 4.2 4.2
Derivatives − held for trading HfT 64.4 64.4 64.4
Liabilities
Bonds payable, bank loans, and miscellaneous financial liabilities FLAC 8,140.2 8,140.2 9,086.8
Trade payables, liabilities relating to personnel, and miscellaneous operating liabilities FLAC 2,248.2 2,248.2 2,248.2
Liabilities from finance lease FLAC 11.5 11.5 11.5
Derivatives − hedge accounting Hedge 3.3 3.3 3.3
Derivatives − held for trading HfT 39.1 39.1 39.1
Non-controlling interests with put options FLAC 27.7 27.7 27.7
1) AfS: Available for sale, LaR: Loans and receivables, Hedge: Hedge accounting, HfT: Held for trading, FLAC: Financial liabilities at amortised cost
241HeidelbergCement | Annual Report 2015
Consolidated income statement
Consolidated statement of comprehensive income
Consolidated statement of cash flows
Consolidated balance sheet
Consolidated statement of changes in equity
Segment reporting / Notes to the consolidated financial statements
Notes to the 2015 consolidated financial statements
Audit opinion
Responsibility statement
Con
solid
ated
fin
anci
al s
tate
men
tsA
ddit
iona
l inf
orm
atio
n
4
5

Financial investments available for sale at cost are equity investments measured at cost, for which no listed price on an active market exists and whose fair value cannot be reliably determined. Therefore, no fair value is indicated for these instruments. Derivative financial instruments, both those designated as hedges and those held for trading, are measured at fair value. In these items, the fair value always corresponds to the carrying amount.
The fair values of the non-current loans, other non-current operating receivables, bank loans, finance lease lia-bilities, and other non-current interest-bearing and operating liabilities correspond to the present values of the future payments, taking into account the current interest parameters. The “Trade payables, liabilities relating to personnel, and miscellaneous operating liabilities” category cannot be immediately reconciled with the related balance sheet items, as these contain not only financial liabilities but also prepaid expenses and non-financial liabilities of €153.2 million (previous year: 127.1).
The fair values of the listed bonds correspond to the nominal values multiplied by the price quotations on the reporting date. For the financial instruments with short-term maturities, the carrying amounts on the reporting date represent appropriate estimates of the fair values.
The derivatives contracted by HeidelbergCement are sometimes subject to legally enforceable netting agree-ments (ISDA Agreement or German Master Agreement for Financial Derivatives), which, however, do not permit netting of receivables and liabilities in the balance sheet in accordance with IAS 32.42. The right to offset only exists in the case of delayed payment or if a contracting party becomes insolvent. The disclosure in the balance sheet is therefore shown on a gross basis. As at the reporting date, derivatives with a positive carrying amount of €101.4 million (previous year: 68.6) and corresponding derivatives with a negative carrying amount of €-46.7 million (previous year: -42.4) were subject to netting agreements. Taking these agreements into consideration, a calculated netting amount of €24.2 million (previous year: 10.4) would result at the reporting date. Accordingly, the derivatives would have positive net carrying amounts of €77.2 million (previous year: 58.2) and negative net carrying amounts of €-22.5 million (previous year: -32.0). Other contractual arrangements for netting financial assets and liabilities do not exist.
In the HeidelbergCement Group, only derivatives that are determined on the basis of input factors that can be observed directly or indirectly are accounted for at fair value. Derivatives are assigned to the fair value hierarchy level 2.
The following table shows the fair value hierarchy for the assets and liabilities, which are not measured at fair value in the balance sheet, but whose fair value is reported.
242 HeidelbergCement | Annual Report 2015
Consolidated financial statements4

Fair value hierarchy 31 December 2014 31 December 2015
€m Level 1 Level 2 Level 3 Level 1 Level 2 Level 3
Assets
Loans and other interest-bearing receivables 218.3 199.4
Trade receivables and other operating receivables 1,617.7 1,827.9
Cash and cash equivalents 1,228.1 1,350.5
Liabilities
Bonds payable, bank loans, and miscellaneous financial liabilities 7,819.5 1,267.3 6,290.7 957.6
Trade payables, liabilities relating to personnel, and miscellaneous operating liabilities 2,248.2 2,483.3
Liabilities from finance lease 11.5 12.0
Non-controlling interests with put options 27.7 30.0
For level 1, the fair value is calculated using prices quoted on an active market (unadjusted) for identical assets or liabilities to which HeidelbergCement has access on the reporting date. For level 2, the fair value is determined using a discounted cash flow model on the basis of input data that does not involve quoted prices classified in level 1, and which is directly or indirectly observable.
Non-controlling interests with put options in level 3 are reported as liabilities and relate to put options held by non-controlling interests. The discounted cash flow method was used for the fair value calculation. In this respect, the cash flows from the companies’ underlying plans were discounted with a risk-adjusted discount rate (WACC).
The assessment as to whether financial assets and liabilities, which are accounted for at fair value, are to be transferred between the levels of the fair value hierarchy will take place at the end of each reporting period. No reclassifications were carried out in the period under review.
The following table shows the net gains or losses from the financial instruments by measurement category.
Net gains or losses
€m 2014 2015
Loans and receivables -214.7 -130.5
Financial investments − available for sale -0.6 -5.1
Financial instruments − held for trading 195.6 142.5
Financial liabilities at amortised cost -76.1 -114.9
-95.8 -108.0
The net result from loans and receivables includes impairment losses as well as reversals of impairment losses of €-3.7 million (previous year: -11.9) and currency effects of €-126.8 million (previous year: -202.7). The net result of financial investments available for sale includes valuation allowances amounting to €-5.1 million (pre-vious year: -0.6). The net result from the subsequent measurement of the financial instruments held for trading includes currency and interest effects. In interest-bearing liabilities carried at amortised costs, the net result primarily includes effects from currency translation of €-115.1 million (previous year: -76.1).
243HeidelbergCement | Annual Report 2015
Consolidated income statement
Consolidated statement of comprehensive income
Consolidated statement of cash flows
Consolidated balance sheet
Consolidated statement of changes in equity
Segment reporting / Notes to the consolidated financial statements
Notes to the 2015 consolidated financial statements
Audit opinion
Responsibility statement
Con
solid
ated
fin
anci
al s
tate
men
tsA
ddit
iona
l inf
orm
atio
n
4
5

The following table shows the total interest income and expenses for the financial instruments not measured at fair value in profit or loss.
Total interest income and expense
€m 2014 2015
Total interest income 93.0 72.9
Total interest expense -565.1 -471.7
-472.1 -398.8
The impairment losses of financial assets by class is depicted in the following table.
Impairment losses
€m 2014 2015
Financial investments − available for sale at cost -0.6 -5.1
Loans and other interest-bearing receivables -1.4 -1.7
Trade receivables and other operating receivables -21.8 -12.9
-23.8 -19.7
244 HeidelbergCement | Annual Report 2015
Consolidated financial statements4

Derivative financial instruments The following table shows the nominal values and fair values of the derivative financial instruments.
Derivative financial instruments 31 December 2014 31 December 2015
€m Nominal value Fair value2) Nominal value Fair value2)
Assets
Cash flow hedges
Currency swaps 1) 1.3 137.8 17.2
Fair value hedges
Interest rate swaps 619.9 2.9 690.6 1.2
Hedges of a net investment
Foreign exchange swaps 15.4 0.0
Derivatives held for trading
Currency forwards 0.7 0.0 4.8 0.2
Foreign exchange swaps 2,221.2 34.0 2,099.9 48.9
Cross-currency interest rate swaps 3) 124.7 30.4 136.5 33.9
2,966.5 68.6 3,084.9 101.4
Liabilities
Cash flow hedges
Currency forwards 1.4 0.1 1.6 0.1
Currency swaps 1) 124.7 1.9 0.9
Commodities 3.4 0.3 4.1 0.8
Fair value hedges
Interest rate swaps 1.0
Derivatives held for trading
Currency forwards 0.7 0.0 2.9 0.0
Foreign exchange swaps 953.0 23.3 2,687.6 32.8
Cross-currency interest rate swaps 3) 43.8 15.6 43.8 11.9
Commodities 2.0 0.2 1.6 0.2
1,129.0 42.4 2,741.5 46.7
1) The nominal values of €137.8 million (previous year: 124.7) relates to currency swaps with positive fair values of €16.3 million (previous year: negative fair value -0.6), which were designated as hedging instruments in a cash flow hedge. The fair values are shown on the asset side and on the liability side because of separation into long-term and short-term components of the currency swaps.
2) The fair value specified with €0.0 is less than €50,000.
3) The nominal values of €136.5 million (previous year: 124.7) relates to cross-currency interest rate swaps with positive fair values of €31.4 million (previous year: 25.5), which are shown on the asset side in the amount of €33.9 million (previous year: 30.4) and on the liability side in the amount of €-2.5 million (previous year: -4.9) because of separation into long-term and short-term components of the swaps. The nominal values of €43.8 million (previous year: 43.8) refers to cross-currency interest rate swaps with negative fair values of €-9.4 million (previous year: 10.7).
245HeidelbergCement | Annual Report 2015
Consolidated income statement
Consolidated statement of comprehensive income
Consolidated statement of cash flows
Consolidated balance sheet
Consolidated statement of changes in equity
Segment reporting / Notes to the consolidated financial statements
Notes to the 2015 consolidated financial statements
Audit opinion
Responsibility statement
Con
solid
ated
fin
anci
al s
tate
men
tsA
ddit
iona
l inf
orm
atio
n
4
5

Cash flow hedgesThe currency swap open at the reporting date with a positive fair value of €16.3 million (previous year: negative fair value of -0.6) hedges the currency risk of the fixed interest-bearing CHF 150 million bond that matures in 2017. During the reporting period, €16.7 million (previous year: 3.7) was recognised directly in equity through other comprehensive income and €-13.1 million (previous year: -2.5) was released to profit or loss. The accrued interest of €-0.1 million (previous year: -0.3) included in the fair value was recognised in profit or loss in the interest result.
The commodities of €-0.8 million (previous year: -0.3) open at the reporting date hedge future electricity prices and mature in the course of 2016. In the reporting year, valuation effects of €1.1 million (previous year: 0.1) were recognised directly in equity through other comprehensive income. Effects of €-1.5 million (previous year: 0.1) included in equity were reclassified to profit or loss.
The contractually set future payments in foreign currency resulting from a long-term investment project are hedged by appropriate cash in foreign currencies. During the reporting period, currency effects of €1.6 million (previous year: -2.8) were recognised directly in equity through other comprehensive income. In the context of the payment of instalments during the reporting period, €-6.9 million (previous year: -7.4) of the amount recognised in the other comprehensive income was reclassified directly from other comprehensive income to assets under construction.
There is no significant ineffectiveness in the cash flow hedges.
Fair value hedgesThe interest rate swaps open at the reporting date with a positive fair value of €1.2 million (previous year: 1.9) hedge the interest rate risks of fixed interest-bearing loans. The change in fair value adjusted for accrued interest of €-0.6 million (previous year: -0.3) was recognised in profit or loss in the other financial result. A corresponding fair value adjustment of €0.4 million (previous year: 0.5) was made for the loans, which was also shown in the hedging result. The accrued interest of €1.0 million (previous year: 1.1) included in the fair value was recognised in profit or loss in the interest result.
Risks from financial instruments As regards its assets, liabilities, firm commitments, and planned transactions, HeidelbergCement is particularly exposed to risks arising from changes in foreign exchange rates, interest rates, and market and stock market prices. These market price risks might have a negative impact on the financial position and performance of the Group. The Group manages these risks primarily as part of its ongoing business and financing activities and, when required, by using derivative financial instruments. The main aspects of the financial policy are determined by the Managing Board.
The Group Treasury department is responsible for the implementation of the financial policy and ongoing risk management. The Group Treasury department acts on the basis of existing guidelines, which bindingly deter-mine the decision criteria, competences, responsibilities, and processes for managing the financial risks. Certain transactions also require the prior approval of the Managing Board. The Group Treasury department informs the Managing Board on an ongoing basis about the amount and scope of the current risk exposure and current market developments on the global financial markets. The Group Internal Audit department monitors the obser-vance of the guidelines mentioned above and the corresponding legal framework by means of targeted auditing. Credit riskHeidelbergCement is exposed to credit risk through its operating activities and certain financial transactions. The credit risk stands for the risk that a contracting party unexpectedly does not fulfil, or only partially fulfils, the obligations agreed when signing a financial instruments contract. The Group limits its credit risk by only concluding contracts for financial assets and derivative financial instruments with partners that have a first-class credit rating.
246 HeidelbergCement | Annual Report 2015
Consolidated financial statements4

Credit ratingThe rating agencies Moody’s and Fitch Ratings assess the creditworthiness of HeidelbergCement as Ba1/Not Prime (Outlook Stable) and BB+/B (Outlook Stable) as at the end of 2015. Any potential downgrading of the ratings awarded by the rating agencies could have a negative impact on HeidelbergCement’s cost of capital and refinancing possibilities.
Cash and cash equivalentsThis item essentially comprises cash. The Group is exposed to losses arising from credit risk in connection with the investment of cash and cash equivalents if contracting parties do not fulfil their obligations. Heidelberg-Cement manages the resulting risk position by diversification of contracting parties. Cash and cash equivalents are invested in selected companies, banks, and financial institutions following a thorough credit analysis. At present, no cash or cash equivalents are overdue or impaired as a result of defaults. The maximum credit risk of cash and cash equivalents corresponds to the carrying amount.
Trade receivablesTrade receivables result mainly from the sale of cement, concrete, and aggregates. In operating activities, the outstanding debts are monitored on an ongoing basis. Default risks are taken into account by means of specific valuation allowances and collective specific valuation allowances. The maximum risk position from trade re-ceivables corresponds to the carrying amount.
Other receivables and assetsThe credit risk position from other receivables and assets corresponds to the carrying amount of these instru-ments. HeidelbergCement regards this credit risk as insignificant.
Derivative financial instrumentsDerivative financial instruments are generally used to reduce risks. In the course of its business activity, Heidel-bergCement is exposed to interest rate, currency, and energy price risks. For accounting purposes, a significant portion of the derivatives are not accounted for as hedges in accordance with IAS 39, but as instruments in the held-for-trading category. However, from a commercial perspective, the changes in the fair values of these instruments represent an economically effective hedge within the context of the Group strategy. The maximum credit risk of this item corresponds to the fair value of the derivative financial instruments that have a positive fair value and are shown as financial assets at the reporting date. Interest rate swaps and cross-currency interest rate swaps were contracted to hedge the fair value risk and were designated as hedging instruments in accor-dance with IAS 39. In order to reduce default risks, the hedging transactions are generally concluded only with leading financial institutions that have a first-class credit rating. The contracting parties enjoy very good credit ratings, awarded by external rating agencies such as Moody’s or Fitch Ratings. There are currently no past-due derivative financial instruments in the portfolio.
Liquidity riskThe liquidity risk describes the risk of a company not being able to fulfil its financial obligations to a sufficient degree. To manage HeidelbergCement’s liquidity, the Group maintains sufficient cash and cash equivalents as well as extensive credit lines with banks, besides the cash inflow from operating activities. The operating liquid-ity management includes a daily reconciliation of cash and cash equivalents. The Group Treasury department, based in Heidelberg, acts as an in-house bank. This allows liquidity surpluses and requirements to be managed in accordance with the needs of the entire Group and of individual Group companies.
247HeidelbergCement | Annual Report 2015
Consolidated income statement
Consolidated statement of comprehensive income
Consolidated statement of cash flows
Consolidated balance sheet
Consolidated statement of changes in equity
Segment reporting / Notes to the consolidated financial statements
Notes to the 2015 consolidated financial statements
Audit opinion
Responsibility statement
Con
solid
ated
fin
anci
al s
tate
men
tsA
ddit
iona
l inf
orm
atio
n
4
5

As at the end of the year, HeidelbergCement still has as yet undrawn, confirmed credit lines of €2.7 billion available in order to secure liquidity, in addition to available cash. An open-ended framework agreement for the issue of short-term bearer bonds (commercial papers) of €1.5 billion is available to cover short-term liquidity peaks. Within the context of the programme, individual tranches with different terms will be issued at different times depending on the market situation. As at the end of 2015, commercial papers totalling €207 million were outstanding. Further information on liquidity risks can be found in the Management Report, Risk and opportunity report chapter on page 127 f.
As the financial contracts of HeidelbergCement do not contain any clauses that trigger a repayment obligation in the event of the credit rating being downgraded, the maturity structure will remain unaffected even if the credit assessments change. Margin calls that could lead to an outflow of liquidity are not agreed in any of the main financial instruments. All derivative financial instruments are contracted on the basis of existing framework agreements that contain netting agreements for the purpose of reducing credit and liquidity risks.
The following maturity overview shows how the cash flows of the liabilities as at 31 December 2015 affect the Group’s liquidity position. The overview describes the progress of:
– undiscounted repayments and interest payments for bonds payable– undiscounted liabilities and interest payments to banks– undiscounted other liabilities– undiscounted contractually agreed payments for derivative financial instruments, as a total for the year.
The trade payables are assigned to short-term maturities (within a year). For variable interest payments, the current interest rate is taken as a basis. Payments in foreign currency are translated using the exchange rate at year end.
Cash flows of interest-bearing liabilities and derivative financial instruments
€m
Carrying amount
31 Dec. 2015
Cash flows 2016
Cash flows 2017
Cash flows 2018
Cash flows 2019
Cash flows 2020 - 2025
Bonds payable 5,795.2 1,339.4 1,398.2 1,190.5 1,136.0 1,620.4
Bank loans 521.2 422.5 11.0 20.4 119.6 8.1
Miscellaneous interest-bearing liabilities 306.3 297.8 7.9 0.9
Derivatives with positive fair value
Cash flow hedges 17.2 10.9 132.5
Fair value hedges 1.2 41.0
Net investment hedges 0.0 15.4
Derivatives held for trading 83.0 2,147.5 29.3 22.6
Derivatives with negative fair value
Cash flow hedges 1.8 5.9
Derivatives held for trading 44.9 2,704.5 4.8 4.8 22.2 38.8
248 HeidelbergCement | Annual Report 2015
Consolidated financial statements4

Cash flows of interest-bearing liabilities and derivative financial instruments
€m
Carrying amount
31 Dec. 2014
Cash flows 2015
Cash flows 2016
Cash flows 2017
Cash flows 2018
Cash flows 2019 - 2023
Bonds payable 7,035.5 1,735.6 1,263.4 1,384.2 1,190.5 2,756.4
Bank loans 553.0 311.2 202.4 17.1 26.2 118.9
Miscellaneous interest-bearing liabilities 551.7 537.8 13.6 0.1 0.9
Derivatives with positive fair value
Cash flow hedges 1.3
Fair value hedges 2.9 34.9 34.7
Derivatives held for trading 64.4 2,230.9 61.6 27.6 21.4
Derivatives with negative fair value
Cash flow hedges 2.3 10.9 11.0 132.5
Fair value hedges 1.0
Derivatives held for trading 39.1 959.7 4.5 4.6 4.5 57.5
The inflow of liquidity amounting to €388.0 million (previous year: 408.3) from interest rate and cross-currency interest rate swaps and €4,810.7 (previous year: 3,206.6) arising from current foreign exchange transactions have not been taken into account in the table.
The undiscounted contractual cash flows of the finance lease liabilities are shown in a separate table on page 240.
Interest rate riskInterest rate risks exist as a result of potential changes in the market interest rate and may lead to a change in fair value in the case of fixed interest-bearing financial instruments and to fluctuations in interest payments in the case of variable interest-bearing financial instruments. The Managing Board and Supervisory Board of HeidelbergCement AG have decided against hedging the variable interest-bearing financial instruments. This strategy is based on the historically strong correlation between increasing profits and rising interest rates. For financial instruments with fixed interest that are measured at amortised cost, interest rate risk has no impact on the result and equity.
The hedging of the bonds issued with interest rate swaps in line with fair value hedge accounting has resulted in effects on results from the adjustment of the carrying amount of the hedged items (bonds – hedged risk) and from the valuation of the interest rate swaps. These effects on profit or loss were taken into account in the sen-sitivity analysis. The average proportion of variable interest-bearing financial instruments is 14.4% (previous year: 32.8%). If the market interest rate level had been 100 basis points higher (lower) on 31 December 2015, the interest cost of the HeidelbergCement Group would have risen (fallen) by €10.9 million (previous year: 29.4).
Currency riskHeidelbergCement’s currency risk results from its investing, financing, and operating activities. Risks from foreign currencies are generally hedged, insofar as they affect the Group’s cash flow. Currency forwards and foreign exchange swaps are used in the elimination of existing currency risks.
Through the in-house banking activities of HeidelbergCement AG, the borrowing and investment of liquidity of the subsidiaries leads to currency positions that are generally hedged by means of external foreign exchange swap transactions, which are appropriate in terms of maturities and amounts. Consequently, currency fluctuations in connection with the in-house banking activities usually have no impact on profit or loss or equity. Unhedged items only exist in isolated cases, such as where currencies are not convertible.
249HeidelbergCement | Annual Report 2015
Consolidated income statement
Consolidated statement of comprehensive income
Consolidated statement of cash flows
Consolidated balance sheet
Consolidated statement of changes in equity
Segment reporting / Notes to the consolidated financial statements
Notes to the 2015 consolidated financial statements
Audit opinion
Responsibility statement
Con
solid
ated
fin
anci
al s
tate
men
tsA
ddit
iona
l inf
orm
atio
n
4
5

The following table shows the hypothetical impact on the financial result assuming a 10% increase or decrease in the value of the foreign currency against the respective functional currency, whereby the positive values represent revenue and the negative values an expense in the income statement.
Sensitivity analysis of currency risk Increase in the value of the foreign currency by 10%
Decrease in the value of the foreign currency by 10%
€m 31 Dec. 2014 31 Dec. 2015 31 Dec. 2014 31 Dec. 2015
USD/GEL -9.3 -9.7 9.3 9.7
USD/GHS 0.0 1.1 0.0 -1.1
USD/UAH -1.3 1.3
USD/NOK 2.3 2.1 -2.3 -2.1
USD/KZT -1.5 1.5
By contrast, foreign currency risks that do not affect the Group’s cash flows (i.e. the risks resulting from the translation of the assets and liabilities of foreign subsidiaries into the Group reporting currency) generally remain unhedged. However, if necessary, HeidelbergCement can also hedge this foreign currency risk.
Other disclosures
Capital managementThe objective of capital management is to ensure sufficient liquidity for the Group at all times. Therefore, the Group makes use of external and internal financing opportunities (see Management Report, Group financial management chapter on page 82 f.). The net debt as well as the dynamic gearing ratio, which corresponds to the ratio of net debt to operating income before depreciation (OIBD), are of fundamental importance to the monitoring of the Group’s capital.
Net debt / OIBD
€m 31 Dec. 2014 31 Dec. 2015
Cash and derivative financial instruments 1,265.0 1,425.5
Interest-bearing liabilities 1) 8,221.8 6,711.5
Net debt 6,956.8 5,286.0
Operating income before depreciation (OIBD) 2,288.0 2,612.7
Net debt / OIBD 3.04 2.02
1) Incl. non-controlling interests with put options
In connection with credit agreements, we agreed to comply with various financial covenants, which were all met in the reporting period. The most important key financial ratios are the ratio of net debt to EBITDA and the interest coverage ratio. The EBITDA key figure is derived from the credit agreements and therefore differs from the operating income before depreciation (OIBD) key figure as it takes elements of the additional ordinary result and adjustments from changes in the scope of consolidation into consideration. Further explanations are given in the Management Report on page 83 f.
Within the context of the Group planning, compliance with the credit agreements is monitored consistently, with notifications issued to the creditors on a quarterly basis. In the event of a breach of the covenants, the creditors could, under certain conditions, accelerate corresponding loans irrespective of the contractually agreed terms.
250 HeidelbergCement | Annual Report 2015
Consolidated financial statements4

Contingent liabilitiesAs at the reporting date, contingent liabilities amounted to €328.8 million (previous year: 61.3), which are essentially related to tax and legal risks. The timing of the possible cash outflows for the contingent liabilities is uncertain because they depend on various external factors that remain outside HeidelbergCement’s control. The application of taxation regulations might not yet be determined at the time that tax refund claims and liabilities are calculated. The calculation of tax items is based on the regulations most likely to be applied in each case. Nevertheless, the fiscal authorities may be of a deviating opinion, which may give rise to additional tax liabilities.
Other financial commitmentsOn 28 July 2015, HeidelbergCement AG announced that it had entered into an agreement with Italmobiliare S.p.A. (“share purchase agreement”) on the acquisition of a 45% shareholding in Italcementi S.p.A. (“Italce-menti”). The purchase price amounts to €10.60 per Italcementi share. This corresponds to a total purchase price of around €1.67 billion for the 45% shareholding, which will be paid in cash and up to 10.5 million shares of HeidelbergCement AG from a capital increase in return for contributions in kind. The closing of the acquisition is subject to the usual conditions, including antitrust approvals particularly in Europe and the USA. The closing is expected during the 2016 financial year following the required antitrust approvals. HeidelbergCement will then submit a public mandatory offer to the remaining Italcementi shareholders. From today’s perspective, the offer price in accordance with applicable law is likely to amount to €10.60 per share in cash. The following table shows the remaining other financial commitments of the HeidelbergCement Group.
Other financial commitments
€m 31 Dec. 2014 31 Dec. 2015
Future minimum lease payments under non-cancellable operating leases 1)
Due within one year 146.8 163.2
Due between one and five years 312.6 354.0
Due after five years 311.1 321.7
770.5 838.9
Other financial commitments for planned investments in property, plant and equipment and financial assets 324.0 288.2
1) Prior year’s figures were adjusted by € 28.7 million in total.
Other financial commitments are listed with their nominal values. The future leasing obligations refer primarily to property and other assets used by HeidelbergCement.
Related parties disclosuresIAS 24 requires a statement concerning the most important relationships with related companies and persons that may exert a considerable influence on HeidelbergCement AG; the former are accounted for as joint ventures or associates, the latter hold key positions as members of the management.
As at 31 December 2015, Mr Ludwig Merckle, Ulm, holds via VEMOS 2 Beteiligungen GmbH, a company under his control, 26.2% of the voting rights in HeidelbergCement AG. HeidelbergCement AG provided services with a net amount of €115,600 (previous year: 129,800) to PHOENIX Pharmahandel GmbH & Co KG, Mannheim, a company of the Merckle Group.
251HeidelbergCement | Annual Report 2015
Consolidated income statement
Consolidated statement of comprehensive income
Consolidated statement of cash flows
Consolidated balance sheet
Consolidated statement of changes in equity
Segment reporting / Notes to the consolidated financial statements
Notes to the 2015 consolidated financial statements
Audit opinion
Responsibility statement
Con
solid
ated
fin
anci
al s
tate
men
tsA
ddit
iona
l inf
orm
atio
n
4
5

Revenue and other sales with joint ventures amounted to €53.0 million (previous year: 51.8). Raw materials, goods, and other services with a value of €264.9 million (previous year: 207.6) were procured from these joint ventures. A total of €6.5 million (previous year: 4.2) was generated in financial and other services. Receivables of €122.6 million (previous year: 155.2) and liabilities of €99.9 million (previous year: 99.0) exist in connection with these activities and financial transactions.
In addition, capital increases of €11.4 million (previous year: 5.1) were carried out for joint ventures. Repayment of capital from joint ventures to the parent company amounted to €0.6 million (previous year: 1.3). In the 2015 financial year, guarantees of €0.7 million (previous year: 0.9) were outstanding to joint ventures.
Business transactions with associates include revenue and other sales amounting to €17.6 million (previous year: 17.9), the procurement of goods and services amounting to €11.9 million (previous year: 8.6), and services provided amounting to €0.3 million (previous year: 0.4). Receivables of €26.1 million (previous year: 15.7) and liabilities of €13.1 million (previous year: 10.0) exist in connection with these activities and financial transactions.
In addition, capital increases of €1.8 million (previous year: 1.1) were carried out at associates in 2015. As in the previous year, no guarantees were outstanding to associates in the 2015 financial year.
Managing Board and Supervisory BoardWe refer to the details given in the Corporate Governance chapter of the Management Report on pages 148 f.
The fixed remuneration of the Managing Board increased in comparison with the previous year to €5.3 million (previous year: 5.0). The sum of short-term variable remuneration elements changed to €8.6 million (previous year: 7.6). It consisted of the annual bonus in the amount of €8.8 million (previous year: 8.1), of which €0.2 million (previous year: 0.6) was offset against other remuneration elements.
Other remuneration elements totalled €0.5 million (previous year: 0.9). The other remuneration elements con-sisted of payments for committee activities at subsidiaries of HeidelbergCement AG and taxable fringe benefits, particularly consisting of the provision of company cars, mobile phones, and communication tools, the reim-bursement of expenses, as well as insurance- and assignment-related benefits.
The members of the Managing Board are participating in the long-term bonus plan 2015–2017/18, granted in 2015. The target values for the plan are €2,250,000 for Dr. Bernd Scheifele, €1,219,000 for Dr. Dominik von Achten, €969,000 for Dr. Lorenz Näger, and €875,000 for each of the other members of the Managing Board. The plan comprises two equally weighted components: the management component and the capital market component. The target value of each component amounts to €1,125,000 for Dr. Bernd Scheifele, €609,000 for Dr. Dominik von Achten, €484,000 for Dr. Lorenz Näger, and €437,500 for Daniel Gauthier, Andreas Kern, and Dr. Albert Scheuer, respectively. The reference price for the capital market component amounts to €56.05. This equates to 20,071 performance share units (PSUs) for Dr. Bernd Scheifele, 10,872 PSUs for Dr. Dominik von Achten, 8,642 PSUs for Dr. Lorenz Näger, and 7,806 PSUs for each of the other members of the Managing Board.
In accordance with § 314, section 1, no. 6a, sentence 4 of the German Commercial Code (HGB), the fair value at the grant date must be indicated for the capital market components. It is €1,412,000 for Dr. Bernd Scheife-le, €765,000 for Dr. Dominik von Achten, €608,000 for Dr. Lorenz Näger, and €549,000 for each of the other members of the Managing Board.
The total remuneration according to DRS 17 amounted to €23.4 million (previous year: 21.5). For the calculation according to DRS 17, we refer to the explanations on page 155 f. in the Corporate Governance chapter of the Management Report.
252 HeidelbergCement | Annual Report 2015
Consolidated financial statements4

Expenses relating to the long-term capital market components of the last four issued and current long-term bonus plans in accordance with IFRS 2.51a amounted to €12.2 million (previous year: 6.0). Of this amount, €3,377,000 (previous year: 1,626,000) apply to Dr. Scheifele, €2,156,000 (previous year: 1,056,000) to Dr. von Achten, €1,704,000 (previous year: 835,000) to Dr. Näger, and €1,657,000 (previous year: 831,000) to each of the other members of the Managing Board. The expenses recognised relating to the long-term management component came to €6.9 million (previous year: 5.1).
Additions to the provisions for pension obligations (current service cost) for the current members of the Man-aging Board amounted to €2.6 million (previous year: 1.9). The present values of the defined benefit obligation amounted to €37.5 million (previous year: 37.2).
Total remuneration of the Managing Board in accordance with IAS 24 came to €36.1 million in 2015 (previous year: 26.4).
Payments to former members of the Managing Board and their surviving dependants amounted to €3.2 million in the reporting year (previous year: 3.0). Provisions for pension obligations to former members of the Managing Board amounted to €26.2 million (previous year: 28.0).
The total Supervisory Board remuneration (excluding value added tax) for the 2015 financial year amounted to €1,471,000 (previous year: 926,477). Employee representatives of the Supervisory Board who are employees of the HeidelbergCement Group also received remuneration in accordance with their contracts of employment, the level of which corresponded to an equitable remuneration for their relevant functions and tasks within the Group.
Furthermore, companies of the HeidelbergCement Group have not carried out reportable transactions of any kind with members of the Supervisory Board or members of the Managing Board as persons in key positions or with companies in whose executive or governing bodies these persons are represented.
Statement of compliance with the German Corporate Governance CodeThe statement of compliance with the German Corporate Governance Code as required by § 161 of the German Stock Company Act was submitted by the Managing Board and the Supervisory Board of HeidelbergCement AG and made available on the internet (www.heidelbergcement.com under “Company/Corporate Governance/Declaration of Corporate Governance”).
Fees of the independent auditorThe auditor Ernst & Young GmbH Wirtschaftsprüfungsgesellschaft received fees of €7.4 million (previous year: 4.8) in the financial year.
Fees of the independent auditor
€m 2014 2015
Audit services 1) 3.0 4.2
Other assurance services 0.2 0.2
Tax services 1.3 2.8
Other services 0.3 0.2
4.8 7.4
1) Thereof for the previous year: 2014: €0.2 million, 2015: €0.2 million
253HeidelbergCement | Annual Report 2015
Consolidated income statement
Consolidated statement of comprehensive income
Consolidated statement of cash flows
Consolidated balance sheet
Consolidated statement of changes in equity
Segment reporting / Notes to the consolidated financial statements
Notes to the 2015 consolidated financial statements
Audit opinion
Responsibility statement
Con
solid
ated
fin
anci
al s
tate
men
tsA
ddit
iona
l inf
orm
atio
n
4
5

Events occurring after the close of the 2015 financial yearOn 14 January 2016, HeidelbergCement placed debt certificates of €625 million, thereby further strengthening its financing structure. On 4 February 2016, the debt certificates were increased by €20 million to €645 million. With a term that expires by 20 January 2022, they consist of one tranche with variable yields and one tranche with fixed yields. The fixed discount rate is 1.85% per year, and the variable rate is 1.5% above the 6-month Euribor rate. The issue of the debt certificates was supported by Landesbank Baden-Württemberg, Landesbank Hessen-Thüringen, and Raiffeisen Bank International. As with all bonds issued since 2009 and the debt certificate completed in December 2011, the debt certificate documentation includes a limitation on incurring additional debt. The documentation also contains the same change in control clause for the bonds and debt certificates marked (3) in the type of clause column in the table on page 93. The issue proceeds serve to pre-finance the acquisition of Italcementi, thereby reducing the financing volume of the bridge financing from €3.3 billion to €2.7 billion. Accordingly, the refinancing requirement on the bond market has also fallen to below €2 billion.
Business combinations occurring after the close of the financial year can be found on page 197.
Approval of the consolidated financial statementsThe consolidated financial statements were prepared by the Managing Board and adopted on 16 March 2016. They were then submitted to the Supervisory Board for approval.
254 HeidelbergCement | Annual Report 2015
Consolidated financial statements4

List of shareholdings of HeidelbergCement Group and HeidelbergCement AG as at 31 December 2015 (§ 313, section 2, resp. § 285, no. 11 of the German Commercial Code (HGB)
Company name Corporate seat HC AG direct
owner-ship %
Capital share
% 6)
Group owner-ship %
Year 7) Equity in €
million 8)
Net income
in € million 9)
Subsidiaries
Western and Northern Europe
A.R.C. (Western) Limited Maidenhead, GBR 100.00 100.00 2014 7.9 0.0
Abetong AB Växjö, SWE 100.00 57.64 2015 14.4 11.8
Amey Group Limited (The) Maidenhead, GBR 100.00 100.00 2014 16.4 0.0
Amey Roadstone International Limited Maidenhead, GBR 100.00 100.00 2014 0.1 0.0
Appleby Group Limited Maidenhead, GBR 100.00 100.00 2014 34.7 0.9
ARC Aggregates Limited Maidenhead, GBR 100.00 100.00 2014 4.2 0.0
ARC Building Limited Maidenhead, GBR 100.00 100.00 2014 -23.2 0.0
ARC Concrete (Anglia) Limited Maidenhead, GBR 100.00 100.00 2014 0.0 0.0
ARC Concrete Limited Maidenhead, GBR 100.00 100.00 2014 0.0 0.0
ARC Holdings Limited Maidenhead, GBR 100.00 100.00 2014 0.1 0.0
ARC Land Holdings Limited Maidenhead, GBR 100.00 100.00 2014 0.3 0.0
ARC Limited Maidenhead, GBR 100.00 100.00 2014 0.0 0.0
ARC Property Investments Limited Maidenhead, GBR 100.00 100.00 2014 50.4 0.0
ARC Slimline Limited Maidenhead, GBR 100.00 100.00 2014 -4.1 0.0
ARC South Wales Limited Maidenhead, GBR 100.00 100.00 2014 0.0 0.0
ARC South Wales Mortar Limited Maidenhead, GBR 100.00 100.00 2014 0.0 0.0
ARC South Wales Quarries Limited Maidenhead, GBR 100.00 100.00 2014 0.0 0.0
ARC South Wales Surfacing Limited Maidenhead, GBR 100.00 100.00 2014 0.4 0.0
ARC Wales Limited Maidenhead, GBR 100.00 100.00 2014 0.0 0.0
Aridos Cabezogordo SLU 5) Madrid, ESP 100.00 100.00 - - -
Áridos Sanz S.L.U. Valladolid, ESP 100.00 100.00 2014 5.5 -0.1
AS Abetong Oslo, NOR 100.00 57.64 2014 0.6 0.0
Attendflower Limited Maidenhead, GBR 100.00 100.00 2014 1,288.0 0.0
B.V. Betoncentrale De Schelde Bergen op Zoom, NLD 66.67 66.67 2014 -1.1 0.1
B.V. Betonmortelcentrale 'BEMA' Alkmaar, NLD 66.67 66.67 2014 0.4 -0.6
Banbury Alton Limited Maidenhead, GBR 100.00 100.00 2014 -0.3 0.0
Bath and Portland Stone (Holdings) Limited Maidenhead, GBR 100.00 100.00 2014 0.1 0.0
Baustoffwerke Dresden GmbH & Co. KG 3) Dresden, DEU 51.00 51.00 2014 0.8 1.0
Beazer Limited Maidenhead, GBR 100.00 100.00 2014 8.0 -0.1
Beazer Services Limited Douglas, IMN 100.00 100.00 2014 1.5 0.0
Beforebeam Limited Maidenhead, GBR 100.00 100.00 2014 515.2 0.0
Beforeblend Limited Maidenhead, GBR 100.00 100.00 2014 262.4 0.0
Berec Holdings B.V. Amsterdam, NLD 100.00 100.00 2014 187.7 0.0
Beton Baguette Marcel S.A. Bruxelles, BEL 85.46 85.46 2014 2.7 0.3
Betong Sör AS Oslo, NOR 67.50 67.50 2014 0.7 -0.1
Betongindustri AB Stockholm, SWE 100.00 100.00 2015 4.2 0.1
Bickleylake Limited Maidenhead, GBR 100.00 100.00 2014 297.4 0.0
Birchwood Concrete Products Limited Maidenhead, GBR 100.00 100.00 2014 205.2 0.0
Birchwood Omnia Limited Maidenhead, GBR 100.00 100.00 2014 1,464.1 91.9
Björgun ehf Reykjavík, ISL 100.00 53.00 2014 5.0 0.3
255HeidelbergCement | Annual Report 2015
Consolidated income statement
Consolidated statement of comprehensive income
Consolidated statement of cash flows
Consolidated balance sheet
Consolidated statement of changes in equity
Segment reporting / Notes to the consolidated financial statements
Notes to the 2015 consolidated financial statements
Audit opinion
Responsibility statement
Con
solid
ated
fin
anci
al s
tate
men
tsA
ddit
iona
l inf
orm
atio
n
4
5

Company name Corporate seat HC AG direct
owner-ship %
Capital share
% 6)
Group owner-ship %
Year 7) Equity in €
million 8)
Net income
in € million 9)
BM Valla ehf Reykjavík, ISL 100.00 53.00 2014 4.1 0.7
Bonny Holding Ltd. Irish Town, GIB 100.00 93.94 2014 0.3 0.0
Boons Granite Quarries Limited Maidenhead, GBR 100.00 100.00 2014 0.0 0.0
Brazier Aggregates Limited Maidenhead, GBR 100.00 100.00 2014 2.1 0.0
Bristol Sand and Gravel Company Limited Maidenhead, GBR 100.00 100.00 2014 0.0 0.0
British Agricultural Services Limited Maidenhead, GBR 100.00 100.00 2014 459.2 13.5
British Ever Ready Limited Maidenhead, GBR 100.00 100.00 2014 31.1 0.0
Buckland Sand & Silica Company Limited Maidenhead, GBR 100.00 100.00 2014 0.1 0.0
Bulldog Company Limited St. Peter Port, GGY 100.00 100.00 2014 49.8 -2.9
Butterley Brick Investments (No 2) Limited Maidenhead, GBR 100.00 100.00 2014 33.5 0.0
Butterley Brick Limited Maidenhead, GBR 100.00 100.00 2014 0.6 0.0
C.B.R. Finance S.A. Luxembourg, LUX 100.00 100.00 2014 7.6 0.0
Calumite Limited Maidenhead, GBR 51.00 51.00 2014 1.6 1.4
Cantera El Hoyon, S.A.U. Madrid, ESP 100.00 100.00 2014 4.0 0.1
Canteras Mecánicas Cárcaba, S.A.U. Oviedo, ESP 100.00 100.00 2014 8.5 0.0
Carimat Béton S.A. Bruxelles, BEL 85.00 85.00 2014 1.0 0.0
Castle Building Products Limited Maidenhead, GBR 100.00 100.00 2014 -0.5 0.0
Castle Cement (Chatburn) Limited Maidenhead, GBR 100.00 100.00 2014 0.2 0.0
Castle Cement (Clyde) Limited Maidenhead, GBR 100.00 100.00 2014 0.1 0.0
Castle Cement (Ketton) Limited Maidenhead, GBR 100.00 100.00 2014 29.0 0.0
Castle Cement (Padeswood) Limited Maidenhead, GBR 100.00 100.00 2014 7.7 0.0
Castle Cement (Pitstone) Limited Maidenhead, GBR 100.00 100.00 2014 12.6 0.0
Castle Cement (Ribblesdale) Limited Maidenhead, GBR 100.00 100.00 2014 27.1 0.0
Castle Cement Limited Maidenhead, GBR 100.00 100.00 2015 365.9 53.6
Castle Lime Limited Maidenhead, GBR 100.00 100.00 2014 0.0 0.0
Castle Pension Scheme Trustees Limited Maidenhead, GBR 100.00 100.00 2014 0.0 0.0
CaucasusCement Holding B.V. 's-Hertogenbosch, NLD 75.00 75.00 2014 95.5 0.0
CBR Baltic B.V. 's-Hertogenbosch, NLD 100.00 100.00 2014 206.5 40.3
CBR International Services S.A. Bruxelles, BEL 100.00 100.00 2015 1,450.5 35.2
CBR Portland B.V. 's-Hertogenbosch, NLD 100.00 100.00 2014 73.7 0.0
Cem Invest Ltd 1) Irish Town, GIB 50.00 46.97 2014 2.5 2.3
Cementa AB Stockholm, SWE 100.00 100.00 2015 47.1 0.2
Cementa Fastighets AB Stockholm, SWE 100.00 100.00 2014 0.0 0.0
Cementrum I B.V. 's-Hertogenbosch, NLD 100.00 100.00 2014 144.3 -0.1
CGF Capital B.V. Amsterdam, NLD 100.00 100.00 2014 0.1 0.0
CHB Exeter Limited Maidenhead, GBR 100.00 100.00 2014 1.5 0.0
CHB Group Limited Maidenhead, GBR 100.00 100.00 2014 865.3 0.0
CHB P H R Limited Maidenhead, GBR 100.00 100.00 2014 -21.7 -0.7
CHB Products Limited Maidenhead, GBR 100.00 100.00 2014 2,575.9 0.0
Chemical Manufacture and Refining Limited Maidenhead, GBR 100.00 100.00 2014 7.0 0.0
Chester Road Sand and Gravel Company Limited Maidenhead, GBR 100.00 100.00 2014 0.0 0.0
City of London Heliport Limited Maidenhead, GBR 55.56 55.56 2014 -2.2 0.0
Civil and Marine (Holdings) Limited Maidenhead, GBR 100.00 100.00 2014 46.1 0.9
Civil and Marine Limited Maidenhead, GBR 100.00 100.00 2015 339.7 52.4
Civil and Marine Slag Cement Limited Maidenhead, GBR 100.00 100.00 2014 78.5 0.0
Claughton Manor Brick Limited (The) Maidenhead, GBR 100.00 100.00 2014 0.2 0.0
Clyde Cement Limited Maidenhead, GBR 100.00 100.00 2014 0.0 0.0
256 HeidelbergCement | Annual Report 2015
Consolidated financial statements4
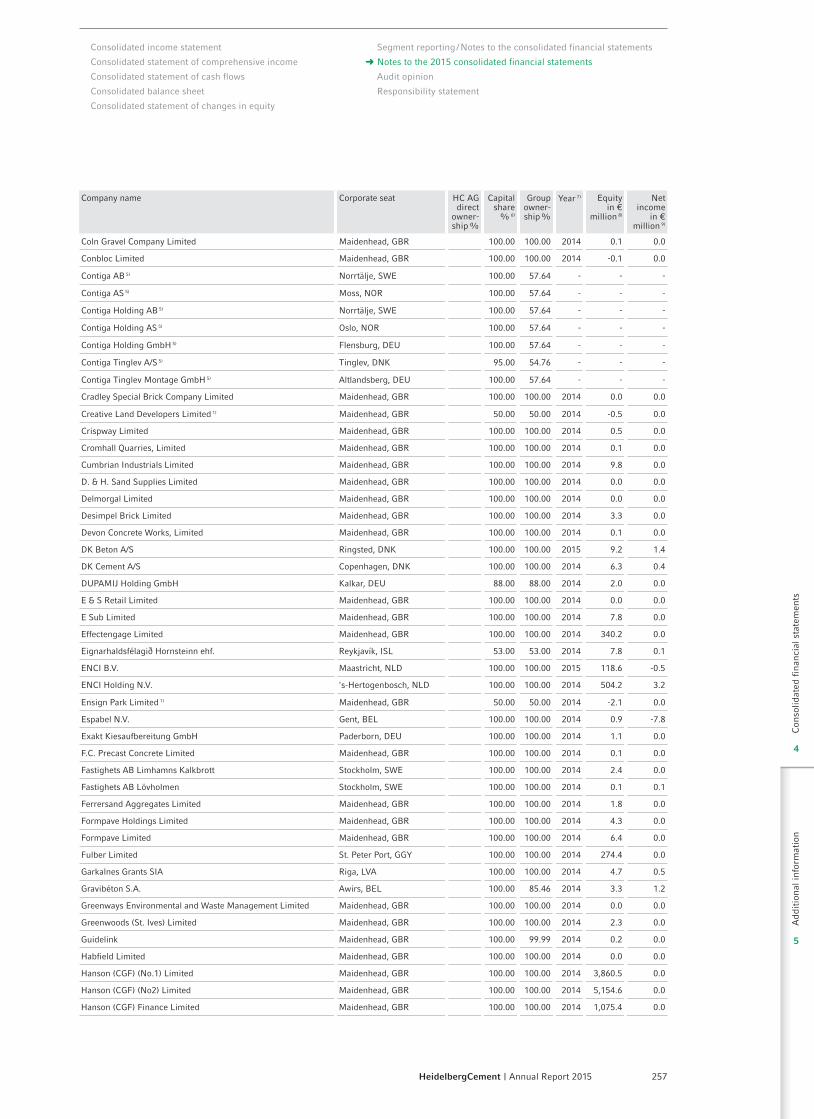
Company name Corporate seat HC AG direct
owner-ship %
Capital share
% 6)
Group owner-ship %
Year 7) Equity in €
million 8)
Net income
in € million 9)
Coln Gravel Company Limited Maidenhead, GBR 100.00 100.00 2014 0.1 0.0
Conbloc Limited Maidenhead, GBR 100.00 100.00 2014 -0.1 0.0
Contiga AB 5) Norrtälje, SWE 100.00 57.64 - - -
Contiga AS 5) Moss, NOR 100.00 57.64 - - -
Contiga Holding AB 5) Norrtälje, SWE 100.00 57.64 - - -
Contiga Holding AS 5) Oslo, NOR 100.00 57.64 - - -
Contiga Holding GmbH 5) Flensburg, DEU 100.00 57.64 - - -
Contiga Tinglev A/S 5) Tinglev, DNK 95.00 54.76 - - -
Contiga Tinglev Montage GmbH 5) Altlandsberg, DEU 100.00 57.64 - - -
Cradley Special Brick Company Limited Maidenhead, GBR 100.00 100.00 2014 0.0 0.0
Creative Land Developers Limited 1) Maidenhead, GBR 50.00 50.00 2014 -0.5 0.0
Crispway Limited Maidenhead, GBR 100.00 100.00 2014 0.5 0.0
Cromhall Quarries, Limited Maidenhead, GBR 100.00 100.00 2014 0.1 0.0
Cumbrian Industrials Limited Maidenhead, GBR 100.00 100.00 2014 9.8 0.0
D. & H. Sand Supplies Limited Maidenhead, GBR 100.00 100.00 2014 0.0 0.0
Delmorgal Limited Maidenhead, GBR 100.00 100.00 2014 0.0 0.0
Desimpel Brick Limited Maidenhead, GBR 100.00 100.00 2014 3.3 0.0
Devon Concrete Works, Limited Maidenhead, GBR 100.00 100.00 2014 0.1 0.0
DK Beton A/S Ringsted, DNK 100.00 100.00 2015 9.2 1.4
DK Cement A/S Copenhagen, DNK 100.00 100.00 2014 6.3 0.4
DUPAMIJ Holding GmbH Kalkar, DEU 88.00 88.00 2014 2.0 0.0
E & S Retail Limited Maidenhead, GBR 100.00 100.00 2014 0.0 0.0
E Sub Limited Maidenhead, GBR 100.00 100.00 2014 7.8 0.0
Effectengage Limited Maidenhead, GBR 100.00 100.00 2014 340.2 0.0
Eignarhaldsfélagið Hornsteinn ehf. Reykjavík, ISL 53.00 53.00 2014 7.8 0.1
ENCI B.V. Maastricht, NLD 100.00 100.00 2015 118.6 -0.5
ENCI Holding N.V. 's-Hertogenbosch, NLD 100.00 100.00 2014 504.2 3.2
Ensign Park Limited 1) Maidenhead, GBR 50.00 50.00 2014 -2.1 0.0
Espabel N.V. Gent, BEL 100.00 100.00 2014 0.9 -7.8
Exakt Kiesaufbereitung GmbH Paderborn, DEU 100.00 100.00 2014 1.1 0.0
F.C. Precast Concrete Limited Maidenhead, GBR 100.00 100.00 2014 0.1 0.0
Fastighets AB Limhamns Kalkbrott Stockholm, SWE 100.00 100.00 2014 2.4 0.0
Fastighets AB Lövholmen Stockholm, SWE 100.00 100.00 2014 0.1 0.1
Ferrersand Aggregates Limited Maidenhead, GBR 100.00 100.00 2014 1.8 0.0
Formpave Holdings Limited Maidenhead, GBR 100.00 100.00 2014 4.3 0.0
Formpave Limited Maidenhead, GBR 100.00 100.00 2014 6.4 0.0
Fulber Limited St. Peter Port, GGY 100.00 100.00 2014 274.4 0.0
Garkalnes Grants SIA Riga, LVA 100.00 100.00 2014 4.7 0.5
Gravibéton S.A. Awirs, BEL 100.00 85.46 2014 3.3 1.2
Greenways Environmental and Waste Management Limited Maidenhead, GBR 100.00 100.00 2014 0.0 0.0
Greenwoods (St. Ives) Limited Maidenhead, GBR 100.00 100.00 2014 2.3 0.0
Guidelink Maidenhead, GBR 100.00 99.99 2014 0.2 0.0
Habfield Limited Maidenhead, GBR 100.00 100.00 2014 0.0 0.0
Hanson (CGF) (No.1) Limited Maidenhead, GBR 100.00 100.00 2014 3,860.5 0.0
Hanson (CGF) (No2) Limited Maidenhead, GBR 100.00 100.00 2014 5,154.6 0.0
Hanson (CGF) Finance Limited Maidenhead, GBR 100.00 100.00 2014 1,075.4 0.0
257HeidelbergCement | Annual Report 2015
Consolidated income statement
Consolidated statement of comprehensive income
Consolidated statement of cash flows
Consolidated balance sheet
Consolidated statement of changes in equity
Segment reporting / Notes to the consolidated financial statements
Notes to the 2015 consolidated financial statements
Audit opinion
Responsibility statement
Con
solid
ated
fin
anci
al s
tate
men
tsA
ddit
iona
l inf
orm
atio
n
4
5

Company name Corporate seat HC AG direct
owner-ship %
Capital share
% 6)
Group owner-ship %
Year 7) Equity in €
million 8)
Net income
in € million 9)
Hanson (CGF) Holdings Limited Maidenhead, GBR 100.00 100.00 2014 301.9 0.0
Hanson (ER - No 5) Limited Maidenhead, GBR 100.00 100.00 2014 464.5 -45.3
Hanson (ER-No 10) Limited Maidenhead, GBR 100.00 100.00 2014 327.5 0.0
Hanson (ER-No 8) Limited Maidenhead, GBR 100.00 100.00 2014 0.3 0.0
Hanson (ER-No 9) Limited Maidenhead, GBR 100.00 100.00 2014 4.3 0.0
Hanson (FP) Limited Maidenhead, GBR 100.00 100.00 2014 8,231.1 0.0
Hanson (MR) Limited Maidenhead, GBR 100.00 99.99 2014 2,827.7 0.0
Hanson (NAIL) Limited Maidenhead, GBR 100.00 100.00 2014 7.0 0.0
Hanson (SH) Limited Maidenhead, GBR 100.00 100.00 2014 57.8 0.0
Hanson Aggregates (North) Limited Maidenhead, GBR 100.00 100.00 2014 52.0 0.0
Hanson Aggregates Holding Nederland B.V. Amsterdam, NLD 100.00 100.00 2014 3.4 -1.3
Hanson Aggregates Limited Maidenhead, GBR 100.00 100.00 2014 105.4 0.0
Hanson Aggregates Marine Limited Maidenhead, GBR 100.00 100.00 2015 229.2 3.0
Hanson Aggregates Nederland B.V. Amsterdam, NLD 100.00 100.00 2014 -0.8 -1.5
Hanson Aggregates South Wales Holdings Limited Maidenhead, GBR 100.00 100.00 2014 8.7 0.0
Hanson Aggregates South Wales Limited Maidenhead, GBR 100.00 100.00 2014 49.9 0.0
Hanson Aggregates UK Limited Maidenhead, GBR 100.00 100.00 2014 2,576.1 0.0
Hanson America Holdings (1) Limited Maidenhead, GBR 100.00 100.00 2014 2,449.2 0.0
Hanson America Holdings (2) Limited Maidenhead, GBR 100.00 100.00 2014 613.4 0.0
Hanson America Holdings (3) Limited Maidenhead, GBR 100.00 100.00 2014 606.2 0.0
Hanson America Holdings (4) Limited Maidenhead, GBR 100.00 100.00 2014 179.5 0.5
Hanson Aruba Limited St. Peter Port, GGY 99.99 99.99 2014 1,744.9 0.0
Hanson Bath and Portland Stone Limited Maidenhead, GBR 100.00 100.00 2014 -2.8 0.0
Hanson Batteries Limited Maidenhead, GBR 100.00 100.00 2014 59.5 0.0
Hanson Blocks North Limited Maidenhead, GBR 100.00 100.00 2014 17.0 0.0
Hanson Brick Ltd Maidenhead, GBR 100.00 100.00 2014 0.3 0.0
Hanson Building Materials Europe Limited Maidenhead, GBR 100.00 100.00 2014 2,903.3 0.0
Hanson Building Materials Limited Maidenhead, GBR 100.00 100.00 2014 4,103.5 -4.6
Hanson Building Products (2003) Limited Maidenhead, GBR 100.00 100.00 2014 2,003.0 0.0
Hanson Building Products Limited St. Helier, JE 100.00 100.00 2014 0.1 0.0
Hanson Canada Limited Maidenhead, GBR 100.00 100.00 2014 1.2 0.2
Hanson Clay Products Limited Maidenhead, GBR 100.00 100.00 2014 19.6 0.0
Hanson Concrete Products Limited Maidenhead, GBR 100.00 100.00 2014 66.5 0.0
Hanson Crewing Services Limited Maidenhead, GBR 100.00 100.00 2014 0.0 0.0
Hanson Devon Limited Shannon, IRL 100.00 100.00 2014 4,351.3 -0.2
Hanson Facing Bricks Limited Maidenhead, GBR 100.00 100.00 2014 319.4 0.0
Hanson Finance (2003) Limited Maidenhead, GBR 100.00 100.00 2014 603.1 -5.6
Hanson Finance Limited Maidenhead, GBR 100.00 100.00 2014 951.3 -22.5
Hanson Financial Services Limited Maidenhead, GBR 100.00 100.00 2014 127.6 0.1
Hanson Fletton Bricks Limited Maidenhead, GBR 100.00 100.00 2014 40.7 0.0
Hanson Foods Limited Maidenhead, GBR 100.00 100.00 2014 218.3 0.0
Hanson FP Holdings B.V. Amsterdam, NLD 100.00 100.00 2014 392.8 1.8
Hanson Funding (G) Limited Maidenhead, GBR 100.00 100.00 2014 223.8 0.0
Hanson Germany GmbH & Co. KG 3) Leinatal, DEU 100.00 100.00 2014 1.0 0.5
Hanson Gerrard Limited St. Peter Port, GGY 100.00 100.00 2014 0.0 0.0
Hanson H4 Limited Maidenhead, GBR 100.00 100.00 2014 1,994.8 0.0
Hanson H5 Maidenhead, GBR 100.00 100.00 2014 0.1 0.0
258 HeidelbergCement | Annual Report 2015
Consolidated financial statements4

Company name Corporate seat HC AG direct
owner-ship %
Capital share
% 6)
Group owner-ship %
Year 7) Equity in €
million 8)
Net income
in € million 9)
Hanson Hedging (Dollars) (1) Limited Maidenhead, GBR 100.00 100.00 2014 250.2 0.0
Hanson Hedging (Dollars) (2) Limited Maidenhead, GBR 100.00 100.00 2014 0.0 0.0
Hanson Hispania, S.A.U. Madrid, ESP 100.00 100.00 2015 102.7 -7.5
Hanson Holdings (1) Limited Maidenhead, GBR 100.00 100.00 2014 48,610.6 -324.5
Hanson Holdings (2) Limited Maidenhead, GBR 100.00 100.00 2014 1,294.8 -55.5
Hanson Holdings (3) Limited Maidenhead, GBR 100.00 100.00 2014 1,067.6 0.0
Hanson Holdings Limited Maidenhead, GBR 100.00 100.00 2014 2,688.7 134.7
Hanson Iceland EHF Reykjavík, ISL 100.00 100.00 2014 2,575.1 -0.1
Hanson Industrial (Engineering Holdings) Limited Maidenhead, GBR 100.00 100.00 2014 7.0 0.0
Hanson Industrial Limited Maidenhead, GBR 100.00 100.00 2014 201.9 0.0
Hanson International Holdings Limited Maidenhead, GBR 100.00 100.00 2014 14,533.8 -22.0
Hanson Island Management Limited St. Peter Port, GGY 100.00 100.00 2014 0.0 -0.2
Hanson Land Development Limited Maidenhead, GBR 100.00 100.00 2014 -38.0 0.0
Hanson LHA Limited Maidenhead, GBR 100.00 100.00 2014 0.0 0.0
Hanson Limited Maidenhead, GBR 100.00 100.00 2015 8,724.2 -46.1
Hanson Marine Holdings Limited Maidenhead, GBR 100.00 100.00 2014 3.2 0.0
Hanson Marine Limited Maidenhead, GBR 100.00 100.00 2014 35.4 -0.8
Hanson Overseas Corporation Limited Maidenhead, GBR 100.00 100.00 2014 2,430.6 0.0
Hanson Overseas Holdings Limited Maidenhead, GBR 100.00 100.00 2014 23,014.2 30.5
Hanson Packed Products Limited Maidenhead, GBR 100.00 100.00 2015 349.8 443.1
Hanson Peabody Limited Maidenhead, GBR 100.00 100.00 2014 1,292.4 0.0
Hanson Pioneer España, S.L.U. Madrid, ESP 100.00 100.00 2014 478.9 -1.0
Hanson Quarry Products Europe Limited Maidenhead, GBR 100.00 100.00 2015 53,800.7 8.3
Hanson Quarry Products Holdings Limited Maidenhead, GBR 100.00 100.00 2014 53.7 0.0
Hanson Quarry Products Overseas Limited Maidenhead, GBR 100.00 100.00 2014 2.6 0.0
Hanson Quarry Products Trade Finance Limited Maidenhead, GBR 100.00 100.00 2014 3.9 0.0
Hanson Quarry Products Transport Limited Maidenhead, GBR 100.00 100.00 2014 0.1 0.0
Hanson Quarry Products Ventures Limited Maidenhead, GBR 100.00 100.00 2014 57.1 0.1
Hanson Recycling Limited Maidenhead, GBR 100.00 100.00 2014 0.0 0.0
Hanson Retail Limited Maidenhead, GBR 100.00 100.00 2014 499.4 -0.5
Hanson Ship Management Ltd St. Peter Port, GGY 100.00 100.00 2014 0.0 -0.1
Hanson Thermalite Limited Maidenhead, GBR 100.00 100.00 2014 53.7 0.0
Hanson TIS Holdings Limited Maidenhead, GBR 100.00 100.00 2014 0.0 0.0
Hanson TIS Limited Maidenhead, GBR 100.00 100.00 2014 -3.3 -0.1
Hanson Trust Limited Maidenhead, GBR 100.00 100.00 2014 125.4 0.0
Hanson Trustees Limited Maidenhead, GBR 100.00 100.00 2014 -1.8 0.0
Harrisons Limeworks Limited Maidenhead, GBR 100.00 100.00 2014 0.1 0.0
Hartsholme Property Limited Maidenhead, GBR 100.00 100.00 2014 0.1 0.0
HB Hotels Limited Maidenhead, GBR 100.00 100.00 2014 -0.7 0.0
HC Asia Holding GmbH Heidelberg, DEU 100.00 100.00 100.00 2014 56.2 7.4
HC Betons SIA Riga, LVA 100.00 100.00 2014 0.9 -0.3
HC Betoon AS, Estonia Tallinn, EST 100.00 100.00 2014 6.0 -0.7
HC Fuels Limited London, GBR 100.00 100.00 2014 11.3 0.1
HC Green Trading Limited St. Julian's, MLT 100.00 100.00 2014 -0.1 0.4
HC Hanson Holding B.V. 's-Hertogenbosch, NLD 100.00 100.00 2014 326.6 0.0
HC Italia SRL Rome, ITA 100.00 100.00 2014 0.3 -0.3
HC Trading B.V. 's-Hertogenbosch, NLD 100.00 100.00 2014 -2.5 -8.6
259HeidelbergCement | Annual Report 2015
Consolidated income statement
Consolidated statement of comprehensive income
Consolidated statement of cash flows
Consolidated balance sheet
Consolidated statement of changes in equity
Segment reporting / Notes to the consolidated financial statements
Notes to the 2015 consolidated financial statements
Audit opinion
Responsibility statement
Con
solid
ated
fin
anci
al s
tate
men
tsA
ddit
iona
l inf
orm
atio
n
4
5

Company name Corporate seat HC AG direct
owner-ship %
Capital share
% 6)
Group owner-ship %
Year 7) Equity in €
million 8)
Net income
in € million 9)
HC Trading Malta Limited St. Julian's, MLT 100.00 100.00 2014 0.0 33.0
HCT Holding Malta Limited St. Julian's, MLT 100.00 100.00 100.00 2014 119.7 31.3
Heidelberg Cement Iceland EHF Reykjavík, ISL 100.00 100.00 2014 0.0 0.0
HeidelbergCement BP Limited Maidenhead, GBR 100.00 100.00 2015 0.1 0.0
HeidelbergCement Canada Holding Limited Maidenhead, GBR 100.00 100.00 2014 3,197.3 83.9
HeidelbergCement Central Europe East Holding B.V. 's-Hertogenbosch, NLD 100.00 100.00 2014 1,267.5 162.4
HeidelbergCement Danmark A/S Ringsted, DNK 100.00 100.00 2014 50.3 0.0
HeidelbergCement Euro I Limited Maidenhead, GBR 100.00 100.00 2014 395.1 0.9
HeidelbergCement Euro II Limited Maidenhead, GBR 100.00 100.00 2014 691.5 1.5
HeidelbergCement Euro III Limited 5) Maidenhead, GBR 100.00 100.00 - - -
HeidelbergCement Finance B.V. 's-Hertogenbosch, NLD 100.00 100.00 2014 22.1 -20.7
HeidelbergCement Finance Luxembourg S.A. Luxembourg, LUX 100.00 100.00 2015 11.6 106.6
HeidelbergCement France S.A.S. 5) Thourotte, FRA 100.00 100.00 - - -
HeidelbergCement Grundstücksgesellschaft mbH & Co. KG 3) Heidelberg, DEU 100.00 100.00 100.00 2014 17.5 1.4
HeidelbergCement Holding Coöperatief U.A. 's-Hertogenbosch, NLD 100.00 100.00 2014 1,125.4 40.3
HeidelbergCement Holding S.à r.l. Luxembourg, LUX 100.00 100.00 2014 20,045.6 205.4
HeidelbergCement Holdings Limited Maidenhead, GBR 100.00 100.00 100.00 2014 2.5 0.0
HeidelbergCement International Holding GmbH Heidelberg, DEU 100.00 100.00 100.00 2014 12,824.7 -
HeidelbergCement Mediterranean Basin Holdings S.L. Madrid, ESP 100.00 100.00 2014 300.7 17.6
HeidelbergCement Miljö AB Stockholm, SWE 100.00 100.00 2014 1.9 0.0
HeidelbergCement Netherlands Holding B.V. 's-Hertogenbosch, NLD 14.54 100.00 100.00 2014 779.1 6.9
HeidelbergCement Northern Europe AB Stockholm, SWE 100.00 100.00 2014 1,237.6 105.5
HeidelbergCement Northern Europe Pumps & Trucks A/S Ringsted, DNK 100.00 100.00 2014 0.7 0.4
HeidelbergCement Norway a.s. Oslo, NOR 100.00 100.00 2015 202.9 -33.6
HeidelbergCement Sweden AB Stockholm, SWE 100.00 100.00 2014 205.1 1.3
HeidelbergCement UK Holding II Limited Maidenhead, GBR 100.00 100.00 2014 13,488.2 218.3
HeidelbergCement UK Holding Limited Maidenhead, GBR 100.00 100.00 2014 11,528.8 -513.8
HeidelbergCement UK Limited Maidenhead, GBR 100.00 100.00 100.00 2015 109.0 0.0
HeidelbergCement, Funk & Kapphan Grundstücksgesellschaft GmbH & Co. KG Heidelberg, DEU 79.91 79.91 79.91 2014 0.0 0.0
Heidelberger Beton Donau-Naab GmbH & Co. KG 3) Burglengenfeld, DEU 85.00 85.00 2014 1.5 1.2
Heidelberger Beton GmbH Heidelberg, DEU 100.00 100.00 100.00 2014 86.3 11.7
Heidelberger Betonelemente GmbH & Co. KG 3) Chemnitz, DEU 83.00 83.00 2014 4.7 3.7
Heidelberger Betonpumpen Rhein-Main-Nahe GmbH & Co. KG 3) Bad Kreuznach, DEU 100.00 93.77 2014 0.6 0.4
Heidelberger Kalksandstein GmbH Durmersheim, DEU 100.00 100.00 2014 14.5 0.0
Heidelberger Kalksandstein Grundstücks- und Beteiligungs- GmbH & Co. KG 3) Durmersheim, DEU 100.00 100.00 2014 17.5 1.9
Heidelberger Kieswerke Niederrhein GmbH Essen, DEU 100.00 100.00 2014 0.9 0.0
Heidelberger Kieswerke Rhein-Ruhr GmbH Essen, DEU 100.00 100.00 2014 3.8 0.8
Heidelberger KS Beteiligungen Deutschland GmbH & Co. KG 3) Heidelberg, DEU 100.00 100.00 2014 4.6 1.2
Heidelberger Sand und Kies GmbH Heidelberg, DEU 100.00 100.00 100.00 2014 67.4 11.6
Heidelberger Sand und Kies Handel & Logistik GmbH Essen, DEU 100.00 100.00 2014 0.0 0.1
HIPS (Trustees) Limited Bedford, GBR 100.00 100.00 2014 0.0 0.0
HK Holdings (No 2) Limited Maidenhead, GBR 100.00 100.00 2014 82.9 0.0
HK Holdings (No.1) Limited Maidenhead, GBR 100.00 100.00 2014 36.0 0.0
HKS Hunziker Kalksandstein AG Brugg, CHE 100.00 100.00 2014 8.2 1.7
Holms Sand & Gravel Company (1985) (The) Maidenhead, GBR 100.00 100.00 2014 0.0 0.0
Holms Sand & Gravel Company Limited (The) Maidenhead, GBR 100.00 100.00 2014 0.0 0.0
260 HeidelbergCement | Annual Report 2015
Consolidated financial statements4
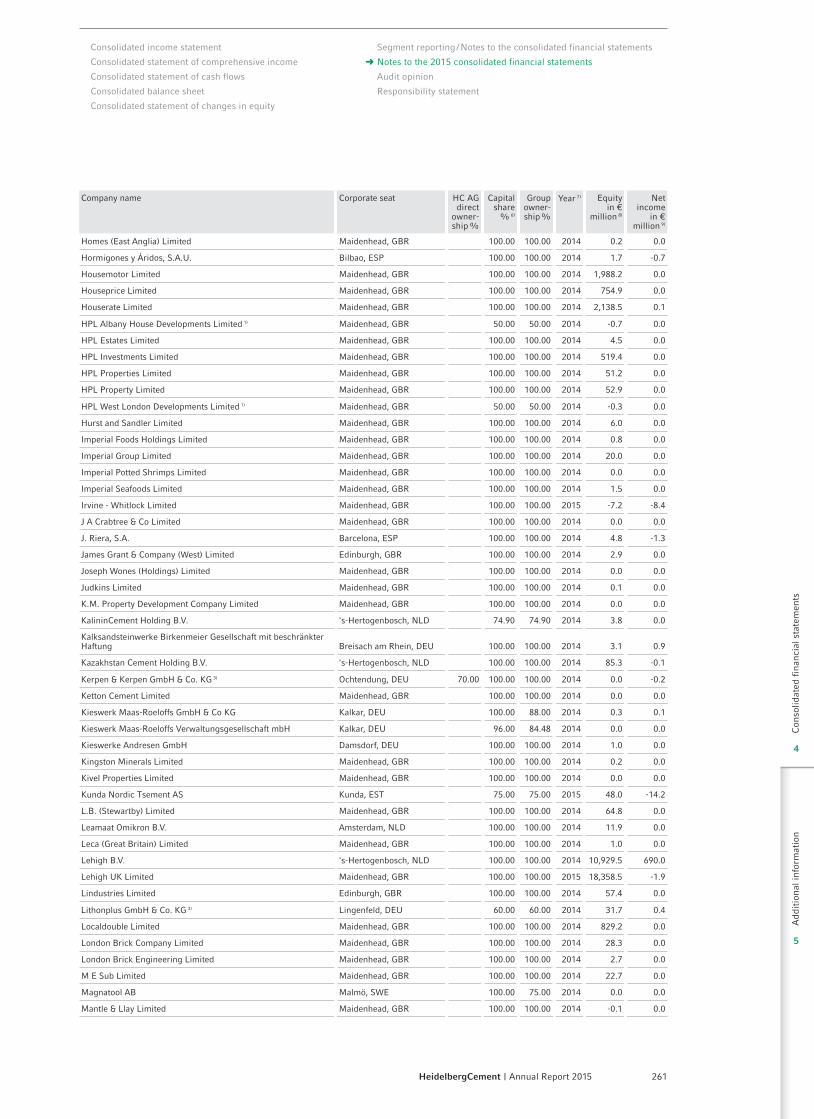
Company name Corporate seat HC AG direct
owner-ship %
Capital share
% 6)
Group owner-ship %
Year 7) Equity in €
million 8)
Net income
in € million 9)
Homes (East Anglia) Limited Maidenhead, GBR 100.00 100.00 2014 0.2 0.0
Hormigones y Áridos, S.A.U. Bilbao, ESP 100.00 100.00 2014 1.7 -0.7
Housemotor Limited Maidenhead, GBR 100.00 100.00 2014 1,988.2 0.0
Houseprice Limited Maidenhead, GBR 100.00 100.00 2014 754.9 0.0
Houserate Limited Maidenhead, GBR 100.00 100.00 2014 2,138.5 0.1
HPL Albany House Developments Limited 1) Maidenhead, GBR 50.00 50.00 2014 -0.7 0.0
HPL Estates Limited Maidenhead, GBR 100.00 100.00 2014 4.5 0.0
HPL Investments Limited Maidenhead, GBR 100.00 100.00 2014 519.4 0.0
HPL Properties Limited Maidenhead, GBR 100.00 100.00 2014 51.2 0.0
HPL Property Limited Maidenhead, GBR 100.00 100.00 2014 52.9 0.0
HPL West London Developments Limited 1) Maidenhead, GBR 50.00 50.00 2014 -0.3 0.0
Hurst and Sandler Limited Maidenhead, GBR 100.00 100.00 2014 6.0 0.0
Imperial Foods Holdings Limited Maidenhead, GBR 100.00 100.00 2014 0.8 0.0
Imperial Group Limited Maidenhead, GBR 100.00 100.00 2014 20.0 0.0
Imperial Potted Shrimps Limited Maidenhead, GBR 100.00 100.00 2014 0.0 0.0
Imperial Seafoods Limited Maidenhead, GBR 100.00 100.00 2014 1.5 0.0
Irvine - Whitlock Limited Maidenhead, GBR 100.00 100.00 2015 -7.2 -8.4
J A Crabtree & Co Limited Maidenhead, GBR 100.00 100.00 2014 0.0 0.0
J. Riera, S.A. Barcelona, ESP 100.00 100.00 2014 4.8 -1.3
James Grant & Company (West) Limited Edinburgh, GBR 100.00 100.00 2014 2.9 0.0
Joseph Wones (Holdings) Limited Maidenhead, GBR 100.00 100.00 2014 0.0 0.0
Judkins Limited Maidenhead, GBR 100.00 100.00 2014 0.1 0.0
K.M. Property Development Company Limited Maidenhead, GBR 100.00 100.00 2014 0.0 0.0
KalininCement Holding B.V. 's-Hertogenbosch, NLD 74.90 74.90 2014 3.8 0.0
Kalksandsteinwerke Birkenmeier Gesellschaft mit beschränkter Haftung Breisach am Rhein, DEU 100.00 100.00 2014 3.1 0.9
Kazakhstan Cement Holding B.V. 's-Hertogenbosch, NLD 100.00 100.00 2014 85.3 -0.1
Kerpen & Kerpen GmbH & Co. KG 3) Ochtendung, DEU 70.00 100.00 100.00 2014 0.0 -0.2
Ketton Cement Limited Maidenhead, GBR 100.00 100.00 2014 0.0 0.0
Kieswerk Maas-Roeloffs GmbH & Co KG Kalkar, DEU 100.00 88.00 2014 0.3 0.1
Kieswerk Maas-Roeloffs Verwaltungsgesellschaft mbH Kalkar, DEU 96.00 84.48 2014 0.0 0.0
Kieswerke Andresen GmbH Damsdorf, DEU 100.00 100.00 2014 1.0 0.0
Kingston Minerals Limited Maidenhead, GBR 100.00 100.00 2014 0.2 0.0
Kivel Properties Limited Maidenhead, GBR 100.00 100.00 2014 0.0 0.0
Kunda Nordic Tsement AS Kunda, EST 75.00 75.00 2015 48.0 -14.2
L.B. (Stewartby) Limited Maidenhead, GBR 100.00 100.00 2014 64.8 0.0
Leamaat Omikron B.V. Amsterdam, NLD 100.00 100.00 2014 11.9 0.0
Leca (Great Britain) Limited Maidenhead, GBR 100.00 100.00 2014 1.0 0.0
Lehigh B.V. 's-Hertogenbosch, NLD 100.00 100.00 2014 10,929.5 690.0
Lehigh UK Limited Maidenhead, GBR 100.00 100.00 2015 18,358.5 -1.9
Lindustries Limited Edinburgh, GBR 100.00 100.00 2014 57.4 0.0
Lithonplus GmbH & Co. KG 3) Lingenfeld, DEU 60.00 60.00 2014 31.7 0.4
Localdouble Limited Maidenhead, GBR 100.00 100.00 2014 829.2 0.0
London Brick Company Limited Maidenhead, GBR 100.00 100.00 2014 28.3 0.0
London Brick Engineering Limited Maidenhead, GBR 100.00 100.00 2014 2.7 0.0
M E Sub Limited Maidenhead, GBR 100.00 100.00 2014 22.7 0.0
Magnatool AB Malmö, SWE 100.00 75.00 2014 0.0 0.0
Mantle & Llay Limited Maidenhead, GBR 100.00 100.00 2014 -0.1 0.0
261HeidelbergCement | Annual Report 2015
Consolidated income statement
Consolidated statement of comprehensive income
Consolidated statement of cash flows
Consolidated balance sheet
Consolidated statement of changes in equity
Segment reporting / Notes to the consolidated financial statements
Notes to the 2015 consolidated financial statements
Audit opinion
Responsibility statement
Con
solid
ated
fin
anci
al s
tate
men
tsA
ddit
iona
l inf
orm
atio
n
4
5

Company name Corporate seat HC AG direct
owner-ship %
Capital share
% 6)
Group owner-ship %
Year 7) Equity in €
million 8)
Net income
in € million 9)
Marnee Limited Maidenhead, GBR 100.00 100.00 2014 69.2 0.0
Marples Ridgway Limited Maidenhead, GBR 100.00 100.00 2014 -5.1 0.0
Marples Ridgway Overseas Limited Maidenhead, GBR 100.00 100.00 2014 0.1 0.0
Matériaux et Béton du Nord S.à r.l. Halluin, FRA 100.00 100.00 2014 0.3 0.0
Mebin B.V. 's-Hertogenbosch, NLD 100.00 100.00 2015 36.2 -8.4
Mebin Leeuwarden B.V. Leeuwarden, NLD 79.79 79.79 2014 1.1 0.1
Meppeler Betoncentrale B.V. Meppel, NLD 66.67 66.67 2014 0.0 -0.2
Midland Quarry Products Limited Maidenhead, GBR 100.00 100.00 2015 144.2 28.2
Milton Hall (Southend) Brick Company Limited (The) Maidenhead, GBR 100.00 100.00 2014 1.7 0.0
Minster Quarries Limited Maidenhead, GBR 100.00 100.00 2014 -1.6 0.0
Mixconcrete Holdings Limited Maidenhead, GBR 100.00 100.00 2014 5.0 0.0
Mixconcrete Limited Maidenhead, GBR 100.00 100.00 2014 -2.3 0.0
Mold Tar Macadam Co.Limited Maidenhead, GBR 100.00 100.00 2014 0.0 0.0
Morebeat Limited Maidenhead, GBR 100.00 100.00 2014 157.8 0.0
Motioneager Limited Maidenhead, GBR 100.00 100.00 2014 274.3 0.0
National Brick Company Limited Maidenhead, GBR 100.00 100.00 2014 3.2 0.0
National Star Brick and Tile Holdings Limited Maidenhead, GBR 100.00 100.00 2014 2.8 0.0
National Star Limited Maidenhead, GBR 100.00 100.00 2014 0.1 0.0
NedCem Holding B.V. 's-Hertogenbosch, NLD 100.00 66.67 2014 0.8 0.0
Nor Element AS 5) Mandal, NOR 100.00 57.64 - - -
Norbetong AS Oslo, NOR 100.00 100.00 2015 60.6 2.1
Norbetong Pumping AS Oslo, NOR 75.50 75.50 2014 0.3 0.0
Norcem AS Oslo, NOR 100.00 100.00 2015 41.9 0.7
Nordic Precast Group AB 5) Stockholm, SWE 57.64 57.64 - - -
NorStone AS Oslo, NOR 100.00 100.00 2015 16.9 0.3
P. & B. J. Dallimore Limited Maidenhead, GBR 100.00 100.00 2014 0.1 0.0
Paderborner Transport - Beton - Gesellschaft mit beschränkter Haftung & Co. K.-G. 3) Geseke, DEU 87.50 87.50 2014 0.8 0.1
Padyear Limited 1) Maidenhead, GBR 50.00 50.00 2014 -0.2 0.0
Palatina Insurance Ltd. Sliema, MLT 100.00 100.00 2014 44.9 -1.3
Paperbefore Limited Maidenhead, GBR 100.00 100.00 2014 387.6 0.0
Pencrete Limited Maidenhead, GBR 100.00 100.00 2014 0.1 0.0
Penfolds Builders Merchants Limited Maidenhead, GBR 100.00 100.00 2014 0.1 0.0
Picon Overseas Limited St. Peter Port, GGY 100.00 100.00 2014 176.4 13.6
Piedras y Derivados, S.A.U. Barcelona, ESP 100.00 100.00 2014 18.6 1.4
PILC Limited St. Peter Port, GGY 100.00 100.00 2014 19.6 0.0
Pimco 2945 Limited Maidenhead, GBR 100.00 100.00 2014 5.2 0.0
Pinden Plant & Processing Co. Limited (The) Maidenhead, GBR 100.00 100.00 2014 7.2 0.0
Pioneer Aggregates (UK) Limited Maidenhead, GBR 100.00 100.00 2014 4.6 0.0
Pioneer Asphalts (U.K.) Limited Maidenhead, GBR 100.00 100.00 2014 0.0 0.0
Pioneer Concrete (U.K.) Limited Maidenhead, GBR 100.00 100.00 2014 0.0 0.0
Pioneer Concrete Development Limited Maidenhead, GBR 100.00 100.00 2014 0.0 0.0
Pioneer Concrete Holdings Limited Maidenhead, GBR 100.00 100.00 2014 150.0 0.0
Pioneer International Group Holdings Limited Maidenhead, GBR 100.00 100.00 2014 1,140.4 0.0
Pioneer International Investments Limited Maidenhead, GBR 100.00 100.00 2014 0.1 0.0
Pioneer Investments UK Limited Maidenhead, GBR 100.00 100.00 2014 0.1 0.0
Pioneer Overseas Investments Limited St. Peter Port, GGY 100.00 100.00 2014 118.7 0.0
Pioneer Willment Concrete Limited Maidenhead, GBR 100.00 100.00 2014 0.0 0.0
262 HeidelbergCement | Annual Report 2015
Consolidated financial statements4

Company name Corporate seat HC AG direct
owner-ship %
Capital share
% 6)
Group owner-ship %
Year 7) Equity in €
million 8)
Net income
in € million 9)
Premix Concrete Limited Maidenhead, GBR 100.00 100.00 2014 0.0 0.0
Protenna AB Stockholm, SWE 75.00 75.00 2014 27.5 0.1
Purfleet Aggregates Limited Maidenhead, GBR 100.00 100.00 2014 -0.2 0.0
Recem S.A. Luxembourg, LUX 100.00 100.00 2014 2.9 0.0
Reci Eesti A/S Tallinn, EST 100.00 100.00 2014 0.3 0.0
Red Bank Manufacturing Company Limited Maidenhead, GBR 100.00 100.00 2014 7.7 0.0
Redshow Limited Maidenhead, GBR 100.00 100.00 2014 141.6 0.0
Renor AS Aurskog, NOR 100.00 100.00 2014 2.8 0.2
Rezincote (1995) Limited Maidenhead, GBR 100.00 100.00 2014 -0.5 0.0
Ribblesdale Cement Limited Maidenhead, GBR 100.00 100.00 2014 3.1 0.0
Roads Reconstruction Limited Maidenhead, GBR 100.00 100.00 2014 11.1 0.0
Roussel-Stichelbout Beton S.A. Mouscron, BEL 100.00 100.00 2014 1.6 0.0
S Sub Limited Maidenhead, GBR 100.00 100.00 2014 0.0 0.0
S.A. CBR Asset Management Luxembourg, LUX 100.00 100.00 2014 0.3 0.0
S.A. Cimenteries CBR Bruxelles, BEL 0.00 100.00 100.00 2015 656.0 70.1
Sabine Limited St. Peter Port, GGY 100.00 100.00 2014 274.4 0.0
Sagrex B.V. 's-Hertogenbosch, NLD 100.00 100.00 2014 0.5 -0.5
Sagrex France S.A.S. Harnes, FRA 100.00 100.00 2014 3.7 -0.4
Sagrex Holding B.V. 's-Hertogenbosch, NLD 100.00 100.00 2014 19.4 1.1
Sagrex Productie B.V. 's-Hertogenbosch, NLD 100.00 100.00 2014 6.8 1.1
Sailtown Limited Maidenhead, GBR 100.00 100.00 2014 945.9 27.4
Saint Hubert Investments S.à r.l. Luxembourg, LUX 100.00 100.00 2014 403.0 0.0
Samuel Wilkinson & Sons Limited Maidenhead, GBR 100.00 100.00 2014 0.0 0.0
Sand- & Grusaktiebolag Jehander Stockholm, SWE 100.00 100.00 2015 11.4 0.1
Sand Supplies (Western) Limited Maidenhead, GBR 100.00 100.00 2014 0.0 0.0
Sandwerke Biesern GmbH Penig, DEU 100.00 100.00 2014 8.4 0.0
Saunders (Ipswich) Limited Maidenhead, GBR 100.00 100.00 2014 0.1 0.0
Scancem Central Africa Holding 1 AB Stockholm, SWE 100.00 100.00 2014 17.0 0.0
Scancem Central Africa Holding 2 AB Stockholm, SWE 100.00 100.00 2014 16.9 0.1
Scancem Central Africa Holding 3 AB Stockholm, SWE 100.00 100.00 2014 14.0 0.1
Scancem Central Africa Holding 4 AB Stockholm, SWE 100.00 100.00 2014 14.0 0.0
Scancem East OY AB Helsinki, FIN 100.00 100.00 2014 6.3 0.0
Scancem Energy and Recovery Limited Maidenhead, GBR 100.00 100.00 2014 20.8 0.0
Scancem International DA Oslo, NOR 93.94 93.94 2014 351.7 87.8
Scancem International Limited Maidenhead, GBR 100.00 100.00 2014 23.0 0.0
Scancem Recovery Limited Maidenhead, GBR 100.00 100.00 2014 21.1 0.1
Scancem Supply Limited Maidenhead, GBR 100.00 100.00 2014 -2.4 0.0
Seagoe Concrete Products Limited Maidenhead, GBR 100.00 100.00 2014 0.0 0.0
Second City Properties Limited Maidenhead, GBR 100.00 100.00 2014 14.9 0.0
Sementsverksmidjan ehf Reykjavík, ISL 100.00 53.00 2014 1.6 0.6
Shanon Limited Partnership Edinburgh, GBR 100.00 99.99 2014 1.8 0.0
Shapedirect Limited Maidenhead, GBR 100.00 100.00 2014 7,845.7 -103.9
SIA BALTIC SAULE Riga, LVA 100.00 100.00 2014 4.6 0.8
SIA SBC 1) 5) Marupe, LVA 49.00 28.24 - - -
SIA SBC Finance 1) 5) Marupe, LVA 100.00 28.24 - - -
SIA SBC Property 1) 5) Marupe, LVA 49.00 28.24 - - -
SJP 1 Limited Maidenhead, GBR 100.00 100.00 2014 -0.1 0.0
263HeidelbergCement | Annual Report 2015
Consolidated income statement
Consolidated statement of comprehensive income
Consolidated statement of cash flows
Consolidated balance sheet
Consolidated statement of changes in equity
Segment reporting / Notes to the consolidated financial statements
Notes to the 2015 consolidated financial statements
Audit opinion
Responsibility statement
Con
solid
ated
fin
anci
al s
tate
men
tsA
ddit
iona
l inf
orm
atio
n
4
5

Company name Corporate seat HC AG direct
owner-ship %
Capital share
% 6)
Group owner-ship %
Year 7) Equity in €
million 8)
Net income
in € million 9)
Slotcount Limited Maidenhead, GBR 100.00 100.00 2014 2,047.3 0.0
Small Lots (Mix-It) Limited Maidenhead, GBR 100.00 100.00 2014 13.9 0.0
SMW Sand und Mörtelwerk GmbH & Co. KG 3) Königs Wusterhausen, DEU 100.00 100.00 2014 0.9 0.7
Solrec Limited Maidenhead, GBR 100.00 100.00 2014 10.7 0.0
Specialstabilisering i Stockholm AB 1) Stockholm, SWE 50.00 50.00 2014 0.0 0.0
SQ Corporation Limited Maidenhead, GBR 100.00 100.00 2014 3,125.2 0.0
SQ Finance No 2 Limited Maidenhead, GBR 100.00 100.00 2014 3,234.7 0.0
St Edouard S.à r.l. Luxembourg, LUX 100.00 99.99 2014 2,717.3 0.0
ST JUDE S.à r.l. Luxembourg, LUX 100.00 100.00 2014 2,575.8 0.0
ST LUKE S.à r.l. Luxembourg, LUX 100.00 100.00 2014 13.4 0.0
ST MARIUS S.à r.l. Luxembourg, LUX 100.00 100.00 2014 890.5 0.4
ST NICOLAS S.à r.l. Luxembourg, LUX 100.00 100.00 2014 1,297.4 -0.4
St Pierre S.à r.l. Luxembourg, LUX 100.00 99.99 2014 0.5 0.0
Stephen Toulson & Sons Limited Maidenhead, GBR 100.00 100.00 2014 0.0 0.0
Stewartby Housing Association, Limited Maidenhead, GBR 100.00 100.00 2014 0.1 0.0
Supamix Limited Maidenhead, GBR 100.00 100.00 2014 7.2 0.0
The Purfleet Ship to Shore Conveyor Company Limited Maidenhead, GBR 100.00 100.00 2014 0.1 0.0
Thistleton Quarries Limited Maidenhead, GBR 100.00 100.00 2014 -1.8 0.0
Tillotson Commercial Motors Limited Maidenhead, GBR 100.00 100.00 2014 -24.0 0.1
Tillotson Commercial Vehicles Limited Maidenhead, GBR 100.00 100.00 2014 0.0 0.0
Tilmanstone Brick Limited Maidenhead, GBR 100.00 100.00 2014 9.1 0.0
Timesound Maidenhead, GBR 100.00 100.00 2014 0.7 0.0
Tinglev Elementfabrik GmbH 5) Altlandsberg, DEU 100.00 57.64 - - -
TLQ Limited Edinburgh, GBR 100.00 100.00 2014 0.0 0.0
TMC Pioneer Aggregates Limited Maidenhead, GBR 100.00 100.00 2014 0.0 0.0
Tunnel Cement Limited Maidenhead, GBR 100.00 100.00 2014 0.0 0.0
U.D.S. Holdings B.V. Amsterdam, NLD 100.00 100.00 2014 612.8 0.0
UAB Gerdukas Vilnius, LTU 70.00 70.00 2014 2.2 0.1
UAB HC Betonas 5) Kaunas, LTU 100.00 100.00 - - -
UAB Heidelberg Cement Klaipeda Klaipeda, LTU 100.00 100.00 2014 1.4 1.0
UDS (No 10) Maidenhead, GBR 100.00 100.00 2014 0.0 0.0
UDS (No 3) Limited Maidenhead, GBR 100.00 100.00 2014 7.3 0.0
UDS Corporation Limited Maidenhead, GBR 100.00 100.00 2014 469.7 0.0
UDS Finance Limited Maidenhead, GBR 100.00 100.00 2014 52.5 0.0
UDS Group Limited Maidenhead, GBR 100.00 100.00 2014 141.4 0.0
UDS Holdings (1) Limited Maidenhead, GBR 100.00 100.00 2014 239.8 0.0
UGI Group Limited Maidenhead, GBR 100.00 100.00 2014 124.1 0.0
United Gas Industries Limited Maidenhead, GBR 100.00 100.00 2014 15.0 0.0
V.E.A. Limited St. Peter Port, GGY 100.00 100.00 2014 205.0 0.3
V.O.F. 'Bouwdok Barendrecht' Barendrecht, NLD 60.01 60.01 2014 0.2 0.0
Viewgrove Investments Limited Maidenhead, GBR 100.00 100.00 2014 8,231.1 0.0
Visionfocus Limited Maidenhead, GBR 100.00 100.00 2014 464.2 0.0
Visionrefine Limited Maidenhead, GBR 100.00 100.00 2014 -0.4 0.0
Welbecson Group Limited Maidenhead, GBR 100.00 100.00 2014 -0.1 0.0
WIKA Sand und Kies GmbH & Co. KG 3) Bremen, DEU 100.00 100.00 2014 6.3 1.3
Wineholm Limited Maidenhead, GBR 100.00 100.00 2014 -2.6 0.0
264 HeidelbergCement | Annual Report 2015
Consolidated financial statements4

Company name Corporate seat HC AG direct
owner-ship %
Capital share
% 6)
Group owner-ship %
Year 7) Equity in €
million 8)
Net income
in € million 9)
Subsidiaries
Eastern Europe-Central Asia
BayKaz Beton LLP Almaty, KAZ 100.00 100.00 2014 4.3 -0.6
BEKTAS Group LLP Almaty, KAZ 100.00 100.00 2014 2.4 -1.4
Betonpumpy a doprava SK a.s. Bratislava, SVK 100.00 100.00 2014 0.2 -0.2
BETOTECH, s.r.o. Beroun, CZE 100.00 91.50 2014 0.6 0.1
BT Poznań Sp. z.o.o. Janikowo, POL 100.00 100.00 2014 0.8 0.0
Bukhtarma Cement Company LLP Oktyabrskiy village, KAZ 100.00 100.00 2014 57.3 2.5
Calumite s.r.o. Ostrava, CZE 100.00 51.00 2014 5.6 1.3
Carpat Beton Servicii Pompe SRL Bucharest, ROU 100.00 100.00 2014 1.9 -0.5
Carpat Cemtrans S.R.L. Bucharest, ROU 100.00 100.00 2014 4.0 -0.1
CaspiCement Limited Liability Partnership Shetpe, KAZ 100.00 100.00 2014 104.9 -8.2
Caspinerud Limited Liability Partnership Aktau, KAZ 75.10 75.10 2014 9.4 -1.6
Cementa sp. z o. o. Warsaw, POL 100.00 100.00 2014 -0.1 -0.1
Českomoravský beton, a.s. Beroun, CZE 100.00 100.00 2014 24.9 3.5
Českomoravský cement, a.s. Mokra, CZE 100.00 100.00 2015 84.1 32.1
Českomoravský štěrk, a.s. Mokra, CZE 100.00 100.00 2014 51.5 3.7
Duda Beton Sp. z o.o. 5) Opole, POL 100.00 100.00 - - -
Duda Kruszywa Sp. z o.o. 5) Opole, POL 100.00 100.00 - - -
Górażdże Beton Sp. z o.o. Chorula, POL 100.00 100.00 2015 16.0 -4.2
Górażdże Cement S.A. Chorula, POL 100.00 100.00 2015 230.9 31.4
Górażdże Kruszywa Sp. z o.o. Chorula, POL 100.00 100.00 2014 27.5 -1.4
HeidelbergBeton Ukraine Limited Liability Company Kryvyi Rih, UKR 100.00 99.98 2014 2.3 -0.4
HeidelbergCement Romania SA Bucharest, ROU 100.00 100.00 2015 199.1 25.1
HeidelbergCement Ukraine Public Joint Stock Company Dnepropetrovsk, UKR 99.83 99.83 2015 -9.0 -27.6
HeidelbergGranit Ukraine Limited Liability Company Dnepropetrovsk, UKR 100.00 100.00 2014 1.8 -0.8
Kamenivo Slovakia a.s. Bytča-Hrabové, SVK 100.00 100.00 2014 1.5 0.2
KSL Limited Liability Company Busheve, UKR 100.00 100.00 2014 1.2 -0.4
Limited Liability Company HeidelbergBeton Georgia Tbilisi, GEO 100.00 100.00 2014 2.5 0.0
Limited Liability Company HeidelbergCement Caucasus Tbilisi, GEO 100.00 100.00 2014 0.0 0.0
Limited Liability Company HeidelbergCement Georgia Tbilisi, GEO 100.00 75.00 2015 -3.4 -13.0
Limited Liability Company Kartuli Cementi Tbilisi, GEO 100.00 100.00 2014 5.8 -1.1
Limited Liability Company Terjola-Quarry Tbilisi, GEO 100.00 100.00 2014 1.0 0.0
LLC 'HeidelbergCement Rus' Podolsk, RUS 100.00 100.00 2014 106.0 -1.1
OOO "Norcem Kola" Murmansk, RUS 100.00 100.00 2014 0.1 -0.4
OOO KaliningradCement Kaliningrad, RUS 100.00 74.90 2014 5.2 0.5
Open Joint Stock Company Gurovo-Beton Novogurovskiy, RUS 100.00 100.00 2014 4.3 0.8
Open Joint-Stock Company "Slantsy Cement Plant "Cesla" Slantsy, RUS 99.81 99.81 2014 14.0 -6.7
Precon Polska Sp.z.o.o. Warsaw, POL 100.00 57.64 2014 4.5 0.5
Recyfuel SRL Bucharest, ROU 100.00 100.00 2014 0.2 0.1
Rybalsky Quarry Limited Liability Company Dnepropetrovsk, UKR 100.00 100.00 2014 0.6 -0.1
TBG BETONMIX a. s. Brno, CZE 66.00 66.00 2014 8.4 1.1
TBG BETONPUMPY MORAVA s.r.o. Brno, CZE 90.00 84.90 2014 0.7 0.1
TBG SEVEROZÁPADNÍ ČECHY s.r.o. Chomutov, CZE 66.00 66.00 2014 2.9 0.1
TBG Východní Čechy s.r.o. Trutnov, CZE 90.00 70.04 2014 2.3 0.5
TBG Vysocina s.r.o. Kožichovice, CZE 90.00 59.40 2014 2.5 0.2
TBG ZNOJMO s. r. o. Dyje, CZE 100.00 66.00 2014 1.6 0.1
265HeidelbergCement | Annual Report 2015
Consolidated income statement
Consolidated statement of comprehensive income
Consolidated statement of cash flows
Consolidated balance sheet
Consolidated statement of changes in equity
Segment reporting / Notes to the consolidated financial statements
Notes to the 2015 consolidated financial statements
Audit opinion
Responsibility statement
Con
solid
ated
fin
anci
al s
tate
men
tsA
ddit
iona
l inf
orm
atio
n
4
5

Company name Corporate seat HC AG direct
owner-ship %
Capital share
% 6)
Group owner-ship %
Year 7) Equity in €
million 8)
Net income
in € million 9)
Subsidiaries
North America
116 Sisquoc Property LLC Wilmington, USA 100.00 100.00 2014 0.0 0.0
4601 Tacoma Property LLC Wilmington, USA 100.00 100.00 2014 0.0 0.0
755 Portland Property LLC Wilmington, USA 100.00 100.00 2014 0.0 0.0
8364 Fordyce Property LLC Wilmington, USA 100.00 100.00 2014 0.0 0.0
Allied Ready Mix Concrete Limited Vancouver, CAN 100.00 100.00 2014 8.9 0.5
Amangani SA Panama City, PAN 100.00 100.00 2014 -0.2 -0.1
Amcord, Inc. Dover, USA 100.00 100.00 2014 7.1 -1.7
Anche Holdings Inc Panama City, PAN 100.00 100.00 2014 1,745.2 0.0
Asian Carriers Inc. Panama City, PAN 100.00 100.00 2014 35.9 0.1
Astravance Corp. Panama City, PAN 100.00 100.00 2014 56,706.4 0.0
Beazer East, Inc. Wilmington, USA 100.00 100.00 2014 28.3 -20.7
Cadman (Black Diamond), Inc. Olympia, USA 100.00 100.00 2014 7.8 -0.5
Cadman (Rock), Inc. Olympia, USA 100.00 100.00 2014 13.5 -0.1
Cadman (Seattle), Inc. Olympia, USA 100.00 100.00 2014 55.5 4.7
Cadman, Inc. Olympia, USA 100.00 100.00 2014 48.7 -1.2
Calaveras Materials Inc. Sacramento, USA 100.00 100.00 2014 85.4 1.9
Calaveras-Standard Materials, Inc. Sacramento, USA 100.00 100.00 2014 29.8 -0.1
Campbell Concrete & Materials LLC Austin, USA 100.00 100.00 2015 29.0 14.5
Campbell Transportation Services LLC 5) Austin, USA 99.00 99.00 - - -
Cascapedia Corporation 4) Panama City, PAN 100.00 100.00 2014 -0.3 -0.1
Cavenham Forest Industries LLC Wilmington, USA 100.00 100.00 2014 8.2 -2.8
Cindercrete Mining Supplies Ltd. 1) Saskatchewan, CAN 50.00 43.75 2014 5.8 0.5
Cindercrete Products Limited Saskatchewan, CAN 87.50 87.50 2014 46.2 1.0
Civil and Marine Inc. Wilmington, USA 100.00 100.00 2014 40.0 -1.0
Commercial Aggregates Transportation and Sales LLC Wilmington, USA 100.00 100.00 2014 2.2 0.2
Constar LLC Wilmington, USA 100.00 100.00 2014 244.1 5.0
Continental Florida Materials Inc. Tallahassee, USA 100.00 100.00 2015 88.9 1.8
Cowichan Corporation Panama City, PAN 100.00 100.00 2014 2,571.7 -0.1
Essex NA Holdings LLC Wilmington, USA 100.00 100.00 2014 43.5 0.0
Ferndale Ready Mix & Gravel, Inc. Olympia, USA 100.00 100.00 2014 16.6 -0.2
Gulf Coast Stabilized Materials LLC Austin, USA 100.00 100.00 2014 38.9 9.3
Gypsum Carrier Inc Panama City, PAN 100.00 100.00 2014 70.0 -0.1
Hampshire Properties LLC Austin, USA 100.00 100.00 2015 0.0 0.0
HAMW Minerals, Inc. Wilmington, USA 100.00 100.00 2014 7.1 0.0
Hanson Aggregates LLC Wilmington, USA 100.00 100.00 2015 915.0 51.3
Hanson Aggregates BMC, Inc. Harrisburg, USA 100.00 100.00 2015 290.3 7.1
Hanson Aggregates Davon LLC Columbus, USA 100.00 100.00 2014 92.5 -4.1
Hanson Aggregates East LLC Wilmington, USA 100.00 100.00 2014 385.3 0.2
Hanson Aggregates Joliet LLC Wilmington, USA 100.00 100.00 2015 0.0 0.0
Hanson Aggregates Mid-Pacific, Inc. Wilmington, USA 100.00 100.00 2015 279.9 1.6
Hanson Aggregates Midwest LLC Frankfort, USA 100.00 100.00 2015 424.7 33.9
Hanson Aggregates New York LLC Albany, USA 100.00 100.00 2015 485.9 28.1
Hanson Aggregates Pacific Southwest, Inc. Wilmington, USA 100.00 100.00 2014 312.8 -0.2
Hanson Aggregates Pennsylvania LLC Wilmington, USA 100.00 100.00 2015 316.7 23.9
266 HeidelbergCement | Annual Report 2015
Consolidated financial statements4

Company name Corporate seat HC AG direct
owner-ship %
Capital share
% 6)
Group owner-ship %
Year 7) Equity in €
million 8)
Net income
in € million 9)
Hanson Aggregates Southeast LLC Wilmington, USA 100.00 100.00 2015 674.2 35.0
Hanson Aggregates WRP, Inc. Wilmington, USA 100.00 100.00 2014 66.7 -0.9
Hanson BC Limited Hamilton, BMU 100.00 100.00 2014 1,333.2 0.0
Hanson Building Materials America LLC Wilmington, USA 100.00 100.00 2014 717.4 -0.2
Hanson Green Limited Hamilton, BMU 100.00 100.00 2014 0.1 0.0
Hanson Hardscape Products LLC Wilmington, USA 100.00 100.00 2014 -1.6 0.0
Hanson Marine Finance, Inc. Sacramento, USA 100.00 100.00 2014 0.2 0.2
Hanson Marine Operations, Inc. Sacramento, USA 100.00 100.00 2014 8.5 0.1
Hanson Micronesia Cement, Inc. Wilmington, USA 100.00 100.00 2014 4.3 0.2
Hanson Permanente Cement of Guam, Inc. Sacramento, USA 100.00 100.00 2014 41.8 1.8
Hanson Permanente Cement, Inc. Phoenix, USA 100.00 100.00 2014 240.5 -5.9
Hanson Structural Precast, Inc. Los Angeles, USA 100.00 100.00 2014 34.4 -1.4
HBMA Holdings LLC Wilmington, USA 100.00 100.00 2014 3,468.4 -2.9
HBP Mineral Holdings LLC 5) Wilmington, USA 100.00 100.00 - - -
HBP Property Holdings LLC 5) Wilmington, USA 100.00 100.00 - - -
HC Trading International Inc. Nassau, BHS 100.00 100.00 2015 5.6 -1.0
HNA Investments Wilmington, USA 100.00 100.00 2014 4,214.6 0.0
Kaiser Gypsum Company, Inc. Olympia, USA 100.00 100.00 2014 -37.6 -7.3
KH 1 Inc. Dover, USA 100.00 100.00 2014 214.0 0.0
Lehigh Cement Company LLC Wilmington, USA 100.00 100.00 2015 1,184.1 67.4
Lehigh Hanson Materials Limited Calgary, CAN 100.00 100.00 2015 1,112.0 78.8
Lehigh Hanson Receivables LLC Wilmington, USA 100.00 100.00 2014 17.6 6.3
Lehigh Hanson, Inc. Wilmington, USA 100.00 100.00 2015 10,027.3 -1.2
Lehigh Northwest Cement Company Olympia, USA 100.00 100.00 2014 139.8 -1.2
Lehigh Northwest Marine, LLC Wilmington, USA 100.00 100.00 2014 2.9 0.0
Lehigh Portland Holdings, LLC Wilmington, USA 100.00 100.00 2014 0.2 0.1
Lehigh Portland Investments, LLC Wilmington, USA 100.00 100.00 2014 80.9 33.5
Lehigh Realty Company Richmond, USA 100.00 100.00 2014 1.8 0.0
Lehigh Southwest Cement Company Sacramento, USA 100.00 100.00 2015 317.2 4.8
Lehigh White Cement Company Harrisburg, USA 51.00 51.00 2015 65.4 21.1
Material Service Corporation Wilmington, USA 100.00 100.00 2015 122.9 25.8
Mayco Mix Ltd. Langley, CAN 100.00 100.00 2014 2.7 -0.5
Mineral and Land Resources Corporation Wilmington, USA 100.00 100.00 2014 28.9 -2.3
Mission Valley Rock Co. Sacramento, USA 100.00 100.00 2014 94.0 0.6
PCAz Leasing, Inc. Phoenix, USA 100.00 100.00 2014 4.9 0.2
Pioneer International Overseas Corporation Tortola, VGB 100.00 100.00 2014 143.5 0.1
Rempel Bros. Concrete Ltd. Langley, CAN 100.00 100.00 2015 18.0 0.7
Rimarcal Corporation Panama City, PAN 100.00 100.00 2014 2,975.9 22.5
Sherman Industries LLC Wilmington, USA 99.00 99.00 2014 44.3 -7.5
Shrewsbury Properties LLC Austin, USA 100.00 100.00 2014 0.7 0.0
Sinclair General Corporation Panama City, PAN 100.00 100.00 2014 9,138.9 0.0
South Valley Materials, Inc. Sacramento, USA 100.00 100.00 2014 15.3 -1.6
Standard Concrete Products, Inc. Sacramento, USA 100.00 100.00 2014 11.3 -0.7
Three Rivers Management, Inc. Wilmington, USA 100.00 100.00 2014 -0.3 0.0
Vestur Insurance (Bermuda) Ltd Hamilton, BMU 100.00 100.00 2014 0.1 0.0
267HeidelbergCement | Annual Report 2015
Consolidated income statement
Consolidated statement of comprehensive income
Consolidated statement of cash flows
Consolidated balance sheet
Consolidated statement of changes in equity
Segment reporting / Notes to the consolidated financial statements
Notes to the 2015 consolidated financial statements
Audit opinion
Responsibility statement
Con
solid
ated
fin
anci
al s
tate
men
tsA
ddit
iona
l inf
orm
atio
n
4
5

Company name Corporate seat HC AG direct
owner-ship %
Capital share
% 6)
Group owner-ship %
Year 7) Equity in €
million 8)
Net income
in € million 9)
Subsidiaries
Asia-Pacific
Bitumix Granite Sdn Bhd Kuala Lumpur, MYS 100.00 100.00 2014 2.5 -0.1
Butra HeidelbergCement Sdn. Bhd. Bandar Seri Begawan, BRN 70.00 70.00 2014 12.6 3.6
CGF Pty Limited New South Wales, AUS 100.00 100.00 2014 229.9 0.0
Christies Stone Quarries Pty Ltd South Australia, AUS 100.00 100.00 2014 0.0 0.0
COCHIN Cements Ltd. Kottyam, IND 98.72 98.72 2015 -0.4 -0.6
Concrete Materials Laboratory Sdn Bhd Kuala Lumpur, MYS 100.00 100.00 2014 0.2 0.1
Consolidated Quarries Pty Ltd. Victoria, AUS 100.00 100.00 2014 0.0 0.0
Excel Quarries Pty Limited Queensland, AUS 100.00 100.00 2014 0.1 0.0
Fairfield Pre-Mix Concrete Pty Ltd Victoria, AUS 100.00 100.00 2014 0.1 0.0
Galli Quarries Pty Limited Victoria, AUS 100.00 100.00 2014 25.2 0.5
Gerak Harapan Sdn Bhd Kuala Lumpur, MYS 70.00 70.00 2014 0.8 0.3
Hanson Australia (Holdings) Proprietary Limited Victoria, AUS 100.00 100.00 2015 2,182.9 261.3
Hanson Australia Cement (2) Pty Ltd New South Wales, AUS 100.00 100.00 2014 17.7 9.9
Hanson Australia Cement Pty Limited New South Wales, AUS 100.00 100.00 2014 46.5 9.9
Hanson Australia Funding Limited New South Wales, AUS 100.00 100.00 2014 0.0 0.0
Hanson Australia Investments Pty Limited New South Wales, AUS 100.00 100.00 2014 57.4 13.4
Hanson Australia Pty Limited New South Wales, AUS 100.00 100.00 2014 891.7 -4.4
Hanson Building Materials (S) Pte Ltd Singapore, SGP 100.00 100.00 2014 -0.3 0.0
Hanson Building Materials Cartage Sdn Bhd Kuala Lumpur, MYS 100.00 100.00 2014 0.2 0.1
Hanson Building Materials Industries Sdn Bhd 4) Kuala Lumpur, MYS 100.00 100.00 2014 0.1 0.1
Hanson Building Materials Malaysia Sdn Bhd Kuala Lumpur, MYS 100.00 100.00 2015 24.3 0.0
Hanson Building Materials Manufacturing Sdn Bhd Kuala Lumpur, MYS 100.00 100.00 2014 0.5 0.0
Hanson Building Materials Production Sdn Bhd Kuala Lumpur, MYS 100.00 100.00 2014 13.2 0.2
Hanson Building Materials Transport Sdn Bhd Kuala Lumpur, MYS 100.00 100.00 2014 0.4 0.0
Hanson Building Materials-KTPC Sdn Bhd Kuala Lumpur, MYS 100.00 100.00 2014 0.3 0.0
Hanson Building Materials-KTPC-PBPM Sdn Bhd Kuala Lumpur, MYS 100.00 85.00 2014 1.2 0.1
Hanson Building Materials-PBPM Sdn Bhd Kuala Lumpur, MYS 70.00 70.00 2014 0.2 0.0
Hanson Cement Holdings Pty Ltd Victoria, AUS 100.00 100.00 2014 13.5 9.4
Hanson Concrete (M) Sdn Bhd Kuala Lumpur, MYS 100.00 100.00 2014 0.3 0.4
Hanson Construction Materials Pty Ltd Queensland, AUS 100.00 100.00 2015 31.2 102.3
Hanson Finance Australia Ltd Australian Capital Territory, AUS 100.00 100.00 2014 126.4 -14.7
Hanson Holdings (M) Sdn Bhd Kuala Lumpur, MYS 100.00 100.00 2014 5.0 -0.6
Hanson Investment Holdings Pte Ltd Singapore, SGP 100.00 100.00 2014 34.4 0.0
Hanson Landfill Services Pty Ltd Victoria, AUS 100.00 100.00 2014 21.0 4.8
Hanson Pacific (S) Pte Limited Singapore, SGP 100.00 100.00 2014 -6.9 0.0
Hanson Precast Pty Ltd New South Wales, AUS 100.00 100.00 2014 -5.9 -0.4
Hanson Pty Limited Victoria, AUS 100.00 100.00 2014 2,718.7 0.0
Hanson Quarries Victoria Pty Limited New South Wales, AUS 100.00 100.00 2014 0.4 0.0
Hanson Quarry Products (Batu Pahat) Sdn Bhd Kuala Lumpur, MYS 100.00 100.00 2014 0.3 0.0
Hanson Quarry Products (EA) Sdn Bhd Kuala Lumpur, MYS 100.00 100.00 2014 1.9 0.2
Hanson Quarry Products (Holdings) Sdn Bhd Kuala Lumpur, MYS 100.00 100.00 2014 50.0 29.2
Hanson Quarry Products (Kuantan) Sdn Bhd Kuala Lumpur, MYS 100.00 100.00 2014 3.4 0.0
Hanson Quarry Products (Kulai) Sdn Bhd Kuala Lumpur, MYS 100.00 100.00 2014 9.4 1.3
Hanson Quarry Products (Land) Sdn Bhd Kuala Lumpur, MYS 100.00 100.00 2014 6.7 0.4
Hanson Quarry Products (Masai) Sdn Bhd Kuala Lumpur, MYS 100.00 100.00 2014 0.7 0.0
Hanson Quarry Products (Northern) Sdn Bhd Kuala Lumpur, MYS 100.00 100.00 2014 2.5 0.0
268 HeidelbergCement | Annual Report 2015
Consolidated financial statements4

Company name Corporate seat HC AG direct
owner-ship %
Capital share
% 6)
Group owner-ship %
Year 7) Equity in €
million 8)
Net income
in € million 9)
Hanson Quarry Products (Pengerang) Sdn Bhd Kuala Lumpur, MYS 100.00 100.00 2014 0.9 0.2
Hanson Quarry Products (Perak) Sdn Bhd Kuala Lumpur, MYS 100.00 100.00 2014 2.6 0.0
Hanson Quarry Products (Premix) Sdn Bhd 4) Kuala Lumpur, MYS 100.00 100.00 2014 0.9 0.0
Hanson Quarry Products (Rawang) Sdn Bhd Kuala Lumpur, MYS 100.00 100.00 2014 2.1 0.4
Hanson Quarry Products (Segamat) Sdn Bhd Kuala Lumpur, MYS 100.00 100.00 2014 0.2 0.0
Hanson Quarry Products (Tempoyak) Sdn Bhd Kuala Lumpur, MYS 100.00 100.00 2014 -1.2 -0.3
Hanson Quarry Products (Terengganu) Sdn Bhd Kuala Lumpur, MYS 100.00 100.00 2014 1.6 0.0
Hanson Quarry Products Sdn Bhd Kuala Lumpur, MYS 100.00 100.00 2015 0.0 0.0
HCT Services Asia Pte. Ltd. Singapore, SGP 100.00 100.00 2014 0.6 0.1
HeidelbergCement Asia Pte Ltd Singapore, SGP 100.00 100.00 2014 8.8 0.2
HeidelbergCement Bangladesh Limited Chittagong, BGD 60.67 60.67 2015 66.6 16.4
HeidelbergCement Holding HK Limited Hong Kong, HKG 100.00 100.00 2014 49.8 8.0
HeidelbergCement India Limited Gurgaon, IND 69.39 69.39 2015 126.4 7.3
HeidelbergCement Myanmar Company Limited Naypyitaw, MMR 100.00 100.00 2015 -0.2 -0.1
Hymix Australia Pty Ltd New South Wales, AUS 100.00 100.00 2015 73.8 18.8
Meghna Energy Limited Dhaka, BGD 100.00 100.00 2014 7.2 0.8
Pioneer Concrete (Hong Kong) Limited Hong Kong, HKG 100.00 100.00 2014 1.5 0.6
Pioneer Concrete (Tasmania) Proprietary Limited Tasmania, AUS 100.00 100.00 2014 5.6 0.0
Pioneer Concrete (WA) Pty Ltd Western Australia, AUS 100.00 100.00 2014 0.0 0.0
Pioneer Concrete Services (Malaysia) S/B 4) 5) Kuala Lumpur, MYS 100.00 100.00 - - -
Pioneer International (Labuan) Ltd Labuan, MYS 100.00 100.00 2014 0.4 0.0
Pioneer International Holdings Pty Ltd New South Wales, AUS 100.00 100.00 2014 1,094.7 50.0
Pioneer North Queensland Pty Ltd Queensland, AUS 100.00 100.00 2014 21.4 1.9
Plentong Granite Industries Sdn Bhd Kuala Lumpur, MYS 70.00 70.00 2014 3.0 1.3
PT Bahana Indonor Jakarta, IDN 100.00 50.98 2014 10.5 2.6
PT Bhakti Sari Perkasa Abadi Jakarta, IDN 100.00 50.98 2014 0.1 0.0
PT Dian Abadi Perkasa Jakarta, IDN 100.00 50.98 2014 55.2 9.9
PT Indocement Tunggal Prakarsa Tbk. Jakarta, IDN 51.00 51.00 2015 1,522.5 277.6
PT Indomix Perkasa Jakarta, IDN 100.00 51.00 2014 3.6 0.2
PT Lentera Abadi Sejahtera Jakarta, IDN 100.00 51.00 2014 0.0 0.0
PT Makmur Abadi Perkasa Mandiri Jakarta, IDN 100.00 51.00 2014 0.0 0.0
PT Mandiri Sejahtera Sentra Purwakarta, IDN 100.00 50.98 2014 19.3 0.1
PT Mineral Industri Sukabumi Sukabumi, IDN 100.00 50.98 2014 1.2 0.1
PT Multi Bangun Galaxy Lombok, IDN 100.00 50.98 2014 0.2 0.0
PT Pionirbeton Industri Jakarta, IDN 100.00 51.00 2014 -0.4 1.9
PT Sahabat Mulia Sakti Semarang, IDN 100.00 50.98 2014 -0.1 0.0
PT Sari Bhakti Sejati Jakarta, IDN 100.00 51.00 2014 3.3 0.0
PT Tarabatuh Manunggal South Tangerang, IDN 100.00 50.98 2014 5.3 -0.4
PT Terang Prakarsa Cipta Jakarta, IDN 100.00 51.00 2014 3.4 0.1
Rajang Perkasa Sdn Bhd Kuala Lumpur, MYS 60.00 60.00 2014 0.5 0.4
Realistic Sensation Sdn Bhd Kuala Lumpur, MYS 69.98 69.98 2014 1.2 0.0
Sofinaz Holdings Sdn Bhd Kuala Lumpur, MYS 100.00 100.00 2014 0.3 0.0
South Coast Basalt Pty Ltd New South Wales, AUS 100.00 100.00 2014 0.1 -0.5
Tanah Merah Quarry Sdn Bhd Kuala Lumpur, MYS 100.00 100.00 2014 -3.1 0.1
Valscot Pty Limited New South Wales, AUS 100.00 100.00 2014 0.0 0.0
Waterfall Quarries Pty Limited Victoria, AUS 100.00 100.00 2014 0.0 0.0
West Coast Premix Pty Ltd Victoria, AUS 100.00 100.00 2014 0.0 0.0
Yalkara Contracting Pty Ltd Queensland, AUS 100.00 100.00 2014 6.7 0.0
269HeidelbergCement | Annual Report 2015
Consolidated income statement
Consolidated statement of comprehensive income
Consolidated statement of cash flows
Consolidated balance sheet
Consolidated statement of changes in equity
Segment reporting / Notes to the consolidated financial statements
Notes to the 2015 consolidated financial statements
Audit opinion
Responsibility statement
Con
solid
ated
fin
anci
al s
tate
men
tsA
ddit
iona
l inf
orm
atio
n
4
5
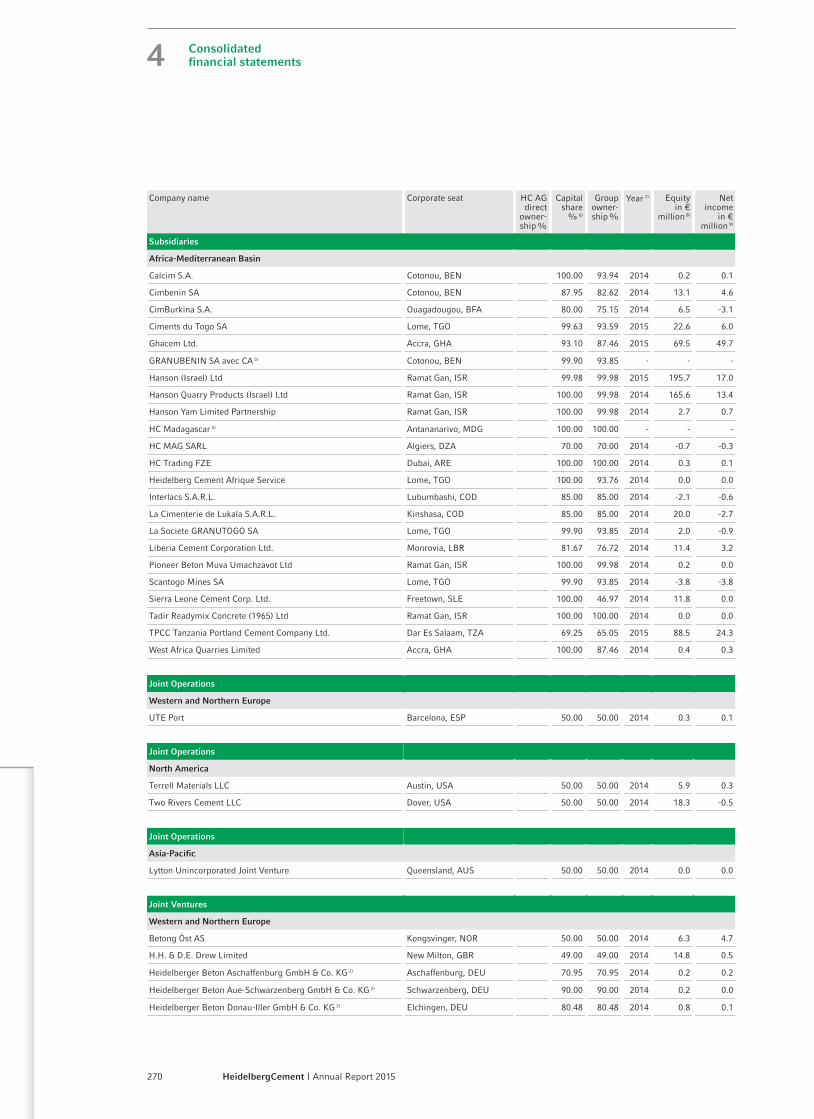
Company name Corporate seat HC AG direct
owner-ship %
Capital share
% 6)
Group owner-ship %
Year 7) Equity in €
million 8)
Net income
in € million 9)
Subsidiaries
Africa-Mediterranean Basin
Calcim S.A. Cotonou, BEN 100.00 93.94 2014 0.2 0.1
Cimbenin SA Cotonou, BEN 87.95 82.62 2014 13.1 4.6
CimBurkina S.A. Ouagadougou, BFA 80.00 75.15 2014 6.5 -3.1
Ciments du Togo SA Lome, TGO 99.63 93.59 2015 22.6 6.0
Ghacem Ltd. Accra, GHA 93.10 87.46 2015 69.5 49.7
GRANUBENIN SA avec CA 5) Cotonou, BEN 99.90 93.85 - - -
Hanson (Israel) Ltd Ramat Gan, ISR 99.98 99.98 2015 195.7 17.0
Hanson Quarry Products (Israel) Ltd Ramat Gan, ISR 100.00 99.98 2014 165.6 13.4
Hanson Yam Limited Partnership Ramat Gan, ISR 100.00 99.98 2014 2.7 0.7
HC Madagascar 5) Antananarivo, MDG 100.00 100.00 - - -
HC MAG SARL Algiers, DZA 70.00 70.00 2014 -0.7 -0.3
HC Trading FZE Dubai, ARE 100.00 100.00 2014 0.3 0.1
Heidelberg Cement Afrique Service Lome, TGO 100.00 93.76 2014 0.0 0.0
Interlacs S.A.R.L. Lubumbashi, COD 85.00 85.00 2014 -2.1 -0.6
La Cimenterie de Lukala S.A.R.L. Kinshasa, COD 85.00 85.00 2014 20.0 -2.7
La Societe GRANUTOGO SA Lome, TGO 99.90 93.85 2014 2.0 -0.9
Liberia Cement Corporation Ltd. Monrovia, LBR 81.67 76.72 2014 11.4 3.2
Pioneer Beton Muva Umachzavot Ltd Ramat Gan, ISR 100.00 99.98 2014 0.2 0.0
Scantogo Mines SA Lome, TGO 99.90 93.85 2014 -3.8 -3.8
Sierra Leone Cement Corp. Ltd. Freetown, SLE 100.00 46.97 2014 11.8 0.0
Tadir Readymix Concrete (1965) Ltd Ramat Gan, ISR 100.00 100.00 2014 0.0 0.0
TPCC Tanzania Portland Cement Company Ltd. Dar Es Salaam, TZA 69.25 65.05 2015 88.5 24.3
West Africa Quarries Limited Accra, GHA 100.00 87.46 2014 0.4 0.3
Joint Operations
Western and Northern Europe
UTE Port Barcelona, ESP 50.00 50.00 2014 0.3 0.1
Joint Operations
North America
Terrell Materials LLC Austin, USA 50.00 50.00 2014 5.9 0.3
Two Rivers Cement LLC Dover, USA 50.00 50.00 2014 18.3 -0.5
Joint Operations
Asia-Pacific
Lytton Unincorporated Joint Venture Queensland, AUS 50.00 50.00 2014 0.0 0.0
Joint Ventures
Western and Northern Europe
Betong Öst AS Kongsvinger, NOR 50.00 50.00 2014 6.3 4.7
H.H. & D.E. Drew Limited New Milton, GBR 49.00 49.00 2014 14.8 0.5
Heidelberger Beton Aschaffenburg GmbH & Co. KG 2) Aschaffenburg, DEU 70.95 70.95 2014 0.2 0.2
Heidelberger Beton Aue-Schwarzenberg GmbH & Co. KG 2) Schwarzenberg, DEU 90.00 90.00 2014 0.2 0.0
Heidelberger Beton Donau-Iller GmbH & Co. KG 2) Elchingen, DEU 80.48 80.48 2014 0.8 0.1
270 HeidelbergCement | Annual Report 2015
Consolidated financial statements4

Company name Corporate seat HC AG direct
owner-ship %
Capital share
% 6)
Group owner-ship %
Year 7) Equity in €
million 8)
Net income
in € million 9)
Heidelberger Beton Elster-Spree GmbH & Co. KG 2) Cottbus, DEU 60.00 60.00 2014 0.6 0.2
Heidelberger Beton Kurpfalz GmbH & Co. KG 2) Eppelheim, DEU 51.11 51.11 2014 0.8 -0.5
Heidelberger Beton Schwandorf GmbH 2) Schwandorf, DEU 67.60 57.46 2014 0.5 0.4
Heidelberger Betonpumpen Simonis GmbH & Co. KG 2) Ubstadt-Weiher, DEU 100.00 57.37 2014 2.5 0.5
Humber Sand and Gravel Limited Egham, GBR 50.00 50.00 2014 -0.9 -0.4
Joyce Green Aggregates Limited Dartford, GBR 50.00 50.00 2014 0.0 0.0
Mendip Rail Limited Markfield, GBR 50.00 50.00 2014 2.9 0.0
Mibau Holding GmbH Cadenberge, DEU 50.00 50.00 2014 49.1 3.9
North Tyne Roadstone Limited Wolverhampton, GBR 50.00 50.00 2014 0.3 -0.3
RECIBETON S.A. 5) Liège, BEL 50.00 42.73 - - -
Reederei Hans Jürgen Hartmann MS "Beltnes" GmbH & CO KG Cadenberge, DEU 50.00 50.00 2014 13.0 1.3
Reederei Hans-Jürgen Hartmann MS "Bulknes" GmbH & Co KG Cadenberge, DEU 50.00 50.00 2014 13.2 1.0
Rewinn B.V. Amsterdam, NLD 50.00 50.00 2014 1.7 -0.1
Shire Business Park Limited London, GBR 50.00 50.00 2014 0.0 0.0
Smiths Concrete Limited Oxford, GBR 49.00 49.00 2014 9.7 0.3
Sola Betong AS Tananger, NOR 33.33 33.33 2014 2.8 0.4
TBG Ilm-Beton GmbH & Co. KG 2) Arnstadt, DEU 55.00 55.00 2014 0.7 0.1
TBG Transportbeton Franken GmbH & Co. KG 2) Fürth, DEU 90.00 90.00 2014 0.5 1.0
TBG Transportbeton GmbH & Co. KG Naabbeton Nabburg, DEU 50.00 50.00 2014 1.1 1.7
TBG Transportbeton Mittweida GmbH & Co KG Mittweida, DEU 40.00 40.00 2014 0.2 0.1
TBG Transportbeton Oder-Spree GmbH & Co. KG Wriezen, DEU 50.00 50.00 2014 1.5 0.5
Trapobet Transportbeton GmbH Kaiserslautern Kommandit-gesellschaft Kaiserslautern, DEU 50.00 50.00 2014 1.0 1.3
WIKING Baustoff- und Transport GmbH & Co. Kommandit-gesellschaft Geseke, DEU 50.00 50.00 2014 0.4 0.1
Joint Ventures
Eastern Europe-Central Asia
BT Topbeton Sp. z.o.o. Gorzów Wielkopolski, POL 50.00 50.00 2014 7.3 1.4
CEMET S.A. Warsaw, POL 42.91 42.91 2014 15.0 3.3
Closed Joint Stock Company "Mineral Resources Company" Ishimbay, RUS 50.00 50.00 2014 10.7 0.2
Duna-Dráva Cement Kft. Vác, HUN 50.00 50.00 2015 158.3 12.3
PÍSKOVNY MORAVA spol. s r.o. Brno, CZE 50.00 50.00 2014 1.5 0.1
Pražské betonpumpy a doprava s.r.o. Praha, CZE 83.66 50.00 2014 1.4 0.2
TBG Doprastav, a.s. Bratislava, SVK 60.00 50.00 2014 3.9 -1.2
TBG METROSTAV s.r.o. Praha, CZE 50.00 50.00 2014 16.0 0.6
TBG Plzeň Transportbeton s.r.o. 2) Beroun, CZE 50.10 50.10 2014 1.8 0.5
TBG SWIETELSKY s.r.o. 2) České Budějovice, CZE 51.00 51.00 2014 1.1 0.0
Vltavske sterkopisky s.r.o. Chlumin, CZE 50.00 50.00 2014 4.5 0.2
Joint Ventures
North America
Allied Cement Company, d/b/a CPC Terminals (Limited Partner-ship Interest) Austin, USA 50.50 50.00 2014 0.5 -0.8
American Stone Company Raleigh, USA 50.00 50.00 2014 1.4 0.2
BP General Partner Ltd. 5) Winnipeg, CAN 50.00 50.00 - - -
Building Products & Concrete Supply Limited Partnership Winnipeg, CAN 50.00 50.00 2014 4.9 1.7
271HeidelbergCement | Annual Report 2015
Consolidated income statement
Consolidated statement of comprehensive income
Consolidated statement of cash flows
Consolidated balance sheet
Consolidated statement of changes in equity
Segment reporting / Notes to the consolidated financial statements
Notes to the 2015 consolidated financial statements
Audit opinion
Responsibility statement
Con
solid
ated
fin
anci
al s
tate
men
tsA
ddit
iona
l inf
orm
atio
n
4
5

Company name Corporate seat HC AG direct
owner-ship %
Capital share
% 6)
Group owner-ship %
Year 7) Equity in €
million 8)
Net income
in € million 9)
California Commercial Asphalt, LLC Wilmington, USA 50.00 50.00 2014 5.1 0.3
China Century Cement Ltd. Hamilton, BMU 50.00 50.00 2014 31.1 10.2
CPC Terminals, Inc 5) Sacramento, USA 50.00 50.00 - - -
Red Bluff Sand & Gravel, L.L.C. Montgomery, USA 50.00 49.50 2014 2.1 0.2
Texas Lehigh Cement Company LP Austin, USA 50.00 50.00 2015 43.6 36.6
Upland Ready Mix Ltd. Campbell River, CAN 50.00 50.00 2014 0.5 0.0
Joint Ventures
Asia-Pacific
Alliance Construction Materials Ltd Hong Kong, HKG 50.00 50.00 2014 29.5 5.5
Cement Australia Holdings Pty Ltd New South Wales, AUS 50.00 50.00 2014 419.7 76.7
Cement Australia Partnership New South Wales, AUS 50.00 50.00 2014 73.6 59.2
Cement Australia Pty Limited Victoria, AUS 50.00 50.00 2014 0.0 0.0
Easy Point Industrial Ltd. Hong Kong, HKG 50.00 50.00 2014 -0.3 0.0
Jidong Heidelberg (Fufeng) Cement Company Limited Baoji, CHN 48.11 48.11 2014 75.2 7.6
Jidong Heidelberg (Jingyang) Cement Company Limited Xianyang City, CHN 50.00 50.00 2014 83.1 19.4
M&H Quarries Partnership Victoria, AUS 50.00 50.00 2014 -1.5 -0.2
Metromix Pty Limited New South Wales, AUS 50.00 50.00 2014 15.7 2.1
Penrith Lakes Development Corporation Limited New South Wales, AUS 20.00 20.00 2015 -147.6 11.3
Squareal Cement Ltd Hong Kong, HKG 50.00 50.00 2014 37.1 11.9
Technically Designed Concrete Partnership Western Australia, AUS 50.00 50.00 2015 2.7 0.1
West Australian Landfill Services Pty Ltd Victoria, AUS 50.00 50.00 2014 6.1 4.9
Western Suburbs Concrete Partnership New South Wales, AUS 50.00 50.00 2015 3.9 4.4
Joint Ventures
Africa-Mediterranean Basin
Akçansa Çimento Sanayi ve Ticaret A.S. Istanbul, TUR 39.72 39.72 2014 281.6 85.5
Fortia Cement S.A. Lome, TGO 50.00 46.97 2014 11.0 0.6
Associates
Western and Northern Europe
Betonmortel Grevelingen B.V. Zierikzee, NLD 50.00 50.00 2014 0.5 -0.1
Betonmortelcentrale De Mark B.V. Breda, NLD 28.57 28.57 2014 0.5 0.3
Betonmortelfabriek Tilburg Bemoti B.V. Tilburg, NLD 38.67 38.67 2014 0.3 0.9
Betonpumpen-Service Niedersachsen GmbH & Co. KG Hannover, DEU 50.00 50.00 2014 0.2 0.2
Betotech GmbH, Baustofftechnisches Labor 2) Eppelheim, DEU 100.00 59.98 2014 0.2 0.1
Betotech GmbH, Baustofftechnisches Labor 2) Nabburg, DEU 100.00 69.65 2014 0.1 0.0
Betuwe Beton Holding B.V. Tiel, NLD 50.00 50.00 2014 4.3 -0.1
Combinatie "Wessem-Thorn" vof Nijmegen, NLD 6.50 6.50 2014 0.0 0.0
Cugla B.V. Breda, NLD 50.00 50.00 2014 6.1 2.2
Demula N.V. Laarne, BEL 99.34 50.00 2014 0.7 0.6
Donau Kies GmbH & Co. KG 2) Fürstenzell, DEU 75.00 75.00 2014 5.0 0.0
DONAU MÖRTEL - GmbH & Co. KG Neuburg a. Inn, DEU 50.00 50.00 2014 0.4 0.1
Ernst Marschall GmbH & Co. KG Kies- und Schotterwerke Kressbronn, DEU 20.50 20.50 2014 4.0 0.9
Europomp B.V. Heerlen, NLD 72.48 63.41 2014 0.8 0.0
Gebrüder Willersinn Industriesandwerk GmbH & Co. KG Raunheim, DEU 33.33 33.33 2014 1.6 0.2
272 HeidelbergCement | Annual Report 2015
Consolidated financial statements4

Company name Corporate seat HC AG direct
owner-ship %
Capital share
% 6)
Group owner-ship %
Year 7) Equity in €
million 8)
Net income
in € million 9)
GENAMO Gesellschaft zur Entwicklung des Naherholungs-gebietes Misburg-Ost mbH Hannover, DEU 50.00 50.00 50.00 2014 0.1 0.0
Hafenbetriebsgesellschaft mbH & Co KG Stade Stade, DEU 50.00 50.00 2014 0.5 0.2
Heidelberger Beton GmbH & Co Stuttgart KG Remseck a. N., DEU 50.00 50.00 2014 0.4 0.1
Heidelberger Beton Grenzland GmbH & Co. KG Marktredwitz, DEU 50.00 50.00 2014 1.2 1.4
Heidelberger Beton Karlsruhe GmbH &Co. KG Karlsruhe, DEU 44.44 44.44 2014 0.4 -0.3
Heidelberger Fließestrich Südwest GmbH 2) Eppelheim, DEU 100.00 64.17 2014 0.4 0.2
Hessisches Bausteinwerk Dr. Blasberg GmbH & Co. KG Mörfelden-Walldorf, DEU 47.08 47.08 2014 3.7 0.6
ISAR-DONAU MÖRTEL-GmbH & Co. KG Passau, DEU 33.33 33.33 2014 0.2 0.1
KANN Beton GmbH & Co KG Bendorf, DEU 50.00 50.00 2014 0.9 -1.1
Kieswerke Flemmingen GmbH 2) Penig, DEU 54.00 54.00 2014 2.2 0.2
Kieswerke Kieser GmbH & Co. KG 2) Gotha, DEU 51.00 51.00 2014 1.0 0.1
Kronimus Aktiengesellschaft Iffezheim, DEU 24.90 24.90 24.90 2014 22.2 1.1
Kronimus SAS 5) Metz, FRA 100.00 43.60 - - -
KVB Kies- Vertrieb GmbH & Co. KG Karlsdorf-Neuthard, DEU 24.46 24.46 2014 0.1 0.0
Materiaux Traites du Hainaut S.A. Antoing, BEL 50.00 50.00 2014 0.7 0.0
MERMANS BETON N.V. Arendonk, BEL 50.00 50.00 2014 0.2 0.0
Misburger Hafengesellschaft mit beschränkter Haftung Hannover, DEU 39.66 39.66 39.66 2014 0.7 0.3
Mittelschwäbische Transport- und Frischbeton- Gesellschaft mit beschränkter Haftung & Co. Kommanditgesellschaft Thannhausen, DEU 34.21 34.21 2014 0.4 0.2
NCD Nederlandse Cement Deelnemingsmaatschappij B.V. 4) Nieuwegein, NLD 36.88 36.88 36.88 2014 1.6 1.1
Nederlands Cement Transport Cetra B.V. Uithoorn, NLD 50.00 50.00 2014 2.3 0.4
Peene Kies GmbH Jarmen, DEU 24.90 24.90 2014 3.8 0.3
Raunheimer Sand- und Kiesgewinnung Blasberg GmbH & Co. KG Raunheim, DEU 23.53 23.53 2014 0.5 0.3
SBU Sandwerke Dresden GmbH Dresden, DEU 24.00 24.00 2014 2.4 0.0
Schwaben Mörtel GmbH u. Co. KG Stuttgart, DEU 30.00 30.00 2014 0.5 0.1
Südbayerisches Portland-Zementwerk Gebr. Wiesböck & Co. GmbH Rohrdorf, DEU 23.90 23.90 23.90 2014 344.1 29.0
Tangen Eiendom AS Brevik, NOR 50.00 50.00 2014 2.7 0.2
TBG Bayerwald Transportbeton GmbH & Co. KG Fürstenzell, DEU 50.00 50.00 2014 0.1 -0.1
TBG Deggendorfer Transportbeton GmbH Deggendorf, DEU 33.33 33.33 2014 1.1 0.6
TBG Pegnitz-Beton GmbH & Co. KG Hersbruck, DEU 28.00 28.00 2014 0.1 0.1
TBG Rott Kies und Transportbeton GmbH Kelheim, DEU 24.00 20.40 2014 0.9 0.3
TBG Transportbeton Caprano GmbH & Co. KG Heidelberg, DEU 50.00 50.00 2014 0.1 0.1
TBG Transportbeton GmbH & Co. KG Betonpumpendienst 2) Nabburg, DEU 68.41 52.54 2014 0.8 0.7
TBG Transportbeton GmbH & Co. Kommanditgesellschaft INN-BETON 2) Altötting, DEU 68.39 68.39 2014 0.6 1.6
TBG Transportbeton GmbH & Co.KG Lohr-Beton Lohr am Main, DEU 50.00 50.00 2014 0.2 0.3
TBG Transportbeton Rhein-Donau-Raum GmbH & Co.KG Singen, DEU 36.90 36.90 2014 0.3 0.6
TBG Transportbeton Schleiz GmbH & Co. KG i.L. 4) Schleiz, DEU 50.00 50.00 2014 0.2 0.0
TBG Transportbeton Selb GmbH & Co. KG Selb, DEU 33.33 33.33 2014 0.2 0.1
TBG Transportbeton Werner GmbH & Co. KG Dietfurt a.d. Altmühl, DEU 50.00 42.50 2014 0.1 0.3
TBM Transportbeton-Gesellschaft mbH Marienfeld & Co. KG 2) Marienfeld, DEU 87.50 85.94 2014 0.1 0.2
Transbeton Gesellschaft mit beschränkter Haftung & Co Kommanditgesellschaft Löhne, DEU 27.23 27.23 2014 1.7 1.2
V.o.F. Betoncentrale West-Brabant Oud-Gastel, NLD 50.00 50.00 2014 -0.4 -1.2
Van Zanten Holding B.V. Zuidbroek, NLD 25.00 25.00 2014 1.9 0.3
Vlissingse Transportbeton Onderneming B.V. Middelburg, NLD 50.00 50.00 2014 1.3 0.0
Woerdense Betonmortel Centrale B.V. Utrecht, NLD 50.00 50.00 2014 0.0 0.0
Zement- und Kalkwerke Otterbein GmbH & Co. KG Müs, DEU 38.10 38.10 38.10 2014 2.8 0.2
273HeidelbergCement | Annual Report 2015
Consolidated income statement
Consolidated statement of comprehensive income
Consolidated statement of cash flows
Consolidated balance sheet
Consolidated statement of changes in equity
Segment reporting / Notes to the consolidated financial statements
Notes to the 2015 consolidated financial statements
Audit opinion
Responsibility statement
Con
solid
ated
fin
anci
al s
tate
men
tsA
ddit
iona
l inf
orm
atio
n
4
5

Company name Corporate seat HC AG direct
owner-ship %
Capital share
% 6)
Group owner-ship %
Year 7) Equity in €
million 8)
Net income
in € million 9)
Associates
Eastern Europe-Central Asia
BETONIKA plus s.r.o. Lužec nad Vltavou, CZE 33.33 33.33 2014 3.0 0.2
Centrum Technologiczne Betotech Sp. z o.o. Dąbrowa Górnicza, POL 100.00 100.00 2014 0.1 -0.3
LOMY MORINA spol. s r.o. Morina, CZE 48.95 48.95 2014 13.5 0.4
PREFA Grygov a.s. 2) Grygov, CZE 54.00 54.00 2014 2.7 0.0
SP Bohemia, k.s. 2) Kraluv Dvur, CZE 77.32 75.00 2014 6.8 0.1
TBG Louny s.r.o. Louny, CZE 33.33 33.33 2014 1.0 0.1
TBG PKS a.s. Zdar nad Sazavou, CZE 50.00 29.70 2014 1.7 0.4
Associates
North America
Cemstone Products Company St. Paul, USA 58.03 49.45 2014 12.9 1.3
Cemstone Ready-Mix, Inc. Madison, USA 44.01 44.01 2014 3.2 0.1
Chandler Concrete/Piedmont, Inc. Raleigh, USA 33.33 33.33 2014 4.9 0.2
Chaney Enterprises Limited Partnership Olympia, USA 25.00 25.00 2014 12.6 1.7
KHB Venture LLC 5) Boston, USA 33.33 33.33 - - -
Southstar Limited Partnership Annapolis, USA 25.00 25.00 2014 13.6 0.4
Twin City Concrete Products Co. St. Paul, USA 33.63 33.63 2014 13.9 1.3
U.S. Concrete, Inc. 5) Wilmington, USA 8.66 8.66 - - -
Associates
Asia-Pacific
PT Bhakti Sari Perkasa Bersama Jakarta, IDN 30.00 15.30 2015 0.1 0.0
PT Cibinong Center Industrial Estate Bogor, IDN 50.00 25.50 2014 6.7 1.5
PT Lintas Bahana Abadi Jakarta, IDN 49.00 24.98 2014 4.1 0.4
PT Pama Indo Mining Jakarta, IDN 40.00 20.39 2014 3.4 1.4
The following subsidiaries are reflected in the consolidated financial statements at cost (available for sale at cost) due to their immateriality.
Immaterial subsidiaries
Western and Northern Europe
Betotech Baustofflabor GmbH Heidelberg, DEU 100.00 100.00 2014 0.3 0.0
CEMLAPIS Warstein GmbH & Co. KG Warstein, DEU 100.00 100.00 100.00 2014 0.1 -1.4
CEMLAPIS Warstein Verwaltungsgesellschaft mbH Warstein, DEU 100.00 100.00 100.00 2014 0.0 0.0
Donau Kies Verwaltungs GmbH Fürstenzell, DEU 75.00 75.00 2014 0.0 0.0
Etablissement F.S. Bivois SARL Strasbourg, FRA 100.00 60.00 2014 0.4 -0.1
Fastighets AB Lövholmen 1 5) Stockholm, SWE 100.00 100.00 - - -
Fastighets AB Lövholmen 10 5) Stockholm, SWE 100.00 100.00 - - -
Fastighets AB Lövholmen 11 5) Stockholm, SWE 100.00 100.00 - - -
Fastighets AB Lövholmen 2 5) Stockholm, SWE 100.00 100.00 - - -
Fastighets AB Lövholmen 3 5) Stockholm, SWE 100.00 100.00 - - -
Fastighets AB Lövholmen 4 5) Stockholm, SWE 100.00 100.00 - - -
Fastighets AB Lövholmen 5 5) Stockholm, SWE 100.00 100.00 - - -
Fastighets AB Lövholmen 6 5) Stockholm, SWE 100.00 100.00 - - -
Fastighets AB Lövholmen 7 5) Stockholm, SWE 100.00 100.00 - - -
274 HeidelbergCement | Annual Report 2015
Consolidated financial statements4

Company name Corporate seat HC AG direct
owner-ship %
Capital share
% 6)
Group owner-ship %
Year 7) Equity in €
million 8)
Net income
in € million 9)
Fastighets AB Lövholmen 8 5) Stockholm, SWE 100.00 100.00 - - -
Fastighets AB Lövholmen 9 5) Stockholm, SWE 100.00 100.00 - - -
Fruitbat Company Maidenhead, GBR 100.00 100.00 2014 0.0 0.0
Greystone Ambient & Style GmbH & Co. KG Lingenfeld, DEU 100.00 60.00 2014 0.2 -0.2
Greystone Ambient & Style Verwaltungsgesellschaft mbH Lingenfeld, DEU 100.00 60.00 2014 0.0 0.0
Hanson Aggregates Verwaltungs-GmbH Leinatal, DEU 100.00 100.00 2014 0.1 0.0
HC River Logistics and Shipping Limited 4) 5) Birkirkara, MLT 99.93 100.00 100.00 - - -
HeidelbergCement Construction Materials Italia S.r.l. 5) Milan, ITA 100.00 100.00 100.00 - - -
HeidelbergCement Grundstücksverwaltungsgesellschaft mbH Heidelberg, DEU 100.00 100.00 100.00 2014 0.0 0.0
HeidelbergCement Shared Services GmbH Leimen, DEU 100.00 100.00 100.00 2014 0.1 0.0
HeidelbergCement Technology Center GmbH Heidelberg, DEU 100.00 100.00 2014 0.0 0.0
HeidelbergCement, Funk & Kapphan Grundstücksverwaltungs-gesellschaft mbH 3) Heidelberg, DEU 80.00 80.00 80.00 2014 0.0 0.0
Heidelberger Beton Aschaffenburg Verwaltungs-GmbH Aschaffenburg, DEU 70.74 70.74 2014 0.0 0.0
Heidelberger Beton Aue-Schwarzenberg Verwaltungs-GmbH Schwarzenberg, DEU 100.00 100.00 2014 0.0 0.0
Heidelberger Beton Donau-Naab Verwaltungsgesellschaft mbH Burglengenfeld, DEU 100.00 85.00 2014 0.0 0.0
Heidelberger Beton Inntal Verwaltungs-GmbH Altötting, DEU 100.00 68.39 2014 0.0 0.0
Heidelberger Beton Personal-Service GmbH Heidelberg, DEU 100.00 100.00 2014 0.1 0.0
Heidelberger Betonelemente Verwaltungs-GmbH Chemnitz, DEU 83.00 83.00 2014 0.0 0.4
Heidelberger Betonpumpen Rhein-Main-Nahe Verwaltungs-GmbH Bad Kreuznach, DEU 100.00 93.74 2014 0.0 0.0
Heidelberger Kalksandstein Grundstücks- und Beteiligungs- Verwaltungs-GmbH Durmersheim, DEU 100.00 100.00 2014 0.0 0.0
Heidelberger KS Beteiligungen Deutschland Verwaltungs-gesellschaft mbH Heidelberg, DEU 100.00 100.00 2014 0.0 0.0
Kalko B.V. 's-Hertogenbosch, NLD 100.00 100.00 2014 0.0 0.0
Kieswerke Kieser Verwaltungs-GmbH Gotha, DEU 51.00 51.00 2014 0.0 0.0
KS-QUADRO Bausysteme GmbH Durmersheim, DEU 100.00 100.00 2014 0.1 0.0
Lithonplus Verwaltungs-GmbH Lingenfeld, DEU 60.00 60.00 2014 0.0 0.0
Martin Milch Gesellschaft mit beschränkter Haftung Ochtendung, DEU 70.00 100.00 100.00 2014 0.1 0.0
Materiaux de Boran S.A. Boran-sur-Oise, FRA 99.84 99.84 2014 0.1 0.0
Paderborner Transport - Beton - Gesellschaft mit beschränkter Haftung Paderborn, DEU 75.00 75.00 2014 0.0 0.0
Rederij Cement-Tankvaart B.V. Terneuzen, NLD 66.66 66.66 2014 4.1 -0.1
RLG Rohstoffe GmbH & Co. KG Essen, DEU 100.00 100.00 2014 0.0 0.0
RLG Rohstoffe Verwaltungs-GmbH Essen, DEU 100.00 100.00 2014 0.0 0.0
SBM Systembaumontagen GmbH 4) Chemnitz, DEU 100.00 83.00 2014 0.0 0.0
SCI Bicowal Strasbourg, FRA 100.00 60.00 2014 0.0 0.0
SMW Sand und Mörtelwerk Verwaltungs-GmbH Königs Wusterhausen, DEU 100.00 100.00 2014 0.1 0.0
SPRL Ferme de Wisempierre Saint-Maur-Ere, BEL 100.00 100.00 2014 2.2 0.0
TBG Ilm-Beton Verwaltungs-GmbH 2) Arnstadt, DEU 55.00 55.00 2014 0.0 0.0
TBG Transportbeton Reichenbach Verwaltungs-GmbH Reichenbach, DEU 70.00 70.00 2014 0.0 0.0
TBG WIKA-Beton Verwaltungs- GmbH Stade, DEU 100.00 100.00 2014 0.0 0.0
TBM Transportbeton-Gesellschaft mit beschränkter Haftung Marienfeld Harsewinkel, DEU 87.50 85.94 2014 0.0 0.0
Trans CBR S.A. Bruxelles, BEL 100.00 100.00 2014 0.8 -0.1
Transportbeton Bad Waldsee Geschäftsführungs GmbH Bad Waldsee, DEU 100.00 64.00 2014 0.0 0.0
Verwaltungsgesellschaft Baustoffwerke Dresden mbH Dresden, DEU 100.00 51.00 2014 0.2 0.0
WIKA Sand und Kies Verwaltungs-GmbH Bremen, DEU 100.00 100.00 2014 0.0 0.0
WTG Walhalla Transportbeton GmbH Regensburg, DEU 100.00 95.00 2014 0.4 0.2
275HeidelbergCement | Annual Report 2015
Consolidated income statement
Consolidated statement of comprehensive income
Consolidated statement of cash flows
Consolidated balance sheet
Consolidated statement of changes in equity
Segment reporting / Notes to the consolidated financial statements
Notes to the 2015 consolidated financial statements
Audit opinion
Responsibility statement
Con
solid
ated
fin
anci
al s
tate
men
tsA
ddit
iona
l inf
orm
atio
n
4
5

Company name Corporate seat HC AG direct
owner-ship %
Capital share
% 6)
Group owner-ship %
Year 7) Equity in €
million 8)
Net income
in € million 9)
Immaterial subsidiaries
Eastern Europe-Central Asia
8 Vershin LLP Almaty, KAZ 100.00 100.00 2014 0.3 0.0
Agrowelt Sp. z o.o. Bielany Wrocławskie, POL 100.00 100.00 2014 -0.3 -0.1
Bukhtarma TeploEnergo LLP Oktyabrskiy village, KAZ 100.00 100.00 2014 -1.8 0.0
Bukhtarma Vodokanal LLP Oktyabrskiy village, KAZ 100.00 100.00 2014 -0.4 0.0
Center Cement Plus Limited Liability Partnership Astana, KAZ 100.00 100.00 2014 1.9 0.1
Donau Kies Bohemia Verwaltungs, s.r.o. Pilsen, CZE 77.33 75.00 2014 0.0 0.0
Geo Nieruchomości Sp. z o.o. Opole, POL 100.00 100.00 2014 0.0 -0.1
Heidelberg Vostok-Cement LLP Almaty, KAZ 100.00 100.00 2014 1.0 -0.1
HeidelbergCement Services - LLP Almaty, KAZ 100.00 100.00 2014 0.1 0.1
MIXT Sp. z o. o. Chorula, POL 100.00 100.00 2014 0.7 0.0
OOO HC Yug Strelica, RUS 100.00 100.00 2014 0.8 0.2
Podgrodzie Sp. z o.o. Wroclaw, POL 100.00 100.00 2014 3.5 -0.2
Polgrunt Sp. z o. o. Chorula, POL 100.00 100.00 2014 0.1 0.0
SABIA spol. s r.o. Bohusovice nad Ori, CZE 100.00 60.00 2014 0.2 0.0
TRANS-SERVIS,spol. s r.o. Kraluv Dvur, CZE 100.00 100.00 2014 3.0 0.3
VAPIS stavební hmoty s.r.o. Praha, CZE 100.00 51.00 2014 0.2 0.0
Immaterial subsidiaries
North America
Cadman Holding Co., Inc. 5) Olympia, USA 100.00 100.00 - - -
Cementi Meridionali Ltd. 5) Tortola, VGB 100.00 100.00 - - -
EPC VA 121, LLC 5) Richmond, USA 100.00 100.00 - - -
HA Properties IN, LLC 5) Indianapolis, USA 100.00 100.00 - - -
HA Properties KY, LLC 5) Frankfort, USA 100.00 100.00 - - -
HA Properties NY II, LLC 5) Albany, USA 100.00 100.00 - - -
HA Properties NY, LLC 5) Albany, USA 100.00 100.00 - - -
HA Properties SC, LLC 5) Greenville, USA 100.00 100.00 - - -
Hanson (ER-No 16) Inc. 5) Wilmington, USA 100.00 100.00 - - -
Hanson Aggregates Contracting, Inc. 5) Sacramento, USA 100.00 100.00 - - -
Hanson Aggregates Properties TX, LLC 5) Austin, USA 100.00 100.00 - - -
Hanson Finance America, Inc. 5) Wilmington, USA 100.00 100.00 - - -
HP&P SE Properties SC LLC 5) Columbia, USA 100.00 100.00 - - -
HP&P SE Properties VA LLC 5) Richmond, USA 100.00 100.00 - - -
HSC Cocoa Property Reserve, LLC 5) Tallahassee, USA 100.00 100.00 - - -
HSPP Properties BMC Ohio LLC 5) Olympia, USA 100.00 100.00 - - -
HSPP Properties Ohio LLC 5) Columbus, USA 100.00 100.00 - - -
HSPP Properties PMA Ohio LLC 5) Olympia, USA 100.00 100.00 - - -
HSPP Properties Tennessee LLC 5) Nashville, USA 100.00 100.00 - - -
Industrial Del Fresno SA 5) Mexico City, MEX 76.00 76.00 - - -
Kidde Industries, Inc. 5) Wilmington, USA 100.00 100.00 - - -
Lehigh Hanson Holdings Limited 5) Ontario, CAN 100.00 100.00 - - -
Lehigh Northeast Cement Company 5) Albany, USA 100.00 100.00 - - -
Lehigh Portland New York LLC 5) Albany, USA 100.00 100.00 - - -
Lucas Coal Company, Inc 5) Harrisburg, USA 100.00 100.00 - - -
Magnum Minerals, Inc. 5) Harrisburg, USA 100.00 100.00 - - -
276 HeidelbergCement | Annual Report 2015
Consolidated financial statements4

Company name Corporate seat HC AG direct
owner-ship %
Capital share
% 6)
Group owner-ship %
Year 7) Equity in €
million 8)
Net income
in € million 9)
Mediterranean Carriers, Inc. 5) Panama City, PAN 100.00 100.00 - - -
Permanente Cement Company 5) Sacramento, USA 100.00 100.00 - - -
Piedras y Arenas Baja SA de CV 5) Tijuana, MEX 100.00 100.00 - - -
Plum Run Lake, LLC 5) Columbus, USA 100.00 100.00 - - -
PUSH NA Holdings, Inc. 5) Wilmington, USA 100.00 100.00 - - -
Sherman-Abetong, Inc. 5) Montgomery, USA 100.00 100.00 - - -
South Coast Materials Company 5) Sacramento, USA 100.00 100.00 - - -
SunCrete Rooftile, Inc. 5) Sacramento, USA 100.00 100.00 - - -
Total Limited 5) Wilmington, USA 100.00 100.00 - - -
Immaterial subsidiaries
Africa-Mediterranean Basin
HeidelbergCement Mediterranean Basin Holdings S.L.U. Palestine Ltd. 5) Ramallah, PSE 100.00 100.00 - - -
The following joint ventures and associates are accounted for at cost (available for sale at cost) due to their immateriality.
Immaterial joint ventures and associates
Western and Northern Europe
AB Stebo Göteborg, SWE 50.00 50.00 2014 0.1 0.0
AB Strömstadsbetong Göteborg, SWE 33.00 33.00 2014 0.0 0.0
AB Strömstadsbetong & Co Kommanditbolag Göteborg, SWE 33.00 33.00 2014 0.5 0.2
ABE Deponie GmbH Damsdorf, DEU 50.00 50.00 2014 1.7 0.0
Alzagri NV Brugge, BEL 50.00 50.00 2014 0.9 -0.2
Baustoff- und Umschlags-GmbH 2) Mosbach, DEU 66.66 38.23 2014 0.2 0.1
Betonpumpen-Service Niedersachsen Verwaltungs-GmbH Hannover, DEU 100.00 50.00 2014 0.0 0.0
bihek GmbH Breisach am Rhein, DEU 40.00 40.00 2014 0.2 0.0
C. & G. Concrete Limited 4) 5) Leeds, GBR 23.48 23.48 - - -
Calcaires de la Rive Gauche I SPRL Obourg, BEL 35.00 35.00 2014 5.6 -0.3
DONAU MÖRTEL-Verwaltungs-GmbH Passau, DEU 50.00 50.00 2014 0.0 0.0
Fertigbeton (FBU) GmbH & Co Kommanditgesellschaft Unterwittbach 2) Unterwittbach, DEU 57.14 57.14 2014 0.2 0.0
Gebrüder Willersinn Industriesandwerk Verwaltungsgesellschaft mit beschränkter Haftung Raunheim, DEU 33.33 33.33 2014 0.0 0.0
Hafenbetriebs- und Beteiligungs-GmbH, Stade Stade, DEU 50.00 50.00 2014 0.1 0.0
Haitz Betonwerk GmbH & Co. KG Au am Rhein, DEU 47.37 21.05 2014 0.4 0.0
Haitz Betonwerk Verwaltungs-GmbH Au am Rhein, DEU 47.43 21.08 2014 0.1 0.0
Heidelberger Beton Donau-Iller Verwaltungs-GmbH 2) Unterelchingen, DEU 80.65 80.65 2014 0.1 0.0
Heidelberger Beton Gersdorf GmbH & Co. KG Gersdorf, DEU 50.00 50.00 2014 0.1 0.1
Heidelberger Beton Gersdorf Verwaltungs- und Beteiligungs-GmbH Gersdorf, DEU 50.00 50.00 2014 0.0 0.0
Heidelberger Beton Grenzland Verwaltungs-GmbH Marktredwitz, DEU 100.00 50.00 2014 0.0 0.0
Heidelberger Beton Karlsruhe Verwaltungs-GmbH Karlsruhe, DEU 100.00 44.44 2014 0.0 0.0
Heidelberger Beton Kurpfalz Verwaltungs-GmbH 2) Eppelheim, DEU 100.00 51.11 2014 0.0 0.0
Heidelberger Beton Verwaltungs GmbH Stuttgart Remseck a. N., DEU 100.00 50.00 2014 0.0 0.0
Heidelberger Betonpumpen Simonis Verwaltungs-GmbH 2) Ubstadt-Weiher, DEU 100.00 57.32 2014 0.0 0.0
Hormigones Mecanizados, S.A. Palma de Mallorca, ESP 33.33 33.33 2014 0.1 0.0
ISAR-DONAU MÖRTEL-Verwaltungs-GmbH Plattling, DEU 33.33 33.33 2014 0.0 0.0
Kalksandsteinwerk Amberg GmbH & Co. KG 2) Ebermannsdorf, DEU 50.10 50.10 2014 1.6 0.1
277HeidelbergCement | Annual Report 2015
Consolidated income statement
Consolidated statement of comprehensive income
Consolidated statement of cash flows
Consolidated balance sheet
Consolidated statement of changes in equity
Segment reporting / Notes to the consolidated financial statements
Notes to the 2015 consolidated financial statements
Audit opinion
Responsibility statement
Con
solid
ated
fin
anci
al s
tate
men
tsA
ddit
iona
l inf
orm
atio
n
4
5
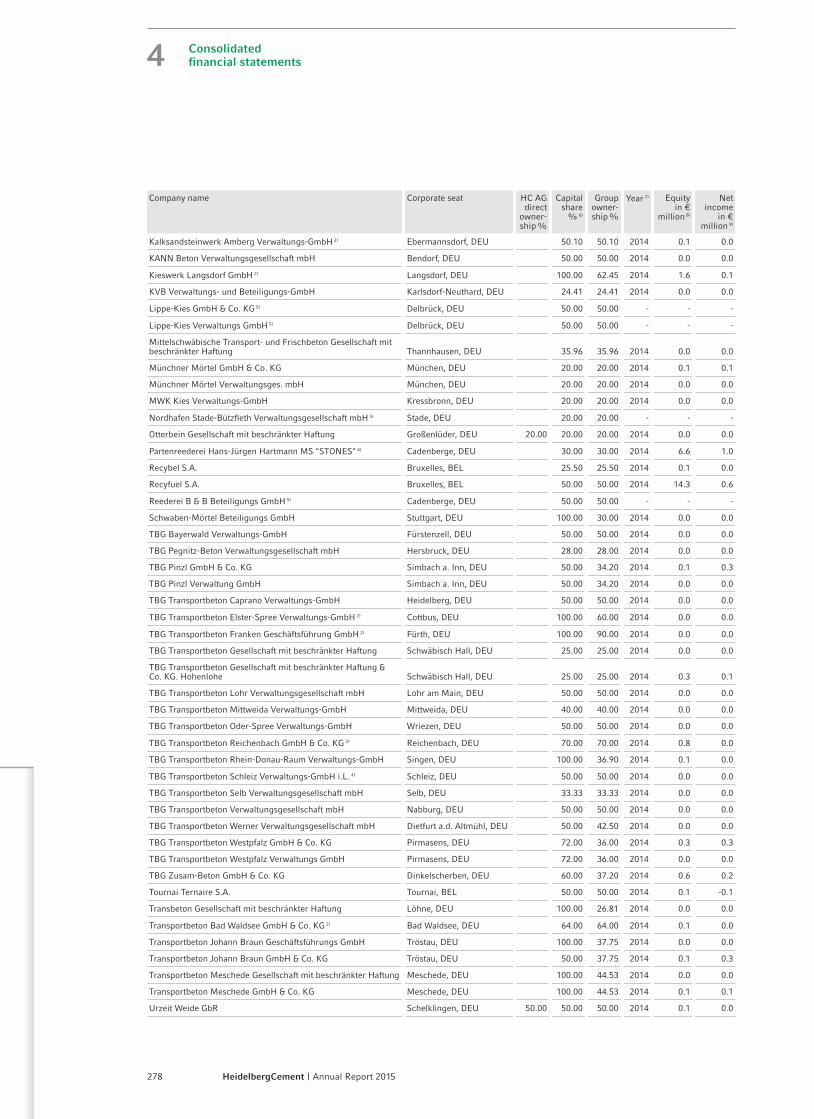
Company name Corporate seat HC AG direct
owner-ship %
Capital share
% 6)
Group owner-ship %
Year 7) Equity in €
million 8)
Net income
in € million 9)
Kalksandsteinwerk Amberg Verwaltungs-GmbH 2) Ebermannsdorf, DEU 50.10 50.10 2014 0.1 0.0
KANN Beton Verwaltungsgesellschaft mbH Bendorf, DEU 50.00 50.00 2014 0.0 0.0
Kieswerk Langsdorf GmbH 2) Langsdorf, DEU 100.00 62.45 2014 1.6 0.1
KVB Verwaltungs- und Beteiligungs-GmbH Karlsdorf-Neuthard, DEU 24.41 24.41 2014 0.0 0.0
Lippe-Kies GmbH & Co. KG 5) Delbrück, DEU 50.00 50.00 - - -
Lippe-Kies Verwaltungs GmbH 5) Delbrück, DEU 50.00 50.00 - - -
Mittelschwäbische Transport- und Frischbeton Gesellschaft mit beschränkter Haftung Thannhausen, DEU 35.96 35.96 2014 0.0 0.0
Münchner Mörtel GmbH & Co. KG München, DEU 20.00 20.00 2014 0.1 0.1
Münchner Mörtel Verwaltungsges. mbH München, DEU 20.00 20.00 2014 0.0 0.0
MWK Kies Verwaltungs-GmbH Kressbronn, DEU 20.00 20.00 2014 0.0 0.0
Nordhafen Stade-Bützfleth Verwaltungsgesellschaft mbH 5) Stade, DEU 20.00 20.00 - - -
Otterbein Gesellschaft mit beschränkter Haftung Großenlüder, DEU 20.00 20.00 20.00 2014 0.0 0.0
Partenreederei Hans-Jürgen Hartmann MS "STONES" 4) Cadenberge, DEU 30.00 30.00 2014 6.6 1.0
Recybel S.A. Bruxelles, BEL 25.50 25.50 2014 0.1 0.0
Recyfuel S.A. Bruxelles, BEL 50.00 50.00 2014 14.3 0.6
Reederei B & B Beteiligungs GmbH 5) Cadenberge, DEU 50.00 50.00 - - -
Schwaben-Mörtel Beteiligungs GmbH Stuttgart, DEU 100.00 30.00 2014 0.0 0.0
TBG Bayerwald Verwaltungs-GmbH Fürstenzell, DEU 50.00 50.00 2014 0.0 0.0
TBG Pegnitz-Beton Verwaltungsgesellschaft mbH Hersbruck, DEU 28.00 28.00 2014 0.0 0.0
TBG Pinzl GmbH & Co. KG Simbach a. Inn, DEU 50.00 34.20 2014 0.1 0.3
TBG Pinzl Verwaltung GmbH Simbach a. Inn, DEU 50.00 34.20 2014 0.0 0.0
TBG Transportbeton Caprano Verwaltungs-GmbH Heidelberg, DEU 50.00 50.00 2014 0.0 0.0
TBG Transportbeton Elster-Spree Verwaltungs-GmbH 2) Cottbus, DEU 100.00 60.00 2014 0.0 0.0
TBG Transportbeton Franken Geschäftsführung GmbH 2) Fürth, DEU 100.00 90.00 2014 0.0 0.0
TBG Transportbeton Gesellschaft mit beschränkter Haftung Schwäbisch Hall, DEU 25.00 25.00 2014 0.0 0.0
TBG Transportbeton Gesellschaft mit beschränkter Haftung & Co. KG. Hohenlohe Schwäbisch Hall, DEU 25.00 25.00 2014 0.3 0.1
TBG Transportbeton Lohr Verwaltungsgesellschaft mbH Lohr am Main, DEU 50.00 50.00 2014 0.0 0.0
TBG Transportbeton Mittweida Verwaltungs-GmbH Mittweida, DEU 40.00 40.00 2014 0.0 0.0
TBG Transportbeton Oder-Spree Verwaltungs-GmbH Wriezen, DEU 50.00 50.00 2014 0.0 0.0
TBG Transportbeton Reichenbach GmbH & Co. KG 2) Reichenbach, DEU 70.00 70.00 2014 0.8 0.0
TBG Transportbeton Rhein-Donau-Raum Verwaltungs-GmbH Singen, DEU 100.00 36.90 2014 0.1 0.0
TBG Transportbeton Schleiz Verwaltungs-GmbH i.L. 4) Schleiz, DEU 50.00 50.00 2014 0.0 0.0
TBG Transportbeton Selb Verwaltungsgesellschaft mbH Selb, DEU 33.33 33.33 2014 0.0 0.0
TBG Transportbeton Verwaltungsgesellschaft mbH Nabburg, DEU 50.00 50.00 2014 0.0 0.0
TBG Transportbeton Werner Verwaltungsgesellschaft mbH Dietfurt a.d. Altmühl, DEU 50.00 42.50 2014 0.0 0.0
TBG Transportbeton Westpfalz GmbH & Co. KG Pirmasens, DEU 72.00 36.00 2014 0.3 0.3
TBG Transportbeton Westpfalz Verwaltungs GmbH Pirmasens, DEU 72.00 36.00 2014 0.0 0.0
TBG Zusam-Beton GmbH & Co. KG Dinkelscherben, DEU 60.00 37.20 2014 0.6 0.2
Tournai Ternaire S.A. Tournai, BEL 50.00 50.00 2014 0.1 -0.1
Transbeton Gesellschaft mit beschränkter Haftung Löhne, DEU 100.00 26.81 2014 0.0 0.0
Transportbeton Bad Waldsee GmbH & Co. KG 2) Bad Waldsee, DEU 64.00 64.00 2014 0.1 0.0
Transportbeton Johann Braun Geschäftsführungs GmbH Tröstau, DEU 100.00 37.75 2014 0.0 0.0
Transportbeton Johann Braun GmbH & Co. KG Tröstau, DEU 50.00 37.75 2014 0.1 0.3
Transportbeton Meschede Gesellschaft mit beschränkter Haftung Meschede, DEU 100.00 44.53 2014 0.0 0.0
Transportbeton Meschede GmbH & Co. KG Meschede, DEU 100.00 44.53 2014 0.1 0.1
Urzeit Weide GbR Schelklingen, DEU 50.00 50.00 50.00 2014 0.1 0.0
278 HeidelbergCement | Annual Report 2015
Consolidated financial statements4

Company name Corporate seat HC AG direct
owner-ship %
Capital share
% 6)
Group owner-ship %
Year 7) Equity in €
million 8)
Net income
in € million 9)
Verwaltungsgesellschaft mit beschränkter Haftung TRAPOBET Transportbeton Kaiserslautern Kaiserslautern, DEU 50.00 50.00 2014 0.0 0.0
WIKING Baustoff- und Transport Gesellschaft mit beschränkter Haftung Soest, DEU 50.00 50.00 2014 0.0 0.0
Immaterial joint ventures and associates
Eastern Europe-Central Asia
Bukhtarma Teplo Tranzit LLP New Bukhtarma village, KAZ 20.00 20.00 2014 -0.1 -
Velkolom Certovy schody, akciova spolecnost Tman, CZE 50.00 50.00 2014 7.6 0.1
Immaterial joint ventures and associates
North America
Newbury Development Associates, LP 5) Bridgeville, USA 35.65 35.00 - - -
Newbury Development Management, LLC 5) Bridgeville, USA 35.00 35.00 - - -
Immaterial joint ventures and associates
Asia-Pacific
Diversified Function Sdn Bhd Kuala Lumpur, MYS 50.00 50.00 2014 0.0 0.0
Pomphen Prathan Company Limited 4) 5) Bangkok, THA 49.70 49.70 - - -
Sanggul Suria Sdn Bhd Kuala Lumpur, MYS 45.00 45.00 2015 0.0 0.0
Immaterial joint ventures and associates
Africa-Mediterranean Basin
Union Cement Norcem C.o. (W.L.L.) Ras Al Khaimah, ARE 40.00 40.00 2014 0.8 4.5
1) Controlling influence through contractual arrangements and/or legal regulations
2) Absence of controlling influence through contractual arrangements and/or legal regulations
3) The company makes use of the exemption from disclosure obligations in accordance with § 264b of the German Commercial Code (HGB).
4) In liquidation
5) Information on equity and earnings is omitted pursuant to Section 286 Subsection 3 Sentence 1 No. 1 of the HGB if such information is of minor relevance for a fair presentation of the financial position, cash flows and profitability of HeidelbergCement AG.
6) Share pursuant to Section 16 of the German Stock Corporation Act (AktG)
7) Last fiscal year for which financial statements are available.
8) Translated with the closing rate of the fiscal year for which financial statements are available.
9) Translated with the average rate of the fiscal year for which financial statements are available.
Heidelberg, 16 March 2016
HeidelbergCement AG
The Managing Board
279HeidelbergCement | Annual Report 2015
Consolidated income statement
Consolidated statement of comprehensive income
Consolidated statement of cash flows
Consolidated balance sheet
Consolidated statement of changes in equity
Segment reporting / Notes to the consolidated financial statements
Notes to the 2015 consolidated financial statements
Audit opinion
Responsibility statement
Con
solid
ated
fin
anci
al s
tate
men
tsA
ddit
iona
l inf
orm
atio
n
4
5

Audit opinion
We have audited the consolidated financial statements prepared by the HeidelbergCement AG, Heidelberg, comprising the consolidated income statement, the consolidated statement of comprehensive income, the consolidated statement of cash flows, the consolidated balance sheet, the consolidated statement of changes in equity and the notes to the consolidated financial statements, together with the combined management report of HeidelbergCement Group and HeidelbergCement AG for the fiscal year from 1 January to 31 December 2015. The preparation of the consolidated financial statements and the group management report in accordance with IFRSs as adopted by the EU, and the additional requirements of German commercial law pursuant to Sec. 315a (1) HGB [“Handelsgesetzbuch”: “German Commercial Code”] and supplementary provisions of the articles of incorporation and bylaws are the responsibility of the parent company’s management. Our responsibility is to express an opinion on the consolidated financial statements and on the group management report based on our audit.
We conducted our audit of the consolidated financial statements in accordance with Sec. 317 HGB and German generally accepted standards for the audit of financial statements promulgated by the Institut der Wirtschaftsprüfer [Institute of Public Auditors in Germany] (IDW). Those standards require that we plan and perform the audit such that misstatements materially affecting the presentation of the net assets, financial position and results of operations in the consolidated financial statements in accordance with the applicable financial reporting frame-work and in the group management report are detected with reasonable assurance. Knowledge of the business activities and the economic and legal environment of the Group and expectations as to possible misstatements are taken into account in the determination of audit procedures. The effectiveness of the accounting-related internal control system and the evidence supporting the disclosures in the consolidated financial statements and the group management report are examined primarily on a test basis within the framework of the audit. The audit includes assessing the annual financial statements of those entities included in consolidation, the determination of entities to be included in consolidation, the accounting and consolidation principles used and significant estimates made by management, as well as evaluating the overall presentation of the consolidated financial statements and the group management report. We believe that our audit provides a reasonable basis for our opinion.
Our audit has not led to any reservations.
In our opinion, based on the findings of our audit, the consolidated financial statements comply with IFRSs as adopted by the EU, the additional requirements of German commercial law pursuant to Sec. 315a (1) HGB and supplementary provisions of the articles of incorporation and bylaws and give a true and fair view of the net assets, financial position and results of operations of the Group in accordance with these requirements. The group management report is consistent with the consolidated financial statements and as a whole provides a suitable view of the Group’s position and suitably presents the opportunities and risks of future development.
Stuttgart, 16 March 2016
Ernst & Young GmbH Wirtschaftsprüfungsgesellschaft
Somes VieringWirtschaftsprüferin Wirtschaftsprüfer [German Public Auditor] [German Public Auditor]
280 HeidelbergCement | Annual Report 2015
Consolidated financial statements4

Responsibility statement
To the best of our knowledge, and in accordance with the applicable reporting principles, the consolidated financial statements give a true and fair view of the assets, liabilities, financial position, and profit or loss of the Group, and the Group management report, which has been combined with the management report of Heidel-bergCement AG, includes a fair review of the development and performance of the business and the position of the Group, together with a description of the principal opportunities and risks associated with the expected development of the Group.
Heidelberg, 16 March 2016
HeidelbergCement AG
The Managing Board
Dr. Bernd Scheifele Dr. Dominik von Achten
Daniel Gauthier
Kevin Gluskie
Andreas Kern
Dr. Lorenz Näger
Dr. Albert Scheuer
Hakan Gurdal Jon Morrish
281HeidelbergCement | Annual Report 2015
Consolidated income statement
Consolidated statement of comprehensive income
Consolidated statement of cash flows
Consolidated balance sheet
Consolidated statement of changes in equity
Segment reporting / Notes to the consolidated financial statements
Notes to the 2015 consolidated financial statements
Audit opinion
Responsibility statement
Con
solid
ated
fin
anci
al s
tate
men
tsA
ddit
iona
l inf
orm
atio
n
4
5

Additional information
5
282 HeidelbergCement | Annual Report 2015

284 Global functions and Country Managers 286 Glossary 288 Imprint Back Cover: Cement capacities and aggregates reserves
283HeidelbergCement | Annual Report 2015
Con
solid
ated
fin
anci
al s
tate
men
tsA
ddit
iona
l inf
orm
atio
n
4
5

Global functions and Country Managers
Global functions
Global functions
Day, Gareth Director Group Strategy & Development and Cementitious
Kozelka, Rolf Director Group Tax
Ploss, Dr. Ines Director Group Purchasing
Schaffernak, Dr. Ingo Director Group Legal
Schaller, Andreas Director Group Communication & Investor Relations
Schnurr, Andreas Director Group Human Resources and Group Compliance
Schwind, Klaus Director Group Shared Service Centers
Standhaft, Dr. Wolfgang Director Group Information Technology
Toborek, Anna Director Group Corporate Finance
Vandenberghe, Marc Director Group Insurance & Corporate Risk Management
Weig, Severin Director Group Treasury
Weingardt, Stefan Director Group Internal Audit
Wendt, Dr. Carsten Director Group Reporting, Controlling & Consolidation
Heidelberg Technology Center (HTC)
Gupta, Akhilesh Director Global HTC
Bertola, Arnaldo Senior Vice President Manufacturing & Engineering, President HTC North America
Breyer, Robert Director Manufacturing & Engineering Central Europe-Central Asia and Head of HTC Central Europe-Central Asia
Conrads, Axel Director Manufacturing & Engineering TEAM and Head of HTC TEAM
Defalque, Juan-Francisco Director Manufacturing & Engineering Asia-Oceania and Head of HTC Asia-Oceania
Competence Center Materials (CCM)
Smith, Chuck Director Global Competence Center Materials
Competence Center Readymix (CCR)
Pearson, Tony Director Global Competence Center Readymix (from 1 April 2016)
Global Environmental Sustainability
Lukas, Peter Director Global Environmental Sustainability
Global Logistics
Middendorf, Kay Director Global Logistics
Global Sales & Marketing
Oerter, Gerald Director Global Sales & Marketing
284 HeidelbergCement | Annual Report 2015
Additional information5

Country Managers
Western and Northern Europe
Baltics/Denmark/Iceland/Norway/Sweden Syvertsen, Gunnar General Manager Northern Europe
Belgium/Netherlands Junon, Jean-Marc General Manager Benelux
Germany Knell, Christian General Manager Germany
United Kingdom Cooper, Daniel Chief Executive Officer UK
Eastern Europe-Central Asia
Bosnia & Herzegovina Muidza, Branimir Country Manager Bosnia & Herzegovina
Czech Republic Hrozek, Jan Chudej, Karel
General Manager Czech Republic (until 31 March 2016) General Manager Czech Republic (from 1 April 2016)
Georgia Hampel, Michael General Manager Georgia
Hungary Szarkándi, János General Manager Hungary
Kazakhstan Kempe, Roman General Manager Kazakhstan
Poland Jelito, Ernest General Manager Poland
Romania Aldea, Dr. Florian General Manager Romania
Russia Polendakov, Mihail General Manager Russia
Ukraine Thiede, Silvio General Manager Ukraine
North America
Morrish, Jon Chief Executive Officer USA
Dolan, Dennis Regional President North
N.N. Regional President South
Saragusa, Kari Regional President West
Ward, Chris Regional President Canada
Asia–Pacific
Australia Gluskie, Kevin Schacht, Phil
Chief Executive Officer Australia (until 31 March 2016) Chief Executive Officer Australia (from 1 April 2016)
Bangladesh/Brunei Ugarte, Marcelino General Manager Bangladesh & Brunei
China Jamar, Jean-Claude Chief Executive Officer China
India Cooper, Jamshed Chief Executive Officer India
Indonesia Kartawijaya, Christian Chief Executive Officer Indonesia
Malaysia Thornton, John General Manager Malaysia
Africa-Mediterranean Basin
Africa Junon, Jean-Marc Chief Operating Officer Africa
Israel Priel, Eliezer Country Manager Israel
Mediterranean Basin/HC Trading Adigüzel, Emir Chief Operating Officer Mediterranean Basin & Middle East and HC Trading
Spain Ortiz, Jesus Country Manager Spain
Turkey Hacikamiloglu, MehmetZenar, Umut
General Manager Akçansa (until 16 February 2016)General Manager Akçansa (from 17 February 2016)
285HeidelbergCement | Annual Report 2015
Global functions and Country Managers
Glossary
Imprint
Cement capacities and aggregates reserves
Con
solid
ated
fin
anci
al s
tate
men
tsA
ddit
iona
l inf
orm
atio
n
4
5

Glossary
AggregatesAggregates in the form of sand, gravel and crushed rock are used principally for concrete manufacturing or for road construction and maintenance.
Alternative fuels Combustible substances and materials used in place of fossil fuels in the clinker-burning process.
Alternative raw materialsBy-products or waste from other industries, whose chemical components make them suitable substitutes for natural raw materials. Alternative raw materials are used both in the production of clinker, the most important intermediate product in cement production, and as additives in cement grinding, in order to conserve natural raw material resources and reduce the proportion of energy-intensive clinker in cement, the end product. By using alternative fuels and raw materials, HeidelbergCement is actively contributing to the preservation of resources as well as to waste management and recycling.
AsphaltAsphalt is manufactured from a mixture of graded aggregates, sand, filler and bitumen. It is used primarily for road construction and maintenance.
BiodiversityBiodiversity or biological diversity is the genetic diversity within species, diversity between species and diversity of ecosystems.
Blast furnace slagFinely ground, glassy by-product from steel production. Additive for cement.
CementCement is a hydraulic binder, i.e. a finely ground inorganic material that sets and hardens by chemical inter-action with water and that is capable of doing so also under water. Cement is mainly used to produce concrete. It binds the sand and gravel into a solid mass.
Cement millCement grinding is the final stage of the cement manufacturing process. In cement mills, the clinker is ground into cement, with the addition of gypsum and anhydrite, as well as other additives, such as limestone, blast furnace slag or fly ash, depending on the type of cement.
Cement Sustainability InitiativeHeidelbergCement is a founding member of the Cement Sustainability Initiative (CSI), an association of 25 leading cement manufacturers worldwide to promote sustainable development under the auspices of the World Business Council for Sustainable Development (WBCSD).
Clinker (cement clinker)Intermediate product in the cement production process that is made by heating a finely-ground raw material mixture to around 1,450° C in the cement kiln. For the manufacture of cement, the greyish-black clinker nodules are extremely finely ground. Clinker is the main ingredient in most cement types.
286 HeidelbergCement | Annual Report 2015
Additional information5

Commercial PaperBearer notes issued by companies within the framework of a Commercial Paper Programme (CP Programme) to meet short-term financing needs.
Composite cementIn composite cements, a proportion of the clinker is replaced with alternative raw materials, usually by-products from other industries, such as blast furnace slag or fly ash. Decreasing the proportion of energy- intensive clinker in cement is of critical importance for reducing energy consumption and CO2 emissions as well as for preserving natural raw materials.
ConcreteBuilding material that is manufactured by mixing cement, aggregates (gravel, sand or crushed stone) and water.
Dynamic gearing ratioRatio of net debt to operating income before depreciation (OIBD).
EMTN programmeAn EMTN (Euro Medium Term Note) programme represents a framework agreement made between the company and the banks appointed to be dealers. HeidelbergCement has the option of issuing debenture bonds up to a total volume of €10 billion under its EMTN programme.
Fly ashSolid, particulate combustion residue from coal-fired power plants. Additive for cement.
Grinding plantA grinding plant is a cement production facility without clinker-burning process. Delivered clinker and selected additives, depending on the type of cement, are ground into cement. Grinding plants are particularly operated at locations where suitable raw material deposits for cement production are not available.
Net debtThe sum of all non-current and current financial liabilities minus cash and cash equivalents and short-term derivatives.
Rating (credit rating).Classification of the credit standing of debt instruments and their issuers. Specialised agencies such as Moody’s, Fitch Ratings and Standard & Poor’s produce such ratings. Ratings range from AAA or Aaa as the highest credit standing to C or D as the lowest.
Ready-mixed concreteConcrete that is manufactured in a ready-mixed concrete facility and transported to the building site using ready-mix trucks.
SustainabilitySustainable development signifies a development that fulfils the economic, ecological and social needs of people alive today without endangering the ability of future generations to fulfil their own needs.
Syndicated loanLarge-sized loan which is distributed (“syndicated”) among several lenders for the purpose of risk spreading.
287HeidelbergCement | Annual Report 2015
Global functions and Country Managers
Glossary
Imprint
Cement capacities and aggregates reserves
Con
solid
ated
fin
anci
al s
tate
men
tsA
ddit
iona
l inf
orm
atio
n
4
5

Imprint
Copyright © 2016HeidelbergCement AGBerliner Strasse 669120 Heidelberg, Germany
Concept and realisationGroup Communication & Investor Relations HeidelbergCementServiceDesign Werbeagentur GmbH, Heidelberg, GermanyTarget Languages GmbH, Dossenheim, Germanyabcdruck GmbH, Heidelberg, Germany
PhotographsMatthias Müller, Ilvesheim, Germany, pages 21, 25, and 34/35; andromeda108/Fotolia.com, pages 6/7; Taras Vyshnya/Fotolia.com, pages 8/9; gemphoto/shutterstock.com, pages 10/11; AsiaTravel/shutterstock.com, pages 12/13; iStock.com/fivepointsix, pages 14/15.
Translation of the Annual Report 2015. The German version is binding. Copies of the 2015 financial statements of HeidelbergCement AG and further information are available on request. Kindly find this Annual Report and further information about HeidelbergCement on the Internet: www.heidelbergcement.com.
Contact: Group CommunicationPhone: + 49 6221 481- 13227Fax: + 49 6221 481- 13217E-mail: [email protected] Investor RelationsPhone:Institutional investors USA and UK: + 49 6221 481-13925Institutional investors EU and rest of the world: +49 6221 481-39568Private investors: + 49 6221 481-13256Fax: + 49 6221 481-13217E-mail: [email protected]
The Annual Report 2015 was published on 17 March 2016.
Printed on environmentally friendly PEFC certified paper. Promotion of sustainable forest management – more information under www.pefc.org
288 HeidelbergCement | Annual Report 2015
Additional information5

HeidelbergCement in the world – cement capacities and aggregates reserves
Financial calendar 2016
Interim Financial Report January to March 2016 4 May 2016
Annual General Meeting 4 May 2016
Half-Year Financial Report January to June 2016 29 July 2016
Interim Financial Report January to September 2016 9 November 2016

HeidelbergCement in the world – cement capacities and aggregates reserves
Cement capacities 1) Million tonnes
Western and Northern Europe
Belgium 4.2
Estonia 1.3
Germany 11.0
Netherlands 4.4
Norway 1.7
Sweden 3.4
United Kingdom 6.3
32.3
Eastern Europe-Central Asia
Czech Republic 2.2
Georgia 2.0
Kazakhstan 2.5
Poland 6.0
Romania 6.2
Russia 5.1
Ukraine 4.4
28.4
North America
USA 10.3
Canada 2.6
12.9
Asia-Pacific
Bangladesh 2.4
Brunei 0.5
India 5.6
Indonesia 20.5
29.0
Africa-Mediterranean Basin
Benin 0.3
Burkina Faso 0.7
DR Congo 0.6
Ghana 4.4
Liberia 0.6
Sierra Leone 0.6
Tanzania 2.2
Togo 0.7
10.1
Total HeidelbergCement 112.7
Cement capacities of joint ventures 2)
Bosnia-Herzegovina 0.4
Hungary 1.7
USA (Texas) 0.6
China 7.4
Australia 2.7
Turkey 3.8
Total joint ventures 16.5
HeidelbergCement incl. joint ventures 129.2
1) Operational capacities based on 80% calendar time utilisation
2) Cement capacities according to our ownership
Aggregates reserves 3) Billion tonnes
Western and Northern Europe 3.1
Eastern Europe-Central Asia 0.8
North America 12.8
Asia-Pacific 1.3
Africa-Mediterranean Basin 0.3
HeidelbergCement total 18.3
3) Owned and leased reserves

HeidelbergCement is member of:

HeidelbergCement AGBerliner Strasse 6
69120 Heidelberg, Germanywww.heidelbergcement.com