annual report 2015 for personal use only - asx2016/04/01 · since joining santos two months ago i...
TRANSCRIPT

Annual Report 2015
For
per
sona
l use
onl
y

Santos Limited ABN 80 007 550 923
Organisation chart
BOARD COMMITTEES
Audit and Risk
Environment, Health, Safety and Sustainability
Nomination
People and Remuneration
CORPORATE CENTRE
Allocate capital and provide governance and policy
Human Resources, Health, Aboriginal Affairs
Finance, Strategy, Legal, Investor Relations, Treasury, Risk and Audit, Information
Technology and Procurement
Government and Public Affairs
Corporate Secretariat
BOARD OF DIRECTORS
MANAGING DIRECTOR AND CHIEF EXECUTIVE OFFICER
SANTOS LEADERSHIP TEAM
Comprises the Managing Director and his reports
Drive business strategy and operations
BUSINESS UNITS
Business execution and delivery
Asia Pacific
Eastern Australia
GLNG
Western Australia and Northern Territory
TECHNICAL DISCIPLINES
Provide excellence, service and assurance
Exploration and Subsurface
Drilling and Completions and Engineering
Safety and Environment
CONTENTS
1 Message from the Chairman 4 Introducing Kevin Gallagher, Santos Managing Director
and Chief Executive Officer 6 Board of Directors 8 Santos Leadership Team 10 Production and Sales 11 Reserves Statement 16 10-year Summary 18 Directors’ Report 34 Remuneration in brief 36 Remuneration Report 55 Financial Report 121 Independent Auditor’s Report 122 Auditor’s Independence Declaration 123 Information for Shareholders 124 Securities Exchange and Shareholder Information 126 Index 127 Glossary 128 Corporate Directory
This 2015 Annual Report is a summary of Santos’ operations, activities and financial position as at 31 December 2015.
All references to dollars, cents or $ in this document are to Australian currency, unless otherwise stated.
An electronic version of this report is available on Santos’ website, www.santos.com
Santos’ Corporate Governance Statement can be viewed at: www.santos.com/who-we-are/corporate-governance
For
per
sona
l use
onl
y

Santos Annual Report 2015 / 1
Dear Shareholder,
The sustained low oil price environment continues to impact oil and gas companies around the globe. Sharp cuts have been made to exploration and production programs, supply continues to outpace demand and the outlook for stronger global economic growth remains at risk.
Despite the challenging backdrop, our confidence in the long-term demand for energy remains strong. Natural gas, in particular, is well positioned to benefit from not only a rapidly growing and increasingly urbanised global population but also the move toward cleaner burning fuels.
Whilst we are confident in the long term demand for energy, the volatility exhibited by external markets is beyond our control. Our commitment, therefore, is to ensure the company is self-sustaining in a low oil price environment, now and into the future. We have already implemented significant initiatives to drive costs out, improve productivity and ultimately, produce more for less, but there is still much to be done. The Board, senior management and all employees are committed and engaged to improve efficiencies and restore shareholder value.
Despite the successful delivery of first LNG in September 2015 from our GLNG project, I accept, that when key LNG investment decisions were made, like most in the sector, we did not fully anticipate the timing, speed and depth of the down cycle for oil prices. Santos, however, is running a long-term business. Over the past five years, our multi-billion dollar investments in PNG LNG and GLNG were made with this in mind. While they have required us to increase our debt level in the short-term, they are by no means short-term projects. Any final judgement on the success of our LNG strategy should be measured through the oil price cycle and not based on the spot price today.
Looking to the future, one of our key advantages is that our LNG assets have low operating costs. They can operate effectively in a
low oil price environment and will materially benefit shareholders as and when market conditions improve. These strategic assets are underpinned by world class resources, high quality partners and binding long-term offtake agreements that will generate cash for decades to come.
The growing demand for energy coupled with the significant cuts to investment by oil and gas companies globally is expected to lead to a recalibration of oil prices to higher levels. Santos, with its key infrastructure position, abundant resources and LNG exposure, is well-placed to benefit.
STRENGTHENING THE BALANCE SHEET
In November 2014, the Organisation of Petroleum Exporting Countries (OPEC) announced its intention to maintain high levels of oil output to protect their market-share against the rise of non-OPEC production, particularly shale oil out of the USA.
Following this announcement, Santos reacted quickly and sought to reposition the company for a lower oil price environment.
In December 2014, we announced a 25% reduction to the 2015 capital expenditure budget and negotiated a $1 billion bilateral bank facility to further strengthen our balance sheet. In February 2015 a recruitment freeze was announced, approximately 500 positions were removed from the company, and a 10% reduction in unit production costs was targeted over the remainder of the year.
Despite these early initiatives, as the year progressed, it became increasingly evident that oil prices were to remain under significant pressure for longer than we, and the market, had anticipated. OPEC reaffirmed their commitment to maintain high crude output, US shale production proved to be unexpectedly resilient, and market sentiment continued to be negatively impacted by the expectation of higher oil exports from Iran and the risk of lower economic growth out of China.
Message from the Chairman
Peter Coates
For
per
sona
l use
onl
y

2 / Santos Annual Report 2015
Against this deteriorating external backdrop, on 9 November 2015, the company announced $3.5 billion of capital initiatives to strengthen the balance sheet and reduce net debt.
The first initiative was the sale of Santos’ 35% interest in the Kipper gas field, offshore Victoria, for $520 million. Further asset sales were considered at this time but the Board determined that it was not in the best interests of shareholders to sell tier one assets at prices that did not adequately reflect their long-term value.
The second initiative was the $500 million private placement to Hony Capital. This was done at a substantial premium to the then share price. This share placement to Hony at $6.80 per share reflected a clear vote of confidence in Santos’ long-term value proposition.
Finally, the decision to raise equity was not taken lightly but ultimately, given an external environment characterised by extreme uncertainty, it was determined that it was in the best interest of shareholders. With strong shareholder support, we raised $2.5 billion via a 1 for 1.7 accelerated pro-rata renounceable entitlement offer.
As a result of these initiatives, our balance sheet today is much stronger. We have retained our investment grade credit rating and have a very strong liquidity position with $4.8 billion in cash and undrawn debt facilities as at 31 December 2015. The initiatives undertaken in 2015 were firmly focused on strengthening the company’s balance sheet and we now have a capital buffer to reinforce the company through a lower oil price environment.
NEW DIVIDEND POLICY
A revised dividend framework was also announced at this time to better reflect the company’s exposure to oil-linked LNG pricing and the cyclical characteristics of global oil markets.
Dividends will now be set as a payout ratio of earnings. Subject to business conditions, this is expected to be a minimum of 40% of underlying net profit after tax. For the 2015 final dividend, a fully franked 5 cents per share dividend was declared.
MANAGEMENT RENEWAL
As a business, we have also started to change the way we do things. With our major LNG investment program behind us, we are now firmly focused on becoming a low cost producer. With this in mind, the Board was pleased to appoint Mr Kevin Gallagher as the new Managing Director and CEO.
Mr Gallagher was previously Chief Executive Officer of the engineering services group, Clough Limited and has 25 years’ experience managing oil and gas operations in Australia, the USA and North and West Africa. He is widely recognised for his achievements in driving strong financial performance and is ideally suited to lead the company as the focus moves from major strategic developments to delivering strong operational results in a low oil price environment. Indeed, he has a clear mandate from the Board to continue to lower the cost base of the company’s operations and ensure Santos is sustainable and self-funding at low oil prices.
Mr Gallagher started at Santos on 1 February 2016.
With our major LNG investment program behind us, we are now firmly focused on becoming a low cost producer.
For
per
sona
l use
onl
y

Santos Annual Report 2015 / 3
CONFIDENCE FOR THE FUTURE
Finally, in what has been an extremely challenging year, I would like to thank you, our shareholders, for your continued support. The company has gone through a significant investment phase and the focus now is to consolidate the business and drive efficiencies to ensure Santos is self-sustaining in a lower oil price environment. We have made material and sustainable cost reductions but there is a lot more to be done.
In 2016, we are scaling back our short-term investment plans on a number of projects as we work through funding priorities in response to the lower oil price. Our growth options are incremental, low risk and will be prioritised to ensure the best return for shareholders. We will continue to refine our strategy and update the market in due course.
We can be confident in the strong and growing demand for energy and our portfolio of high-quality assets is well placed to benefit.
We are determined to restore and maximise shareholder value.
PETER COATESChairman
We can be confident in the strong and growing demand for energy and our portfolio of high quality assets is well placed to benefit.
For
per
sona
l use
onl
y

4 / Santos Annual Report 2015
Introducing
Kevin Gallagher, Managing Director and Chief Executive Officer
Dear Shareholder,
Since joining Santos two months ago I have focused my efforts on getting up to speed to understand the issues and the opportunities across our portfolio of assets. I am working hard to develop a clear strategy for the future and am determined to build an organisation with a reputation for delivering what we promise.
There is no question that lower oil prices present significant challenges to the oil and gas industry, to Santos and to you, our shareholders. The dynamics of supply and demand have brought into stark reality the need to ensure that our assets are operated in a disciplined and efficient manner.
If we look at the 2015 production and safety results, operationally we have a lot to work with. What cannot be ignored, however, is the steep decline in the oil price and the impact this is having on our business. It is clear that we must do better.
Production of 57.7 million barrels of oil equivalent in 2015 was the company’s highest in seven years, underpinned by a full-year of production from PNG LNG, the start-up of GLNG in the third quarter and record annual production from Darwin LNG.
The first cargo departed GLNG in October and marked a significant milestone in a project that is set to run for decades to come. Train 1 production has regularly exceeded 10% above nameplate capacity and as at the end of February 2016 the project had produced approximately 1.2 million tonnes of LNG and shipped 18 cargoes.
The PNG LNG project shipped 101 cargoes in 2015 as strong upstream deliverability and reliable plant performance resulted in the plant operating 7% above its nameplate capacity at an annualised rate of 7.4 million tonnes per annum.
We recorded some exploration success in 2015, announcing a significant oil discovery in March 2015 from the Bestari-1 exploration well located offshore Malaysia. Further, in the Cooper Basin, the first stand-alone Permian Source Rock play producer, the Tirrawarra South-1 well, was successfully brought online in May and is flowing liquids-rich gas in line with forecasts.
Kevin joined Santos as Managing Director and Chief Executive Officer on 1 February 2016.
Kevin is a senior executive with more than 25 years’ experience in managing oil and gas operations in Australia, the USA and North and West Africa.
A qualified mechanical engineer, Kevin commenced his career as a drilling engineer with Mobil North Sea Ltd, before joining Woodside Petroleum Ltd in 1998. During a 13 year tenure with Woodside, he led the drilling organisation through rapid growth, delivering several Australian and international development projects and exploration campaigns. In his last role he was accountable for profit and loss on Australia’s largest resource project, the North West Shelf, where he held the positions of Executive Vice President, North West Shelf Business Unit and CEO of the North West Shelf Venture.
Appointed Managing Director and CEO of Clough Ltd in 2011, Kevin implemented strategies that transformed the business. He established a strong leadership team, improved cost and operational performance and delivered record financial results. He oversaw the development of innovative programs to improve safety and drive productivity and executed an M&A and international expansion strategy which saw Clough enter five new regions including the US, UK, Canada, Africa and Asia.
In 2013 Kevin was recognised by Australia’s CEO Magazine as the CEO of the Year, and the Energy and Resources Executive of the Year.
For
per
sona
l use
onl
y
Santos Annual Report 2015 / 5
Despite this operational performance, a net loss of $2.7 billion was reported, reflecting after tax impairments of $2.8 billion. The impairment charges are primarily a result of the current lower oil price environment. The impairment charge is an accounting adjustment that relates to the historical book value of the company’s assets.
The impairment charge was attributed predominantly to the company’s Cooper Basin, GLNG and Gunnedah Basin assets. Although the lower oil price has resulted in a reduction of capital expenditure and the deferral of field development plans, we remain committed to meeting our contractual obligations from the Cooper Basin and the GLNG project, and will continue to progress the evaluation and approvals processes for the Narrabri Gas opportunity.
EBITDAX1 of $1.9 billion was down 17% on the previous year despite the oil price declining by almost 50%. Underlying net profit after tax was $50 million, 91% lower than the prior year, a result again impacted by the weak oil price. Operating cash flow was strong at $1.1 billion, due in part to the defensive nature of our domestic gas assets.
Over the course of 2015 we reduced capex by 54%, cut 825 employee positions across the company and secured $230 million in savings across the supply chain. Unit production costs were down 10% to $14.40 per barrel of oil equivalent. We remain committed to further driving costs out of the business and working closely with our joint venture partners to improve efficiencies.
These savings can only be achieved through the hard work of all of our teams, and are reflective of a new mind-set where producing more for less is expected. We have made a significant start, but we are certainly not done and we must continue to improve our performance.
It is vital that we continue to take costs out of our business. My first priority and absolute focus is to look closely at our operations. I am scrutinising our portfolio of assets and the structure and processes that we have in place to manage them.
I am working hard to develop the right management team, the right strategy and the right culture to make Santos self-sustaining in a low oil price environment and well positioned to take full advantage of rising commodity prices in the future.
We must continue to adapt to changing market conditions. Change is required if we are to stay competitive and I will be working quickly to identify further actions that are essential to effectively manage the business.
In a period of significant operational and cultural change, it was pleasing to see in 2015 the company record its best safety performance on record with a Lost Time Injury Frequency Rate (LTIFR) of 0.1 per million hours worked. We must, however, remain vigilant across all of our operations to ensure everyone goes home without injury. In addition, we were recognised for our sustainable operations and placed in the top 10% of the leading 2,500 companies globally by the Dow Jones Sustainability Index. Companies are selected for inclusion in the index based on a comprehensive assessment of long-term economic, environmental and social criteria. For further information I would encourage you to read our 2015 Sustainability Report, available on our website at www.santos.com/sustainability
I look forward to the challenges ahead and will update you on the progress we make in due course.
This is a great company with a great history. It’s an incredible honour for me to lead and serve this company and I have high expectations that Santos will emerge from this period a stronger and more sustainable business.
KEVIN GALLAGHERManaging Director and Chief Executive Officer
1 Earnings before interest, tax, depreciation, depletion, amortisation and exploration.
I am working hard to develop a clear strategy for the future and am determined to build an organisation with a reputation for delivering what we promise.
For
per
sona
l use
onl
y

6 / Santos Annual Report 2015
PETER COATES AO
Chairman
BSc (Mining Engineering), FAICD, FAusIMM
Independent non-executive Director. Member of the Board since March 2008, Chairman from December 2009 to May 2013, reappointed Chairman April 2015 and appointed Executive Chairman from August 2015 to January 2016. A Director of Santos Finance Ltd and Chair of the Nomination Committee.
Non-executive Director of Glencore plc since its float in April 2011 until its merger with Xstrata plc in May 2013. Joined the Board of the merged company in June 2013 and worked as an Executive Director assisting with the integration of Glencore and Xstrata before resuming the position as a non-executive Director from 1 January 2014. Non-executive Chairman of Glencore majority owned Sphere Minerals Ltd since May 2013.
Non-executive Director of Event Hospitality & Entertainment Limited (formerly Amalgamated Holdings Limited) since July 2009.
Former non-executive Chairman of Xstrata Australia Pty Limited from January 2008 to August 2009 and former Chairman and non-executive Director of Minara Resources Limited from April 2008 to April 2011. Previously Chief Executive of Xstrata Coal, Xstrata plc’s global coal business. Past Chairman of the Minerals Council of Australia, the NSW Minerals Council and the Australian Coal Association.
Made an Officer of the Order of Australia in June 2009 and was awarded the 2010 Australasian Institute of Mining and Metallurgy Medal.
KEVIN GALLAGHER
Managing Director and Chief Executive Officer
BEng (Mechanical) Hons, FIEAust
Kevin joined Santos as Managing Director and Chief Executive Officer on 1 February 2016.
Prior to this Kevin was CEO and Managing Director at Clough Limited. Kevin is a Senior Executive with more than 25 years’ experience in managing oil and gas operations in Australia, the USA and North and West Africa.
A qualified mechanical engineer, Kevin commenced his career as a drilling engineer with Mobil North Sea Ltd, before joining Woodside in 1998. During his 13-year tenure with Woodside, Kevin led the drilling organisation through rapid growth, delivering several Australian and international development projects and exploration campaigns. He also led the Australian Oil Business Unit consisting of five floating production storage offload (FPSO) operations and east coast domestic gas plants.
Kevin was also responsible for production on Australia’s largest resource project, the North West Shelf, where he held the positions of Executive Vice President, North West Shelf Business Unit and CEO, North West Shelf Venture at Woodside.
At Clough, Kevin implemented strategies that transformed the business. He established a strong leadership team, improved cost and operational performance and delivered record financial results. He oversaw the development of innovative programs to improve safety and drive productivity and executed an M&A and international expansion strategy which saw Clough enter five new regions including the US, UK, Canada, Africa and Asia.
YASMIN ALLEN
BCom FAICD
Independent non-executive Director since 22 October 2014. A member of the Environment, Health, Safety and Sustainability and Audit and Risk Committees of the Board.
Ms Allen has more than 20 years’ experience in finance and investment banking, including senior roles at Deutsche Bank AG, ANZ and HSBC Group Plc.
She is a Director of Cochlear Limited, chairs its Audit Committee and is a member of the Nomination and Remuneration Committee.
She is a member of the George Institute for Global Health Board and a Director of the National Portrait Gallery. In February 2015 Ms Allen was appointed non-executive Director of the Board of ASX Limited.
Ms Allen was a former non-executive Director of Insurance Australia Group Limited, until 30 September 2015 and a former national Director and acting Chair of the Australian Institute of Company Directors.
KENNETH DEAN
BCom (Hons), FCPA, FAICD
Independent non-executive Director since 23 February 2005. Member of the Audit and Risk and Nomination Committees of the Board. Director of Santos Finance Limited since 30 September 2005.
Non-executive Director of Bluescope Steel Limited since April 2009 and Chairman of Bluescope’s Audit and Risk Committee. Independent non-executive Director of EnergyAustralia Holdings Limited since June 2012.
Appointed to the Australian Securities & Investment Commission’s Director Advisory Panel, effective 1 October 2015.
Previously Chief Financial Officer of Alumina Limited, October 2005 to February 2009, alternate Director of Alumina Limited, and non-executive Director of Alcoa of Australia Ltd, Alcoa World Alumina LLC and related companies. Director of Shell Australia Ltd from 1997 to 2001 and Woodside Petroleum Ltd from 1998 to 2004.
Over 40 years’ experience in the oil and gas industry. Fellow of the Australian Society of Certified Practising Accountants and Fellow of the Australian Institute of Company Directors. Former Chief Executive Officer of Shell Financial Services and member of the La Trobe University Council. In 2015 Mr Dean was appointed to the Board of Mission Australia.
ROY FRANKLIN OBE
BSc (Hons)
Independent non-executive Director since 28 September 2006. Chair of the Environment, Health, Safety and Sustainability Committee, member of the People and Remuneration Committee of the Board and member of the Nomination Committee effective 25 June 2015.
Non-executive Director of Keller Group plc since July 2007 and Chairman since August 2009 and Chairman of Cuadrilla Resources Holdings Limited since April 2015. Appointed deputy Chairman of Statoil with effect from 1 July 2015, and as a Director of Amec Foster Wheeler plc with effect from 1 January 2016.
Chief Executive Officer of Paladin Resources plc from 1997 to 2005 and former Group Managing Director of Clyde Petroleum plc. Chairman of BRINDEX, the trade association for UK independent oil and gas companies from 2002 to 2005 and a former member of PILOT, the joint industry/UK Government task force set up to maximise hydrocarbon recovery from the UK North Sea 2002 to 2005.
In 2004, awarded the OBE for services to the UK oil and gas industry.
Board of DirectorsF
or p
erso
nal u
se o
nly

Santos Annual Report 2015 / 7
HOCK GOH
BEng (Hons) Mech Eng
Independent non-executive Director since 22 October 2012. Member of the Environment, Health, Safety and Sustainability Committee and the Audit and Risk Committee of the Board.
More than 30 years’ experience in the global oil and gas industry, having spent 25 years with Schlumberger Limited, including as President of Network and Infrastructure Solutions division in London, President of Asia, and Vice President and General Manager of China. Previously held managerial and staff positions in Asia, the Middle East and Europe.
Chairman of MEC Resources Ltd since October 2006. Appointed as non-executive Director of Stora Enso Oyj (Finland) in April 2012. Also a non-executive Director of AB SKF (Sweden) since March 2014 and Vesuvius PLC (UK) since April 2015.
Previously a non-executive Director of BPH Energy Ltd from 2007 to March 2015, an Operating Partner of Baird Capital Partners Asia, based in China, from 2007 to June 2012, and non-executive Director of Xaloy Holding Inc in the US from 2006 to 2008.
JANE HEMSTRITCH
BSc (Hons), FCA, FAICD
Independent non-executive Director since 16 February 2010. Member of the People and Remuneration Committee and Chair of the Audit and Risk Committee.
Broad experience in the oil and gas, telecommunications, government, financial services and manufacturing sectors. Former Director of Commonwealth Bank of Australia and spent 25 years of her career with Accenture and Andersen Consulting. Formerly Accenture’s Managing Director Resources Operating Group Asia Pacific, and before that, Country Managing Director Australia.
Non-executive Director of Lend Lease Group since September 2011 and Tabcorp Holdings Ltd since November 2008. Chairman of Victorian Opera since February 2013, having formerly been non-executive Director since 2010. Director of the Walter and Eliza Hall Institute of Medical Research since November 2013. In July 2015 Ms Hemstritch was appointed as a non-executive member to the Herbert Smith Freehills Global Council.
A member of the Council of the National Library of Australia. A Fellow of the Institutes of Chartered Accountants in Australia and in England and Wales, a Fellow of the Australian Institute of Company Directors and a member of Chief Executive Women Inc.
GREGORY MARTIN
BEc, LLB, FAIM, MAICD
Independent non-executive Director since 29 October 2009. Chair of the People and Remuneration Committee and a member of the Audit and Risk Committee of the Board.
Chairman of Iluka Resources Limited from 18 December 2013. Chairman and Joint Managing Partner of Prostar Capital since July 2012 and independent non-executive Chairman of Sydney Desalination Plant Pty Ltd from December 2012. On 1 February 2015 Mr Martin was appointed to the CoAG Energy Council Energy Selection Panel. The role of the Panel is to provide recommendations to CoAG’s Energy Council on appointments to the Australian Energy Market Operator, Australian Energy Market Commission, Australian Energy Regulator and Energy Consumers Australia. In April 2015 Mr Martin was appointed to the Board of Electricity Networks Corporation, trading as Western Power, as Deputy Chairman.
Previous non-executive Director of Australian Energy Market Operator Limited (July 2008–November 2014) and Energy Developments Limited (May 2006–October 2015), Deputy Chairman of the Australian Gas Association and inaugural Chairman of the Energy Supply Association of Australia. Past member of the Business Council of Australia, Committee for the Economic Development of Australia, and the Council on Australia Latin America Relations. Formerly Managing Director and Chief Executive Officer of AGL, Chief Executive Infrastructure at Challenger Financial Services Group and Managing Director of Murchison Metals Limited.
SCOTT SHEFFIELD
BS Petroleum Engineering
Mr Sheffield is an independent non-executive Director, effective 24 February 2014. He is Chairman and Chief Executive Officer of Pioneer Natural Resources Company, which is listed on the New York Stock Exchange and included in the S&P 500 Index. He has been Chief Executive Officer since 1997 and Chairman since 1999.
Serves on various industry and education-related boards, including the National Petroleum Council and the Maguire Energy Institute of the SMU Cox School of Business.
Recipient of the Permian Basin Association’s Top Hand award, which recognises individuals who have demonstrated exceptional leadership within the oil and gas industry and the Permian Basin community. He is also a 2013 inductee into the Permian Basin Petroleum Museum Hall of Fame.
COMMITTEES OF THE BOARD
Audit and Risk Committee
Ms J Hemstritch (Chair) Mr K Dean Mr G Martin Mr H Goh Ms Y Allen
Nomination Committee
Mr P Coates (Chair) Mr K Dean Mr R Franklin
People and Remuneration Committee
Mr G Martin (Chair) Ms J Hemstritch Mr R Franklin
Environment, Health, Safety and Sustainability Committee
Mr R Franklin (Chair) Mr H Goh Ms Y Allen Mr K Gallagher
For
per
sona
l use
onl
y

8 / Santos Annual Report 2015
1/KEVIN GALLAGHERManaging Director and Chief Executive Officer
For bio see page 6.
2/ANDREW SEATONChief Financial OfficerBEng Hons (Chem), GradDip BusAdmin
Andrew Seaton was appointed Chief Financial Officer in 2010, and is responsible for Santos’ corporate finance, accounting, taxation, treasury, investor relations, risk, audit, insurance, information systems and procurement functions.
Andrew has over 25 years of oil and gas industry experience, encompassing finance, banking, commercial and engineering roles. Prior to joining Santos in 2005, Andrew held senior positions in investment banking where he worked on a broad range of mergers and acquisitions, equity and debt transactions. His early career included 10 years of operations, engineering design and project management experience.
3/JOHN ANDERSON Vice President Asia & Western Australia and Northern TerritoryLLB, BEc, GDCL
John Anderson is the Vice President responsible for Santos’ business in Asia, Western Australia and the Northern Territory.
John joined Santos in 1996 as a Corporate Counsel in Brisbane having previously worked for 10 years as a solicitor with a large corporate law firm in Brisbane and Melbourne.
John has held a number of senior roles in Santos including Vice President Commercial, Vice President Strategic Projects and Group Executive Business Development.
In 2009, John relocated to Perth to run Santos’ WA & NT operations including domestic gas and oil production in the Carnarvon Basin, exploration activity in the Browse and Bonaparte basins and the company’s first LNG project, Darwin LNG.
In 2014, John moved to Singapore after his responsibilities were extended to include Santos’ Asian activities including the company’s second LNG project, PNG LNG, as well as oil and gas production assets in Indonesia and Vietnam, and a variety of other interests including exploration opportunities in Malaysia and Bangladesh.
4/JOE ARIYARATNAMGeneral Manager Western Australia & Northern TerritoryBE (Hons), BSc
Joe Ariyaratnam is responsible for Santos’ activities in Western Australia and its offshore interests in Northern Territory and South Australia, including exploration, development, production, commercial and finance, business development, and operated assets.
Joe joined Santos in April 2012 and managed Santos’ assets across Northern Australia, and later also took the added responsibility of managing technical activity for the company’s Perth-based WA and NT business unit in 2013.
Joe has a subsurface and developments background, and has 18 years’ industry experience including senior management and technical roles. Prior to joining Santos, Joe most recently worked with BP in Australia and overseas, in roles spanning subsurface and concept development activity.
5/JAMES BAULDERSTONEVice President Corporate DevelopmentLLB (Hons), BSc (Hons)
James Baulderstone is responsible for corporate development, commercial and marketing, public affairs and sustainability, and the company’s New South Wales assets.
James joined Santos in 2007 as General Counsel and Company Secretary after previously holding similar roles at Mayne Group and BlueScope Steel. James has 25 years of extensive legal, commercial and business development experience and was responsible for Santos’ East Coast operations for the previous 5 years.
6/TREVOR BROWNVice President QueenslandBSc (Hons)
Trevor Brown has responsibility for leading all aspects of the development and operation of the gas fields and gas supply infrastructure of the GLNG project. Trevor has extensive international experience in exploration, new ventures, onshore and offshore developments and leadership of major projects. A geologist by background Trevor has over 30 years’ experience in the international oil and gas industry including 11 years in Indonesia managing onshore and offshore exploration and development projects. Trevor has held Australian and international roles with Woodside, VICO and Unocal prior to joining Santos in 2001.
Santos Leadership Team
1/ 8/
2/ 9/
3/
4/
10/
11/
13/
5/ 12/
6/
14/7/
For
per
sona
l use
onl
y

Santos Annual Report 2015 / 9
7/ROD DUKEVice President Downstream GLNGBEng (Hons) Chemical, GradDip Management
Rod Duke is responsible for leading the downstream activities of the Santos GLNG project, including the successful delivery of the GLNG gas transmission pipeline and the LNG plant and port projects, ongoing plant operations, commercial, LNG marketing and production planning for GLNG.
Rod has extensive global experience in the LNG industry including with Woodside and Singapore LNG. He has over 30 years of experience in project management, engineering, construction, commissioning, operations, commercial, marketing and business development areas of the upstream natural gas and LNG industry.
8/RICHARD ELLIOTTHead of Projects and Chief EngineerBSc (Mechanical Engineering)
Richard Elliott is responsible for all drilling and completions activities and the projects, surface engineering, production engineering, safety and environment corporate functions.
Richard joined Santos in 2013 from Hess, where he was project manager for Equus in Western Australia. Richard has more than 35 years’ experience in the oil and gas industry including major oil, gas, LNG and pipeline projects in the United States, Indonesia, Trinidad and Tobago, and the United Kingdom. He has worked with Exxon, ARCO, BP and Hess prior to joining Santos.
9/JOANNE FOXChief Human Resources OfficerBMgt, GradCert Energy & Resources, MBA
Joanne Fox is responsible for Santos’ human resources function which supports the company in matters relating to people and organisational effectiveness.
She has over 25 years’ experience working in the area of human resources for ASX listed companies in the health, pharmaceuticals, FMCG, and oil and gas sectors.
Since joining Santos in 2003, Joanne has been involved in all facets of Santos’ business and has been responsible for a broad range of roles and projects.
10/DAVID LIMCompany SecretaryBEc, LLB, Ch.Sec
David Lim is accountable to the Board for the effectiveness of corporate governance processes, ensuring adherence to the Board’s principles and procedures and coordinating all Board business, and provides the Santos Board with independent advice and support in relation to these matters.
David has over 20 years of experience in commercial and corporate legal practice. He is an accredited Chartered Secretary.
11/ANDREW NAIRNGroup Executive Investor RelationsB.Comm
Andrew Nairn is responsible for Santos’ investor relations.
He has over 20 years’ resources industry experience, encompassing finance, commercial and investor relations roles. Andrew joined Santos in 2008 from BHP Billiton.
Andrew is a member of the Board of the Australasian Investor Relations Association.
12/BILL OVENDENGeneral Manager Exploration & SubsurfaceBSc (Hons) (Geology and Geophysics)
Bill Ovenden is responsible for exploration budget and strategy, and ensuring excellence in subsurface activities across Santos’ upstream programs.
Bill is a geologist with over 30 years of experience in the oil and gas industry. He has worked on exploration projects in Australia, Central and South-East Asia, North Africa, the Middle East and South America, with companies including Sun Oil, Kufpec, ExxonMobil and Ampolex.
He joined Santos in 2002 after working for ExxonMobil in Indonesia.
13/CHRISTIAN PAECHGeneral CounselLLB (Hons) BCom
Christian Paech advises the Santos Board and management on legal matters affecting the company and its operations. He is responsible for Santos’ legal function, which supports the corporate team and the business units in joint venture agreements, project development, dispute resolution, statutory compliance, mergers and acquisitions, gas sales and production sharing contracts.
Christian has over 20 years of legal experience and joined Santos in 2004 after working in national and international firms in Australia and overseas where he focused on large-scale corporate transactions and corporate governance.
14/BRETT WOODSVice President Eastern AustraliaBSc (Hons) Geology and Geophysics
Brett Woods is responsible for production, development and commercialisation of the company’s oil and gas resources in Central Australia.
Brett joined Santos in February 2013 as the Manager Exploration for the company’s Perth-based WA and NT business unit. Brett is a geologist and geophysicist, and has over 20 years of oil and gas industry experience including senior management, technical and business development roles with Woodside, Japan Australia LNG (MIMI) and UK-listed Sterling Resources.
He was also managing director of dual-listed E&P company, Rialto Energy, which had interests throughout Africa and Australia.
Brett has worked around the world in many challenging environments and led multidisciplinary teams. He is currently a Board member of APPEA.
For
per
sona
l use
onl
y

10 / Santos Annual Report 2015
Production and Sales
2015 2014
Field units mmboe
Field units mmboe
Sales gas and ethane (PJ)
Cooper 63.0 10.8 63.3 10.9
Carnarvon 51.6 8.9 54.2 9.3
Indonesia 23.8 4.1 25.1 4.3
Denison/Scotia/ Spring Gully/Combabula 14.3 2.5 12.4 2.1
Otway 13.0 2.2 16.0 2.8
GLNG domestic 4.7 0.8 7.9 1.4
Vietnam 4.0 0.7 3.2 0.5
Other1 1.6 0.2 0.4 0.1
Total production 176.0 30.2 182.5 31.4
Total sales volume 184 31.6 207.0 35.6
Total sales revenue ($million) 993 1,028
Sales gas to LNG (PJ)
PNG LNG 59.5 10.2 34.0 5.9
Darwin LNG 19.5 3.4 16.5 2.8
GLNG 5.7 1.0 - -
Total production 84.7 14.6 50.5 8.7
Total sales volume (’000 t) 1,484.3 14.2 766.5 7.3
Total sales revenue ($million) 925 659
Condensate (’000 bbls)
PNG LNG 1,441.9 1.4 915.6 0.9
Cooper 943.9 0.9 1,036.9 1.0
Bayu-Undan 682.1 0.6 695.4 0.6
Carnarvon 511.8 0.5 533.4 0.5
Other2 54.6 - 60.7 -
Total production 3,634.3 3.4 3,242.0 3.0
Total sales volume 3,574.3 3.3 3,127.4 2.9
Total sales revenue ($million) 243 317
2015 2014
Field units mmboe
Field units mmboe
LPG (’000 t)
Cooper 114.2 1.0 128.4 1.1
Bayu-Undan 37.5 0.3 39.0 0.3
Total production 151.7 1.3 167.4 1.4
Total sales volume 168.2 1.4 172.6 1.5
Total sales revenue ($million) 103 155
Crude oil (’000 bbls)
Cooper 2,840.4 2.8 3,230.6 3.2
Vietnam 2,610.4 2.6 2,822.0 2.8
Mutineer-Exeter/ Fletcher Finucane 972.0 1.0 1,443.6 1.5
Stag 817.1 0.8 1,085.5 1.1
Barrow 483.8 0.5 526.7 0.5
Indonesia 162.3 0.2 168.2 0.2
Other3 259.7 0.3 318.1 0.3
Total production 8,145.7 8.2 9,594.7 9.6
Total sales volume 13,746.6 13.8 16,446.1 16.4
Total sales revenue ($million) 982 1,878
TOTAL
Production (mmboe) 57.7 54.1
Sales volume (mmboe) 64.3 63.7
Sales revenue ($million) 3,246 4,037
1 Amadeus and Gunnedah
2 Amadeus, Otway, Indonesia and Queensland
3 Amadeus, Queensland and PNG
For
per
sona
l use
onl
y

Santos Annual Report 2015 / 11
RESERVES SUMMARY
• Proved (1P) reserves at year end were 485 mmboe, 22% lower than 2014.
• Proved plus probable (2P) reserves were 945 mmboe, 24% lower than 2014.
• The impact of the lower oil price environment combined with asset divestments and 2015 production of 58 mmboe were the key factors in the reduction in booked reserves in 2015.
• Gunnedah Basin reserves reclassified to contingent resources.
• Developed 2P reserves represent 51% of total 2P reserves, up from 43% in 2014.
• 2P Reserves life of 16 years, based on 2015 production of 58 mmboe.
Santos proved plus probable (2P) petroleum reserves were 945 million barrels of oil equivalent (mmboe) as at the end of 2015, 24% lower than 2014.
The key movements in 2P reserves before production in 2015 were:
• 133 mmboe reduction due to the reclassification of Gunnedah Basin reserves to contingent resources.
• 66 mmboe reduction due to the sale of interests in the Kipper, Mereenie and Stag assets.
• 38 mmboe reduction in Cooper Basin reserves due mainly to lower oil price assumptions and work program results.
RESERVES AND 2C CONTINGENT RESOURCES (SANTOS SHARE)
Santos share 2015 2014 %change
Proved reserves mmboe 485 622 (22)
Proved plus probable reserves mmboe 945 1,245 (24)
Contingent resources mmboe 1,853 1,721 8
Reserves Statement for the year ended 31 December 2015
Proved plus probable reserves by product%
Crude oil 4%
NGLs 6%
Natural gas 90%
Proved plus probable reserves by area%
Eastern Australia 58%
WA&NT 17%
Asia Paci�c 25%
For
per
sona
l use
onl
y

12 / Santos Annual Report 2015
COOPER BASIN
Cooper Basin proved plus probable reserves by product (Santos share)
Santos share 2015 2014 %change
Sales gas PJ 726 972 (25)
Crude oil mmbbl 20 26 (22)
Condensate mmbbl 11 15 (23)
LPG 000 tonnes 1,457 1,791 (19)
Total mmboe 168 222 (24)
Sales gas proved plus probable reserves decreased by 19% before 2015 production, primarily due to the adoption of lower oil and gas price assumptions and the consequent removal or reclassification of sub-economic projects. Revisions were also made based on work program results and project updates, primarily in the Baryulah, Coonatie, Tirrawarra-Gooranie, Big Lake and Moomba fields.
GLNG
GLNG Reserves and 2C contingent resources (GLNG share)
GLNG share 2015 2014 %change
Proved reserves PJ 2,540 2,245 13
Proved plus probable reserves PJ 5,546 5,603 (1)
Contingent resources PJ 1,328 1,202 10
GLNG proved reserves increased 15% before 2015 production, while proved plus probable reserves were broadly in-line with the prior year.
In addition to the reserves in the table above, GLNG has executed Santos portfolio and third party gas supply agreements for an aggregate of between approximately 2,100 PJ and 2,500 PJ over periods of up to 20 years.
GUNNEDAH BASIN
Santos’ focus in the current lower oil price environment is to improve the operating efficiency of its producing assets and reduce capital expenditure. While the company is progressing the evaluation and approvals processes for the proposed Narrabri Gas Project, reserves in the Gunnedah Basin have been reclassified as contingent resources.
2C CONTINGENT RESOURCES
Contingent resources increased by 8% or 132 mmboe to approximately 1.8 billion barrels of oil equivalent.
Key movements in contingent resources included:
• 46 mmboe addition following the integration of successful appraisal drilling results in the Barossa field.
• 29 mmboe addition from exploration discoveries, including the Bestari oil discovery offshore Malaysia.
• 50 mmboe reduction from asset divestments, including Meerenie, Sole and Stag.
• 83 mmboe net overall increase due to a categorisation review and the reclassification of Gunnedah Basin reserves to contingent resources.
OIL PRICE ASSUMPTIONS
In undertaking its 2015 reserves process, Santos has taken into account its oil price forecasts used for impairment analysis in its 2015 full-year accounts.
Reserves Statementcontinued
For
per
sona
l use
onl
y

Santos Annual Report 2015 / 13
PROVED RESERVES
Year-end 2015 (Santos share)
All products mmboe
Basin/AreaSales gas
PJCrude oil
mmbblCondensate
mmbblLPG
000 tonnes Developed Undeveloped Total
Eastern Australia
Surat/Bowen 903 0 0 - 78 77 155
Cooper/Eromanga 336 9 5 628 45 31 76
Gippsland/Otway 49 - 0 - 2 7 8
Gunnedah 0 - - - 0 - 0
Total EA 1,288 9 5 628 125 115 240
Western Australia & Northern Territory
Carnarvon 360 3 4 - 47 21 69
Bonaparte 72 - 2 96 14 1 15
Amadeus 17 2 0 149 3 3 6
Total WA&NT 450 5 6 245 65 25 90
Asia Pacific
Papua New Guinea 752 0 12 - 90 51 141
Vietnam 8 7 - - 8 - 8
Indonesia 36 0 0 - 6 - 6
Total Asia Pacific 796 7 12 - 105 51 155
Total 1P 2,534 21 23 873 295 191 485
Proportion of total proved reserves that are unconventional 32%
Proved reserves reconciliation
Product
Reserves Year-end
2014 ProductionRevisions and
extensions Discoveries
Net acquisitions
and divestments
Reserves Year-end
2015
Sales gas PJ 3,204 (261) (226) - (184) 2,534
Crude oil mmbbl 28 (8) 3 - (3) 21
Condensate mmbbl 32 (4) (2) - (4) 23
LPG 000 tonnes 1,520 (152) (36) - (459) 873
Total 1P mmboe 622 (58) (37) - (42) 485
For
per
sona
l use
onl
y

14 / Santos Annual Report 2015
PROVED PLUS PROBABLE RESERVES
Year-end 2015 (Santos share)
All products mmboe
Basin/AreaSales gas
PJCrude oil
mmbblCondensate
mmbblLPG 000
tonnes Developed Undeveloped Total
Eastern Australia
Surat/Bowen 2,136 0 0 - 89 279 367
Cooper/Eromanga 726 20 11 1,457 106 61 168
Gippsland/Otway 74 - 0 - 4 9 13
Gunnedah 0 - - - 0 - 0
Total EA 2,935 20 11 1,457 199 349 548
Western Australia & Northern Territory
Carnarvon 606 9 7 - 78 41 119
Bonaparte 93 - 3 178 17 3 20
Amadeus 61 4 1 299 12 6 18
Total WA&NT 760 12 11 476 107 50 157
Asia Pacific
Papua New Guinea 1,173 0 20 - 153 68 220
Vietnam 11 9 - - 11 - 11
Indonesia 52 0 0 - 9 - 9
Total Asia Pacific 1,236 9 20 - 172 68 240
Total 2P 4,931 42 42 1,933 478 466 945
Proportion of total proved plus probable reserves that are unconventional 39%
Proved plus probable reserves reconciliation
Product
Reserves Year-end
2014 ProductionRevisions and
extensions Discoveries
Net acquisitions
and divestments
Reserves Year-end
2015
Sales gas PJ 6,450 (261) (1,028) - (231) 4,931
Crude oil mmbbl 61 (8) (3) - (8) 42
Condensate mmbbl 53 (4) (2) - (6) 42
LPG 000 tonnes 3,002 (152) (221) - (697) 1,933
Total 2P mmboe 1,245 (58) (184) - (59) 945
Reserves Statementcontinued
For
per
sona
l use
onl
y

Santos Annual Report 2015 / 15
2C CONTINGENT RESOURCES
Year-end 2015 (Santos share)
Basin/AreaSales gas
PJCrude oil
mmbblCondensate
mmbblLPG 000
tonnesAll products
mmboe
Eastern Australia 5,715 35 25 3,370 1,070
Western Australia & Northern Territory 3,559 20 42 56 672
Asia Pacific 273 62 2 - 111
Total 2C 9,547 118 69 3,426 1,853
2C Contingent resources reconciliation
Product
Contingent resources Year-end
2014 ProductionRevisions and
extensions Discoveries
Net acquisitions
and divestments
Contingent resources Year-end
2015
Total 2C (mmboe) 1,721 - 153 29 (50) 1,853
Notes
1. This reserves statement:
a. is based on, and fairly represents, information and supporting documentation prepared by, or under the supervision of, the qualified petroleum reserves and resources evaluators listed in note 14 of this reserves statement. Details of each qualified petroleum reserves and resources evaluator’s employment and professional organisation membership are set out in note 14 of this reserves statement; and
b. as a whole has been approved by Barbara Pribyl, who is a qualified petroleum reserves and resources evaluator and whose employment and professional organisation membership details are set out in note 14 of this reserves statement; and
c. is issued with the prior written consent of Barbara Pribyl as to the form and context in which the estimated petroleum reserves and contingent resources and the supporting information are presented.
2. The estimates of petroleum reserves and contingent resources contained in this reserves statement are as at 31 December 2015.
3. Santos prepares its petroleum reserves and contingent resources estimates in accordance with the Petroleum Resources Management System (PRMS) sponsored by the Society of Petroleum Engineers (SPE).
4. This reserves statement is subject to risk factors associated with the oil and gas industry. It is believed that the expectations of petroleum reserves and contingent resources reflected in this statement are reasonable, but they may be affected by a range of variables which could cause actual results or trends to differ materially, including but not limited to: price fluctuations, actual demand, currency fluctuations, geotechnical factors, drilling and production results, gas commercialisation, development progress, operating results, engineering estimates, loss of market, industry competition, environmental risks, physical risks, legislative, fiscal and regulatory developments, economic and financial markets conditions in various countries, approvals and cost estimates.
5. All estimates of petroleum reserves and contingent resources reported by Santos are prepared by, or under the supervision of, a qualified petroleum reserves and resources evaluator or evaluators. Processes are documented in the Santos Reserves Guidelines which are overseen by a Reserves Committee. The frequency of reviews is dependent on the magnitude of the petroleum reserves and contingent resources and changes indicated by new data. If the changes are material, they are reviewed by the Santos internal technical leaders, prior to overall approval by management and the Reserves Committee.
6. Santos engages independent experts Gaffney, Cline & Associates, Netherland, Sewell & Associates, Inc. and DeGolyer and MacNaughton to audit and/or evaluate reserves and contingent resources. Each auditor found, based on the outcomes of its respective audit and evaluation, and its understanding of the estimation processes employed by Santos, that Santos’ 31 December 2015 petroleum reserves and contingent resources quantities in aggregate compare reasonably to those estimates prepared by each auditor. Thus, in the aggregate, the total volumes summarised in the tables included in this reserves statement represent a reasonable estimate of Santos’ petroleum reserves and contingent resources position as at 31 December 2015.
7. Unless otherwise stated, all references to petroleum reserves and contingent resources quantities in this reserves statement are Santos’ net share.
8. Reference points for Santos’ petroleum reserves and contingent resources and production are defined points within Santos’ operations where normal exploration and production business ceases, and quantities of produced product are measured under defined conditions prior to custody transfer. Fuel, flare and vent consumed to the reference points are excluded.
9. Petroleum reserves and contingent resources are aggregated by arithmetic summation by category and as a result, proved reserves may be a very conservative estimate due to the portfolio effects of arithmetic summation.
10. Petroleum reserves and contingent resources are typically prepared by deterministic methods with support from probabilistic methods.
11. Any material concentrations of undeveloped petroleum reserves that have remained undeveloped for more than 5 years: (a) are intended to be developed when required to meet contractual obligations; and (b) have not been developed to date because they have not yet been required to meet contractual obligations.
12. Petroleum reserves replacement ratio is the ratio of the change in petroleum reserves (excluding production) divided by production.
13. Information on petroleum reserves and contingent resources quoted in this reserves statement is rounded to the nearest whole number. Some totals in the tables may not add due to rounding. Items that round to zero are represented by the number 0, while items that are actually zero are represented with a dash “-“.
14. Qualified Petroleum Reserves and Resources Evaluators
Name EmployerProfessional Organisation
B Pribyl Santos Ltd SPE
P Lyford Santos Ltd SPE
B Camac Santos Ltd SPE, PESA
A Western Santos Ltd SPE
M Woolley Santos Ltd SPE
A Hill Santos Ltd PESA
E Klettke Santos Ltd SPE, APEGA
N Pink Santos Ltd SPE
A Wisnugroho Santos Ltd SPE
J Telford Santos Ltd SPE
R Price Santos Ltd SPE
C Harwood Santos Ltd PESA, AAPG
D Smith NSAI SPE
SPE: Society of Petroleum Engineers
APEGA: The Association of Professional Engineers and Geoscientists of Alberta
PESA: Petroleum Exploration Society of Australia
AAPG: American Association of Petroleum Geologists
Abbreviations and conversion factors
Abbreviations
1P proved reserves
2P proved plus probable reserves
GJ gigajoules
LNG liquefied natural gas
LPG liquefied petroleum gas
mmbbl million barrels
mmboe million barrels of oil equivalent
NGLs natural gas liquids
PJ petajoules
TJ terajoules
Conversion factors
Sales gas and ethane, 1 PJ 171,937 boe
Crude oil, 1 barrel 1 boe
Condensate, 1 barrel 0.935 boe
LPG, 1 tonne 8.458 boe
For
per
sona
l use
onl
y

16 / Santos Annual Report 2015
As at 31 December 2006 2007 2008 2009 2010 2011 2012 2013 2014 2015
Santos average realised oil price (A$/bbl)3 89.35 92.00 117.45 78.83 87.35 115.29 113.78 120.96 114.21 71.44
Financial performance ($million)4,5
Product sales revenue3 2,750 2,489 2,762 2,181 2,228 2,721 3,223 3,602 4,037 3,246
Total revenue3 2,779 2,518 2,805 2,251 2,306 2,803 3,289 3,651 4,099 3,294
Foreign currency gains/(losses)6 1 0 24 (28) (10) 18 (2) 24 161 251
Profit from ordinary activities before tax6 964 719 2,533 717 793 1,282 911 869 (1,378) (3,598)
Income tax relating to ordinary activities6 321 196 768 205 244 440 318 296 (316) (868)
Royalty-related taxes1 164 115 78 51 91 75 57 (127) (32)
Net profit after tax attributable to the shareholders of Santos Ltd
643 359 1,650 434 500 753 519 516 (935) (2,698)
Financial position ($million)4,5
Total assets 6,903 7,320 9,802 11,361 13,769 15,814 16,988 20,664 22,345 21,926
Net debt/ (cash) 1,450 1,839 506 (605) (1,201) (205) 1,334 4,918 7,490 6,530
Total equity 3,356 3,093 4,478 6,967 7,603 8,963 9,354 10,212 9,413 10,202
Reserves and production (mmboe)
Proven plus probable reserves (2P) 819 879 1,013 1,440 1,445 1,364 1,406 1,368 1,245 945
Production 61.0 59.1 54.4 54.4 49.9 47.2 52.1 51.0 54.1 58.0
Exploration2
Wells drilled (number) 25 10 13 6 3 4 4 12 9 4
Expenditure ($million)4 259 150 233 181 90 151 162 391 323 272
Other capital expenditure ($million)4,5
Delineation and development2 866 955 1,290 1,204 1,684 2,769 2,960 3,704 3,247 1,367
Buildings, plant and equipment 182 202 105 172 107 149 231 274 261 179
General
Number of employees (excluding contractors)
1,679 1,786 1,940 2,096 2,367 2,847 3,289 3,502 3,636 2,946
Number of shareholders 83,566 77,498 78,933 107,138 112,145 113,173 111,135 112,397 140,509 161,854
Market capitalisation ($million) 5,907 8,274 8,696 11,721 11,506 11,560 10,669 14,222 8,116 6,500
Netback ($/boe)3 32.9 32.9 35.9 22.9 23.0 27.6 31.1 33.9 33.4 27.8
10-year SummaryF
or p
erso
nal u
se o
nly
Santos Annual Report 2015 / 17
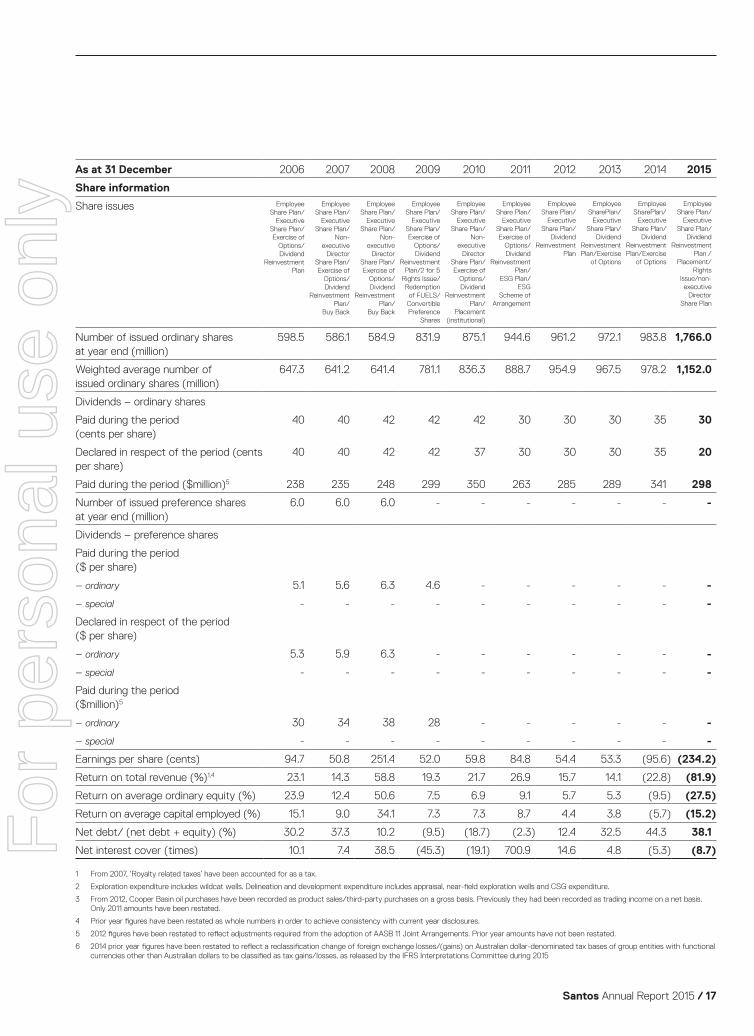
As at 31 December 2006 2007 2008 2009 2010 2011 2012 2013 2014 2015
Share information
Share issues Employee Share Plan/
Executive Share Plan/ Exercise of
Options/ Dividend
Reinvestment Plan
Employee Share Plan/
Executive Share Plan/
Non- executive
Director Share Plan/ Exercise of
Options/ Dividend
Reinvestment Plan/
Buy Back
Employee Share Plan/
Executive Share Plan/
Non- executive
Director Share Plan/ Exercise of
Options/ Dividend
Reinvestment Plan/
Buy Back
Employee Share Plan/
Executive Share Plan/ Exercise of
Options/ Dividend
Reinvestment Plan/2 for 5
Rights Issue/ Redemption
of FUELS/ Convertible Preference
Shares
Employee Share Plan/
Executive Share Plan/
Non- executive
Director Share Plan/ Exercise of
Options/ Dividend
Reinvestment Plan/
Placement (institutional)
Employee Share Plan/
Executive Share Plan/ Exercise of
Options/ Dividend
Reinvestment Plan/
ESG Plan/ ESG
Scheme of Arrangement
Employee Share Plan/
Executive Share Plan/
Dividend Reinvestment
Plan
Employee SharePlan/
Executive Share Plan/
Dividend Reinvestment Plan/Exercise
of Options
Employee SharePlan/
Executive Share Plan/
Dividend Reinvestment Plan/Exercise
of Options
Employee Share Plan/
Executive Share Plan/
Dividend Reinvestment
Plan /Placement/
Rights Issue/non-executive
Director Share Plan
Number of issued ordinary shares at year end (million)
598.5 586.1 584.9 831.9 875.1 944.6 961.2 972.1 983.8 1,766.0
Weighted average number of issued ordinary shares (million)
647.3 641.2 641.4 781.1 836.3 888.7 954.9 967.5 978.2 1,152.0
Dividends – ordinary shares
Paid during the period (cents per share)
40 40 42 42 42 30 30 30 35 30
Declared in respect of the period (cents per share)
40 40 42 42 37 30 30 30 35 20
Paid during the period ($million)5 238 235 248 299 350 263 285 289 341 298
Number of issued preference shares at year end (million)
6.0 6.0 6.0 - - - - - - -
Dividends – preference shares
Paid during the period ($ per share)
– ordinary 5.1 5.6 6.3 4.6 - - - - - -
– special - - - - - - - - - -
Declared in respect of the period ($ per share)
– ordinary 5.3 5.9 6.3 - - - - - - -
– special - - - - - - - - - -
Paid during the period ($million)5
– ordinary 30 34 38 28 - - - - - -
– special - - - - - - - - - -
Earnings per share (cents) 94.7 50.8 251.4 52.0 59.8 84.8 54.4 53.3 (95.6) (234.2)
Return on total revenue (%)1,4 23.1 14.3 58.8 19.3 21.7 26.9 15.7 14.1 (22.8) (81.9)
Return on average ordinary equity (%) 23.9 12.4 50.6 7.5 6.9 9.1 5.7 5.3 (9.5) (27.5)
Return on average capital employed (%) 15.1 9.0 34.1 7.3 7.3 8.7 4.4 3.8 (5.7) (15.2)
Net debt/ (net debt + equity) (%) 30.2 37.3 10.2 (9.5) (18.7) (2.3) 12.4 32.5 44.3 38.1
Net interest cover (times) 10.1 7.4 38.5 (45.3) (19.1) 700.9 14.6 4.8 (5.3) (8.7)
1 From 2007, ‘Royalty related taxes’ have been accounted for as a tax.
2 Exploration expenditure includes wildcat wells. Delineation and development expenditure includes appraisal, near-field exploration wells and CSG expenditure.
3 From 2012, Cooper Basin oil purchases have been recorded as product sales/third-party purchases on a gross basis. Previously they had been recorded as trading income on a net basis. Only 2011 amounts have been restated.
4 Prior year figures have been restated as whole numbers in order to achieve consistency with current year disclosures.
5 2012 figures have been restated to reflect adjustments required from the adoption of AASB 11 Joint Arrangements. Prior year amounts have not been restated.
6 2014 prior year figures have been restated to reflect a reclassification change of foreign exchange losses/(gains) on Australian dollar-denominated tax bases of group entities with functional currencies other than Australian dollars to be classified as tax gains/losses, as released by the IFRS Interpretations Committee during 2015
For
per
sona
l use
onl
y

18 / Santos Annual Report 2015
Directors’ Report
Directors’ Report
CONTENTS
18 Directors’ Report 19 Directors, Directors’ shareholdings and Directors’ meetings 21 Operating and financial review 30 Significant changes in the state of affairs 31 Post balance date events 31 Shares under option and unvested share acquisition rights 32 Shares issued on the exercise of options and on the vesting of SARs 33 Directors’ and Senior Executives’ remuneration 34 Remuneration in brief 34 Response to the global oil price environment 35 Actually realised remuneration 36 Remuneration Report 36 Remuneration Policy 36 Remuneration governance 37 Remuneration framework 41 CEO transition 42 Senior Executive remuneration 43 At risk remuneration summary 43 Non-executive Director remuneration 45 Detailed remuneration information 49 Key management personnel disclosures 51 Share holdings 52 Detailed information about linking company performance to incentives 54 Directors’ Report (continued) 54 Indemnification 54 Non-audit services 54 Rounding
For
per
sona
l use
onl
y

Santos Annual Report 2015 / 19
Directors’ Report
DIRECTORS’ REPORT
The Directors present their report together with the consolidated financial report of the consolidated entity, being Santos Limited (“Santos” or “the Company”) and its controlled entities, for the financial year ended 31 December 2015, and the Auditor’s Report thereon. Information in the Annual Report referred to in this report, including the Remuneration Report, or contained in a note to the financial statements referred to in this report forms part of, and is to be read as part of, this report.
DIRECTORS, DIRECTORS’ SHAREHOLDINGS AND DIRECTORS’ MEETINGS
Directors and Directors’ shareholdings
The names of Directors of the Company in office at the date of this report and details of the relevant interest of each of those Directors in shares in the Company at that date are as set out below:
Surname Other names Shareholdings in Santos Limited
Allen Yasmin Anita 15,883
Coates Peter Roland (Chairman) 92,872
Dean Kenneth Alfred 67,581
Franklin Roy Alexander 25,104
Gallagher Kevin Thomas 100,000
Goh Hock 33,407
Hemstritch Jane Sharman 63,482
Martin Gregory John Walton 38,912
Sheffield Scott Douglas 63,529
The above-named Directors held office during and since the end of the financial year, other than Mr Gallagher who was appointed to the Board on 16 February 2016. Mr Kenneth Borda was a Director and Chairman until his retirement at the Annual General Meeting on 30 April 2015. Mr David Knox was Managing Director and CEO until his retirement from the Board on 12 November 2015. There were no other persons who acted as Directors at any time during the financial year and up to the date of this report. All shareholdings are of fully paid ordinary shares. No Director holds a relevant interest in a related body corporate of Santos Limited.
At the date of this report, Mr Gallagher holds 333,822 share acquisition rights (“SARs”). No other Director holds options or SARs.
Details of the qualifications, experience and special responsibilities of each Director and the Company Secretary are set out on the Directors’ and Executives’ biography pages of the Annual Report. This information includes details of other listed company directorships held during the last three years.
For
per
sona
l use
onl
y

20 / Santos Annual Report 2015
Directors’ Report
Directors’ Reportcontinued
Directors’ meetings
The number of Directors’ meetings and meetings of committees of Directors held during the financial year and the number of meetings attended by each Director are set out below:
Table of Directors’ meetings
DirectorDirectors’ Meeting
Audit & Risk Committee
Environment, Health,
Safety & Sustainability
Committee
People & Remuneration
CommitteeFinance
Committee2
Nomination Committee
Attended/Held1 Attended/Held1 Attended/Held1 Attended/Held1 Attended/Held1 Attended/Held1
Allen3 Yasmin A. 15 of 16 3 of 3 5 of 5 n/a n/a n/a
Borda4 Kenneth C. 3 of 5 n/a n/a 1 of 1 1 of 2 1 of 1
Coates5 Peter R. 16 of 16 n/a 5 of 5 n/a n/a 8 of 8
Dean Kenneth A. 15 of 16 5 of 5 n/a n/a 2 of 2 8 of 8
Franklin6 Roy A. 16 of 16 n/a 5 of 5 5 of 5 n/a 5 of 5
Goh Hock 13 of 16 5 of 5 4 of 5 n/a n/a n/a
Hemstritch Jane S. 15 of 16 5 of 5 n/a 5 of 5 n/a n/a
Knox7 David J. W. 10 of 12 n/a 4 of 5 n/a n/a n/a
Martin Gregory J. W. 13 of 16 5 of 5 n/a 5 of 5 2 of 2 n/a
Sheffield Scott D. 10 of 16 n/a n/a n/a 2 of 2 n/a
1 Reflects the number of meetings held during the time the Director held office, or was a member of the Committee, during the year
2 The Finance Committee was discontinued on 1 May 2015
3 Ms YA Allen became a member of the Audit & Risk Committee on 1 May 2015
4 Mr KC Borda retired as a non-executive Director on 30 April 2015
5 Mr PR Coates was elected Chairman on 1 May 2015
6 Mr RA Franklin became a member of the Nomination Committee on 25 June 2015
7 Mr DJW Knox retired as Managing Director and CEO on 12 November 2015
For
per
sona
l use
onl
y

Santos Annual Report 2015 / 21
OPERATING AND FINANCIAL REVIEW
Santos’ principal activities during 2015 were the exploration for, and development, production, transportation and marketing of, hydrocarbons. There were no significant changes in the nature of these activities during the year. Revenue is derived primarily from the sale of gas and liquid hydrocarbons.
A review of the operations and of the results of those operations of the consolidated entity during the year is as follows:
Summary of results table
2015 mmboe
2014 mmboe
Variance %
Production volume 57.7 54.1 7
Sales volume 64.3 63.7 1
$million $million
Product sales 3,246 4,037 (20)
EBITDAX1 1,919 2,319 (17)
Exploration and evaluation expensed (244) (256) (5)
Depreciation and depletion (1,059) (988) 7
Net impairment loss (3,924) (2,356) 67
EBIT1 (3,308) (1,281) (158)
Net finance costs (290) (97) 199
Taxation benefit 900 443 103
Net loss for the period and attributable to equity holders of Santos (2,698) (935) (189)
Underlying profit for the period1 50 533 (91)
1 EBITDAX (earnings before interest, tax, depreciation, depletion, exploration and evaluation and impairment), EBIT (earnings before interest and tax) and underlying profit are non-IFRS measures that are presented to provide an understanding of the underlying performance of Santos’ operations. Underlying profit excludes the impacts of asset acquisitions, disposals and impairments, as well as items that are subject to significant variability from one period to the next, including the effects of fair value adjustments and fluctuations in exchange rates. Please refer to page 24 for the reconciliation from net loss to underlying profit for the period. The non-IFRS financial information is unaudited however the numbers have been extracted from the audited financial statements.
Production and sales
Santos’ 2015 full-year production of 57.7 million barrels of oil equivalent (mmboe) was the Company’s highest annual production since 2007 and a 7% increase on the prior year, primarily due to a full year of production from PNG LNG, a record number of cargoes shipped from Darwin LNG and the start-up of GLNG in the third quarter, offset by lower crude oil production from Mutineer Exeter / Fletcher Finucane due to the Floating Production Storage Offloading (“FPSO”) vessel being offline for maintenance repairs.
Sales volumes were flat year on year at 64.3 mmboe as higher LNG sales volumes were offset by lower crude oil volumes due to the Mutineer Exeter / Fletcher Finucane FPSO being offline for maintenance repairs and lower Santos own and third party crude oil volumes in the Cooper Basin due to a reduction in development activity in response to lower oil prices.
Sales revenue of $3.2 billion was 20% lower than 2014 reflecting sharply lower realised oil prices. The average realised crude oil price for the year was A$71.44, 37% lower than 2014.
For
per
sona
l use
onl
y

22 / Santos Annual Report 2015
Directors’ Report
Directors’ Reportcontinued
Review of operations
Santos’ operations are reported in four business units based on the different geographic regions of the Company’s operations: Eastern Australia; Western Australia & Northern Territory; Asia Pacific and GLNG.
Eastern Australia
Santos is a leading producer of natural gas, gas liquids and crude oil in eastern Australia. Gas is sold primarily to domestic retailers, industry and for the production of liquefied natural gas, while gas liquids and crude oil are sold in the domestic and export markets.
Eastern Australia Business Unit EBITDAX was $421 million, 39% lower than 2014 primarily due to lower commodity prices.
Santos’ share of Cooper Basin gas production of 63.0 petajoules (“PJ”) was in line with 2014 production of 63.3 PJ reflecting lower raw gas capacity due to the deferral of development activity, offset by lower downtime and lower fuel, flare and vent. Santos’ share of Cooper Basin condensate production was 943,900 barrels, 9% lower than 2014 due to lower raw gas production and lower yields due to the development of drier gas fields.
Santos’ share of gas production from the Otway Basin offshore Victoria was 13.0 PJ, 19% lower than 2014 due to natural well decline.
Santos’ share of Cooper Basin oil production of 2.8 million barrels (mmbbl) was 12% lower than 2014 due to reduced development activity and natural field decline. Volumes of third party crude oil processed at Moomba decreased as activity in the Basin was curtailed in response to lower oil prices.
Santos continued to progress appraisal of the unconventional gas potential in the Cooper Basin with the successful exploration campaign within the Patchawarra wet gas fairway resulting in seven discoveries from eight wells and the Basin’s first stand-alone deep coal producer, Tirrawarra South 1, brought on-line in May.
Western Australia & Northern Territory
Santos is one of the largest producers of domestic natural gas in Western Australia and is also a significant producer of gas liquids and crude oil. Santos also has an interest in the Bayu-Undan/Darwin LNG project.
Santos’ Western Australia gas and condensate production of 51.6 PJ and 511,800 barrels respectively, were both slightly lower than 2014 due to lower customer nominations and outages.
Western Australia Business Unit EBITDAX was $424 million, 33% lower than 2014 primarily due to lower global oil prices, combined with the Mutineer Exeter / Fletcher Finucane FPSO being offline for repairs in the first half of 2015.
Santos’ share of Western Australia oil production of 2.3 mmbbl was 26% lower than 2014, primarily due to maintenance repairs on the Mutineer Exeter / Fletcher Finucane FPSO vessel.
First gas from Bayu-Undan Phase 3 development was delivered ahead of schedule in March. Darwin LNG continued to perform strongly, producing a record 3.8 million tonnes of LNG and shipping a record 58 cargoes over the course of 2015. Santos’ net entitlement to gas production of 19.5 PJ was 18% more than the prior year.
For
per
sona
l use
onl
y

Santos Annual Report 2015 / 23
Asia Pacific
Santos is building a material business in Asia with producing assets presently in three countries, Papua New Guinea, Indonesia and Vietnam and exploration assets in Malaysia, Papua New Guinea, Indonesia and Bangladesh.
Asia Pacific Business Unit EBITDAX was $827 million, 11% higher than 2014 primarily due to a full year of production from PNG LNG.
In Papua New Guinea, the PNG LNG project (Santos 13.5% interest) shipped 101 LNG cargoes as strong upstream deliverability and reliable plant performance resulted in the plant operating 7% above nameplate capacity at an annualised rate of approximately 7.4 mtpa. Santos’ share of gas and condensate production was 59.5 PJ and 1.4 mmbbl respectively.
Also in Papua New Guinea, drilling concluded during the first quarter on the exploration component of the Hides F1 well after reaching a total depth of 4,633 metres. Despite intersecting thick argillaceous sandstone intervals in the Koi Iange formation, wireline logging confirmed poor reservoir quality. The exploration component of the well was plugged and abandoned and the development section completed as a gas producer for the PNG LNG project.
Santos’ net entitlement to oil production in Vietnam of 2.6 mmbbl was 7% lower than 2014 due to operations being shut down for most of August for repairs to the firewater system on the FPSO swivel.
Santos’ net entitlement to gas production in Indonesia of 23.8 PJ was 5% lower than 2014, primarily due to Maleo field decline and lower Oyong entitlement, partially offset by higher Peluang and Wortel gross gas production and contractor entitlement.
Santos and its partners made a significant oil discovery with the Bestari-1 exploration well located in the Deepwater Block R Production Sharing Contract offshore Malaysia. In water depths ranging from 100 metres to 1,400 metres, the Bestari-1 well encountered 67 metres of net oil pay in multiple sand packages within the primary Miocene age formation at true vertical subsea depths ranging from 1,860m to 2,702m. The oil bearing sands are of high quality with good porosity and permeability. Initial results from an appraisal well on the discovery drilled during the fourth quarter were in line with expectations and further evaluation will be carried out over 2016.
GLNG
Sanctioned in January 2011, the GLNG project (Santos 30% interest) produced first LNG on 24 September 2015 and shipped its first cargo on 16 October 2015.
A total of seven cargoes were shipped by year end.
Average feed rate to the plant for the fourth quarter was 370 TJ/d, which includes downtime for the planned two-week shutdown completed during November. Average feed gas to the plant for the quarter was approximately 50 per cent GLNG-owned gas production, with the remaining feed gas supplied from third party and Santos portfolio-purchased quantities. Santos’ share of fourth quarter sales gas production of 5.4 PJ from GLNG’s upstream fields was a 218% increase on the corresponding quarter, reflecting the successful ramp-up of LNG Train 1 over the period.
Train 1 produced 544,000 tonnes of LNG during the fourth quarter and achieved daily LNG production rates more than 10% above nameplate capacity.
Commissioning work on the second LNG train is underway with first LNG expected in the second quarter of 2016.
The GLNG Business Unit results include domestic gas production and sales from the GLNG coal seam natural gas fields in south-western Queensland. GLNG Business Unit EBITDAX was $8 million, 180% higher than 2014 due to the commencement of LNG sales during the fourth quarter, partially offset by lower domestic gas nominations.
Santos’ share of GLNG domestic gas production was 4.7 PJ, 41% lower than 2014 due to lower domestic gas nominations.
For
per
sona
l use
onl
y

24 / Santos Annual Report 2015
Directors’ Report
Net loss
The 2015 net loss attributable to equity holders of Santos Limited of $2,698 million is $1,763 million higher than the net loss of $935 million in 2014. This increase is primarily due to higher impairment losses of $2,761 million after tax ($1,563 million in 2014) and lower sales revenue as a result of the decline in global oil prices.
Net loss includes items before tax of $3,725 million ($2,748 million after tax), as referred to in the reconciliation of net loss to underlying profit below.
Reconciliation of net loss to underlying profit1
2015 $million
2014 $million
Gross Tax Net Gross Tax Net
Net loss after tax attributable to equity holders of Santos Limited (2,698) (935)
Add/(deduct) the following:
Net gains on sales of non-current assets (2) 1 (1) (4) 1 (3)
Impairment losses 3,924 (1,163) 2,761 2,356 (793) 1,563
Foreign exchange (gains)/ losses (251) 223 (28) (161) 164 3
Fair value adjustments on embedded derivatives and hedges (15) 5 (10) (59) 17 (42)
Remediation (income)/costs for incidents net of related insurance recoveries – – – (6) 2 (4)
Other expense items2 69 (21) 48 – – –
Other tax adjustments – (22) (22) – (49) (49)
3,725 (977) 2,748 2,126 (658) 1,468
Underlying profit1 50 533
1 Underlying profit is a non-IFRS measure that is presented to provide an understanding of the underlying performance of Santos’ operations. The measure excludes the impacts of asset acquisitions, disposals and impairments, as well as items that are subject to significant variability from one period to the next, including the effects of fair value adjustments and fluctuations in exchange rates. The non-IFRS financial information is unaudited, however the numbers have been extracted from the financial statements which have been subject to audit by the Company’s auditor.
2 Other expense items in 2015 relates to Business Unit restructure costs including redundancy payments.
Financial position
Summary of financial position
2015 $million
2014 $million
Variance $million
Exploration and evaluation assets 715 1,106 (391)
Oil and gas assets and other land, buildings, plant and equipment 17,301 18,689 (1,388)
Restoration provision (2,443) (2,157) (286)
Other net assets/(liabilities)1 624 (207) 831
Total funds employed 16,197 17,431 (1,234)
Net debt2 (6,530) (7,490) 960
Net tax assets/(liabilities)3 535 (528) 1,063
Net assets/equity 10,202 9,413 789
1 Other net assets/(liabilities) comprises trade and other receivables, prepayments, inventories, other financial assets, share of investments in joint ventures, offset by trade and other payables, deferred income, provisions and other financial liabilities.
2 Net debt reflects the net borrowings position and includes interest-bearing loans, net of cash and interest rate and cross-currency swap contracts.
3 Net tax assets/(liabilities) comprises deferred tax assets and tax receivable, offset by deferred tax liabilities and current tax payable.
Directors’ Reportcontinued
For
per
sona
l use
onl
y

Santos Annual Report 2015 / 25
Impairment of assets
During the Company’s regular review of asset carrying values, Santos undertook an impairment review against the lower oil price environment as part of the preparation of its 2015 full-year accounts.
Some assets were assessed to be impaired and non-cash after-tax impairment losses of $2,761 million have been recognised in the 2015 accounts.
The impairment losses primarily relate to oil and gas assets, including in the Cooper Basin and GLNG, and certain exploration and evaluation assets, including the Narrabri assets.
Exploration and evaluation assets
Exploration and evaluation assets were $715 million compared to $1,106 million at the end of 2014, a decrease of $391 million, mainly due to impairment losses before tax of $685 million and exploration and evaluation expensed, offset by 2015 capital expenditure, including drilling unconventional Cooper Basin gas wells and the Bestari wells in Malaysia in addition to acquisition costs comprising interests in Block R in Malaysia and PPL 269 in Papua New Guinea.
Oil and gas assets and other land, buildings, plant and equipment
Oil and gas assets and other land and buildings, plant and equipment of $17,301 million were $1,388 million lower than in 2014 mainly due to impairment losses before tax of $3,201 million and depreciation and depletion charges, offset by 2015 capital expenditure, including GLNG, PNG LNG and the Cooper Basin.
Restoration provision
Restoration provision balances have increased by $286 million to $2,443 million mainly due to revised restoration cost estimates, unfavourable exchange rate movements and unwinding the effect of discounting on the provisions.
Net debt
Net debt of $6,530 million was $960 million lower than at the end of 2014 primarily as a result of debt repayments from equity raising proceeds, partially offset by the impact of the AUD:USD exchange rate on US$ denominated debt.
Net tax assets/(liabilities)
Net tax assets of $535 million have increased by $1,063 million from a net tax liability of $528 million at the end of 2014 primarily as a result of higher carry-forward tax losses recognised by the group.
Net assets/equity
Total equity increased by $789 million to $10,202 million at year end. The increase primarily reflects the increase in shares issued from the rights issue and private placement during 2015 and the impact of the AUD:USD exchange rate on foreign operations ($465 million), partially offset by the net loss after tax attributable to owners of Santos of $2,698 million.
Future commitments
Due to the nature of Santos’ operations, the Company has future obligations for capital expenditure, for which no amounts have been provided in the financial statements. Santos also has certain requirements to perform minimum exploration work and spend minimum amounts of money pursuant to the terms of the granting of petroleum exploration permits in order to maintain rights of tenure. The minimum exploration commitments are less than the normal level of exploration expenditures expected to be undertaken by the Company.
Santos leases LNG carriers and tug facilities under finance leases. The leases have terms of between 10 and 20 years with varying renewal options. At the reporting date, finance lease liabilities for a purpose-built LNG carrier and tug boats were recorded on the balance sheet. Santos also leases floating production, storage and offtake facilities, floating storage offloading facilities, LNG carriers and mobile offshore production units under operating leases. These leases typically run for a period of four to six years and may have an option to renew after that time. The group also leases building office space and a warehouse under operating leases. These leases are generally for a period of 10 years, with an option to renew the lease after that date.F
or p
erso
nal u
se o
nly

26 / Santos Annual Report 2015
Directors’ Report
Directors’ Reportcontinued
Business strategy and prospects for future financial years
Business strategy
Santos’ vision is to be a leading energy company in Australia and Asia.
The Company has a three-pronged strategy to achieve this:
• Australia: Driving value and performance in the base business and unlocking resources to meet gas demand.
With one of the largest exploration and production acreages in Australia and an extensive infrastructure position, Santos is committed to supplying the domestic markets, unlocking resources and driving value and performance from its existing operations.
• LNG: Leveraging existing and new LNG infrastructure and capabilities.
Santos has interests in three producing LNG projects. GLNG commenced production in 2015, PNG LNG in 2014 and Darwin LNG in 2006. All three projects are underpinned by long-term offtake agreements to high-quality Asian buyers.
• Asia: Building a focused, high-value position in South-East Asia.
In South-East Asia, Santos’ business continues to grow through the successful delivery of key projects in Papua New Guinea, Vietnam and Indonesia, and through high impact exploration opportunities.
Between June 2014 and the end of 2015, the Brent Crude oil price deteriorated 68% from US$112 to US$36 per barrel, significantly impacting oil and gas companies around the globe. Substantial cuts have been made to capital expenditure budgets, and development and exploration programs across the industry have been either cancelled or postponed.
The severe and protracted deterioration of the oil price is primarily due to an over-supply of oil to global markets on the back of the Organisation of Petroleum Exporting Countries (“OPEC”) resolving to maintain high levels of production in an effort to defend market share against the rise of non-OPEC production, particularly shale oil from the United States.
Following the initial endorsement of this strategy by OPEC in November 2014, Santos reacted quickly and sought to reposition the Company for the lower oil price environment. In December 2014, the Company announced a 25% reduction in the 2015 capital expenditure budget from $2.7 billion to $2 billion and negotiated a $1 billion bilateral bank facility to further strengthen the balance sheet. At the full-year results in February 2015, Santos announced a recruitment freeze, removed approximately 500 positions from the Company and targeted a greater than 10% reduction in unit production costs over the course of the calendar year.
Despite these early initiatives, as 2015 unfolded it became increasingly evident that the oil price environment was to remain under significant pressure for longer than the market had originally anticipated. Chart 1 illustrates the downward revisions to the Brent oil price forward curve over the course of the year as the market became increasingly focussed on the continued growth in crude inventories, the easing of international sanctions on oil exports from Iran and weaker than expected growth in China.
Chart 1: Brent oil forward curve US$/barrel
30
40
50
60
70
80
May/2015 Dec/2015 Jul/2016 Feb/2017 Sep/2017 Apr/2018 Nov/2018 Jun/2019 Jan/2020 Aug/2020 Mar/2021 Oct/2021 May/2022 Dec/2022
Crude Oil, Brent 30 June 2015 Crude Oil, Brent 30 September 2015 Crude Oil, Brent 31 December 2015
For
per
sona
l use
onl
y

Santos Annual Report 2015 / 27
As any expectation of a short-term recovery in the oil price diminished, the Board announced on 21 August 2015 that it would conduct a full Strategic Review to examine all options to restore and maximise shareholder value, the outcome of which resulted in the following $3.5 billion in capital initiatives to strengthen the balance sheet and reduce net debt:
• $520 million from the sale of Santos’ interest in the Kipper gas field
Santos reached agreement to sell its 35% non-operated interest in the Kipper gas field, located in the Gippsland Basin, offshore Victoria to Mitsui E&P Australia Pty Ltd (“Mitsui”).
Under the terms of the transaction, Mitsui agreed to pay Santos $520 million in cash. The sale is subject to customary consents and regulatory approvals and is expected to complete in the first quarter of 2016.
Whilst further asset sales were considered as part of the Strategic Review, the Board determined that it was not in the best interests of shareholders to sell tier one assets at prices that did not adequately reflect their long-term value. Further, while the capital initiatives announced under the Strategic Review mean that Santos is under no pressure to sell further assets, inbound interest may continue and the Company will respond accordingly in the normal course of business. Santos will only sell assets where there is a compelling value case for our shareholders and it is consistent with the Company’s strategy.
• $500 million private placement to Hony Capital
Santos entered into a binding Share Subscription Agreement with an affiliate of Hony Capital (“Hony”), a major global financial investor. Under the terms of the agreement, Hony subscribed for 73,529,412 fully paid ordinary shares in Santos, at a price of $6.80 per share pre the Entitlement Offer.
Hony provided binding commitments to take up its full pro-rata entitlement under the Entitlement Offer and not to increase its total holding in Santos above 9.9% for a period of three months. Hony also agreed not to divest to any unrelated party any of its shares in Santos acquired through the placement and Entitlement Offer for a period of 12 months, without the Company’s consent, subject to limited exceptions.
The share placement to Hony reflected a clear vote of confidence in Santos’ long-term value proposition.
• $2.5 billion fully underwritten accelerated pro-rata renounceable Entitlement Offer
The Santos Board gave careful consideration to the question of an equity issue and agreed to take action to strengthen the Santos balance sheet through a $2.5 billion fully underwritten, 1 for 1.7 accelerated pro rata renounceable Entitlement Offer.
The decision to raise equity was not taken lightly but ultimately, given an external environment characterised by uncertainty, the Board determined that it was in the best interests of shareholders to safeguard the Company’s future and strengthen the balance sheet.
A revised dividend framework was also announced at completion of the Strategic Review to better reflect the Company’s exposure to oil-linked LNG pricing and the cyclical characteristics of global oil markets. Dividends will now be set as a payout ratio of earnings. Subject to business conditions, this is expected to be a minimum of 40% of underlying net profit after tax. For the 2015 final dividend only, a 5 cents per share dividend was declared on the expanded capital base following the placement and Entitlement Offer.
The outcome of the Strategic Review and associated capital initiatives reinforced Santos’ balance sheet, resulting in a significant liquidity position of more than $4.8 billion in cash and undrawn debt facilities at year end as well as making a significant step towards restoring long-term value for shareholders.
In conjunction with the outcome of the Strategic Review, it was announced that Kevin Gallagher, previously Chief Executive Officer of the engineering services group, Clough Limited, would assume the role of Managing Director and Chief Executive Officer. With nearly 25 years’ experience in managing oil and gas operations in Australia, the USA and North and West Africa, Mr Gallagher is widely recognised for his achievements in driving strong financial performance and is ideally suited to lead the Company as the focus moves from major strategic developments to delivering strong operational results in a low oil price environment. Mr Gallagher commenced with Santos on 1 February 2016.
Throughout 2015 Santos management and employees remained focused on driving operational and capital efficiencies. Capital expenditure guidance was moderated further in the fourth quarter from $2 billion to $1.8 billion and at year end came in under guidance at $1.7 billion. Unit production costs of $14.4 / barrel of oil equivalent (boe) were 10% lower than in 2014 and production was up 7% year on year to 57.7 mmboe. A total of 825 employee positions were also removed from the Company in 2015 resulting in targeted gross labour cost savings of $160 million per annum.
Despite the initiatives undertaken to right size the business for a lower oil price environment, operational performance remained strong in 2015 as evidenced by the delivery of the GLNG project, strong production from PNG LNG and Darwin LNG, exploration success in Malaysia and the Cooper Basin and an outstanding safety record.
The GLNG project produced first LNG from Train 1 in September on schedule and within budget and by year end had shipped seven commissioning cargoes. Commissioning work on the second LNG train is underway with first LNG expected in the second quarter of 2016.
For
per
sona
l use
onl
y

28 / Santos Annual Report 2015
Directors’ Report
The PNG LNG project shipped 101 LNG cargoes as strong upstream deliverability and reliable plant performance resulted in the plant operating 7% above its nameplate capacity at an annualised rate of approximately 7.4 mtpa. Darwin LNG produced a record 3.8 million tonnes of LNG and shipped a record 58 cargoes.
On the exploration front, a significant oil discovery was announced in March from the Bestari-1 exploration well located offshore Malaysia, and in the Cooper Basin the first stand-alone Permian Source Rock play producer, Tirrawarra South 1, was successfully brought online in May and is flowing liquids-rich gas in line with forecasts.
Finally, despite a period of significant project delivery and organisational change, the Company recorded its lowest annual Lost-Time Injury Frequency Rate (LTIFR) on record of 0.1 per million hours worked.
Prospects for future financial years
Santos is well placed to withstand an extended period of low oil prices, with more than $4.8 billion in cash and committed undrawn debt facilities as at 31 December 2015 and no material debt maturities until 2019. Santos will continue to focus on reducing capital expenditure and build on the significant improvements made in 2015 to operating efficiency.
As a leading energy company in Australia and Asia, the Company’s portfolio will be increasingly leveraged to Asian energy demand and its revenue to Asian energy prices. Santos’ portfolio exposure to oil-linked pricing will continue to grow as GLNG ramps-up, PNG LNG produces at plateau and an increasing proportion of Santos’ domestic sales gas production is sold at oil-linked prices.
Santos’ portfolio of LNG assets is backed by long-term offtake agreements which will see shareholders benefit from strong cash flows for decades to come. Once GLNG is fully ramped up, Santos will be exporting more than 3 million tonnes of LNG per annum to customers throughout Asia.
We remain focused on strengthening our balance sheet, reducing our capital expenditure and making significant improvements to our operating efficiency in order to withstand the lower oil price environment.
We remain confident in the long-term underlying demand for energy on the back of Asian economic growth, the rising global population and rapid urbanisation in developing economies. Large cuts in capital expenditure by oil and gas companies are expected to lead to falling production and a recalibration of oil prices to higher levels. However, we are well on our way to resetting the cost base in order to operate profitably and sustainably in periods of prolonged weakness in the oil price, and are confident that in time the measures taken will drive better returns for shareholders.
Material business risks
The achievement of the business strategy, production growth outlook and future financial performance is subject to various risks including the material business risks summarised below. Santos undertakes steps to identify, assess and manage these risks and operates under a Board-approved enterprise-wide Risk Management Policy. This summary refers to significant risks identified at a whole of entity level relevant to Santos. It is not an exhaustive list of all risks that may affect the Company nor have they been listed in any particular order of importance.
Volatility in oil and gas prices
• Santos’ business relies primarily on the production and sale of oil and gas products (including LNG) to a variety of buyers under a range of short-term and long-term contracts. While the existence of oil-linked pricing means that downward movements in oil price have an effect on Santos’ revenue, the Company also receives revenue from non oil-linked contracts. Crude oil prices are affected by numerous factors beyond the Company’s control and have fluctuated widely historically.
• Oil prices in 2015 saw Santos continue to manage risks associated with a lower oil price operating environment. Steps taken in 2015 included an organisation-wide strategic review, asset interest sales, a private equity placement, an underwritten pro-rata investor entitlement offer and an ongoing focus on operational efficiencies and reduction of capital expenditure and production costs.
Project development risk
• Santos undertakes investment in a variety of oil and gas projects to extract, process and supply oil and gas to a variety of customers including long-term high-volume contracts to supply feedstock gas to the GLNG project. Such projects may be delayed or be unsuccessful for many reasons, including unanticipated economic, financial, operational, engineering, technical, environmental, contractual, regulatory, community or political events. Delays, changes in scope, cost increases or poor performance outcomes pose risks that may impact the Company’s financial performance.
• Santos has comprehensive project and risk management and reporting systems in place and the progress and performance of material projects is regularly reviewed by senior management and the Board.
Directors’ Reportcontinued
For
per
sona
l use
onl
y

Santos Annual Report 2015 / 29
Oil and gas reserves
• Estimations of recoverable oil and gas reserves and resources contain significant uncertainties, which are inherent in the reservoir geology, seismic and well data available and other factors such as project development and operating costs, together with commodity prices.
• Santos has adopted a reserves management system that is consistent with the Society of Petroleum Engineers’ Petroleum Resource Management System. The Company’s reserves and resources estimations are subject to annual independent audits and evaluations.
Exploration risk
• Santos’ future long-term prospects are also directly related to the success of efforts to replace existing oil and gas reserves as they are depleted through production. Exploration is a high risk endeavour subject to geological and technological uncertainties and the failure to replace utilised reserves with additional proved reserves is a risk inherent in the oil and gas exploration and production industry.
• Santos employs a well-established exploration prospect evaluation methodology and risking process to manage the risks associated with exploration.
Regulatory risks
• Santos’ business is subject to various laws and regulations, in each of the countries in which it operates, relating to the development, production, marketing, pricing, transportation and storage of its products. A change in the laws which apply to the Company’s business or the way in which it is regulated could have a material adverse effect on its business, results of operations and financial condition. For example, a change in taxation laws, environmental laws or the application of existing laws could also have a material effect on Santos.
• A number of Santos’ interests are located within areas which are the subject of one or more claims or applications for native title determination. In Australia, compliance with the requirements of the Native Title Act 1993 (Cth) can delay the grant of mineral and petroleum tenements and consequently impact generally the timing of exploration, development and production operations.
• Santos continually monitors legislative and regulatory developments and engages appropriately with legislative and regulatory bodies to manage this risk.
Litigation risks
• The nature of Santos’ business means that it is likely to be involved in litigation or regulatory actions arising from a wide range of matters. Santos may also be involved in investigations, inquiries or disputes, debt recoveries, commercial and contractual disputes, native title claims, land tenure and access disputes, environmental claims or occupational health and safety claims. Any of these claims or actions could result in delays, increase costs or otherwise adversely impact Santos’ assets and operations, and adversely impact Santos’ financial performance and future financial prospects.
• Santos’ legal team actively monitors and manages potential and actual claims, actions and disputes.
Environmental and safety risks and social licence to operate
• A range of health, safety and environmental risks exists with oil and gas exploration and production activities. Accidents, environmental incidents and real or perceived threats to the environment or the amenity of local communities could result in a loss of the Company’s social licence to operate, leading to delays, disruption or the shut-down of exploration and production activities.
• Santos has a comprehensive environmental, health and safety management system to mitigate the risk of incidents. The Company also has highly informed and dedicated community affairs teams who engage with local communities to ensure that issues are understood and addressed appropriately.
Joint venture arrangements
• Santos’ business is carried out through joint ventures. The use of joint ventures is common in the exploration and production industry and serves to mitigate the risk and associated cost of exploration, production and operational failure. However, failure of agreement or alignment with joint venture partners or the failure of third party joint venture operators could have a material effect on Santos’ business. The failure of joint venture partners to meet their commitments and share costs and liabilities can result in increased costs to Santos.
• Santos works closely with its joint venture partners in order to reduce the risk of misalignment in joint venture activities.
For
per
sona
l use
onl
y

30 / Santos Annual Report 2015
Directors’ Report
Financial risks
• Foreign currency risk
Santos is exposed to foreign currency risk principally through the sale of products denominated in US dollars, borrowings denominated in US dollars and Euros and foreign currency capital and operating expenditure.
• Credit risk
Credit risk for Santos represents a potential financial loss if counterparties fail to perform as contracted, and arises from investments in cash and cash equivalents, derivative financial instruments and deposits with banks and financial institutions, as well as credit exposures to customers including outstanding receivables and committed transactions.
• Access to capital and liquidity
Santos’ business and, in particular, the development of large-scale projects, relies on access to debt and equity financing. The ability to secure financing, or financing on acceptable terms may be adversely affected by volatility in the financial markets, globally or affecting a particular geographic region, industry or economic sector, or by a downgrade in its credit rating.
Santos’ overall financial risk management strategy is to seek to ensure that Santos is able to fund its corporate objectives and meet its obligations to stakeholders. Financial risk management is carried out by a central treasury department which operates under Board-approved policies. The policies govern the framework and principles for overall financial risk management and covers specific financial risks, such as foreign exchange risk, interest rate risk and credit risk, approved derivative and non-derivative financial instruments, and liquidity management.
Material prejudice
As permitted by sections 299(3) and 299A(3) of the Corporations Act 2001, Santos has omitted some information from the above Operating and Financial Review in relation to the Company’s business strategy, future prospects and likely developments in operations and the expected results of those operations in future financial years on the basis that such information, if disclosed, would be likely to result in unreasonable prejudice (for example, because the information is premature, commercially sensitive, confidential or could give a third party a commercial advantage). The omitted information typically relates to internal budgets, forecasts and estimates, details of the business strategy, and contractual pricing.
Forward looking statements
This report contains forward-looking statements, including statements of current intention, opinion and predictions regarding the Company’s present and future operations, possible future events and future financial prospects. While these statements reflect expectations at the date of this report, they are, by their nature, not certain and are susceptible to change. Santos makes no representation, assurance or guarantee as to the accuracy or likelihood of fulfilling of any such forward-looking statements (whether express or implied) and, except as required by applicable law or the ASX Listing Rules, disclaims any obligation or undertaking to publicly update such forward-looking statements.
SIGNIFICANT CHANGES IN THE STATE OF AFFAIRS
The Directors consider that matters or circumstances that have significantly affected, or may significantly affect, the operations, results of operations or the state of affairs of the Company in subsequent financial years are as follows:
Oil prices
Between June 2014 and the end of 2015, the Brent Crude oil price deteriorated by 68% from US$112 to US$36 per barrel. Despite significant cuts to capital expenditure budgets by oil and gas companies around the globe, in 2016 markets remain concerned that the continued growth in crude inventories, the easing of international sanctions on oil exports from Iran and weaker than expected growth in China will continue to exert downward pressure on the price of crude oil.
Over the course of 2015 Santos cut capital expenditure by 54%, made the difficult decision to reduce our headcount by over 800 positions across the Company resulting in targeted gross labour cost savings of $160 million per annum and delivered a further $230 million in gross savings across the supply chain. Santos will continue to focus on reducing operating costs and driving productivity gains so that the Company is well placed to operate profitably and sustainably in a low oil price environment.
Directors’ Reportcontinued
For
per
sona
l use
onl
y

Santos Annual Report 2015 / 31
Dividends
On 19 February 2016, the Directors resolved to pay a fully franked final dividend of 5 cents per fully paid ordinary share on 30 March 2016 to shareholders registered in the books of the Company at the close of business on 26 February 2016 (“Record Date”). This final dividend amounts to approximately $88 million. The Board also resolved that the Santos Dividend Reinvestment Plan (“DRP”) will continue to be in operation for this dividend. Shares issued under the DRP will be allocated at the arithmetic average of the daily volume weighted-average market price over a period of seven business days commencing on the second business day after the Record Date less a 1.5% discount. The last date to elect to participate in the DRP is 29 February 2016.
A fully franked final dividend of $148 million (15 cents per fully paid ordinary share) was paid on 25 March 2015 in respect of the year ended 31 December 2014, as disclosed in the 2014 Annual Report. In addition, a fully franked interim dividend of $150 million (15 cents per fully paid ordinary share) was paid to members on 30 September 2015. The DRP was in operation for both of these dividends and shares were allocated based on the DRP issue price that was advised to the market for each dividend.
Environmental regulation
The consolidated entity’s Australian operations are subject to various environmental regulations under Commonwealth, State and Territory legislation. Applicable legislation and requisite environmental licences are specified in the consolidated entity’s EHS Compliance Database, which forms part of the consolidated entity’s overall Environmental Management System. Compliance performance is monitored on a regular basis and in various forms, including environmental audits conducted by regulatory authorities and by the Company, either through internal or external resources.
In 2015, the consolidated entity received $34,155 in fines relating to three Infringement Notices issued pursuant to the Environmental Protection Act 1994 (Qld). The consolidated entity undertook corrective measures in respect of the infringements to prevent re-occurrences.
POST BALANCE DATE EVENTS
Except as mentioned below or elsewhere in this report, in the opinion of the Directors there has not arisen, in the interval between the end of the financial year and the date of this report, any matter or circumstance that has significantly affected or may significantly affect the operations of the consolidated entity, the results of those operations, or the state of affairs of the consolidated entity in future financial years.
On 19 February 2016, the Directors of Santos Limited declared a final dividend on ordinary shares in respect of the 2015 financial year. The dividend has not been provided for in the 31 December 2015 financial statements. Refer to note 2.6 of the financial statements for dividends declared after 31 December 2015.
SHARES UNDER OPTION AND UNVESTED SHARE ACQUISITION RIGHTS
Options
Unissued ordinary shares of Santos Limited under option at the date of this report are as follows:
Date options granted Expiry date Issue price of shares1 Number of options
24 October 2006 24 October 2016 $10.48 263,300
4 May 2006 3 May 2016 $11.36 2,500,000
1 July 2007 30 June 2017 $14.14 203,900
1 July 2007 30 June 2017 $14.14 47,400
3 September 2007 2 September 2017 $12.81 100,000
3 May 2008 2 May 2018 $15.39 447,540
3 May 2008 2 May 2018 $15.39 227,951
28 July 2008 27 July 2018 $17.36 81,948
02 March 2009 2 March 2019 $14.81 50,549
3,922,588
1 This is the exercise price payable by the option holder.
Options do not confer an entitlement to participate in a bonus or rights issue, prior to the exercise of the option.
For
per
sona
l use
onl
y

32 / Santos Annual Report 2015
Directors’ Report
Unvested SARs
Unissued ordinary shares of Santos Limited under unvested SARs at the date of this report are as follows:
Date SARs grantedNumber of shares under
unvested SARs
3 May 2012 205,339
6 March 2013 20,829
1 July 2013 321,702
21 January 2014 27,378
7 March 2014 2,921,580
1 July 2014 386,917
6 March 2015 2,419,795
28 July 2015 805,361
10 February 2016 333,822
7,442,723
No amount is payable on the vesting of SARs. SARs do not confer an entitlement to participate in a bonus or rights issue, prior to the vesting of the SAR. Further details regarding the SARs (including when they will lapse) are contained in the Remuneration Report commencing on page 36 of this report and in note 7.2 to the financial statements.
SHARES ISSUED ON THE EXERCISE OF OPTIONS AND ON THE VESTING OF SARS
Options
No options were exercised during the year ended 31 December 2015 or up to the date of this report.
Vested SARs
The following ordinary shares of Santos Limited were issued during the year ended 31 December 2015 on the vesting of SARs granted under the Santos Employee Equity Incentive Plan (“SEEIP”) (formerly known as the Santos Employee Share Purchase Plan (“SESAP”)) and ShareMatch Plan (“ShareMatch”). No amount is payable on the vesting of SARs and accordingly no amounts are unpaid on any of the shares.
Date SARs granted Number of shares issued
15 May 2013 15,127
2 July 2012 381,569
3 January 2013 45,378
1 July 2013 70,619
21 January 2014 3,932
1 July 2014 74,560
28 July 2015 20,433
611,618
Since 31 December 2015, the following ordinary shares of Santos Limited have been issued on the vesting of SARs granted under the SEEIP and ShareMatch.
Date SARs granted Number of shares issued
1 July 2013 4,201
1 July 2014 4,822
28 July 2015 8,576
17,599
Directors’ Reportcontinued
For
per
sona
l use
onl
y

Santos Annual Report 2015 / 33
DIRECTORS’ AND SENIOR EXECUTIVES’ REMUNERATION
Details of the Company’s remuneration policies and the nature and amount of the remuneration of the Directors and senior management (including shares, options and SARs granted during the financial year) are set out in the Remuneration Report commencing on page 36 of this report and in note 7.2 to the financial statements.
For
per
sona
l use
onl
y

Directors’ Report
34 / Santos Annual Report 2015
Remuneration in brief
This section is in addition to the Remuneration Report on pages 36 to 53. This section therefore does not form part of the audited Remuneration Report. It provides additional information in relation to the amount of remuneration paid to the Company’s former Managing Director and Chief Executive Officer (“CEO”), David Knox, and Senior Executives during 2015. The Company has chosen to do this so that investors have the benefit of this information in addition to the Remuneration Report on pages 36 to 53, which has been prepared in accordance with statutory requirements and accounting standards.
RESPONSE TO THE GLOBAL OIL PRICE ENVIRONMENT
Despite strong operational performance during 2015, including the shipment of GLNG’s first cargo on 16 October 2015 with a total of seven LNG cargoes shipped during the year and annual production of 57.7 mmboe being the highest since 2007, the Company’s share price fell sharply, in line with the severe fall in the global Brent Crude oil price. The Company has responded by repositioning the business for a low oil price environment, including cutting capital expenditure by 54% over the course of 2015 and driving down unit production costs by 10%.
The Company’s ongoing response to the low oil price environment included:
Frozen pay Total Fixed Remuneration comprising base pay and superannuation (“TFR”) remained fixed at 2014 levels. No pay rises were awarded except where on account of a change in role or responsibilities, or other appropriate circumstances.
Zero CEO & CFO STI Both the CEO and Chief Financial Officer (“CFO”) declined to receive any Short-Term Incentive (“STI”) award in respect of 2015.
Reduced STI
and
Zero cash STI
Although the scorecard result would have resulted in 50% – 70% of maximum payout, the Board exercised its discretion so that Senior Executives did not receive any payout from the Company scorecard, except for the Environmental, Safety and Sustainability components. This reflects the importance the Company places on these targets.
As a result, Senior Executives received a significantly reduced STI award of between 22% and 42% of maximum.
In addition, any STI award received by Senior Executives will be deferred into equity for two years. No cash STI was paid to any Senior Executives.
Nil LTI vesting None of the Long-Term Incentives (“LTI”) granted to the CEO and Senior Executives vested.
Zero Director fee increase Fees paid to non-executive Directors (“NED”) have remained fixed since October 2013.
For
per
sona
l use
onl
y

Santos Annual Report 2015 / 35
ACTUALLY REALISED REMUNERATION
The table below shows remuneration “actually realised” by the CEO and Senior Executives in relation to 2015, namely, cash payments on account of TFR, cash STI awards earned in respect of 2015 performance and Share Acquisition Rights (“SARs”) granted as part of the LTI program, only if they vest, valued on the basis of their closing price on the date of vesting.
These amounts differ from the amounts reported in the Remuneration Report which are prepared in accordance with the Corporations Act 2001 (Cth) (“Corporations Act”) and Accounting Standards. This is because the Accounting Standards require a value to be placed on “share based payments” at the time of grant, and for that “accounting value” to be reported as remuneration, even though the CEO and Senior Executives may ultimately NOT realise any actual value from the “share based payments” (e.g. because the performance conditions are not satisfied, as was the case for the 2013–2015 Total Shareholder Return LTI award tested at the end of 2015).
Annual, long service and other leave entitlements are not included in the table below.
Actually realised remuneration (unaudited and non-IFRS)
Year TFR1 Cash STI2 LTI3 Other4 Total
$ $ $ $ $
D Knox5 2015 2,421,787 – 302,4876 – 2,724,274
MD and CEO 2014 2,421,787 983,200 – – 3,404,987
J Anderson 2015 712,016 – – 45,000 757,016
Vice President (“VP”) Asia and Western Australia & Northern Territory (“WA&NT”)
2014 706,830 241,500 86,226 45,000 1,079,556
J Baulderstone7 2015 775,137 – – 17,720 792,857
VP Corporate Development 2014 768,947 253,700 92,694 26,131 1,141,472
T Brown 2015 724,914 – – 1,477 726,391
VP Queensland 2014 718,786 280,400 84,350 17,720 1,101,256
A Seaton 2015 770,752 – – – 770,752
CFO 2014 764,596 256,800 72,338 – 1,093,734
B Woods8 2015 561,167 – – 9,804 570,971
VP Eastern Australia 2014 N/A N/A N/A N/A N/A
1 TFR comprises base salary and superannuation. There were no TFR increases in 2015 except in relation to Mr Woods (see note 8 below). The slight increase in TFR in 2015 from 2014 reflects the first three months of 2014 being at the lower 2013 levels, as the 2014 TFR increase was effective from April 2014.
2 Senior Executives (with the exception of the CEO and CFO, who both declined to receive any STI) will receive their STI payout as deferred equity, subject to a two-year service-based period. They did not receive any STI in cash.
3 No LTI vested in 2015. The LTI which vested in 2014 related to the last of the service-based SARs which were awarded in 2011. For the value of share-based payments calculated in accordance with the Accounting Standards, see Table 6 “2014 and 2015 Senior Executive remuneration details” on page 45.
4 “Other” comprises ad hoc payments treated as remuneration, such as assignment and mobilisation allowances.
5 Although Mr Knox ceased to be a KMP on 12 November 2015 when he stepped down as CEO (as announced to the ASX on 9 November 2015), his TFR for the entire year is included here for the purpose of comparison. The figures in this table do not include Mr Knox’s termination payments, details of which are set out on page 41.
6 Mr Knox’s 2012 Strategic Grant was assessed for performance and resulted in 88,706 shares vesting (see Table 3 on page 41 for details). The amount reflected is based on the closing share price of $3.41 on 16 February 2016, the date the Board assessed and confirmed the final vesting outcome. This value may not reflect his actual benefit received when the shares are issued to Mr Knox later in February 2016.
7 Mr Baulderstone ceased to be a KMP on 2 August 2015 upon accepting the new role of VP Corporate Development. Although Mr Baulderstone was a KMP for only part of the year, his remuneration for the entire year is included for the purpose of comparison.
8 Mr Woods became a KMP on 3 August 2015 when he was appointed to the role of VP Eastern Australia Business Unit. Mr Woods was formerly General Manager WA&NT and received a pay increase in relation to the new appointment. Although Mr Woods was a KMP for only part of the year, his remuneration for the entire year is included. 2014 details are not shown as he was not a KMP at that time.
The total remuneration amounts determined in accordance with the requirements of the Corporations Act and Accounting Standards are set out in Table 6 “2014 and 2015 Senior Executive remuneration details” (see page 45).
For
per
sona
l use
onl
y

Directors’ Report
36 / Santos Annual Report 2015
Remuneration Report
The Directors of Santos Limited (referred to as the “Company” or “Santos”) present this Remuneration Report for the consolidated entity for the year ended 31 December 2015. The information provided in this Report has been audited as required by section 308(3C) of the Corporations Act 2001 (Cth) (“Corporations Act”) and forms part of the Directors’ Report.
The Remuneration Report outlines the Company’s key remuneration activities in 2015 and remuneration information pertaining to the Company’s Directors, former Managing Director and Chief Executive Officer (“CEO”) David Knox and Senior Executives who are the key management personnel (“KMP”) of the consolidated entity for the purposes of the Corporations Act and the Accounting Standards.
REMUNERATION POLICY
The diagram below shows the key objectives of Santos’ Remuneration Policy and how these are implemented through the Company’s remuneration framework.
Attracting and retaining talented and qualified executives
Encouraging executives to strive for superior performance
Aligning executive and shareholder interests
• Remuneration levels are market-aligned against similar roles in comparable companies.
• A significant component of remuneration is “at risk” under short-term and long-term incentive plans. Value to the executive is dependent on meeting challenging targets.
• Short-term incentives are aligned to key performance milestones including safety, environment, production, cashflow, project delivery and reserves development.
• Long-term incentives and deferred short-term incentives are delivered through equity instruments linked to Santos ordinary shares.
• Vesting of performance-based long-term incentives are contingent on Santos’ performance relative to the ASX100 and the S&P Global 1200 Energy Index as measured by the relative total shareholder return at the end of the four-year performance period.
• Long-term incentives and deferred short-term incentives are “at risk” and executives cannot hedge equity instruments that are unvested or subject to restrictions. These incentives are also subject to “clawback”.
REMUNERATION GOVERNANCE
People and Remuneration Committee
The People and Remuneration Committee (“Committee”) oversees and formulates recommendations to the Board on the remuneration policies and practices of the Company generally, including the remuneration of non-executive Directors, the CEO and Senior Executives.
External advisors and remuneration advice
In performing their roles, the Board and the Committee directly commission and receive information, advice and recommendations from independent external advisors. This assists the Directors to make informed decisions when considering the Company’s remuneration policies and practices. The Board has adopted a protocol to formally record the process for engaging and seeking advice from remuneration consultants, which ensures remuneration recommendations in relation to KMPs are free from undue influence by management.
During 2015, the Company engaged 3 degrees consulting to provide remuneration recommendations as defined under the Corporations Act in relation to CEO and Senior Executive remuneration levels. 3 degrees consulting was paid $39,750 for these services.
The Board is satisfied that this advice received from 3 degrees consulting was made free from undue influence from the KMP to whom the recommendations relate as 3 degrees consulting was engaged by, and reported directly to, the Chair of the Committee.
For
per
sona
l use
onl
y

Santos Annual Report 2015 / 37
In this regard, in addition to adhering to Board-approved protocols, 3 degrees consulting provided a formal declaration to the Chair of the Committee.
In addition to providing remuneration recommendations, 3 degrees consulting provided market practice data and advice on other aspects of the Company’s remuneration framework throughout the year, including legal and stakeholder communications. 3 degrees consulting also provides CEO and non-executive Director search and succession planning services. The Company engaged these services in relation to the appointment of non-executive Director, Yasmin Allen, in late 2014, and in relation to the search for the new CEO, Kevin Gallagher, in late 2015. Together, for these additional remuneration related and search services, 3 degrees consulting was paid $342,451.
REMUNERATION FRAMEWORK
Benchmarking
Total Fixed Remuneration comprising base pay and superannuation (“TFR”), Short-Term Incentives (“STI”) and Long-Term Incentives (“LTI”) are set by reference to market comparable data in order to ensure that the Company is competitive and able to attract and retain the skills it needs for business operations and project delivery. In relation to Senior Executives, the Company references remuneration levels for similar roles in a benchmarking group comprised of peer companies in the oil and gas sector, and closely related mining and engineering sectors.
At risk remuneration
STI (“at risk” because the amount earned (if any) depends on the extent to which targets are met)
The Company sets a range of short-term operational and financial targets to be achieved annually. These are chosen to encourage outcomes and behaviours that support the safe operation and delivery of the base business while pursuing long-term growth in shareholder value, and are reviewed annually by the Board. Table 1 on page 38 outlines the short-term objectives used in 2015 to measure performance for STI purposes and the reasons why these objectives were chosen.
The Company’s policy is to deliver part of any STI award for the CEO and Senior Executives into “Deferred STI shares”. These are ordinary shares or SARs that will only vest at the end of a two-year deferral period. If a Senior Executive resigns during this period, they will ordinarily forfeit their Deferred STI shares. This promotes a focus on long-term performance as the value of the shares is linked to the ongoing performance of the Company.
Further details are provided in relation to the STI program on page 52.
LTI (“at risk” because the amount earned (if any) depends on the extent to which vesting conditions are met)
In order to align the interests of executives with the creation of long-term shareholder value, the Company awards SARs. The SARs are granted at no cost, however only vest if the Company’s relative Total Shareholder Return (“TSR”) over a four year performance period is in the 51st percentile or more against a comparator group comprised of companies in the ASX 100 and S&P Global Energy Index (“GEI”).
Prior to 2014, the performance period was three years and the comparator group comprised companies in the ASX 100 only.
Further details are provided in relation to the LTI program on page 53.
Clawback
The share plan rules give the Company the discretion to lapse or forfeit unvested LTI and deferred STI awards as well as claw back any vested shares or cash paid in certain circumstances. These include dishonest or fraudulent conduct, breach of material obligations, miscalculation or error, a material misstatement or omission in the accounts of a group company or events which require re-statement of the group’s financial accounts in circumstances where an LTI or deferred STI award would not otherwise have been granted or would not have vested. This is in addition to any rights the Company has under the plan rules and general legal principles to seek to recover payments made in error.
For
per
sona
l use
onl
y

Directors’ Report
38 / Santos Annual Report 2015
Remuneration Reportcontinued
Link between performance and remuneration
STI
The Company’s performance against the 2015 STI scorecard as assessed by the Board resulted in a score of 67%. The table below summarises the short-term objectives in the scorecard, their rationale and the Company’s performance against them.
Table 1: 2015 STI scorecard performance
STI measure Rationale Performance Score
Personnel safety
Measured by the number of Lost-Time Injuries per million hours worked.
Process safety
Measured by the number of Tier 1 incidents of loss of containment of hydrocarbons and the level of Safety Critical Maintenance performed on plant and equipment in enclosed and open areas.
Environmental incidents
Measured by the number of environmental incidents of moderate or greater consequence.
Sustainability
Measured by the Company’s performance as assessed by the Dow Jones Sustainability Index.
The Company takes safety and the environment very seriously. The integrated targets represent the Company’s holistic approach aimed at reducing the number of injuries to employees and contractors, the likelihood of low-frequency but high-impact incidents such as fires and explosions and the incidence of significant environmental incidents.
The Company also recognises the increasing importance that investors and other stakeholders are placing on Corporate Social Responsibility performance. The Dow Jones Sustainability Indices serve as benchmarks for investors who integrate sustainability considerations into their portfolios. The world’s largest 3,400 companies are invited to take part in the annual Corporate Sustainability Assessment.
Santos’ safety record in 2015 exceeded all targets with a Lost Time Injury Frequency Rate of 0.12, Safety Critical Maintenance of 99%, no environmental incidents of moderate or greater consequence and a Dow Jones Sustainability Index score of 72, which puts the Company in the top 10% of the Index.
19.7%
Production Production is critical to the Company’s profitability, which is a key measure of the Company’s overall performance and underpins annual earnings and cash flow for distribution to shareholders and for re-investment for future growth.
Production of 57.7 mmboe, the highest annual production since 2007, was slightly below target.
31.3%
Operating cash flow Operating cash flow was introduced to ensure a focus on liquidity in 2015 against a backdrop of a declining oil price and its impact on revenue and cash inflows.
Operating cash flow of $1,094 million was slightly below target.
EH
S (
20%
)F
inan
cial
an
d o
per
atio
nal
(4
5%
)F
or p
erso
nal u
se o
nly

Santos Annual Report 2015 / 39
STI measure Rationale Performance Score
Project delivery
Progress against milestones in key projects (including GLNG) are identified and measured.
Reserves Replacement & Resource Add
The volume of proven and probable (2P) reserves and contingent resources (2C) added by the Company organically (through exploration and exploitation efforts as opposed to acquisitions) compared to the volume of reserves used in the current year’s production.
Project delivery underpins the future production, growth and profitability of the Company. In the current climate of rising costs and large capital expenditure commitments, it is essential that the Company delivers its long-term projects on time and within budget to achieve future production.
The Company’s ability to replace the reserves it uses in production and to convert contingent resources into proven and probable reserves is critical to the long-term future of the Company.
GLNG delivered on several major milestones in 2015 including completion of LNG Train 1 on schedule and within budget, delivery of 7 LNG cargoes and commencement of LNG Train 2 commissioning.
The 2P reserves replacement and 2C resources growth targets were not achieved.
15.7%
Other Value Add
To capture any other achievements which were not covered by the rest of the specific objectives.
In order to incentivise and reward high performance which may not be captured in the scorecard.
Having regard to the loss in shareholder value due to the global oil price decline, it was not appropriate to allocate any score for this item.
0%
Total 67%
Gro
wth
(3
0%
)O
ther
Val
ue
Ad
d (
5%
)
For
per
sona
l use
onl
y

Directors’ Report
40 / Santos Annual Report 2015
Remuneration Reportcontinued
LTI
The Company’s TSR for the period 1 January 2013 to 31 December 2015 ranked below the 51st percentile in the comparator group comprised of the companies in the ASX 100. As a result, none of the SARs granted to the CEO and Senior Executives as part of the 2013–2015 LTI grant vested. This reflects the alignment of the Company’s LTI program with the interests and long-term returns of shareholders.
More details about how performance targets are set and tested for the purposes of STI and LTI awards are set out in the section “Detailed Information about Linking Company Performance to Incentives” on pages 52 and 53.
Table 2 sets out the Company’s performance over the past five years in respect of several key financial and non-financial indicators and the STI and LTI awards during this period.
Table 2: Key metrics of company performance 2011–2015
2011 2012 2013 2014 2015
Injury frequency:
total recordable case frequency rate 3.3 5.0 3.8 3.5 2.8
lost time injury frequency rate 1.2 0.7 0.6 0.7 0.1
Production (mmboe) 47.2 52.1 51.0 54.1 57.7
Reserve replacement rate – 2P organic (%) 173 136 3 0 0
Net profit/(loss) after tax ($m) 751 518 516 (935) (2,698)
Dividends per ordinary share (cents) 30 30 30 35 20
Share price – closing price on first trading day of year $13.19 $12.34 $11.11 $14.63 $8.251
LTI performance (% vesting) – shown against final year of performance period 0% 0% 0% 0% 0%
Average STI paid (% of maximum) 69% 68% 60% 58%2 67%
1 Closing share price at 31 December 2015 was $3.68.
2 Whilst the 2014 company performance result was 78%, the actual STI payout was reduced by the Board to 58%.
For
per
sona
l use
onl
y

Santos Annual Report 2015 / 41
CEO TRANSITION
Mr Knox stepped down as Managing Director and CEO on 12 November 2015 and continued to assist the Company in handover and transitional duties until he ceased employment on 31 December 2015. This section provides details of Mr Knox’s remuneration during the year, the outcomes of the Strategic Grant awarded in 2012 and his termination arrangements.
Santos’ new Managing Director and CEO, Mr Kevin Gallagher, commenced employment on 1 February 2016. Details of Mr Gallagher’s remuneration and other contractual arrangements are outlined in an announcement that was made to the ASX on 9 November 2015.
During the transition period from August 2015 until the commencement of Mr Gallagher, the Chair of the Board, Mr Peter Coates, held the temporary position of Executive Chairman. Details of Mr Coates’ remuneration are provided in Table 12 on page 48.
Remuneration during the year for former CEO Mr Knox
Mr Knox’s TFR did not change during 2015 and he declined to receive any STI. No LTI vested in 2015.
In accordance with the approval of shareholders at the 2015 AGM, Mr Knox received an LTI grant in 2015 with a performance period from 1 January 2015 to 31 December 2018.
2012–2015 Strategic Grant
As approved by shareholders at the AGM held on 3 May 2012, Mr Knox received a Strategic Grant of SARs in 2012, the vesting of which was conditional upon the achievement of performance conditions over the period 1 January 2012 to 31 December 2015. Mr Knox achieved a result of 43% of the maximum total SARs available from the Strategic Grant (57% of maximum forfeited). The key details and outcomes of the Strategic Grant are set out in Table 3 below.
Table 3: Former CEO Strategic Grant 2012–2015
TARGETSNO OF SARS
IN EACH TRANCHE
VESTING PARAMETERS PERFORMANCE
NUMBER AND % OF SHARES
TO VEST FROM EACH TRANCHE
GLNG START-UP 41,068 100% if first cargo by 30 June 2015 0% if first cargo on 31 March 2016
16-Oct-15 25,051 (61%)
GLNG CAPEX (TO END 2015)
41,068 Although the actual capital expenditure was within the US$18.5bn budget, the Board exercised discretion to lapse this tranche in full.
PRODUCTION (BY END 2015)
41,068 100% if 77 mmboe 0% if 70 mmboe
57.7 mmboe 0
R/P RATIO* (AT END 2015)
41,068 100% for R/P ratio of 18 years 0% for R/P ratio of 12 years
17.4 years 36,961 (90%)
OPERATIONAL INTEGRITY (AVERAGE EHS SCORE OVER 2012–2015)
41,067 100% vesting for average score of 90% 0% vesting for average score of 70%
83% average score
26,694 (65%)
TOTAL 205,339 88,706 (43%)
* R/P ratio refers to Organic Reserves / Production ratio calculated by dividing 2P Reserves at the end of 2015, excluding acquisitions and divestments, by total production in 2015.
Termination arrangements
In accordance with the service agreement between the Company and Mr Knox, the shareholder approval obtained at the 2012 AGM and the STI and LTI Plan Rules, the following termination arrangements were agreed with Mr Knox:
• a separation payment equivalent to 12 months of TFR of $2,421,787;
• a payment for accrued but untaken annual leave, pro-rata long service leave and any other statutory entitlements of $749,864;
• the restrictions on his previously earned Deferred STI shares from the 2014 award were lifted; and
• a pro-rata portion of his unvested LTI from the 2014 and 2015 grants will remain on foot until the expiry of the relevant performance periods when they will be tested against the relevant performance conditions.
For
per
sona
l use
onl
y

Directors’ Report
42 / Santos Annual Report 2015
Remuneration Reportcontinued
SENIOR EXECUTIVE REMUNERATION
Overview of 2015 earnings
Fixed remuneration
What was the increase in Senior Executives’ TFR?
Nil. Senior Executives’ TFR was frozen at 2014 levels.
Mr Woods received a TFR increase on his appointment to the role of VP Eastern Australian Business Unit.
Short-term incentives
What was the maximum STI Senior Executives could receive?
Between 70% and 85% of TFR.
How were STI payments calculated?
Company performance against overall corporate scorecard (60%)
To promote collaboration among Senior Executives and to focus their efforts towards the overall benefit of the Company, 60% of their STI is based on Company performance against the overall Corporate scorecard (see Table 1 on page 38).
The Company’s performance against the 2015 STI scorecard as assessed by the Board resulted in a score of 67%. However, in light of the decline in the share price and loss of shareholder value, the Board exercised its discretion so that Senior Executives did not receive any payment from the Company scorecard, except the Environmental, Safety and Sustainability components. This reflects the importance the Company places on these targets.
Individual performance against specific targets (40%)
The remaining 40% is based on each executive’s individual performance against business, operational, financial and qualitative objectives such as specific safety, environmental, production and profitability targets as well as leadership, staff development and other strategic measures in relation to their own business units or areas of responsibility.
How was performance assessed for STI purposes?
Company performance against the overall corporate scorecard was assessed by the Committee and the Board.
Senior Executives’ performance against individual targets was assessed by the Executive Chairman, and reviewed and endorsed by the Committee.
How much STI will Senior Executives receive in respect of 2015 performance?
Although the Company performance score would have resulted in an award of 50% to 70% of maximum payout, the Board exercised its discretion to reduce STI awards made to Senior Executives in respect of 2015 performance so that they ranged from 22% to 42% of maximum (see Table 6 on page 45). This compares to 55% to 65% of maximum awarded in respect of 2014.
The difference between the actual STI award and maximum STI potential will not be carried forward.
Long-term incentives
How much LTI was granted to Senior Executives in 2015?
In 2015, all Senior Executives received an LTI award equivalent to between 50% and 60% of TFR for a four-year performance period ending on 31 December 2018.
What are the performance conditions?
Vesting is based on the Company’s relative TSR performance over the relevant performance period. The comparator group for 75% of each grant is the ASX 100 and the comparator group for the remaining 25% is the S&P GEI. See the vesting schedule provided in the section “Detailed Information about Linking Company Performance to Incentives” on pages 52 and 53.
What proportion of prior year LTI grants vested in 2015?
Nil.
The testing of the 2013 LTI grant with a performance period 1 January 2013 to 31 December 2015 occurred in early 2016. As the performance hurdle was not achieved, there was no vesting of the grant and this was forfeited.
Further details for each individual Senior Executive’s remuneration are provided in Table 6 “2014 and 2015 Senior Executive remuneration details” on page 45.
For
per
sona
l use
onl
y

Santos Annual Report 2015 / 43
Service agreements and termination entitlements
The Company has entered into service agreements with the Senior Executives. For all existing Senior Executives, the service agreements are ongoing until termination by the Company upon giving between 6 and 12 months’ notice, or by the Senior Executive giving 6 months’ notice. In a Company-initiated termination, the Company may make a payment in lieu of notice equivalent to the TFR that the Senior Executive would have received over the notice period. All Senior Executives’ service agreements may be terminated immediately for cause, whereupon no payments in lieu of notice or other termination payments are payable under the agreement.
AT RISK REMUNERATION SUMMARY
At risk remuneration
A higher proportion of the CEO’s total remuneration package is “at risk” relative to that of the Senior Executives because the CEO has the greatest scope to personally influence the Company’s performance.
Table 4: Relative weightings of remuneration components for CEO and Senior Executives1
At Risk Remuneration
Fixed remuneration
STI2 LTI Total “at risk”
Total
CEO 2015 33.33% 33.33% 33.33% 66.66% 100%
2014 33.33% 33.33% 33.33% 66.66% 100%
Senior Executives 2015 40.80% 34.70% 24.50% 59.20% 100%
2014 40.80% 34.70% 24.50% 59.20% 100%
1 These figures do not reflect the actual relative value derived by the Executive from each of the components, which is dependent on actual performance against targets for the “at risk” components. The figures represent maximum potential of each component.
2 Also includes deferred STI component.
NON-EXECUTIVE DIRECTOR REMUNERATION
Remuneration Policy
The diagram below shows the key objectives of Santos’ non-executive Director Remuneration Policy and how these are implemented through the Company’s remuneration framework.
Securing and retaining talented, qualified Directors
Promoting independence and impartiality
Aligning Director and shareholder interests
Fee levels are set with regard to:
• time commitment and workload;
• the risk and responsibility attached to the role;
• experience and expertise; and
• market benchmarking.
• Fee levels do not vary according to the performance of the Company or individual Director performance from year to year.
• Santos encourages its non-executive Directors to build a long-term stake in the Company and established a Minimum Shareholding Requirement of 15,000 shares for all non-executive Directors within three-years.
• Non-executive Directors can acquire shares through acquisition on market during trading windows and/or through the non-executive Director Share Plan.
For
per
sona
l use
onl
y

Directors’ Report
44 / Santos Annual Report 2015
Remuneration Reportcontinued
Maximum aggregate amount
Total fees paid to all non-executive Directors in a year, including Board Committee fees, must not exceed $2,600,000, being the amount approved by shareholders at the 2013 AGM.
Directors may also be paid additional fees for special duties or exertions, and are entitled to be reimbursed for all business-related expenses.
Remuneration
There have been no increases in non-executive Director fees since October 2013.
As announced to the market on 7 September 2015, Peter Coates received an additional special duties and exertions fee of $45,000 a month inclusive of superannuation. This fee related to his additional responsibilities as Executive Chairman from 24 August 2015 to 31 January 2016 and was not paid out of the aggregate non-executive Director fee pool.
Remuneration details for the non-executive Directors are provided in Table 12 “2014 and 2015 non-executive Director remuneration details” on page 48.
Fee structure
Table 5: Non-executive Directors’ fees per annum1
Chair2 Member
Board $503,550 $167,550
Audit & Risk Committee $42,000 $21,000
Environment, Health, Safety and Sustainability Committee $22,000 $15,000
Finance Committee3 $22,000 $15,000
Nomination Committee4 N/A $10,000
People and Remuneration Committee $30,000 $16,000
1 Fees are shown exclusive of superannuation.
2 The Chair of the Board does not receive any additional fees for serving on or chairing any Board committee. The Chair of the Board is the Chair of the Nomination Committee, in accordance with its Charter.
3 The Finance Committee was discontinued on 1 May 2015.
4 The Chair of the Board is the Chair of the Nomination Committee, in accordance with its Charter.
Superannuation and retirement benefits
Superannuation contributions are made on behalf of non-executive Directors in accordance with the requirements of the Company’s statutory superannuation obligations. Non-executive Directors are not entitled to retirement benefits (other than mandatory statutory entitlements).
For
per
sona
l use
onl
y

Santos Annual Report 2015 / 45
DE
TA
ILE
D R
EM
UN
ER
AT
ION
IN
FO
RM
AT
ION
Tabl
e 6
pres
ents
sum
mar
ised
det
ails
of
the
rem
uner
atio
n fo
r th
e C
EO
and
Sen
ior
Exe
cutiv
es in
201
4 an
d 20
15 a
s re
quire
d un
der
the
Cor
pora
tions
Act
.
Tab
le 6
: 20
14 a
nd
20
15 S
enio
r E
xecu
tive
rem
un
erat
ion
det
ails
Sh
ort
-ter
m e
mp
loye
e b
enefi
tsP
ost-
em
plo
ymen
tS
har
e-b
ased
pay
men
ts1
Bas
e sa
lary
ST
I2O
ther
3
Su
per
ann
uat
ion
co
ntr
ibu
tion
sLT
ID
efer
red
S
TI4
Op
tion
sC
ash
bas
ed
Tota
l sh
are-
bas
ed
pay
men
tsTe
rmin
atio
n
Oth
er
lon
g-t
erm
b
enefi
ts
(lon
g s
ervi
ce)5
Tota
lTo
tal
“at
risk
”
$$
$$
$$
$$
$$
$$
%
DJW
Kno
x620
152,
076,
657
––
22,2
252,
262,
265
229,
987
––
2,49
2,25
22,
421,7
8727
,721
7,0
40,6
4235
%
2014
2,40
3,50
898
3,20
0–
18,2
793,
131,5
4414
3,70
5–
–3,
275,
249
–10
2,46
66,
782,
702
63%
JH A
nder
son
2015
685,
124
–45
,000
26,8
9240
6,62
411
2,11
2–
–51
8,73
6–
4,69
31,
280,
445
41%
2014
688,
551
241,5
0045
,000
18,2
7945
5,98
134
,406
––
490,
387
–19
,483
1,503
,20
049
%
JL B
auld
erst
one7
2015
443,
834
–10
,432
12,4
9626
0,42
446
,969
––
307,
393
–7,
281
781,4
3639
%
2014
750,
668
253,
700
26,13
118
,279
492,
284
36,14
3–
–52
8,42
7–
32,7
901,6
09,
995
49%
TJ B
row
n20
1570
5,86
9–
1,477
19,0
4641
3,41
511
8,90
7–
–53
2,32
2–
7,65
51,
266,
369
42%
2014
700,
507
280,
400
17,7
2018
,279
455,
263
39,9
48–
–49
5,21
1–
20,6
031,5
32,7
2051
%
AJ
Sea
ton
2015
743,
861
––
26,8
9243
9,80
235
,586
––
475,
388
–9,
134
1,25
5,27
538
%
2014
746,
317
256,
800
–18
,279
494,
342
36,5
85–
–53
0,92
7–
20,4
141,5
72,7
375
0%
BK
Woo
ds8
2015
247,
409
–9,
804
12,3
3968
,752
23,6
16–
–92
,368
–6,
158
368,
078
25%
2014
N/A
N/A
N/A
N/A
N/A
N/A
N/A
N/A
N/A
N/A
N/A
N/A
N/A
1 In
acc
orda
nce
with
the
req
uire
men
ts o
f th
e A
ustr
alia
n A
ccou
ntin
g S
tand
ards
Boa
rd, r
emun
erat
ion
incl
udes
a p
ropo
rtio
n of
the
val
ue o
f th
e eq
uity
-lin
ked
com
pens
atio
n de
term
ined
as
at t
he g
rant
dat
e an
d pr
ogre
ssiv
ely
expe
nsed
ove
r th
e ve
stin
g pe
riod.
The
am
ount
allo
cate
d as
rem
uner
atio
n is
not
rel
ativ
e to
or
indi
cativ
e of
the
act
ual b
enefi
t (i
f an
y) t
hat
the
Sen
ior
Exe
cutiv
es m
ay u
ltim
atel
y re
alis
e sh
ould
the
equ
ity in
stru
men
ts v
est.
The
val
ue o
f eq
uity
-lin
ked
com
pens
atio
n w
as
dete
rmin
ed in
acc
orda
nce
with
AA
SB
2 S
hare
-bas
ed P
aym
ents
app
lyin
g th
e M
onte
Car
lo s
imul
atio
n m
etho
d. D
etai
ls o
f th
e as
sum
ptio
ns u
nder
lyin
g th
e va
luat
ion
are
set
out
in n
ote
7.2
to t
he fi
nanc
ial s
tate
men
ts.
2 N
o S
TI w
as p
aid
in c
ash
in 2
015.
3 “O
ther
” co
mpr
ises
ad
hoc
paym
ents
tre
ated
as
rem
uner
atio
n, s
uch
as a
ssig
nmen
t an
d m
obilis
atio
n al
low
ance
.
4 T
his
amou
nt r
epre
sent
s a
prop
ortio
n of
the
est
imat
ed v
alue
of
the
defe
rred
ST
I (S
AR
s or
sha
res)
, det
erm
ined
in a
ccor
danc
e w
ith t
he r
equi
rem
ents
of
AA
SB
2 S
hare
-bas
ed P
aym
ents
and
pro
gres
sive
ly e
xpen
sed
over
a 3
-yea
r ve
stin
g pe
riod
bein
g th
e ye
ar o
f pe
rfor
man
ce a
nd a
2-y
ear
perio
d of
ser
vice
to
whi
ch t
he g
rant
rel
ates
. The
am
ount
allo
cate
d as
rem
uner
atio
n is
not
rel
ativ
e to
or
indi
cativ
e of
the
act
ual b
enefi
t (i
f an
y) t
hat
the
Sen
ior
Exe
cutiv
es m
ay u
ltim
atel
y re
alis
e sh
ould
the
eq
uity
inst
rum
ents
ves
t. T
he v
alue
has
bee
n ca
lcul
ated
in a
ccor
danc
e w
ith A
AS
B 2
Sha
re-b
ased
Pay
men
ts b
ased
on
an e
stim
ate
of t
he f
air
valu
e of
the
equ
ity in
stru
men
ts.
5 “
Oth
er lo
ng-t
erm
ben
efits
” re
pres
ents
the
mov
emen
t in
the
Sen
ior
Exe
cutiv
e’s
long
ser
vice
leav
e en
title
men
ts m
easu
red
as t
he p
rese
nt v
alue
of
the
estim
ated
fut
ure
cash
out
flow
s to
be
mad
e in
res
pect
of
the
Sen
ior
Exe
cutiv
e’s
serv
ice
betw
een
the
resp
ectiv
e re
port
ing
date
s.
6 M
r K
nox
ceas
ed t
o be
a K
MP
on
12 N
ovem
ber
2015
. Fig
ures
sho
wn
for
2015
are
for
the
per
iod
1 Ja
nuar
y 20
15 t
o 12
Nov
embe
r 20
15. M
r K
nox’
s 20
14 d
efer
red
ST
I (de
ferr
ed s
hare
s) a
mor
tisat
ion
expe
nse
have
bee
n ac
cele
rate
d to
refl
ect
his
end
of
cont
ract
dat
e of
31
Dec
embe
r 20
15.
7 M
r B
auld
erst
one
ceas
ed t
o be
a K
MP
on
2 A
ugus
t 20
15. F
igur
es s
how
n fo
r M
r B
auld
erst
one
are
for
the
perio
d 1
Janu
ary
2015
to
2 A
ugus
t 20
15.
8 M
r W
oods
bec
ame
a K
MP
on
3 A
ugus
t 20
15. F
igur
es s
how
n fo
r M
r W
oods
are
for
the
per
iod
3 A
ugus
t 20
15 t
o 31
Dec
embe
r 20
15. M
r W
oods
was
not
a K
MP
in 2
014.
For
per
sona
l use
onl
y

Directors’ Report
46 / Santos Annual Report 2015
Remuneration Reportcontinued
Tables 7 and 8 contains details of the number and value of Deferred Shares and SARs granted, vested and lapsed for Mr Knox in 2015. Mr Knox did not have any options granted, vesting or lapsing in 2015. Mr Knox did not exercise any options in 2015.
Table 7: 2015 SARs outcomes for CEO
Granted Vested Lapsed
NumberMaximum
Value Number2 Value3 Number4
SARs 505,509 2,749,1561 88,706 302,487 (974,018)
1 Maximum value represents the fair value of LTI grants received in 2015 determined in accordance with AASB 2 Share-based Payments. The fair values of the grants as at the grant date of 7 May 2015 were $5.44 and $5.43 (weighted $5.437). Details of the assumptions underlying the valuations are set out in note 7.2 to the financial statements. The minimum total value of the grant, if the applicable vesting conditions are not met, is nil in all cases.
2 Relates to 2012–2015 Strategic Grant as detailed in Table 3.
3 These figures show the value of the 2012–2015 Strategy Grant, using the share price of $3.41 on 16 February 2016, the date the Board assessed and confirmed the final vesting outcome.
4 Remuneration for Mr Knox includes SARs which lapsed after he ceased to be a KMP on 12 November 2015. The number of lapsed SARs includes 116,633 granted during 2012, 243,652 granted during 2013, 234,453 granted during 2014 and 379,280 granted during 2015.
Table 8: 2015 Deferred Share outcomes for CEO
Granted Vested Lapsed
Number1
Maximum Value2 Number3 Value4 Number
Shares 55,520 408,627 55,520 204,314 –
1 The grant relates to the 2014 deferred STI granted on 16 April 2015.
2 Maximum value represents the fair value of 2014 STI grant received in 2015 determined in accordance with AASB 2 Share-based Payments. The fair value of the grant as at the grant date of 16 April 2015 was $7.36.
3 The restrictions on Mr Knox’s 2014 deferred shares were lifted on 31 December 2015, the date he ceased employment with the Company.
4 These figures show the value of the shares deferred which vested on 31 December 2015 at a closing share price of $3.68.
Tables 9 and 10 contains details of the number and value of Deferred Shares and SARs granted, vested and lapsed for Senior Executives in 2015. No Senior Executive had any options granted, vesting or lapsing in 2015. No options were exercised in 2015.
Table 9: 2015 SARs outcomes for Senior Executives
Granted Vested Lapsed
Number1
Maximum Value2 Number Value Number5
JH Anderson 89,186 356,967 – – (42,981)
JL Baulderstone3 97,093 388,615 – – (46,655)
TJ Brown 90,802 363,435 – – (43,548)
AJ Seaton 96,544 386,417 – – (46,392)
BK Woods4 – – – – (10,881)
Total 373,625 1,495,434 – – (190,457)
1 The grant relates to the Senior Executives’ full LTI award for the four year performance period ended on 31 December 2018.
2 Maximum value represents the fair value of LTI grants received in 2015 determined in accordance with AASB 2 Share-based Payments. The fair values of the grants as at the grant date of 16 April 2015 were $4.13 and $3.96 (weighted $4.00). Details of the assumptions underlying the valuations are set out in note 7.2 to the financial statements. The minimum total value of the grant, if the applicable vesting conditions are not met, is nil in all cases.
3 Remuneration for Mr Baulderstone includes SARs which lapsed after he ceased to be a KMP on 2 August 2015.
4 Mr Woods held 105,829 SARs before becoming a KMP however his remuneration is disclosed only as his time as a KMP. His 2013 LTI has 10,881 SARs that lapsed.
5 Lapsed SARs relate to the 2013 LTI grant.
For
per
sona
l use
onl
y

Santos Annual Report 2015 / 47
Table 10: 2015 share outcomes for Senior Executives
Granted Vested Lapsed
Number1
Maximum Value2 Number Value Number
JH Anderson 13,636 100,361 – – –
JL Baulderstone 14,321 105,403 – – –
TJ Brown 15,823 116,457 – – –
AJ Seaton 14,505 106,757 – – –
BK Woods3 – – – – –
Total 58,285 428,978 – – –
1 This relates to the 30% of the 2014 STI award deferred into shares for two years, granted on 16 April 2015.
2 Maximum value represents the fair value of 2014 STI shares received in 2015 determined in accordance with AASB 2 Share-based Payments. The fair value of the grant as at the grant date of 16 April 2015 was $7.36.
3 Remuneration disclosed for Mr Woods is for the period from 3 August 2015 when he became a KMP. None of Mr Woods’ 2014 STI award was deferred as the STI deferral program only applied to KMPs.
Table 11 outlines the LTI grants that were tested or still in progress in 2015.
Table 11: LTI grants
Grant year Grant type Vesting condition(s)Performance/ vesting period Status
2012 CEO Strategy Grant Conditional upon the achievement of strategic performance conditions.
1 January 2012 to 31 December 2015
Testing completed. Resulted in 43% of the grant vesting.
2013 Performance Award Relative TSR performance against ASX 100 companies
1 January 2013 to 31 December 2015
Testing completed. Resulted in 0% of the grant vesting.
2014 Three-year transitionary Performance Award
Relative TSR performance against ASX 100 companies (75%) and S&P GEI (25%)
1 January 2014 to 31 December 2016
In progress.
Four-year Performance Award
Relative TSR performance against ASX 100 companies (75%) and S&P GEI (25%)
1 January 2014 to 31 December 2017
In progress.
2015 Four-year Performance Award
Relative TSR performance against ASX 100 companies (75%) and S&P GEI (25%)
1 January 2015 to 31 December 2018
In progress.
Full details of all grants made prior to 2015 can be found in note 7.2 to the financial statements and in prior Remuneration Reports.
For
per
sona
l use
onl
y

Directors’ Report
48 / Santos Annual Report 2015
Remuneration Reportcontinued
Details of the fees and other benefits paid to non-executive Directors in 2015 are set out in Table 12. No fee increases were received in 2015. Differences in fees received between 2014 and 2015 reflect changes in roles and responsibilities (i.e. Chair or committee appointments) and superannuation payments. No share-based payments were made to any non-executive Directors.
Table 12: 2014 and 2015 non-executive Director remuneration details
Director Short-term benefitsRetirement
benefits
Director Year
Directors’ fees (incl.
committee fees)
Fees for special
duties or exertions Other Superannuation9
Share-based payments Total
$ $ $ $ $ $
YA Allen1 2015 195,289 – – 18,552 – 213,841
2014 35,314 – – 3,355 – 38,669
KC Borda2 2015 166,940 – – 8,620 – 175,560
2014 503,046 – – 18,279 – 521,325
PR Coates3 2015 398,624 175,192 – 35,542 – 609,358
2014 186,517 – – 17,492 – 204,009
KA Dean4 2015 204,780 – – 18,750 – 223,530
2014 213,046 – – 18,279 – 231,325
RA Franklin5 2015 226,768 – – 1,721 – 228,489
2014 222,066 – – 1,259 – 223,325
H Goh6 2015 220,518 – – 807 – 221,325
2014 203,623 – – 786 – 204,409
JS Hemstritch 2015 224,280 – – 19,046 – 243,326
2014 225,046 – – 18,279 – 243,325
GJW Martin7 2015 224,588 – – 19,046 – 243,634
2014 240,046 – – 18,279 – 258,325
SD Sheffield8 2015 189,723 – – 585 – 190,308
2014 166,537 – – 600 – 167,1371 Ms Allen was appointed to the Board in October 2014 and became a member of the Audit & Risk Committee on 1 May 2015.
2 Mr Borda retired as Chair of the Board and a non-executive Director on 30 April 2015.
3 Mr Coates was appointed as the Chair of the Board on 1 May 2015. In addition to his role as Chair of the Board Mr Coates has been acting as the Executive Chairman since 24 August 2015. His remuneration in this Table 12 shows his fees as both the Chair of the Board and the Executive Chairman.
4 Mr Dean ceased to be a member of the Finance Committee when it was discontinued in May 2015.
5 Mr Franklin became a member of the Nomination Committee on 25 June 2015.
6 Mr Goh was appointed to the Audit & Risk Committee in October 2014.
7 Mr Martin is the current Chair of the People and Remuneration Committee. Mr Martin ceased to be the Chair of the Finance Committee when it was discontinued in May 2015.
8 Mr Sheffield was appointed to the Board in February 2014 and was a member of the member of the Finance Committee until May 2015 when it was discontinued.
9 Includes superannuation guarantee payments. Superannuation guarantee payments are made to Mr Franklin, Mr Goh and Mr Sheffield only in relation to days worked in Australia.
For
per
sona
l use
onl
y

Santos Annual Report 2015 / 49
KE
Y M
AN
AG
EM
EN
T P
ER
SO
NN
EL
DIS
CLO
SU
RE
S
(a)
Loan
s to
key
man
agem
ent
per
son
nel
T
here
hav
e be
en n
o lo
ans
mad
e, g
uara
ntee
d or
sec
ured
, dire
ctly
or
indi
rect
ly, b
y th
e C
ompa
ny o
r an
y of
its
subs
idia
ries
at a
ny t
ime
thro
ugho
ut t
he y
ear
to a
ny k
ey
man
agem
ent
pers
on, i
nclu
ding
the
ir re
late
d pa
rty.
(b)
Eq
uit
y h
old
ing
s of
key
man
agem
ent
per
son
nel
O
pti
ons
an
d S
AR
s h
old
ing
s
T
he m
ovem
ent
durin
g th
e re
port
ing
perio
d in
the
num
ber
of o
ptio
ns a
nd S
AR
s ov
er o
rdin
ary
shar
es o
f th
e C
ompa
ny h
eld
dire
ctly
, ind
irect
ly o
r be
nefic
ially
, by
each
key
m
anag
emen
t pe
rson
, inc
ludi
ng t
heir
rela
ted
part
ies,
is a
s fo
llow
s:
Op
enin
g
bal
ance
Gra
nte
d1
Op
tion
s ex
erci
sed
/ ri
gh
ts
vest
ed2
Oth
er
chan
ges
3
Sol
d/
tran
sfer
red
Clo
sin
g
bal
ance
Ves
ted
at
end
of
th
e ye
ar
Ves
ted
an
d
exer
cisa
ble
at
en
d o
f th
e ye
ar
Ves
ted
b
ut
not
ex
erci
sab
le
at e
nd
of
the
year
20
15
O
pti
ons
D
irec
tors
K
nox,
Dav
id J
ohn
Wis
sler
425
7,51
2–
–(2
57,5
12)
––
––
–
S
enio
r E
xecu
tive
s
A
nder
son,
Joh
n H
ugh
117,
693
––
––
117,
693
117,
693
117,
693
–
B
auld
erst
one,
Jam
es L
eslie
586
,238
––
(86,
238)
––
––
–
B
row
n, T
revo
r Jo
hn37
,137
––
––
37,13
737
,137
37,13
7–
S
eato
n, A
ndre
w J
ohn
22,2
13–
––
–22
,213
22,2
1322
,213
–
To
tal
520
,79
3–
–(3
43,
750
)–
177,
04
317
7,0
43
177,
04
3–
S
AR
s
D
irec
tors
K
nox,
Dav
id J
ohn
Wis
sler
41,0
09,9
2050
5,59
2(8
8,70
6)(1
,426
,806
)–
––
––
S
enio
r E
xecu
tive
s
A
nder
son,
Joh
n H
ugh
141,9
2989
,186
–(4
2,98
1)–
188,
134
––
–
B
auld
erst
one,
Jam
es L
eslie
515
4,37
497
,093
–(2
51,4
67)
––
––
–
B
row
n, T
revo
r Jo
hn14
4,28
890
,802
–(4
3,54
8)–
191,5
42–
––
S
eato
n, A
ndre
w J
ohn
153,
502
96,5
44–
(46,
392)
–20
3,65
4–
––
W
oods
, Bre
tt K
enne
th6
–53
,444
–41
,50
4–
94,9
48–
––
To
tal
1,6
04
,013
93
2,6
61
(88,
706
)(1
,76
9,6
90
)–
678
,278
––
–
For
per
sona
l use
onl
y

Directors’ Report
50 / Santos Annual Report 2015
Remuneration Reportcontinued
Op
enin
g
bal
ance
Gra
nte
d
Op
tion
s ex
erci
sed
/ ri
gh
ts
vest
edO
ther
ch
ang
esS
old
/ tr
ansf
erre
dC
losi
ng
b
alan
ceV
este
d a
t en
d
of t
he
year
Ves
ted
an
d
exer
cisa
ble
at
end
of
the
year
Ves
ted
b
ut
not
ex
erci
sab
le
at e
nd
of
the
year
20
15
D
efer
red
sh
ares
D
irec
tors
K
nox,
Dav
id J
ohn
Wis
sler
4–
55,5
20(5
5,52
0)–
––
––
–
S
enio
r E
xecu
tive
s
A
nder
son,
Joh
n H
ugh
–13
,636
––
–13
,636
––
–
B
auld
erst
one,
Jam
es L
eslie
5–
14,3
21–
(14,
321)
––
––
–
B
row
n, T
revo
r Jo
hn–
15,8
23–
––
15,8
23–
––
S
eato
n, A
ndre
w J
ohn
–14
,505
––
–14
,505
––
–
W
oods
, Bre
tt K
enne
th–
––
––
––
––
To
tal
–11
3,8
05
(55
,520
)(1
4,3
21)
–4
3,9
64
––
–
1 S
AR
s gr
ante
d to
Sen
ior
Exe
cutiv
es in
clud
ing
the
CE
O r
elat
e to
the
4-y
ear
LTI g
rant
s as
dis
clos
ed in
Tab
les
7 an
d 9.
2 R
elat
es t
o 20
12–
2015
Str
ateg
ic G
rant
as
deta
iled
in T
able
3.
3 S
AR
s th
at d
id n
ot v
est
due
to t
he n
on-f
ulfil
men
t of
ves
ting
cond
ition
s an
d w
ere
forf
eite
d du
ring
the
year
, as
wel
l as
chan
ges
resu
lting
fro
m in
divi
dual
s ce
asin
g to
be
and
beco
min
g K
MP
s du
ring
the
perio
d.
4 M
r K
nox
ceas
ed t
o be
a K
MP
on
12 N
ovem
ber
2015
.
5 M
r B
auld
erst
one
ceas
ed t
o be
a K
MP
on
2 A
ugus
t 20
15 u
pon
acce
ptin
g th
e ne
w r
ole
of V
P C
orpo
rate
Dev
elop
men
t.
6 M
r W
oods
bec
ame
a K
MP
on
3 A
ugus
t 20
15 w
hen
he w
as a
ppoi
nted
to
the
role
of
VP
Eas
tern
Aus
tral
ia B
usin
ess
Uni
t. M
r W
oods
hel
d 10
5,82
9 S
AR
s w
hen
he w
as a
ppoi
nted
as
a K
MP
on
3 A
ugus
t 20
15 a
nd s
ubse
quen
tly 1
0,88
1 la
psed
on
31
Dec
embe
r 20
15.
For
per
sona
l use
onl
y

Santos Annual Report 2015 / 51
SH
AR
E H
OL
DIN
GS
O
pen
ing
b
alan
ce
Rec
eive
d
vest
ing
of
SA
Rs
Pu
rch
ased
1 S
old
Def
erre
d
2014
ST
IO
ther
ch
ang
es2
Clo
sin
g
bal
ance
Bal
ance
hel
d
no
min
ally
at
end
of
the
year
2015
Ord
inar
y sh
ares
– f
ully
pai
d
Dir
ecto
rs
Alle
n, Y
asm
in A
nita
10,
000
–5,
883
––
–15
,883
–
Bor
da, K
enne
th C
harle
s87
,874
–54
,523
––
4,81
314
7,21
0–
Coa
tes,
Pet
er R
olan
d48
,879
–41
,269
––
2,72
492
,872
–
Dea
n, K
enne
th A
lfred
32,13
0–
33,6
20–
–1,8
3167
,581
–
Fran
klin
, Roy
Ale
xand
er15
,215
–9,
297
––
592
25,10
4–
Goh
, Hoc
k15
,000
–17
,373
––
1,034
33,4
07–
Hem
strit
ch, J
ane
Sha
rman
39,19
2–
23,5
13–
–77
763
,482
–
Kno
x, D
avid
Joh
n W
issl
er3
108,
665
–97
,462
–55
,520
(261
,647
)4–
–
Mar
tin, G
rego
ry J
ohn
Wal
ton
24,5
00–
14,4
12–
––
38,9
12–
She
ffiel
d, S
cott
Dou
glas
40,0
00–
23,5
29–
––
63,5
29–
Sen
ior
Exe
cuti
ves
And
erso
n, J
ohn
Hug
h69
,825
–41
,334
––
–11
1,159
–
Bau
lder
ston
e, J
ames
Les
lie5
61,2
17–
––
–(6
1,21
7)–
–
Bro
wn,
Tre
vor
John
397,
680
–14
0,00
0(1
00,0
00)
––
437,
680
–
Sea
ton,
And
rew
Joh
n31
,325
–27
,037
––
132
58,
494
–
Woo
ds, B
rett
Ken
neth
––
––
––
––
Tota
l9
81,
50
2–
52
9,25
2(1
00,
00
0)
55
,520
(310
,96
1)1,
155
,313
–
1 In
clud
es p
urch
ases
on
mar
ket,
par
ticip
atio
n in
the
201
5 rig
hts
issu
e an
d sh
ares
issu
es f
rom
pos
t-ta
x fe
es u
nder
the
non
-exe
cutiv
e D
irect
or S
hare
Pla
n.
2 D
ivid
end
Rei
nves
tmen
t P
lan
allo
catio
ns a
s w
ell a
s ch
ange
s re
sulti
ng f
rom
indi
vidu
als
ceas
ing
to b
e K
MP
s du
ring
the
perio
d.
3 M
r K
nox
ceas
ed t
o be
a K
MP
on
12 N
ovem
ber
2015
.
4 O
ther
cha
nges
for
Mr
Kno
x in
clud
ed t
he a
mou
nt o
f 1,4
99 D
ivid
end
Rei
nves
tmen
t P
lan
allo
catio
ns.
5 M
r B
auld
erst
one
ceas
ed t
o be
a K
MP
on
2 A
ugus
t 20
15 u
pon
acce
ptin
g th
e ne
w r
ole
of V
P C
orpo
rate
Dev
elop
men
t.
For
per
sona
l use
onl
y

Directors’ Report
52 / Santos Annual Report 2015
Remuneration Reportcontinued
DETAILED INFORMATION ABOUT LINKING COMPANY PERFORMANCE TO INCENTIVES
Short-term incentives
How are the Company’s short-term performance targets determined?
The Company’s short-term performance targets comprise a combination of strategic, financial and operational targets, all of which are agreed with the Board and directly related to the strategic plan. These are captured in the Company’s annual performance scorecard.
What is measured in the Company’s annual performance scorecard?
The Company’s scorecard includes a range of Company performance measures used to drive balanced business performance. These measures include lagging indicators to assess the Company’s past performance, as well as forward-looking indicators to ensure the Company is positioning itself effectively for future growth – see Table 1 “2015 STI scorecard performance” on page 38.
The Board believes that this scorecard is balanced and focusses CEO and Senior Executive attention on achieving the key conditions and milestones necessary to deliver Santos’ strategic plan.
How is Company performance assessed?
Company performance is formally assessed by the Committee against the overall Company scorecard at the end of each financial year, and this forms the basis of a recommendation to the Board.
Each metric is assessed against an agreed target and assigned a percentage weighting of the total scorecard. The actual versus target performance of each metric is assigned a score between 0% and 100%. The weightings are then applied to these scores to derive a rating for that metric. The sum of each metric’s rating is used to determine the Company’s overall performance score.
The Board believes the above method of assessment is rigorous and provides a balanced assessment of the Company’s performance.
How does Company performance impact the STI program?
First, the Company’s overall performance score sets the budget available for STI allocations across the organisation in respect of that performance year. This is calculated by applying the percentage performance score to the maximum potential STIs of all eligible employees.
Secondly, the Company’s overall performance score contributes to the actual STI payment made to individuals in a given year. For the CEO, the Company performance outcome determines 75% of his STI payment. The other 25% is based on performance against additional goals. For Senior Executives, the Company performance outcome determines 60% of their STI payment. The other 40% is based on their individual performance assessment.
For
per
sona
l use
onl
y

Santos Annual Report 2015 / 53
Long-term incentives
How are long-term incentives linked to Company performance?
LTI aligns the rewards received by the CEO and Senior Executives with the longer-term performance of Santos relative to other ASX 100 companies and international energy sector peers. Recipients also have the opportunity to grow the long-term value of their LTI by delivering results for the Company that increase the share price. All 2015 LTI grants were solely performance based, ensuring further alignment with shareholder interests.
How is LTI awarded?
All LTI grants are delivered in the form of SARs, i.e. a conditional entitlement to a fully paid ordinary share at zero price, subject to satisfaction of the performance condition. Nothing is payable by Senior Executives if and when SARs vest. The Board has discretion to settle the SARs in cash if they vest.
What is the performance period?
SARs issued under the annual LTI program after 2014 have a four-year performance period. This period represents an appropriate balance between providing a genuine and foreseeable incentive to Senior Executives and fostering a long-term view of shareholder interests.
What performance hurdles are applied to the LTI?
Vesting of the 2015 LTI grants is based on the Company’s relative TSR against the companies comprising the ASX 100 (75%) and S&P GEI (25%). The Board has discretion to adjust the comparator group; for example to take account of takeovers, mergers and demergers that occur during the performance period. Relative TSR performance is tested by an independent third party and reviewed by the Board prior to vesting.
Why has relative TSR been chosen as the company’s LTI performance hurdle?
The Board believes that relative TSR effectively aligns the interests of individual Senior Executives with that of the Company’s shareholders, by motivating Senior Executives to achieve superior shareholder outcomes relative to Santos’ competitors for investor capital and its energy sector peers. TSR takes into account share price and dividend yield and is therefore a robust and objective measure of shareholder returns. Individual LTI awards in 2015 were divided so that the TSR hurdle for 75% of the award is measured relative to companies in the ASX 100 and 25% is measured against companies in the S&P GEI.
Why have the ASX 100 and S&P Global Energy Index been chosen?
The ASX 100 represents the companies in which most of the Company’s shareholders would invest as an alternative to Santos. If Santos performs well relative to these companies, it means that Santos shareholders’ investments have performed well relative to alternative investments. The S&P GEI was chosen as a second comparator group because the global energy market is of increasing relevance to Santos. Many of the companies that comprise the S&P GEI have oil and gas operations and are likely to be affected by similar global cyclical issues as Santos. Santos’ major competitors are included in the Index, along with other leading industry players based in various countries.
How is vesting determined?
Vesting of the 2015 LTI grants will be in accordance with the following schedule:
TSR percentile ranking % of grant vesting
< 51st percentile 0%
= 51st percentile 50%
52nd to 75th percentile Further 2% for each percentile improvement above the 51st percentile
76th to 100th percentile 100%
This vesting scale applies to both the CEO and Senior Executives’ annual LTI grants. There is no re-testing of the performance condition. SARs that do not vest upon testing of the performance condition will lapse.
When can vested SARs be traded?
Upon vesting of SARs, shares will automatically be allocated to the Senior Executive. Trading in these shares is subject to compliance with the Company’s Securities Trading Policy.
For
per
sona
l use
onl
y

Directors’ Report
54 / Santos Annual Report 2015
Directors’ Reportcontinued
INDEMNIFICATION
Rule 61 of the Company’s Constitution provides that the Company indemnifies, on a full indemnity basis and to the full extent permitted by law, officers of the Company for all losses or liabilities incurred by the person as an officer of the Company, a related body corporate or trustee of a company-sponsored superannuation fund. Rule 61 does not permit the Company to indemnify an officer for any liability involving a lack of good faith.
Rule 61 also permits the Company to purchase and maintain a Directors’ and Officers’ insurance policy.
In conformity with Rule 61, the Company is party to Deeds of Indemnity in favour of each of the Directors referred to in this report who held office during the year and certain Senior Executives of the consolidated entity. The indemnities operate to the full extent permitted by law and are not subject to a monetary limit. Santos is not aware of any liability having arisen, and no claims have been made, during or since the financial year ending 31 December 2015 under the Deeds of Indemnity.
During the year, the Company paid premiums in respect of Directors’ and Officers’ Liability and Legal Expenses insurance contracts for the year ended 31 December 2015 and since the end of the year the Company has paid, or agreed to pay, premiums in respect of such contracts for the year ending 31 December 2016. The insurance contracts insure against certain liability (subject to exclusions) persons who are or have been directors or officers of the Company and its controlled entities. A condition of the contracts is that the nature of the liability indemnified and the premium payable not be disclosed.
NON-AUDIT SERVICES
Amounts paid or payable to the Company’s auditor, Ernst & Young, for non-audit services provided during the year were:
Taxation and other services $84,000
Assurance services $507,000
The Directors are satisfied, based on the advice of the Audit & Risk Committee, that the provision of the non-audit services detailed above by Ernst & Young is compatible with the general standard of independence for auditors imposed by the Corporations Act.
The reason for forming this opinion is that all non-audit services have been reviewed by the Audit & Risk Committee to ensure they do not impact the impartiality and objectivity of the auditor.
A copy of the auditor’s independence declaration as required under section 307C of the Corporations Act is set out on page 122.
ROUNDING
Australian Securities and Investments Commission Class Order 98/100, dated 10 July 1998, applies to the Company. Accordingly, amounts have been rounded off in accordance with that Class Order, unless otherwise indicated.
This report is made out on 19 February 2016 in accordance with a resolution of the Directors.
Director
For
per
sona
l use
onl
y

Santos Annual Report 2015 / 55
Financial Report
Consolidated Income Statement 56
Consolidated Statement of Comprehensive Income 57
Consolidated Statement of Financial Position 58
Consolidated Statement of Cash Flows 59
Consolidated Statement of Changes in Equity 60
Notes to the Consolidated Financial Statements 61
SECTION 1 BASIS OF PREPARATION PAGE 62 - 63
1.1 Statement of compliance 1.2 Key events in the current period 1.3 Significant accounting judgements, estimates and assumptions 1.4 Foreign currency
SECTION 2 FINANCIAL PERFORMANCE PAGE 64 - 75
2.1 Segment information 2.2 Revenue 2.3 Expenses 2.4 Taxation 2.5 Earnings per share 2.6 Dividends
SECTION 3 CAPITAL EXPENDITURE, OPERATING ASSETS AND RESTORATION OBLIGATIONS PAGE 76 - 86
3.1 Exploration and evaluation assets 3.2 Oil and gas assets 3.3 Impairment of non-current assets 3.4 Restoration obligations 3.5 Commitments for expenditure 3.6 Assets held for sale
SECTION 4 WORKING CAPITAL MANAGEMENT PAGE 87 - 88
4.1 Cash and cash equivalents 4.2 Trade and other receivables 4.3 Inventories 4.4 Trade and other payables
SECTION 5 FUNDING AND RISK MANAGEMENT PAGE 89 - 99
5.1 Interest-bearing loans and borrowings 5.2 Net finance costs 5.3 Issued capital 5.4 Reserves and retained earnings 5.5 Financial risk management
SECTION 6 GROUP STRUCTURE PAGE 100 - 108
6.1 Consolidated entities 6.2 Acquisitions and disposal of subsidiaries 6.3 Joint arrangements 6.4 Parent entity disclosures 6.5 Deed of Cross Guarantee
SECTION 7 PEOPLE PAGE 109 - 115
7.1 Employee benefits 7.2 Share-based payment plans 7.3 Key management personnel disclosures
SECTION 8 OTHER PAGE 116 - 119
8.1 Contingent liabilities 8.2 Events after the end of the reporting period 8.3 Commitment on removal of shareholder cap 8.4 Remuneration of auditors 8.5 Accounting policies
Directors’ Declaration 120
Independent Auditor’s Report 121
Auditor’s Independence Declaration 122 For
per
sona
l use
onl
y

Financial Report
56 / Santos Annual Report 2015
Consolidated Income Statementfor the year ended 31 December 2015
2015 2014 Note $million $million
Product sales 2.2 3,246 4,037Cost of sales 2.3 (2,513) (2,899)
Gross profit 733 1,138Other revenue 48 62Other income 13 12Impairment of non-current assets 3.3 (3,924) (2,356)Other expenses 2.3 (192) (154)Finance income 5.2 7 19 Finance costs 5.2 (297) (116)Share of net profit of joint ventures 6.3(c) 14 17
Loss before tax (3,598) (1,378)
Income tax benefit 2.4(a) 868 316Royalty-related tax benefit 2.4(b) 32 127
Total tax benefit 900 443
Net loss for the period attributable to owners of Santos Limited (2,698) (935)
Earnings per share attributable to the equity holders of Santos Limited (¢) Basic loss per share 2.5 (234.2) (95.6)
Diluted loss per share 2.5 (234.2) (95.6)
Dividends per share (¢) Paid during the period 2.6 30 35
Declared in respect of the period 2.6 20 35
The consolidated income statement is to be read in conjunction with the notes to the consolidated financial statements.
For
per
sona
l use
onl
y

Santos Annual Report 2015 / 57
Consolidated Statement of Comprehensive Incomefor the year ended 31 December 2015
2015 2014 $million $million
Net loss for the period (2,698) (935)
Other comprehensive income, net of tax: Other comprehensive income to be reclassified to profit or loss in subsequent periods: Exchange gain on translation of foreign operations 958 623 Tax effect – –
958 623
Loss on foreign currency loans designated as hedges of net investments in foreign operations (704) (450) Tax effect 211 135
(493) (315)
Loss on derivatives designated as cash flow hedges 7 (13) Tax effect (2) 4
5 (9)
Net other comprehensive income to be reclassified to profit or loss in subsequent periods 470 299
Items not to be reclassified to profit or loss in subsequent periods: Remeasurement of defined benefit obligation 10 – Tax effect (3) –
7 –
Net other comprehensive income not being reclassified to profit or loss in subsequent periods 7 –
Other comprehensive income, net of tax 477 299
Total comprehensive loss attributable to owners of Santos Limited (2,221) (636)
The consolidated statement of comprehensive income is to be read in conjunction with the notes to the consolidated financial statements.
For
per
sona
l use
onl
y

Financial Report
58 / Santos Annual Report 2015
2015 2014 Note $million $million
Current assets Cash and cash equivalents 4.1 1,154 775Trade and other receivables 4.2 539 633Prepayments 64 91Inventories 4.3 495 443Other financial assets 5.5(f) 1 66Tax receivable 117 57Assets held for sale 3.6 551 –
Total current assets 2,921 2,065
Non-current assets Receivables 4.2 6 10Prepayments 28 189Investments in joint ventures 6.3(b) 98 97Other financial assets 5.5(f) 217 166Exploration and evaluation assets 3.1 715 1,106Oil and gas assets 3.2 17,052 18,422Other land, buildings, plant and equipment 249 267Deferred tax assets 2.4(d) 640 23
Total non-current assets 19,005 20,280
Total assets 21,926 22,345
Current liabilities Trade and other payables 4.4 849 1,382Deferred income 9 51Interest-bearing loans and borrowings 5.1 210 327Current tax liabilities 11 14Provisions 3.4, 7.1 172 169Other financial liabilities 5.5(f) 3 3Liabilities directly associated with assets held for sale 3.6 19 –
Total current liabilities 1,273 1,946
Non-current liabilities Deferred income 218 150Interest-bearing loans and borrowings 5.1 7,211 7,925Deferred tax liabilities 2.4(d) 211 594Provisions 3.4, 7.1 2,387 2,136Other financial liabilities 5.5(f) 424 181
Total non-current liabilities 10,451 10,986
Total liabilities 11,724 12,932
Net assets 10,202 9,413
Equity Issued capital 5.3 10,192 6,905Reserves 5.4 985 346Accumulated losses 5.4 (975) 2,166
Equity attributable to owners of Santos Limited 10,202 9,417Non-controlling interests – (4)
Total equity 10,202 9,413
The consolidated statement of financial position is to be read in conjunction with the notes to the consolidated financial statements.
Consolidated Statement of Financial Positionfor the year ended 31 December 2015
For
per
sona
l use
onl
y

Santos Annual Report 2015 / 59
2015 2014 Note $million $million
Cash flows from operating activities Receipts from customers 3,562 4,399Dividends received 17 18Pipeline tariffs and other receipts 88 130Payments to suppliers and employees (2,035) (2,222)Exploration and evaluation seismic and studies (151) (150)Royalty and excise paid (57) (97)Borrowing costs paid (219) (49)Carbon costs paid (20) (52)Income taxes paid (68) (115)Royalty-related tax paid (58) (49)Other operating activities 35 30
Net cash provided by operating activities 4.1(b) 1,094 1,843
Cash flows from investing activities Payments for: Exploration and evaluation assets (370) (455) Oil and gas assets (1,487) (2,834) Other land, buildings, plant and equipment (22) (52) Acquisitions of oil and gas assets (128) (33) Acquisitions of controlled entities – (8)Proceeds from disposal of non-current assets 2.2 77 1Borrowing costs paid (146) (223)Other investing activities (26) (7)
Net cash used in investing activities (2,102) (3,611)
Cash flows from financing activities Dividends paid (215) (196)Drawdown of borrowings 904 2,167Repayment of borrowings (2,516) (86)Proceeds from issues of ordinary shares 3,193 10
Net cash provided by financing activities 1,366 1,895
Net increase in cash and cash equivalents 358 127Cash and cash equivalents at the beginning of the period 775 644Effects of exchange rate changes on the balances of cash held in foreign currencies 21 4
Cash and cash equivalents at the end of the period 4.1 1,154 775
The consolidated statement of cash flows is to be read in conjunction with the notes to the consolidated financial statements.
Consolidated Statement of Cash Flowsfor the year ended 31 December 2015
For
per
sona
l use
onl
y

Financial Report
60 / Santos Annual Report 2015
Consolidated Statement of Changes in Equityfor the year ended 31 December 2015
Equity attributable to owners of Santos Limited
Accum- Accum- ulated ulated Non- Issued Translation Hedging profits profits/ Total controlling Total capital reserve reserve reserve (losses) equity interests equity Note $million $million $million $million $million $million $million $million
Balance at 1 January 2014 6,749 57 (10) – 3,420 10,216 (4) 10,212Loss for the period – – – – (935) (935) – (935)Other comprehensive income/(loss) for the period – 308 (9) – – 299 – 299
Total comprehensive income/(loss) for the period – 308 (9) – (935) (636) – (636)Transactions with owners in their capacity as owners: Shares issued 5.3 156 – – – – 156 – 156 Dividends to shareholders 2.6 – – – – (341) (341) – (341) Share-based payment transactions – – – – 22 22 – 22
Balance at 31 December 2014 6,905 365 (19) – 2,166 9,417 (4) 9,413
Balance at 1 January 2015 6,905 365 (19) – 2,166 9,417 (4) 9,413Transfer retained profits to accumulated profits reserve 5.4 – – – 167 (167) – – –Items of comprehensive income: Loss for the period – – – – (2,698) (2,698) – (2,698) Other comprehensive income for the period – 465 5 – 7 477 – 477
Total comprehensive income/(loss) for the period – 465 5 – (2,691) (2,221) – (2,221)Transactions with owners in their capacity as owners: Shares issued 5.3 3,287 – – – – 3,287 – 3,287 Dividends to shareholders 2.6 – – – – (298) (298) – (298) Share-based payment transactions – – – – 21 21 – 21 Non-controlling interest exit from foreign operations – 2 – – (6) (4) 4 –
Balance at 31 December 2015 10,192 832 (14) 167 (975) 10,202 – 10,202
The consolidated statement of changes in equity is to be read in conjunction with the notes to the consolidated financial statements.
For
per
sona
l use
onl
y

Santos Annual Report 2015 / 61
Notes to the Consolidated Financial Statementsfor the year ended 31 December 2015
STRUCTURE OF THE FINANCIAL REPORT
In preparing the 2015 financial report a thorough review of the content and structure has been conducted, resulting in changes to its layout and wording. These changes have been made to reduce complexity and increase relevance to users. The revised notes include information that is considered material and relevant to an understanding of the results of the Group.
The notes are organised into key sections to provide an enhanced understanding of the Group’s performance that is aligned with management’s view of the business, as shown below.
Significant and other accounting policies that summarise the measurement bases and that are relevant to an understanding of the financial statements are provided throughout the notes to the financial statements.
SECTION 1 BASIS OF PREPARATION PAGE
1.1 Statement of compliance 62 1.2 Key events in the current period 62 1.3 Significant accounting judgements, estimates and assumptions 62 1.4 Foreign currency 63
SECTION 2 FINANCIAL PERFORMANCE PAGE
2.1 Segment information 64 2.2 Revenue 67 2.3 Expenses 69 2.4 Taxation 70 2.5 Earnings per share 74 2.6 Dividends 75
SECTION 3 CAPITAL EXPENDITURE, OPERATING ASSETS AND RESTORATION OBLIGATIONS PAGE
3.1 Exploration and evaluation assets 76 3.2 Oil and gas assets 77 3.3 Impairment of non-current assets 80 3.4 Restoration obligations 84 3.5 Commitments for expenditure 85 3.6 Assets held for sale 86
SECTION 4 WORKING CAPITAL MANAGEMENT PAGE
4.1 Cash and cash equivalents 87 4.2 Trade and other receivables 88 4.3 Inventories 88 4.4 Trade and other payables 88
SECTION 5 FUNDING AND RISK MANAGEMENT PAGE
5.1 Interest-bearing loans and borrowings 89 5.2 Net finance costs 92 5.3 Issued capital 93 5.4 Reserves and retained earnings 94 5.5 Financial risk management 94
SECTION 6 GROUP STRUCTURE PAGE
6.1 Consolidated entities 100 6.2 Acquisitions and disposal of subsidiaries 102 6.3 Joint arrangements 103 6.4 Parent entity disclosures 106 6.5 Deed of Cross Guarantee 107
SECTION 7 PEOPLE PAGE
7.1 Employee benefits 109 7.2 Share-based payment plans 110 7.3 Key management personnel disclosures 115
SECTION 8 OTHER PAGE
8.1 Contingent liabilities 116 8.2 Events after the end of the reporting period 116 8.3 Commitment on removal of shareholder cap 116 8.4 Remuneration of auditors 116 8.5 Accounting policies 117
For
per
sona
l use
onl
y

Financial Report
62 / Santos Annual Report 2015
Notes to the Consolidated Financial Statements Section 1: Basis of Preparation
This section provides information about the basis of preparation of the financial report, and certain accounting policies that are not disclosed elsewhere in the financial report. Accounting policies specific to individual elements of the financial statements are located with the relevant section of the report.
1.1 STATEMENT OF COMPLIANCE
The consolidated financial report of Santos Limited (“the Company”) for the year ended 31 December 2015 was authorised for issue in accordance with a resolution of the Directors on 19 February 2016.
The consolidated financial report of the Company for the year ended 31 December 2015 comprises the Company and its controlled entities (“the Group”). Santos Limited (“the Parent”) is a company limited by shares incorporated in Australia, whose shares are publicly traded on the Australian Securities Exchange (“ASX”) and is the ultimate parent entity in the Group. The Group is a for-profit entity for the purpose of preparing the financial report. The nature of the operations and principal activities of the Group are described in the Directors’ Report.
This consolidated financial report is:
• a general purpose financial report which has been prepared in accordance with the requirements of the Corporations Act 2001, Australian Accounting Standards and other authoritative pronouncements of the Australian Accounting Standards Board (“AASB”);
• compliant with Australian Accounting Standards as issued by the AASB and International Financial Reporting Standards (“IFRS”) as issued by the International Accounting Standards Board, including new and amended accounting standards issued and effective for reporting periods beginning on or after 1 January 2015;
• presented in Australian dollars;
• prepared on the historical cost basis except for derivative financial instruments, fixed rate notes that are hedged by an interest rate swap or a cross-currency swap, and available-for-sale financial assets, which are measured at fair value; and
• rounded to the nearest million dollars, unless otherwise stated, in accordance with ASIC Class Order 98/100.
1.2 KEY EVENTS IN THE CURRENT PERIOD
The financial position and performance of the Group was particularly impacted by the following events and transactions during the year:
• first production and sale of LNG from the GLNG project in October 2015;
• completion of a Strategic Review in November 2015 culminating in the raising of $3,000 million of equity and the agreement to sell the Group’s share in the Kipper gas project for $520 million (the sale remains subject to outstanding conditions which have not yet been met, and therefore has not been recorded during the 2015 year);
• production of 57.7mmboe compared to 54.1mmboe in 2014; and
• average realised oil price of A$71.44 per barrel compared to A$114.21 per barrel in 2014.
1.3 SIGNIFICANT ACCOUNTING JUDGEMENTS, ESTIMATES AND ASSUMPTIONS
The carrying amounts of certain assets and liabilities are often determined based on management’s judgement regarding estimates and assumptions of future events. The key judgements, estimates and assumptions that have a significant risk of causing a material adjustment to the carrying amount of certain assets and liabilities within the next annual reporting period are disclosed in the following notes:
• Note 2.4 Taxation
• Note 3.1 Exploration and evaluation assets
• Note 3.2 Oil and gas assets – Estimates of reserve quantities
• Note 3.3 Impairment of non-current assets
• Note 3.4 Restoration obligations
In addition to the significant judgements referenced above, other areas of estimation and judgement are highlighted throughout the financial report.
For
per
sona
l use
onl
y

Santos Annual Report 2015 / 63
1.4 FOREIGN CURRENCY
Functional and presentation currency
Both the currency of the Parent and the presentation currency of the Group are Australian dollars. Some subsidiaries have a functional currency other than Australian dollars which is translated to the presentation currency.
Transactions and balances
Transactions in currencies other than an entity’s functional currency are initially recorded in the functional currency by applying the exchange rate ruling at the date of the transaction. Monetary assets and liabilities denominated in currencies other than an entity’s functional currency are retranslated at the foreign exchange rate ruling at the reporting date. Foreign exchange differences arising on translation are recognised in the income statement.
Foreign exchange differences that arise on the translation of monetary items that form part of the net investment in a foreign operation are recognised in the translation reserve in the consolidated financial statements.
Non-monetary assets and liabilities that are measured in terms of historical cost in currencies other than an entity’s functional currency are translated using the exchange rate at the date of the initial transaction. Non-monetary assets and liabilities denominated in currencies other than an entity’s functional currency that are stated at fair value are translated to the functional currency at foreign exchange rates ruling at the dates the fair value was determined.
The year-end exchange rate used was A$/US$ 1:0.7274 (2014: 1:0.8181).
Group companies
The results of subsidiaries with a functional currency other than Australian dollars are translated to Australian dollars as at the date of each transaction. The assets and liabilities are translated to Australian dollars at foreign exchange rates ruling at the reporting date. Foreign exchange differences arising on retranslation are recognised directly in the translation reserve.
Exchange differences arising from the translation of the net investment in foreign operations and of related hedges are recognised in the translation reserve. They are released into the income statement upon disposal of the foreign operation.
Also refer to note 5.5(b) Foreign currency risk.
For
per
sona
l use
onl
y

Financial Report
64 / Santos Annual Report 2015
Notes to the Consolidated Financial Statements Section 2: Financial Performance
This section focuses on the operating results and financial performance of the Group. It includes disclosures of segmental financial information, taxes, dividends, and earnings per share including the relevant accounting policies adopted in each area.
2.1 SEGMENT INFORMATION
The Group has identified its operating segments to be the four business units of Eastern Australia; Western Australia and Northern Territory (“WA&NT”); Asia Pacific; and Gladstone LNG (“GLNG”), based on the nature and geographical location of the assets. This is the basis on which internal reports are provided to the Chief Executive Officer for assessing performance and determining the allocation of resources within the Group.
The Chief Executive Officer monitors the operating results of the business units separately for the purposes of allocating resources and assessing performance. Segment performance is measured based on earnings before interest, tax, impairment, exploration and evaluation, and gains or losses on sale of non-current assets and controlled entities “EBITX”. Corporate and exploration expenditure and inter-segment eliminations are included in the segment disclosure for reconciliation purposes.
For
per
sona
l use
onl
y

Santos Annual Report 2015 / 65
2.1 SEGMENT INFORMATION (CONTINUED)
Corporate, Eastern Asia exploration, Australia WA&NT Pacific GLNG eliminations Total$million 2015 2015 2015 2015 2015 2015
Revenue Sales to external customers 1,307 722 1,123 94 – 3,246Inter-segment sales1 18 – – 16 (34) –Other revenue from external customers 25 – 13 6 4 48
Total segment revenue 1,350 722 1,136 116 (30) 3,294
Costs Production costs (305) (304) (209) (33) 57 (794)Other operating costs (157) (4) (78) (29) – (268)Third-party product purchases (413) – (1) (62) – (476)Inter-segment purchases1 (16) – – (18) 34 –
Results EBITDAX 421 424 827 8 239 1,919Depreciation and depletion (420) (225) (278) (92) (44) (1,059)Less (gains)/losses on sale of non-current assets 2 (4) – – – (2)
EBITX 3 195 549 (84) 195 858Add back gains/(losses) on sale of non-current assets (2) 4 – – – 2Exploration and evaluation expensed – – – – (244) (244)Net impairment loss (2,774) (340) (186) (624) – (3,924)
EBIT (2,773) (141) 363 (708) (49) (3,308)Net finance costs (290) (290)
Loss before tax (3,598)Income tax benefit 868 868Royalty-related tax benefit 70 (40) – 2 – 32
Net loss (2,698)
Asset additions and acquisitions: Exploration and evaluation assets 96 10 287 17 – 410 Oil and gas assets 739 182 135 614 – 1,670
835 192 422 631 – 2,080
1 Inter-segment pricing is determined on an arm’s length basis. Inter-segment sales and purchases are eliminated on consolidation.
2015 Revenue from external customers by geographical location
$million
Australia 2,157
Papua New Guinea 753
Vietnam 199
Other countries 185
Total 3,294
2015 Non-current assets by geographical location (excluding �nancial and deferred tax assets)
$million
Australia 13,203
Papua New Guinea 4,071
Other countries 840
Total 18,114
For
per
sona
l use
onl
y

Financial Report
66 / Santos Annual Report 2015
Notes to the Consolidated Financial Statements Section 2: Financial Performance
2014 Revenue from external customers by geographical location
$million
Australia 3,115
Papua New Guinea 492
Vietnam 337
Other countries 155
Total 4,099
2014 Non-current assets by geographical location (excluding �nancial and deferred tax assets)
$million
Australia 15,410
Papua New Guinea 3,561
Other countries 921
Total 19,892
2.1 SEGMENT INFORMATION (CONTINUED)
Corporate, Eastern Asia exploration, Australia WA&NT Pacific GLNG eliminations Total$million 2014 2014 2014 2014 2014 2014
Revenue Sales to external customers 1,964 1,057 972 44 – 4,037Inter-segment sales1 – – – 13 (13) –Other revenue from external customers 37 – 13 2 10 62
Total segment revenue 2,001 1,057 985 59 (3) 4,099
Costs Production costs (340) (385) (170) (12) 60 (847)Other operating costs (198) (10) (71) (20) – (299)Third-party product purchases (749) (1) – (36) – (786)Inter-segment purchases1 (13) – – – 13 –
Results EBITDAX 693 635 743 (10) 258 2,319Depreciation and depletion (438) (257) (218) (34) (41) (988)Less (gains)/losses on sale of non-current assets (5) – – – 1 (4)
EBITX 250 378 525 (44) 218 1,327Add back gains/(losses) on sale of non-current assets 5 – – – (1) 4 Exploration and evaluation expensed – – – – (256) (256)Net impairment loss (1,666) (456) (220) – (14) (2,356)
EBIT (1,411) (78) 305 (44) (53) (1,281)Net finance costs (97)
Loss before tax (1,378)Income tax benefit 316 316Royalty-related tax benefit 26 100 – 1 – 127
Net loss (935)
Asset additions and acquisitions: Exploration and evaluation assets 278 61 166 10 – 515 Oil and gas assets 1,255 280 435 1,582 – 3,552
1,533 341 601 1,592 – 4,067
1 Inter-segment pricing is determined on an arm’s length basis. Inter-segment sales and purchases are eliminated on consolidation.
For
per
sona
l use
onl
y

Santos Annual Report 2015 / 67
2.2 REVENUE
Revenue is recognised in the income statement when the significant risks and rewards of ownership have been transferred to the buyer. Revenue is recognised and measured at the fair value of the consideration or contributions received, net of goods and services tax or similar taxes, to the extent it is probable that the economic benefits will flow to the Group and the revenue can be reliably measured.
Sales revenue
Sales revenue is recognised on the basis of the Group’s interest in a producing field (“entitlements” method), when the physical product and associated risks and rewards of ownership pass to the purchaser, which is generally at the time of ship or truck loading, or on the product entering the pipeline.
Revenue earned under a production sharing contract (“PSC”) is recognised on a net entitlements basis according to the terms of the PSC. Generally, under these terms the local government retains title to the resources, and is therefore entitled to its share of the production and revenue, after allowing for the joint venture partners to extract and sell their share of hydrocarbons to recover specified costs and a profit margin.
During the year, revenue from one customer amounted to $620 million (2014: $1,153 million from two customers), arising from sales from all segments of the Group.
Deferred income
A liability is recorded for obligations under sales contracts to deliver natural gas in future periods for which payment has already been received.
2015 2014 Sales revenue $million $million
Product sales: Gas, ethane and liquefied natural gas 1,918 1,687 Crude oil 982 1,878 Condensate and naphtha 243 317 Liquefied petroleum gas 103 155
Total product sales1 3,246 4,037
1 Total product sales include third-party product sales of $589 million (2014: $932 million).
For
per
sona
l use
onl
y

Financial Report
68 / Santos Annual Report 2015
Notes to the Consolidated Financial Statements Section 2: Financial Performance
2.2 REVENUE (CONTINUED)
2015 2014 Sale of non-current assets $million $million
Net gain on sale of non-current assets Proceeds on disposals 127 7Book value of oil and gas assets disposed (77) (2)Book value of other land, buildings, plant and equipment disposed (3) (1)Book value of exploration and evaluation assets disposed (35) –Recoupment of current year exploration and evaluation expenditure (12) –Book value of working capital disposed 2 –
Total net gain on sale of non-current assets 2 4
Comprising: Net gain on sale of exploration and evaluation assets 4 – Net (loss)/gain on sale of oil and gas assets (4) 5 Net gain/(loss) on sale of other land, buildings, plant and equipment 2 (1)
2 4
Reconciliation to cash inflows from proceeds on disposal of non-current assets Proceeds after recoupment of current year exploration and evaluation expenditure 115 7Amounts receivable (38) (6)
Amounts received from current year disposals 77 1
Total proceeds on disposal of non-current assets 77 1
Comprising: Proceeds from disposal of oil and gas assets 42 1 Proceeds from disposal of exploration and evaluation assets 35 –
77 1
For
per
sona
l use
onl
y

Santos Annual Report 2015 / 69
2.3 EXPENSES
2015 2014 $million $million
Cost of sales: Production costs: Production expenses 696 746 Production facilities operating leases 98 101
Total production costs 794 847
Other operating costs: LNG plant costs 39 16 Pipeline tariffs, processing tolls and other 143 136 Royalty and excise 56 99 Carbon costs – 30 Shipping costs 30 18
Total other operating costs 268 299
Total cash cost of production 1,062 1,146
Depreciation of plant, equipment and buildings 628 529 Depletion of subsurface assets 428 459
Total depreciation and depletion 1,056 988
Third-party product purchases 476 786 Increase in product stock (81) (21)
Total cost of sales 2,513 2,899
Other expenses: Selling 27 25 Corporate 172 93 Depreciation 3 – Foreign exchange losses/(gains)1 (251) (161) Losses from change in fair value of derivative financial assets designated as fair value through profit or loss 6 4 Fair value hedges, (gains)/losses: On the hedging instrument 65 (83) On the hedged item attributable to the hedged risk (86) 20 Exploration and evaluation expensed 244 256 Other 12 –
Total other expenses 192 154
1. Reclassification: foreign exchange losses/(gains) previously included the effects of foreign exchange on Australian dollar-denominated tax bases of Group entities with functional currencies other than Australian dollars. Further accounting guidance on the matter was released by the IFRS Interpretations Committee during 2015 and early 2016 clarifying that such amounts are to be classified as tax gains/losses rather than foreign exchange gains/losses. Consequently a $213 million loss in 2015 has been classified as a tax expense, and a $166 million loss in 2014 has been re-classified from foreign exchange gains to tax expense.
For
per
sona
l use
onl
y

Financial Report
70 / Santos Annual Report 2015
Notes to the Consolidated Financial Statements Section 2: Financial Performance
2.4 TAXATION
Income tax
Income tax on the profit or loss for the year comprises current and deferred tax. Income tax is recognised in the income statement except in relation to items recognised directly in equity.
Current tax is the amount of income tax payable on the taxable profit or loss for the year, using tax rates enacted or substantively enacted at the reporting date, and any adjustment to tax payable in respect of previous years.
Current income tax assets and liabilities for the current and prior periods are measured at the amount expected to be recovered from or paid to the taxation authorities. The tax rates and tax laws used to compute the amount are those that are enacted or substantively enacted at the reporting date in the countries where the Group operates and generates taxable income.
The Company and all of its wholly-owned Australian resident entities are part of a tax-consolidated group under Australian taxation law. Santos Limited is the head entity in the tax-consolidated group. The head entity and the controlled entities in the tax-consolidated group continue to account for their own current and deferred tax amounts. Current tax liabilities and assets and deferred tax assets arising from unused tax losses and tax credits of the members of the tax-consolidated group are recognised by the Company (as head entity in the tax-consolidated group).
The Company and the other entities in the tax-consolidated group have entered into a tax funding agreement and a tax sharing agreement.
For
per
sona
l use
onl
y

Santos Annual Report 2015 / 71
2.4 TAXATION (CONTINUED)
Royalty-related tax
Petroleum Resource Rent Tax (“PRRT”), Resource Rent Royalty and Timor-Leste’s Additional Profits Tax are accounted for as income tax.
2015 2014 Recognised in the income statement $million $million
(a) Income tax expense/(benefit) Current tax expense/(benefit) Current year 10 (156) Adjustments for prior years 22 (4)
32 (160)
Deferred tax benefit Origination and reversal of temporary differences (809) (144) Adjustments for prior years (91) (12)
(900) (156)
Total income tax benefit (868) (316)
(b) Royalty-related tax expense/(benefit) Current tax expense/(benefit) Current year 35 47
35 47
Deferred tax benefit Origination and reversal of temporary differences (67) (174)
(67) (174)
Total royalty-related tax benefit (32) (127)
(c) Numerical reconciliation between pre-tax net loss and tax benefit Loss before tax (3,598) (1,378)
Prima facie income tax benefit at 30% (2014: 30%) (1,079) (413) Increase/(decrease) in income tax (benefit)/expense due to: Foreign losses not recognised 39 17 Non-deductible expenses 11 12 Exchange and other translation variations 150 100 Tax adjustments relating to prior years 7 (6) Other 4 (26)
Income tax benefit (868) (316) Royalty-related tax benefit (32) (127)
Total tax benefit (900) (443)
For
per
sona
l use
onl
y

Financial Report
72 / Santos Annual Report 2015
Notes to the Consolidated Financial Statements Section 2: Financial Performance
2.4 TAXATION (CONTINUED)
Deferred tax assets and liabilities
Deferred tax is determined using the statement of financial position approach, providing for temporary differences between the carrying amounts of assets and liabilities for financial reporting purposes and the appropriate tax bases.
The following temporary differences are not provided for:
• the initial recognition of assets or liabilities that affect neither accounting or taxable profit; nor
• differences relating to investments in subsidiaries to the extent it is probable that they will not reverse in the foreseeable future.
The amount of deferred tax provided is based on the expected manner of realisation or settlement of the carrying amount of assets and liabilities, using tax rates enacted or substantively enacted at the reporting date.
Significant judgement – Deferred taxes recognised
The calculation of the Group’s tax charge involves a degree of estimation and judgement in respect of certain items for which the ultimate tax determination is uncertain.
The Group recognises deferred tax assets only to the extent that it is probable that future taxable profits will be available against which the asset can be utilised. Deferred tax assets are reduced to the extent that it is no longer probable that the related tax benefit will be realised.
Assets Liabilities Net
2015 2014 2015 2014 2015 2014 Recognised assets and liabilities $million $million $million $million $million $million
Exploration and evaluation assets – 19 (76) (274) (76) (255)Oil and gas assets – – (339) (721) (339) (721)Available-for-sale financial assets – – (28) (24) (28) (24)Other assets 11 3 (58) (31) (47) (28)Derivative financial instruments 80 4 – – 80 4Interest-bearing loans and borrowings 240 151 – (7) 240 144Provisions 60 130 – – 60 130Royalty-related tax – – (74) (120) (74) (120)Other items 8 3 (16) (7) (8) (4)Tax value of carry-forward losses recognised 621 303 – – 621 303
Tax assets/(liabilities) 1,020 613 (591) (1,184) 429 (571)Set-off of tax (380) (590) 380 590 – –
Net tax assets/(liabilities) 640 23 (211) (594) 429 (571)
For
per
sona
l use
onl
y

Santos Annual Report 2015 / 73
2.4 TAXATION (CONTINUED)
Accounting judgement and estimate – Deferred taxes unrecognised
Deferred tax assets have not been recognised in respect of the following items because it is not probable that the temporary differences will reverse in the future and that there will be sufficient future taxable profits against which the benefits can be utilised. Tax losses of $89 million (2014: $79 million) will expire between 2021 and 2028. The remaining deductible temporary differences and tax losses do not expire under current tax legislation.
2015 2014 Unrecognised deferred tax assets $million $million
Deferred tax assets have not been recognised in respect of the following items: Temporary differences in relation to investments in subsidiaries 7,597 5,536 Deductible temporary differences relating to royalty-related tax (net of income tax) 6,090 4,817 Other deductible temporary differences 303 172 Tax losses 503 443
14,493 10,968
For
per
sona
l use
onl
y

Financial Report
74 / Santos Annual Report 2015
Notes to the Consolidated Financial Statements Section 2: Financial Performance
2.5 EARNINGS PER SHARE
Basic earnings per share amounts are calculated by dividing net profit or loss for the year attributable to ordinary equity holders of Santos Limited by the weighted average number of ordinary shares outstanding during the year.
Diluted earnings per share amounts are calculated by adjusting basic earnings per share by the weighted average number of ordinary shares that would be issued on the conversion of all the dilutive potential ordinary shares into ordinary shares.
Earnings used in the calculation of basic and diluted earnings per share reconciles to the net profit or loss after tax in the income statement as follows: 2015 2014 $million $million
Statutory earnings used in the calculation of basic and diluted earnings per share (2,698) (935)
Underlying earnings (refer reconciliation below) used in the calculation of underlying earnings per share 50 533
The weighted average number of shares used for the purpose of calculating diluted earnings per share reconciles to the number used to calculate basic earnings per share as follows: 2015 2014 Number of shares Number of shares
Basic earnings per share 1,151,977,771 978,166,528 Dilutive potential ordinary shares1 – –
Diluted earnings per share 1,151,977,771 978,166,528
2015 2014 Earnings per share attributable to the equity holders of Santos Limited ¢ ¢
Basic earnings per share (234.2) (95.6)
Diluted earnings per share (234.2) (95.6)
Underlying earnings per share 4.3 54.5
Underlying earnings
Underlying earnings is presented to provide an understanding of the Group’s underlying performance as used by management. Underlying earnings excludes the impacts of asset acquisitions, disposals and impairments, and items that are subject to significant variability from one period to the next, including the effects of fair-value adjustments and fluctuations in exchange rates.
2015 2014 Reconciliation of underlying profit $million $million
Net loss after tax attributable to equity holders of Santos Limited (2,698) (935)Add/(deduct) the following items (after impact of tax): Net gain on sale of non-current assets (1) (3) Impairment losses after tax 2,761 1,563 Foreign exchange (gains)/losses (28) 3 Fair value adjustments on embedded derivatives and hedges (10) (42) Remediation (income)/costs net of insurance recoveries – (4) Other expense items, including redundancy and restructure costs 48 – Other tax adjustments (22) (49)
Underlying profit2 50 533
1 Due to a net loss after tax in 2014 and 2015, potential ordinary shares are anti-dilutive and therefore excluded from the calculation of diluted earnings per share.
2 Underlying profit is a non-IFRS measure that is unaudited. However, the numbers have been extracted from the financial statements which have been subject to audit by the Company’s auditor.
For
per
sona
l use
onl
y

Santos Annual Report 2015 / 75
2.6 DIVIDENDS
Dividends are recognised as a liability at the time the Directors resolve to pay or declare the dividend.
Dividend per share Total Dividends recognised during the year ¢ $million
2015 Interim 2015 ordinary – paid 30 Sep 2015 15 150Final 2014 ordinary – paid 25 Mar 2015 15 148
30 298
2014 Interim 2014 ordinary – paid 30 Sep 2014 20 195Final 2013 ordinary – paid 26 Mar 2014 15 146
35 341
Dividend per share TotalDividends declared in respect of the year ¢ $million
2015 Final 2015 ordinary1 – to be paid 30 Mar 2016 5 88Interim 2015 ordinary – paid 30 Sep 2015 15 150
20 238
2014 Final 2014 ordinary – paid 25 Mar 2015 15 148Interim 2014 ordinary – paid 30 Sep 2014 20 195
35 343
1. After the reporting date, the final 2015 ordinary dividend of 5 cents per share was proposed by the Directors. The financial effect of these dividends has not been brought to account in the financial statements for the year ended 31 December 2015 and will be recognised in the subsequent period.
All dividends declared during the year were franked dividends and were franked at the tax rate of 30%.
2015 2014 Dividend franking account $million $million
30% franking credits available to the shareholders of Santos Limited for future distribution, after adjusting for franking credits which will arise from the payment of the current tax liability at 31 December 590 737
The impact on the dividend franking account of dividends proposed after the reporting date but not recognised as a liability is to reduce it by $38 million (2014: $63 million).
For
per
sona
l use
onl
y

Financial Report
76 / Santos Annual Report 2015
This section includes information about the assets used by the Group to generate profits and revenue, specifically information relating to exploration and evaluation assets, oil and gas assets, associated restoration obligations, and commitments for capital expenditure not yet recognised as a liability.
The life cycle of our assets is summarised as follow:
Exploration and evaluation
Appraisal drilling Development Production DecomissioningAbandonment and restoration
Key information to note in this section includes:
• the carrying values of various exploration and evaluation assets and oil and gas assets were written down at 31 December 2015. As a result a pre-tax impairment charge of $3,924 million was recognised in impairment expenses; and
• significant movements in oil and gas assets resulted from the continued construction of the GLNG and PNG LNG projects, with the completion of various aspects of these projects seeing the assets transition from assets in development to producing assets.
3.1 EXPLORATION AND EVALUATION ASSETS
Exploration and evaluation expenditure
Exploration and evaluation activity involves the search for hydrocarbon resources, the determination of technical feasibility and the assessment of commercial viability of an identified resource. Expenditure in respect of each area of interest is accounted for using the successful efforts method of accounting.
The successful efforts method requires all exploration and evaluation expenditure to be expensed in the period it is incurred, except the costs of acquiring interests in new exploration and evaluation assets, the cost of successful wells and appraisal costs relating to determining development feasibility, which are capitalised as intangible exploration and evaluation assets.
Exploration and evaluation expenditure is recognised in relation to an area of interest when the rights to tenure of the area of interest are current and either:
• such expenditure is expected to be recovered through successful development and commercial exploitation of the area of interest or, alternatively, by its sale; or
• the exploration activities in the area of interest have not yet reached a stage that permits reasonable assessment of the existence of economically recoverable reserves and active and significant operations in, or in relation to, the area of interest are continuing.
Where an ownership interest in an exploration and evaluation asset is exchanged for another, the transaction is recognised by reference to the carrying value of the original interest. Any cash consideration paid, including transaction costs, is accounted for as an acquisition of exploration and evaluation assets. Any cash consideration received, net of transaction costs, is treated as a recoupment of costs previously capitalised with any excess accounted for as a gain on disposal of non-current assets.
No amortisation is charged during the exploration and evaluation phase.
Acquisition of assets
All assets acquired are recorded at their cost of acquisition, being the amount of cash or cash equivalents paid, and the fair value of assets given, shares issued or liabilities incurred. The cost of an asset comprises the purchase price including any incidental costs directly attributable to the acquisition; any costs directly attributable to bringing the asset to the location and condition necessary for it to be capable of operating; and the estimate of the costs of dismantling and removing the asset and restoring the site on which it is located.
Exploration licence and leasehold property acquisition costs are capitalised as intangible assets. Licence costs paid in connection with a right to explore in an existing exploration area are capitalised and amortised over the term of the permit.
Notes to the Consolidated Financial StatementsSection 3: Capital Expenditure, Operating Assets and Restoration Obligations
For
per
sona
l use
onl
y

Santos Annual Report 2015 / 77
3.1 EXPLORATION AND EVALUATION ASSETS (CONTINUED)
Significant judgement – Exploration and evaluation
The application of this policy requires management to make certain estimates and assumptions as to future events and circumstances, particularly in relation to the assessment of whether economic quantities of resources have been found. Any such estimates and assumptions may change as new information becomes available. If, after having capitalised exploration and evaluation expenditure, management concludes that the capitalised expenditure is unlikely to be recovered by future exploitation or sale, then the relevant capitalised amount will be written off through the income statement.
2015 2014 $million $million
Cost 2,521 2,336Less impairment (1,806) (1,230)
Balance at 31 December 715 1,106
Reconciliation of movements Balance at 1 January 1,106 1,964Acquisitions 129 64Additions 281 451Disposals and recoupment (34) –Expensed (114) (95)Impairment losses (685) (1,170)Transfer to oil and gas assets in development – (10)Transfer to oil and gas assets in production (1) (123)Exchange differences 33 25
Balance at 31 December 715 1,106
Comprising: Acquisition costs 285 409 Successful exploration wells 320 581 Pending determination of success 110 116
715 1,106
3.2 OIL AND GAS ASSETS
Oil and gas assets are usually single oil or gas fields being developed for future production or that are in the production phase. Where several individual oil or gas fields are to be produced through common facilities, the individual oil or gas field and the associated production facilities are managed and reported as a single oil and gas asset.
Assets in development
When the technical and commercial feasibility of an undeveloped oil or gas field has been demonstrated and approval of commercial development occurs, the field enters its development phase from the exploration and evaluation phase. Expenditure on the construction, installation or completion of infrastructure facilities such as platforms, pipelines, and the drilling of development wells, as well as exploration and evaluation costs, are capitalised as tangible assets within oil and gas assets. Other subsurface expenditures include the costs of de-watering coal seam gas fields to provide access to coal seams to enable production from coal seam gas reserves. De-watering costs include the costs of extracting, transporting, treating and disposing of water during the development phase of the coal seam gas fields.
When commercial operation commences the accumulated costs are transferred to oil and gas producing assets.
For
per
sona
l use
onl
y

Financial Report
78 / Santos Annual Report 2015
3.2 OIL AND GAS ASSETS (CONTINUED)
Producing assets
The costs of oil and gas assets in production are separately accounted for as tangible assets and include past exploration and evaluation costs, pre-production development costs and the ongoing costs of continuing to develop reserves for production and to expand or replace plant and equipment and any associated land and buildings.
Ongoing exploration and evaluation activities
Often the initial discovery and development of an oil or gas asset will lead to ongoing exploration for, and evaluation of, potential new oil or gas fields in the vicinity with the intention of producing any near-field discoveries using the infrastructure in place.
Exploration and evaluation expenditure associated with oil and gas assets is accounted for in accordance with the policy note in 3.1. Exploration and evaluation amounts capitalised in respect of oil and gas assets are separately disclosed in the table on page 79.
Depreciation and depletion
Depreciation charges are calculated to write off the value of buildings, plant and equipment over their estimated economic useful lives to the Group. Each component of an item of buildings, plant and equipment with a cost that is significant in relation to the total cost of the asset is depreciated separately.
Depreciation of onshore buildings, plant and equipment and corporate assets is calculated using the straight-line method of depreciation from the date the asset is available for use, unless a units of production method represents a more reasonable allocation of the asset’s depreciable value over its economic useful life.
The estimated useful lives for each class of onshore assets for the current and comparative periods are generally as follows:
• Buildings 20 – 50 years
• Pipelines 10 – 30 years
• Plant and facilities 10 – 50 years
Depreciation of offshore plant and equipment is calculated using the units of production method from the date of commencement of production.
Significant judgement – Estimates of reserve quantities
The estimated quantities of Proven plus Probable (“2P”) hydrocarbon reserves reported by the Group are integral to the calculation of depletion and depreciation expense and to assessments of possible impairment of assets. Estimated reserve quantities are based upon interpretations of geological and geophysical models and assessments of the technical feasibility and commercial viability of producing the reserves. These assessments require assumptions to be made regarding future development and production costs, commodity prices, exchange rates and fiscal regimes. The estimates of reserves may change from period to period as the economic assumptions used to estimate the reserves can change from period to period, and as additional geological data is generated during the course of operations. Reserves estimates are prepared in accordance with the Group’s policies and procedures for reserves estimation which conform to guidelines prepared by the Society of Petroleum Engineers.
Accounting judgement and estimate – Depletion charges
Depletion and certain depreciation charges are calculated using the units of production method. This is based on barrels of oil equivalent which will amortise the cost of carried forward exploration, evaluation and subsurface development expenditure (“subsurface assets”) over the life of the estimated 2P hydrocarbon reserves for an asset or group of assets, together with future subsurface costs necessary to develop the hydrocarbon reserves in the respective asset or group of assets.
Notes to the Consolidated Financial StatementsSection 3: Capital Expenditure, Operating Assets and Restoration Obligations
For
per
sona
l use
onl
y

Santos Annual Report 2015 / 79
3.2 OIL AND GAS ASSETS (CONTINUED)
2015 2014
Subsurface Plant and Subsurface Plant and assets equipment Total assets equipment Total $million $million $million $million $million $million
Cost 13,278 21,400 34,678 12,494 19,259 31,753Less accumulated depreciation, depletion and impairment (9,692) (7,934) (17,626) (7,864) (5,467) (13,331)
Balance at 31 December 3,586 13,466 17,052 4,630 13,792 18,422
Reconciliation of movements Assets in development Balance at 1 January 424 5,567 5,991 1,225 7,832 9,057Additions 16 363 379 248 1,637 1,885Capitalised depreciation – 32 32 – 15 15Transfer from exploration and evaluation assets – – – 10 – 10Transfer to oil and gas assets in production (225) (5,208) (5,433) (1,094) (4,386) (5,480)Transfer to oil and gas assets held for sale net of impairment (97) (135) (232) – – –Net impairment losses on assets transferred to held for sale (13) (19) (32) – – –Exchange differences 27 694 721 35 469 504
Balance at 31 December 132 1,294 1,426 424 5,567 5,991
Producing assets Balance at 1 January 4,206 8,225 12,431 3,417 3,349 6,766Acquisitions of oil and gas assets 1 – 1 6 10 16Additions 536 722 1,258 757 879 1,636Transfer from exploration and evaluation assets 1 – 1 123 – 123Transfer from oil and gas assets in development 225 5,208 5,433 1,094 4,386 5,480Disposals (70) (32) (102) (7) (3) (10)Depreciation and depletion (428) (616) (1,044) (459) (499) (958)Net impairment losses (1,227) (1,930) (3,157) (820) (273) (1,093)Impairment of exploration and evaluation expenditure pending commercialisation (44) – (44) (70) – (70)Exchange differences 254 595 849 165 376 541
Balance at 31 December 3,454 12,172 15,626 4,206 8,225 12,431
Total oil and gas assets 3,586 13,466 17,052 4,630 13,792 18,422
Comprising: Exploration and evaluation expenditure pending commercialisation 283 – 283 184 – 184 Other capitalised expenditure 3,303 13,466 16,769 4,446 13,792 18,238
3,586 13,466 17,052 4,630 13,792 18,422
For
per
sona
l use
onl
y

Financial Report
80 / Santos Annual Report 2015
Notes to the Consolidated Financial StatementsSection 3: Capital Expenditure, Operating Assets and Restoration Obligations3.3 IMPAIRMENT OF NON-CURRENT ASSETS
The carrying amounts of the Group’s oil and gas assets are reviewed at each reporting date to determine whether there is any indication of impairment. Where an indicator of impairment exists, a formal estimate of the recoverable amount is made.
Indicators of impairment – exploration and evaluation assets
The carrying amounts of the Group’s exploration and evaluation assets are reviewed at each reporting date, to determine whether any of the following indicators of impairment exists:
(i) tenure over the licence area has expired during the period or will expire in the near future, and is not expected to be renewed; or
(ii) substantive expenditure on further exploration for, and evaluation of, mineral resources in the specific area is not budgeted or planned; or
(iii) exploration for, and evaluation of, resources in the specific area have not led to the discovery of commercially viable quantities of resources, and the Group has decided to discontinue activities in the specific area; or
(iv) sufficient data exists to indicate that although a development is likely to proceed, the carrying amount of the exploration and evaluation asset is unlikely to be recovered in full from successful development or from sale.
Cash generating units – oil and gas assets
Oil and gas assets, land, buildings, plant and equipment are assessed for impairment on a cash-generating unit basis. A cash-generating unit is the smallest grouping of assets that generates independent cash inflows, and generally represents an individual oil or gas field. Impairment losses recognised in respect of cash-generating units are allocated to reduce the carrying amount of the assets in the unit on a pro-rata basis.
Individual assets within a cash-generating unit may become impaired if their ongoing use changes or that the benefits to be obtained from ongoing use are likely to be less than the carrying value of the individual asset. An impairment loss is recognised in the income statement whenever the carrying amount of an asset or its cash-generating unit exceeds its recoverable amount.
For
per
sona
l use
onl
y

Santos Annual Report 2015 / 81
3.3 IMPAIRMENT OF NON-CURRENT ASSETS (CONTINUED)
Recoverable amount
The recoverable amount of an asset is the greater of its fair value less costs of disposal (“FVLCD”) (based on level 3 fair value hierarchy) and its value-in-use (“VIU”), using an asset’s estimated future cash flows (as described below) discounted to their present value using a pre-tax discount rate that reflects current market assessments of the time value of money and the risks specific to the asset.
Significant judgement – Impairment of oil and gas assets
For oil and gas assets, the expected future cash flow estimation is based on a number of factors, variables and assumptions, the most important of which are estimates of reserves, future production profiles, commodity prices, costs and foreign exchange rates. In most cases, the present value of future cash flows is most sensitive to estimates of future oil price and discount rates.
The estimated future cash flows for the VIU calculation are based on estimates, the most significant of which are 2P hydrocarbon reserves, future production profiles, commodity prices, operating costs and any future development costs necessary to produce the reserves. Under a FVLCD calculation, future cash flows are based on estimates of 2P hydrocarbon reserves in addition to other relevant factors such as value attributable to additional resource and exploration opportunities beyond 2P reserves based on production plans.
Estimates of future commodity prices are based on the Group’s best estimate of future market prices with reference to external market analysts’ forecasts, current spot prices and forward curves. Future commodity prices are reviewed at least annually. Where volumes are contracted, future prices are based on the contracted price. Future prices (US$/bbl) used were:
2016 2017 2018 20191 20201 20211
40.00 60.00 70.00 80.77 82.79 84.86
1. Based on US$75/bbl (2016 real) from 2019 escalated at 2.5%.
Forecasts of the foreign exchange rate for foreign currencies, where relevant, are estimated with reference to observable external market data and forward values, including analysis of broker and consensus estimates. The future estimated rate applied is A$/US$ of 0.70 in 2016 and 2017, and A$/US$ of 0.75 in all subsequent years.
The discount rates applied to the future forecast cash flows are based on the Group’s weighted average cost of capital, adjusted for risks where appropriate, including functional currency of the asset, and risk profile of the countries in which the asset operates. The range of pre-tax discount rates that have been applied to non-current assets is between 9.0% and 17.9%.
In the event that future circumstances vary from these assumptions, the recoverable amount of the Group’s oil and gas assets could change materially and result in impairment losses or the reversal of previous impairment losses.
Due to the interrelated nature of the assumptions, movements in any one variable can have an indirect impact on others and individual variables rarely change in isolation. Additionally, management can be expected to respond to some movements, to mitigate downsides and take advantage of upsides, as circumstances allow. Consequently, it is impracticable to estimate the indirect impact that a change in one assumption has on other variables and hence, on the likelihood, or extent, of impairments or reversals of impairments under different sets of assumptions in subsequent reporting periods.
For
per
sona
l use
onl
y

Financial Report
82 / Santos Annual Report 2015
Notes to the Consolidated Financial StatementsSection 3: Capital Expenditure, Operating Assets and Restoration Obligations3.3 IMPAIRMENT OF NON-CURRENT ASSETS (CONTINUED)
2015 2014 Impairment expense Note $million $million
Current assets Assets held for sale 3.6 32 –Other assets 6 9
Total impairment of current assets 38 9
Non-current assets Exploration and evaluation assets 685 1,170Oil and gas assets 3,201 1,163Investments in joint ventures 6.3(b) – 14
Total impairment of non-current assets 3,886 2,347
Total impairment 3,924 2,356
Recoverable amounts and resulting impairment write-downs recognised in the year ended 31 December 2015 are:
Subsurface Plant and Recoverable assets equipment Total amount1 2015 Segment $million $million $million $million
Exploration and evaluation assets: Gunnedah Basin Eastern Australia 563 25 588 nil Cooper – unconventional resources Eastern Australia 23 – 23 102 Papua New Guinea Asia Pacific 52 – 52 112 Malaysia Asia Pacific 22 – 22 104
Total impairment of exploration and evaluation assets 660 25 685
Oil and gas assets-producing: Cooper Basin Eastern Australia 783 1,312 2,095 1,371 Mereenie Eastern Australia – 13 13 62 Patricia Baleen Eastern Australia 10 7 17 26 Barrow WA&NT 96 152 248 64 WA&NT oil assets WA&NT 73 19 92 25 Vietnam (Chim Sáo/Dua) Asia Pacific 64 42 106 162 SE Gobe Asia Pacific 1 5 6 nil GLNG GLNG 224 341 565 9,414 Denison GLNG 20 39 59 nil
Total impairment of oil and gas assets 1,271 1,930 3,201
Total impairment of non-current assets 1,931 1,955 3,886
1 Recoverable amounts represent the carrying values of assets before deducting the carrying value of restoration liabilities. All producing oil and gas asset amounts are calculated using the VIU method, whilst all exploration and evaluation asset amounts use the FVLCD method.F
or p
erso
nal u
se o
nly

Santos Annual Report 2015 / 83
3.3 IMPAIRMENT OF NON-CURRENT ASSETS (CONTINUED)
The impairment charges noted above primarily result from the lower oil price environment and, in some cases, a consequential reduction or delay in future capital expenditure that diminishes or removes the path to commercialisation.
As the CGUs above have been written down to their respective recoverable amounts, any change in key assumptions on which the valuations are based would further impact asset carrying values. When modelled in isolation, it is estimated that changes in the key assumptions would result in the following additional impairment in 2015 on the CGUs which are already impaired:
Oil price decrease Discount rate US$5/bbl increase 0.50% all years Sensitivity $million $million
Cooper Basin 95 487 Mereenie 4 11 Patricia Baleen 1 nil Barrow 2 18 WA&NT oil assets 1 7 Vietnam (Chim Sáo/Dua) 2 27 GLNG 551 1,010
As identified above, the impact of changes in key assumptions such as 2P reserves, production levels, commodity prices and discount rates are significant on the determination of recoverable amount. Due to the number of factors that could impact any of these assumptions, as well as any actions taken to respond to adverse changes, actual future determinations of recoverable amount may vary from those stated above.
Recoverable amounts and resulting impairment write-downs recognised in the year ended 31 December 2014 were:
Subsurface Plant and Recoverable assets equipment Total amount1 2014 Segment $million $million $million $million
Exploration and evaluation assets: Gunnedah Basin Eastern Australia 808 – 808 543 Carnarvon Basin (Winchester, Zola/Bianchi) WA&NT 198 – 198 nil Browse Basin (Bassett-West) WA&NT 57 – 57 nil Bangladesh (Magnama) Asia Pacific 49 – 49 nil Indonesia (CBM interests) Asia Pacific 58 – 58 nil
Total impairment of exploration and evaluation assets 1,170 – 1,170
Oil and gas assets: Cooper Basin (specific oil assets) Eastern Australia 574 114 688 883 Cooper Basin (unconventional resources) Eastern Australia 70 – 70 70 Mereenie Eastern Australia 68 32 100 145 Carnarvon Basin (Stag, Barrow, Thevenard, Mutineer-Exeter/Fletcher Finucane) WA & NT 113 88 201 456 Vietnam (Chim Sáo/Dua) Asia Pacific 60 37 97 336 SE Gobe Asia Pacific 5 2 7 nil
Total impairment of oil and gas assets 890 273 1,163
Total impairment of non-current assets 2,060 273 2,333
1 Recoverable amounts represent the carrying values of assets before deducting the carrying value of restoration liabilities.
For
per
sona
l use
onl
y

Financial Report
84 / Santos Annual Report 2015
Notes to the Consolidated Financial StatementsSection 3: Capital Expenditure, Operating Assets and Restoration Obligations3.4 RESTORATION OBLIGATIONS
Provisions for future removal and environmental restoration costs are recognised where there is a present obligation as a result of exploration, development, production, transportation or storage activities having been undertaken, and it is probable that future outflow of economic benefits will be required to settle the obligation. The estimated future obligations include the costs of removing facilities, abandoning wells and restoring the affected areas and is the best estimate of the present value of the future expenditure required to settle the restoration obligation at the reporting date, based on current legal requirements. Any changes in the estimate are reflected in the present value of the restoration provision at the reporting date, with a corresponding change in the cost of the associated asset.
The amount of the provision for future restoration costs relating to exploration, development and production facilities is capitalised and depleted as a component of the cost of those activities.
Significant judgement – Provision for restoration
The Group estimates the future removal and restoration costs of oil and gas production facilities, wells, pipelines and related assets at the time of installation of the assets and reviews these assessments periodically. In most instances the removal of these assets will occur many years in the future. The estimate of future removal costs therefore requires management to make judgements regarding the removal date, future environmental legislation, the extent of restoration activities required and future removal technologies.
The Group has recorded provisions for restoration obligations as follows:
2015 2014 $million $million
Current provision 71 36 Non-current provision 2,372 2,121
2,443 2,157
Movements in the provision during the financial year are set out below:
Total restoration $million
Balance at 1 January 2015 2,157 Provisions made during the year 147 Provisions used during the year (34) Unwind of discount 63 Disposal of provision (25) Change in discount rate 91 Transferred to liabilities held for sale (18) Exchange differences 62
Balance at 31 December 2015 2,443
Other provisions – current
In addition to the provision for restoration shown above and employee provisions in note 7.1, other items for which a current provision has been recorded are carbon, nil in 2015 (2014: $20 million), and other provisions, $18 million (2014: $9 million).F
or p
erso
nal u
se o
nly

Santos Annual Report 2015 / 85
3.5 COMMITMENTS FOR EXPENDITURE
The Group has certain obligations to perform minimum exploration work and expend minimum amounts of money pursuant to the terms of the granting of petroleum exploration permits in order to maintain rights of tenure.
These commitments may be varied as a result of renegotiations of the terms of the exploration permits, licences or contracts or alternatively upon their relinquishment. The minimum exploration commitments are less than the normal level of exploration expenditures expected to be undertaken by the Group.
The Group leases floating production, storage and offtake facilities, floating storage offloading facilities, LNG carriers and mobile offshore production units under operating leases. The leases typically run for a period of four to six years, and may have an option to renew after that time.
The Group also leases building office space and a warehouse under operating leases. The leases are generally for a period of 10 years, with an option to renew the lease after that date. The lease payments typically increase annually by the Consumer Price Index.
During the year ended 31 December 2015, the Group recognised $98 million (2014: $101 million) as an expense in the income statement in respect of operating leases.
The Group has the following commitments for expenditure for which no liabilities have been recorded in the financial statements as the goods or services have not been received, including non-cancellable operating lease rentals:
Capital Minimum exploration Operating lease
2015 2014 2015 2014 2015 2014 Commitments $million $million $million $million $million $million
Not later than one year 396 879 242 180 160 122 Later than one year but not later than five years 45 229 431 745 274 298 Later than five years – 294 2 2 184 219
441 1,402 675 927 618 639
For
per
sona
l use
onl
y

Financial Report
86 / Santos Annual Report 2015
3.6 ASSETS HELD FOR SALE
Non-current assets are classified as held for sale and measured at the lower of their carrying amount and fair value less costs of disposal if their carrying amount will be recovered principally through a sale transaction. They are not depreciated or amortised. For an asset to be classified as held for sale, it must be available for immediate sale in its present condition and its sale must be highly probable.
An impairment loss is recognised for any initial or subsequent write-down of the asset (or disposal group) to fair value less cost of disposal. A gain is recognised for any subsequent increases in fair value less cost of disposal of an asset (or disposal group) but not in excess of any cumulative impairment loss previously recognised. A gain or loss not previously recognised by the date of the sale of the non-current asset (or disposal group) is recognised at the date of derecognition.
Following agreement to sell the Group’s 35% interest in Kipper, the associated assets and liabilities have been classified as held for sale at 31 December 2015. The sale agreement remained subject to outstanding conditions at 31 December 2015 and will be accounted for upon completion or waiver of each significant condition.
The following amounts are included within the financial statements in relation to joint operations classified as held for sale:
2015 Assets and liabilities classified as held for sale $million
Prepayments 263 Oil and gas assets 232 Deferred tax asset 56
Assets classified as held for sale 551
Trade and other payables 1 Restoration provisions 18
Liabilities classified as held for sale 19
Net assets 532
An impairment loss of $32 million attributed to the write-down of Kipper assets to fair value has been recorded.
The assets and liabilities associated with Kipper are attributed to the Eastern Australia segment.
Notes to the Consolidated Financial StatementsSection 3: Capital Expenditure, Operating Assets and Restoration Obligations
For
per
sona
l use
onl
y

Santos Annual Report 2015 / 87
This section provides information about the Group’s working capital balances and management, including cash flow information. Cash flow management is a significant consideration in running our business in an efficient and resourceful manner. We also consider inventories which contribute to the business platform for generating profits and revenues.
4.1 CASH AND CASH EQUIVALENTS
Cash and cash equivalents comprise cash balances and short-term deposits that are readily convertible to cash, are subject to an insignificant risk of changes in value, and generally have an original maturity of three months or less.
The carrying amounts of cash and cash equivalents represent fair value. Bank balances and short-term deposits earn interest at floating rates based upon market rates.
2015 2014 $million $million
Cash at bank and in hand 504 775Short-term deposits 650 –
1,154 775
(a) Restricted cash balances
In accordance with the terms of the PNG LNG project financing, cash relating to the Group’s interest in undistributed cash flows of the PNG LNG project is required to be held in secured bank accounts. As at 31 December 2015, US$33 million (2014: US$35 million) was held in these accounts.
2015 2014 Cash flow activities $million $million
(b) Reconciliation of cash flows from operating activities
Loss after income tax (2,698) (935) Add/(deduct) non-cash items: Depreciation and depletion 1,059 988 Exploration and evaluation expensed 114 95 Net impairment loss 3,924 2,356 Net gains on fair value hedges (21) (63) Share-based payment expense 23 24 Unwind of the effect of discounting on provisions 63 62 Foreign exchange (gains)/losses (251) 5 Other 4 (4)
Net cash provided by operating activities before changes in assets or liabilities 2,217 2,528 Add/(deduct) change in operating assets or liabilities, net of acquisitions or disposals of businesses: Decrease in trade and other receivables 91 155 Increase in inventories (80) (12) Increase in other assets (31) (42) Decrease in net deferred tax liabilities (843) (669) Decrease in current tax liabilities (56) (52) Decrease in trade and other payables (168) (50) Decrease in provisions (36) (15)
Net cash provided by operating activities 1,094 1,843
(c) Non-cash financing and investing activities
Santos Dividend Reinvestment Plan 83 145
Notes to the Consolidated Financial StatementsSection 4: Working Capital Management
For
per
sona
l use
onl
y

Financial Report
88 / Santos Annual Report 2015
Notes to the Consolidated Financial StatementsSection 4: Working Capital Management
4.2 TRADE AND OTHER RECEIVABLES
Trade and other receivables are initially recognised at fair value, which in practice is the equivalent of cost, less any impairment losses.
Long-term receivables are discounted and are stated at amortised cost, less any impairment losses.
Trade receivables are non-interest-bearing and settlement terms are generally within 30 days. Trade receivables that are neither past due nor impaired relate to a number of independent customers for whom there is no recent history of default.
2015 2014 $million $million
Current Trade receivables 341 424Other receivables 198 209
539 633
Non-current
Other receivables 6 10
Of the Group’s $545 million total receivables (2014: $643 million), $529 million (2014: $630 million) is not yet due and $2 million (2014: $5 million) is past due by over 12 months but not impaired. No amounts are considered impaired at 31 December 2015 (2014: nil).
4.3 INVENTORIES
Inventories are stated at the lower of cost and net realisable value. Net realisable value is the estimated selling price in the ordinary course of business, less the estimated costs of completion and selling expenses. Cost is determined as follows:
(i) drilling and maintenance stocks, which include plant spares, consumables and maintenance and drilling tools used for ongoing operations, are valued at weighted average cost; and
(ii) petroleum products, which comprise extracted crude oil, liquefied petroleum gas, condensate and naphtha stored in tanks and pipeline systems and processed sales gas and ethane stored in subsurface reservoirs, are valued using the absorption cost method in a manner which approximates specific identification.
2015 2014 $million $million
Petroleum products 362 293Drilling and maintenance stocks 133 150
Total inventories at lower of cost and net realisable value 495 443
Inventories included above that are stated at net realisable value 85 53
4.4 TRADE AND OTHER PAYABLES
Trade and other payables are recognised when the related goods or services are received, at the amount of cash or cash equivalents that will be required to discharge the obligation, gross of any settlement discount offered. Trade payables are non-interest-bearing and are settled on normal terms and conditions.
2015 2014 $million $million
Trade payables 738 1,235Non-trade payables 111 147
849 1,382
For
per
sona
l use
onl
y

Santos Annual Report 2015 / 89
Our business has exposure to capital, credit, liquidity and market risks. This section provides information relating to our management of, as well as, our policies for measuring and managing these risks.
Capital risk management objectives
The Group’s objectives when managing capital are to safeguard its ability to continue as a going concern, allowing returns to shareholders and benefits for other stakeholders to be maintained, and to retain an efficient capital structure. In order to optimise the capital structure, the Group may adjust its dividend distribution policy, return capital to shareholders, issue new shares, draw or repay debt or undertake other corporate initiatives consistent with its strategic objectives.
In applying these objectives, the Group aims to:
• minimise the weighted average cost of capital whilst retaining appropriate financial flexibility;
• ensure ongoing access to a range of debt and equity markets; and
• maintain an investment grade credit rating.
A range of financial metrics are used to monitor the capital structure including ratios measuring Gearing, Funds from Operations to Debt (“FFO-to-Debt”) and Debt to Earnings before Interest, Tax, Depreciation and Amortisation (“Debt-to-EBITDA”). The Group monitors these capital structure metrics on both an actual and forecast basis.
Santos Limited’s corporate credit rating was lowered by Standard & Poor’s to BBB- (negative outlook) on 22 January 2016.
5.1 INTEREST-BEARING LOANS AND BORROWINGS
Interest-bearing loans and borrowings are recognised initially at fair value, net of transaction costs incurred. Subsequent to initial recognition, interest-bearing loans and borrowings are stated at amortised cost with any difference between cost and redemption value being recognised in the income statement over the period of the borrowings on an effective interest basis.
Fixed-rate notes that are hedged by an interest rate swap are recognised at fair value.
All borrowings are unsecured, with the exception of the secured bank loans and finance leases.
All interest-bearing loans and borrowings, with the exception of secured bank loans and finance leases, are borrowed through Santos Finance Ltd, which is a wholly-owned subsidiary of Santos Limited. All interest-bearing loans and borrowings by Santos Finance Ltd are guaranteed by Santos Limited.
Details of the contractual maturities can be found in note 5.5.
2015 2014 Ref $million $million
Current Commercial paper (a) – 140Bank loans – secured (b) 164 –Bank loans – unsecured (c) 44 19Medium-term notes (d) – 102Long-term notes (e) – 64Finance leases (g) 2 2
210 327
Non-current Bank loans – secured (b) 2,405 2,282Bank loans – unsecured (c) 2,354 3,269Long-term notes (e) 829 777Subordinated notes (f) 1,575 1,590Finance leases (g) 48 7
7,211 7,925
Notes to the Consolidated Financial StatementsSection 5: Funding and Risk Management
For
per
sona
l use
onl
y
Financial Report
90 / Santos Annual Report 2015
Notes to the Consolidated Financial StatementsSection 5: Funding and Risk Management
5.1 INTEREST-BEARING LOANS AND BORROWINGS (CONTINUED)
The Group’s weighted average interest rate on interest-bearing liabilities is 4.07% as at 31 December 2015 (2014: 4.32%).
(a) Commercial paper
Facility Commercial paper
Currency Australian dollars Limit A$800 million uncommitted (2014: A$800 million) Drawn principal Nil (2014: A$140 million) Accounting balance Nil (2014: A$140 million)
(b) Bank loans – secured
Facility PNG LNG
Currency US dollars Limit US$1,973 million (2014: US$1,989 million) Drawn principal US$1,973 million (2014: US$1,989 million) Accounting balance A$2,569 million (2014: A$2,282 million) including prepaid amounts Effective interest rate 4.57% (2014: 4.26%) Maturity 2024–2026 Other Loan facilities for the PNG LNG project, in which Santos entities hold an equity interest of
13.5%, were entered into by the joint venture participants on 15 December 2009 and are provided by 17 commercial banks and six export credit agencies, bear fixed and floating rates of interest and have final maturity dates of June 2024 and June 2026 respectively. Funds were also provided by a co-venturer on a pro-rata basis with maturities matching those corresponding to the commercial banks and export credit agencies.
During 2013 supplemental loan financing was raised by the joint venture participants. The funds were sourced from co-venturer and commercial bank lenders, with maturities matching the initial loan facilities.
Assets pledged as security and restricted cash
The PNG LNG facilities include security over assets and entitlements of the participants in respect of the project. The total carrying value of the Group’s assets pledged as security is A$4,001 million at 31 December 2015 (2014: A$3,674 million).
As referred to in note 4.1, under the terms of the project financing, cash relating to the Group’s interest in undistributed project cash flows is required to be held in secured bank accounts. Funds held in these accounts attributable to the Group may be withdrawn on the provision of acceptable credit support to the lenders. As at 31 December 2015, letters of credit totalling US$100 million (A$137 million) (2014: US$290 million, A$354 million) had been provided under a stand-alone US$300 million facility.
(c) Bank loans – unsecured
Facility Term bank loans
Currency US dollars Limit US$33 million (2014: US$48 million) Drawn principal US$33 million (2014: US$48 million) Accounting balance A$45 million (2014: A$59 million) Effective interest rate 0.41% (2014: 0.40%) Maturity 2016–2017F
or p
erso
nal u
se o
nly

Santos Annual Report 2015 / 91
5.1 INTEREST-BEARING LOANS AND BORROWINGS (CONTINUED)
(c) Bank loans – unsecured (continued)
Facility Export credit agency supported loan facilities
Currency US dollars Limit US$1,730 million (2014: US$1,730 million) Drawn principal US$1,730 million (2014: US$1,730 million) Accounting balance A$2,353 million (2014: A$2,083 million) including prepaid amounts Effective interest rate 2.40% (2014: 2.79%) Maturity 2016–2024 Other Loan facilities supported by various export credit agencies, which have estimated maturity
dates subject to the date of practical completion of the GLNG project.
Facility Bilateral bank loan facility
Currency Australian dollars and US dollars Limit Australian dollar facility: A$1,425 million (2014: A$2,050 million)
US dollar facility: US$1,600 million (2014: US$1,100 million) Drawn principal Nil (2014: A$1,150 million) Accounting balance Nil (2014: A$1,146 million) Maturity 2016–2020
(d) Medium-term notes
Facility Medium-term notes
Currency Australian dollars Limit A$1,000 million (2014: A$1,000 million) Drawn principal Nil (2014: A$100 million) Accounting balance Nil (2014: A$102 million) Effective interest rate 2.96% (2014: 3.23%) Maturity 2015
(e) Long-term notes
Facility Long-term notes
Currency US dollars Limit US$577 million (2014: US$627 million) Drawn principal US$577 million (2014: US$627 million) Accounting balance A$829 million (2014: A$841 million) including fair value accounting measurement
and prepaid amounts Effective interest rate 1.25% to 2.09% Maturity 2015–2027 Other Long-term notes bear a fixed interest rate of 6.05% to 6.81% (2014: 6.05% to 8.44%),
which have been swapped to floating rate commitments. The Group has entered into interest rate swap contracts, under which it has a right to receive interest at floating US dollar rates and pay interest at fixed US dollar interest rates. These contracts are in place to cover coupon payments through to the end of 2016.
(f) Subordinated notes
Facility Subordinated notes
Currency Euro Limit €1,000 million (2014: €1,000 million) Drawn principal €1,000 million (2014: €1,000 million) Accounting balance A$1,575 million (2014: A$1,590 million) including fair value accounting measurement and
prepaid amounts Effective interest rate 6.12% (2014: 6.11%) Maturity 2070 Other The notes mature after 60 years and can be redeemed at the Group’s option on or after
22 September 2017.
For
per
sona
l use
onl
y

Financial Report
92 / Santos Annual Report 2015
Notes to the Consolidated Financial StatementsSection 5: Funding and Risk Management
5.1 INTEREST-BEARING LOANS AND BORROWINGS (CONTINUED)
(g) Finance lease commitments
Finance lease commitments are payable as follows:
2015 2014 $million $million
Not later than one year 11 8 Later than one year but not later than five years 51 42 Later than five years 181 173
Minimum lease payments 243 223 Future finance charges (75) (140) Leases not commenced at reporting date (118) (74)
Total lease liabilities 50 9
The Group leases LNG carriers and tug facilities under finance leases. The leases have terms of between 10 and 20 years with
varying renewal options. The LNG carrier finance leases had not commenced at reporting date. Title does not pass to the Group on expiration of the relevant lease period.
5.2 NET FINANCE COSTS
Borrowing costs
Borrowing costs relating to major oil and gas assets under development are capitalised as a component of the cost of development. Where funds are borrowed specifically for qualifying projects the actual borrowing costs incurred are capitalised. Where the projects are funded through general borrowings the borrowing costs are capitalised based on the weighted average cost of borrowing. Borrowing costs incurred after commencement of commercial operations are expensed to the income statement.
All other borrowing costs are recognised in the income statement in the period in which they are incurred.
Interest income
Interest income is recognised in the income statement as it accrues using the effective interest method.
2015 2014 $million $million
Finance income: Interest income 7 19
Total finance income 7 19
Finance costs: Interest paid to third parties 390 290 Deduct borrowing costs capitalised (156) (236)
234 54 Unwind of the effect of discounting on provisions 63 62
Total finance costs 297 116
Net finance costs 290 97
For
per
sona
l use
onl
y

Santos Annual Report 2015 / 93
5.3 ISSUED CAPITAL
Ordinary share capital
Ordinary share capital is classified as equity. The issued shares do not have a par value and there is no limit on the authorised share capital of the Company.
Fully paid ordinary shares carry one vote per share, which entitles the holder to participate in dividends and the proceeds on winding up of the Company in proportion to the number of and amounts paid on the shares held. The market price of the Company’s ordinary shares on 31 December 2015 was $3.68 (2014: $8.25).
Transaction costs
Transaction costs of an equity transaction are accounted for as a deduction from equity, net of any related income tax benefit. During 2015 transaction costs of $36 million have been deducted from equity.
2015 2014 Number Number 2015 2014 Movement in ordinary shares Note of shares of shares $million $million
Balance at 1 January 983,750,151 972,088,279 6,905 6,749Placement 73,529,412 – 500 –Rights issue 654,198,741 – 2,482 –Santos Dividend Reinvestment Plan (“DRP”) 15,052,884 10,342,340 83 145DRP underwriting 37,960,195 – 215 –Santos Employee Share1000 Plan 7.2 180,040 111,507 1 2Santos Employee ShareMatch Plan 7.2 890,889 536,383 6 8Shares issued on exercise of options 7.2 – 99,400 – 1Shares issued on vesting of Share Acquisition Rights 7.2 611,618 560,742 – –Santos Executive Share Plan 18,000 11,500 – –Non-executive Director Share Plan 18,709 – – –
Balance at 31 December 1,766,210,639 983,750,151 10,192 6,905
Included within the Group’s ordinary shares at 31 December 2015 are 25,000 (2014: 43,000) ordinary shares paid to one cent with a value of nil (2014: nil).
Santos Dividend Reinvestment Plan
The Santos DRP is in operation. Shares are allocated at the arithmetic average of the daily weighted average market price of the Company’s shares on the ASX over a period of seven business days commencing on the second business day after the Dividend Record Date. At this time, the Board has determined that a 1.5% discount will apply to the Santos DRP on the final dividend for the year ended 31 December 2015. The last date for the receipt of an election notice to participate in the Santos DRP is the record date, 26 February 2016.
For
per
sona
l use
onl
y

Financial Report
94 / Santos Annual Report 2015
Notes to the Consolidated Financial StatementsSection 5: Funding and Risk Management
5.4 RESERVES AND RETAINED EARNINGS
The Group’s reserves and retained earnings balances, and movements during the period, are disclosed in the statement of changes in equity.
Translation reserve
The translation reserve comprises all foreign exchange differences arising from the following:
• the translation of the financial statements of foreign operations where their functional currency is different from the presentation currency of the reporting entity;
• the translation of liabilities that hedge the Company’s net investment in a foreign subsidiary; and
• exchange differences that arise on the translation of the monetary items that form part of the net investment in a foreign operation.
Hedging reserve
The hedging reserve comprises the effective portion of the cumulative net change in the fair value of cash flow hedging instruments related to hedged transactions that have not yet occurred.
Accumulated profits reserve
The accumulated profits reserve acts to quarantine profits generated in prior periods. The reserve was established during 2015.
5.5 FINANCIAL RISK MANAGEMENT
Exposure to foreign currency risk, interest rate risk, commodity price risk, credit risk and liquidity risk arises in the normal course of the Group’s business. The Group’s overall financial risk management strategy is to seek to ensure that the Group is able to fund its corporate objectives and meet its obligations to stakeholders. Derivative financial instruments may be used to hedge exposure to fluctuations in foreign exchange rates, interest rates and commodity prices.
The Group uses various methods to measure the types of financial risk to which it is exposed. These methods include Cash Flow at Risk analysis in the case of interest rate, foreign exchange and commodity price risk, and ageing analysis for credit risk.
Financial risk management is carried out by a central treasury department (“Treasury”) which operates under Board-approved policies. The policies govern the framework and principles for overall risk management and covers specific financial risks, such as foreign exchange risk, interest rate risk and credit risk, approved derivative and non-derivative financial instruments, and liquidity management.
(a) Liquidity
The Group adopts a prudent liquidity risk management strategy and seeks to maintain sufficient liquid assets and available committed credit facilities to meet short-term to medium-term liquidity requirements. The Group’s objective is to maintain flexibility in funding to meet ongoing operational requirements, exploration and development expenditure, and other corporate initiatives.
For
per
sona
l use
onl
y

Santos Annual Report 2015 / 95
5.5 FINANCIAL RISK MANAGEMENT (CONTINUED)
(a) Liquidity (continued)
The following tables analyse the contractual maturities of the Group’s financial assets and liabilities held to manage liquidity risk. The relevant maturity groupings are based on the remaining period to the contractual maturity date, as at 31 December. The amounts disclosed in the tables are the contractual undiscounted cash flows comprising principal and interest repayments. Estimated variable interest expense is based upon appropriate yield curves as at 31 December.
Less than 1 to 2 2 to 5 More than 1 year years years 5 years 2015 $million $million $million $million
Financial assets held to manage liquidity risk Cash and cash equivalents 1,154 – – – Derivative financial assets Interest rate swap contracts 41 36 51 24 Derivative financial liabilities Cross-currency swap contracts 4 (444) – – Non-derivative financial liabilities Trade and other payables (849) – – – Obligations under finance leases (1) (1) (3) (44) Bank loans (396) (454) (2,966) (2,350) Long-term notes (50) (325) (294) (360) Subordinated debt (124) (1,626) – –
(221) (2,814) (3,212) (2,730)
Less than 1 to 2 2 to 5 More than 1 year years years 5 years 2014 $million $million $million $million
Financial assets held to manage liquidity risk Cash and cash equivalents 775 – – – Derivative financial assets Interest rate swap contracts 41 40 60 29 Derivative financial liabilities Cross-currency swap contracts 22 10 (241) – Non-derivative financial liabilities Trade and other payables (1,382) – – – Obligations under finance leases (2) – (7) (7) Commercial paper (140) – – – Bank loans (170) (480) (4,154) (2,134) Medium-term notes (106) – – – Long-term notes (111) (45) (532) (338) Subordinated debt (123) (123) (1,609) –
(1,196) (598) (6,483) (2,450)
For
per
sona
l use
onl
y

Financial Report
96 / Santos Annual Report 2015
5.5 FINANCIAL RISK MANAGEMENT (CONTINUED)
(b) Foreign currency risk
Foreign exchange risk arises from commercial transactions and valuations of assets and liabilities that are denominated in a currency that is not the entity’s functional currency.
The Group is exposed to foreign currency risk principally through the sale of products denominated in US dollars, borrowings denominated in US dollars and euros and foreign currency capital and operating expenditure. In order to economically hedge foreign currency risk, the Group from time to time enters into forward foreign exchange, foreign currency swap and foreign currency option contracts.
The Group has certain investments in domestic and foreign operations whose net assets are exposed to foreign currency translation risk. Currency exposures arising from the net assets of these operations are managed primarily through borrowings denominated in the relevant foreign currency.
All foreign currency denominated borrowings of Australian dollar functional currency companies are either designated as a hedge of US dollar denominated investments in foreign operations (2015: US$2,340 million; 2014: US$2,855 million), or swapped using cross-currency swaps to US dollars and designated as a hedge of US dollar denominated investments in foreign operations (2015: US$1,410 million; 2014: US$1,410 million). As a result, there were no net foreign currency gains or losses arising from translation of US dollar-denominated borrowings recognised in the income statement in 2015.
Monetary items, including financial assets and liabilities, denominated in currencies other than the functional currency of an operation, are periodically restated to Australian dollar equivalents, and the associated gain or loss is taken to the income statement. The exception is foreign exchange gains or losses on foreign currency provisions for restoration at operating sites that are capitalised in oil and gas assets.
Sensitivity to foreign currency movement
Based on the Group’s net financial assets and liabilities at 31 December 2015, the estimated impact on post-tax profit of a ±15 cent movement in the US dollar exchange rate (2014: ±15 cent) combined with a ±10 cent movement in the Euro exchange rate (2014: ±10 cent), each against the Australian dollar, with all other variables held constant is $28 million (2014: $20 million).
(c) Market risk
Cash flow and fair value interest rate risk
The Group’s interest rate risk arises from its borrowings. Borrowings issued at variable rates expose the Group to cash flow interest rate risk. Borrowings issued at fixed rates expose the Group to fair value interest rate risk.
The Group adopts a policy of ensuring that the majority of its exposure to changes in interest rates on borrowings is on a floating rate basis. Interest rate swaps have been entered into as fair value hedges of medium-term notes, long-term notes and subordinated debt. When transacted, these swaps had maturities ranging from 1 to 20 years, aligned with the maturity of the related notes.
During 2013, the Group entered into US dollar-denominated interest rate swaps, which fix the interest rate associated with the coupon payments on US$670 million of uncovered export credit agency supported loan through to the end of 2016. These instruments have been designated as cash flow hedges.
The Group’s interest rate swaps had a notional contract amount of $2,507 million (2014: $2,452 million) and a net fair value of $125 million (2014: $141 million). The net fair value amounts were recognised as fair value derivatives.
Sensitivity to interest rate movement
Based on the net debt position as at 31 December 2015, taking into account interest rate swaps, it is estimated that if the US dollar London Interbank Offered Rate (“LIBOR”) interest rates changed by ±0.50% (2014: ±0.50%), Euro Interbank Offered Rate (“EURIBOR”) changed by ±0.50% (2014: ±0.50%) and Australian Bank Bill Swap reference rate (“BBSW”) changed by ±0.50% (2014: ±0.50%), with all other variables held constant, the impact on post-tax profit is $22 million (2014: $14 million).
This assumes that the change in interest rates is effective from the beginning of the financial year and the net debt position and fixed/floating mix is constant over the year. However, interest rates and the debt profile of the Group are unlikely to remain constant and therefore the above sensitivity analysis will be subject to change.
Commodity price risk exposure
The Group is exposed to commodity price fluctuations through the sale of petroleum products and other oil-price-linked contracts. The Group may enter into commodity crude oil price swap and option contracts to manage its commodity price risk.
Notes to the Consolidated Financial StatementsSection 5: Funding and Risk Management
For
per
sona
l use
onl
y

Santos Annual Report 2015 / 97
5.5 FINANCIAL RISK MANAGEMENT (CONTINUED)
(c) Market risk (continued)
At 31 December 2015, the Group has no open oil price swap contracts (2014: nil), and therefore is not exposed to movements in commodity prices on financial instruments. The Group continues to monitor oil price volatility and to assess whether commodity price hedging is appropriate.
(d) Credit risk
Credit risk represents the potential financial loss if counterparties fail to complete their obligations under financial instrument or customer contracts. Santos employs credit policies which include monitoring exposure to credit risk on an ongoing basis. The majority of Santos’ gas contracts are spread across major Australian energy retailers and industrial users. Contracts exist in every mainland state whilst the largest customer accounts for less than 30% of sales revenue.
At 31 December 2015 there were no significant concentrations of credit risk within the Group and financial instruments are spread amongst a number of financial institutions to minimise the risk of counterparty default.
The maximum exposure to financial institution credit risk is represented by the sum of all cash deposits plus accrued interest, bank account balances and derivative mark-to-market gains.
(e) Fair values
The financial assets and liabilities of the Group are all initially recognised in the statement of financial position at their fair values. The initial fair values of receivables, payables, interest-bearing liabilities and other financial assets and liabilities, which are not subsequently measured at fair value, approximate their carrying value.
The following summarises the significant methods and assumptions used in estimating the fair values of financial instruments:
Derivatives
The fair value of interest rate swaps is calculated by discounting estimated future cash flows based on the terms of maturity of each contract and using market interest rates for a similar instrument at the reporting date. Where these cash flows are in a foreign currency, the present value is converted to Australian dollars at the foreign exchange spot rate prevailing at reporting date.
Financial liabilities
Fair value is calculated based on the present value of future principal and interest cash flows, discounted at the market rate of interest at the reporting date. Where these cash flows are in a foreign currency, the present value is converted to Australian dollars at the foreign exchange spot rate prevailing at reporting date.
Interest rates used for determining fair value
The interest rates used to discount estimated future cash flows, where applicable, are based on the market yield curve and credit spreads at the reporting date. The interest rates including credit spreads used to determine fair value were as follows:
2015 2014 % %
Derivatives (0.1) – 4.1 0.1 – 5.1 Loans and borrowings (0.1) – 4.1 0.1 – 5.1
The Group uses the following hierarchy for determining and disclosing the fair value of financial instruments by valuation technique:
Level 1: quoted (unadjusted) prices in active markets for identical assets and liabilities;
Level 2: other techniques for which all inputs which have a significant effect on the recorded fair value are observable, either directly or indirectly;
Level 3: techniques which use inputs which have a significant effect on the recorded fair value that are not based on observable market data.
All of the Group’s financial instruments were valued using the Level 2 valuation technique.
For
per
sona
l use
onl
y

Financial Report
98 / Santos Annual Report 2015
Notes to the Consolidated Financial StatementsSection 5: Funding and Risk Management
5.5 FINANCIAL RISK MANAGEMENT (CONTINUED)
(f) Hedging
The Group uses derivative financial instruments to hedge its exposures to changes in foreign exchange rates, interest rates and commodity markets arising in the normal course of business. The principal derivatives that may be used are forward foreign exchange contracts, cross-currency interest rate swaps, and interest rate swaps. Their use is subject to a set of policies, procedures and limits approved by the Board of Directors. The Group does not trade in derivative financial instruments for speculative purposes. The Group’s Accounting Policy for fair value and cash flow hedges are as follows:
Types of hedges Fair value hedges Cash flow hedges
What is it? A derivative or financial instrument designated as hedging the change in fair value of a recognised asset or liability.
A derivative or financial instrument to hedge the exposure to variability in cash flows attributable to a particular risk associated with an asset, liability or forecast transaction.
Recognition date At the date the instrument is entered into. At the date the instrument is entered into.
Measurement Measured at fair value, being the estimated amount that the Group would receive or pay to terminate the contracts at the reporting date.
Measured at fair value, being the estimated amount that the Group would receive or pay to terminate the contracts at the reporting date.
Changes in fair value The gains or losses on both the derivative or financial instrument and hedged asset or liability attributable to the hedged risk are recognised in the income statement immediately.
The gain or loss relating to the effective portion of interest rate swaps hedging fixed rate borrowings is recognised in the income statement within finance costs, together with loss or gain in the fair value of the hedged fixed rate borrowings attributable to interest rate risk.
The gain or loss relating to the ineffective portion is recognised in the income statement within other income or other expenses.
If the hedge no longer meets the criteria for hedge accounting, the adjustment to the carrying amount of a hedged item for which the effective interest method is used is amortised to the income statement over the period to maturity using a recalculated effective interest rate.
Changes in the fair value of derivatives designated as cash flow hedges are recognised directly in other comprehensive income and accumulated in equity in the hedging reserve to the extent that the hedge is highly effective. To the extent that the hedge is ineffective, changes in fair value are recognised immediately in the income statement within other income or other expenses.
Amounts accumulated in equity are transferred to the income statement or the balance sheet, for a non-financial asset, at the same time as the hedged item is recognised.
When a hedging instrument expires or is sold, terminated or exercised, or when a hedge no longer meets the criteria for hedge accounting, any cumulative gain or loss existing in equity at that time remains in equity and is recognised when the underlying forecast transaction occurs.
When a forecast transaction is no longer expected to occur, the cumulative gain or loss that was reported in equity is immediately transferred to the income statement.
Hedge of monetary assets and liabilities
When a derivative financial instrument is used to hedge economically the foreign exchange exposure of a recognised monetary asset or liability, hedge accounting is not applied and any gain or loss on the hedging instrument is recognised in the income statement.F
or p
erso
nal u
se o
nly

Santos Annual Report 2015 / 99
5.5 FINANCIAL RISK MANAGEMENT (CONTINUED)
(f) Hedging (continued)
Hedge of net investment in a foreign operation
The gain or loss on an instrument used to hedge a net investment in a foreign operation is recognised directly in equity. On disposal of the foreign operation, the cumulative value of any such gains or losses recognised directly in equity is transferred to the income statement.
Hedges in place
The Group has issued €1,000 million subordinated notes with an average fixed interest rate of 8.25%.
In order to reduce the variability of the cash flows arising from the Euro principal and interest payments to September 2017, the Group entered into cross-currency interest rate swap contracts in March 2011, under which it has a right to receive interest at fixed Euro rates and pay interest at floating US dollar interest rates. These contracts are in place to cover principal and interest payments on €950 million of the subordinated notes through to the call date in 2017.
Subordinated notes totalling €50 million have been swapped to a fixed US dollar interest rate of 8.48% through to the call date in 2017.
The Group has entered into US dollar interest rate swap contracts, under which it has a right to receive interest at floating US dollar rates and pay interest at fixed US dollar interest rates. These contracts are in place to cover coupon payments on US$670 million of uncovered export credit agency supported loans through to the end of 2016.
The cross-currency and interest rate swap contracts are recognised at fair value and all gains and losses attributable to the hedged risks are recognised in the hedge reserve and reclassified into the income statement when the interest expense is recognised.
The table below contains all “other financial assets and liabilities” as shown on the balance sheet, including derivative financial instruments used for hedging:
2015 2014 $million $million
Current assets Amounts held in escrow – 61 Interest rate swap contracts – 5 Other 1 –
1 66
Non-current assets Interest rate swap contracts 125 136 Embedded derivatives – 1 Available-for-sale financial assets 10 10 Amounts held in escrow 71 – Defined benefit surplus 11 – Other – 19
217 166
Current liabilities Other 3 3
3 3
Non-current liabilities Cross-currency swap contracts 388 154 Embedded derivatives 5 – Other 31 27
424 181
For
per
sona
l use
onl
y

Financial Report
100 / Santos Annual Report 2015
This section provides information which will help users understand how the Group structure affects the financial position and performance of the Group as a whole. Specifically it contains information about consolidated entities, acquisitions and disposals of subsidiaries, joint arrangements as well as parties to the Deed of Cross Guarantee under which each company guarantees the debts of others.
6.1 CONSOLIDATED ENTITIES
Subsidiaries are entities controlled by the Company. Control exists when the Company is exposed to, or has the rights to variable returns from its involvement with an entity and has the ability to affect those returns through its power over the entity. The financial statements of subsidiaries are included in the consolidated financial statements from the date that control commences until the date that control ceases.
Acquisitions of subsidiaries are accounted for using the acquisition method of accounting, and are initially recorded in the parent entity’s financial statements at the cost of acquisition less any impairment charges.
A change in ownership interest of a subsidiary that does not result in the loss of control is accounted for as an equity transaction.
Intra-group balances and any unrealised gains and losses or income and expenses arising from intra-group transactions are eliminated in preparing the consolidated financial statements.
Non-controlling interests
Non-controlling interests in the net assets of consolidated entities are allocated their share of net profit after tax in the income statement, and are identified separately from the Group’s equity in those entities. Losses are attributed to the non-controlling interests even if that results in a deficit balance.
Notes to the Consolidated Financial StatementsSection 6: Group Structure
For
per
sona
l use
onl
y

Santos Annual Report 2015 / 101
6.1 CONSOLIDATED ENTITIES (CONTINUED)
Name Country of incorporation
Santos Limited1 (Parent Company) AUSControlled entities: Alliance Petroleum Australia Pty Ltd1 AUSBasin Oil Pty Ltd1 AUSBridgefield Pty Ltd AUSBridge Oil Developments Pty Ltd1 AUSBronco Energy Pty Ltd AUSCanso Resources Pty Ltd AUSDoce Pty Ltd AUSFairview Pipeline Pty Ltd AUSFarmout Drillers Pty Ltd AUSGidgealpa Oil Pty Ltd AUSKipper GS Pty Ltd AUS Controlled entities of Kipper GS Pty Ltd Santos Carbon Pty Ltd AUS Controlled entity of Santos Carbon Pty Ltd SB Jethro Pty Ltd AUSMoonie Pipeline Company Pty Ltd AUSReef Oil Pty Ltd1 AUSSantos Asia Pacific Pty Ltd AUS Controlled entities of Santos Asia Pacific Pty Ltd Santos (Sampang) Pty Ltd AUS Santos (Warim) Pty Ltd AUSSantos Australian Hydrocarbons Pty Ltd AUSSantos (BOL) Pty Ltd1 AUS Controlled entity of Santos (BOL) Pty Ltd Bridge Oil Exploration Pty Ltd AUSSantos Browse Pty Ltd AUSSantos CSG Pty Ltd AUSSantos Darwin LNG Pty Ltd1 AUSSantos Direct Pty Ltd AUSSantos Facilities Pty Ltd AUSSantos Finance Ltd AUSSantos GLNG Pty Ltd AUS Controlled entity of Santos GLNG Pty Ltd Santos GLNG Corp USASantos (Globe) Pty Ltd AUSSantos International Holdings Pty Ltd AUS Controlled entities of Santos International Holdings Pty Ltd Barracuda Ltd PNG Lavana Ltd PNG Sanro Insurance Pte Ltd SGP Santos Americas and Europe Corporation USA Controlled entities of Santos Americas and Europe Corp Santos TPY Corp USA Controlled entities of Santos TPY Corp Santos Queensland Corp USA Santos TOG Corp USA Controlled entities of Santos TOG Corp Santos TOGA Pty Ltd AUS Santos TPY CSG Corp USA Santos Bangladesh Ltd GBR Santos Baturaja Pty Ltd AUS
Name Country of incorporation
Controlled entities of Santos International Holdings Pty Ltd (cont) Santos (BBF) Pty Ltd AUS Controlled entities of Santos (BBF) Pty Ltd Santos (SPV) Pty Ltd AUS Controlled entity of Santos (SPV) Pty Ltd Santos (Madura Offshore) Pty Ltd AUS Santos Belida Pty Ltd AUS Santos (Donggala) Pty Ltd AUS Santos Egypt Pty Ltd2 AUS Santos EOM Pty Ltd AUS Santos Hides Ltd PNG Santos International Pte Ltd SGP Santos International Operations Pty Ltd AUS Santos OIG Pty Ltd AUS Santos P’nyang Limited3 PNG Santos (Papalang) Pty Ltd AUS Santos (Popodi) Pty Ltd AUS Santos Sabah Block R Limited GBR Santos Sangu Field Ltd GBR Santos (UK) Limited GBR Controlled entities of Santos (UK) Limited Santos Northwest Natuna B.V. NLD Santos Petroleum Ventures B.V. NLD Santos Sabah Block S Limited GBR Santos Vietnam Pty Ltd AUS Zhibek Resources Ltd4 GBRSantos (JBJ1) Pty Ltd AUS Controlled entities of Santos (JBJ1) Pty Ltd Santos (JBJ2) Pty Ltd AUS Controlled entity of Santos (JBJ2) Pty Ltd Shaw River Power Station Pty Ltd AUSSantos (JPDA 06–104) Pty Ltd AUSSantos (JPDA 91–12) Pty Ltd AUSSantos (NARNL Cooper) Pty Ltd1 AUSSantos NSW Pty Ltd AUS Controlled entities of Santos NSW Pty Ltd Santos NSW (Betel) Pty Ltd AUS Santos NSW (Hillgrove) Pty Ltd AUS Santos NSW (Holdings) Pty Ltd AUS Controlled entities of Santos NSW (Holdings) Pty Ltd Santos NSW (LNGN) Pty Ltd AUS Santos NSW (Pipeline) Pty Ltd AUS Santos NSW (Sales) Pty Ltd AUS Santos NSW (Narrabri Energy) Pty Ltd AUS Controlled entities of Santos NSW (Narrabri Energy) Pty Ltd Santos NSW (Eastern) Pty Ltd AUS Santos NSW (Sulu) Pty Ltd AUS Santos NSW (Tooncomet) Pty Ltd AUS Santos NSW (Narrabri Power) Pty Ltd AUS Santos NSW (Operations) Pty Ltd AUSSantos (N.T.) Pty Ltd AUS Controlled entity of Santos (N.T.) Pty Ltd Bonaparte Gas & Oil Pty Ltd AUS
For
per
sona
l use
onl
y

Financial Report
102 / Santos Annual Report 2015
6.1 CONSOLIDATED ENTITIES (CONTINUED)
Name Country of incorporation
Santos Offshore Pty Ltd1 AUSSantos Petroleum Pty Ltd1 AUSSantos QLD Upstream Developments Pty Ltd AUSSantos QNT Pty Ltd1 AUS Controlled entities of Santos QNT Pty Ltd Outback Energy Hunter Pty Ltd AUS Santos QNT (No. 1) Pty Ltd1 AUS Controlled entities of Santos QNT (No. 1) Pty Ltd Santos Petroleum Management Pty Ltd AUS Santos Petroleum Operations Pty Ltd AUS TMOC Exploration Proprietary Limited AUS Santos QNT (No. 2) Pty Ltd1 AUS Controlled entities of Santos QNT (No. 2) Pty Ltd Moonie Oil Pty Ltd AUS Petromin Pty Ltd AUS Santos (299) Pty Ltd5 AUS Santos Exploration Pty Ltd AUS Santos Gnuco Pty Ltd AUS Santos Upstream Pty Ltd AUS Santos TPC Pty Ltd AUS Santos Wilga Park Pty Ltd AUS
Name Country of incorporation
Santos Resources Pty Ltd AUSSantos (TGR) Pty Ltd AUSSantos Timor Sea Pipeline Pty Ltd AUSSantos Ventures Pty Ltd AUSSESAP Pty Ltd AUSVamgas Pty Ltd1 AUS
Notes to the Consolidated Financial StatementsSection 6: Group Structure
Notes
1 Company is party to a Deed of Cross Guarantee. Refer note 6.5.
2 Company placed into liquidation during 2015 and deregistered on 28 January 2016.
3 Company changed name from Santos Niugini Exploration Limited on 10 July 2015.
4 Company dissolved on 10 November 2015.
5 In liquidation.
Country of incorporation
AUS – AustraliaGBR – United KingdomNLD – NetherlandsPNG – Papua New GuineaSGP – SingaporeUSA – United States of America
6.2 ACQUISITIONS AND DISPOSALS OF SUBSIDIARIES
There were no acquisitions or disposals of subsidiaries during 2015.
For
per
sona
l use
onl
y

Santos Annual Report 2015 / 103
6.3 JOINT ARRANGEMENTS
The Group’s investments in joint arrangements are classified as either joint operations or joint ventures; depending on the contractual rights and obligations each investor has, rather than the legal structure of the joint arrangement. Santos’ exploration and production activities are often conducted through joint arrangements governed by joint operating agreements, production sharing contracts or similar contractual relationships.
The differences between joint operations and joint ventures are as follows:
Types of arrangement Joint operation Joint venture
Characteristics A joint operation involves the joint control, and often the joint ownership, of assets contributed to, or acquired for the purpose of, the joint operation. The assets are used to obtain benefits for the parties to the joint operation and are dedicated to that purpose.
The Group has interests in joint ventures, whereby the venturers have contractual arrangements that establish joint control over the economic activities of the entities.
Rights and obligations Each party has control over its share of future economic benefits through its share of the joint operation, and has rights to the assets, and obligations for the liabilities, relating to the arrangement.
Parties that have joint control of the arrangement have rights to the net assets of the arrangement.
Accounting method The interests of the Group in joint operations are brought to account by recognising the Group’s share of jointly controlled assets, share of expenses and liabilities incurred, and the income from its share of the production of the joint operation.
The Group recognises its interest in joint ventures using the equity method of accounting.
Under the equity method, the investment in a joint venture is initially recognised in the consolidated statement of financial position at cost and adjusted thereafter to recognise the post-acquisition changes to the Group’s share of net assets of the joint venture. After application of the equity method, the Group determines whether it is necessary to recognise any impairment loss with respect to the Group’s net investment in the joint venture.
The Group’s share of the joint venture’s post-acquisition profits or losses is recognised in the income statement and its share of post-acquisition movements in reserves is recognised in the statement of changes in equity and, when applicable, in the statement of comprehensive income. Dividends receivable from the joint venture reduce the carrying amount of the investment in the consolidated financial statements of the Group.
For
per
sona
l use
onl
y

Financial Report
104 / Santos Annual Report 2015
Notes to the Consolidated Financial StatementsSection 6: Group Structure
6.3 JOINT ARRANGEMENTS (CONTINUED)
(a) Joint operations
The following are the material joint operations in which the Group has an interest:
Area of cash-generating unit/ 2015 2014 Joint operation Area of interest Principal activities % Interest % Interest
Oil and gas assets – Producing assets Barrow Island Barrow Oil production 28.6 28.6 Bayu Undan Bayu Undan Gas and liquids production 11.5 11.5 Casino Casino Gas production 50.0 50.0 Chim Sáo Vietnam (Block 12W) Oil and gas production 31.9 31.9 Fairview GLNG Gas production 22.8 22.8 GLNG Downstream GLNG LNG facilities 30.0 30.0 Halyard/Spar Varanus Island Gas production 45.0 45.0 John Brookes Varanus Island Gas production 45.0 45.0 Madura Offshore PSC (Maleo) Madura PSC Gas production 67.5 67.5 Mutineer Exeter/ Mutineer Exeter/ Fletcher Finucane Fletcher Finucane Oil production 37.5 37.5 PNG LNG PNG LNG Gas and liquids production 13.5 13.5 Reindeer Reindeer Gas production 45.0 45.0 Roma GLNG Gas production 30.0 30.0 SA Fixed Factor Area Cooper Basin Oil and gas production 66.6 66.6 Sampang PSC (Oyong, Wortel) Sampang PSC Oil and gas production 45.0 45.0 Stag Stag Oil and gas production 66.7 66.7 SWQ Unit Cooper Basin Gas production 60.1 60.1 Oil and gas assets – Assets in development Kipper1 Kipper Gas development 35.0 35.0 Exploration and evaluation assets EPP43 Ceduna Basin Contingent oil or gas resource 50.0 50.0 EP161, 162 and 189 McArthur Basin Contingent gas resource 50.0 50.0 Block R – Oil and gas exploration 20.0 – Caldita/Barossa – Contingent gas resource 25.0 25.0 PEL1 and 12 – Contingent gas resource 65.0 65.0 PEL238 and PAL2 Gunnedah Basin Contingent gas resource 80.0 80.0 PPL269 – Oil and gas exploration 30.0 – Northwest Natuna – Oil resource 50.0 50.0 WA-58-R (WA-274-P) – Gas development 30.0 30.0 WA-323-P – Contingent gas resource 75.0 75.0 WA-49-R – Contingent gas resource 24.8 24.8
1. Asset classified as held for sale.
(b) Share of investments in joint ventures
The Group’s only material joint venture is Darwin LNG Pty Ltd, which operates the Darwin LNG liquefaction facility that currently processes gas from the Bayu Undan gas fields.
For
per
sona
l use
onl
y

Santos Annual Report 2015 / 105
6.3 JOINT ARRANGEMENTS (CONTINUED)
(b) Share of investments in joint ventures (continued)
Summarised financial information of the joint venture, based on the amounts presented in its financial statements, and a reconciliation to the carrying amount of the investment in the consolidated financial statements, are set out below:
2015 2014 Share of investments in Darwin LNG Ltd $million $million
Reconciliation to carrying amount: Opening net assets 1 January 847 844 Profit for the period 122 141 Exchange gain on translation of foreign operations 103 67 Reduction in capital (95) (65) Dividends paid (124) (140)
Closing net assets 31 December 853 847
Group’s share (%) 11.5% 11.5% Group’s share of closing net assets ($million) 98 97
Carrying amount of investments in joint ventures ($million) 98 97
Summarised statement of comprehensive income: Profit for the period 122 141 Other comprehensive income 103 67
Total comprehensive income 225 208
Group’s share of profit 14 16
Dividends received from joint venture 14 16
The following are the joint ventures in which the group has an interest, including those which are immaterial:
2015 2014 Joint venture % Interest % Interest
Darwin LNG Pty Ltd 11.5 11.5 Easternwell Drilling Services Holdings Pty Ltd 50.0 50.0 GLNG Operations Pty Ltd 30.0 30.0 GLNG Property Pty Ltd 30.0 30.0 Lohengrin Pty Ltd 50.0 50.0
(c) Income from all joint ventures
A reconciliation of the Group’s total income from all joint ventures:
2015 2014 $million $million
Share of Darwin LNG Pty Ltd net profits 14 16 Share of immaterial joint venture net profits – 1
Total share of net profits 14 17
At 31 December 2015 the Group reassessed the carrying amount of its investments in joint ventures for indicators of impairment. As a result no impairment was recorded (2014: impairment expense of $14 million relating to Easternwell Drilling).
For
per
sona
l use
onl
y

Financial Report
106 / Santos Annual Report 2015
Notes to the Consolidated Financial StatementsSection 6: Group Structure
6.4 PARENT ENTITY DISCLOSURES
Selected financial information of the ultimate parent entity in the Group, Santos Limited, is as follows:
2015 2014 $million $million
Net (loss)/profit for the period (3,343) 529
Total comprehensive (loss)/income (3,343) 529
Current assets 1,324 841 Total assets 12,771 13,911
Current liabilities 1,857 894 Total liabilities 4,975 5,791
Issued capital 10,192 6,905 Reserves 167 – Accumulated (losses)/profits (2,564) 1,215
Total equity 7,795 8,120
Commitments of the parent entity
The parent entity’s capital expenditure commitments and minimum exploration commitments are:
2015 2014 $million $million
Capital expenditure commitments 106 222 Minimum exploration commitments 23 49
Guarantees entered into by the parent entity in relation to the debts of its subsidiaries
All interest-bearing loans and borrowings, as disclosed in note 5.1, with the exception of the finance leases and secured bank loans, are arranged through Santos Finance Ltd, which is a wholly-owned subsidiary of Santos Limited. All interest-bearing loans and borrowings of Santos Finance Ltd are guaranteed by Santos Limited.
Contingent liabilities of the parent entity
Contingent liabilities arise in the ordinary course of business through claims against Santos Limited, including contractual, third-party and contractor claims. In most instances it is not possible to reasonably predict the outcome of these claims, and as at reporting date Santos Limited believes that the aggregate of such claims will not materially impact the Company’s financial report.
For
per
sona
l use
onl
y

Santos Annual Report 2015 / 107
6.5 DEED OF CROSS GUARANTEE
As a condition of the Class Order, the Company and each of the wholly-owned subsidiaries identified in note 6.1 (refer footnote 1) (collectively, “the Closed Group”) have entered into a Deed of Cross Guarantee (“the Deed”). The effect of the Deed is that the Company has guaranteed to pay any deficiency in the event of winding up of any of the subsidiaries under certain provisions of the Corporations Act 2001. The subsidiaries have also given a similar guarantee in the event that the Company is wound up.
Pursuant to Class Order 98/1418, the wholly-owned subsidiaries within the Closed Group are relieved from the Corporations Act 2001 requirements for preparation, audit and lodgement of their financial reports.
Set out below is a consolidated income statement, consolidated statement of comprehensive income and summary of movements in consolidated retained earnings for the year ended 31 December 2015 of the Closed Group.
2015 2014 $million $million
Consolidated income statement Product sales 1,583 2,550Cost of sales (1,469) (2,186)
Gross profit 114 364Other revenue 415 1,012Other income 14 24Other expenses (5,412) (2,167)Interest income 6 10Finance costs (55) (56)
Loss before tax (4,918) (813)
Income tax benefit 884 417Royalty-related tax benefit 25 121
Total tax benefit 909 538
Net loss for the period (4,009) (275)
Consolidated statement of comprehensive income Net loss for the period (4,009) (275)Other comprehensive income, net of tax: Net exchange gain on translation of foreign operations – 4 Net actuarial gain on defined benefit plan 7 –
Total comprehensive loss (4,002) (271)
Summary of movements in the Closed Group’s retained earnings Retained earnings at 1 January 896 1,490Net loss for the period (4,009) (275)Net actuarial gain on defined benefit plan 7 –Dividends to shareholders (298) (341)Share-based payment transactions 21 22
Accumulated (loss)/profit at 31 December (3,383) 896
For
per
sona
l use
onl
y

Financial Report
108 / Santos Annual Report 2015
Notes to the Consolidated Financial StatementsSection 6: Group Structure
6.5 DEED OF CROSS GUARANTEE (CONTINUED)
Set out below is a consolidated statement of financial position as at 31 December 2015 of the Closed Group:
2015 2014 $million $million
Current assets Cash and cash equivalents 940 426 Trade and other receivables 1,921 963 Other current assets 185 383
Total current assets 3,046 1,772
Non-current assets Other financial assets 8,270 9,003 Exploration and evaluation assets 172 399 Oil and gas assets 2,976 5,322 Other non-current assets 2,074 732
Total non-current assets 13,492 15,456
Total assets 16,538 17,228
Current liabilities Trade and other payables 1,771 790 Other current liabilities 1,029 410
Total current liabilities 2,800 1,200
Non-current liabilities Interest-bearing loans and borrowings 4,940 6,564 Provisions 1,777 1,546 Other non-current liabilities 184 106
Total non-current liabilities 6,901 8,216
Total liabilities 9,701 9,416
Net assets 6,837 7,812
Equity Issued capital 10,192 6,905 Reserves 195 11 Accumulated (loss)/profit (3,550) 896
Total equity 6,837 7,812
For
per
sona
l use
onl
y

Santos Annual Report 2015 / 109
This section includes information relating to the various programs the Group uses to reward and recognise employees and key management personnel. It includes details of our employee benefits and share-based payment schemes.
7.1 EMPLOYEE BENEFITS
Wages, salaries and sick leave
Liabilities for wages and salaries, including non-monetary benefits that are expected to be settled within 12 months of the reporting date are recognised in respect of employee service up to the reporting date. They are measured at the amounts expected to be paid when the liabilities are settled. Expenses for non-vesting sick leave are recognised when the leave is taken and are measured at the rates paid or payable.
Long-term service benefits
Liabilities for long service leave and annual leave that is not expected to be taken within 12 months of the respective service being provided, are recognised and measured at the present value of the estimated future cash outflows to be made in respect of employee service up to the reporting date.
Defined benefit plan
The Group’s net obligation in respect of the defined benefit superannuation plan is calculated by estimating the discounted amount of future benefit that employees have earned in relation to their service in the current and prior periods and deducting the fair value of any plan assets.
Actuarial gains or losses that arise in calculating the Group’s obligation in respect of the plan are recognised directly in retained earnings.
Defined benefit members of the Santos Superannuation Plan receive a lump sum benefit on retirement, death, disablement and withdrawal. The defined benefit section of the plan is closed to new employees. All new employees receive accumulation-only benefits.
During the period an expense of $1 million (2014: $2 million) was recorded in relation to the defined benefit plan.
The Group expects to contribute $1 million to the defined benefit superannuation plan in 2016 (2015: $1 million).
Defined contribution plans
The Group makes contributions to several defined contribution superannuation plans. Obligations for contributions are recognised as an expense in the income statement as incurred. The amount incurred during the year was $15 million (2014: $12 million).
The following amounts are recognised on the Group’s balance sheet in relation to employee benefits:
2015 2014 $million $million
Non-current assets Defined benefit surplus 11 –
Current provisions Employee benefits 83 104
Non-current provisions Employee benefits 15 13 Defined benefit obligations – 2
Total non-current provisions 15 15
Total employee benefits provisions 98 119
Notes to the Consolidated Financial StatementsSection 7: People
For
per
sona
l use
onl
y

Financial Report
110 / Santos Annual Report 2015
Notes to the Consolidated Financial StatementsSection 7: People
7.2 SHARE-BASED PAYMENT PLANS
The Group provides benefits to employees of the Group through share-based incentives. Employees are paid for their services or incentivised for their performance in part through shares or rights over shares.
There are two main share-based payment plans; equity-settled share-based payment plans and cash-settled share-based payment plans. The equity-settled plans consist of the general employee share-based payment plans and executive long-term incentive share-based payment plans.
The amounts recognised in the financial statements of the Group during the financial year in relation to shares issued under the share plans are summarised as follows:
2015 2014 $000 $000
Statement of financial position, classified as liabilities: General employee share plans – ShareMatch Plan 6,420 7,617 Executive long-term incentive share-based payment plans: Share options – 1,042 Cash-settled – 68
6,420 8,727
Issued capital: General employee share plans: Share1000 Plan 1,285 1,580 ShareMatch Plan (matched Share Acquisition Rights (“SARs”)) 6,420 7,617 Executive long-term incentive share-based payment plans – share options – 1,042
7,705 10,239
Retained earnings: General employee share plans – matched SARs 5,765 5,090 Executive long-term incentive share-based payment plans – equity-settled 15,681 16,557 2012–2015 Four-year CEO Strategy Grant (178) 370 2013–2015 Three-year Executive Strategy Grant 97 68
21,365 22,085
Employee expenses: General employee share plans: Share1000 Plan (1,285) (1,580) ShareMatch Plan (matched SARs) (5,765) (5,090) Executive long-term incentive share-based payment plans: Equity-settled (15,681) (16,557) Cash-settled – 68 2012–2015 Four-year CEO Strategy Grant 178 (370) 2013–2015 Three-year Executive Strategy Grant (97) (68)
(22,650) (23,597)
Total equity 6,420 8,727
For
per
sona
l use
onl
y

Santos Annual Report 2015 / 111
7.2 SHARE-BASED PAYMENT PLANS (CONTINUED)
(a) Equity-settled share-based payment plans
The cost of equity-settled transactions is determined by the fair value at the grant date using an appropriate valuation model. The cost is recognised, together with a corresponding increase in other capital reserves in equity, over the period in which the performance and/or service conditions are met. Currently, the Company has four equity-settled share-based payment plans in operation, the details of which are as follows:
i. General employee share plans
Santos operates two general employee share plans, the Share1000 Plan and the ShareMatch Plan. Eligible employees have the option to participate in either the Share1000 Plan or the ShareMatch Plan. Members of the Santos Leadership Team, Directors of the Company, casual employees, employees on fixed-term contracts and employees on international assignment are excluded from participating in the Share1000 Plan and the ShareMatch Plan.
Share1000 ShareMatch
What is it? The Share1000 Plan provides for grants of fully paid ordinary shares up to a value determined by the Board, which in 2015 was $1,000 per employee (2014: $1,000).
The ShareMatch Plan allows for the purchase of shares through salary sacrificing up to $5,000 over a maximum 12-month period, and to receive matched SARs at a 1:1 ratio or as otherwise set by the Board.
The employee’s ownership and right to deal with them
Subject to restrictions until the earlier of the expiration of the three-year restriction period and the time when the employee ceases to be in employment.
Upon vesting, subject to restrictions until the earlier of the expiration of the restriction period (which will be three, five or seven years from the date of the offer, depending on any election made by the employee) and the time when he or she ceased to be an employee.
How is the fair value recognised?
The fair value of these shares is recognised as an employee expense with a corresponding increase in issued capital, and the fair value per share is determined by the Volume Weighted Average Price (“VWAP”) of ordinary Santos shares on the ASX during the week up to and including the date of issue of the shares.
The fair value of the shares is recognised as an increase in issued capital and a corresponding increase in loans receivable. The fair value per share is determined by the VWAP of ordinary Santos shares on the ASX during the week up to and including the date of issue of the shares.
The fair value of services required in return for matched SARs granted is measured by reference to the fair value of matched SARs granted. The estimate of the fair value of the services received is measured by discounting the share price on the grant date using the assumed dividend yield and recognised as an employee expense for the term of the matched SARs.
The following shares were issued pursuant to the employee share plans during the period:
Share1000 Plan ShareMatch Plan
Issued Fair value Issued Fair value shares per share shares per share Year No. $ No. $
2015 28 Jul 2015 180,040 7.1383 890,889 7.1383 2014 21 Jan 2014 5,037 14.3508 35,412 14.3508 1 Jul 2014 106,470 14.1598 500,971 14.1598
111,507 536,383
For
per
sona
l use
onl
y

Financial Report
112 / Santos Annual Report 2015
Notes to the Consolidated Financial StatementsSection 7: People
7.2 SHARE-BASED PAYMENT PLANS (CONTINUED)
i. General employee share plans (continued)
The number of SARs outstanding, and movements throughout the financial year are:
Beginning of End of the year Granted Lapsed Vested the year Year No. No. No. No. No.
2015 total 1,361,730 899,388 (64,524) (596,491) 1,600,103
2014 total 1,226,833 537,445 (49,911) (352,637) 1,361,730
The inputs used in the valuation of the SARs are as follows:
Matched SARs grant 2015
Share price on grant date ($) 7.13 Exercise price ($) – Right life (weighted average, years) 3.0 Expected dividends (% p.a.) 4.21 Fair value at grant date ($) 6.30
The loan arrangements relating to the ShareMatch Plan are as follows:
During the year the Company issued $6 million (2014: $8 million) of share capital under the ShareMatch Plan, with $3 million (2014: $7 million) received from employees under loan arrangements. The movements in loans receivable from employees were:
2015 2014 $000 $000
Employee loans at 1 January 3,611 2,807 Ordinary share capital issued during the year 6,420 7,617 Cash received during the year (6,326) (6,813)
Employee loans at 31 December 3,705 3,611
ii. Executive Long-Term Incentive share-based payment plans
The Company’s Executive Long-Term Incentive (“LTI Program”) provides for invitations to be extended to eligible executives selected by the Board to receive SARs upon the satisfaction of set market and non-market performance conditions. Each SAR is a conditional entitlement to a fully paid ordinary share, subject to the satisfaction of performance or service conditions, on terms and conditions determined by the Board. The Board has the discretion to cash-settle SARs granted under the amended Santos Employee Equity Incentive Plan.
The fair value of SARs is recognised as an employee expense with a corresponding increase in equity. The fair value is measured at grant date and recognised over the period during which the executive becomes unconditionally entitled to the SARs. The fair value of the performance-based SARs granted is measured using a Monte Carlo simulation method, taking into account the terms and market conditions upon which the SARs were granted. The fair value of the deferred-based SARs granted is measured by discounting the share price on the grant date using the assumed dividend yield for the term of the SAR. The amount recognised as an expense is only adjusted when SARs do not vest due to non-market-related conditions.
The 2015 LTI Program offers consisted only of SARs. Performance Awards were granted to eligible executives in 2015 who were granted two three-year grants (1 January 2015 – 31 December 2017).
In each of the grants 75% of the SARs are subject to Santos’ Total Shareholder Return (“TSR”) relative to the performance of the ASX 100 companies (“ASX 100 comparator group”) and 25% are subject to Santos’ TSR relative to the performance of the Standard & Poor’s Global 1200 Energy Index companies (“S&P GEI comparator group”) over the performance period.
For
per
sona
l use
onl
y

Santos Annual Report 2015 / 113
7.2 SHARE-BASED PAYMENT PLANS (CONTINUED)
ii. Executive Long-Term Incentive share-based payment plans (continued)
The numbers of SARs outstanding at the end of, and movements throughout, the financial year are:
Beginning of End of the year Granted Lapsed Vested the year Year No. No. No. No. No.
2015 total 6,631,253 3,158,016 (2,124,044) (15,127) 7,650,098
2014 total 3,775,596 3,817,719 (753,957) (208,105) 6,631,253
The SARs granted during 2015 totalling 3,158,016 were issued across the following four tranches, each with varying valuations:
2015
Performance Awards M1 M2 M3 M4
Performance index ASX 100 S&P GEI ASX 100 S&P GEI Fair value at grant date ($) 3.96 4.13 5.44 5.43 Share price on grant date ($) 7.93 7.93 9.03 9.03 Exercise price ($) nil nil nil nil Expected volatility (weighted average, % p.a.) 29 29 29 29 Right life (weighted average, years) 4 4 4 4 Expected dividends (% p.a.) 4.4 4.4 3.9 3.9 Risk-free interest rate (% p.a.) 1.7 1.7 2.2 2.2 Total granted (No.) 1,989,338 663,086 379,194 126,398
The above table includes the valuation assumptions used for Performance Awards SARs granted during the current year. The expected vesting period of the SARs is based on historical data and current expectations and is not necessarily indicative of exercise patterns that may occur. The expected volatility reflects the assumption that the historical volatility over a period similar to the life of the SARs is indicative of future trends, which may not necessarily be the actual outcome.
Vesting of Performance Awards
All Performance Awards are subject to hurdles based on the Company’s TSR relative to both the ASX 100 and S&P GEI comparator group over the performance period to the end of the vesting period. There is no re-testing of performance conditions. Each tranche of the Performance Awards granted during 2015 vests in accordance with the following vesting schedule, relative to the TSR conditions:
TSR percentile ranking % of grant vesting
< 51st percentile 0%
= 51st percentile 50%
52nd to 75th percentile Further 2.0% for each percentile over 51st
≥ 76th percentile 100%
Restriction period
Shares allocated on vesting of SARs granted in 2011 and 2012 may be subject to additional restrictions on dealing for five or seven years after the original grant date, depending on whether the executive elected to extend the trading restrictions period beyond the vesting date. Shares allocated on the vesting of SARs that were granted prior to 2012 will be subject to further restrictions on dealing for a maximum of 10 years after the original grant date. No amount is payable on grant or vesting of the SARs.
For
per
sona
l use
onl
y

Financial Report
114 / Santos Annual Report 2015
7.2 SHARE-BASED PAYMENT PLANS (CONTINUED)
iii. 2012–2015 Four-year CEO Strategy Grant
In 2012 the Company granted 205,339 SARs to the CEO (2012–2015 Four-year CEO Strategy Grant). The issue of SARs under this arrangement was approved by shareholders at the 2012 Annual General Meeting (“AGM”).
As described more fully in the Notice of Meeting to the 2012 AGM, the award is split into five equal tranches with separate performance targets that relate to the following:
Target Measure
• GLNG start-up Loading of first LNG cargo on or before 30 June 2015
• GLNG cost Project cost within or under budget
• Production growth Targeting 77 mmboe or more by 31 December 2015
• Reserves growth Targeting 2P reserve/production cover of 18 years or more at 31 December 2015
• Operations integrity Maintaining an annual score of 90% or more against various environmental, health and safety metrics while ensuring no High Impact or Critical Environment incidents occur over the 2012–2015 period
Each of the five performance target measures have been tested at 31 December 2015. The results of the test concluded that a total of 88,706 SARs vested, being 43.2%. No SARs vested in relation to the GLNG cost and production growth performance targets.
The cumulative expense to this grant was $938 thousand, amortised over the four-year vesting period. This included a reversal of $178 thousand in the current period reflecting a true-up based on the results of testing at 31 December 2015.
iv. 2013–2015 Three-year Executive Strategy Grant
In 2013 the Company granted 20,829 SARs under the Santos Employee Equity Incentive Plan (“SEEIP”), referred to as the 2013–2015 Three-year Executive Strategy Grant.
The award is split into three equal tranches with separate performance targets that relate to GLNG start-up, GLNG cost and operations integrity, similar to the corresponding targets in the 2012–2015 Four-year CEO Strategy Grant.
Each of the three performance target measures have been tested at 31 December 2015. The results of the test concluded that a total of 18,121 SARs vested, being 87%. No SARs vested in relation to the GLNG cost performance target.
The cumulative expense to this grant was $214 thousand, amortised over the three-year vesting period. This included an expense of $97 thousand in the current period reflecting a true-up based on the results of testing at 31 December 2015.
Notes to the Consolidated Financial StatementsSection 7: People
For
per
sona
l use
onl
y

Santos Annual Report 2015 / 115
7.2 SHARE-BASED PAYMENT PLANS (CONTINUED)
(b) Options
The Company has not granted options over unissued shares under the Executive Long-Term Incentive share-based payment plans since 2009. The information as set out below relates to options issued under the Executive Long-Term Incentive share-based payment plans in 2009 and earlier that have vested in prior years:
Exercisable Beginning of End of at end of the year Lapsed Exercised the year the year No. No. No. No. No.
2015 Vested in prior years 3,992,038 (69,450) – 3,922,588 3,922,588
Weighted average exercise price ($) 12.31 8.46 – 12.38 12.38
2014 Vested in prior years 4,142,738 (51,300) (99,400) 3,992,038 3,992,038
Weighted average exercise price ($) 12.31 15.39 10.48 12.31 12.31
(c) Cash-settled share-based payment plans
The Group recognises the fair value of cash-settled share-based payment transactions as an employee expense with a corresponding increase in the liability for employee benefits. The fair value of the liability is measured initially, and at the end of each reporting period until settled, at the fair value of the cash-settled share-based payment transaction, by using a Monte Carlo simulation method.
7.3 KEY MANAGEMENT PERSONNEL DISCLOSURES
2015 2014 (a) Key management personnel compensation $000 $000
Short-term employee benefits 7,198 9,462 Post-employment benefits 240 195 Other long-term benefits 63 196 Termination benefits 2,422 – Share-based payments 4,418 5,320
14,341 15,173
(b) Loans to key management personnel
There have been no loans made, guaranteed or secured, directly or indirectly, by the Group or any of its subsidiaries at any time throughout the year to any key management person, including their related parties.
For
per
sona
l use
onl
y

Financial Report
116 / Santos Annual Report 2015
Notes to the Consolidated Financial StatementsSection 8: Other
This section provides information that is not directly related to the specific line items in the financial statements, including information about contingent liabilities, events after the end of the reporting period, the Group’s commitment to the removal of the shareholder cap, remuneration of auditors and changes to accounting policies and disclosures.
8.1 CONTINGENT LIABILITIES
Contingent liabilities arise in the ordinary course of business through claims against the Group, including contractual, third-party and contractor claims. In most instances it is not possible to reasonably predict the outcome of these claims, and as at reporting date the Group believes that the aggregate of such claims will not materially impact the Group’s financial report.
8.2 EVENTS AFTER THE END OF THE REPORTING PERIOD
On 19 February 2016, the Directors of Santos Limited declared a final dividend on ordinary shares in respect of the 2015 financial year. Consequently, the dividend has not been provided for in the 31 December 2015 financial statements. Refer to note 2.6 for dividends declared after 31 December 2015.
8.3 COMMITMENT ON REMOVAL OF SHAREHOLDER CAP
Pursuant to a Deed of Undertaking to the Premier of South Australia dated 16 October 2007 and as a consequence of the enactment of the Santos Limited (Deed of Undertaking) Act 2007 on 29 November 2007, Santos has agreed to:
• continue to make payments under its existing Social Responsibility and Community Benefits Program specified in the Deed totalling $60 million over a 10-year period from the date the legislation was enacted. As at 31 December 2015, approximately $6 million (2014: $10 million) remains to be paid over the remainder of the 10-year period through to 29 November 2017; and
• continue to maintain the South Australian Cooper Basin asset’s Head Office and Operational Headquarters together with other roles in South Australia for 10 years subsequent to the date the legislation was enacted. At 31 December 2015, if this condition had not been met, the Company would have been liable to pay a maximum of $50 million (2014: $50 million) to the State Government of South Australia.
Santos is required to make these payments only if the State Government of South Australia does not reintroduce a shareholder cap on the Company’s shares or introduce any other restriction on or in respect of the Company’s Board or senior management which has an adverse discriminatory effect in their application to the Company relative to other companies domiciled in South Australia.
8.4 REMUNERATION OF AUDITORS
The auditor of Santos Limited is Ernst & Young.
(a) Audit and review services
Amounts received or due and receivable for an audit or review of the financial report of the entity and any other entity in the Group by:
2015 2014 $000 $000
Ernst & Young (Australia) 1,465 1,490 Overseas network firms of Ernst & Young (Australia) 223 217
1,688 1,707For
per
sona
l use
onl
y

Santos Annual Report 2015 / 117
8.4 REMUNERATION OF AUDITORS (CONTINUED)
(b) Other services
Amounts received or due and receivable for other services in relation to the entity and any other entity in the Group by:
2015 2014 $000 $000
Ernst & Young (Australia) for other assurance services 507 798 Ernst & Young (Australia) for taxation and other services 64 96 Overseas network firms of Ernst & Young (Australia) for taxation services 20 20
591 914
8.5 ACCOUNTING POLICIES
Changes in accounting policies and disclosures
The Group applied a number of amendments to accounting standards applicable for the first time for the financial year beginning 1 January 2015.
The below amendments did not impact the consolidated financial statements and disclosures of the Group:
• AASB 2014-1 Part A – Annual Improvements 2010-2012 Cycle;
• AASB 2014-1 Part A – Annual Improvements 2011-2013 Cycle;
• AASB 2014-1 Part B Amendments to AASB 119 – Amendments to Australian Accounting Standards – Part B Defined Benefit Plans: Employee Contributions (Amendments to AASB 119);
• AASB 2013-9 – Amendments to Australian Accounting Standards – Conceptual Framework, Materiality and Financial Instruments; and
• AASB 2014-2 – Amendments to AASB 1053 – Transition to and between Tiers, and related Tier 2 Disclosure Requirements.
New standards and interpretations not yet adopted
The Group has not elected to apply any pronouncements before their effective date for the annual reporting period ended 31 December 2015.
For
per
sona
l use
onl
y

Financial Report
118 / Santos Annual Report 2015
Notes to the Consolidated Financial StatementsSection 8: Other
8.5 ACCOUNTING POLICIES (CONTINUED)
New standards and interpretations not yet adopted (continued)
A number of new standards, amendments to standards and interpretations are effective for annual periods beginning on or after 1 January 2016, and have not been applied in preparing these consolidated financial statements. The Group’s assessment of the impact of these new standards, amendments to standards and interpretations is set out below:
Reference DescriptionApplication of standard
Impact on Group financial report
AASB 9 Financial Instruments
AASB 9 as issued replaces AASB 139 and includes a logical model for classification, measurement and derecognition of financial assets, a single, forward-looking ‘expected loss’ impairment model and a substantially reformed approach to hedge accounting. The main changes to the classification and measurement of financial assets and liabilities are:
• financial assets that are debt instruments will be classified based on: (1) the objective of the entity’s business model for managing the financial assets; and (2) the characteristics of the contractual cash flows;
• allows an irrevocable election on initial recognition to present gains and losses on investments in equity instruments that are not held for trading in other comprehensive income. Dividends in respect of these investments that are a return on investment can be recognised in profit or loss and there is no impairment or recycling on disposal of the instrument;
• financial assets can be designated and measured at fair value through profit or loss at initial recognition if doing so eliminates or significantly reduces a measurement or recognition inconsistency that would arise from measuring assets or liabilities, or recognising the gains and losses on them, on different bases; and
• where the fair value option is used for financial liabilities the change attributable to changes in credit risk is presented in other comprehensive income, and the remaining change is presented in profit or loss.
1 January 2018 Impact is currently being assessed
AASB 15 Revenue from Contracts with Customers
AASB 15 as issued replaces AASB 111, AASB 118 and related IFRIC Interpretations. The core principle of AASB 15 is that an entity recognises revenue in accordance with the transfer of promised goods or services to customers in an amount that reflects the consideration to which the entity expects to be entitled in exchange for those goods or services. An entity recognises revenue in accordance with that core principle by applying the following steps:
Step 1: Identify the contract(s) with a customer
Step 2: Identify the performance obligations in the contract
Step 3: Determine the transaction price
Step 4: Allocate the transaction price to the performance obligations in the contract
Step 5: Recognise revenue when (or as) the entity satisfies a performance obligation.
1 January 2018 Impact is currently being assessed
For
per
sona
l use
onl
y

Santos Annual Report 2015 / 119
Reference DescriptionApplication of standard
Impact on Group financial report
AASB 2014-3 Amendments to Australian Accounting Standards – Accounting for Acquisitions of Interests in Joint Operations
This standard sets out the guidance on the accounting for acquisitions of interests in joint operations in which the activity constitutes a business.
1 January 2016 No impact
AASB 2015-2 Amendments to Australian Accounting Standards – Disclosure Initiative: Amendments to AASB 101
AASB 2015-2 provides clarification regarding the disclosure requirements in AASB 101. Specifically, the Standard proposes narrow-focus amendments to address some of the concerns expressed about existing presentation and disclosure requirements and to ensure entities are able to use judgement when applying a Standard in determining what information to disclose in their financial statements.
1 January 2016 The 2015 financial statement content and structure has been reviewed and amended, refer to section “Structure of the Financial Report”.
IFRS 16 Leases The key features of IFRS 16 are as follows:
Lessee accounting
• lessees are required to recognise assets and liabilities for all leases with a term of more than 12 months, unless the underlying asset is of low value.
• a lessee measures right-of-use assets similarly to other non-financial assets and lease liabilities similarly to other financial liabilities.
• assets and liabilities arising from a lease are initially measured on a present value basis. The measurement includes non-cancellable lease payments (including inflation-linked payments), and also includes payments to be made in optional periods if the lessee is reasonably certain to exercise an option to extend the lease, or not to exercise an option to terminate the lease.
• IFRS 16 contains disclosure requirements for lessees.
Lessor accounting
• IFRS 16 substantially carries forward the lessor accounting requirements in IAS 17. Accordingly, a lessor continues to classify its leases as operating leases or finance leases, and to account for those two types of leases differently.
• IFRS 16 also requires enhanced disclosures to be provided by lessors that will improve information disclosed about a lessor’s risk exposure, particularly to residual value risk.
1 January 2019 Impact yet to be assessed
Several other amendments to standards and interpretations will apply on or after 1 January 2016, and have not yet been applied, however they are not expected to impact the Group’s annual consolidated financial statements or half-year condensed consolidated financial statements.
8.5 ACCOUNTING POLICIES (CONTINUED)
For
per
sona
l use
onl
y

Financial Report
120 / Santos Annual Report 2015
In accordance with a resolution of the Directors of Santos Limited (“the Company”), we state that:
1. In the opinion of the Directors:
(a) the financial statements and notes of the consolidated entity are in accordance with the Corporations Act 2001 (Cth), including:
(i) giving a true and fair view of the consolidated entity’s financial position as at 31 December 2015 and of its performance for the year ended on that date; and
(ii) complying with Accounting Standards and the Corporations Regulations 2001 (Cth); and
(b) the financial statements and notes comply with International Financial Reporting Standards as disclosed in note 1.1; and
(c) there are reasonable grounds to believe that the Company will be able to pay its debts as and when they become due and payable.
2. This declaration has been made after receiving the declarations required to be made to the Directors in accordance with section 295A of the Corporations Act 2001 (Cth) for the financial year ended 31 December 2015.
3. As at the date of this declaration, there are reasonable grounds to believe that the members of the Closed Group identified in note 6.5 will be able to meet any obligations or liabilities to which they are or may become subject by virtue of the Deed of Cross Guarantee between the Company and those members of the Closed Group pursuant to Class Order 98/1418.
Dated this 19th day of February 2016
On behalf of the Board:
Director
Directors’ Declarationfor the year ended 31 December 2015
For
per
sona
l use
onl
y

Santos Annual Report 2015 / 121
Report on the Financial Report
We have audited the accompanying Financial Report of Santos Limited, which comprises the consolidated statement of financial position as at 31 December 2015, the consolidated income statement, the consolidated statement of comprehensive income, the consolidated statement of changes in equity and the consolidated statement of cash flows for the year then ended, notes comprising a summary of significant accounting policies and other explanatory information, and the Directors’ Declaration of the consolidated entity comprising the company and the entities it controlled at the year's end or from time to time during the financial year.
Directors’ responsibility for the Financial Report
The Directors of the company are responsible for the preparation of the Financial Report that gives a true and fair view in accordance with Australian Accounting Standards and the Corporations Act 2001 and for such internal controls as the Directors determine are necessary to enable the preparation of the Financial Report that is free from material misstatement, whether due to fraud or error. In Note 1.1, the Directors also state, in accordance with Accounting Standard AASB 101 Presentation of Financial Statements, that the financial statements comply with International Financial Reporting Standards.
Auditor’s responsibility
Our responsibility is to express an opinion on the Financial Report based on our audit. We conducted our audit in accordance with Australian Auditing Standards. Those standards require that we comply with relevant ethical requirements relating to audit engagements and plan and perform the audit to obtain reasonable assurance about whether the financial report is free from material misstatement.
An audit involves performing procedures to obtain audit evidence about the amounts and disclosures in the Financial Report. The procedures selected depend on the auditor’s judgment, including the assessment of the risks of material misstatement of the Financial Report, whether due to fraud or error. In making those risk assessments, the auditor considers internal controls relevant to the entity’s preparation and fair presentation of the Financial Report in order to design audit procedures that are appropriate in the circumstances, but not for the purpose of expressing an opinion on the effectiveness of the entity’s internal controls. An audit also includes evaluating the appropriateness of accounting policies used and the reasonableness of accounting estimates made by the Directors, as well as evaluating the overall presentation of the Financial Report.
We believe that the audit evidence we have obtained is sufficient and appropriate to provide a basis for our audit opinion.
Independence
In conducting our audit we have complied with the independence requirements of the Corporations Act 2001. We have given to the Directors of the company a written Auditor’s Independence Declaration, a copy of which is referred to in the Directors’ Report.
Opinion
In our opinion:
a. the Financial Report of Santos Limited is in accordance with the Corporations Act 2001, including:
(i) giving a true and fair view of the consolidated entity's financial position as at 31 December 2015 and of its performance for the year ended on that date; and
(ii) complying with Australian Accounting Standards and the Corporations Regulations 2001; and
b. the Financial Report also complies with International Financial Reporting Standards as disclosed in Note 1.1.
Report on the Remuneration Report
We have audited the Remuneration Report included in pages 36 to 53 of the Directors’ Report for the year ended 31 December 2015. The Directors of the company are responsible for the preparation and presentation of the Remuneration Report in accordance with section 300A of the Corporations Act 2001. Our responsibility is to express an opinion on the Remuneration Report, based on our audit conducted in accordance with Australian Auditing Standards.
Opinion
In our opinion, the Remuneration Report of Santos Limited for the year ended 31 December 2015, complies with section 300A of the Corporations Act 2001.
Ernst & Young T S Hammond Partner Adelaide 19 February 2016
Independent Auditor’s Report to the members of Santos Limited
A member firm of Ernst & Young Global Limited Liability limited by a scheme approved under Professional Standards Legislation
For
per
sona
l use
onl
y

Financial Report
122 / Santos Annual Report 2015
As lead auditor for the audit of Santos Limited for the financial year ended 31 December 2015, I declare to the best of my knowledge and belief, there have been:
a) no contraventions of the auditor independence requirements of the Corporations Act 2001 in relation to the audit; and
b) no contraventions of any applicable code of professional conduct in relation to the audit.
This declaration is in respect of Santos Limited and the entities it controlled during the financial year.
Ernst & Young T S Hammond Partner Adelaide 19 February 2016
Auditor’s Independence Declaration to the Directors of Santos Limited
A member firm of Ernst & Young Global Limited Liability limited by a scheme approved under Professional Standards Legislation
For
per
sona
l use
onl
y

Santos Annual Report 2015 / 123
NOTICE OF MEETING
The Annual General Meeting of Santos Limited will be held in Hall L at Adelaide Convention Centre, North Terrace, Adelaide, South Australia, on Wednesday 4 May 2016 at 10:00 am.
FINAL DIVIDEND
The 2015 final ordinary dividend will be paid on 30 March 2016 to shareholders registered in the books of the Company at the close of business on 26 February 2016 in respect of fully paid shares held at record date.
SECURITIES EXCHANGE LISTING
Santos Limited. Incorporated in Adelaide, South Australia, on 18 March 1954.Quoted on the official list of the Australian Securities Exchange (ordinary shares code STO).
DIRECTORS
PR Coates (Chairman), KT Gallagher, (Managing Director and CEO), YA Allen, KA Dean, RA Franklin, H Goh, JS Hemstritch, GJW Martin, SD Sheffield.
COMPANY SECRETARY
DTJ Lim
CHANGE OF SHAREHOLDER DETAILS
Shareholders can access their current shareholding details and change many of these details online via the website, www.investorcentre.com/sto. The website requires you to quote your Shareholder Reference Number (“SRN”) or Holder Identification Number (“HIN”) in order to access this information. Forms are also available to advise the Company of changes relating to change of address, direct crediting of dividends, Tax File Number and Australian Business Number, Annual Report and Sustainability Report mailing preferences and Dividend Reinvestment Plan participation.
INVESTOR INFORMATION AND SERVICES
Santos website
A wide range of information for investors is available from Santos’ website, www.santos.com, including Annual Reports, Sustainability Reports, Full-Year and Interim Reports and presentations, news announcements, Quarterly Activities Reports and current well information.
Comprehensive archives of these materials dating back to 1990 are available on the Santos website.
Other investor information available on the Santos website includes:
• webcasts of investor briefings:
• an email alert facility where people can register to be notified, free of charge, of Santos’ News Announcements via email: and
• an RSS feed of Santos’ News Announcements, which allows people to view these announcements using RSS reader software.
The Santos website provides a full history of Santos’ dividend payments and equity issues. Shareholders can also check their holdings and payment history via the secure View Shareholding section.
Santos’ website also provides an online Conversion Calculator, which instantly computes equivalent values of the most common units of measurement in the oil and gas industry.
Publications
The Annual Report, Interim Report, Shareholder Review and the Sustainability Report are the major sources of printed information about Santos. Printed copies of the reports are available from the Share Registry or Investor Relations.
SHAREHOLDER ENQUIRIES
Enquiries about shareholdings should be directed to:
Computershare Investor Services Pty Limited GPO Box 2975 Melbourne, Victoria 3001 Phone: 1300 017 716 (within Australia) or
+61 3 9938 4343 (outside Australia)
Investor enquiries online:
www.investorcentre.com/contact Website: www.investorcentre.com/sto
Investor information, other than that relating to a shareholding, can be obtained from:
Investor Relations, Santos Limited GPO Box 2455 Adelaide, South Australia 5001 Telephone: 08 8116 5000 Email: [email protected]
Electronic enquiries can also be submitted through the ‘Contact Us’ section of the Santos website, www.santos.com
SHAREHOLDERS’ CALENDAR
2015 full-year Results announcement 19 February 2016
Ex-dividend date for 2015 full-year dividend 24 February 2016
Record date for 2015 full-year dividend 26 February 2016
Payment date for 2015 full-year dividend 30 March 2016
Annual General Meeting 4 May 2016
2016 interim results announcement 19 August 2016
Ex-dividend date for 2016 interim dividend 24 August 2016
Record date for 2016 interim dividend 25 August 2016
Payment date for 2016 interim dividend 30 September 2016
Dates may be subject to change.
QUARTERLY REPORTING CALENDAR
2016 First Quarter Activities Report 22 April 2016
2016 Second Quarter Activities Report 22 July 2016
2016 Third Quarter Activities Report 21 October 2016
2016 Fourth Quarter Activities Report 20 January 2017
Dates are subject to change and are published on the Santos website, www.santos.com
Information for Shareholders
For
per
sona
l use
onl
y

124 / Santos Annual Report 2015
Securities Exchangeand Shareholder Information
Listed on the Australian Securities Exchange at 29 February 2016 were 1,765,779,105 fully paid ordinary shares. Unlisted were 12,500 partly paid Plan 0 shares, 12,500 partly paid Plan 2 shares, 396,595 restricted fully paid ordinary shares issued to eligible Senior Executives pursuant to the Santos Employee Share Purchase Plan (“SESPP”), 19,775 fully paid ordinary shares issued pursuant to the Non-executive Director Share Plan (“NED Share Plan”), 103,382 fully paid ordinary shares issued with further restrictions pursuant to the ShareMatch Plan and 19,395 fully paid ordinary shares issued with further restrictions pursuant to the Santos Employee Share Purchase Plan (“SESPP”).
There were 162,013 holders of all classes of issued ordinary shares, including: 2 holders of Plan 0 shares; 2 holders of Plan 2 shares; 33 holders of restricted shares pursuant to the SESPP; 2 holders of NED Share Plan shares; 88 holders of ShareMatch shares with further restrictions and 5 holders of SESPP shares with further restrictions. This compared with 148,740 holders of all classes of issued ordinary shares a year earlier.
On 29 February 2016 there were also: 38 holders of 3,922,588 Options granted pursuant to the Santos Executive Share Option Plan; 99 holders of 5,696,026 Share Acquisition Rights pursuant to the SEEIP and 1,559 holders of 1,537,352 Share Acquisition Rights pursuant to the ShareMatch Plan.
The listed issued ordinary shares plus the ordinary shares issued pursuant to the SESPP, and the restricted shares issued pursuant to the SESPP, NED Share Plan, represent all of the voting power in Santos. The holdings of the 20 largest holders of ordinary shares represent 56.94% of the total voting power in Santos (51.39% on 27 February 2015). The largest shareholders of fully paid ordinary shares in Santos as shown in the Company’s Register of Members at 29 February 2016 were:
Name No. of shares %
HSBC Custody Nominees (Australia) Limited 271,866,868 15.40
JP Morgan Nominees Australia Limited 169,663,246 9.61
Citicorp Nominees Pty Limited 159,395,518 9.03
United Faith Ventures Limited 138,314,170 7.83
National Nominees Limited 131,351,942 7.44
BNP Paribas Noms Pty Ltd <DRP> 32,520,645 1.84
Citicorp Nominees Pty Limited <Colonial First State Inv A/c> 18,790,863 1.06
BNP Paribas Nominees Pty Ltd <Agency Lending DRP A/c> 13,018,931 0.74
HSBC Custody Nominees (Australia) Limited <NT-Comnwlth Super Corp A/c> 11,690,232 0.66
Argo Investments Limited 10,326,884 0.58
Morgan Stanley Australia Securities (Nominee) Pty Limited <No 1 Account> 10,109,833 0.57
CS Fourth Nominees Pty Limited <HSBC Cust Nom Au Ltd 11 A/c> 7,655,348 0.43
Australian Foundation Investment Company Limited 6,739,581 0.38
National Nominees Limited <DB A/c> 6,727,999 0.38
AMP Life Limited 3,233,610 0.18
Dynamic Supplies Investments Pty Ltd 3,181,868 0.18
UBS Wealth Management Australia Nominees Pty Ltd 3,054,055 0.17
Navigator Australia Ltd <MLC Investment Sett A/c> 2,892,987 0.16
HSBC Custody Nominees (Australia) Limited-GSCO ECA 2,510,042 0.14
Custodial Services Limited <Beneficiaries Holding A/c> 2,377,479 0.13
Total: 1,005,422,101 56.94
For
per
sona
l use
onl
y

Santos Annual Report 2015 / 125
ANALYSIS OF SHARES – RANGE OF SHARES HELD
Fully paid ordinary
shares (holders) % of holders
% of shares held
1–1,000 55,759 34.42 1.54
1,001–5,000 73,282 45.23 10.38
5,001–10,000 18,657 11.52 7.61
10,001–100,000 13,937 8.60 17.21
100,001 and over 378 0.23 63.26
Total 162,013 100.00 100.00
Less than a marketable parcel of $500 10,285
Substantial Shareholders as disclosed by notices received by the Company as at 29 February 2016:
NameNumber of voting
shares held
United Faith Ventures Limited 205,196,886
For Directors’ shareholdings see the Directors’ Report as set out on page 19 of this Annual Report.
VOTING RIGHTS
Every member present in person or by an attorney, a proxy or a representative shall on a show of hands, have one vote and upon a poll, one vote for every fully paid ordinary share held. Pursuant to the Rules of the Santos Executive Share Plan, Plan 2 and Plan 0 shares do not carry any voting rights except on a proposal to vary the rights attached to Plan shares.
For
per
sona
l use
onl
y

126 / Santos Annual Report 2015
A
Annual General Meeting 123 Audit & Risk Committee 7, 20, 44 Auditor’s Independence Declaration 122
B
Board of Directors 6-7 Board Committees 7, 28, 44
C
Chairman’s Letter 1-3 Consolidated Income Statement 56 Consolidated Statement of Cash Flows 59 Consolidated Statement of Changes in Equity 60 Consolidated Statement of Comprehensive Income 57 Consolidated Statement of Financial Position 58
D
Directors 6-7 Directors declaration 33-54 Directors’ remuneration 18-54 Directors’ report 38-74 Dividend 27, 31, 56, 75, 123 Dividend Reinvestment Plan 31, 87, 93
E
Earnings per share 15, 56, 74 Environment, Health, Safety and Sustainability committee 7, 20, 44
F
Finance Committee 7, 20, 44 Financial Report 55-120 Financial Risk Management 94-99
I
Information for shareholders 123 Independent Auditor’s report 121
M
Managing Director and Chief Executive Officer 4-5
N
Nomination Committee 7, 20, 44 Notes to the Consolidated Financial Statements 61-119
P
People and Remuneration Committee 7, 20, 36, 44 Production and Sales 10, 21
R
Remuneration Report 34-53 Reserves Statement 11-15 Risk management 28-30
S
Santos Leadership Team 8 Securities exchange and shareholder information 124-125
T
10-year Summary 16-17 Total shareholder return (TSR) 37, 40, 47, 53, 112, 113
IndexF
or p
erso
nal u
se o
nly

Santos Annual Report 2015 / 127
Aboriginal Refers to both Aboriginal and Torres Strait Islander people.
barrel/bbl The standard unit of measurement for all oil and condensate production. One barrel = 159 litres or 35 imperial gallons.
boe Barrels of oil equivalent.
the company Santos Ltd and its subsidiaries.
condensate A natural gas liquid that occurs in association with natural gas and is mainly composed of pentane and heavier hydrocarbon fractions.
proven, probable plus possible reserves contingent resources (2C) Those quantities of hydrocarbons which are estimated, on a given date, to be potentially recoverable from known accumulations, but which are not currently considered to be commercially recoverable. Contingent resources may be of a significant size, but still have constraints to development. These constraints, preventing the booking of reserves, may relate to lack of gas marketing arrangements or to technical, environmental or political barriers.
crude oil A general term for unrefined liquid petroleum or hydrocarbons.
CSG Coal seam gas. Predominantly methane gas stored within coal deposits or seams.
EBITDAX Earnings before interest, tax, depreciation, depletion, exploration and impairment.
exploration Drilling, seismic or technical studies undertaken to identify and evaluate regions or prospects with the potential to contain hydrocarbons.
hydrocarbon Compounds containing only the elements hydrogen and carbon, which may exist as solids, liquids or gases.
joules Joules are the metric measurement unit for energy.
A gigajoule (GJ) is equal to 1 joule × 109
A terajoule (TJ) is equal to 1 joule × 1012
A petajoule (PJ) is equal to 1 joule × 1015
liquid hydrocarbons (liquids) A sales product in liquid form; for example, condensate and LPG.
LNG Liquefied natural gas. Natural gas that has been liquefied by refrigeration to store or transport it. Generally, LNG comprises mainly methane.
Lost-Time Injury Frequency Rate (LTIFR) A statistical measure of health and safety performance, calculated by the number of hours worked. A lost-time injury is a work-related injury or illness that results in a persons disability, or time lost from work of one day shift or more.
LPG Liquefied petroleum gas. A mixture of light hydrocarbons derived from oil-bearing strata which is gaseous at normal temperatures but which has been liquefied by refrigeration or pressure to store or transport it. Generally, LPG comprises mainly propane and butane.
market capitalisation A measurement of a company’s stock market value at a given date. Market capitalisation is calculated as the number of shares on issue multiplied by the closing share price on that given date.
medical treatment injury A work-related injury or illness, other than a lost-time injury, that is serious enough to require more than minor first aid treatment. Santos classifies injuries that result in modified duties as medical treatment injuries.
mmbbl million barrels
mmboe million barrels of oil equivalent.
mtpa million tonnes per annum
oil A mixture of liquid hydrocarbons of different molecular weights.
proven reserves (1P) Reserves that, to a high degree of certainty (90% confidence), are recoverable. There is relatively little risk associated with these reserves. Proven developed reserves are reserves that can be recovered from existing wells with existing infrastructure and operating methods. Proven undeveloped reserves require development.
proven plus probable reserves (2P) Reserves that analysis of geological and engineering data suggests are more likely than not to be recoverable. There is at least a 50% probability that reserves recovered will exceed proven plus probable reserves.
sales gas Natural gas that has been processed by gas plant facilities and meets the required specifications under gas sales agreements.
Santos Santos Limited and its subsidiaries.
seismic survey Data used to gain an understanding of rock formations beneath the earth’s surface using reflected sound waves.
t tonnes
total recordable case frequency rate (TRCFR) A statistical measure of health and safety performance. Total recordable case frequency rate is calculated as the total number of recordable cases (medical treatment injuries and lost-time injuries) per million hours worked.
Conversion
Crude oil 1 barrel = 1 boe
Sales gas 1 petajoule = 171,937 boe
Condensate/naphtha
1 barrel = 0.935 boe
LPG 1 tonne = 8.458 boe
For a comprehensive online conversion calculator tool, visit the Santos website at www.santos.com
GlossaryF
or p
erso
nal u
se o
nly

128 / Santos Annual Report 2015
Santos Limited ABN 80 007 550 923
REGISTERED AND HEAD OFFICE
Ground Floor Santos Centre 60 Flinders Street Adelaide SA 5000 Australia
GPO Box 2455 Adelaide SA 5001 Australia
Telephone: +61 8 8116 5000 Facsimile: +61 8 8116 5050 Website: www.santos.com
SHARE REGISTER
Computershare Investor Services Pty Ltd Yarra Falls, 452 Johnson Street Abbotsford VIC 3067 Australia
GPO Box 2975 Melbourne VIC 3001 Australia
Online enquiries: www.investorcentre.com/contact Website: www.investorcentre.com/sto
Telephone: 1300 017 716 (within Australia) +61 3 9938 4343 (international)
Corporate DirectoryF
or p
erso
nal u
se o
nly

Designed and produced by www.twelvecreative.com.au
For
per
sona
l use
onl
y

For
per
sona
l use
onl
y