annual report 2009/2010 - cloud object storage |...
TRANSCRIPT

Represented Political Parties’ Fund
Annual Report 2009/2010
An
nu
al R
ep
or
t 20
09
/20
10
Electoral Commission of South AfricaRiverside Office Park
1303 Heuwel Avenue, Centurion, 0157
Telephone: +27 12 622 5700
www.elections.org.za
RP 228/2010ISBN: 978-0-621-39666-9
Rep
resented
Politica
l Parties’ Fu
nd
ELECTORAL COMMISSIONReport regarding the Management and Administration of the
Represented Political Parties’ Fund
during thefinancial year 1 April 2009 to 31 March 2010 in terms ofSection 8 of the Public Funding of Represented Political Parties Act, 1997
(Act 103 of 1997)

Represented Political Parties’ Fund – Annual Report 2009/2010 3
Contents
Management and Administration 5
Allocations to the Represented Political Parties 7
Extracts of Represented Political Parties’ Financial Statements- African Christian Democratic Party- African Independent Congress- African National Congress- African People’s Convention- Azanian People’s Organisation- Congress of the People- Democratic Alliance- Freedom Front Plus- Independent Democrats- Inkatha Freedom Party- Minority Front- Pan Africanist Congress of Azania- United Christian Democratic Party- United Democratic Movement
1315182024262830323436394142 44
Report of the Audit Committee
Report of the Auditor-General
Financial Statements of the Represented Political Parties’ Fund- Statement of Financial Position - Statement of Comprehensive Income- Statement of Changes in Funds- CashflowStatement- Notes to the Annual Financial Statements
47
50
555657585960
Appendix A: - Detailed Income and Expenditure Statement 71

Represented Political Parties’ Fund – Annual Report 2009/2010 5
Management and Administration
The Public Funding of Represented Political Parties Act, 1997 (hereafter referred to as the Act) determined that thefinancialyearoftheFundwillrunfrom1Aprilofeveryyearuntil31Marchinthefollowingyear.
TheChiefElectoralOfficer,subjecttothedirectionoftheCommission,isresponsibleforthemanagementandadministrationoftheFundandisitsAccountingOfficerandChiefExecutiveOfficer.
For each financial year theCommissionmust have records kept ofmoneys received by/or accruing to theFund,allocationsmade/andpaymentstherefromandofexpenditurearisingfromtheallocationofmoneysandacurrentrecordofthecapitalandliabilitiesoftheFund.
Allocationstopartiesaremadeinaccordancewiththeprescribedformula.Anumberofpurposesforwhichsuchmoneysmaynotbeusedbyparties,issetoutintheAct.
Themannerinwhichpartieshavetodealwithandaccountformoneysallocatedtothem,issetoutintheAct.Attheendofeachfinancialyeareverypartymustprepareastatementshowingtheamountreceivedandthepurposesforwhich itwasspentandhavethestatementand itsbooksof recordsofaccountsaudited. TheauditormustexpressanopinionastowhethertheallocatedmoneyswerespentforpurposesnotauthorisedbytheAct.
Theauditor’sreportandtheauditedstatementsmustbesubmittedtotheCommission.
Particularsofallocationsmadetorepresentedpoliticalparties inrespectof the2009/2010financialyearareincludedinthisreport.
Extractsfromthefinancialstatementsofrepresentedpoliticalparties,astheywerefiledwiththeCommission,arepublishedinthisreport.
TheAuditor-General’sreportisunqualifiedbutdrawsattentioninparagraph14tothenon-compliancewiththerelevantlegislationbyvariouspoliticalpartiesinrespectoftheirfinancialstatements.
TheCommissionexpresses itsappreciation to theaccountingofficersofall thepoliticalparties for their co-operation.

Allocations to Represented
Political Parties

Represented Political Parties’ Fund – Annual Report 2009/2010 9
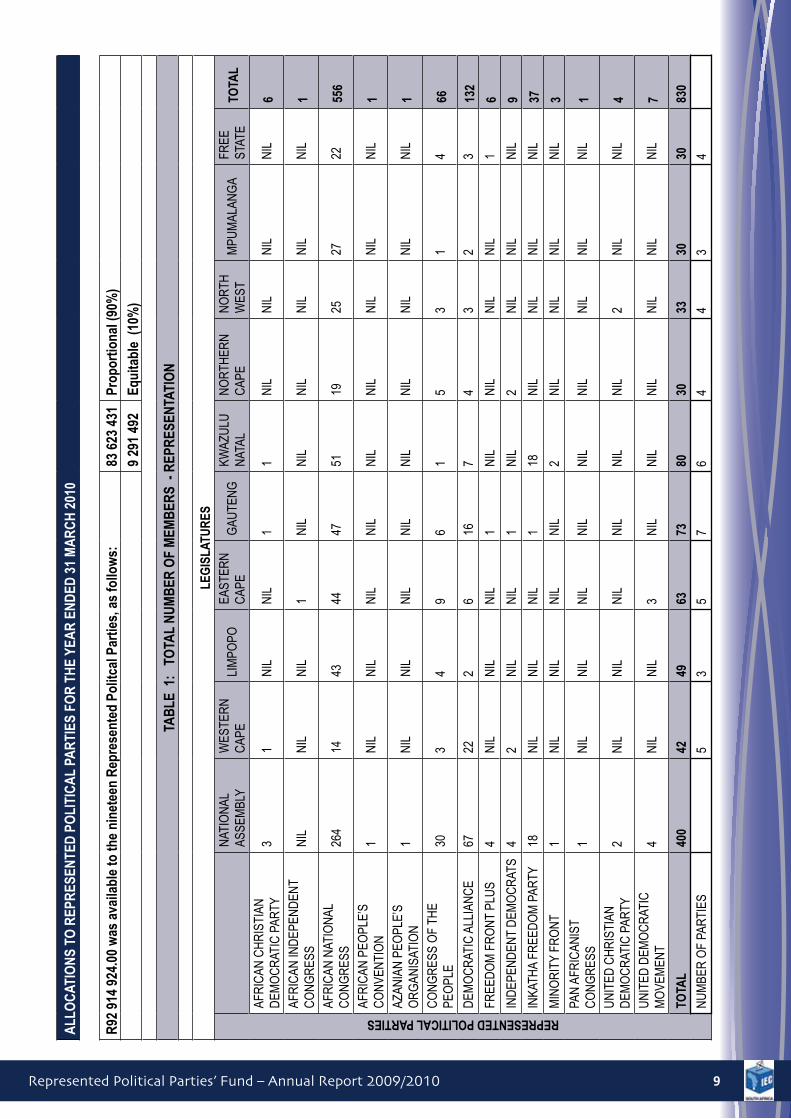
ALL
OC
ATIO
NS
TO R
EPR
ESEN
TED
PO
LITI
CA
L PA
RTI
ES F
OR
TH
E YE
AR
EN
DED
31
MA
RC
H 2
010
R92
914
924
.00
was
ava
ilabl
e to
the
nine
teen
Rep
rese
nted
Pol
itcal
Par
ties,
as
follo
ws:
83 6
23 4
31Pr
opor
tiona
l (90
%)
9 29
1 49
2Eq
uita
ble
(10%
)
TAB
LE 1
: T
OTA
L N
UM
BER
OF
MEM
BER
S -
REP
RES
ENTA
TIO
N
LEG
ISLA
TUR
ES
REPRESENTED POLITICAL PARTIES
NAT
ION
AL
ASSE
MBL
YW
ESTE
RN
C
APE
LIM
POPO
EAST
ERN
C
APE
GAU
TEN
GKW
AZU
LU
NAT
ALN
OR
THER
N
CAP
EN
OR
TH
WES
TM
PUM
ALAN
GA
FREE
ST
ATE
TOTA
L
AFR
ICAN
CH
RIS
TIAN
D
EMO
CR
ATIC
PAR
TY3
1N
ILN
IL1
1N
ILN
ILN
ILN
IL6
AFR
ICAN
IND
EPEN
DEN
T C
ON
GR
ESS
NIL
NIL
NIL
1N
ILN
ILN
ILN
ILN
ILN
IL1
AFR
ICAN
NAT
ION
AL
CO
NG
RES
S26
414
4344
4751
1925
2722
556
AFR
ICAN
PEO
PLE’
S
CO
NVE
NTI
ON
1N
ILN
ILN
ILN
ILN
ILN
ILN
ILN
ILN
IL1
AZAN
IAN
PEO
PLE’
S
OR
GAN
ISAT
ION
1N
ILN
ILN
ILN
ILN
ILN
ILN
ILN
ILN
IL1
CO
NG
RES
S O
F TH
E PE
OPL
E30
34
96
15
31
466
DEM
OC
RAT
IC A
LLIA
NC
E67
222
616
74
32
313
2
FREE
DO
M F
RO
NT
PLU
S4
NIL
NIL
NIL
1N
ILN
ILN
ILN
IL1
6
IND
EPEN
DEN
T D
EMO
CR
ATS
42
NIL
NIL
1N
IL2
NIL
NIL
NIL
9
INKA
THA
FREE
DO
M P
ARTY
18N
ILN
ILN
IL1
18N
ILN
ILN
ILN
IL37
MIN
OR
ITY
FRO
NT
1N
ILN
ILN
ILN
IL2
NIL
NIL
NIL
NIL
3PA
N A
FRIC
ANIS
T
CO
NG
RES
S1
NIL
NIL
NIL
NIL
NIL
NIL
NIL
NIL
NIL
1
UN
ITED
CH
RIS
TIAN
D
EMO
CR
ATIC
PAR
TY2
NIL
NIL
NIL
NIL
NIL
NIL
2N
ILN
IL4
UN
ITED
DEM
OC
RAT
IC
MO
VEM
ENT
4N
ILN
IL3
NIL
NIL
NIL
NIL
NIL
NIL
7
TOTA
L40
042
4963
7380
3033
3030
830
NU
MBE
R O
F PA
RTI
ES5
35
76
44
34
Represented Political Parties’ Fund – Annual Report 2009/201010
ALL
OC
ATIO
NS
TO R
EPR
ESEN
TED
PO
LITI
CA
L PA
RTI
ES F
OR
TH
E YE
AR
EN
DED
31
MA
RC
H 2
010
(con
tinue
d)
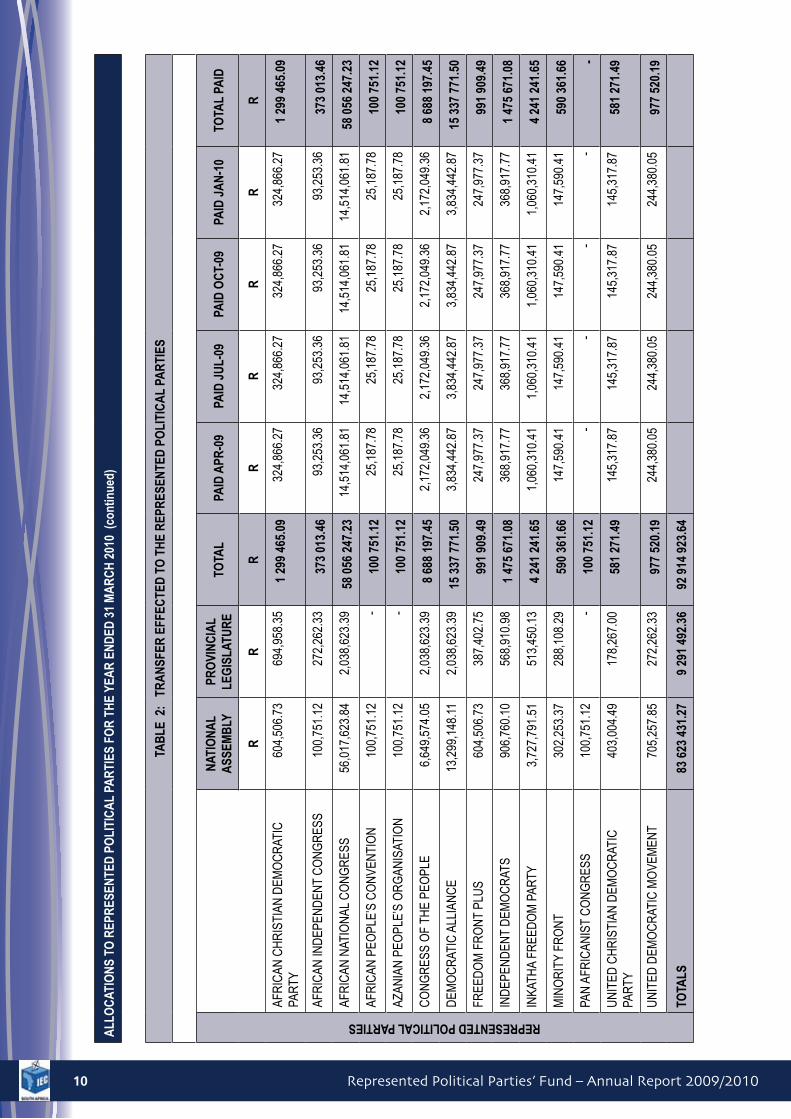
TAB
LE 2
: T
RA
NSF
ER E
FFEC
TED
TO
TH
E R
EPR
ESEN
TED
PO
LITI
CA
L PA
RTI
ES
REPRESENTED POLITICAL PARTIES
NAT
ION
AL
ASS
EMB
LYPR
OVI
NC
IAL
LEG
ISLA
TUR
ETO
TAL
PAID
APR
-09
PAID
JU
L-09
PAID
OC
T-09
PAID
JA
N-1
0TO
TAL
PAID
RR
RR
RR
RR
AFR
ICAN
CH
RIS
TIAN
DEM
OC
RAT
IC
PAR
TY604,506.73
694,958.35
1 2
99 4
65.0
9 324,866.27
324,866.27
324,866.27
324,866.27
1 2
99 4
65.0
9
AFR
ICAN
IND
EPEN
DEN
T C
ON
GR
ESS
100,751.12
272,262.33
373
013
.46
93,253.36
93,253.36
93,253.36
93,253.36
373
013
.46
AFR
ICAN
NAT
ION
AL C
ON
GR
ESS
56,017,623.84
2,038,623.39
58
056
247.
23
14,514,061.81
14,514,061.81
14,514,061.81
14,514,061.81
58
056
247.
23
AFR
ICAN
PEO
PLE’
S C
ON
VEN
TIO
N100,751.12
- 1
00 7
51.1
2 25,187.78
25,187.78
25,187.78
25,187.78
100
751
.12
AZAN
IAN
PEO
PLE’
S O
RG
ANIS
ATIO
N100,751.12
- 1
00 7
51.1
2 25,187.78
25,187.78
25,187.78
25,187.78
100
751
.12
CO
NG
RES
S O
F TH
E PE
OPL
E6,649,574.05
2,038,623.39
8 6
88 1
97.4
5 2,172,049.36
2,172,049.36
2,172,049.36
2,172,049.36
8 6
88 1
97.4
5
DEM
OC
RAT
IC A
LLIA
NC
E13,299,148.11
2,038,623.39
15
337
771.
50
3,834,442.87
3,834,442.87
3,834,442.87
3,834,442.87
15
337
771.
50
FREE
DO
M F
RO
NT
PLU
S604,506.73
387,402.75
991
909
.49
247,977.37
247,977.37
247,977.37
247,977.37
991
909
.49
IND
EPEN
DEN
T D
EMO
CR
ATS
906,760.10
568,910.98
1 4
75 6
71.0
8 368,917.77
368,917.77
368,917.77
368,917.77
1 4
75 6
71.0
8
INKA
THA
FREE
DO
M P
ARTY
3,727,791.51
513,450.13
4 2
41 2
41.6
5 1,060,310.41
1,060,310.41
1,060,310.41
1,060,310.41
4 2
41 2
41.6
5
MIN
OR
ITY
FRO
NT
302,253.37
288,108.29
590
361
.66
147,590.41
147,590.41
147,590.41
147,590.41
590
361
.66
PAN
AFR
ICAN
IST
CO
NG
RES
S100,751.12
- 1
00 7
51.1
2 -
- -
- -
UN
ITED
CH
RIS
TIAN
DEM
OC
RAT
IC
PAR
TY403,004.49
178,267.00
581
271
.49
145,317.87
145,317.87
145,317.87
145,317.87
581
271
.49
UN
ITED
DEM
OC
RAT
IC M
OVE
MEN
T705,257.85
272,262.33
977
520
.19
244,380.05
244,380.05
244,380.05
244,380.05
977
520
.19
TOTA
LS 8
3 62
3 43
1.27
9
291
492
.36
92
914
923.
64
Represented Political Parties’ Fund – Annual Report 2009/2010 11
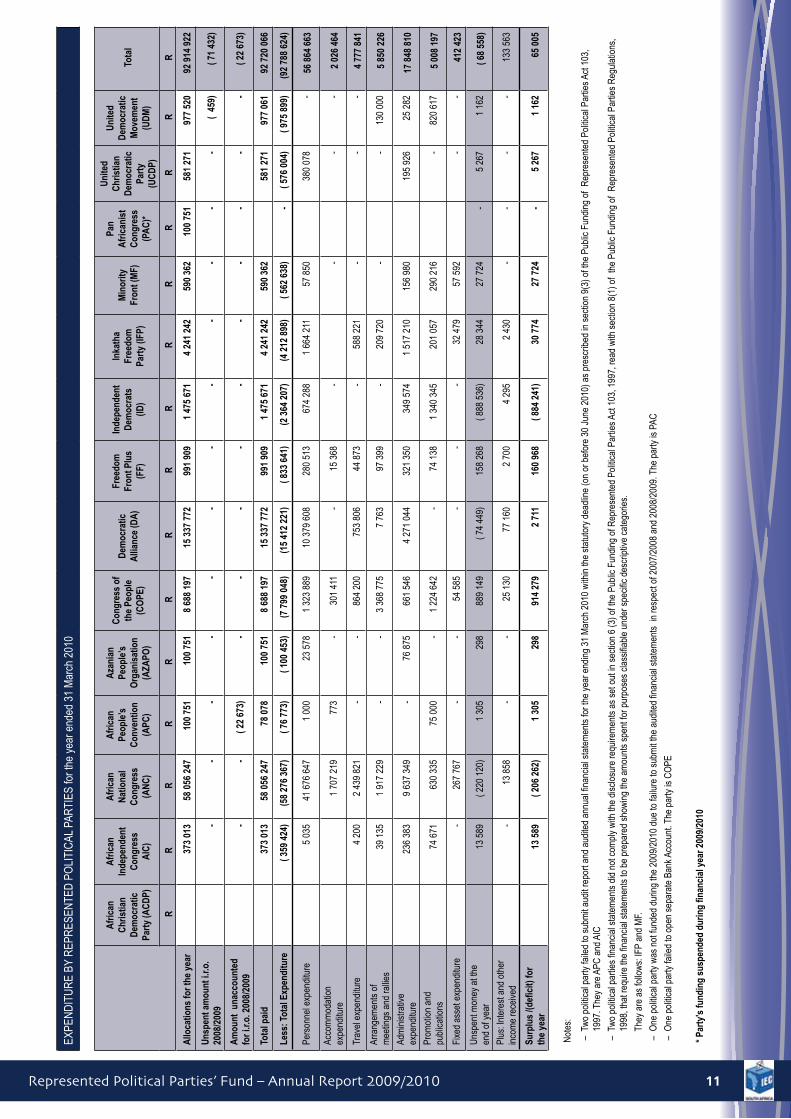
EXPE
ND
ITU
RE
BY R
EPR
ESEN
TED
PO
LITI
CAL
PAR
TIES
for t
he y
ear e
nded
31
Mar
ch 2
010
Afr
ican
C
hris
tian
Dem
ocra
tic
Part
y (A
CD
P)
Afr
ican
In
depe
nden
t C
ongr
ess
AIC
)
Afr
ican
N
atio
nal
Con
gres
s (A
NC
)
Afr
ican
Pe
ople
’s
Con
vent
ion
(APC
)
Aza
nian
Pe
ople
’s
Org
anis
atio
n (A
ZAPO
)
Con
gres
s of
th
e Pe
ople
(C
OPE
)
Dem
ocra
tic
Alli
ance
(DA
)
Free
dom
Fr
ont P
lus
(FF)
Inde
pend
ent
Dem
ocra
ts
(ID)
Inka
tha
Free
dom
Pa
rty
(IFP)
Min
ority
Fr
ont (
MF)
Pan
Afr
ican
ist
Con
gres
s (P
AC
)*
Uni
ted
Chr
istia
n D
emoc
ratic
Pa
rty
(UC
DP)
Uni
ted
Dem
ocra
tic
Mov
emen
t (U
DM
)
Tot
al
R
R
R
R
R
R
R
R
R
R
R
R
R
R
R
Allo
catio
ns fo
r the
yea
r 3
73 0
13
58
056
247
100
751
1
00 7
51
8 6
88 1
97
15
337
772
991
909
1
475
671
4
241
242
5
90 3
62
100
751
5
81 2
71
977
520
9
2 91
4 92
2
Uns
pent
am
ount
i.r.o
. 20
08/2
009
- -
- -
- -
- -
- -
- -
( 4
59)
( 71
432
)
Am
ount
una
ccou
nted
fo
r i.r.
o. 2
008/
2009
-
- (
22 6
73)
- -
- -
- -
- -
- -
( 22
673
)
Tota
l pai
d 3
73 0
13
58
056
247
78
078
100
751
8
688
197
1
5 33
7 77
2 9
91 9
09
1 4
75 6
71
4 2
41 2
42
590
362
5
81 2
71
977
061
9
2 72
0 06
6
Less
: Tot
al E
xpen
ditu
re
( 35
9 42
4) (5
8 27
6 36
7) (
76 7
73)
( 10
0 45
3) (7
799
048
) (1
5 41
2 22
1) (
833
641)
(2 3
64 2
07)
(4 2
12 8
98)
( 56
2 63
8) -
( 57
6 00
4) (
975
899)
(92
788
624)
Pers
onne
l exp
endi
ture
5
035
4
1 67
6 64
7 1
000
2
3 57
8 1
323
889
1
0 37
9 60
8 2
80 5
13
674
288
1
664
211
5
7 85
0 3
80 0
78
- 5
6 86
4 66
3
Acco
mm
odat
ion
expe
nditu
re
1 7
07 2
19
77
3 -
301
411
-
15
368
- -
- -
2 0
26 4
64
Trav
el e
xpen
ditu
re
4 2
00
2 4
39 8
21
- -
864
200
7
53 8
06
44
873
- 5
88 2
21
- -
- 4
777
841
Arra
ngem
ents
of
mee
tings
and
rallie
s 3
9 13
5 1
917
229
-
- 3
368
775
7
763
9
7 39
9 -
209
720
-
- 1
30 0
00
5 8
50 2
26
Adm
inis
trativ
e ex
pend
iture
2
36 3
83
9 6
37 3
49
- 7
6 87
5 6
61 5
46
4 2
71 0
44
321
350
3
49 5
74
1 5
17 2
10
156
980
1
95 9
26
25
282
17
848
810
Prom
otio
n an
d pu
blic
atio
ns
74
671
630
335
7
5 00
0 -
1 2
24 6
42
- 7
4 13
8 1
340
345
2
01 0
57
290
216
-
820
617
5
008
197
Fixe
d as
set e
xpen
ditu
re
- 2
67 7
67
- -
54
585
- -
- 3
2 47
9 5
7 59
2 -
- 4
12 4
23
Uns
pent
mon
ey a
t the
en
d of
yea
r 1
3 58
9 (
220
120)
1 3
05
29
8 8
89 1
49
( 74
449
) 1
58 2
68
( 88
8 53
6) 2
8 34
4 2
7 72
4 -
5 2
67
1 1
62
( 68
558
)
Plus
: Int
eres
t and
oth
er
inco
me
rece
ived
-
13
858
- -
25
130
77
160
2 7
00
4 2
95
2 4
30
- -
- -
133
563
Surp
lus
/(defi
cit)
for
the
year
1
3 58
9 (
206
262)
1 3
05
29
8 9
14 2
79
2 7
11
160
968
(
884
241)
30
774
27
724
- 5
267
1
162
6
5 00
5
Not
es:
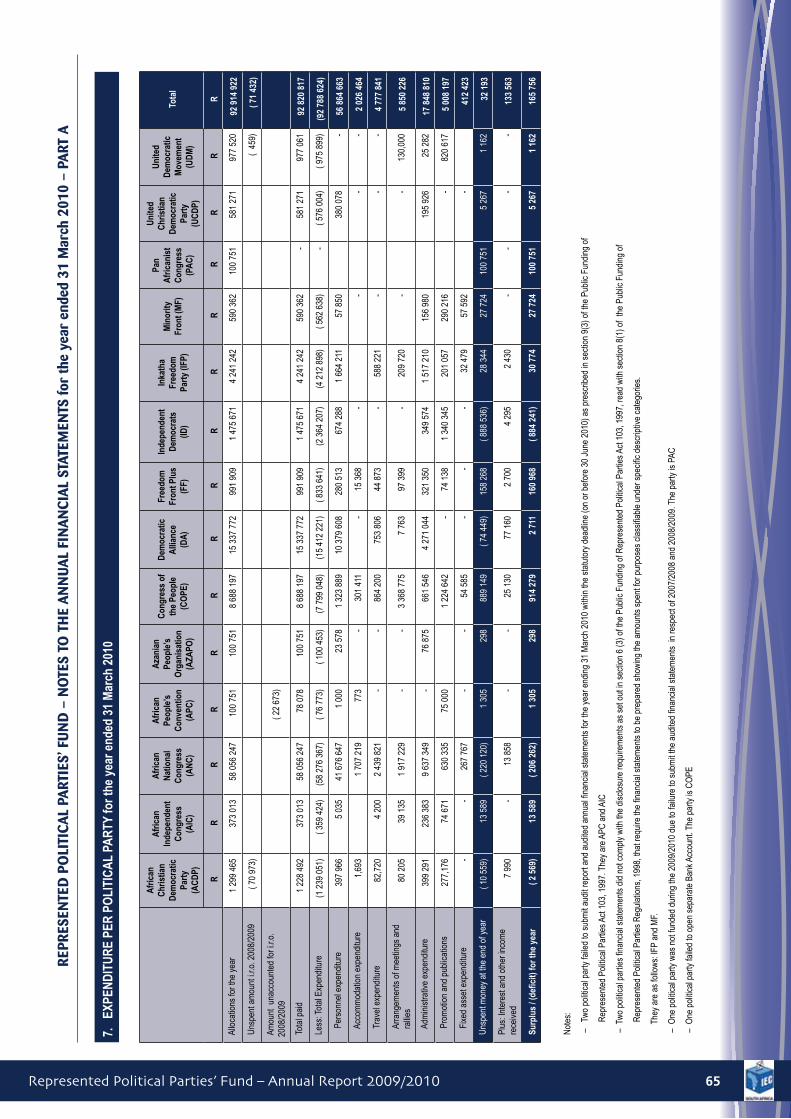
–Twopoliticalpartyfailedtosubmitauditreportandauditedannualfinancialstatementsfortheyearending31March2010withinthestatutorydeadline(onorbefore30June2010)asprescribedinsection9(3)ofthePublicFundingofRepresentedPoliticalPartiesAct103,
1997.TheyareAP
CandAIC
–Twopoliticalpartiesfinancialstatementsdidnotcom
plywiththedisclosurerequirementsassetoutinsection6(3)ofthePublicFundingofR
epresentedPoliticalPartiesAct103,1997,readwithsection8(1)ofthePu
blicFundingofRepresentedPoliticalPartiesRegulations,
1998,thatrequirethefinancialstatementstobepreparedshowingtheam
ountsspentforpurposesclassifiableunderspecificdescriptivecategories.
Theyareasfollows:IFPandMF.
–O
nepoliticalpartywasnotfundedduringthe2009/2010duetofailuretosubmittheauditedfinancialstatementsinrespectof2007/2008and2008/2009.ThepartyisPAC
–O
nepoliticalpartyfailedtoopenseparateBankAccount.ThepartyisCOPE
* Pa
rty'
s fu
ndin
g su
spen
ded
durin
g fin
anci
al y
ear 2
009/
2010

Extracts Of The RepresentedPolitical Parties’ Statements
Published In This Report As Filed With Commission

Represented Political Parties’ Fund – Annual Report 2009/2010 15
REPRESENTED POLITICAL PARTY
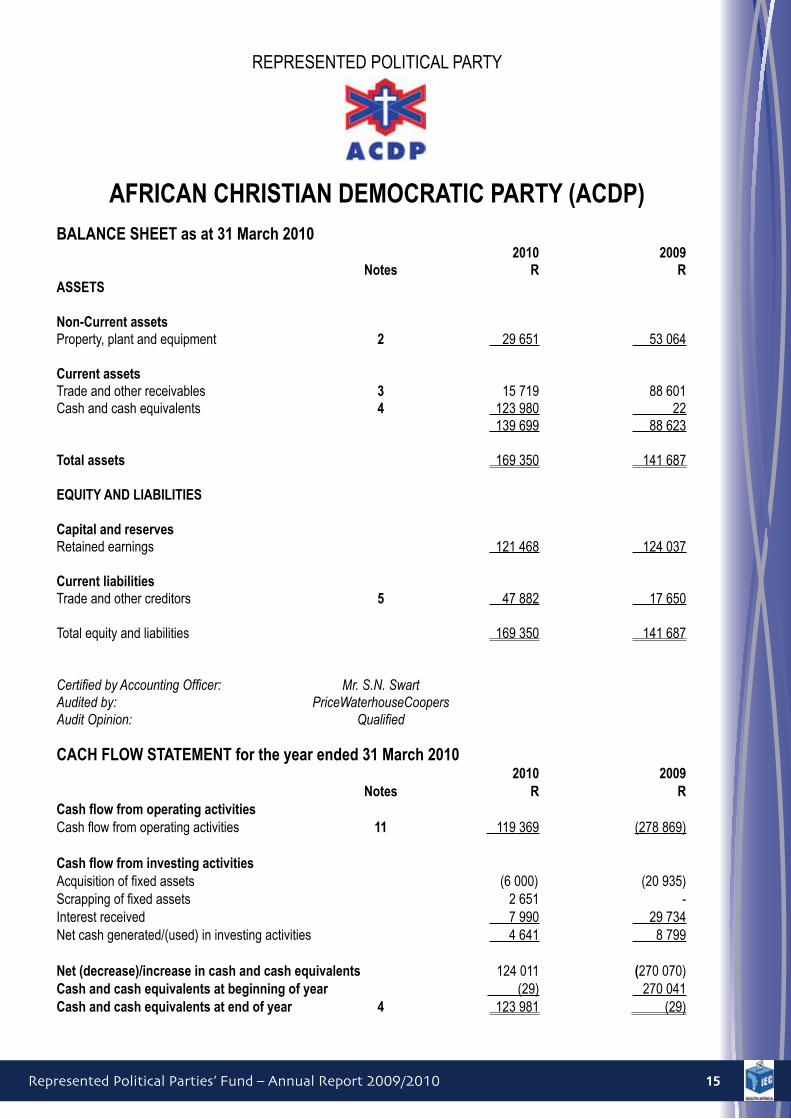
AFRICAN CHRISTIAN DEMOCRATIC PARTY (ACDP) BALANCE SHEET as at 31 March 2010 2010 2009 Notes R RASSETS
Non-Current assetsProperty, plant and equipment 2 29 651 53 064
Current assetsTrade and other receivables 3 15 719 88 601Cash and cash equivalents 4 123 980 22 139 699 88 623 Total assets 169 350 141 687 EQUITY AND LIABILITIES
Capital and reserves Retained earnings 121 468 124 037
Current liabilitiesTrade and other creditors 5 47 882 17 650
Total equity and liabilities 169 350 141 687
Certified by Accounting Officer: Mr. S.N. SwartAudited by: PriceWaterhouseCoopersAudit Opinion: Qualified
CACH FLOW STATEMENT for the year ended 31 March 2010 2010 2009 Notes R RCash flow from operating activitiesCashflowfromoperatingactivities 11 119 369 (278 869)
Cash flow from investing activitiesAcquisitionoffixedassets (6000) (20935)Scrappingoffixedassets 2651 -Interest received 7 990 29 734Netcashgenerated/(used)ininvestingactivities 4 641 8 799
Net (decrease)/increase in cash and cash equivalents 124 011 (270 070)Cash and cash equivalents at beginning of year (29) 270 041Cash and cash equivalents at end of year 4 123 981 (29)
Represented Political Parties’ Fund – Annual Report 2009/201016
REPRESENTED POLITICAL PARTY
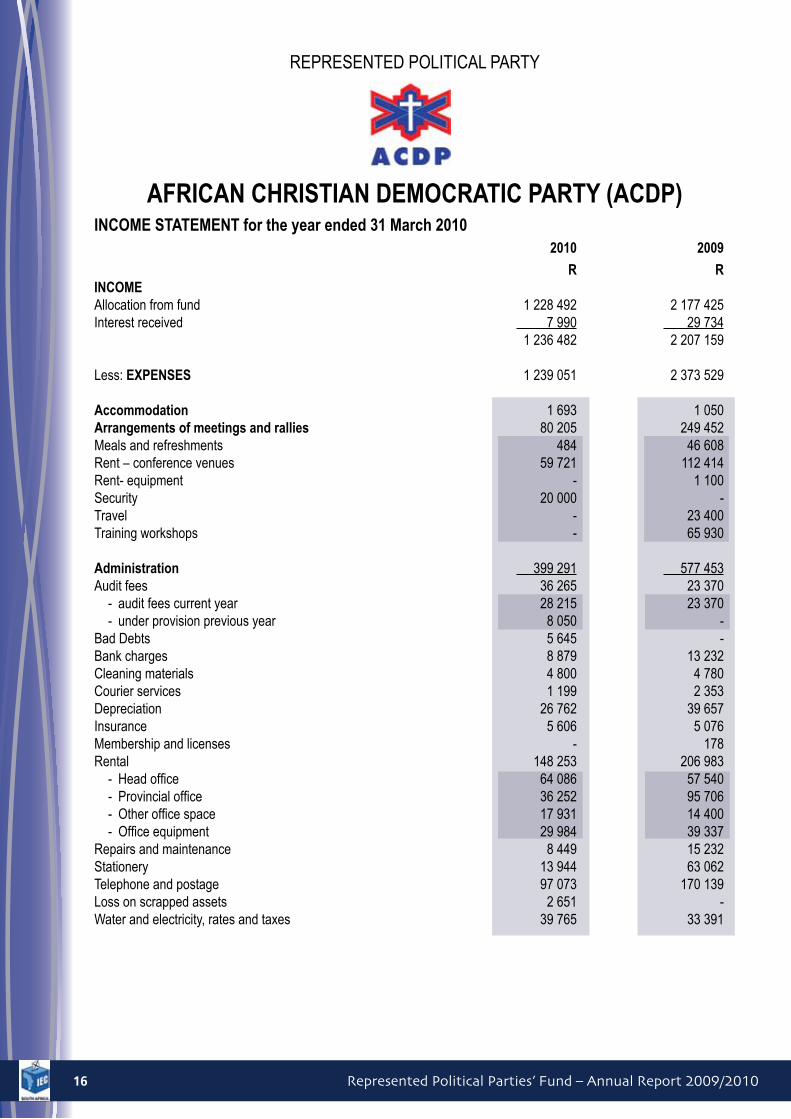
AFRICAN CHRISTIAN DEMOCRATIC PARTY (ACDP)INCOME STATEMENT for the year ended 31 March 2010 2010 2009
R RINCOME Allocation from fund 1 228 492 2 177 425Interest received 7 990 29 734 1 236 482 2 207 159 Less: EXPENSES 1 239 051 2 373 529 Accommodation 1 693 1 050Arrangements of meetings and rallies 80 205 249 452Meals and refreshments 484 46 608Rent – conference venues 59 721 112 414Rent- equipment - 1 100Security 20 000 -Travel - 23 400Trainingworkshops - 65930
Administration 399 291 577 453Audit fees 36 265 23 370
- audit fees current year 28 215 23 370- under provision previous year 8 050 -
Bad Debts 5 645 - Bank charges 8 879 13 232Cleaning materials 4 800 4 780Courier services 1 199 2 353Depreciation 26 762 39 657Insurance 5 606 5 076Membership and licenses - 178Rental 148 253 206 983- Headoffice 64086 57540- Provincialoffice 36252 95706- Otherofficespace 17931 14400- Officeequipment 29984 39337
Repairs and maintenance 8 449 15 232Stationery 13 944 63 062Telephone and postage 97 073 170 139Loss on scrapped assets 2 651 -Water and electricity, rates and taxes 39 765 33 391

Represented Political Parties’ Fund – Annual Report 2009/2010 17
REPRESENTED POLITICAL PARTY
AFRICAN CHRISTIAN DEMOCRATIC PARTY (ACDP)
INCOME STATEMENT for the year ended 31 March 2010 2010 2009
R R
Promotions and publications 277 176 650 247Advertisements 70 441 194 618Entertainment expenditure 366 1 092Printing 199 000 311 823Promotions 7 369 142 714
Personnel Expenditure 397 966 579 471Salaries 375 969 551 691Skills Development Levy 4 285 5 673Telephoneallowance 13427 16434Unemployment Insurance fund 4 285 5 673
Travel 82 720 315 856
Net loss for the year (2 569) (166 370)

Represented Political Parties’ Fund – Annual Report 2009/201018
REPRESENTED POLITICAL PARTY
AFRICAN INDEPENDENT CONGRESS (AIC)BALANCE SHEET as at 31 March 2010
2010Notes
ASSETS
Non-current assets Furnitureandofficeequipment 4 23522 Current assets Cash and cash equivalents 13 Total assets 23 535 CAPITAL ACCOUNT AND LIABILITIES Capital AccountSurplus for the year 13 590
Current liabilities Accounts payables 9 945 TOTAL EQUITY AND LIABILITIES 23 535
Certified by Accounting Officer: Mr MP GaloAudited by: Nicholson & Company Audit Opinion: Unqualified
Represented Political Parties’ Fund – Annual Report 2009/2010 19
REPRESENTED POLITICAL PARTY
AFRICAN INDEPENDENT CONGRESS (AIC)
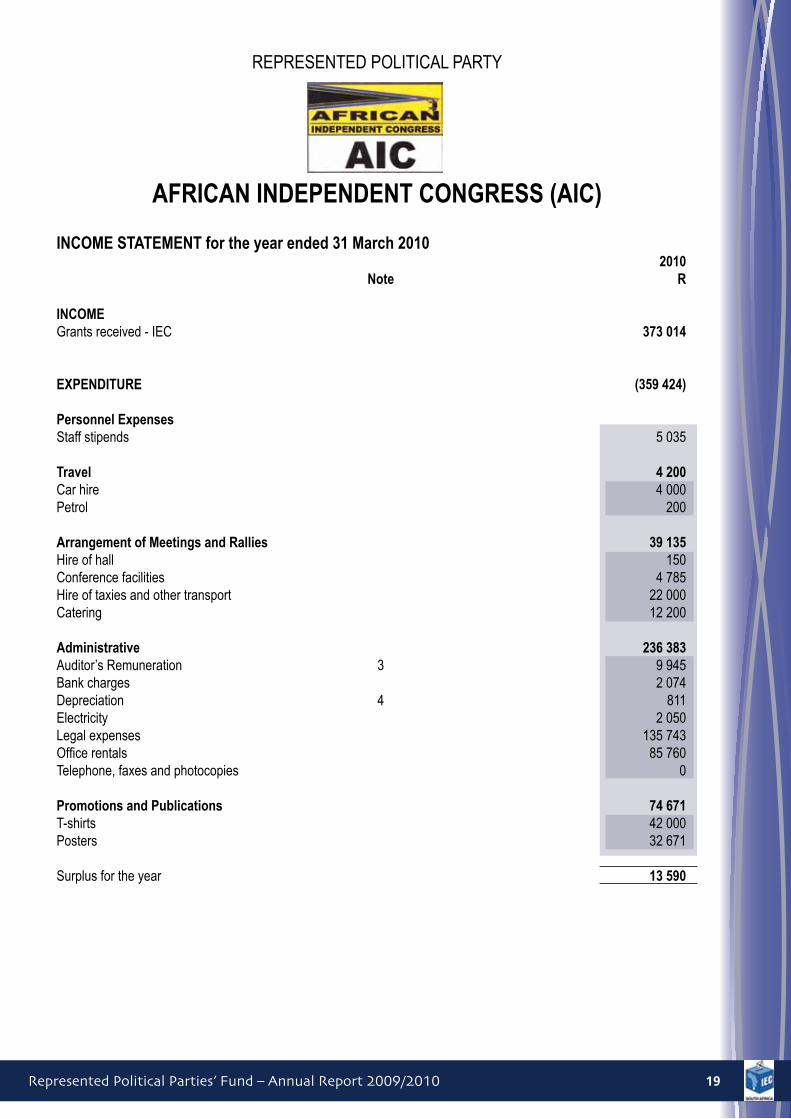
INCOME STATEMENT for the year ended 31 March 2010 2010 Note R
INCOME Grants received - IEC 373 014
EXPENDITURE (359 424)
Personnel Expenses Staff stipends 5 035
Travel 4 200Car hire 4 000Petrol 200
Arrangement of Meetings and Rallies 39 135Hire of hall 150Conference facilities 4 785Hire of taxies and other transport 22 000Catering 12 200 Administrative 236 383Auditor’s Remuneration 3 9 945Bank charges 2 074Depreciation 4 811Electricity 2 050Legal expenses 135 743Officerentals 85760Telephone, faxes and photocopies 0
Promotions and Publications 74 671T-shirts 42 000Posters 32 671 Surplus for the year 13 590

Represented Political Parties’ Fund – Annual Report 2009/201020
REPRESENTED POLITICAL PARTY
AFRICAN NATIONAL CONGRESS (ANC)
BALANCE SHEET as at 31 March 2010 2010 2009 Notes R RASSETS
Non-current assets 654 232 921 999Furniture and equipment 3 630 423 851 526Intangible assets 4 23 809 70 473 Current assets 7 167 35 260Cash and cash equivalents 5 7 167 4 395 Trade and other receivables 6 - 30 865 Total assets 661 399 957 259 EQUITY AND LIABILITIES
EquityAccumulated surplus 491 399 697 661
Current liabilities Trade and other payables 7 170 000 259 598
TOTAL EQUITY AND LIABILITIES 661 399 957 259 Certified by Accounting Officer: Mr. M PhosaAudited by: Deloitte & Touche Audit opinion: Unqualified
CACH FLOW STATEMENT for the year ended 31 March 2010 2010 2009 Notes R ROPERATING ACTIVITIESCash received from the Independent Electoral Commission 58 056 247 61 113 511Cash paid to suppliers and employees (58 067 333) (61 741 564) Cash(utilisedin)/generatedbyoperations 8 (11 086) (628 053)Interest received 13 858 47 293Net cash generated from (utilised in) operating activities 2 772 (580 760)
INVESTING ACTIVITIESAdditions to furniture and equipment - (59 702)Net cash utilised in investing activities - (59 702) NET INCREASE/(DECREASE) IN CASH AND CASH EQUIVALENTS 2 772 (640 462)Cash and cash equivalents at beginning of year 4 395 644 857CASH AND CASH EQUIVALENTS AT END OF YEAR 5 7 167 4 395
Represented Political Parties’ Fund – Annual Report 2009/2010 21
REPRESENTED POLITICAL PARTY
AFRICAN NATIONAL CONGRESS (ANC)
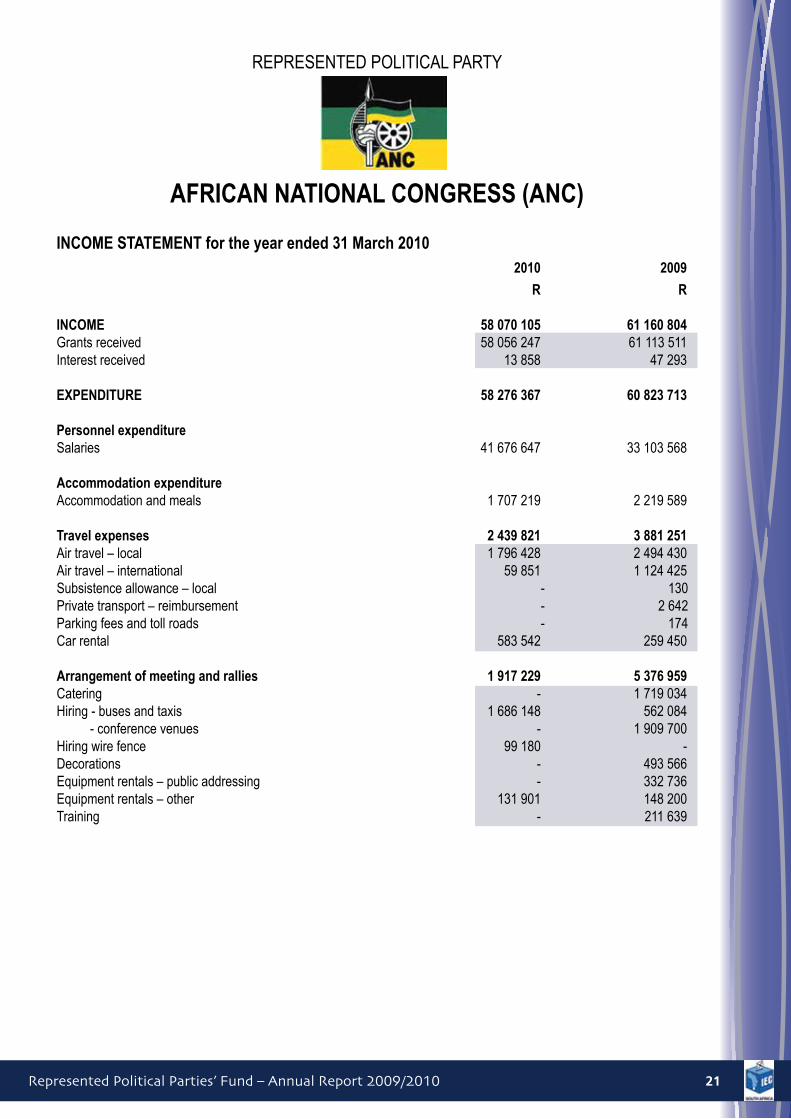
INCOME STATEMENT for the year ended 31 March 2010 2010 2009
R R
INCOME 58 070 105 61 160 804Grants received 58 056 247 61 113 511Interest received 13 858 47 293
EXPENDITURE 58 276 367 60 823 713
Personnel expenditureSalaries 41 676 647 33 103 568
Accommodation expenditure Accommodation and meals 1 707 219 2 219 589
Travel expenses 2 439 821 3 881 251Air travel – local 1 796 428 2 494 430 Air travel – international 59 851 1 124 425Subsistenceallowance–local -130Private transport – reimbursement - 2 642Parking fees and toll roads - 174 Car rental 583 542 259 450
Arrangement of meeting and rallies 1 917 229 5 376 959Catering - 1 719 034 Hiring - buses and taxis 1 686 148 562 084 - conference venues - 1 909 700Hiringwirefence 99180 -Decorations - 493 566Equipment rentals – public addressing - 332 736Equipment rentals – other 131 901 148 200Training - 211 639

Represented Political Parties’ Fund – Annual Report 2009/201022
REPRESENTED POLITICAL PARTY
AFRICAN NATIONAL CONGRESS (ANC)
INCOME STATEMENT for the year ended 31 March 2010
2010 2009
R REXPENDITURE (continued)
Administrative – general 8 604 754 8 610 125Cleaning 806 963 797 030 Communication expenses - cell phones 912 411 689 779 - telephone fax modem 2 872 836 1 237 674Consultation fees 264 756 1 482 800Courier services 62 754 219 834Maintenance and repairs - buildings 207 550 90 644 - motor vehicles 18 404 16 848Security services 3 026 131 3 189 055Server expenses - 318 783Stationery 209 013 201 510Website maintenance 223 936 366 168
Administrative – other 1 032 595 965 273Audit costs – Independent Electoral Commission 226 180 167 600Bank charges 986 1 678Fuel - 14 679Improvement on Property - 114 000Internet Maintenance 77 905 3 221Interest Paid - 153Legal costs 58 128 - RenewalofLicenses 45964 30096Rental-officeplant 10230 56257 - parking 251 888 230 400Services rendered 57 353 322 634Staff training - 2 180Subscription fees 30 865 22 375OfficeCatering 212387 -Rental-OfficeEquipment 60709 -

Represented Political Parties’ Fund – Annual Report 2009/2010 23
REPRESENTED POLITICAL PARTY
AFRICAN NATIONAL CONGRESS (ANC)
INCOME STATEMENT for the year ended 31 March 2010
2010 2009
R REXPENDITURE (continued)
Promotions and publications 630 335 6 388 117Advertisements - other 3 000 2 000 000Advertisements-Newspapers 40695 3232000Books/magazines - -Hire of sound system 118 058 61 929Photographic costs 47 937 3 420Press conference and media 144 073 194 105Printing and production - books - 8 883 - pamphlets 276 572 708 875 - posters - 90 216
Depreciation and amortisation 267 767 278 831
(Deficit)/Surplus for the year (206 262) 337 091
Represented Political Parties’ Fund – Annual Report 2009/201024
REPRESENTED POLITICAL PARTY
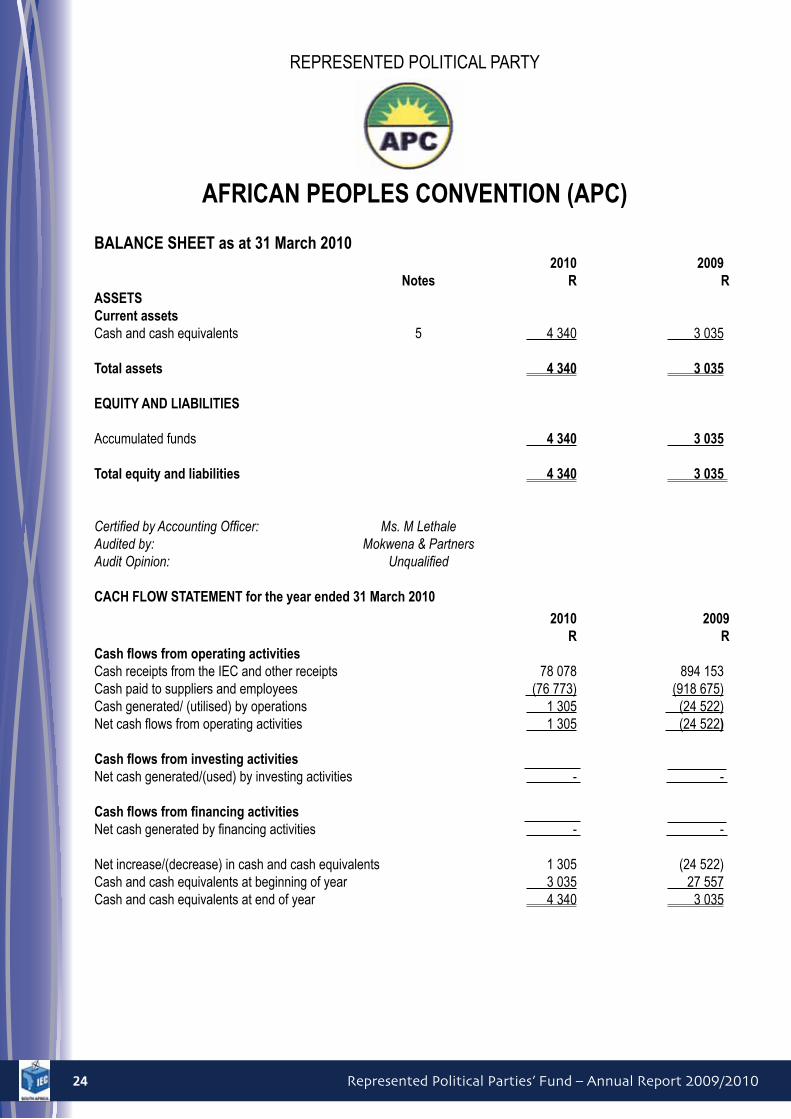
AFRICAN PEOPLES CONVENTION (APC)
BALANCE SHEET as at 31 March 2010 2010 2009 Notes R RASSETSCurrent assets Cash and cash equivalents 5 4 340 3 035
Total assets 4 340 3 035 EQUITY AND LIABILITIES
Accumulated funds 4 340 3 035
Total equity and liabilities 4 340 3 035
Certified by Accounting Officer: Ms. M LethaleAudited by: Mokwena & Partners Audit Opinion: Unqualified
CACH FLOW STATEMENT for the year ended 31 March 2010
2010 2009 R RCash flows from operating activities Cash receipts from the IEC and other receipts 78 078 894 153Cash paid to suppliers and employees (76 773) (918 675)Cashgenerated/(utilised)byoperations 1 305 (24 522)Netcashflowsfromoperatingactivities 1 305 (24 522)
Cash flows from investing activities Netcashgenerated/(used)byinvestingactivities - -
Cash flows from financing activities Netcashgeneratedbyfinancingactivities - - Netincrease/(decrease)incashandcashequivalents 1305 (24522)Cash and cash equivalents at beginning of year 3 035 27 557Cash and cash equivalents at end of year 4 340 3 035
Represented Political Parties’ Fund – Annual Report 2009/2010 25
REPRESENTED POLITICAL PARTY
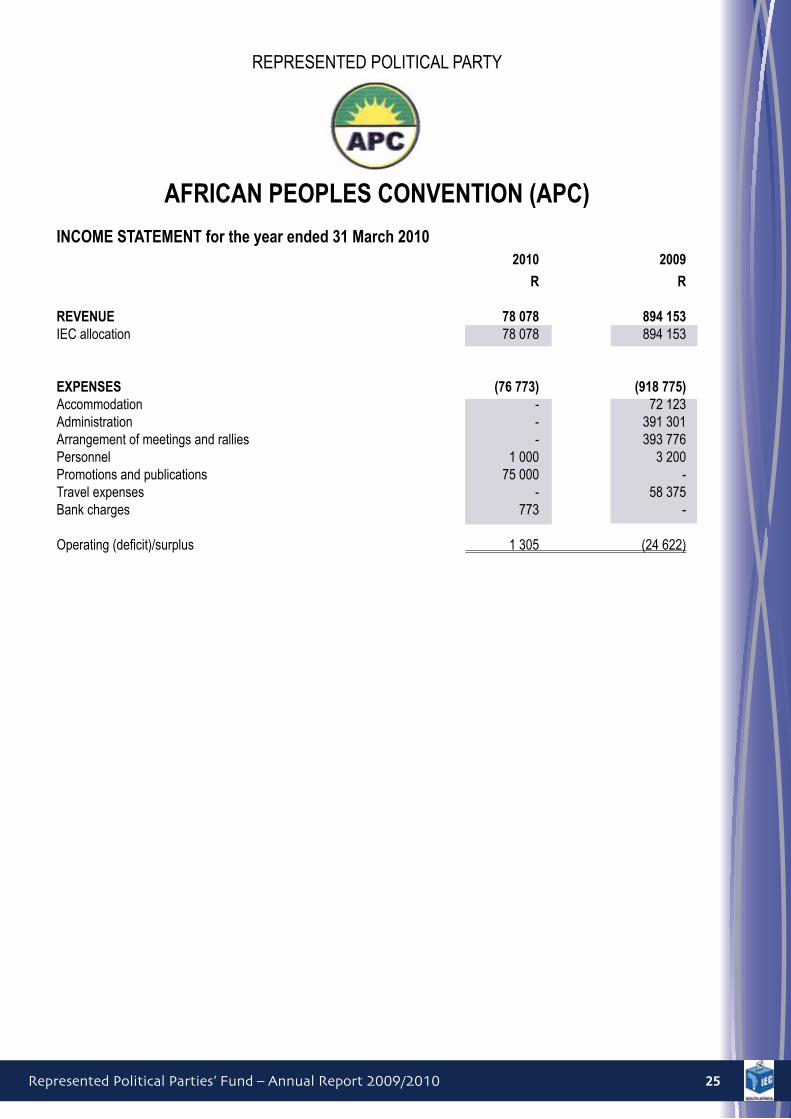
AFRICAN PEOPLES CONVENTION (APC)
INCOME STATEMENT for the year ended 31 March 2010 2010 2009
R R
REVENUE 78 078 894 153IEC allocation 78 078 894 153
EXPENSES (76 773) (918 775)Accommodation - 72 123Administration - 391 301Arrangement of meetings and rallies - 393 776Personnel 1 000 3 200Promotions and publications 75 000 -Travel expenses - 58 375Bank charges 773 -
Operating(deficit)/surplus 1 305 (24 622)
Represented Political Parties’ Fund – Annual Report 2009/201026
REPRESENTED POLITICAL PARTY
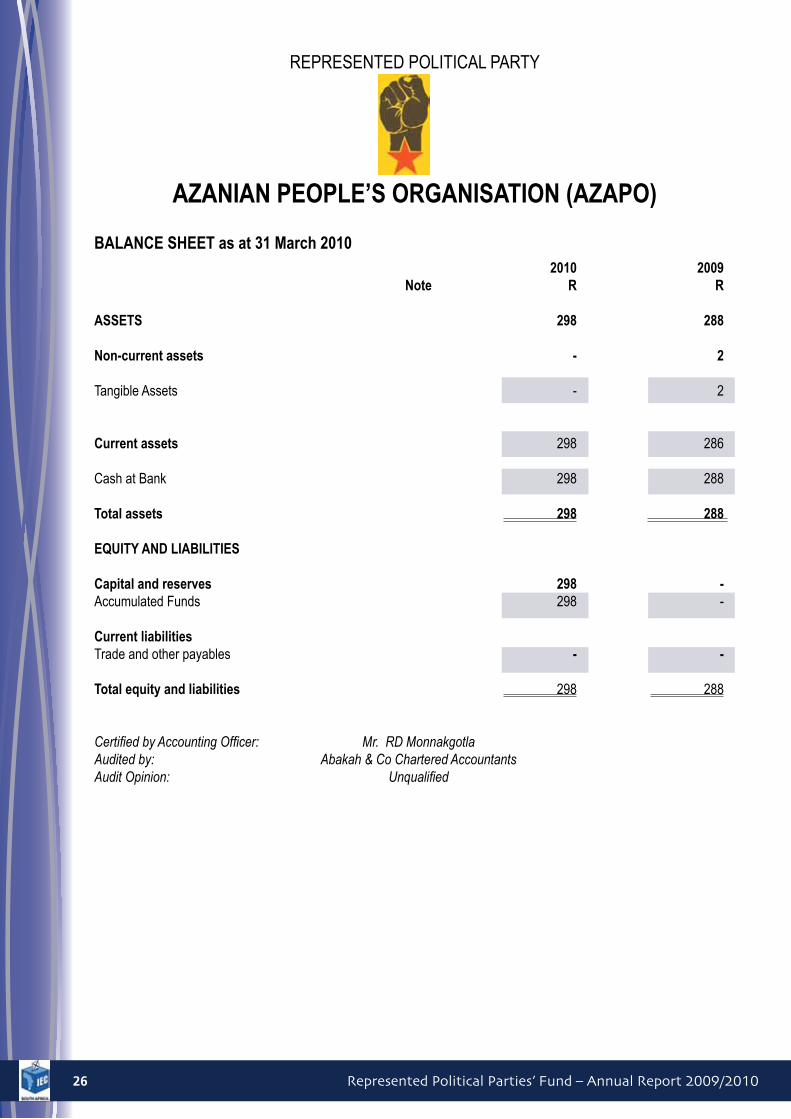
AZANIAN PEOPLE’S ORGANISATION (AZAPO)
BALANCE SHEET as at 31 March 2010 2010 2009 Note R R
ASSETS 298 288 Non-current assets - 2
Tangible Assets - 2 Current assets 298 286 Cash at Bank 298 288 Total assets 298 288 EQUITY AND LIABILITIES
Capital and reserves 298 -Accumulated Funds 298 - Current liabilities Trade and other payables - - Total equity and liabilities 298 288
Certified by Accounting Officer: Mr. RD MonnakgotlaAudited by: Abakah & Co Chartered Accountants Audit Opinion: Unqualified

Represented Political Parties’ Fund – Annual Report 2009/2010 27
REPRESENTED POLITICAL PARTY
AZANIAN PEOPLE’S ORGANISATION (AZAPO)
INCOME STATEMENT for the year ended 31 March 2010 2010 2009 Note R R
TOTAL INCOME 100 751 95 786
Grant/Allocationreceived 100751 95786 LESS: EXPENDITURE 100 453 108 055
Administration 76 875 55 849Audit fees 4 500 4 500 Accountingofficer’sfee - 1480Bank charges 2 490 3 129E-mail and internet service 1 960 2 520Repairstoofficeequipment 259 3174Rent,water&lights 53766 24731Rentalofofficeequipment 8485 -Printing and stationery - 270Sundry 1 320 -Telephones 4 095 16 045
Personnel 23 578 50 906Salaries 23 578 50 906 Travelling - 1 300Local - 1 300 NET SURPLUS/(DEFICIT) FOR THE YEAR 298 -12 269
Represented Political Parties’ Fund – Annual Report 2009/201028
REPRESENTED POLITICAL PARTY
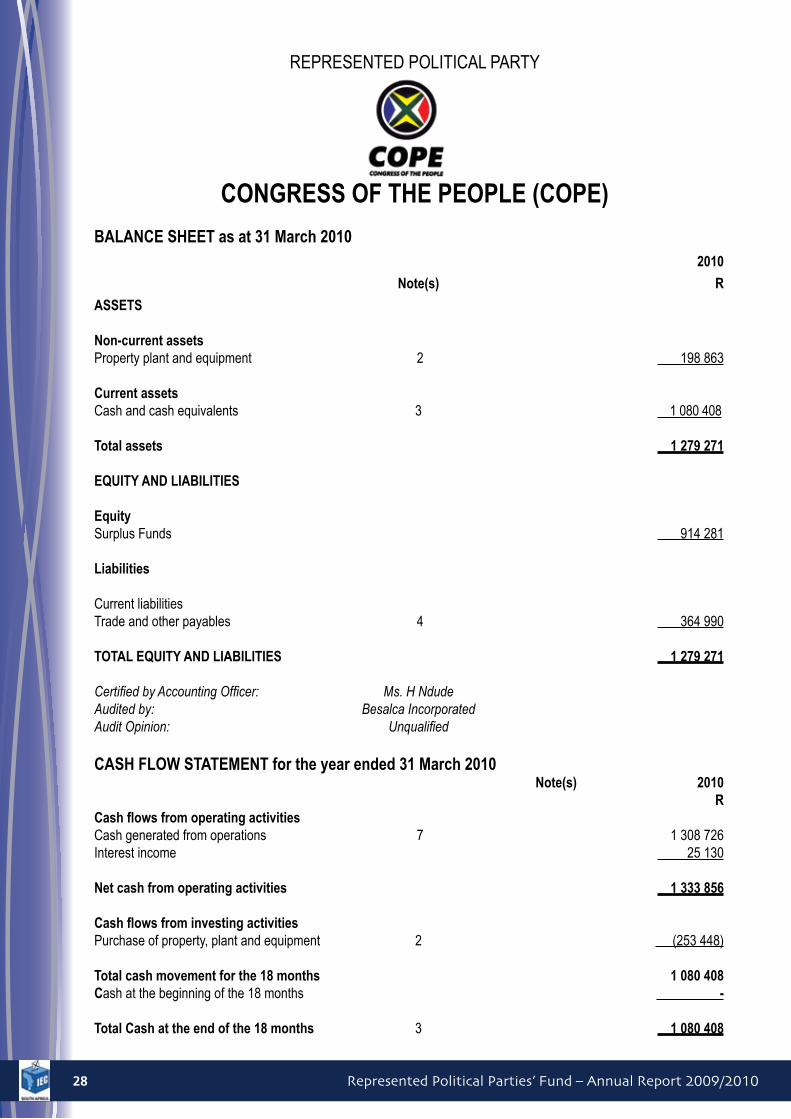
CONGRESS OF THE PEOPLE (COPE)
BALANCE SHEET as at 31 March 2010 2010
Note(s) R
ASSETS Non-current assetsProperty plant and equipment 2 198 863 Current assets Cash and cash equivalents 3 1 080 408 Total assets 1 279 271 EQUITY AND LIABILITIES
EquitySurplus Funds 914 281
Liabilities
Current liabilities Trade and other payables 4 364 990 TOTAL EQUITY AND LIABILITIES 1 279 271 Certified by Accounting Officer: Ms. H NdudeAudited by: Besalca Incorporated Audit Opinion: Unqualified
CASH FLOW STATEMENT for the year ended 31 March 2010 Note(s) 2010 RCash flows from operating activities Cash generated from operations 7 1 308 726Interest income 25 130
Net cash from operating activities 1 333 856
Cash flows from investing activities Purchase of property, plant and equipment 2 (253 448) Total cash movement for the 18 months 1 080 408Cash at the beginning of the 18 months -
Total Cash at the end of the 18 months 3 1 080 408
Represented Political Parties’ Fund – Annual Report 2009/2010 29
REPRESENTED POLITICAL PARTY
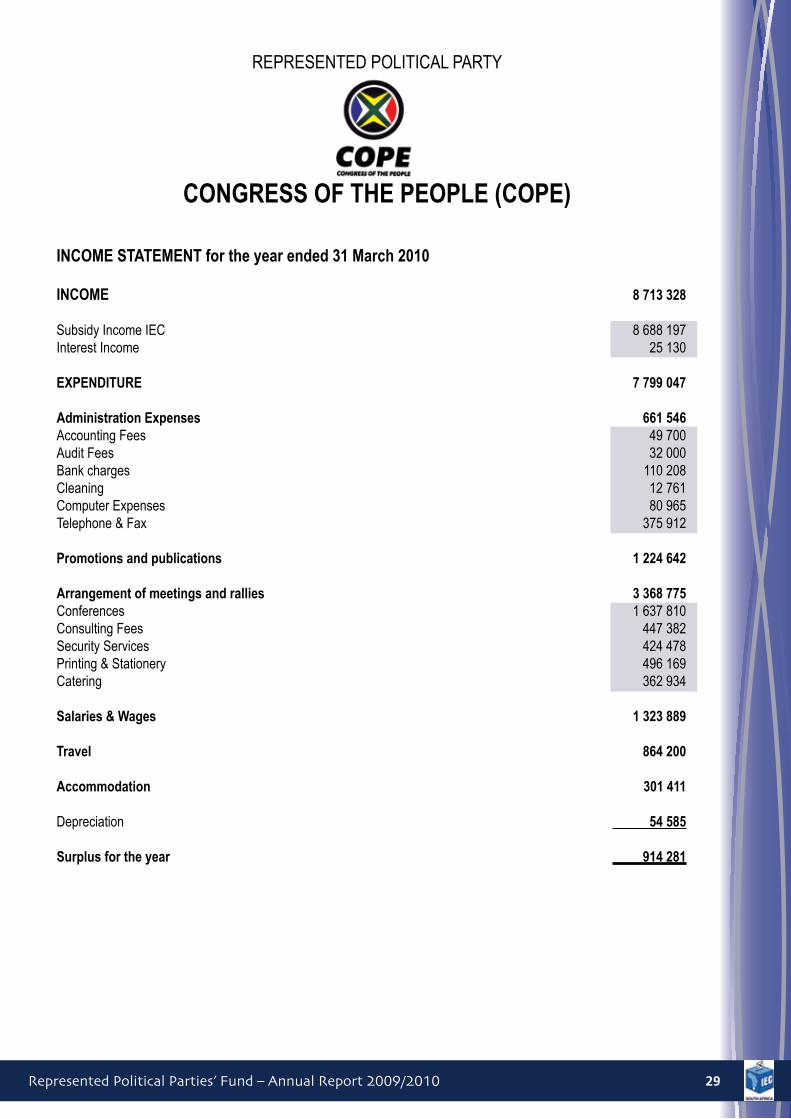
CONGRESS OF THE PEOPLE (COPE)
INCOME STATEMENT for the year ended 31 March 2010
INCOME 8 713 328
Subsidy Income IEC 8 688 197 Interest Income 25 130
EXPENDITURE 7 799 047 Administration Expenses 661 546Accounting Fees 49 700Audit Fees 32 000Bank charges 110 208 Cleaning 12 761Computer Expenses 80 965Telephone&Fax 375912
Promotions and publications 1 224 642
Arrangement of meetings and rallies 3 368 775Conferences 1 637 810Consulting Fees 447 382Security Services 424 478Printing&Stationery 496169Catering 362 934
Salaries & Wages 1 323 889
Travel 864 200
Accommodation 301 411
Depreciation 54 585
Surplus for the year 914 281

Represented Political Parties’ Fund – Annual Report 2009/201030
REPRESENTED POLITICAL PARTY
DEMOCRATIC ALLIANCE (DA)
STATEMENT OF FINANCIAL POSITION as at 31 March 2010 2010 2009 Notes R RASSETS
Non-Current Assets Property, plant and equipment 2 328 327 328 327Current Assets Otherfinancialassets 3 - 10000Accounts receivable 4 8 482 -Cash and cash equivalents 429 977 109 343 438 459 119 343Total Assets 438 787 119 670 EQUITY AND LIABILITIES
Equity Accumulateddeficit (21 015) (23 728)
LiabilitiesCurrent Liabilities Accounts payable 5 459 802 143 398Total Equity and Liabilities 438 787 119 670 Certified by Accounting Officer: Mr. J MoakesAudited by: BBR Van Der Grijp Audit Opinion: Unqualified
STATEMENT OF CACH FLOW for the year ended 31 March 2010 2010 2009 Notes R RCash flows from operating activitiesCash generated from operations 11 345 088 (291 449)Interest income 77 160 51 175Finance costs - (47)Net cash from operating activities 422 248 (240 321)
Cash flows from investing activitiesPurchase of property, plant and equipment 2 (111 614) - Repaymentsofotherfinancialassets 10 000 - Net cash from investing activities (101 614) - Total cash movement for the year 320 634 (240 321)Cash at beginning of the year 109 343 349 664Total cash at end of the year 4 429 977 109 343

Represented Political Parties’ Fund – Annual Report 2009/2010 31
REPRESENTED POLITICAL PARTY
DEMOCRATIC ALLIANCE (DA)
STATEMENT OF COMPREHENSIVE INCOME for the year ended 31 March 2010 2010 2009
Notes R RINCOME Grants received from Independent Electoral Commission 6 15 337 772 10 538 737Interest received 8 77 160 51 175 1.3 15 414 931 10 589 912EXPENDITURE Personnel expenditureInsurance: UIF 69 082 35 130Medical funds 307 739 187 460Pension funds 374 716 278 733Recruitment of staff 13 558 49 626Salaries 9 005 917 5 196 012Staff gifts 2 680 285Staff training 605 916 87 901 10 379 608 5 835 147
Travel Expenditure 753 806 739 867 Administrative expenditureAuditor’s remuneration 10 37 934 24 624Bank charges 9 554 6 857Communication expenditure: telephone and fax 1 062 297 733 644Consultancy fees 201 863 153 936Courier and postage services 71 605 68 378Depreciation 111 613 -Finance costs - 47Internet 421 166 181 417Loss on disposal of asset - 1Maintenance and repairs: building 628 883 72 791Maintenance and repairs: computers 356 051 419 383Maintenance and repairs: equipment 68 943 65 137Newspapers,booksandpublications 27863 50963Printing and stationery 79 914 331 972Refreshments and sundries 38 588 52 162Rent and electricity 484 492 638 462Rentalofficeequipment 572362 1341932Security expenses 12 666 7 649Skills development levies 85 252 46 756 4 271 044 4 196 111
Arrangement of meetings and rallies 7 763 10 251Meetings and rallies 7 763 10 251
Total expenditure 15 412 220 10 781 375Total Comprehensive income (deficit) for the year 7 2 711 (191 463)
Represented Political Parties’ Fund – Annual Report 2009/201032
REPRESENTED POLITICAL PARTY
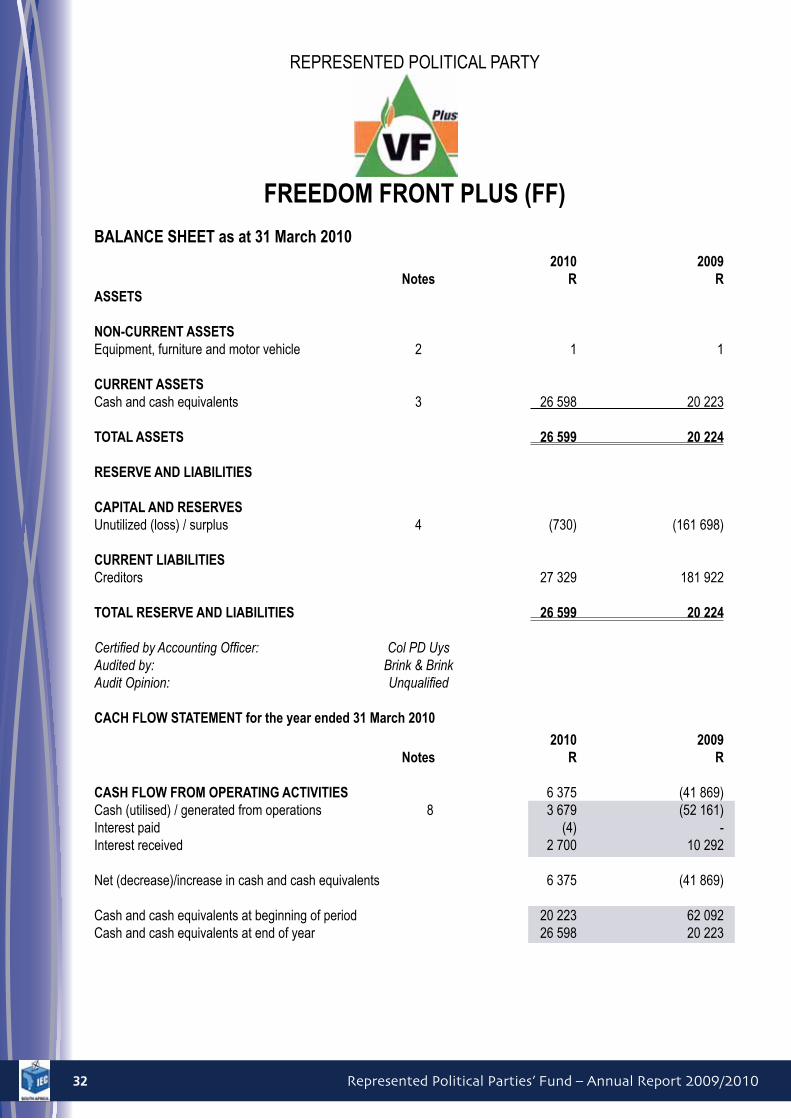
FREEDOM FRONT PLUS (FF)
BALANCE SHEET as at 31 March 2010 2010 2009 Notes R RASSETS
NON-CURRENT ASSETSEquipment, furniture and motor vehicle 2 1 1
CURRENT ASSETS Cash and cash equivalents 3 26 598 20 223 TOTAL ASSETS 26 599 20 224 RESERVE AND LIABILITIES CAPITAL AND RESERVESUnutilized(loss)/surplus 4 (730) (161698)
CURRENT LIABILITIESCreditors 27 329 181 922 TOTAL RESERVE AND LIABILITIES 26 599 20 224
Certified by Accounting Officer: Col PD UysAudited by: Brink & BrinkAudit Opinion: Unqualified
CACH FLOW STATEMENT for the year ended 31 March 2010
2010 2009 Notes R R
CASH FLOW FROM OPERATING ACTIVITIES 6 375 (41 869)Cash(utilised)/generatedfromoperations 8 3679 (52161)Interest paid (4) -Interest received 2 700 10 292
Net(decrease)/increaseincashandcashequivalents 6375 (41869)
Cash and cash equivalents at beginning of period 20 223 62 092Cash and cash equivalents at end of year 26 598 20 223
Represented Political Parties’ Fund – Annual Report 2009/2010 33
REPRESENTED POLITICAL PARTY
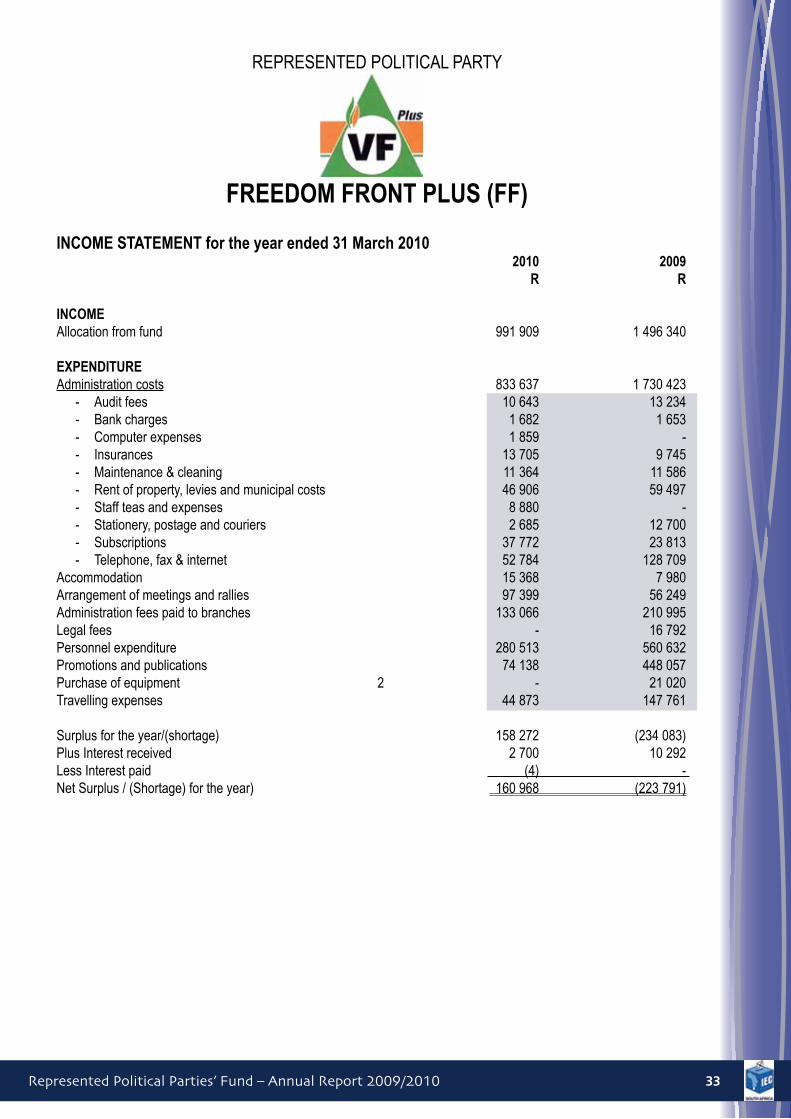
FREEDOM FRONT PLUS (FF)
INCOME STATEMENT for the year ended 31 March 2010 2010 2009 R R INCOME Allocation from fund 991 909 1 496 340 EXPENDITURE Administration costs 833 637 1 730 423
- Audit fees 10 643 13 234- Bank charges 1 682 1 653- Computer expenses 1 859 -- Insurances 13 705 9 745- Maintenance&cleaning 11364 11586- Rent of property, levies and municipal costs 46 906 59 497- Staff teas and expenses 8 880 -- Stationery, postage and couriers 2 685 12 700- Subscriptions 37 772 23 813- Telephone,fax&internet 52784 128709
Accommodation 15 368 7 980Arrangement of meetings and rallies 97 399 56 249Administration fees paid to branches 133 066 210 995Legal fees - 16 792Personnel expenditure 280 513 560 632Promotions and publications 74 138 448 057Purchase of equipment 2 - 21 020Travelling expenses 44 873 147 761
Surplusfortheyear/(shortage) 158272 (234083)Plus Interest received 2 700 10 292Less Interest paid (4) - NetSurplus/(Shortage)fortheyear) 160 968 (223 791)
Represented Political Parties’ Fund – Annual Report 2009/201034
REPRESENTED POLITICAL PARTY
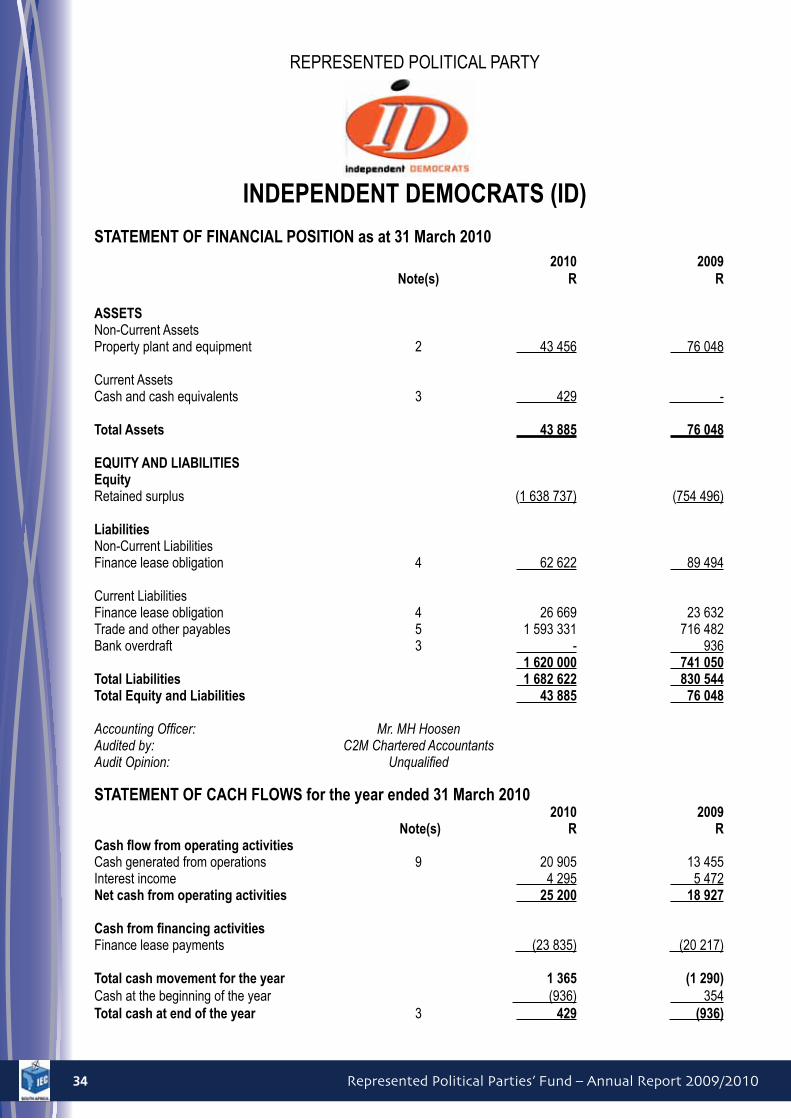
INDEPENDENT DEMOCRATS (ID)
STATEMENT OF FINANCIAL POSITION as at 31 March 2010 2010 2009 Note(s) R R
ASSETSNon-Current AssetsProperty plant and equipment 2 43 456 76 048
Current AssetsCash and cash equivalents 3 429 -
Total Assets 43 885 76 048 EQUITY AND LIABILITIESEquity Retained surplus (1 638 737) (754 496)
LiabilitiesNon-Current LiabilitiesFinance lease obligation 4 62 622 89 494
Current LiabilitiesFinance lease obligation 4 26 669 23 632Trade and other payables 5 1 593 331 716 482Bank overdraft 3 - 936 1 620 000 741 050Total Liabilities 1 682 622 830 544Total Equity and Liabilities 43 885 76 048 Accounting Officer: Mr. MH HoosenAudited by: C2M Chartered AccountantsAudit Opinion: Unqualified
STATEMENT OF CACH FLOWS for the year ended 31 March 2010 2010 2009 Note(s) R RCash flow from operating activitiesCash generated from operations 9 20 905 13 455Interest income 4 295 5 472Net cash from operating activities 25 200 18 927
Cash from financing activitiesFinance lease payments (23 835) (20 217)
Total cash movement for the year 1 365 (1 290)Cash at the beginning of the year (936) 354Total cash at end of the year 3 429 (936)

Represented Political Parties’ Fund – Annual Report 2009/2010 35
REPRESENTED POLITICAL PARTY
INDEPENDENT DEMOCRATS (ID)
INCOME STATEMENT For the year ended 31 March 2010 2010 2009
Note(s) R RRevenueRepresented Political Party Fund allocation 1 475 671 1 249 562
Other incomeInterest received 7 4 295 5 472
Operating expenses Administration 349 574 1 31 389Arrangement of meetings and rallies - 2 595Personnel expenditure 674 288 1 058 331Promotions and publications 1 340 345 447 037 2 364 207 1 639 352Surplus / (shortfall) for the year (884 241) (384 318)
Represented Political Parties’ Fund – Annual Report 2009/201036
REPRESENTED POLITICAL PARTY
INKATHA FREEDOM PARTY (IFP)
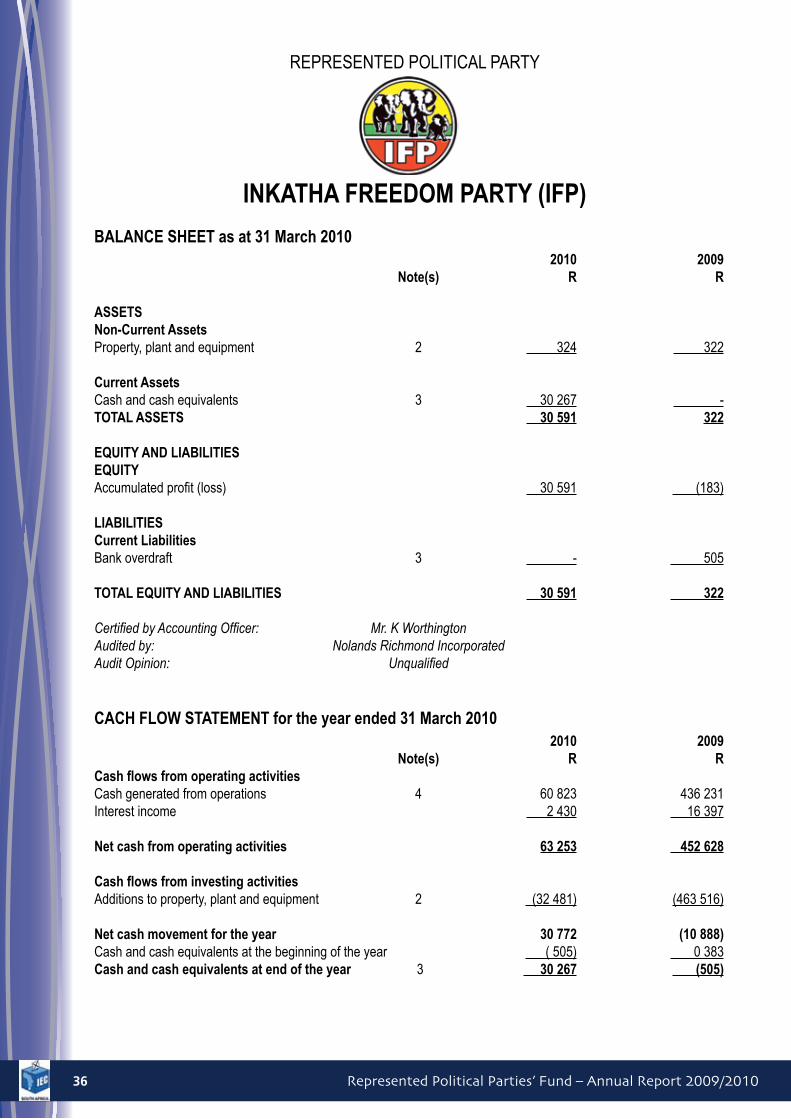
BALANCE SHEET as at 31 March 2010 2010 2009 Note(s) R R
ASSETSNon-Current AssetsProperty, plant and equipment 2 324 322
Current AssetsCash and cash equivalents 3 30 267 -TOTAL ASSETS 30 591 322 EQUITY AND LIABILITIESEQUITY Accumulatedprofit(loss) 30 591 (183)
LIABILITIESCurrent LiabilitiesBank overdraft 3 - 505
TOTAL EQUITY AND LIABILITIES 30 591 322 Certified by Accounting Officer: Mr. K WorthingtonAudited by: Nolands Richmond IncorporatedAudit Opinion: Unqualified
CACH FLOW STATEMENT for the year ended 31 March 2010 2010 2009 Note(s) R RCash flows from operating activities Cash generated from operations 4 60 823 436 231Interest income 2 430 16 397
Net cash from operating activities 63 253 452 628
Cash flows from investing activities Additions to property, plant and equipment 2 (32 481) (463 516)
Net cash movement for the year 30 772 (10 888)Cash and cash equivalents at the beginning of the year ( 505) 0 383Cash and cash equivalents at end of the year 3 30 267 (505)

Represented Political Parties’ Fund – Annual Report 2009/2010 37
REPRESENTED POLITICAL PARTY
INKATHA FREEDOM PARTY (IFP)
INCOME STATEMENT for the year ended 31 March 2010 2010 2009
R R
Revenue 4 241 242 5 403 084
Operating expenses (4 212 898) (5 437 675)
Personnel expenditure 1 664 211 960 672Salaries: employees 1 657 534 832 457Pension contributions - 105 365Training: computer and other 6 677 22 850 Travel expenditure 588 221 821 497Air travel – internal 44 895 136 573Car rental 201 483 86 837Fuel and maintenance 16 163 1 270Hotel expenditure 255 388 448 553Parking fees and toll roads 66 892 104 283Public transport 3 400 43 981
Arrangement of meeting and rallies 209 720 714 132Food and beverages 61 310 132 673Hiring - conference venues 30 870 101 748 Hiring - buses and taxis 108 631 354 499Renting equipment – public address - 65 548Renting equipment – other 2 300 16 853Security 6 609 42 811

Represented Political Parties’ Fund – Annual Report 2009/201038
REPRESENTED POLITICAL PARTY
INKATHA FREEDOM PARTY (IFP)
INCOME STATEMENT for the year ended 31 March 2010 2010 2009
R REXPENDITURE (continued)
Administration expenditure 1 517 210 2 131 885Auditors renumeration 25 685 34 236Bank charges 6 181 5 830Cleaning - 11 889Communication expenditure: telephone, fax, modem 169 051 126 510Entertainment 8 708 77 122Legal costs 193 811 776 726Maintenance and repairs - buildings 62 700 5 641Maintenance and repairs - computers 21 205 11 894Maintenance and repairs - equipment 42 657 102 833Maintenance and repairs - motor vehicles 42 581 19 994Rent paid 44 032 526 646Rental:officeequipment 34906 68326Stationery 113 727 192 867Subscriptions 12 890 5 508Utilities 739 076 165 863
Promotions and publications 201 057 345 997Advertising 38 975 -Printing and production: posters, books and pamphlets 76 530 201 978Promotional T shirts, badges, keyrings and caps 85 552 144 019 Depreciation and amortisation 32 479 463 492
Operating profit (loss) 28 344 (34 591)
Investment revenue 2 430 16 397
Profit (loss) for the year 30 774 (18 194)
Represented Political Parties’ Fund – Annual Report 2009/2010 39
REPRESENTED POLITICAL PARTY
MINORITY FRONT (MF)
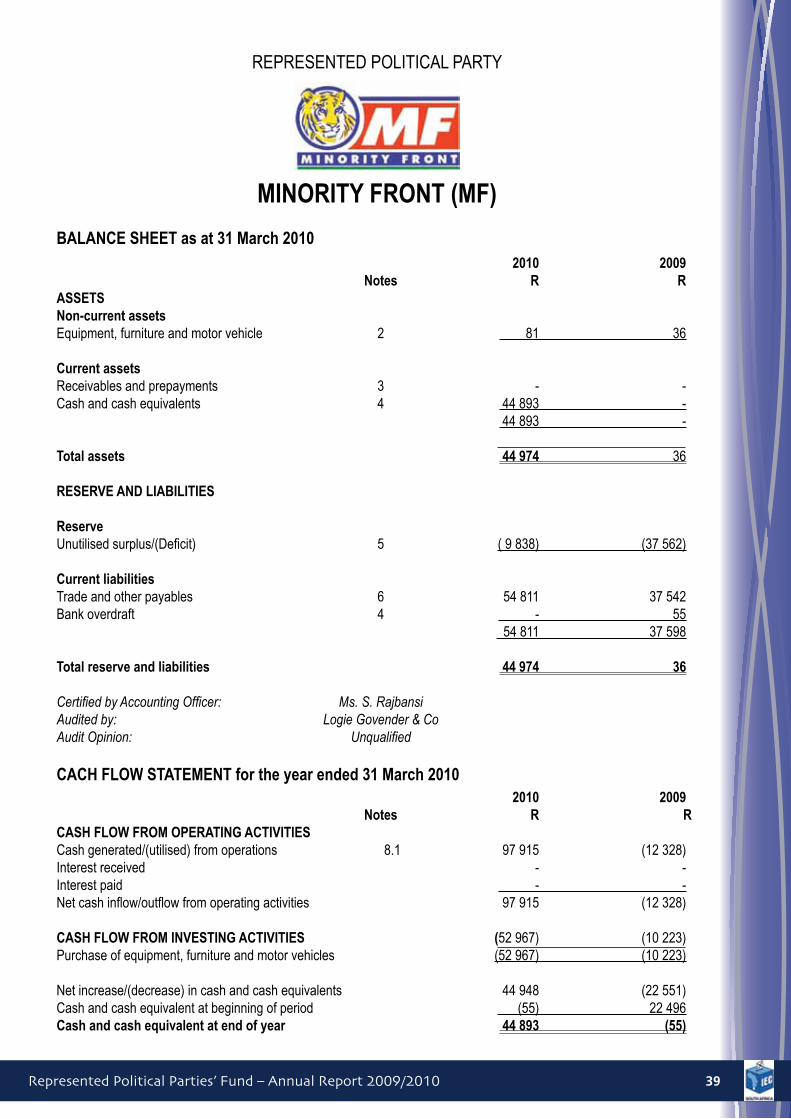
BALANCE SHEET as at 31 March 2010 2010 2009 Notes R RASSETSNon-current assetsEquipment, furniture and motor vehicle 2 81 36
Current assets Receivables and prepayments 3 - -Cash and cash equivalents 4 44 893 - 44 893 -
Total assets 44 974 36 RESERVE AND LIABILITIES
ReserveUnutilisedsurplus/(Deficit) 5 ( 9 838) (37 562)
Current liabilitiesTrade and other payables 6 54 811 37 542Bank overdraft 4 - 55 54 811 37 598
Total reserve and liabilities 44 974 36
Certified by Accounting Officer: Ms. S. RajbansiAudited by: Logie Govender & Co Audit Opinion: Unqualified
CACH FLOW STATEMENT for the year ended 31 March 2010 2010 2009 Notes R RCASH FLOW FROM OPERATING ACTIVITIES Cashgenerated/(utilised)fromoperations 8.1 97915 (12328)Interest received - -Interest paid - -Netcashinflow/outflowfromoperatingactivities 97915 (12328) CASH FLOW FROM INVESTING ACTIVITIES (52 967) (10 223)Purchase of equipment, furniture and motor vehicles (52 967) (10 223)
Netincrease/(decrease)incashandcashequivalents 44948 (22551)Cash and cash equivalent at beginning of period (55) 22 496Cash and cash equivalent at end of year 44 893 (55)
Represented Political Parties’ Fund – Annual Report 2009/201040
REPRESENTED POLITICAL PARTY
MINORITY FRONT (MF)
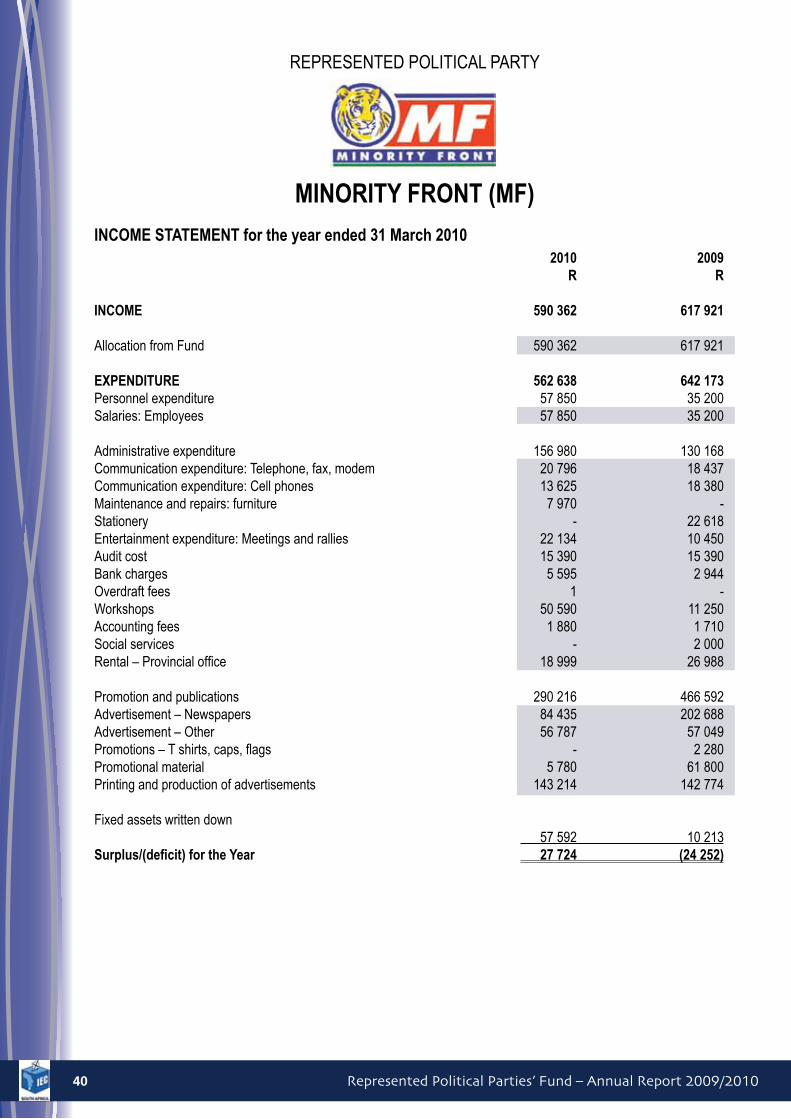
INCOME STATEMENT for the year ended 31 March 2010 2010 2009 R R INCOME 590 362 617 921 Allocation from Fund 590 362 617 921 EXPENDITURE 562 638 642 173Personnel expenditure 57 850 35 200Salaries: Employees 57 850 35 200
Administrative expenditure 156 980 130 168Communication expenditure: Telephone, fax, modem 20 796 18 437Communication expenditure: Cell phones 13 625 18 380Maintenance and repairs: furniture 7 970 -Stationery - 22 618Entertainment expenditure: Meetings and rallies 22 134 10 450Audit cost 15 390 15 390Bank charges 5 595 2 944Overdraft fees 1 -Workshops 50 590 11 250Accounting fees 1 880 1 710Social services - 2 000Rental–Provincialoffice 18999 26988
Promotion and publications 290 216 466 592Advertisement–Newspapers 84435 202688Advertisement – Other 56 787 57 049Promotions–Tshirts,caps,flags - 2280Promotional material 5 780 61 800Printing and production of advertisements 143 214 142 774
Fixedassetswrittendown 57 592 10 213Surplus/(deficit) for the Year 27 724 (24 252)

Represented Political Parties’ Fund – Annual Report 2009/2010 41
REPRESENTED POLITICAL PARTY
PAN AFRICANIST CONGRESS OF AZANIA (PAC)
AUDITED ANNUAL FINANCIAL STATEMENTS for the year ended 31 March 2010
Funding suspended during 2009/2010

Represented Political Parties’ Fund – Annual Report 2009/201042
REPRESENTED POLITICAL PARTY
UNITED CHRISTIAN DEMOCRATIC PARTY (UCDP)
STATEMENT OF FINANCIAL POSITION as at 31 March 2010 2010 2009 Note R R
ASSETS
Non-current assets 48 48 Equipment,furnitureandfittings 2 48 48 Current assets 2 986 575
Cash and cash equivalents 3 2 986 575 Total Assets 3 034 623 RESERVE AND LIABILITIES
Reserve 3 034 (2 233)Unutiliseddeficit 4 3034 (2233) Current liabilities - 2 856
Trade and other payables 5 - 2 856
Total Reserve and Liabilities 3 034 623 Certified by Accounting Officer: Mr. IR MahumaAudited by: Walker Daly IncorporatedAudit Opinion: Unqualified
STATEMENT OF CACHFLOWS for the year ended 31 March 2010 2010 2009 Note R RCASH FLOWS FROM OPERATING ACTIVITIESCashgeneratedbyoperations 8.1 2 411 (205)
NET CASH FLOW FROM OPERATING ACTIVITIES 2 411 (205) NET (DECREASE) / INCREASE IN CASH AND CASH EQUIVALENTS 2 411 (205)CASH AND CASH EQUIVALENTS AT BEGINNING OF YEAR 575 780CASH AND CASH EQUIVALENTS AT END OF YEAR 2 986 575

Represented Political Parties’ Fund – Annual Report 2009/2010 43
REPRESENTED POLITICAL PARTY
UNITED CHRISTIAN DEMOCRATIC PARTY (UCDP)
STATEMENT OF INCOME AND EXPENSES for the year ended 31 March 2010 2010 2009
R R
INCOME 581 271 744 194Allocation from fund 581 271 744 194 EXPENDITURE 576 004 744 086Personnel expenditure 380 078 388 332
- Salaries employees 351 516 349 654- Pay as you earn (PAYE) 22 313 30 122-Casualwages - 1260- Unemployment Insurance Fund (UIF) 6 249 7 296
Travel expenditure - 34 593
- Pool vehicles - 34 593
Administrative expenditure 195 926 254 816- Communication expenditure: Telephone, fax, modem 76 055 66 985- Courier services 9 130 5 010- Insurances - 15 440- Interest paid - 1- Maintenance and repairs: Equipment 547 12 271- Maintenance and repairs: Computer 2 485 14 949- Stationery 6 774 29 333- Entertainment expenditure 19 180 3 631- Audit and accounting fees 33 074 57 100- Bank charges 6 690 10 054- Cleaning - 2 168- Security services 4 017 3 947-Rentalofficeequipmentandconsumables 37974 32494- Water and lights, rates and taxes - 1 436
Party development - 66 346-Workshops,meetings&rallies - 66346
Surplus for the year 5 267 108
Represented Political Parties’ Fund – Annual Report 2009/201044
REPRESENTED POLITICAL PARTY
UNITED DEMOCRATIC MOVEMENT (UDM)
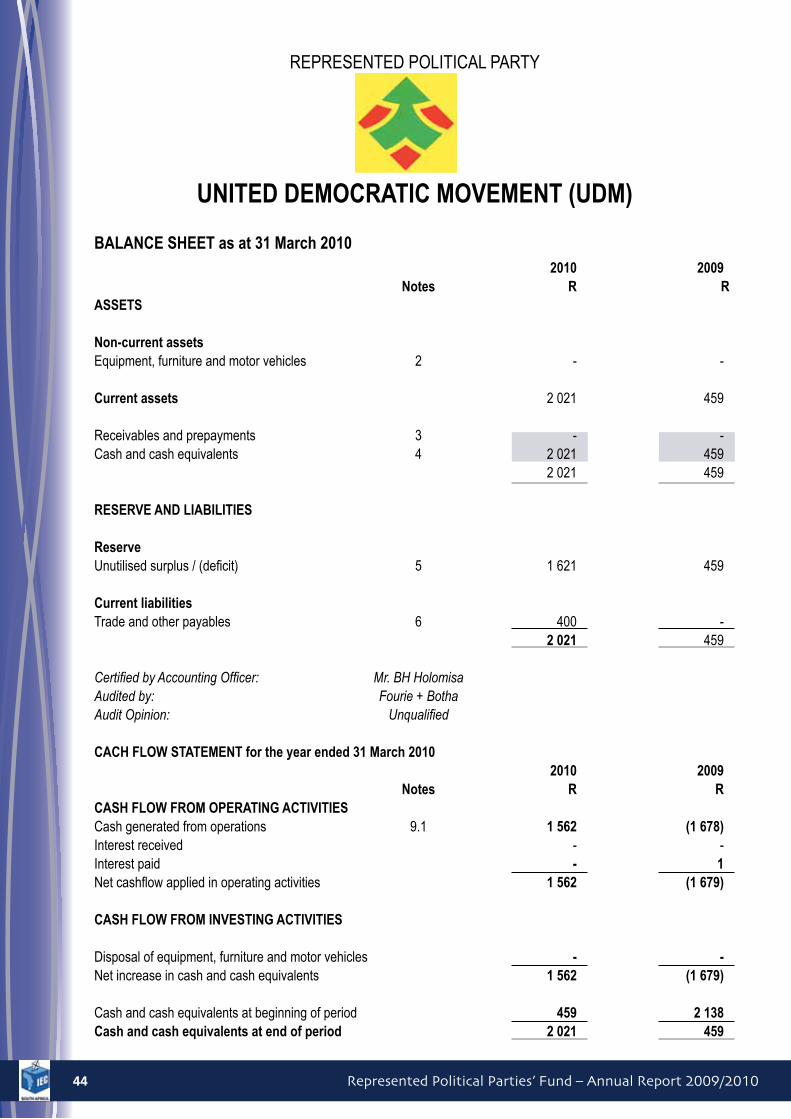
BALANCE SHEET as at 31 March 2010 2010 2009 Notes R RASSETS
Non-current assets Equipment, furniture and motor vehicles 2 - - Current assets 2 021 459
Receivables and prepayments 3 - -Cash and cash equivalents 4 2 021 459 2 021 459 RESERVE AND LIABILITIES
Reserve Unutilisedsurplus/(deficit) 5 1621 459 Current liabilities Trade and other payables 6 400 - 2 021 459 Certified by Accounting Officer: Mr. BH HolomisaAudited by: Fourie + BothaAudit Opinion: Unqualified CACH FLOW STATEMENT for the year ended 31 March 2010 2010 2009 Notes R RCASH FLOW FROM OPERATING ACTIVITIESCashgeneratedfromoperations 9.1 1 562 (1 678)Interest received - -Interest paid - 1Netcashflowappliedinoperatingactivities 1 562 (1 679) CASH FLOW FROM INVESTING ACTIVITIES Disposal of equipment, furniture and motor vehicles - -Net increase in cash and cash equivalents 1 562 (1 679)
Cash and cash equivalents at beginning of period 459 2 138Cash and cash equivalents at end of period 2 021 459
Represented Political Parties’ Fund – Annual Report 2009/2010 45
REPRESENTED POLITICAL PARTY
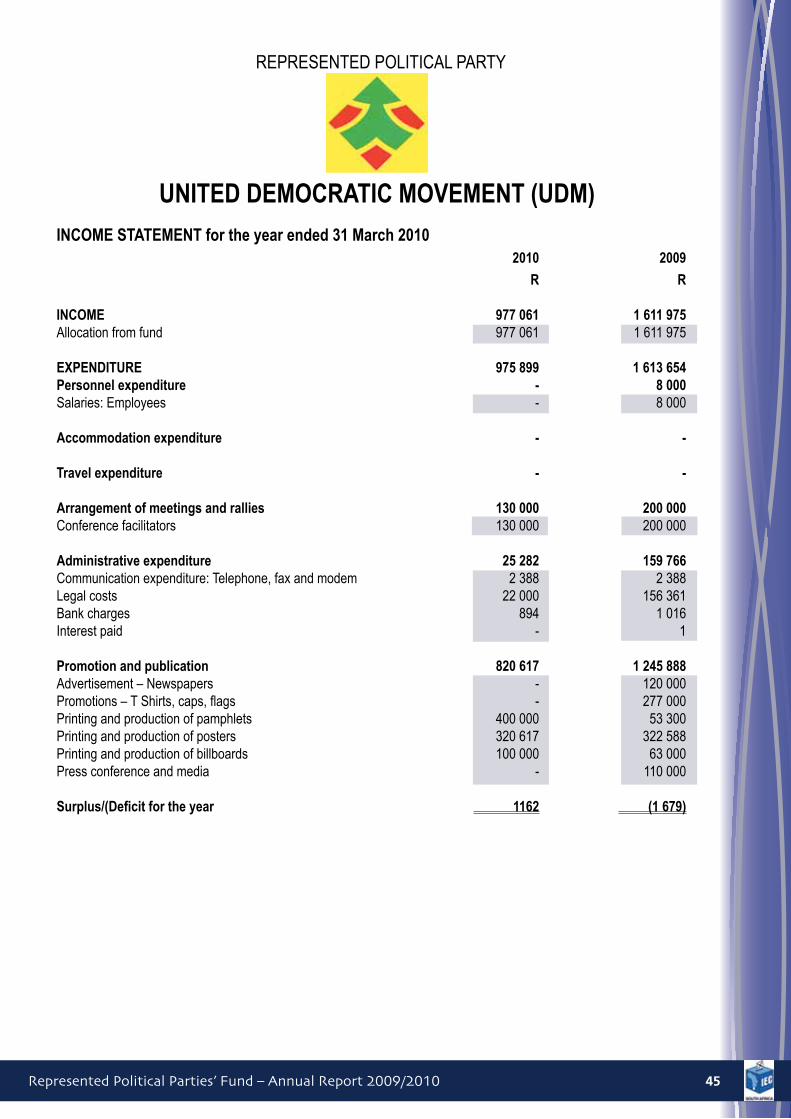
UNITED DEMOCRATIC MOVEMENT (UDM)
INCOME STATEMENT for the year ended 31 March 2010 2010 2009
R R
INCOME 977 061 1 611 975Allocation from fund 977 061 1 611 975
EXPENDITURE 975 899 1 613 654Personnel expenditure - 8 000Salaries: Employees - 8 000 Accommodation expenditure - -
Travel expenditure - -
Arrangement of meetings and rallies 130 000 200 000Conference facilitators 130 000 200 000
Administrative expenditure 25 282 159 766Communication expenditure: Telephone, fax and modem 2 388 2 388Legal costs 22 000 156 361Bank charges 894 1 016 Interest paid - 1
Promotion and publication 820 617 1 245 888Advertisement–Newspapers - 120000Promotions–TShirts,caps,flags - 277000Printing and production of pamphlets 400 000 53 300Printing and production of posters 320 617 322 588Printing and production of billboards 100 000 63 000Press conference and media - 110 000
Surplus/(Deficit for the year 1162 (1 679)

Report of the Audit Committee
Represented Political Parties’ Fund – Annual Report 2009/201048
RepoRt of the Audit Committee foR the finAnCiAl yeAR of the
RepResented politiCAl pARties’ fund estAblished in teRms of ACt 103 of 1997 foR the peRiod ended 31 mARCh 2010
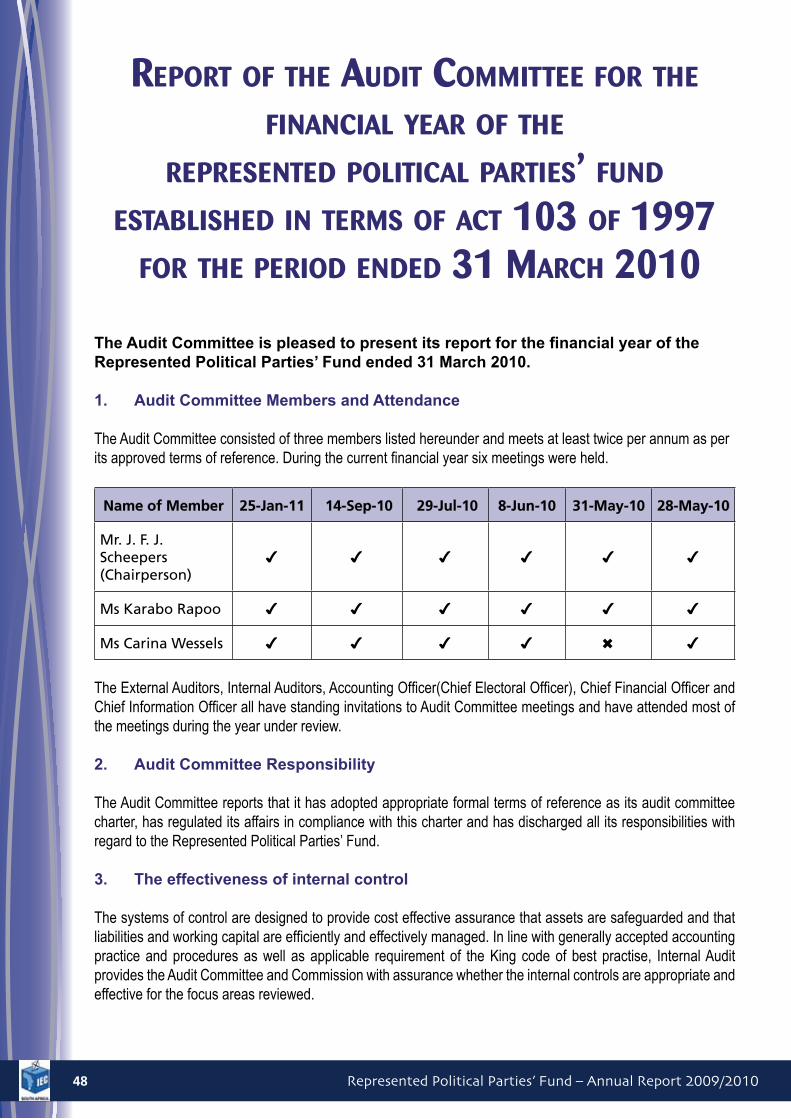
The Audit Committee is pleased to present its report for the financial year of the Represented Political Parties’ Fund ended 31 March 2010.
1. Audit Committee Members and Attendance
TheAuditCommitteeconsistedofthreememberslistedhereunderandmeetsatleasttwiceperannumasperitsapprovedtermsofreference.Duringthecurrentfinancialyearsixmeetingswereheld.
Name of Member 25-Jan-11 14-Sep-10 29-Jul-10 8-Jun-10 31-May-10 28-May-10
Mr. J. F. J. Scheepers (Chairperson)
Ms Karabo Rapoo
Ms Carina Wessels
TheExternalAuditors,InternalAuditors,AccountingOfficer(ChiefElectoralOfficer),ChiefFinancialOfficerandChiefInformationOfficerallhavestandinginvitationstoAuditCommitteemeetingsandhaveattendedmostofthemeetingsduringtheyearunderreview.
2. Audit Committee Responsibility
The Audit Committee reports that it has adopted appropriate formal terms of reference as its audit committee charter,hasregulateditsaffairsincompliancewiththischarterandhasdischargedallitsresponsibilitieswithregardtotheRepresentedPoliticalParties’Fund.
3. The effectiveness of internal control
The systems of control are designed to provide cost effective assurance that assets are safeguarded and that liabilitiesandworkingcapitalareefficientlyandeffectivelymanaged.Inlinewithgenerallyacceptedaccountingpracticeandproceduresaswell as applicable requirement of theKing codeof best practise, InternalAuditprovidestheAuditCommitteeandCommissionwithassurancewhethertheinternalcontrolsareappropriateandeffectiveforthefocusareasreviewed.
Represented Political Parties’ Fund – Annual Report 2009/2010 49
Thisisachievedbymeansoftheriskmanagementprocessesaswellastheimplementationofsuitablecorrectiveactionsflowingfromrecommendedenhancementstothecontrolenvironment.
Management has given assurance that measures are in place to prevent errors and more importantly that the finaldecisionregardingthelistingornotoftheFundunderthePFMAisvigorouslybeingpursuedwithNationalTreasury.
Accordingly,theAuditCommitteecanreportthattherewerenomaterialdeficienciesinthesystemsofinternalcontroloftheRepresentedPoliticalParties’Fundfortheperiodunderreview.
4. The quality of in-year management, monthly and quarterly reports
The Audit Committee is of the opinion that the policies and procedures for in-year monitoring as implemented bymanagementwereinthemainsufficienttoensurethattheaccountingandinformationsystemsandrelatedcontrolsareadequateandeffectivethroughouttheperiodunderreview.
5. Evaluation of Annual Financial Statements
The Audit Committee has• Reviewedanddiscussed theauditedannual financial statements with theAuditor-General and the
AccountingOfficer;• ReviewedtheAuditor-General’smanagementletterandtheresponseofmanagementthereto;
TheAuditCommitteeconcursandacceptstheAuditor-General’sconclusionsontheannualfinancialstatementsoftheRepresentedPoliticalParties’FundandisoftheopinionthattheauditedannualfinancialstatementsbeacceptedandreadtogetherwiththereportoftheAuditor-General.
………………………………………………J F J ScheepersChairperson of the Audit Committee
31 May 2011

Report of the Auditor General
Represented Political Parties’ Fund – Annual Report 2009/2010 51
AuditoR’s RepoRt of the
AuditoR-GeneRAl to pARliAment on the
RepResented politiCAl pARties’ fund
REPORT ON THE FINANCIAL STATEMENTS
Introduction
1. Ihave audited the accompanying financial statements of theRepresented Political Parties’ Fund (RPPF), whichcomprise the statement of financial position as at 31March 2010, and the statement of comprehensive income,statement of changes in funds and cash flow statement for the year then ended, and a summary of significantaccountingpoliciesandotherexplanatoryinformation,assetoutonpages55to70.
Accounting officer’s responsibility for the financial statements
2. The accounting officer is responsible for the preparation and fair presentation of these financial statements inaccordancewithSouthAfricanStandardsofGenerallyAcceptedAccountingPractice(SAStandardsofGAAP)andinthemannerrequiredbythePublicFundingofRepresentedPoliticalPartiesAct,1997(ActNo.103of1997)(PFRPPAct).Thisresponsibilityincludes:designing,implementingandmaintaininginternalcontrolrelevanttothepreparationandfairpresentationoffinancialstatementsthatarefreefrommaterialmisstatement,whetherduetofraudorerror;selectingandapplyingappropriateaccountingpolicies;andmakingaccountingestimatesthatarereasonableinthecircumstances.
Auditor-General’s responsibility
3. Asrequiredbysection188oftheConstitutionofSouthAfrica,1996(ActNo.108of1996)andsection4ofthePublicAuditActofSouthAfrica,2004(ActNo.25of2004)(PAA)andsection8(2)ofthePFRPPAct,myresponsibilityistoexpressanopiniononthesefinancialstatementsbasedonmyaudit.
4. IconductedmyauditinaccordancewithInternationalStandardsonAuditingandGeneral Notice 1570 of 2009 issued in Government Gazette 32758 of 27 November 2009.ThosestandardsrequirethatIcomplywithethicalrequirementsandplanandperformtheaudittoobtainreasonableassurancethatthefinancialstatementsarefreefrommaterialmisstatement.
5. Anauditinvolvesperformingprocedurestoobtainauditevidenceabouttheamountsanddisclosuresinthefinancialstatements.Theproceduresselecteddependontheauditor’sjudgement,includingtheassessmentoftherisksofmaterialmisstatementofthefinancialstatements,whetherduetofraudorerror.Inmakingthoseriskassessments,theauditor considers internal control relevant to the entity’s preparation and fair presentation ofthefinancialstatementsin order to design audit procedures that are appropriate in the circumstances, but not for the purpose of expressing anopinionontheeffectivenessoftheentity’sinternalcontrol.Anauditalsoincludesevaluatingtheappropriatenessof accounting policies used and the reasonableness of accounting estimatesmade bymanagement, as well asevaluatingtheoverallpresentationofthefinancialstatements.
6. IbelievethattheauditevidenceIhaveobtainedissufficientandappropriatetoprovideabasisformyauditopinion.
Represented Political Parties’ Fund – Annual Report 2009/201052
Opinion
7. Inmyopinionthefinancialstatementspresentfairly,inallmaterialrespects, thefinancialpositionoftheRPPFasat31March2010,anditsfinancialperformanceandcashflowsfortheyearthenendedareprepared,inallmaterialrespects, inaccordancewithSAStatementsofGAAPand in themannerrequiredbysection4(2)of thePFRPPAct.
Emphasis of matter
8. Idrawattentiontothematterbelow.Myopinionisnotmodifiedinrespectofthismatter.
Restatement of corresponding figures
9. Asdisclosedinnote15tothefinancialstatements,thecorrespondingfiguresfor31March2009havebeenrestatedasaresultofanerrordiscoveredduring2010inthefinancialstatementsoftheRPPFat,andfortheyearended,31March2009.
Additional matters
10. Idrawattentiontothematterbelow.Myopinionisnotmodifiedinrespectofthematter:
Unaudited supplementary schedules
11. The supplementary information set out on pages 71 to 73 does not form part of the financial statements and ispresentedasadditionalinformation.Ihavenotauditedtheseschedulesand,accordinglyIdonotexpressanopinionthereon.
REPORT ON OTHER LEGAL AND REGULATORY REQUIREMENTS
12. Asrequiredby thePAAand in termsofGeneral notice 1570 of 2009 issued in Government Gazette 32758 of 27 November 2009,Iincludebelowmyfindingsonthereportonpredeterminedobjectives,compliancewiththefollowingkeylawsandregulations,PublicFinanceManagementAct,1999(ActNo.1of1999)(PFMA)andPFRPPActandfinancialmanagement(internalcontrol).
Predetermined objectives
13. Iwasunable toconduct theauditofperformanceagainstpredeterminedobjectivesas theRPPF isnotcurrentlysubjecttothePFMAandisnotrequiredintermsofPFRPPActtoprepareandsubmitanannualperformancereport.
Compliance with laws and regulationsPFRPP Act
14. During theauditof thefinancialstatements for theyearended31March2010 the following instancesofnon-complianceby
politicalpartieswith thePublicFundingofRepresentedPoliticalParties’Act,1997 (ActNo.103of1997) (PFRPPAct)were
identified:
• Duringthereviewofthefinancialstatementssubmittedbypoliticalparties,twopoliticalpartiesdidnotsubmittheirauditedfinancialstatementsforthefinancialyearending31March2010timeouslyasrequiredbysection6(5)ofthePFRPPAct.
Represented Political Parties’ Fund – Annual Report 2009/2010 53
• During the review of the financial statements it was identified that two political parties expenditure was notdisclosedinaccordancewithsection8(1)ofthePFRPPAct.
• Duringthereviewofthesubmittedfinancialstatementsitwasidentifiedthatonepoliticalpartyhadanemphasisofmatterparagraphregardingnon-compliancewithsection6(1)ofthePFRPPAct,astheydidnotkeepaseparatebankaccountformoneyallocatedfromRPPF.
15. Theabovementionedinstancesofnon-complianceresultedfrompoliticalpartiesnotadheringtothePFRPPAct.
PFMA and Treasury Regulations of 2005
16. Section47(2)ofthePFMArequirestheaccountingauthorityofanunlistedpublicentitytonotifytheNationalTreasurywithoutdelay,inwriting,thattheentityisnotlisted.GeneralNotice1570Auditor-GeneralDirectiveofthe2009,issuedinGovernmentGazetteNo.32758of27November2009alsoemphasised, inparagraph30, thatunlistedentitiesshouldinformNationalTreasurythattheentityisnotlistedinthePFMA.TheRPPFnotifiedtheNationalTreasuryon14October2004andon10September2010,respectively,thatitwasnotlistedinthePFMA.TheNationalTreasuryisintheprocessofrulingonwhethertheRPPFshouldbelistedasapublicentityaswellastheapplicabilityofthePFMA.
INTERNAL CONTROL
17. IconsideredinternalcontrolrelevanttomyauditofthefinancialstatementsandthereportonpredeterminedobjectivesaswellascompliancewithkeylawsandregulationsandPFRPPAct,butnotforthepurposesofexpressinganopinionontheeffectivenessofinternalcontrol.Nosignificantinternalcontroldeficiencieswereidentifiedduringtheaudit.
PRETORIA
21June2011

REPRESENTED POLITICAL PARTIES’ FUND
ANNUAL FINANCIAL STATEMENTSfor the year ended
31 March 2010

Represented Political Parties’ Fund – Annual Report 2009/201056
STATEMENT OF FINANCIAL POSITION as at 31 March 2010
2010 2009
Notes Restated
R R
ASSETS
Current assets
Trade and other receivables 2 1,592,632 1,689,342
Cash and cash equivalents 3 2,285,108 2,076,761
3,877,740 3,766,103
Total assets 3,877,740 3,766,103
FUNDS AND LIABILITIES
FUNDS
Unutilised funds 4 2,122,345 2,850,869
Current liabilities
Trade and other payables 5 629,637 577,805
Provisions 6 1,125,758 337,429
1,755,395 915,234
Total funds and libilities 3,877,740 3,766,103
FDP Tlakula ACCOUNTING OFFICER
DATE
REPRESENTED POLITICAL PARTIES’ FUNDANNUAL FINANCIAL STATEMENTS for the year ended 31 March 2010

Represented Political Parties’ Fund – Annual Report 2009/2010 57
STATEMENT OF COMPREHENSIVE INCOME for the year ended 31 March 2010
Notes 2010 2009
R R
Government Grants 8.1 92,823,000 88,187,000
Allocation to parties 8.3 (92,814,171) (88,287,677)
Unused funds recievable from parties 9.2 337,429 1,976,360
Funds retained for other purposes 346,258 1,875,683
Administration expenses (313,092) (294,407)
Personnel cost (314,986) (263,541)
Bad Debts (1,125,758) -
Operating(deficit)/surplus 8 (1,407,578) 1,317,735
Finance income 9.1 679,054 770,686
Other income 9.2 - -
Net (Deficit)/surplus for the year (728,524) 2,088,421
Other comprehensive income for the year - -
Total comprehensive income (728,524) 2,088,421
Profit / (loss) attributable to owners (728,524) 2,088,421
Total comprehensive income attributable to owners (728,524) 2,088,421
REPRESENTED POLITICAL PARTIES’ FUNDANNUAL FINANCIAL STATEMENTS for the year ended 31 March 2010

Represented Political Parties’ Fund – Annual Report 2009/201058
STATEMENT OF CHANGES IN FUNDS for the year ended 31 March 2010
Unutilised
Funds
R
Balance at 31 March 2008 762,448
Surplus for the year 3,113,848
Balance at 31 March 2009 3,876,296
Changes in net assets 15 (1,025,427)
Restated balance at 31 March 2009 2,850,869
Surplus for the year (728,524)
Balance at 31 March 2010 2,122,345
REPRESENTED POLITICAL PARTIES’ FUNDANNUAL FINANCIAL STATEMENTS for the year ended 31 March 2010

Represented Political Parties’ Fund – Annual Report 2009/2010 59
CASH FLOW STATEMENT for the year ended 31 March 2010
Note 2010 2009
R R
CASH FLOW FROM OPERATING
ACTIVITIES
Cash(utilisedby)/generatedfromoperations 10 (470,707) (1,167,647)
Interest received 679,054 770,686
Netcashinflowfromoperatingactivities 208,347 (396,961)
Net increase in cash and cash
equivalents 208,347 (396,961)
Cash and cash equivalents at
beginning of period 2,076,761 2,473,722
CASH AND CASH EQUIVALENTS AT END OF YEAR 2,285,108 2,076,761
REPRESENTED POLITICAL PARTIES’ FUNDANNUAL FINANCIAL STATEMENTS for the year ended 31 March 2010
Represented Political Parties’ Fund – Annual Report 2009/201060
1. Notes to the financial statements
1.1 Reportingentity
The Represented Political Parties’ Fund (the “Fund”) provides funding for political parties participating in Parliamentandprovinciallegislatures.
1.2 Basisofpreparation
1.2.1 Statementofcompliance
Theannualfinancialstatementshavebeenpreparedonthehistoricalcostbasisandconform,inallmaterial respects, to Generally Accepted Accounting Practice (SA GAAP) and the requirements of the PublicFundingofRepresentedPoliticalPartiesAct,1997(ActNo.103of1997)andPublicFundingofRepresentedPoliticalPartiesRegulations,1998.
ThefinancialstatementswereauthorisedforissuebytheAccountingOfficeron20/06/2011.
1.2.2 Basisofmeasurement
Thefinancialstatementshavebeenpreparedonthehistoricalcostbasis.
1.2.3 Functionalandpresentationcurrency
ThesefinancialstatementsarepresentedinRands,whichistheFund’sfunctionalcurrency.AllfinancialinformationpresentedinRandshasbeenroundedtothenearestR1.
1.2.4 Useofestimatesandjudgements
ThepreparationofthefinancialstatementsinconformitywithSAGAAPrequiresmanagementtomakejudgements,estimatesandassumptionsthataffecttheapplicationofaccountingpoliciesandthereportedamountsofassets,liabilities,incomeandexpenses.Actualresultsmaydifferfromtheseestimates.
Estimatesandunderlyingassumptionsarereviewedonanongoingbasis.Revisionstoaccountingestimatesarerecognisedintheperiodinwhichtheestimatesarerevisedandinanyfutureperiodsaffected.
Informationaboutassumptionsandestimationuncertaintiesthathaveasignificantriskofresultinginamaterialadjustmentwithinthenextfinancialyearareincludedinthefollowingnotes:
–Notes2–Allowanceforimpairmentlosses;and
–Notes6–Provisions.
1.3 Significantaccountingpolicies
Theprincipalaccountingpoliciesadoptedandappliedduringthisyearofoperation,aresetoutbelow.
REPRESENTED POLITICAL PARTIES’ FUNDNOTES TO THE ANNUAL FINANCIAL STATEMENTS for the year ended 31 March 2010

Represented Political Parties’ Fund – Annual Report 2009/2010 61
1.3.1 Governmentgrants
Government appropriations for the funding of political parties participating in Parliament and Provincial Legislatures and for the compensation of operating expenditure and capital, are recognised initially asdeferredincomewhenthereisreasonableassurancethattheywillbereceived.GrantsthatcompensatetheFundforexpensesincurredarerecognisedinprofitorlossonasystematicbasisinthesameperiodsinwhichtheexpensesarerecognised.Governmentgrantsrelatedtoassets,including non-monetary grants at fair value, are presented in the balance sheet by deducting the grant inarrivingatthecarryingamountoftheassets.
Governmentassistanceasactionbygovernmentdesignedtoprovideaneconomicbenefitspecifictoanentityorrangeofentitiesqualifyingundercertaincriteria.
Government assistance is not recognised in the Annual Financial Statements, but the nature, extent anddurationoftheassistanceprovidedisdisclosedinnote13.
1.3.2Financeincome
Financeincomecomprisesinterestincomeonfundsinvested.Interestincomeisrecognisedasitaccruesinprofitorloss,usingtheeffectiveinterestmethod.
1.3.3Financialinstruments
Recognition
FinancialassetsandfinancialliabilitiesarerecognisedonthebalancesheetwhentheFundbecomesapartytothecontractualprovisionsoftheinstrument.
All“regularway”purchasesandsalesoffinancialassetsareinitiallyrecognisedusingtradedateaccounting.
Measurement
Financialinstrumentsareinitiallymeasuredatfairvalue,whichincludestransactioncosts.Subsequenttoinitialrecognitiontheseinstrumentsaremeasuredassetoutbelow.
Financial assets
TheFund’sprincipalfinancialassetsaretradereceivablesandcashandcashequivalents.Thesefinancialassetsareclassifiedasloansandreceivables.
Trade and other receivables
Trade and other receivables are recognised initially at fair value and subsequently measured at amortisedcostusingtheeffectiveinterestratemethod,lessallowanceforimpairment.ImpairmentoftradeandotherreceivablesisestablishedwhenthereisobjectiveevidencethattheFundwillnotbeabletocollectallamountsdueaccordingtotheoriginaltermsofreceivables.
Significantfinancialdifficultiesofthedebtor,defaultordelinquencyinpaymentsareconsidered
indicatorsthatthetradeandotherreceivablesareimpaired.Theamountoftheprovisionisthedifferencebetweentheasset’scarryingamountandthepresentvalueofestimatedfuturecashflows,discountedattheeffectiveinterestrate.
REPRESENTED POLITICAL PARTIES’ FUNDNOTES TO THE ANNUAL FINANCIAL STATEMENTS for the year ended 31 March 2010

Represented Political Parties’ Fund – Annual Report 2009/201062
Cash and cash equivalents
Cashandcashequivalentscomprisecashbalancesandcalldepositswithoriginalmaturitiesof threemonthsorless.
Financial liabilities TheFund’sprincipalfinancialliabilitiesaretradeandotherpayables.
Allfinancialliabilitiesareinitiallyrecognisedatfairvaluewhichissubsequentlymeasuredatamortisedcostusingtheeffectiveinterestratemethod.
De-recognition
Financial assets Financialassetsarede-recognisedwhenthecontractedrighttothecashflowfromtheassetexpires,
orwhensubstantiallyalltherisksandrewardsofownershipofthefinancialassetsaretransferredtoanotherpartywithoutretainingcontrolorsubstantiallyallrisksandrewardsoftheassets.
Financial liabilities
Financialliabilitiesarede-recognisedwhentheobligationinthecontractisdischarged,cancelledorexpires.
1.4Provisions
ProvisionsarerecognisedwhentheFundhasapresentlegalorconstructiveobligationasaresultofpastevents,whenitisprobablethatanoutflowofresourcesembodyingeconomicbenefitswillberequiredtosettletheobligation,andwhenareliableestimateoftheamountoftheobligationcanbemade.
1.5Cashflow
ForthepurposesoftheCashFlowStatement,cashincludescashonhandanddepositsheldoncallwithbanks.
1.6Comparativefigures
Wherenecessarycomparativefigureshavebeenadjustedtoconformtochangesinpresentationinthecurrentyear.
REPRESENTED POLITICAL PARTIES’ FUNDNOTES TO THE ANNUAL FINANCIAL STATEMENTS for the year ended 31 March 2010

Represented Political Parties’ Fund – Annual Report 2009/2010 63
2010 2009
R R
Restated
2. Trade and other receivables
Trade accounts receivable 1,592,632 1,689,342
Party Allocation Repayable - NADECO 228,348 228,348
Party Allocation Repayable - PAC 466,874 466,874
Party Allocation Repayable - PIM 45,470 45,470
Party Allocation Repayable - ACDP - 70,973
Party Allocation Repayable - AFD - 2,605
Party Allocation Repayable - APC - 22,673
Party Allocation Repayable - FD 2,003 2,003
Party Allocation Repayable - NA 95,786 95,786
Party Allocation Repayable - NVP - -
Party Allocation Repayable - UDM - 459
Party Allocation Repayable - UIF 754,151 754,151
Less:Allowanceforimpairment (1,125,758) -
466,874 1,689,342
Theallowanceforimpairmenthasbeendeterminedbyreferencetopastdefaultexperienceandthecurrenteconomicenvironment.Theexecutiveconsidersthatthecarryingamountoftradeandotherreceivablesapproximatesthefairvalueduetotheirshort-termmaturity.
3. Cash and cash equivalents
Bank balances – Call deposits 2,285,108 2,076,761
2,285,108 2,076,761
Cashandcashequivalentscomprisecashandshort-term,highlyliquidinvestmentsthatareheldwitharegisteredbankinstitutionwithmaturitiesofthreemonthsorlessandthataresubjecttoinsignificantinterestraterisk.Thecarryingamountoftheseassetsapproximatesthefairvalue.
4. Unutilised funds
Opening unutilised funds 2,850,869 762,448
(Deficit)/surplusfortheyear (728,524) 2,088,421
Unutilised funds at 31 March 2010 2,122,345 2,850,869
5. Trade and other payables
Trade accounts payable 629,637 577,805
The executive considers that the carrying amount of trade and other payables approximates to their fair value due to theirshort-termmaturity.
REPRESENTED POLITICAL PARTIES’ FUNDNOTES TO THE ANNUAL FINANCIAL STATEMENTS for the year ended 31 March 2010
Represented Political Parties’ Fund – Annual Report 2009/201064
2010 2009
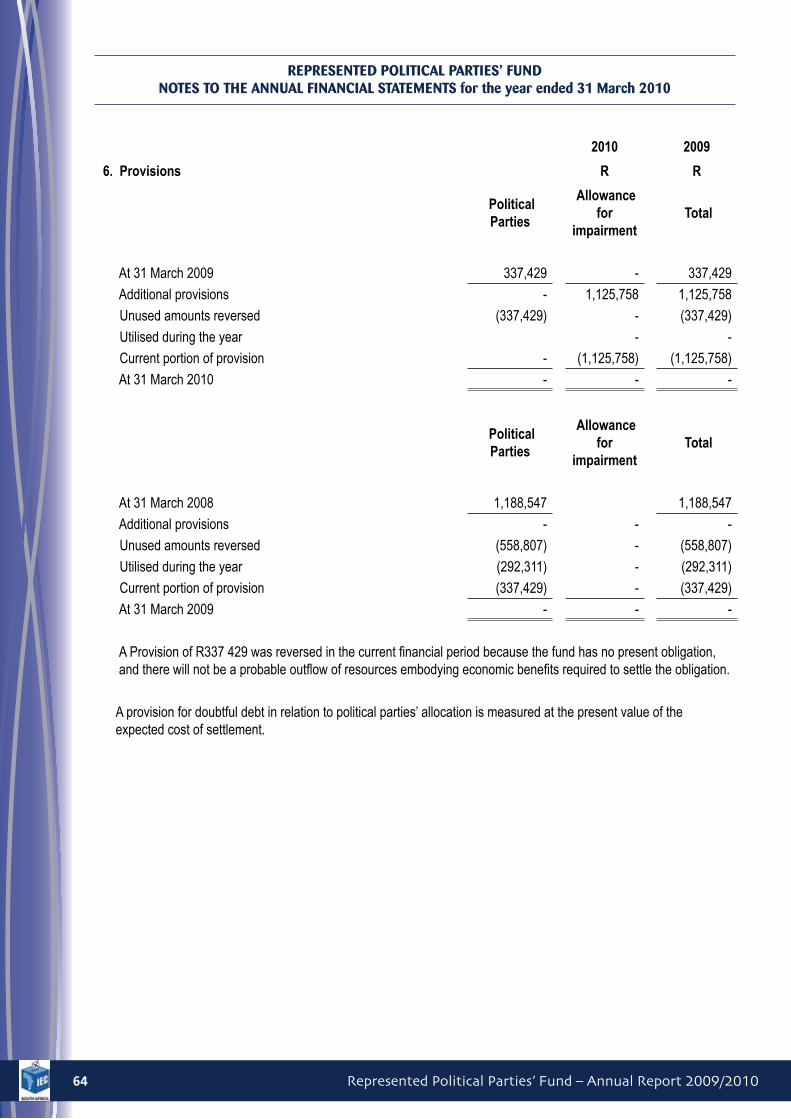
6. Provisions R R
Political Parties
Allowance for
impairment Total
At 31 March 2009 337,429 - 337,429
Additional provisions - 1,125,758 1,125,758
Unused amounts reversed (337,429) - (337,429)
Utilised during the year - -
Current portion of provision - (1,125,758) (1,125,758)
At 31 March 2010 - - -
Political Parties
Allowance for
impairment Total
At 31 March 2008 1,188,547 1,188,547
Additional provisions - - -
Unused amounts reversed (558,807) - (558,807)
Utilised during the year (292,311) - (292,311)
Current portion of provision (337,429) - (337,429)
At 31 March 2009 - - -
AProvisionofR337429wasreversedinthecurrentfinancialperiodbecausethefundhasnopresentobligation,andtherewillnotbeaprobableoutflowofresourcesembodyingeconomicbenefitsrequiredtosettletheobligation.
A provision for doubtful debt in relation to political parties’ allocation is measured at the present value of the expectedcostofsettlement.
REPRESENTED POLITICAL PARTIES’ FUNDNOTES TO THE ANNUAL FINANCIAL STATEMENTS for the year ended 31 March 2010
Represented Political Parties’ Fund – Annual Report 2009/2010 65
7.
EXPE
ND
ITU
RE
PER
PO
LITI
CA
L PA
RTY
for t
he y
ear e
nded
31
Mar
ch 2
010
Afr
ican
C
hris
tian
Dem
ocra
tic
Part
y (A
CD
P)
Afr
ican
In
depe
nden
t C
ongr
ess
(AIC
)
Afr
ican
N
atio
nal
Con
gres
s (A
NC
)
Afr
ican
Pe
ople
’s
Con
vent
ion
(APC
)
Aza
nian
Pe
ople
’s
Org
anis
atio
n (A
ZAPO
)
Con
gres
s of
th
e Pe
ople
(C
OPE
)
Dem
ocra
tic
Alli
ance
(D
A)
Free
dom
Fr
ont P
lus
(FF)
Inde
pend
ent
Dem
ocra
ts
(ID)
Inka
tha
Free
dom
Pa
rty
(IFP)
Min
ority
Fr
ont (
MF)
Pan
Afr
ican
ist
Con
gres
s (P
AC
)
Uni
ted
Chr
istia
n D
emoc
ratic
Pa
rty
(UC
DP)
Uni
ted
Dem
ocra
tic
Mov
emen
t (U
DM
)
Tot
al
R
R
R
R
R
R
R
R
R
R
R
R
R
R
R
Allo
catio
ns fo
r the
yea
r 1
299
465
3
73 0
13
58
056
247
100
751
1
00 7
51
8 6
88 1
97
15
337
772
991
909
1
475
671
4
241
242
5
90 3
62
100
751
5
81 2
71
977
520
9
2 91
4 92
2
Unspentamounti.r.o.2008/2009
( 70
973
) (
459
) (
71 4
32)
Amountunaccountedfori.r.o.
2008/2009
( 22
673
)
Tot
al p
aid
1 2
28 4
92
373
013
5
8 05
6 24
7 7
8 07
8 1
00 7
51
8 6
88 1
97
15
337
772
991
909
1
475
671
4
241
242
5
90 3
62
-
581
271
9
77 0
61
92
820
817
Les
s: T
otal
Exp
endi
ture
(1
239
051
) (
359
424)
(58
276
367)
( 76
773
) (
100
453)
(7 7
99 0
48)
(15
412
221)
( 83
3 64
1) (2
364
207
) (4
212
898
) (
562
638)
- (
576
004)
( 97
5 89
9) (9
2 78
8 62
4)
P
erso
nnel
exp
endi
ture
3
97 9
66
5 0
35
41
676
647
1 0
00
23
578
1 3
23 8
89
10
379
608
280
513
6
74 2
88
1 6
64 2
11
57
850
380
078
-
56
864
663
A
ccom
mod
atio
n ex
pend
iture
1
,693
1
707
219
773
- 3
01 4
11
- 1
5 36
8 -
- -
- 2
026
464
T
rave
l exp
endi
ture
8
2,72
0 4
200
2
439
821
-
- 8
64 2
00
753
806
4
4 87
3 -
588
221
-
- -
4 7
77 8
41
A
rrang
emen
ts o
f mee
tings
and
ra
llies
80
205
39
135
1 9
17 2
29
- -
3 3
68 7
75
7 7
63
97
399
- 2
09 7
20
- -
130
,000
5
850
226
A
dmin
istra
tive
expe
nditu
re
399
291
2
36 3
83
9 6
37 3
49
- 7
6 87
5 6
61 5
46
4 2
71 0
44
321
350
3
49 5
74
1 5
17 2
10
156
980
1
95 9
26
25
282
17
848
810
P
rom
otio
n an
d pu
blic
atio
ns
277
,176
7
4 67
1 6
30 3
35
75
000
1 2
24 6
42
- 7
4 13
8 1
340
345
2
01 0
57
290
216
-
820
617
5
008
197
F
ixed
ass
et e
xpen
ditu
re
- -
267
767
-
- 5
4 58
5 -
- -
32
479
57
592
- 4
12 4
23
Uns
pent
mon
ey a
t the
end
of y
ear
( 10
559
) 1
3 58
9 (
220
120)
1 3
05
29
8 8
89 1
49
( 74
449
) 1
58 2
68
( 88
8 53
6) 2
8 34
4 2
7 72
4 1
00 7
51
5 2
67
1 1
62
32
193
Plu
s: In
tere
st a
nd o
ther
inco
me
rece
ived
7
990
-
13
858
- -
25
130
77
160
2 7
00
4 2
95
2 4
30
- -
- -
133
563
Sur
plus
/ (d
efici
t) fo
r the
yea
r (
2 56
9) 1
3 58
9 (
206
262)
1 3
05
29
8 9
14 2
79
2 7
11
160
968
(
884
241)
30
774
27
724
100
751
5
267
1
162
1
65 7
56
Not
es:
–Tw
opoliticalpartyfailedtosubmitauditreportandauditedannualfinancialstatementsfortheyearending31March2010withinthestatutorydeadline(onorbefore30June2010)asprescribedinsection9(3)ofthePublicFundingof
RepresentedPoliticalPartiesAct103,1997.TheyareAP
CandAIC
–Twopoliticalpartiesfinancialstatementsdidnotcom
plywiththedisclosurerequirementsassetoutinsection6(3)ofthePublicFundingofR
epresentedPoliticalPartiesAct103,1997,readwithsection8(1)ofthePu
blicFundingof
RepresentedPoliticalPartiesRegulations,1998,thatrequirethefinancialstatementstobepreparedshowingtheam
ountsspentforpurposesclassifiableunderspecificdescriptivecategories.
Theyareasfollows:IFPandMF.
–O
nepoliticalpartywasnotfundedduringthe2009/2010duetofailuretosubmittheauditedfinancialstatementsinrespectof2007/2008and2008/2009.ThepartyisPAC
–O
nepoliticalpartyfailedtoopenseparateBankAccount.ThepartyisCOPE
REPR
ESEN
TED
PO
LITI
CAL
PART
IES’
FU
ND
– N
OTE
S TO
TH
E A
NN
UAL
FIN
AN
CIA
L ST
ATEM
ENTS
for
the
year
end
ed 3
1 M
arch
201
0 –
PART
A

Represented Political Parties’ Fund – Annual Report 2009/201066
EXPE
ND
ITU
RE
PER
PO
LITI
CA
L PA
RTY
for t
he y
ear e
nded
31
Mar
ch 2
009
Afr
ican
C
hris
tian
Dem
ocra
tic
Part
y (A
CD
P)
Alli
ance
of
Fre
e D
emoc
rats
(A
FD)
Afr
ican
N
atio
nal
Con
gres
s (A
NC
)
Afr
ican
Pe
ople
’s
Con
vent
ion
(APC
)
Aza
nian
Pe
ople
’s
Org
anis
atio
n (A
ZAPO
)*
Chr
istia
n Pa
rty
(CP)
Dem
ocra
tic
Alli
ance
(D
A)
Fede
ratio
n of
D
emoc
rats
(F
D)
Free
dom
Fr
ont P
lus
(FF)
Inde
pend
ent
Dem
ocra
ts
(ID)
Inka
tha
Free
dom
Pa
rty
(IFP)
Min
ority
Fr
ont
(MF)
Nat
iona
l A
llian
ce
(NA
)
Nat
iona
l D
emoc
ratic
C
onve
ntio
n (N
AD
ECO
)
New
Vi
sion
Pa
rty
(NVP
)*
Pan
Afr
ican
ist
Con
gres
s (P
AC
)
Uni
ted
Chr
istia
n D
emoc
ratic
Pa
rty
(UC
DP)
Uni
ted
Dem
ocra
tic
Mov
emen
t (U
DM
)
Uni
ted
Inde
pend
ent
Fron
t (U
IF)
Tot
al
R
R
R
R
R
R
R
R
R
R
R
R
R
R
R
R
R
R
R
R
Allo
catio
ns fo
r th
e ye
ar
2 1
77 4
25
283
242
6
1 11
3 51
1 8
94 1
53
95
786
301
217
1
0 53
8 73
7 9
5 78
6 1
496
340
1
249
562
5
403
084
6
17 9
21
95
786
905
278
1
53 9
47
95
786
744
194
1
611
975
4
61 8
40
88
335
570
Amountpaidi.r.o.
2007/2008
292
311
2
92 3
11
Am
ount
ove
rpai
d during2008/2009
226
319
2
26 3
19
Am
ount
set
off
i.r.o.2007/2008
debt
(
47 8
93)
( 47
893
)
Tot
al p
aid
2 1
77 4
25
283
242
6
1 11
3 51
1 8
94 1
53
95
786
301
217
1
0 53
8 73
7 9
5 78
6 1
496
340
1
249
562
5
403
084
6
17 9
21
95
786
1 1
31 5
97
153
947
4
7 89
3 7
44 1
94
1 6
11 9
75
754
151
8
8 80
6 30
7
Les
s: T
otal
Ex
pend
iture
(2
373
528
) (
290
724)
(60
823
713)
- (
108
055)
( 68
9 87
9) (1
0 78
1 37
6) (
176
447)
(1 7
30
423)
(1 6
39 3
52)
(5 4
37 6
75)
( 64
2 17
3) -
(1 1
27 5
80)
- -
( 74
4 08
7) (1
613
654
) (1
100
953
) (8
9 27
9 61
9)
P
erso
nnel
ex
pend
iture
5
79 4
71
75
055
33
103
568
50
906
199
,309
5
835
147
-
560
632
1
058
331
9
60 6
72
35
200
182
400
3
88 3
32
8 0
00
285
660
4
3 32
2 68
3
A
ccom
mod
atio
n ex
pend
iture
1
,050
590
2 2
19 5
89
- 9
480
-
9 4
59
7 9
80
- -
- -
- -
2 2
48 1
48
T
rave
l ex
pend
iture
3
15,8
56
43
779
3 8
81 2
51
1 3
00
- 7
39 8
67
36
575
147
761
-
821
497
-
14
450
34
593
- 4
05 4
28
6 4
42 3
57
A
rrang
emen
ts
of m
eetin
gs
and
rallie
s 2
49 4
52
68
175
5 3
76 9
59
- -
10
251
10
715
56
249
2 5
95
714
132
-
390
949
6
6 34
6 2
00 0
00
- 7
145
823
A
dmin
istra
tive
expe
nditu
re
577
452
9
9 10
3 9
575
398
5
5 84
9 5
0 89
4 4
196
111
7
455
4
88 7
24
131
389
2
131
885
1
30 1
68
283
194
2
54 8
16
159
766
3
95 1
82
18
537
386
P
rom
otio
n an
d pu
blic
atio
ns
650
,247
4
022
6
388
117
-
408
746
-
112
243
4
48 0
57
447
037
3
45 9
97
466
592
2
56 5
87
- 1
245
888
-
10
773
533
F
ixed
ass
et
expe
nditu
re
- -
278
831
-
21
450
- -
21
020
- 4
63 4
92
10
213
- -
14
683
809
689
Uns
pent
mon
ey
at th
e en
d of
ye
ar
( 19
6 10
3) (
7 48
2) 2
89 7
98
894
153
(
12 2
69)
( 38
8 66
2) (
242
639)
( 80
661
) (
234
083)
( 38
9 79
0) (
34 5
91)
( 24
252
) 9
5 78
6 4
017
1
53 9
47
47
893
10
7 (
1 67
9) (
346
802)
( 47
3 31
2)
Plu
s: In
tere
st
and
othe
r inc
ome
rece
ived
2
9 73
4 -
47
293
- -
37
019
51
175
1 2
46
10
292
5 4
72
16
397
- -
- -
- -
- 7
860
2
06 4
88
Surplus/(deficit)
for t
he y
ear
( 16
6 36
9) (
7 48
2) 3
37 0
91
894
153
(
12 2
69)
( 35
1 64
3) (
191
464)
( 79
415
) (
223
791)
( 38
4 31
8) (
18 1
94)
( 24
252
) 9
5 78
6 4
017
1
53 9
47
47
893
10
7 (
1 67
9) (
338
942)
( 26
6 82
4)
Not
es:
–Fourpoliticalpartiesfailedtosubmittheauditedfinancialstatementsfortheperiodunderreview,asprescribedbysection9(3)ofthePublicFundingofR
epresentedPoliticalPartiesAct103,1997.Theyareasfollows:APC
,NA,PAC
andNVP
.
–Onepoliticalpartydidnotcom
plywithsection7(1)ofthePublicFundingofR
epresentedPoliticalPartiesAct103of1997andthereforereceivedadisclaimerauditopinionfromtheindependentauditors.ThepartyisUIF.
–Sixpoliticalpartiesfailedtosubmitauditreportsandauditedannualfinancialstatementsfortheyearending31March2009withinthestatutorydeadline(onorbefore14April2009)asprescribedinsection9(3)ofthePublicFundingof
RepresentedPoliticalPartiesAct103,1997.Theyareasfollows:AZA
PO,FD,ID,M
F,NAD
ECO,U
DM.
–Twopoliticalpartiesfinancialstatementsdidnotcom
plywiththedisclosurerequirementsassetoutinsection6(3)ofthePublicFundingofR
epresentedPoliticalPartiesAct103,1997,readwithsection8(1)ofthePu
blicFundingof
RepresentedPoliticalPartiesRegulations,1998,thatrequirethefinancialstatementstobepreparedshowingtheam
ountsspentforpurposesclassifiableunderspecificdescriptivecategories.
Theyareasfollows:AZA
POandNAD
ECO.N
ADEC
Ohascorrectedtheirfinancialstatements.*-A
ZAPO
hasnotasyetrectifiedthisomission.
–Fivepoliticalpartiesdidnotreturnunspentm
oneyasrequiredbysection9(3)ofthePublicFundingofR
epresentedPoliticalPartiesAct103of1997.Theyareasfollows:ACDP,AFD
,FD,N
ADEC
O,U
DM.
REPR
ESEN
TED
PO
LITI
CAL
PART
IES’
FU
ND
– N
OTE
S TO
TH
E A
NN
UAL
FIN
AN
CIA
L ST
ATEM
ENTS
for
the
year
end
ed 3
1 M
arch
201
0 –
PART
B
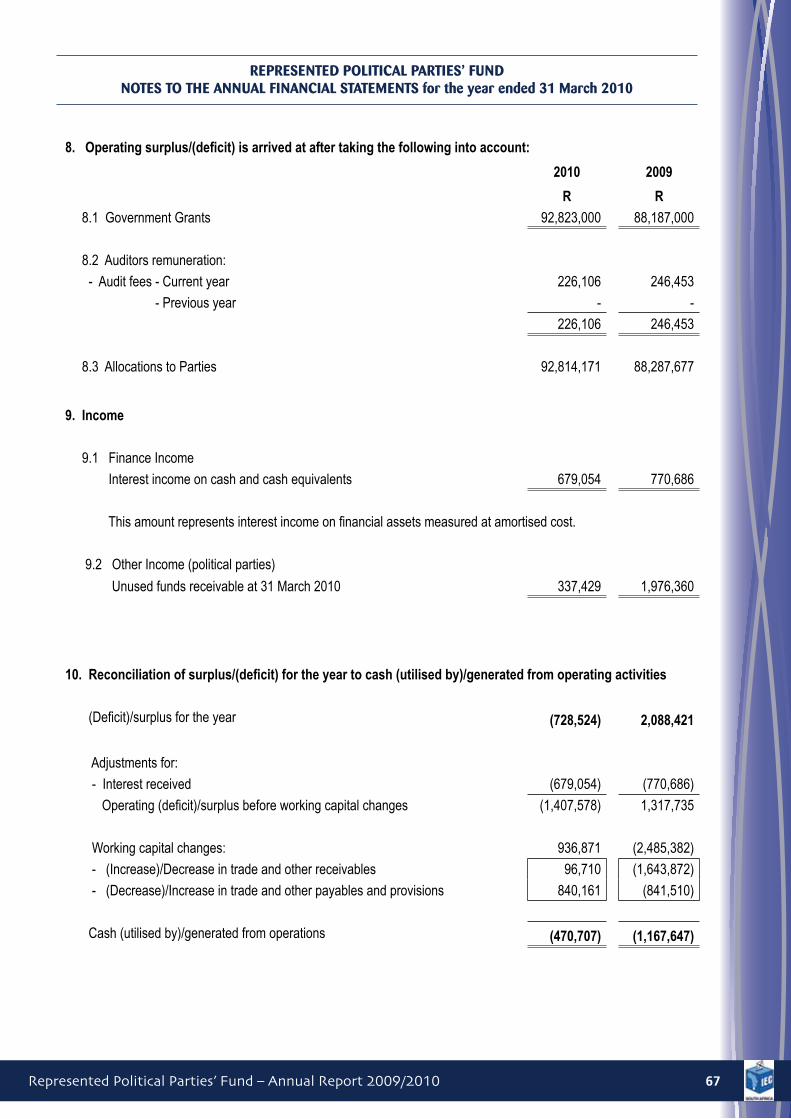
Represented Political Parties’ Fund – Annual Report 2009/2010 67
8. Operating surplus/(deficit) is arrived at after taking the following into account:
2010 2009
R R
8.1GovernmentGrants 92,823,000 88,187,000
8.2Auditorsremuneration:
- Audit fees - Current year 226,106 246,453
- Previous year - -
226,106 246,453
8.3AllocationstoParties 92,814,171 88,287,677
9. Income
9.1FinanceIncome
Interest income on cash and cash equivalents 679,054 770,686
Thisamountrepresentsinterestincomeonfinancialassetsmeasuredatamortisedcost.
9.2OtherIncome(politicalparties)
Unused funds receivable at 31 March 2010 337,429 1,976,360
10. Reconciliation of surplus/(deficit) for the year to cash (utilised by)/generated from operating activities
(Deficit)/surplusfortheyear (728,524) 2,088,421
Adjustmentsfor:
- Interest received (679,054) (770,686)
Operating(deficit)/surplusbeforeworkingcapitalchanges (1,407,578) 1,317,735
Working capital changes: 936,871 (2,485,382)
-(Increase)/Decreaseintradeandotherreceivables 96,710 (1,643,872)
-(Decrease)/Increaseintradeandotherpayablesandprovisions 840,161 (841,510)
Cash(utilisedby)/generatedfromoperations (470,707) (1,167,647)
REPRESENTED POLITICAL PARTIES’ FUNDNOTES TO THE ANNUAL FINANCIAL STATEMENTS for the year ended 31 March 2010
Represented Political Parties’ Fund – Annual Report 2009/201068
11. Taxation
No provision is made for taxation, as the Represented Political Parties’ Fund is exempted from taxation in terms of theIncometaxAct.
12. Fund Administration
TheChiefElectoralOfficeroftheElectoralCommissionistheaccountingofficeroftheFund.StaffoftheElectoralCommissionexecuteFundresponsibilitiesalongsideotherdutiesassignedtothem.TheElectoralCommissionchargestheFundwithcostsrelatedtotheadministrationoftheFund.
2010 2009
R R
13. Related party transactions
Electoral Commission
- Expenditure arising from the allocation of moneys from the Fund 628,826 576,592
TheElectoralCommissionmanagesandadministerstheRepresentedPoliticalParitiesFund.
Inlinewithprevailinggovernmentpractices,functionsprovidedonanocostbasisbytheElectoralCommissiontotheFundincludetherenderingoflegal,financial,humanresourcesmanagement,informationcommunicationtechnologyservices,infrastructureandtheexerciseofinternalcontrol.
IntermsoftheCommission’sexpenditureallocationpolicyallexpenditureincurredinconnectionwiththerenderingofadministrativeservicesonacostrecoverybasis,isexpensedintheFund.Staffexpenditureisallocatedona20%/80%(manager)and40%/60%(assistantmanager)basisrespectively.
14. Financial Instrument Risk Management
ElectoralCommission’sactivitieshavealimitedexposuretomarketrisk,creditrisk,liquidityriskandcashflowrisk.RiskmanagementiscarriedoutbytheExecutiveCommitteeunderpoliciesapprovedbytheCommission.TheCommissionprovideswrittenpoliciesforoverallriskmanagement,aswellaswrittenpoliciescoveringspecificareas,suchasinvestingexcessliquidity.TheRepresentedPoliticalPartiesFundismanagedbytheCommissionunderthesamefinancialpoliciesandproceduresapplicabletotheCommission,takingthestipulationsofthePublicFundingofRepresentedPoliticalPartiesFundAct103of1997intoaccount.
a) Liquidity risk
Prudentliquidityriskmanagementimpliesmaintainingsufficientcash.Sufficientfundingismaintainedthroughthoroughplanningprocesses.
REPRESENTED POLITICAL PARTIES’ FUNDNOTES TO THE ANNUAL FINANCIAL STATEMENTS for the year ended 31 March 2010
Represented Political Parties’ Fund – Annual Report 2009/2010 69
Thefollowingarecontractualmaturitiesoffinancialliabilities
2010/03/31 Carrying Amounts 0-3 months
Trade and other payables 629,637 629,637
2009/03/31
Trade and other payables 577,806 577,806
b) Cash flow
TheFundmanagesitscashflowriskbyaligningthequarterlygovernmentallocationtoitsquarterlypaymentstoparties.
c) Credit risk
Receivablesaremonitoredonanongoingbasiswiththeresultthatexposuretobaddebtsisminimised.
Withrespecttocreditarisingfromcashandcashequivalents,cashisplacedwithqualityfinancialinstitutions.
Thecarryingamountsofthefinancialassetsrepresentthemaximumcreditexposure.Themaximumexposureatthereportingdatewas:
Carrying amounts
2010 2009
R R
Trade and other receivables 466,874 1,689,342
Cash and cash equivalents 2,285,108 2,076,761
Themaximumexposuretocreditriskfortradereceivablesatthereportingdatebymajorcustomerwas:
Carrying amounts
2010 2009
R R
Trade and other receivables 466,874 1,689,342
d) Interest rate risk
TheFundisexposedtotheriskoffluctuationsininterestratesonitsCallDeposit.
Interestrateriskreferstotheriskthatthefairvalueoffuturecashflowsofafinancialinstrumentwillfluctuatebecauseofthechangesinmarketinterestrates.
REPRESENTED POLITICAL PARTIES’ FUNDNOTES TO THE ANNUAL FINANCIAL STATEMENTS for the year ended 31 March 2010
Represented Political Parties’ Fund – Annual Report 2009/201070
TheFund’sinterestrateprofileconsistsoffloatingratebankbalanceswhichexposestheFundtocashflowinterestrateriskandcanbesummarisedasfollows:
Financial Assets
TieredRateCallDepositlinkedtoSouthAfricanPrimerate.
15. Prior period adjustment
Unspent funds
AmountsofR871480.00andR153947.00inrespectofAPCandNVPrespectively,werestatedinthefinancialstatementsasunspentasat31March2009,duetofailureofbothpartiestosubmittheauditedfinancialstatements.Thepartieshadsincesubmittedtheirstatements.Asthestatementsweresubmittedafterthisdate,anadjustmenttotradeandotherreceivablesaffectingprioryearhasnowbeenprocessed.
Effect on 2009:
Decrease in other income 1,025,427
1,025,427
Decrease in trade receivables (1,025,427)
(1,025,427)
REPRESENTED POLITICAL PARTIES’ FUNDNOTES TO THE ANNUAL FINANCIAL STATEMENTS for the year ended 31 March 2010

Appendix A

Represented Political Parties’ Fund – Annual Report 2009/201072
DETAILED INCOME AND EXPENDITURE STATEMENT for the year ended 31 March 2010
APPENDIX A
2010 2009
R R
INCOME 93,839,483 90,934,046
Government appropriation 92,823,000 88,187,000
Other Income 1,016,483 2,747,046
- Unused funds receivable(NADECO) 337,429 560,836
- Unused funds receivable(PAC) - 466,874
- Unused funds receivable(ACDP) - 70,973
- Unused funds receivable(AFD) - 2,605
- Unused funds receivable(APC) - 22,673
- Unused funds receivable(FD) - 2,003
- Unused funds receivable(NA) - 95,786
- Unused funds receivable(NVP) - -
- Unused funds receivable(UDM) - 459
- Unused funds receivable(UIF) - 754,151
- Interest received 679,054 770,686
EXPENDITURE 94,568,007 88,845,625
Allocations to parties 92,814,171 88,287,677
African Christian Democratic Party (ACDP) 1,299,465 2,177,425
Alliance of Free Democrats (AFD) - 283,242
African Independent Congress (AIC) 373,013 -
African National Congress (ANC) 58,056,247 61,113,511
African People’s Convention (APC) 100,751 894,153
Azanian People’s Organisation (AZAPO) 100,751 95,786
Congress of the People (COPE) 8,688,197 -
Christian Party (CP) - 301,217
Democratic Alliance (DA) 15,337,772 10,538,737
Federation of Democrats (FD) - 95,786
Freedom Front (FF) 991,909 1,496,340
Independent Democrats (ID) 1,475,671 1,249,562
Inkatha Freedom Party (IFP) 4,241,242 5,403,084
Minority Front (MF) 590,362 617,921
National Alliance (NA) - 95,786
National Democratic Convention (NADECO) - 905,278
NewVisionParty(NVP) - 153,947
Pan Africanist Congress (PAC) - 47,893
United Christian Democratic Party (UCDP) 581,271 744,194
United Democratic Movement (UDM) 977,520 1,611,975
United Independent Front (UIF) - 461,840
REPRESENTED POLITICAL PARTIES’ FUNDANNUAL FINANCIAL STATEMENTS for the year ended 31 March 2010

Represented Political Parties’ Fund – Annual Report 2009/2010 73
APPENDIX A (continued)
2010 2009
R R
EXPENDITURE (continued)
Personnel expenditure 314,986 263,541
Salaries: Employees 314,986 263,541
Subsistenceallowance - -
Accommodation expenditure 3,219 -
Hotelexpenditure&meals:Local 3,219 -
Travel expenditure 11,376 -
Car rental 810 -
Private transport - Reimburse - -
Parking fees and toll roads - -
Air Travel - Internal 10,566 -
Arrangements of meetings and rallies - -
Hiring: Conference venues - -
Administrative expenditure 233,802 253,407
Audit cost 226,106 246,453
Courier services 2,727 1,677
Stationery 4,969 5,277
Promotion&publications 64,695 41,000
Printing and production of books 64,695 41,000
Bad Debts 1,125,758 -
Allowanceforimpairment 1,125,758 -
Surplus(deficit)/ for the year (728,524) 2,088,421
REPRESENTED POLITICAL PARTIES’ FUNDANNUAL FINANCIAL STATEMENTS for the year ended 31 March 2010

Represented Political Parties’ Fund – Annual Report 2009/201074
Notes

Represented Political Parties’ Fund – Annual Report 2009/2010 75
Notes

Represented Political Parties’ Fund – Annual Report 2009/201076
Notes
Represented Political Parties’ Fund
Annual Report 2009/2010
An
nu
al R
ep
or
t 20
09
/20
10
Electoral Commission of South AfricaRiverside Office Park
1303 Heuwel Avenue, Centurion, 0157
Telephone: +27 12 622 5700
www.elections.org.za
RP 228/2010ISBN: 978-0-621-39666-9
Rep
resented
Politica
l Parties’ Fu
nd